Agenus Inc. · NASDAQ:AGEN
Agenus — Investor Presentation (August 2016)
19 slides from Agenus's investor presentation, August 2016
Slide 1: Agenus IR Presentation August 2016
Agenus IR Presentation August 2016
Slide 2: Forward-Looking Statements
Forward-Looking Statements This presentation contains forward-looking statements. These forward-looking statements are subject to risks and uncertainties, including the factors described under the Risk Factors section of our Quarterly Report on form 10-Q filed with the Securities and Exchange Commis
Slide 3: Agenus vision in immuno-oncology
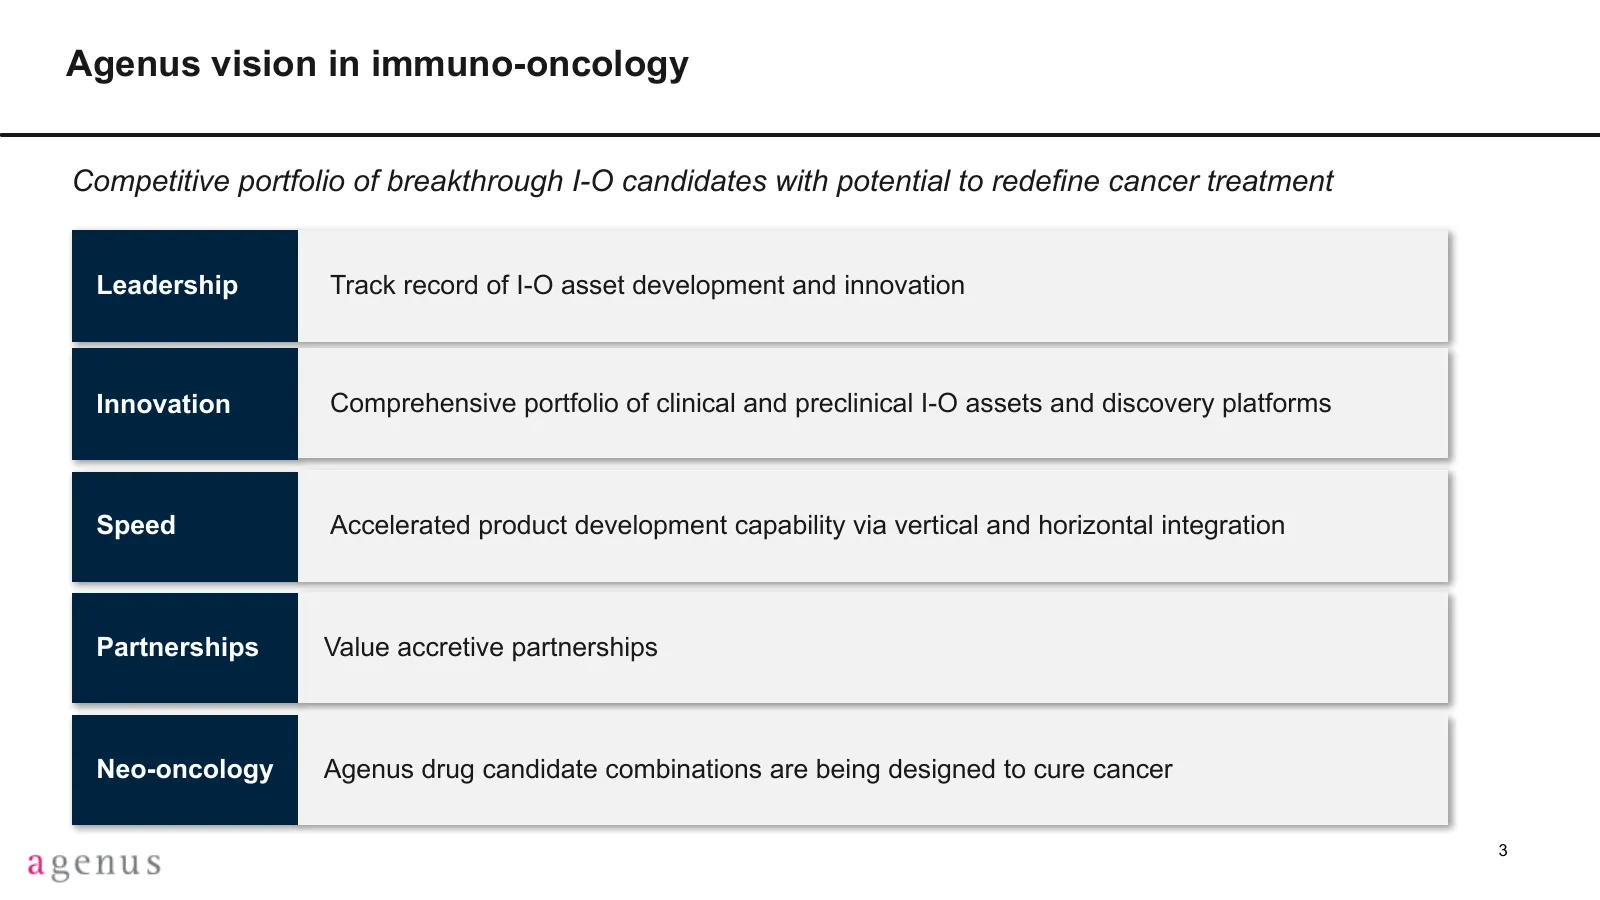
Agenus vision in immuno-oncology Competitive portfolio of breakthrough I-O candidates with potential to redefine cancer treatment Leadership Track record of I-O asset development and innovation Innovation Comprehensive portfolio of clinical and preclinical I-O assets and discovery platforms Speed Ac
Slide 4: Agenus evolution and transformation
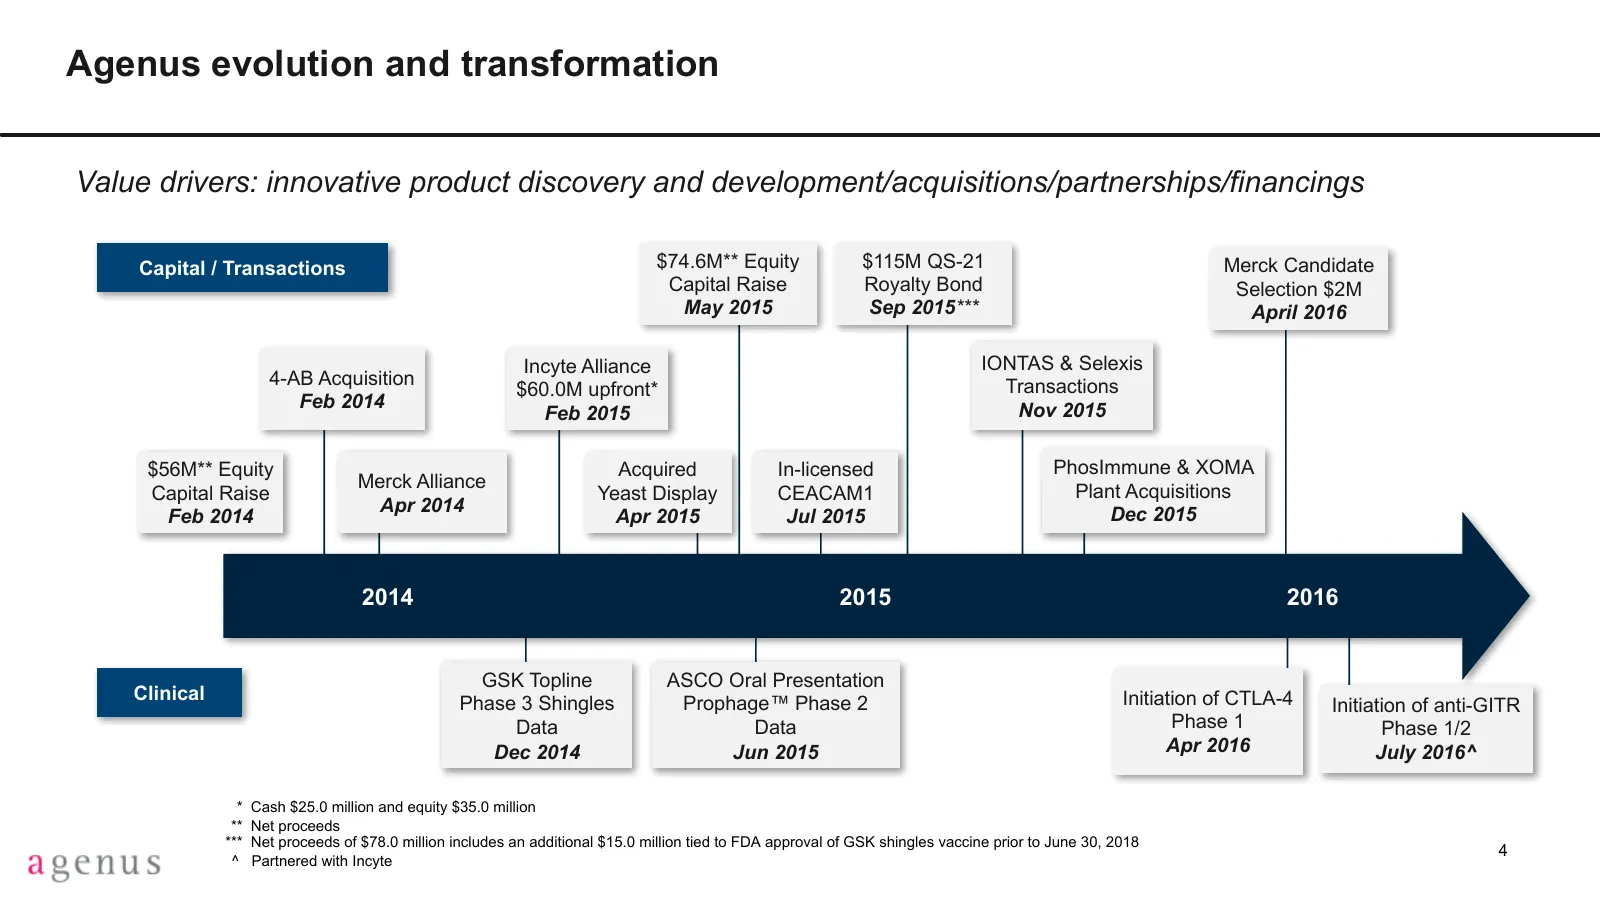
Agenus evolution and transformation Value drivers: innovative product discovery and development/acquisitions/partnerships/financings Capital / Transactions $74.6M** Equity $115M QS-21 Merck Candidate Capital Raise Royalty Bond Selection $2M May 2015 Sep 2015*** April 2016 Incyte Alliance IONTAS & Se
Slide 5: Our near-term priorities
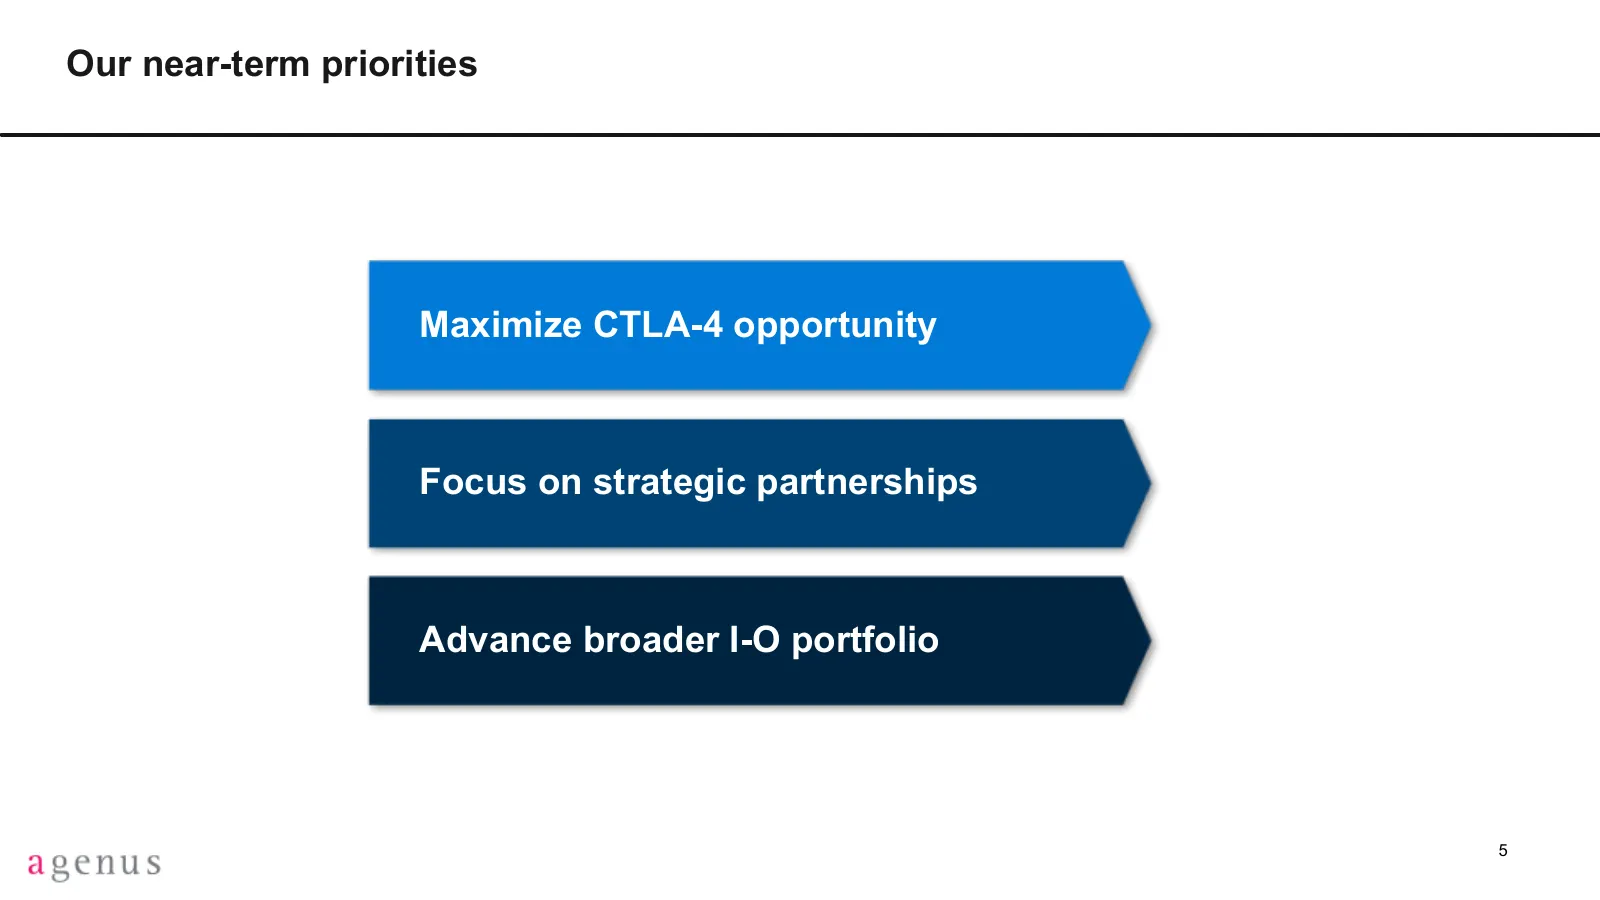
Our near-term priorities Maximize CTLA-4 opportunity Focus on strategic partnerships Advance broader I-O portfolio 5
Slide 6: Agenus possesses an industry leading portfolio of I-O assets
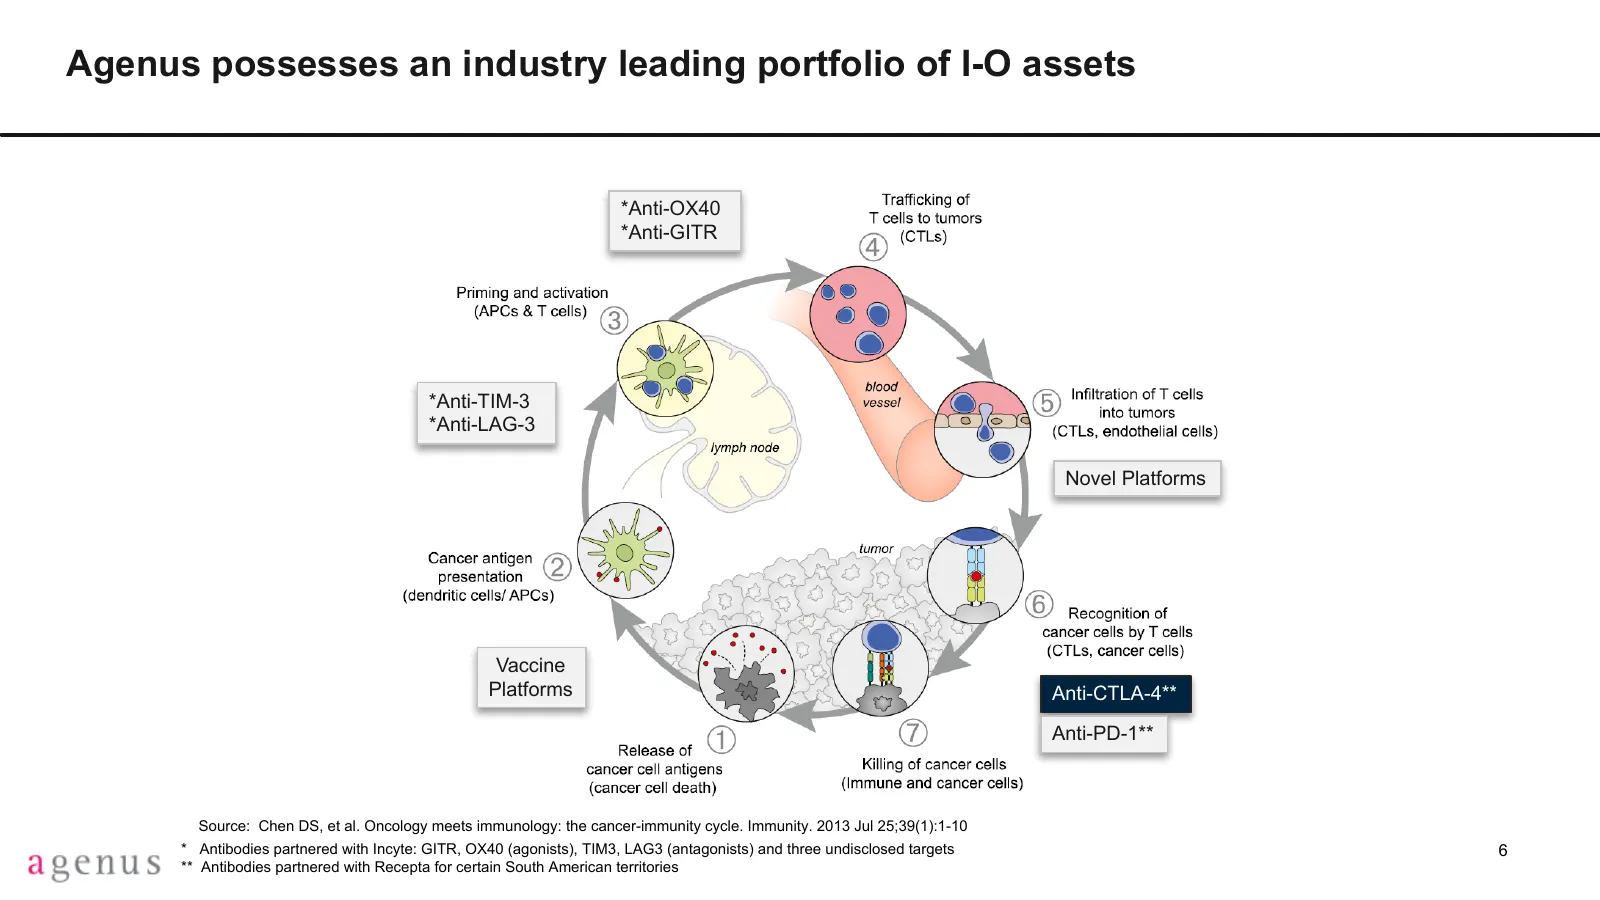
Agenus possesses an industry leading portfolio of I-O assets *Anti-OX40 *Anti-GITR *Anti-TIM-3 *Anti-LAG-3 Novel Platforms Vaccine Platforms Anti-CTLA-4** Anti-PD-1** Source: Chen DS, et al. Oncology meets immunology: the cancer-immunity cycle. Immunity. 2013 Jul 25;39(1):1-10 * Antibodies partnered
Slide 7: Post-ASCO reality
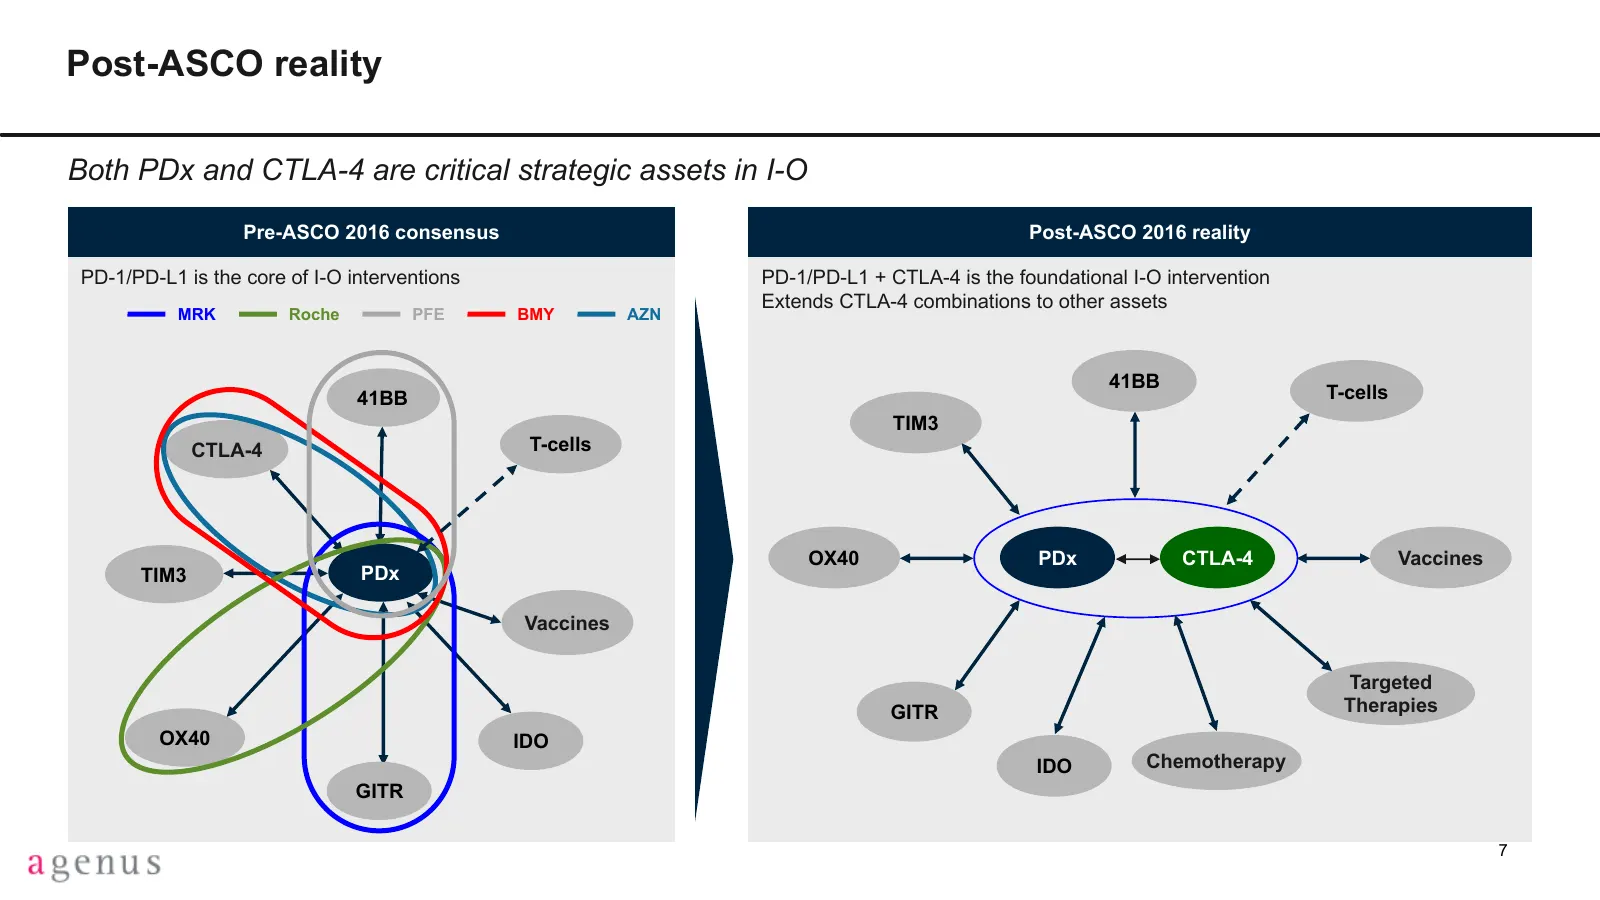
Post-ASCO reality Both PDx and CTLA-4 are critical strategic assets in I-O Pre-ASCO 2016 consensus Post-ASCO 2016 reality PD-1/PD-L1 is the core of I-O interventions PD-1/PD-L1 + CTLA-4 is the foundational I-O intervention Extends CTLA-4 combinations to other assets MRK Roche PFE BMY AZN 41BB 41BB T
Slide 8: Approved indication plus emerging data underscore the importance of CTLA-4
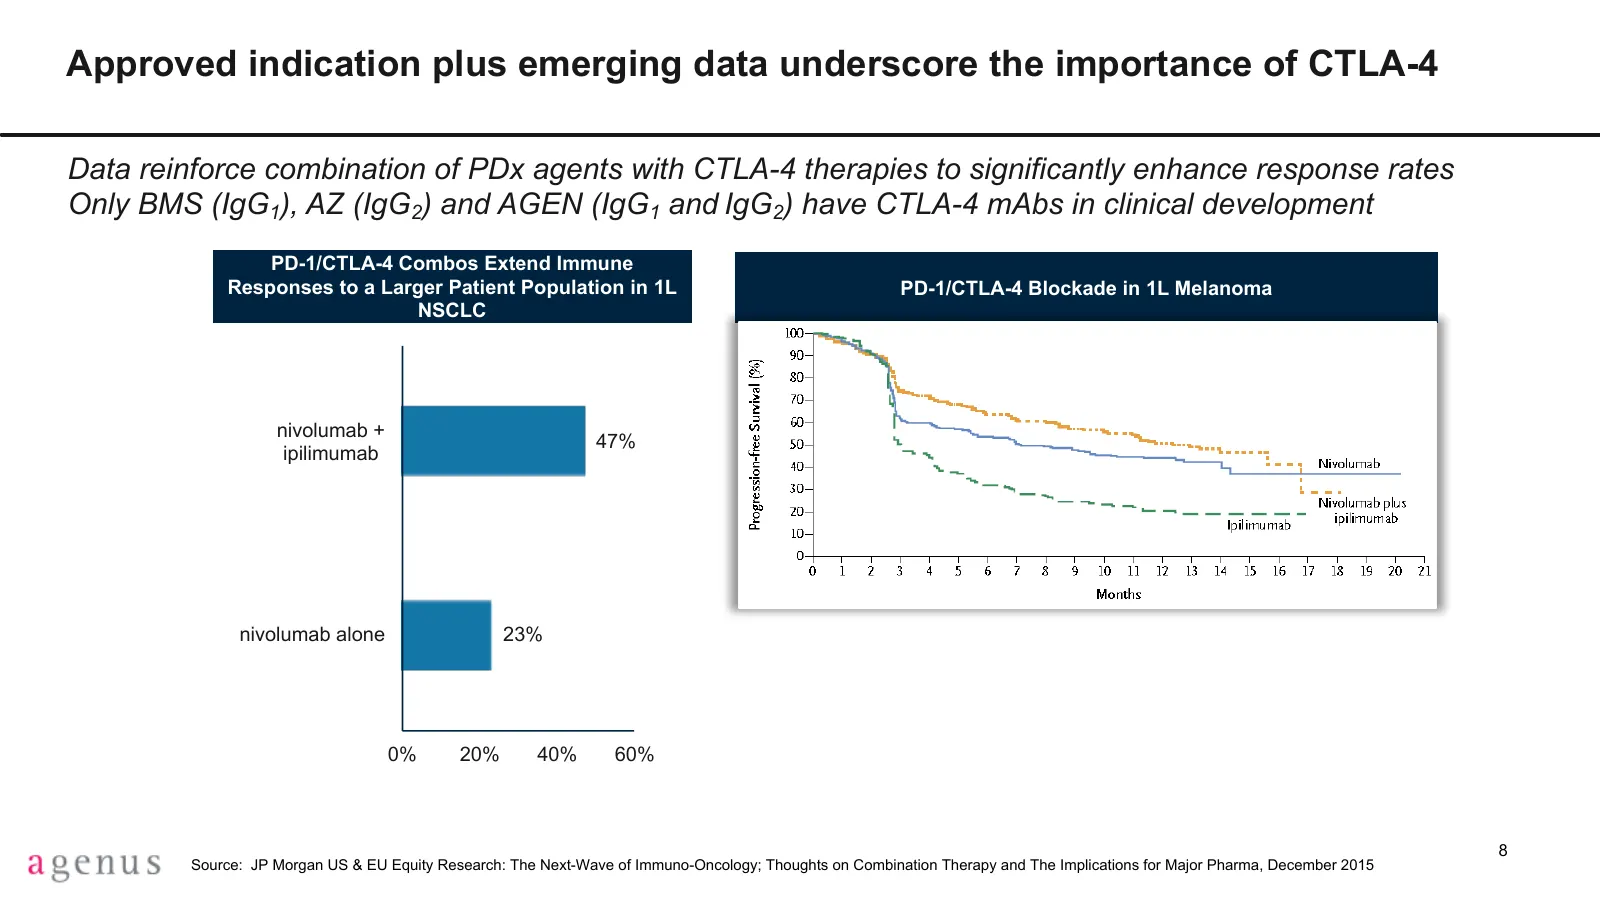
Approved indication plus emerging data underscore the importance of CTLA-4 Data reinforce combination of PDx agents with CTLA-4 therapies to significantly enhance response rates Only BMS (IgG1), AZ (IgG2) and AGEN (IgG1 and IgG2) have CTLA-4 mAbs in clinical development PD-1/CTLA-4 Combos Extend Imm
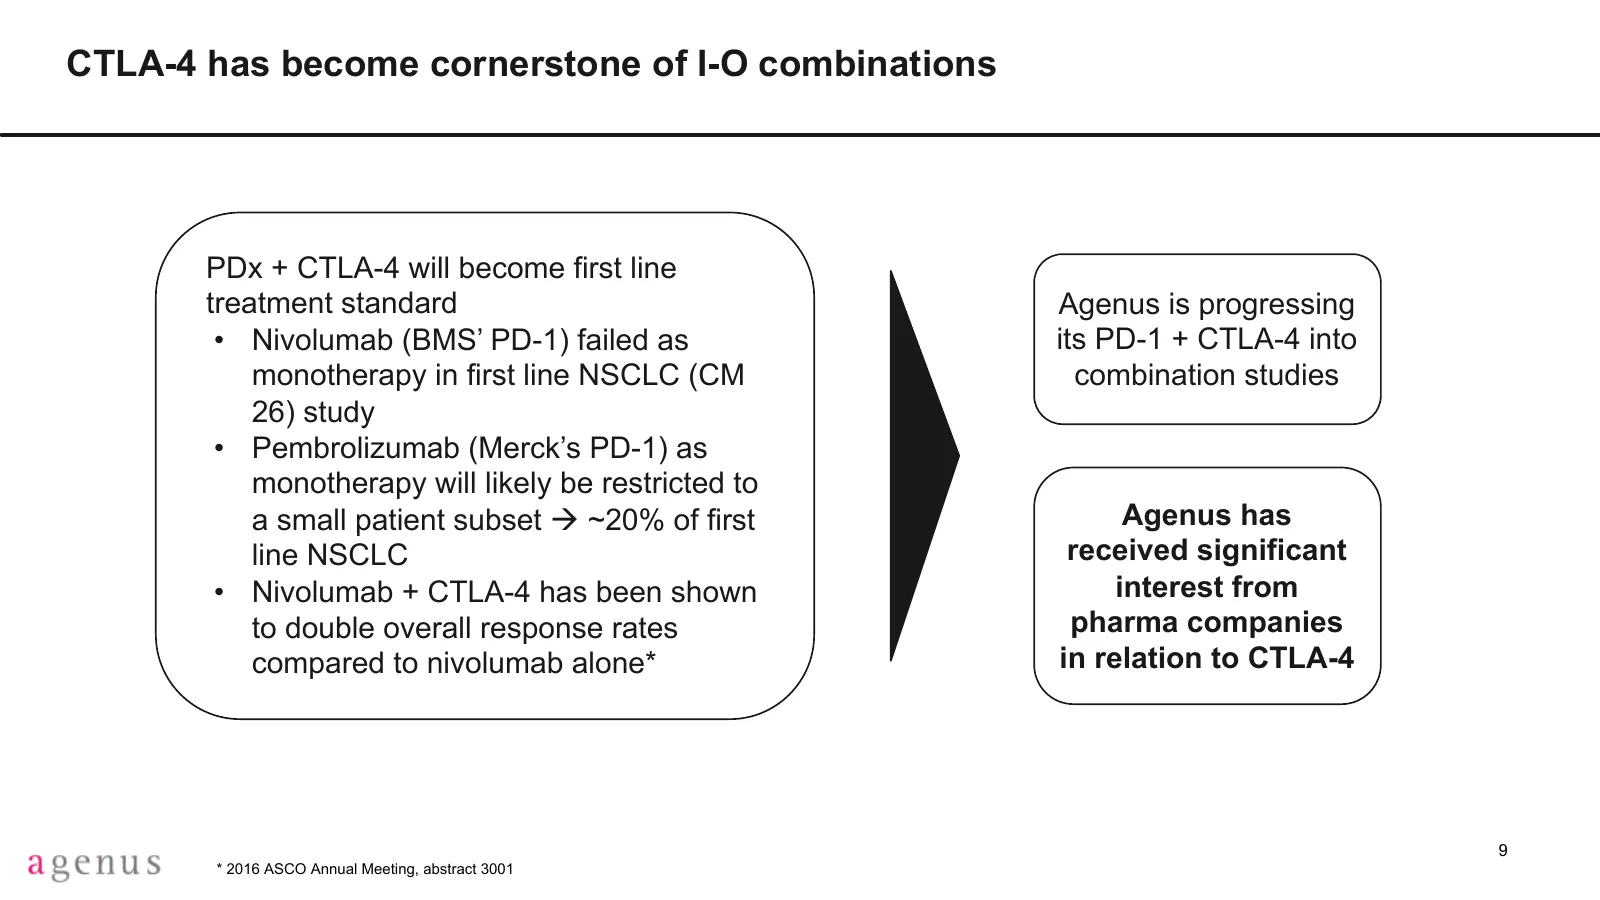
Slide 9: CTLA-4 has become cornerstone of I-O combinations
CTLA-4 has become cornerstone of I-O combinations PDx + CTLA-4 will become first line treatment standard Agenus is progressing • Nivolumab (BMS’ PD-1) failed as its PD-1 + CTLA-4 into monotherapy in first line NSCLC (CM combination studies 26) study • Pembrolizumab (Merck’s PD-1) as monotherapy will
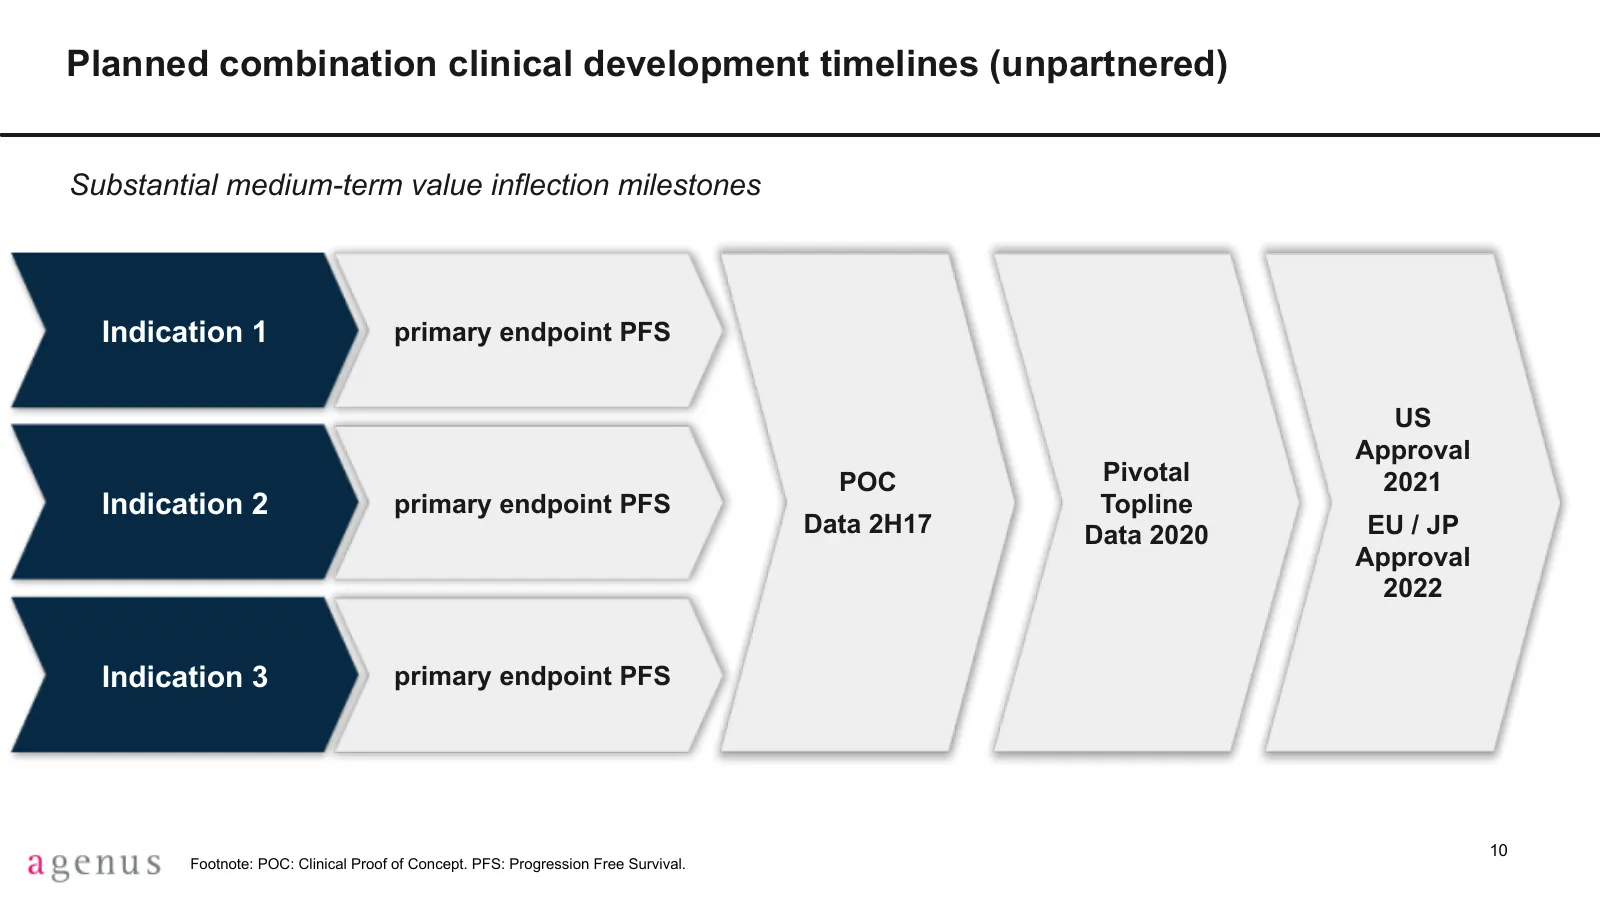
Slide 10: Planned combination clinical development timelines (unpartnered)
Planned combination clinical development timelines (unpartnered) Substantial medium-term value inflection milestones Indication 1 primary endpoint PFS US Approval POC Pivotal 2021 Indication 2 primary endpoint PFS Topline Data 2H17 Data 2020 EU / JP Approval 2022 Indication 3 primary endpoint PFS 10
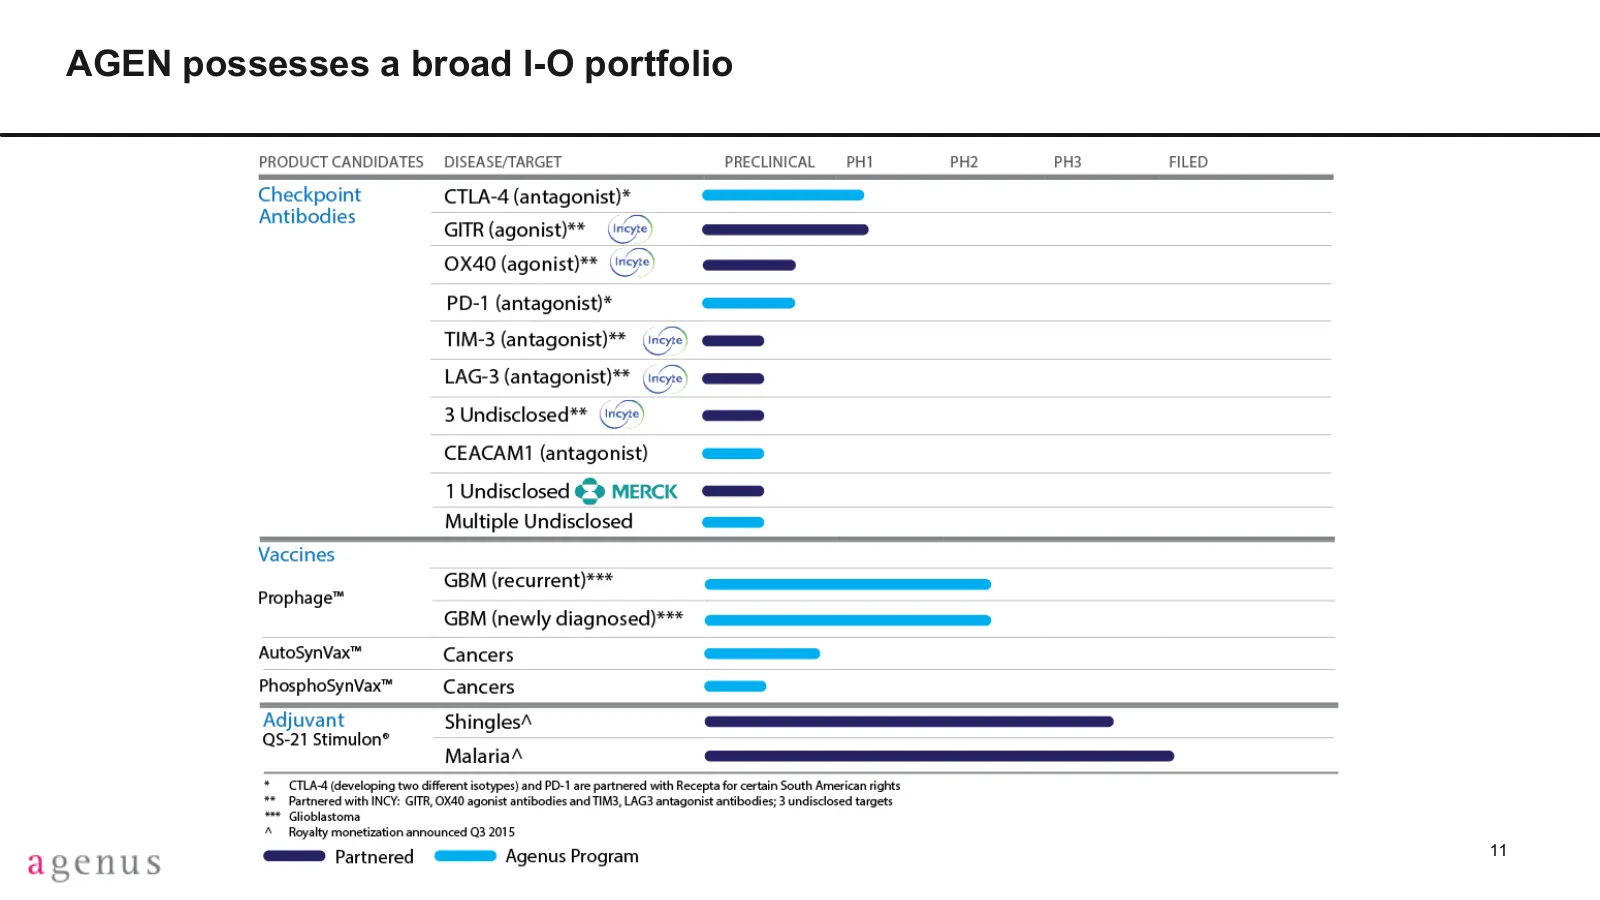
Slide 11: AGEN possesses a broad I-O portfolio
AGEN possesses a broad I-O portfolio 11
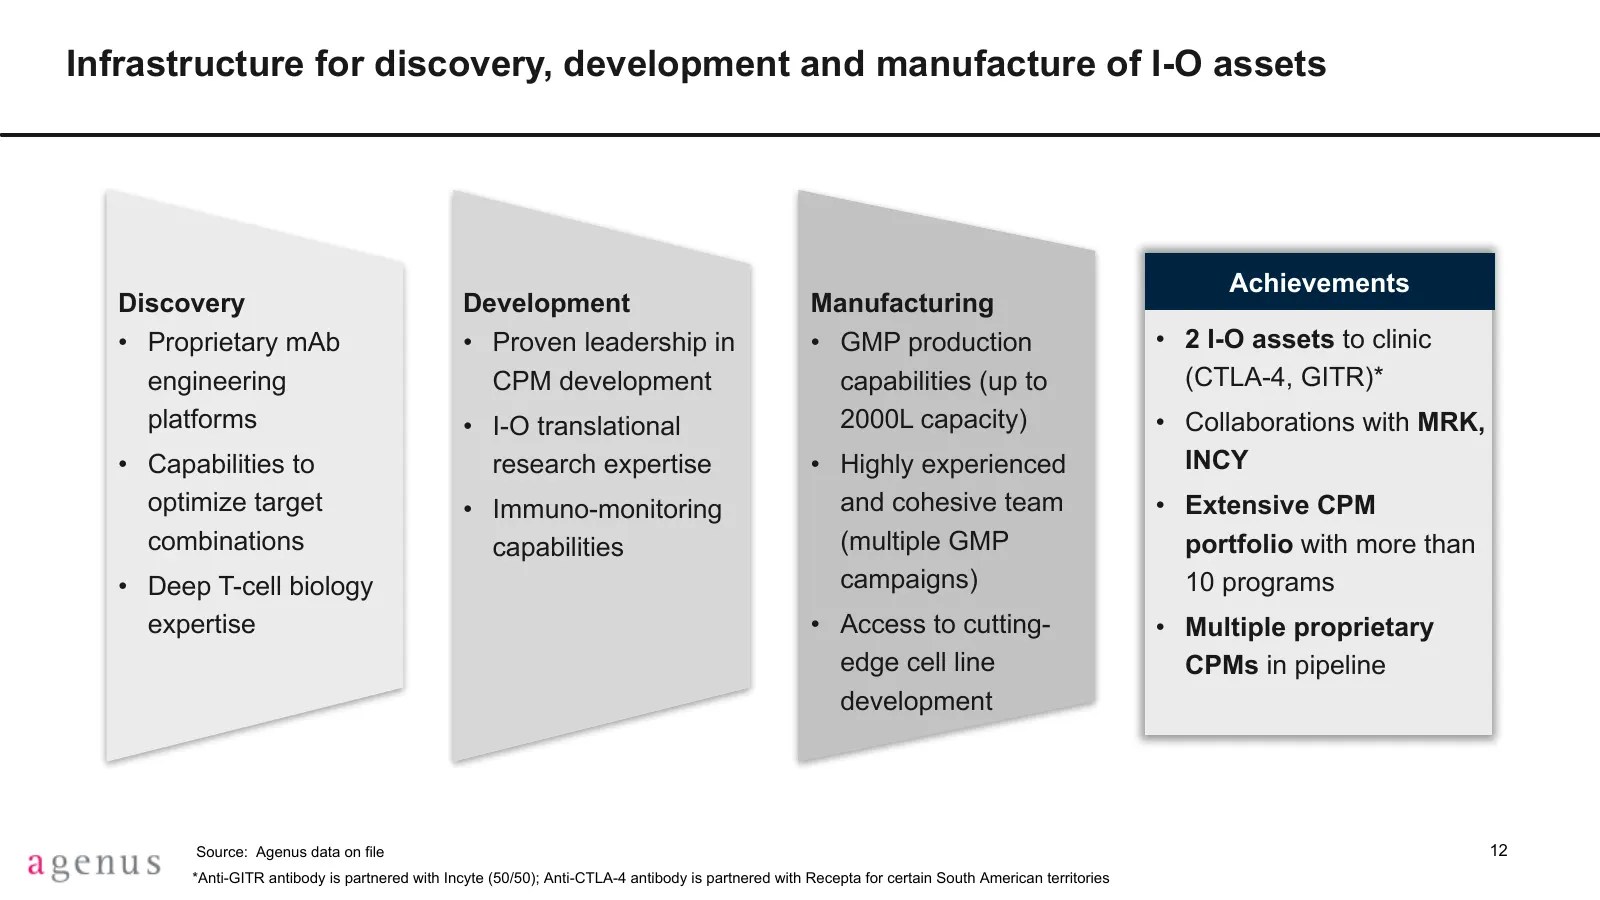
Slide 12: Infrastructure for discovery, development and manufacture of I-O assets
Infrastructure for discovery, development and manufacture of I-O assets Achievements Discovery Development Manufacturing • Proprietary mAb • Proven leadership in • GMP production • 2 I-O assets to clinic engineering CPM development capabilities (up to (CTLA-4, GITR)* platforms • I-O translational 20
Slide 13: Immuno-oncology (I-O) companies creating substantial value
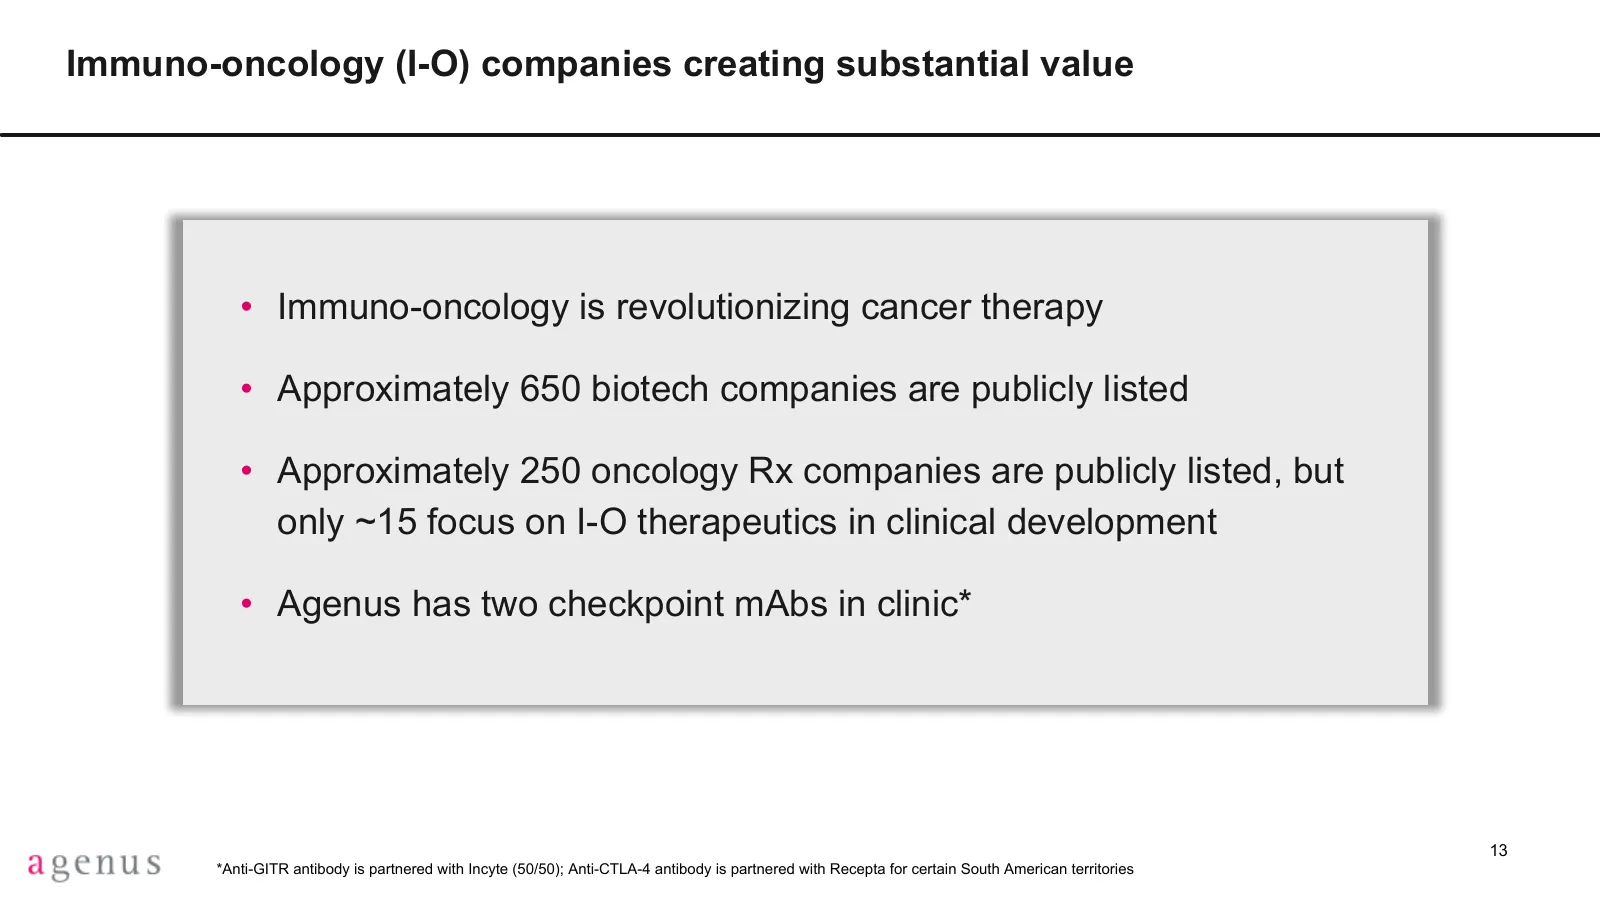
Immuno-oncology (I-O) companies creating substantial value • Immuno-oncology is revolutionizing cancer therapy • Approximately 650 biotech companies are publicly listed • Approximately 250 oncology Rx companies are publicly listed, but only ~15 focus on I-O therapeutics in clinical development • Age
Slide 14: Few biotechs possess clinical stage I-O programs
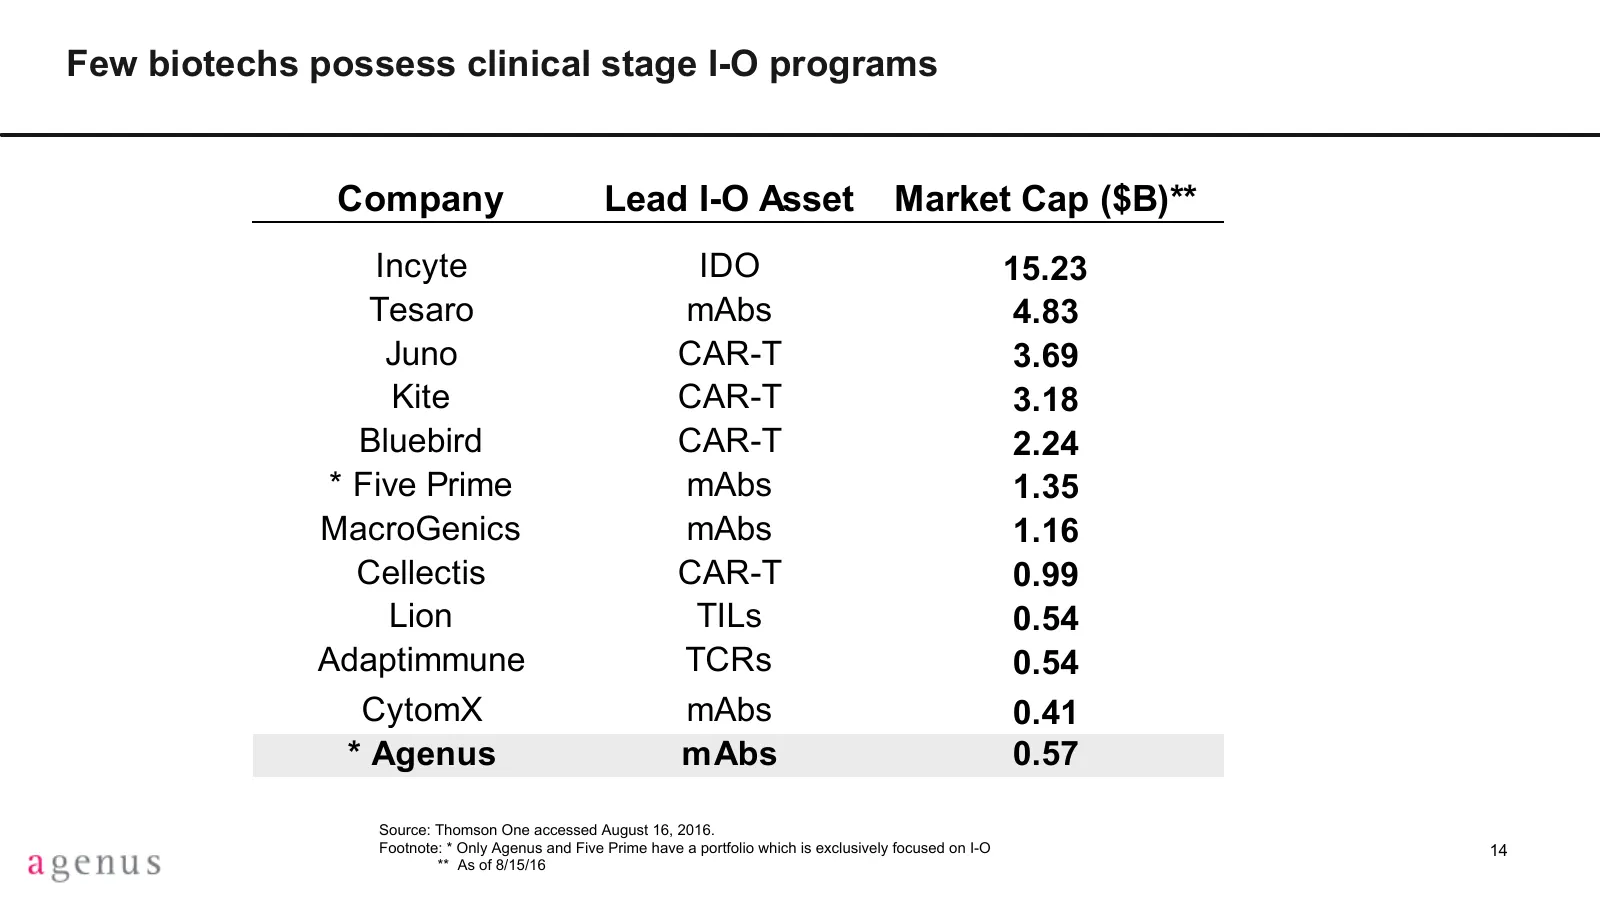
Few biotechs possess clinical stage I-O programs Company Lead I-O Asset Market Cap ($B)** Incyte IDO 15.23 Tesaro mAbs 4.83 Juno CAR-T 3.69 Kite CAR-T 3.18 Bluebird CAR-T 2.24 * Five Prime mAbs 1.35 MacroGenics mAbs 1.16 Cellectis CAR-T 0.99 Lion TILs 0.54 Adaptimmune TCRs 0.54 CytomX mAbs 0.41 * Ag
Slide 15: I-O market projected to grow to > $17B by 2020
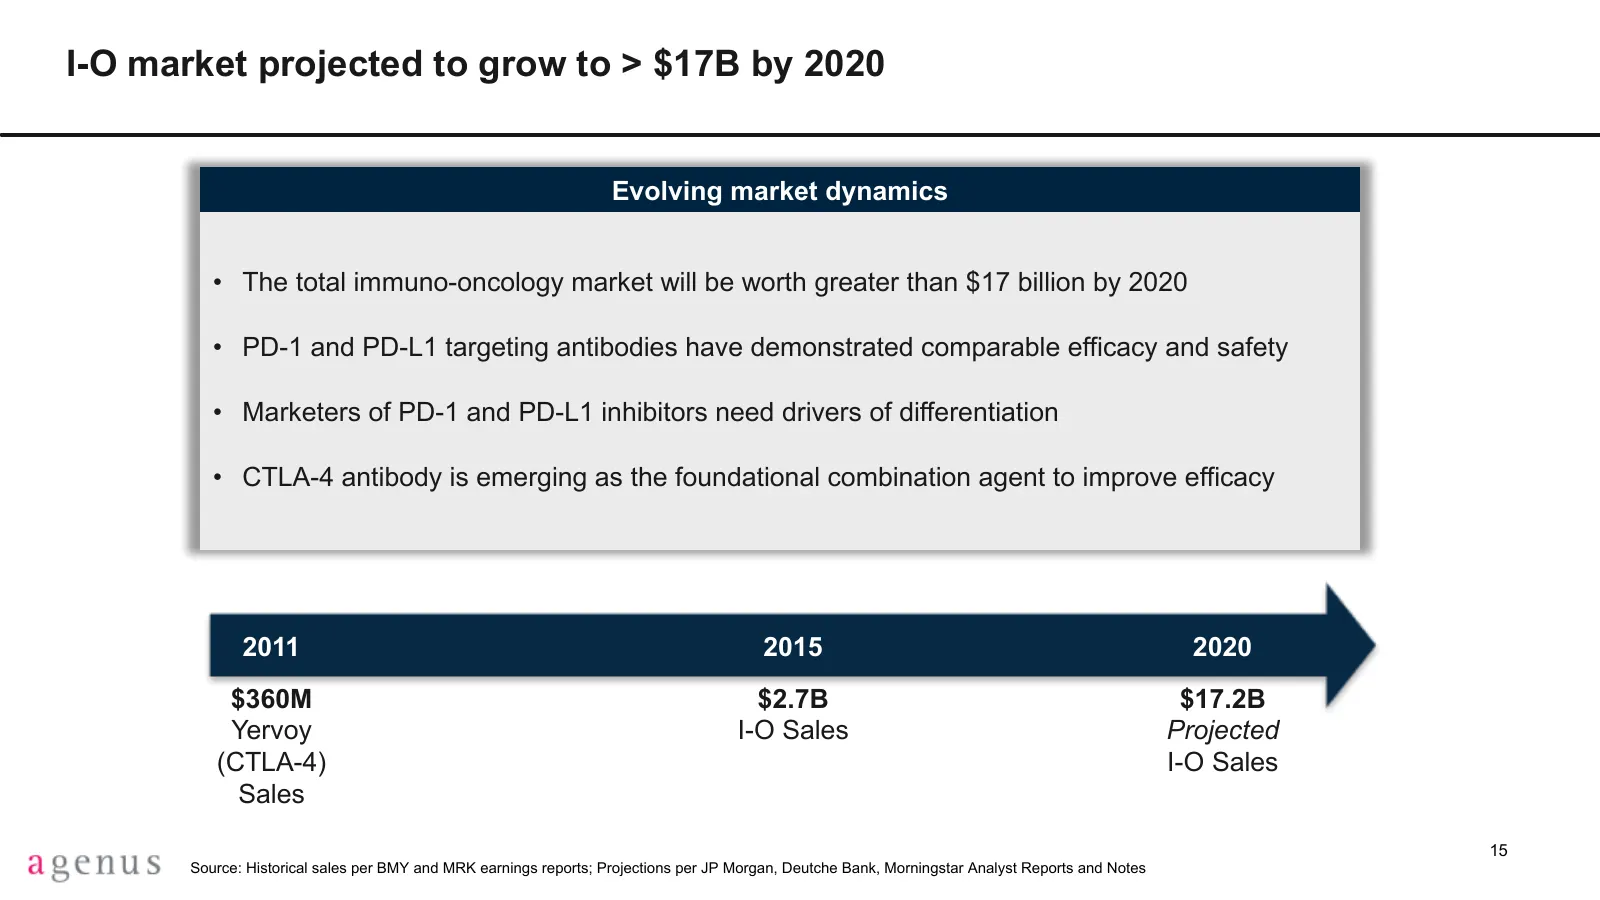
I-O market projected to grow to > $17B by 2020 Evolving market dynamics • The total immuno-oncology market will be worth greater than $17 billion by 2020 • PD-1 and PD-L1 targeting antibodies have demonstrated comparable efficacy and safety • Marketers of PD-1 and PD-L1 inhibitors need drivers of di
Slide 16: Current I-O Landscape
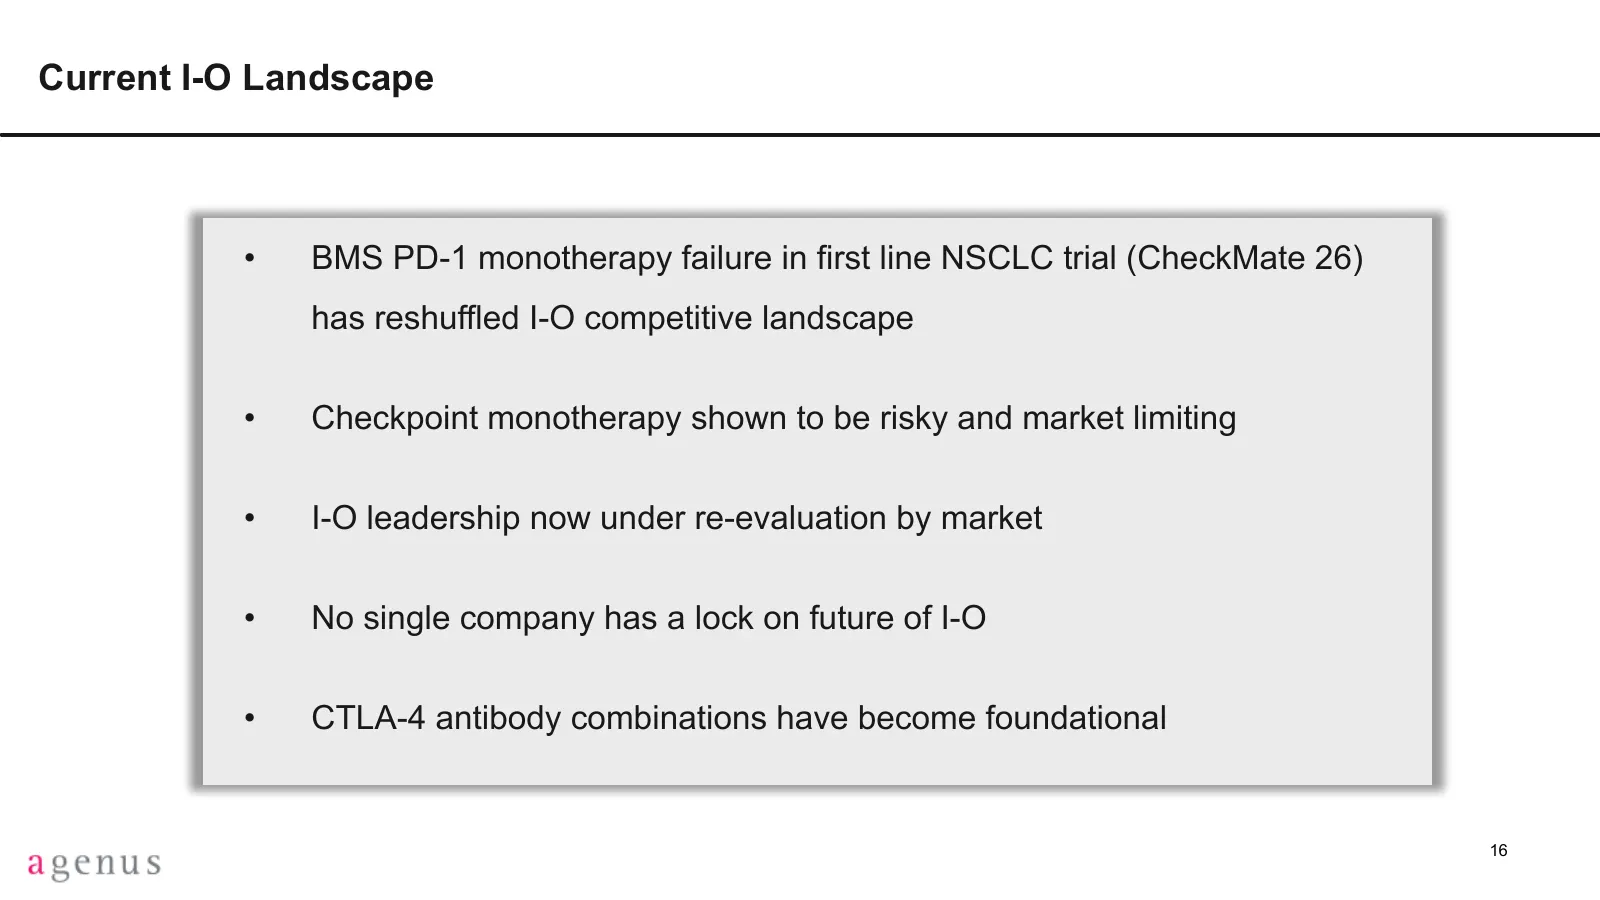
Current I-O Landscape • BMS PD-1 monotherapy failure in first line NSCLC trial (CheckMate 26) has reshuffled I-O competitive landscape • Checkpoint monotherapy shown to be risky and market limiting • I-O leadership now under re-evaluation by market • No single company has a lock on future of I-O • C
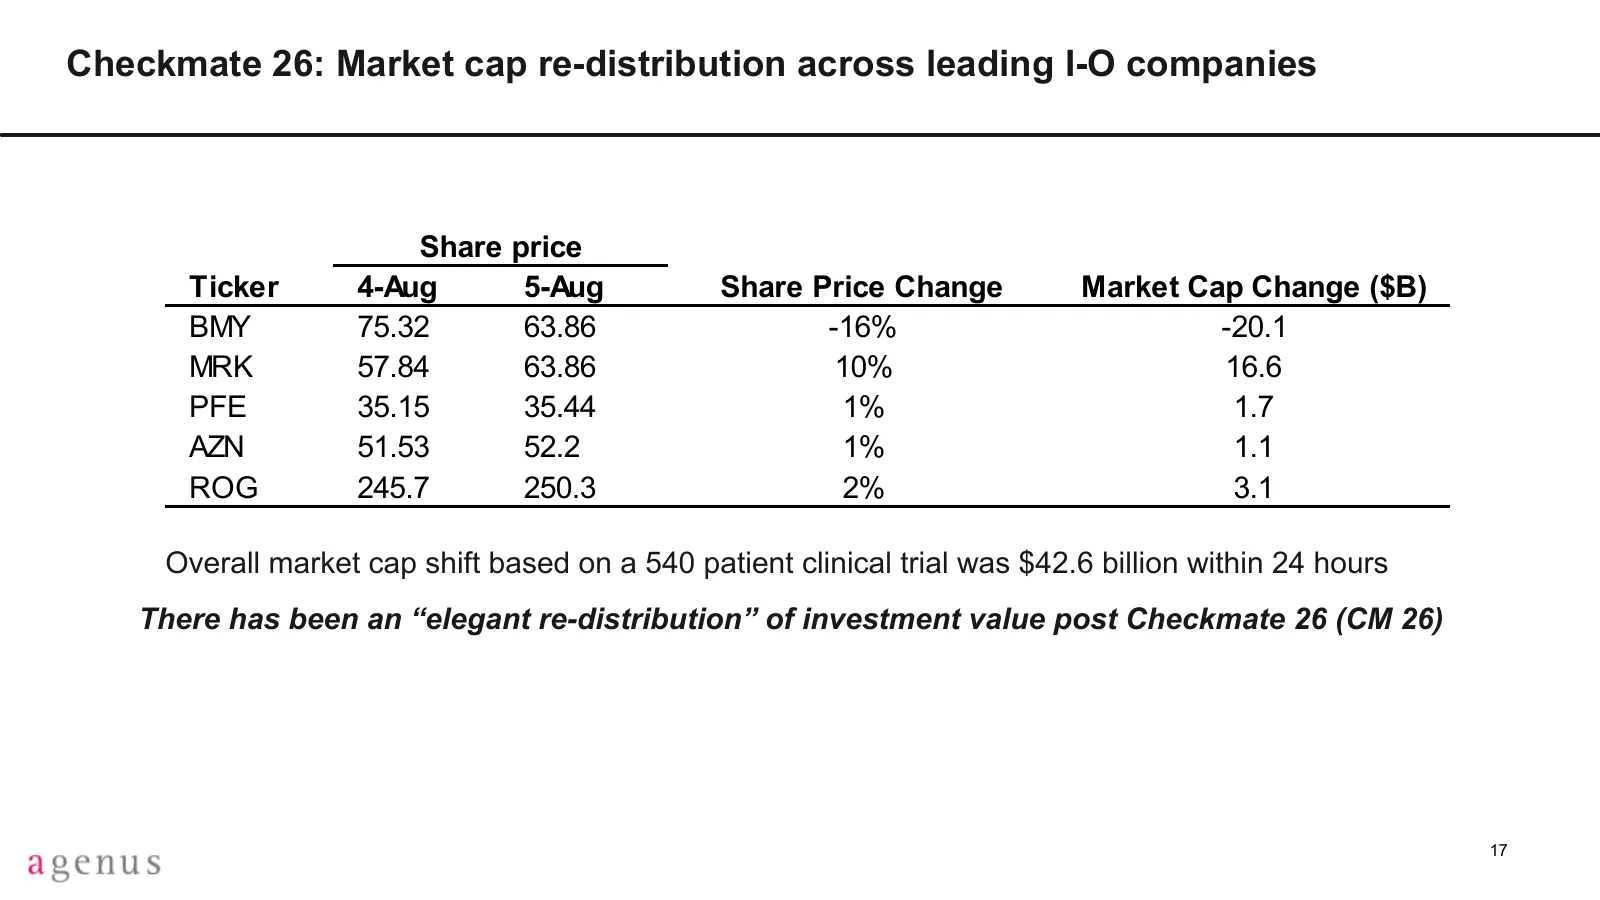
Slide 17: Checkmate 26: Market cap re-distribution across leading I-O companies
Checkmate 26: Market cap re-distribution across leading I-O companies Share price Ticker 4-Aug 5-Aug Share Price Change Market Cap Change ($B) BMY 75.32 63.86 -16% -20.1 MRK 57.84 63.86 10% 16.6 PFE 35.15 35.44 1% 1.7 AZN 51.53 52.2 1% 1.1 ROG 245.7 250.3 2% 3.1 Overall market Overall marketcap caps
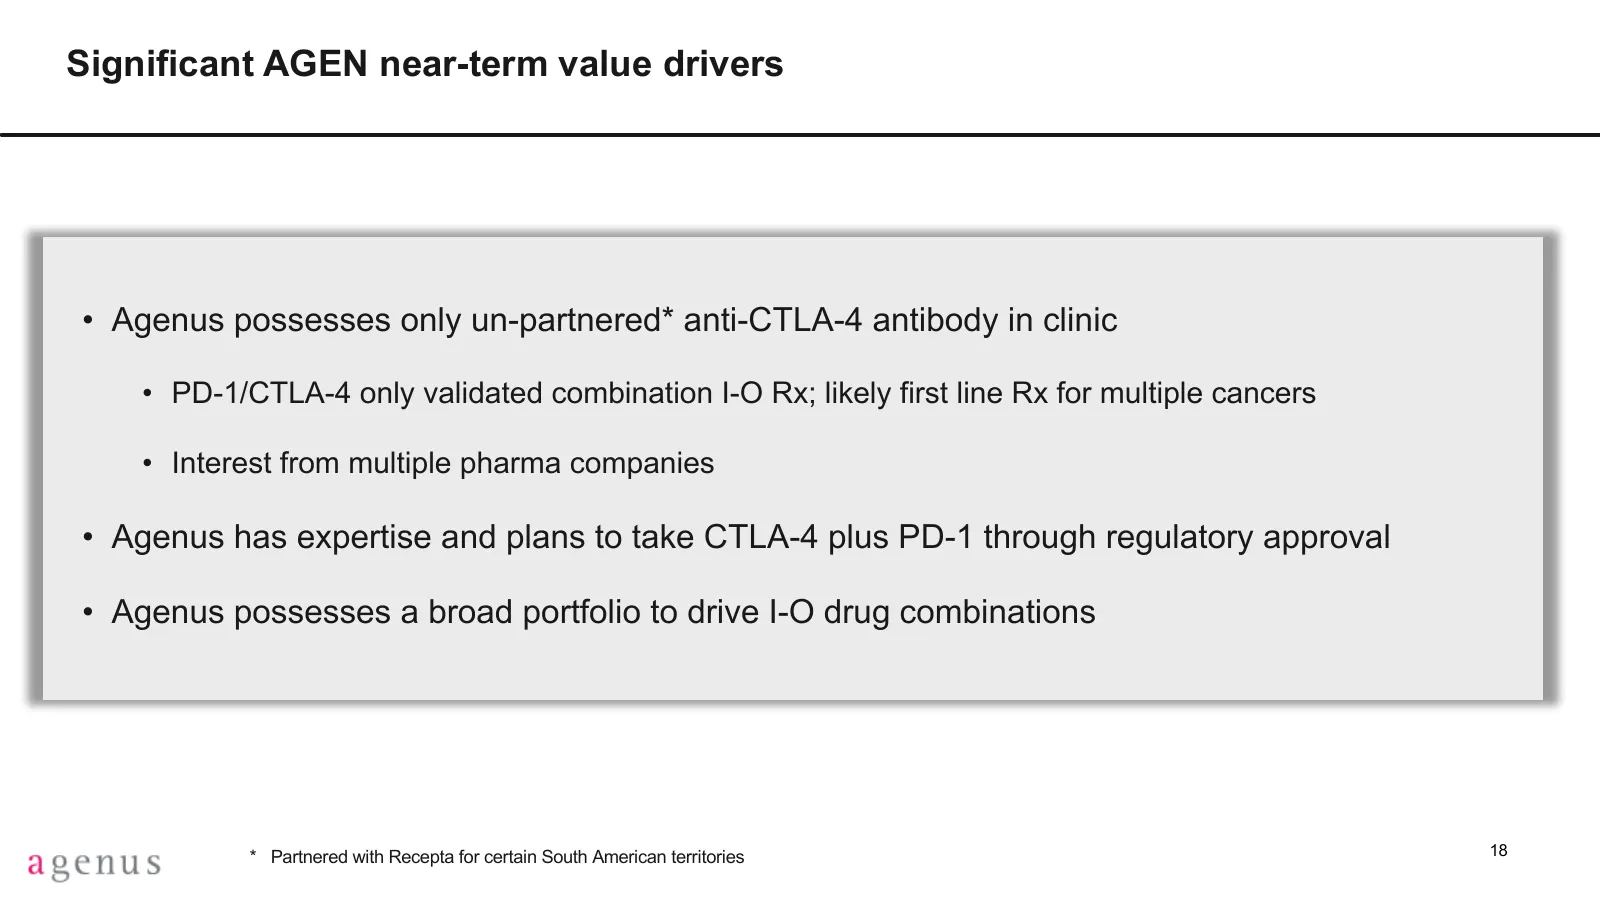
Slide 18: Significant AGEN near-term value drivers
Significant AGEN near-term value drivers • Agenus possesses only un-partnered* anti-CTLA-4 antibody in clinic • PD-1/CTLA-4 only validated combination I-O Rx; likely first line Rx for multiple cancers • Interest from multiple pharma companies • Agenus has expertise and plans to take CTLA-4 plus PD-1
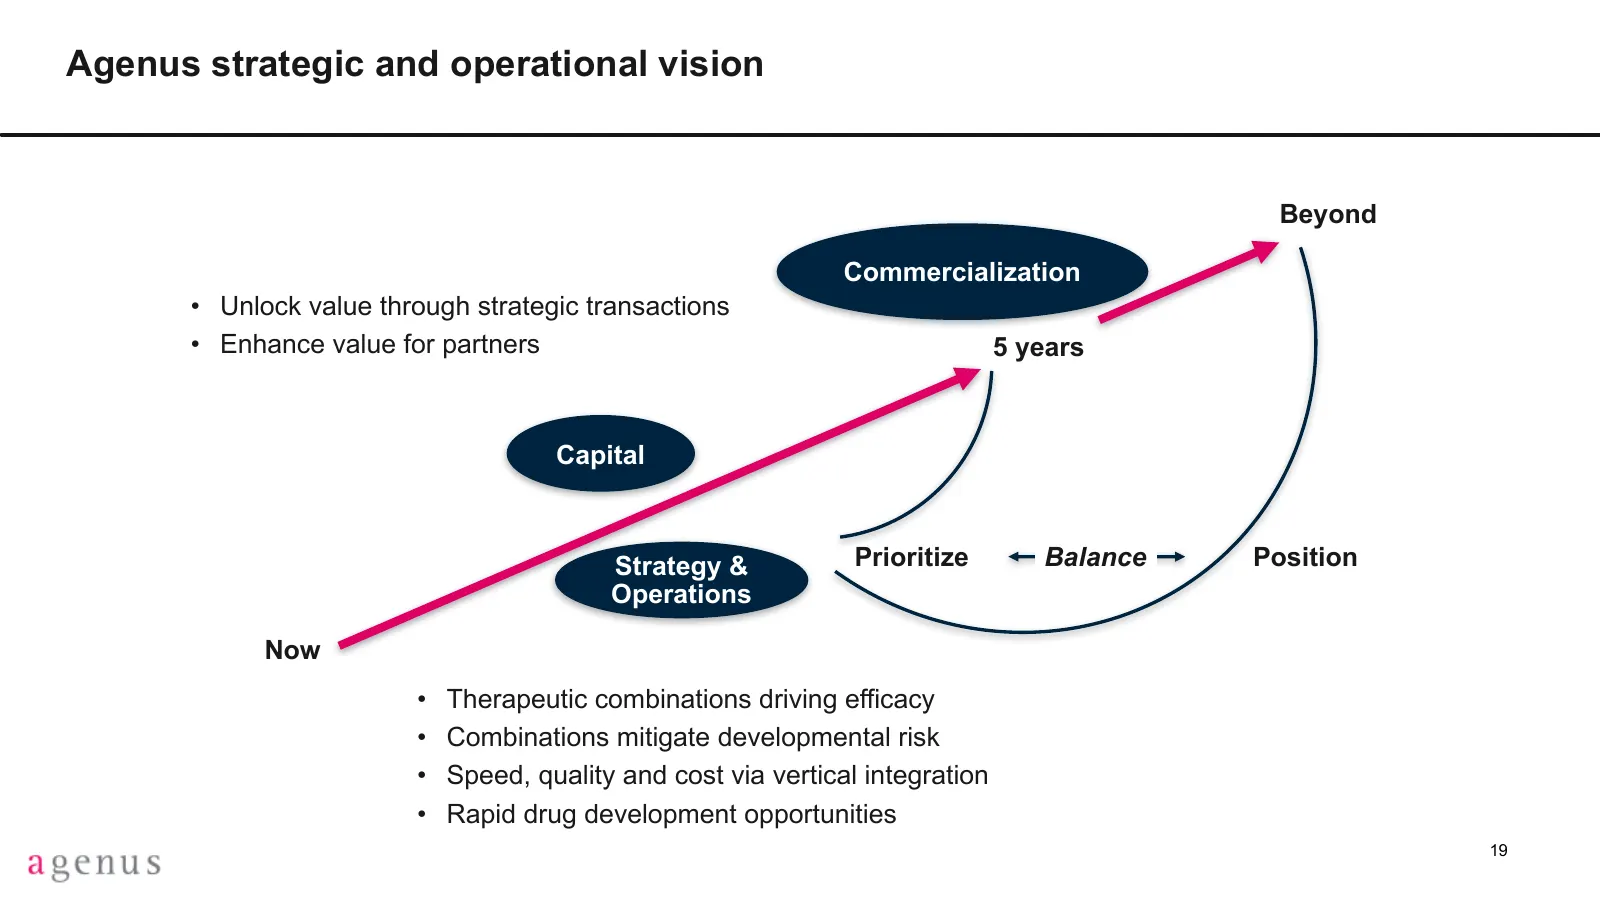
Slide 19: Agenus strategic and operational vision
Agenus strategic and operational vision Beyond Commercialization • Unlock value through strategic transactions • Enhance value for partners 5 years Capital Strategy & Prioritize Balance Position Operations Now • Therapeutic combinations driving efficacy • Combinations mitigate developmental risk • S
Source: Internet Archive copy of agenusbio.com
More decks from Agenus Inc.
 Investor Presentation (November 2026)33 slides · November 2026
 Investor Presentation (October 2026)33 slides · October 2026
 Corporate Update (July 2026)31 slides · Jul 13, 2026
 Investor Presentation (April 2026)24 slides · April 2026
 Agenus Corporate Event at ESMO 202334 slides · Oct 22, 2023
 Technical Presentation (June 2023)17 slides · June 2023