Cambridge Bancorp — Investor Presentation (February 2020)
37 slides from Cambridge Bancorp's investor presentation, Feb 3, 2020
Slide 1: Investor Presentation February 3, 2020
Investor Presentation February 3, 2020 NASDAQ: CATC Parent of Cambridge Trust Company EX: 99-1
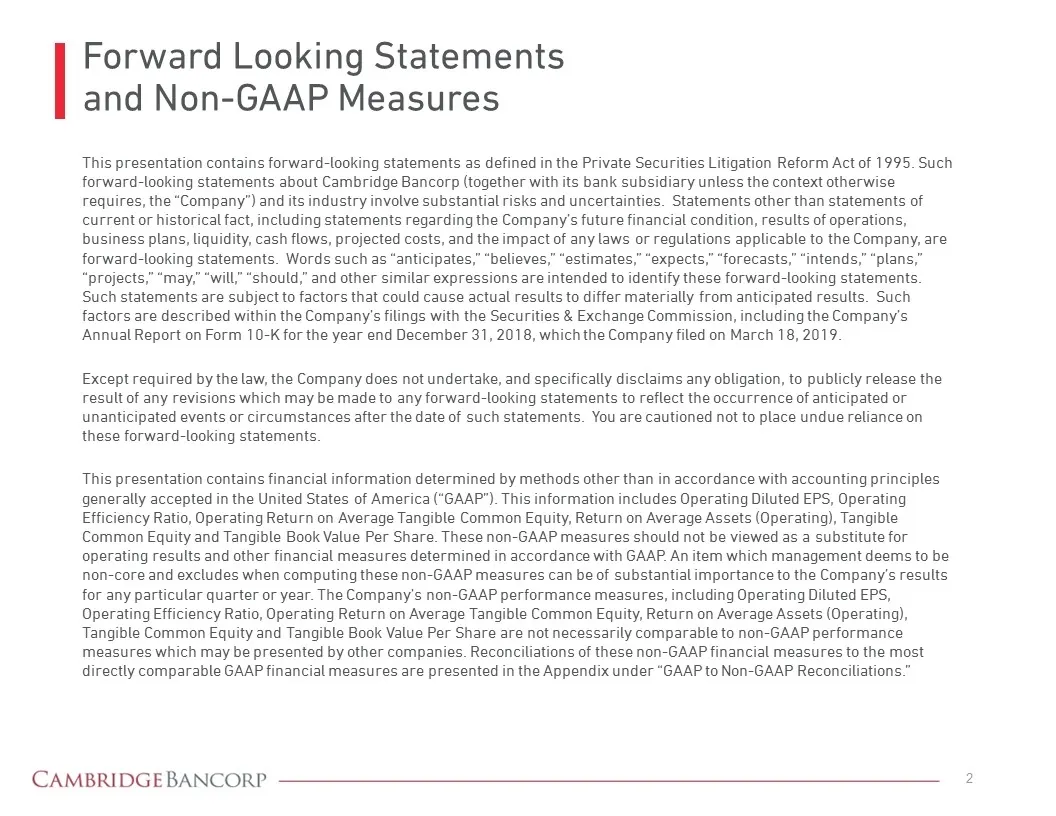
Slide 2: Forward Looking Statements and Non-GAAP Measures
Forward Looking Statements and Non-GAAP Measures This presentation contains forward-looking statements as defined in the Private Securities Litigation Reform Act of 1995. Such forward-looking statements about Cambridge Bancorp (together with its bank subsidiary unless the context otherwise requires,
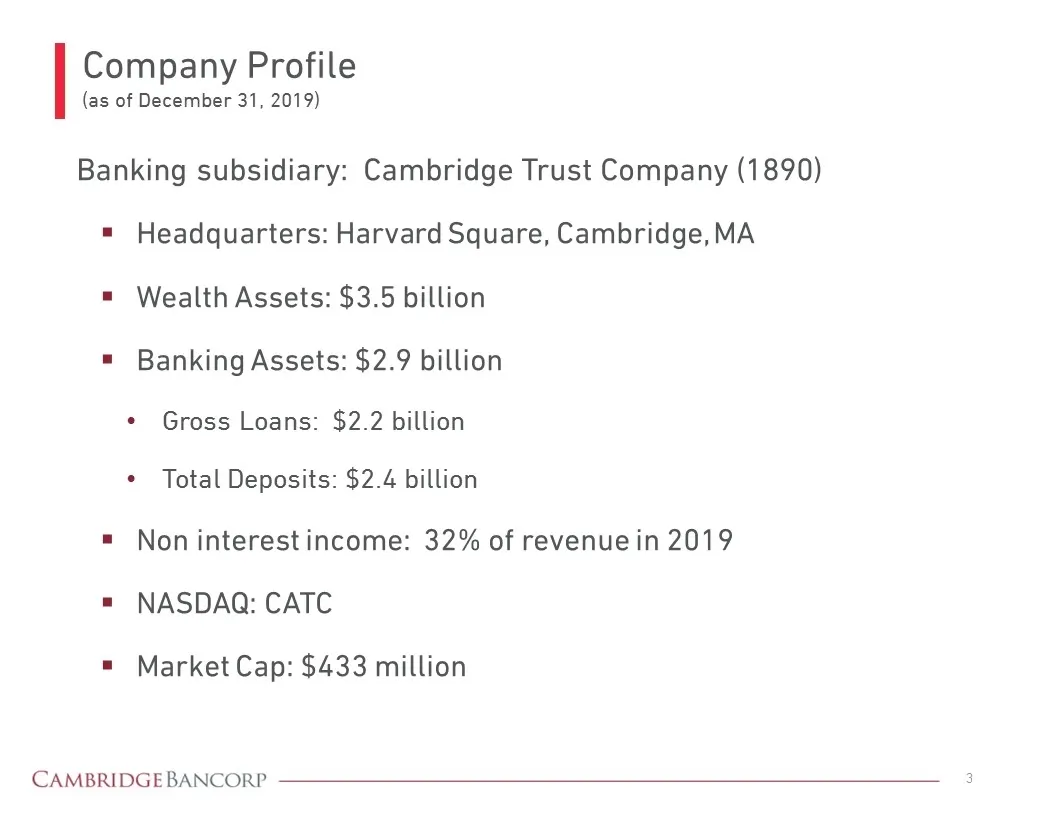
Slide 3: Company Profile (as of December 31, 2019)
Company Profile (as of December 31, 2019) Banking subsidiary: Cambridge Trust Company (1890) Headquarters: Harvard Square, Cambridge, MA Wealth Assets: $3.5 billion Banking Assets: $2.9 billion Gross Loans: $2.2 billion Total Deposits: $2.4 billion Non interest income: 32% of revenue in 2019 NASDAQ:
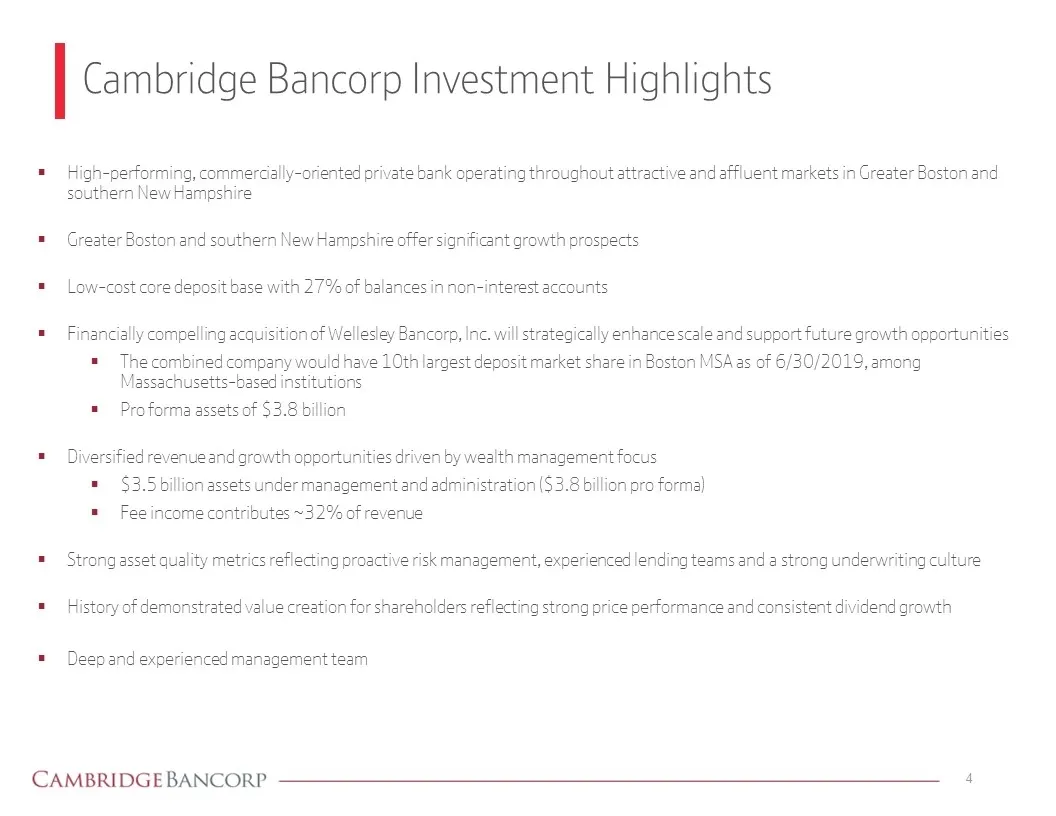
Slide 4: Cambridge Bancorp Investment Highlights
Cambridge Bancorp Investment Highlights High-performing, commercially-oriented private bank operating throughout attractive and affluent markets in Greater Boston and southern New Hampshire Greater Boston and southern New Hampshire offer significant growth prospects Low-cost core deposit base with 2
Slide 5: Geographic Footprint (Pro forma with Wellesley)
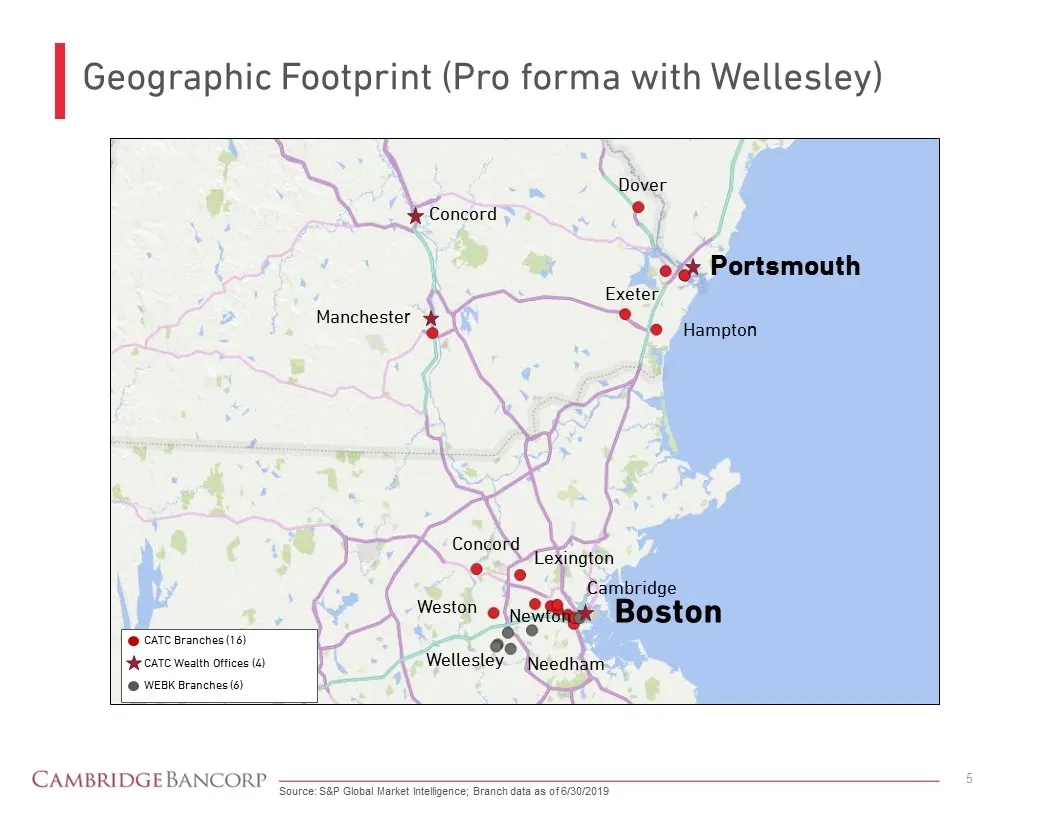
Geographic Footprint (Pro forma with Wellesley) Source: S&P Global Market Intelligence; Branch data as of 6/30/2019 Boston Cambridge Lexington Concord Weston Wellesley Needham Newton CATC Branches (16) CATC Wealth Offices (4) WEBK Branches (6) Portsmouth Dover Concord Manchester Hampton Exeter
Slide 6: Dynamic and Affluent Markets of Operations
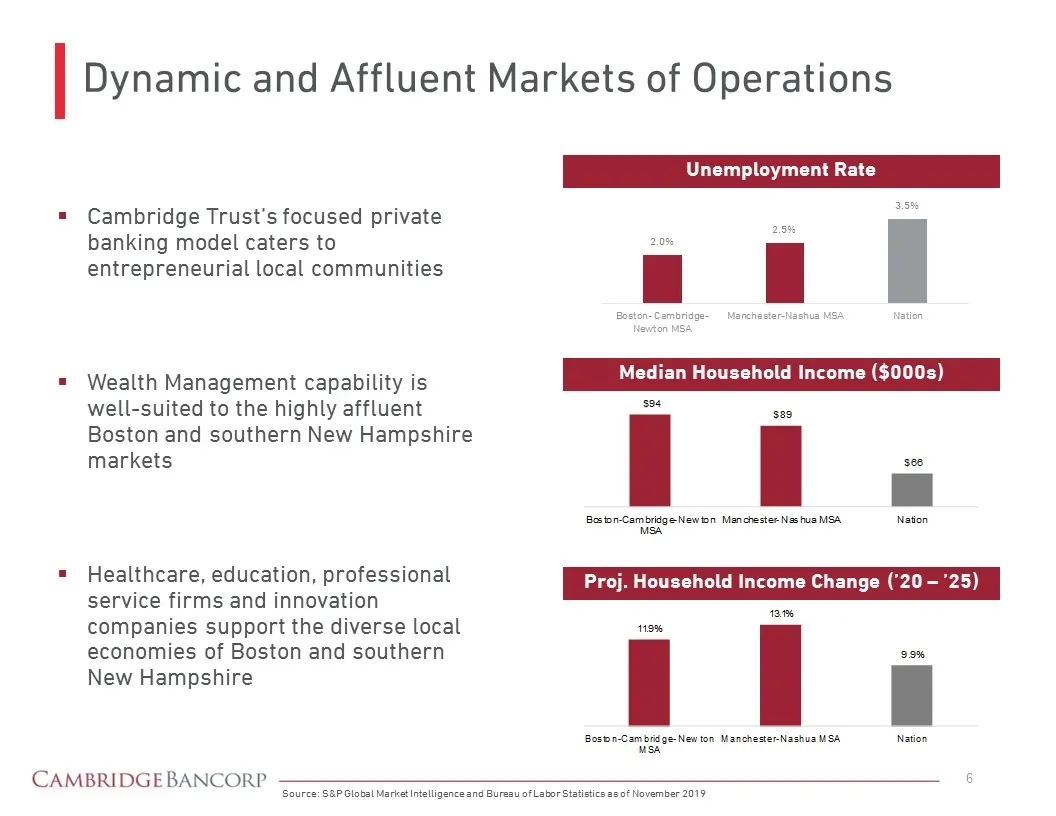
Dynamic and Affluent Markets of Operations Source: S&P Global Market Intelligence and Bureau of Labor Statistics as of November 2019 Unemployment Rate Median Household Income ($000s) Proj. Household Income Change (’20 – ’25) Cambridge Trust’s focused private banking model caters to entrepreneurial l
Slide 7: Why Cambridge Bancorp?
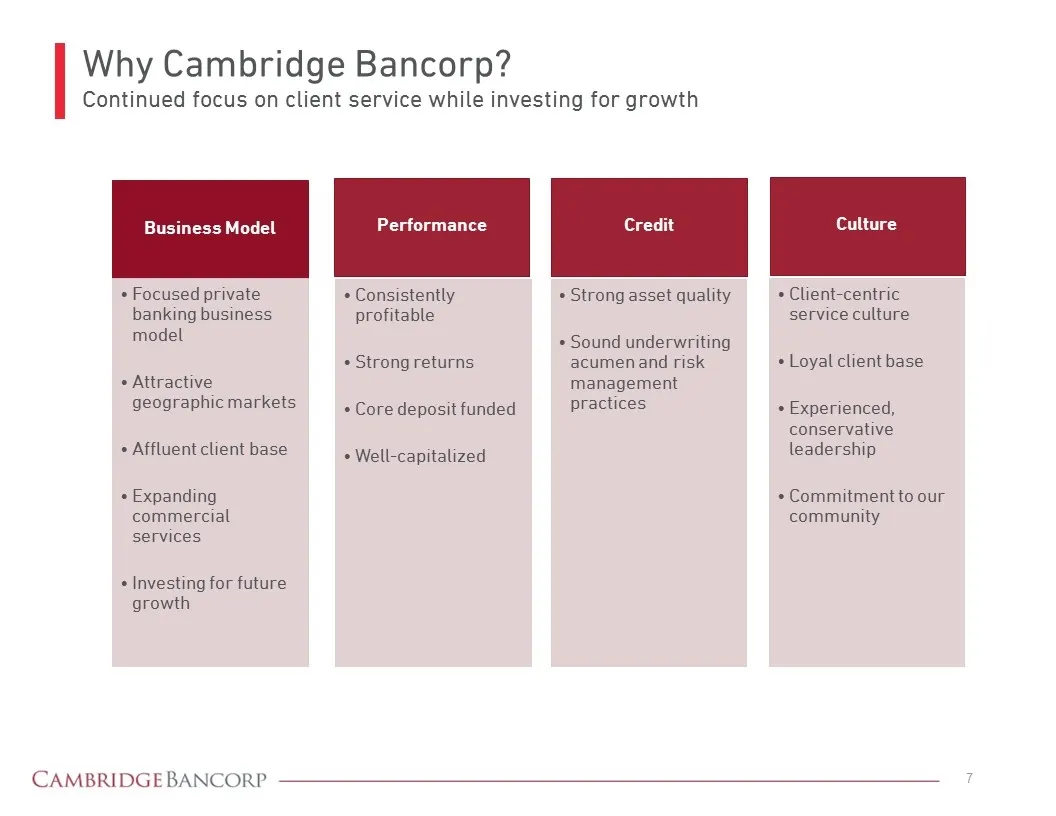
Why Cambridge Bancorp? Continued focus on client service while investing for growth Business Model Focused private banking business model Attractive geographic markets Affluent client base Expanding commercial services Investing for future growth Culture Client-centric service culture Loyal client b
Slide 8: Targeted Operating Model
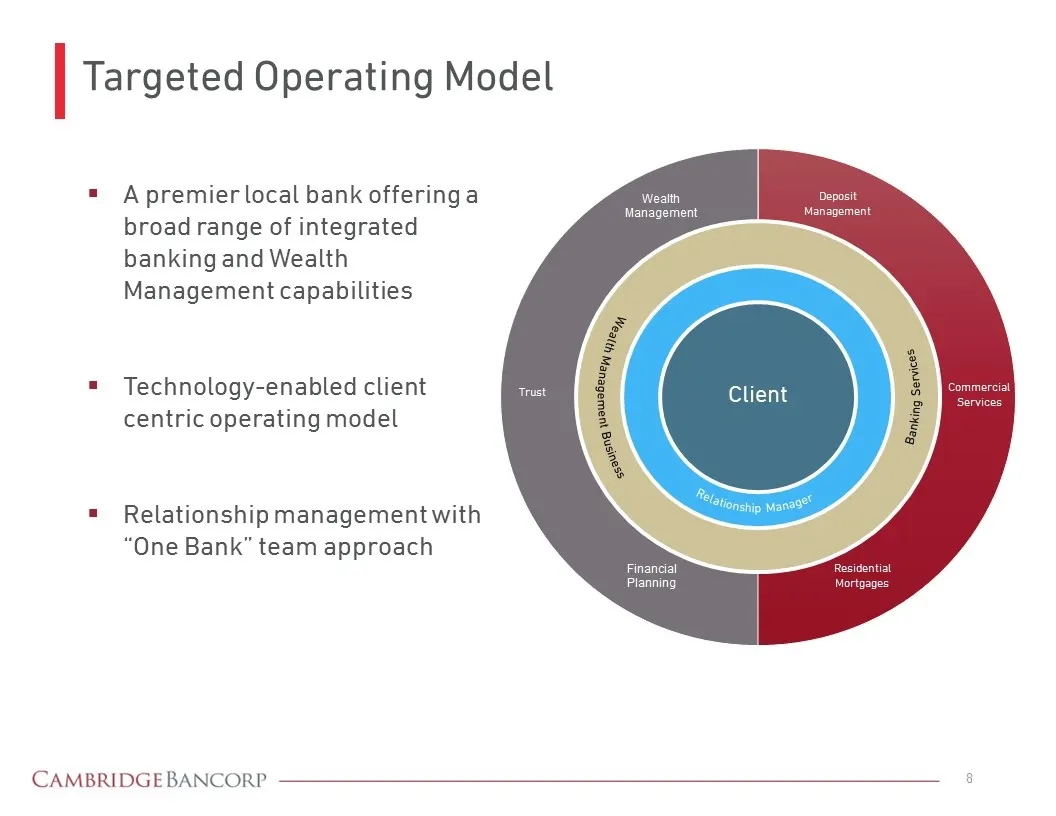
Targeted Operating Model A premier local bank offering a broad range of integrated banking and Wealth Management capabilities Technology-enabled client centric operating model Relationship management with “One Bank” team approach Client Relationship Manager Wealth Management Business Banking Service
Slide 9: Strategic Focus
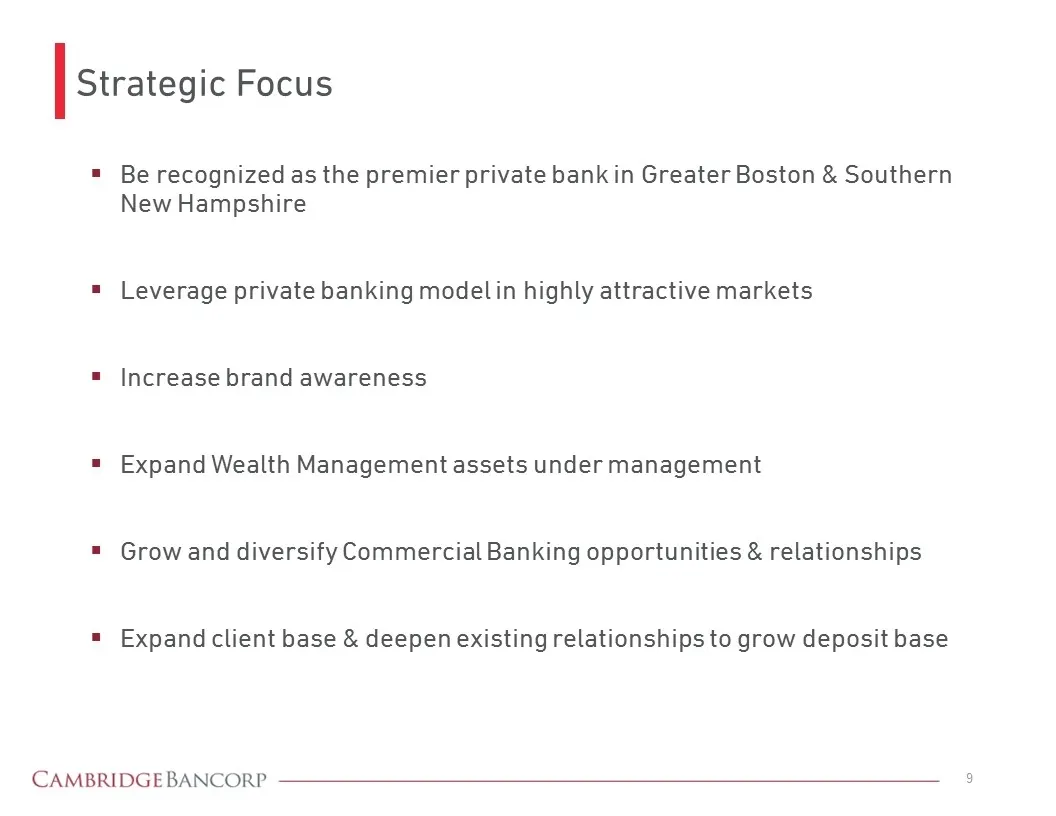
Strategic Focus Be recognized as the premier private bank in Greater Boston & Southern New Hampshire Leverage private banking model in highly attractive markets Increase brand awareness Expand Wealth Management assets under management Grow and diversify Commercial Banking opportunities & relationshi
Slide 10: Recent Strategic Progress
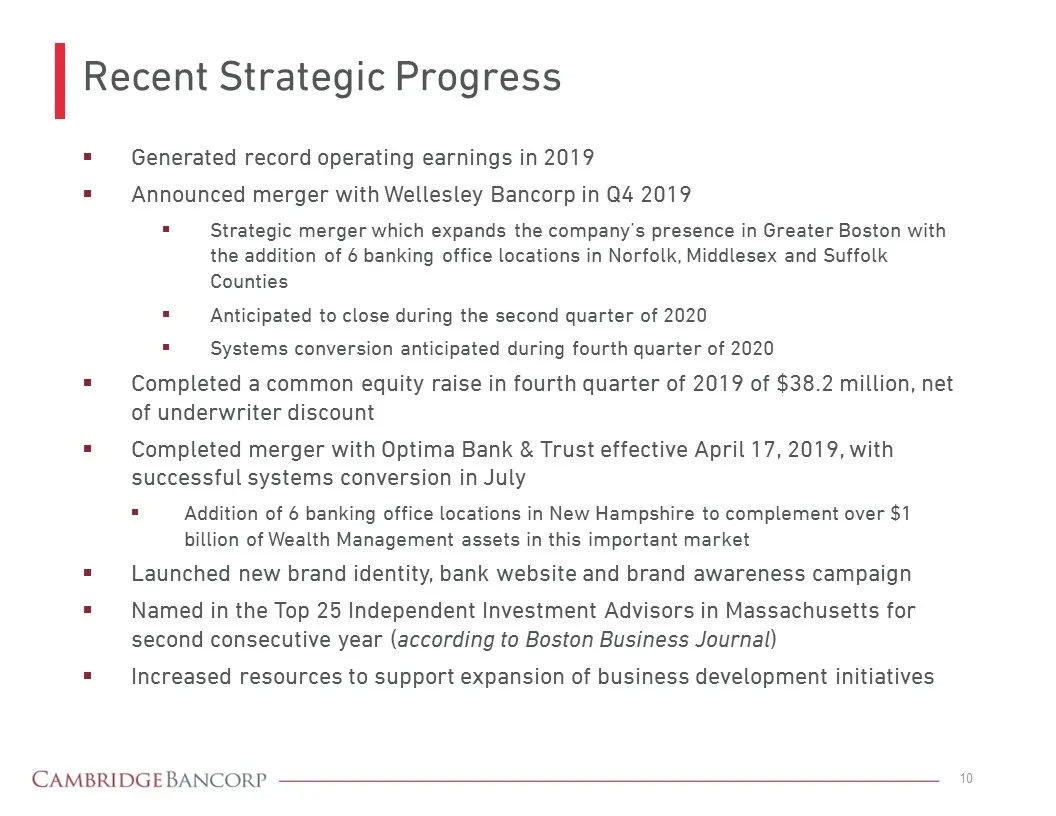
Recent Strategic Progress Generated record operating earnings in 2019 Announced merger with Wellesley Bancorp in Q4 2019 Strategic merger which expands the company’s presence in Greater Boston with the addition of 6 banking office locations in Norfolk, Middlesex and Suffolk Counties Anticipated to c
Slide 11: Strong Financial Performance
Strong Financial Performance
Slide 12: Strong Financial Performance
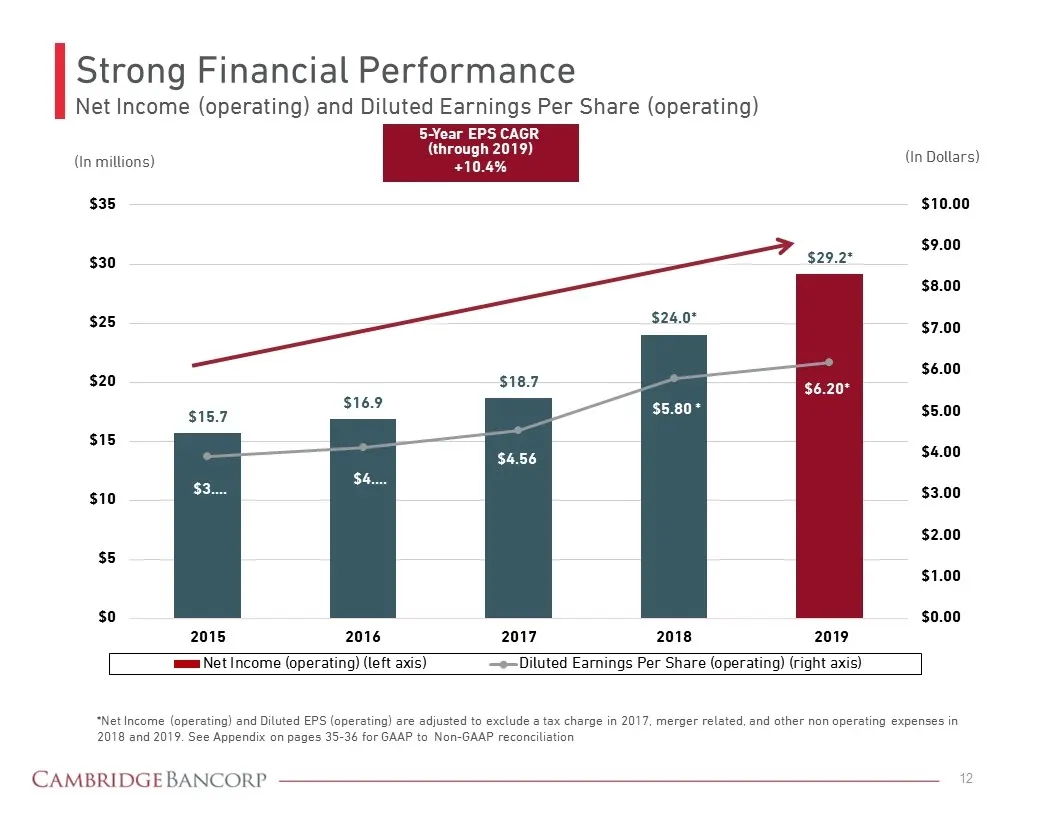
Strong Financial Performance Net Income (operating) and Diluted Earnings Per Share (operating) 5-Year EPS CAGR (through 2019) +10.4% (In Dollars) *Net Income (operating) and Diluted EPS (operating) are adjusted to exclude a tax charge in 2017, merger related, and other non operating expenses in 2018
Slide 13: Deposit Profile
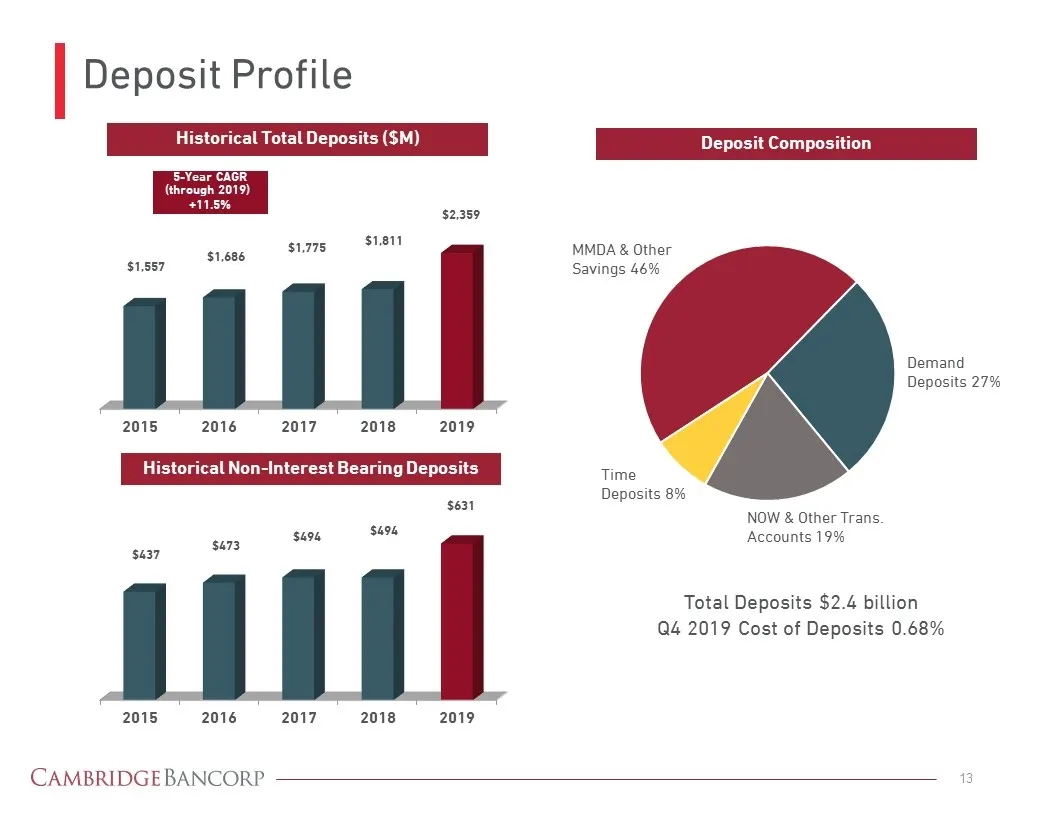
Deposit Profile Historical Total Deposits ($M) Historical Non-Interest Bearing Deposits MMDA & Other Savings 46% Time Deposits 8% Deposit Composition Demand Deposits 27% NOW & Other Trans. Accounts 19% Total Deposits $2.4 billion Q4 2019 Cost of Deposits 0.68% 5-Year CAGR (through 2019) +11.5%
Slide 14: Total Loans and Assets
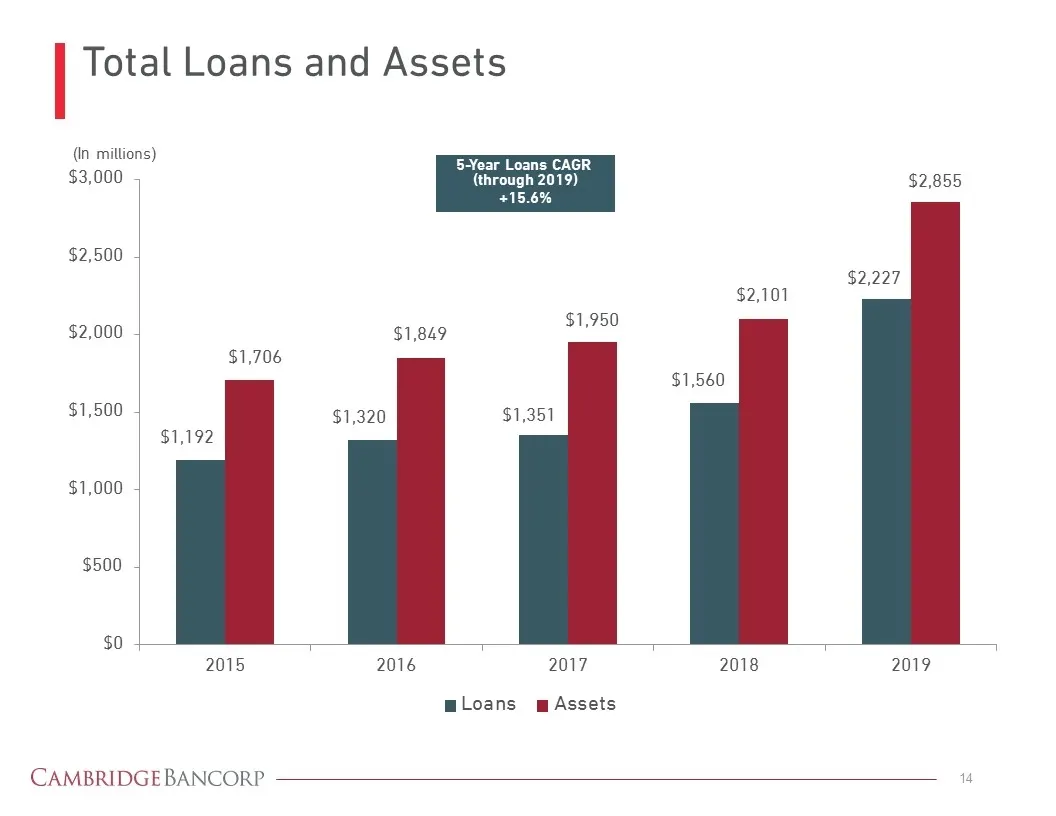
Total Loans and Assets (In millions) 5-Year Loans CAGR (through 2019) +15.6%
Slide 15: Diversified Loan Portfolio
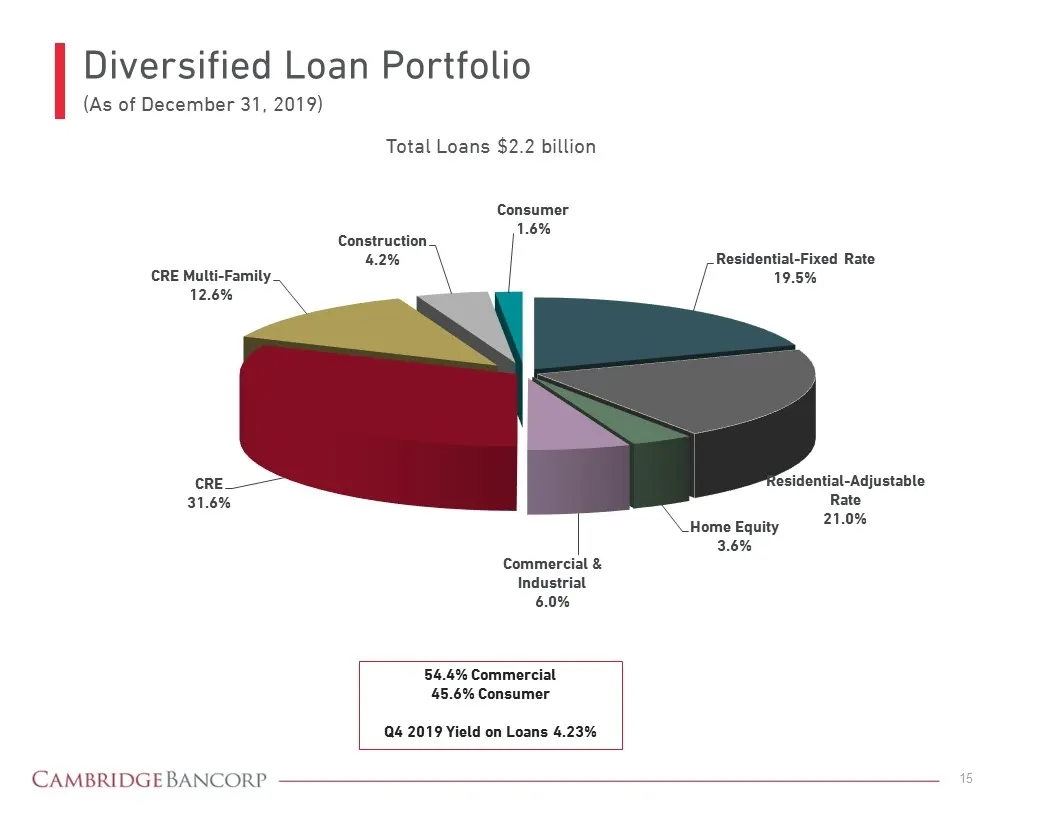
Diversified Loan Portfolio (As of December 31, 2019) Total Loans $2.2 billion 54.4% Commercial 45.6% Consumer Q4 2019 Yield on Loans 4.23%
Slide 16: Net Interest Margin (Fully Taxable Equivalent)
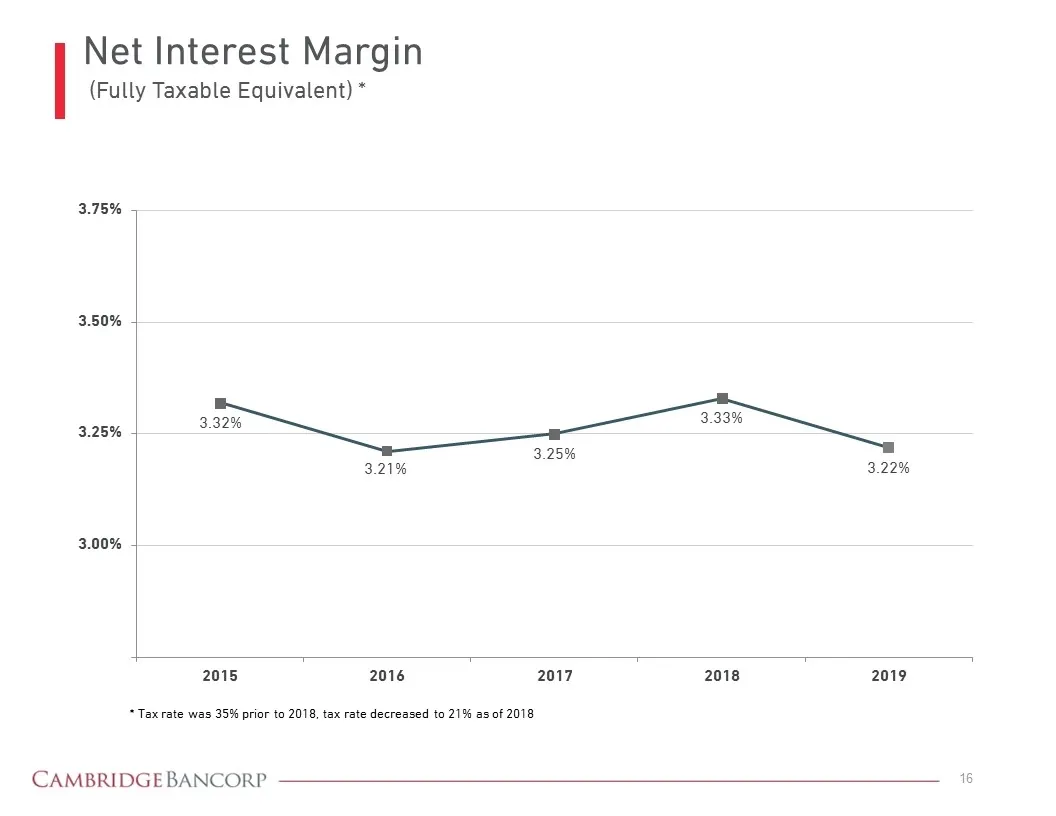
Net Interest Margin (Fully Taxable Equivalent) *
Slide 17: Asset Quality Review
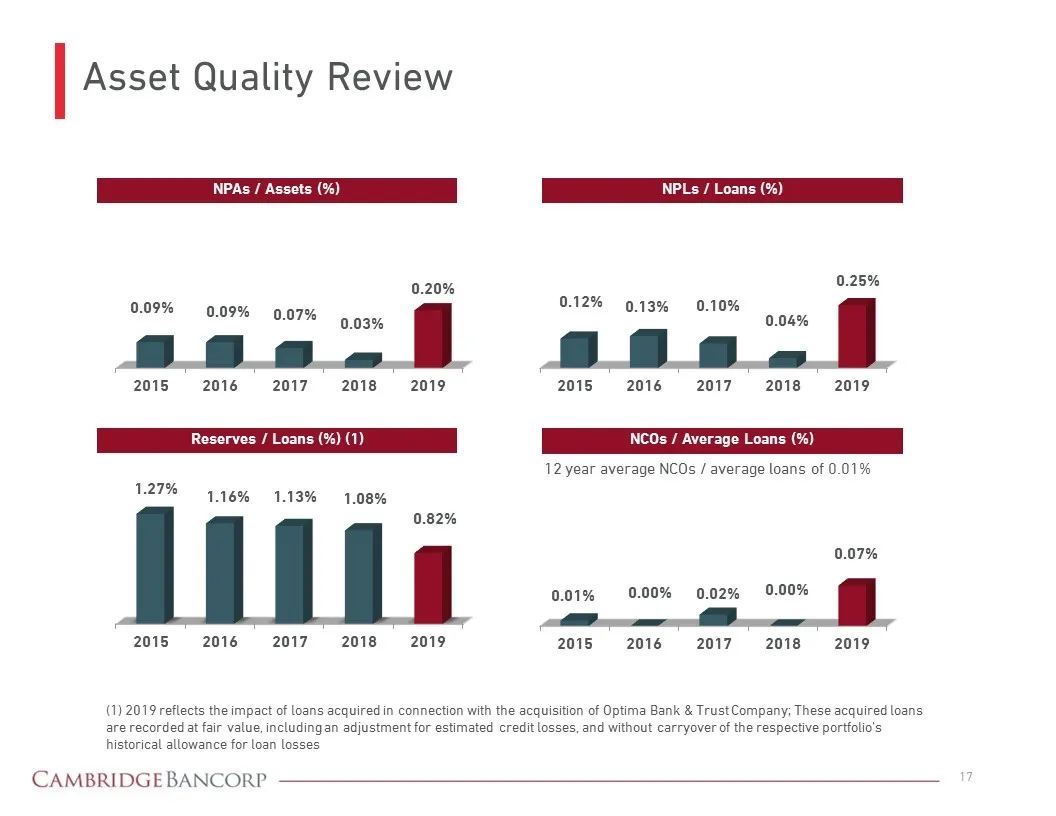
Asset Quality Review NPLs / Loans (%) Reserves / Loans (%) (1) NCOs / Average Loans (%) NPAs / Assets (%) 12 year average NCOs / average loans of 0.01% (1) 2019 reflects the impact of loans acquired in connection with the acquisition of Optima Bank & Trust Company; These acquired loans are recorded
Slide 18: Non-Interest Income – Stable Source of Revenue
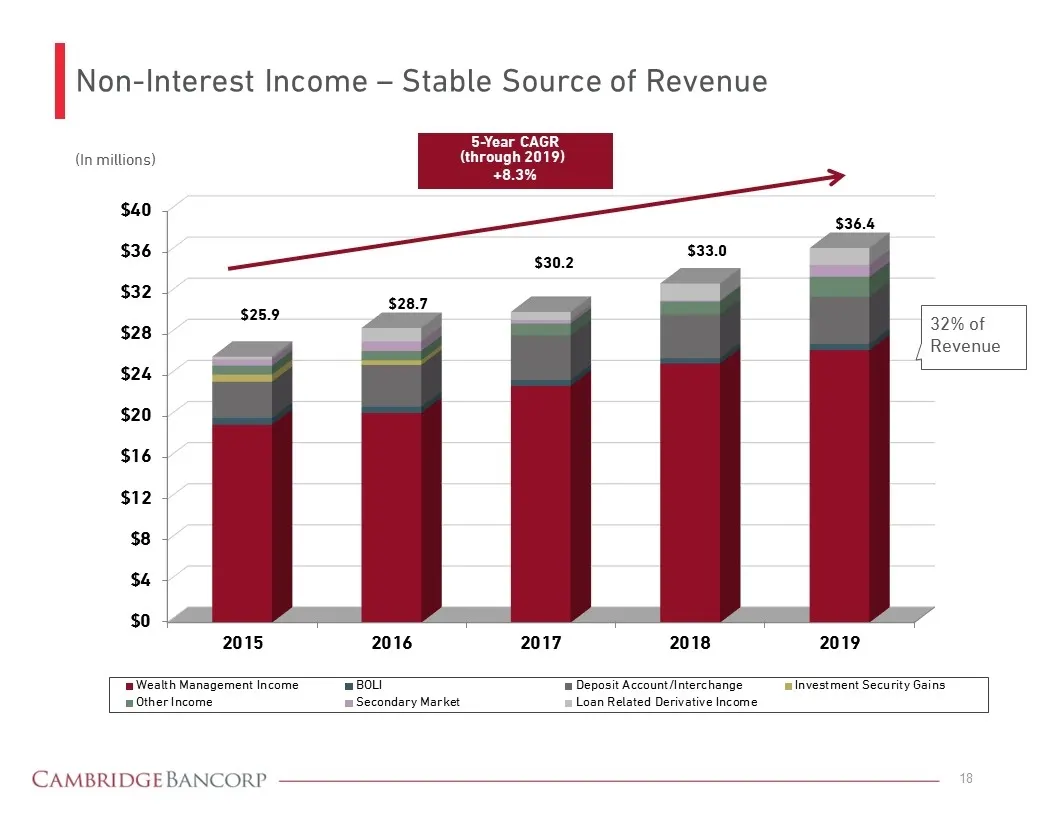
Non-Interest Income – Stable Source of Revenue (In millions) 32% of Revenue 5-Year CAGR (through 2019) +8.3%
Slide 19: Wealth Management Assets Under Management and Administration
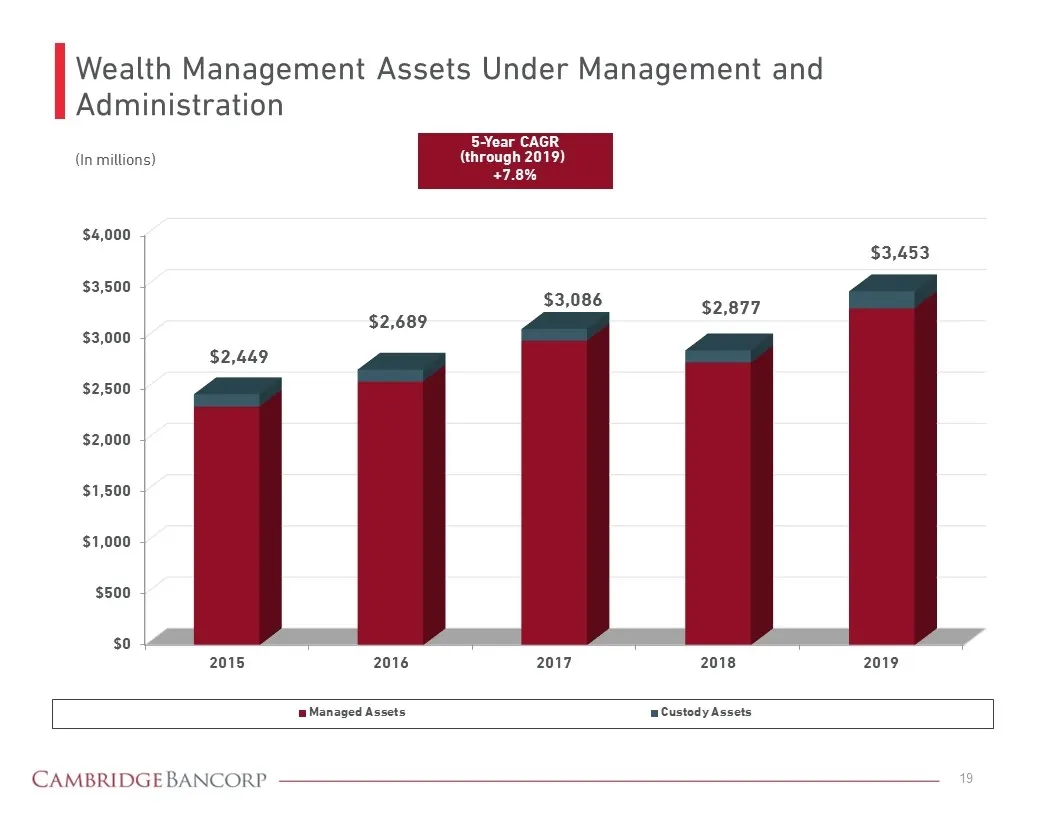
Wealth Management Assets Under Management and Administration 5-Year CAGR (through 2019) +7.8% (In millions)
Slide 20: Wealth Management Revenue
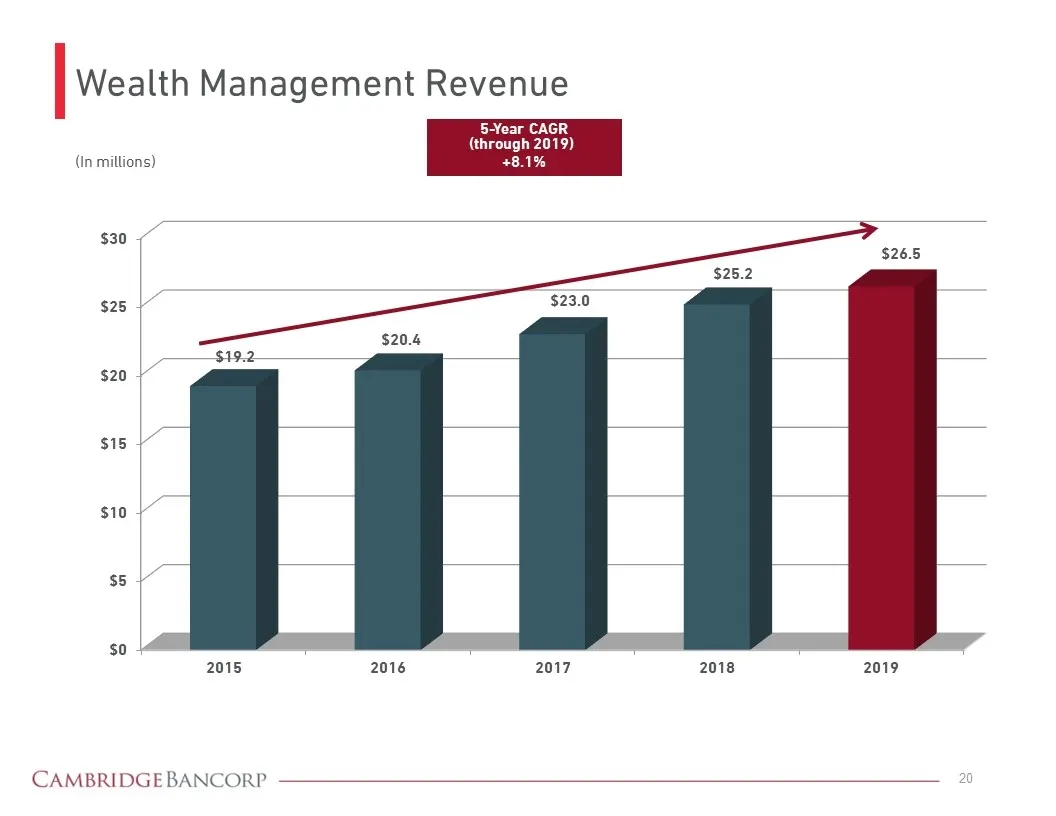
Wealth Management Revenue 5-Year CAGR (through 2019) +8.1% (In millions)
Slide 21: Net Client Flows
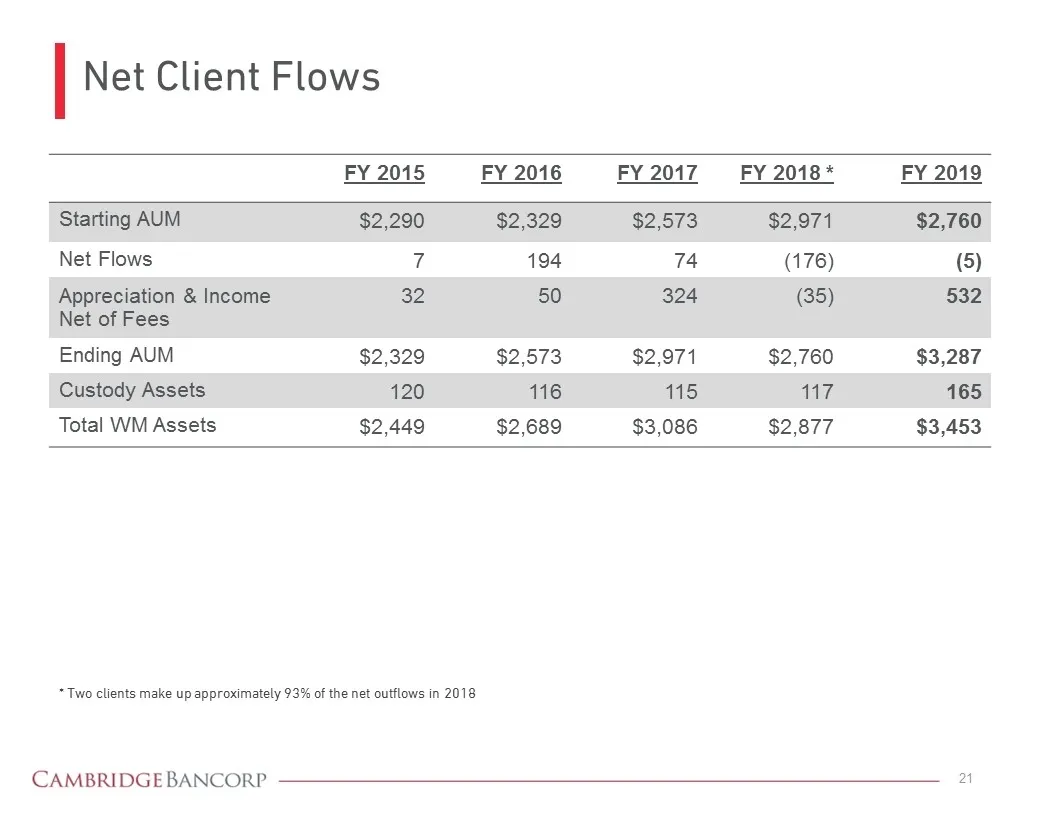
Net Client Flows * Two clients make up approximately 93% of the net outflows in 2018 FY 2015 FY 2016 FY 2017 FY 2018 * FY 2019 Starting AUM $2,290 $2,329 $2,573 $2,971 $2,760 Net Flows 7 194 74 (176) (5) Appreciation & Income Net of Fees 32 50 324 (35) 532 Ending AUM $2,329 $2,573 $2,971 $2,760 $3,2
Slide 22: Other Key Performance Measures
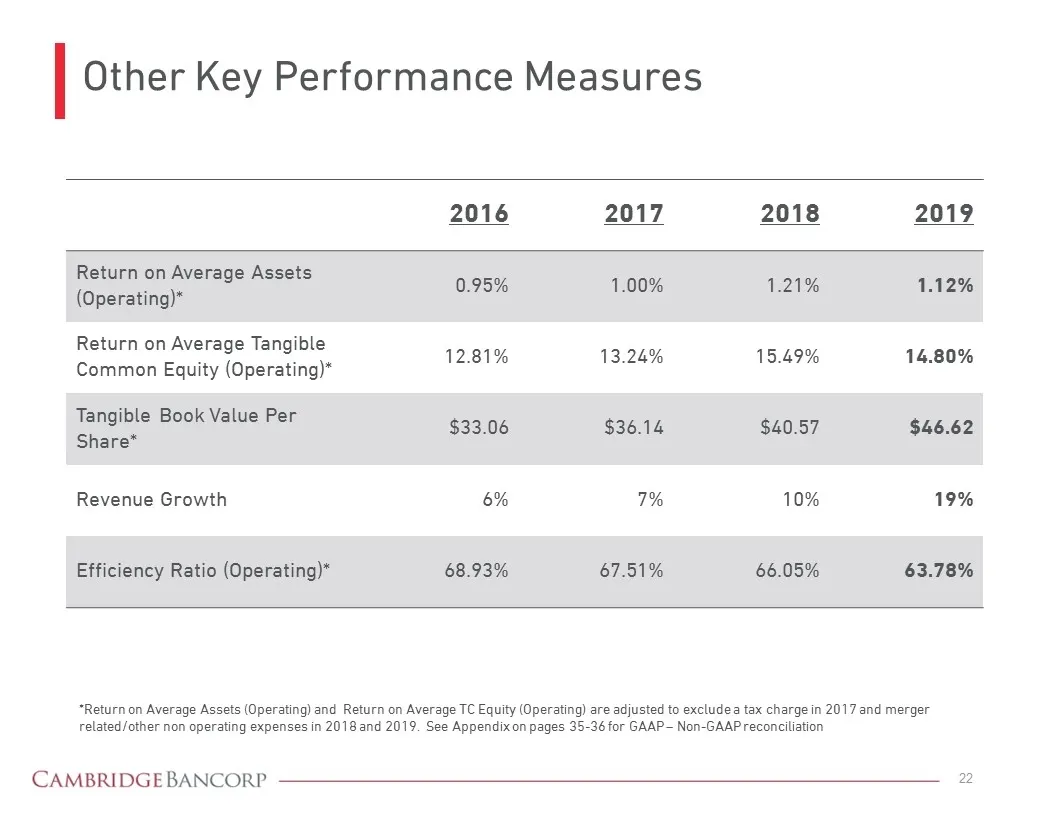
Other Key Performance Measures 2016 2017 2018 2019 Return on Average Assets (Operating)* 0.95% 1.00% 1.21% 1.12% Return on Average Tangible Common Equity (Operating)* 12.81% 13.24% 15.49% 14.80% Tangible Book Value Per Share* $33.06 $36.14 $40.57 $46.62 Revenue Growth 6% 7% 10% 19% Efficiency Ratio
Slide 23: Capital Position
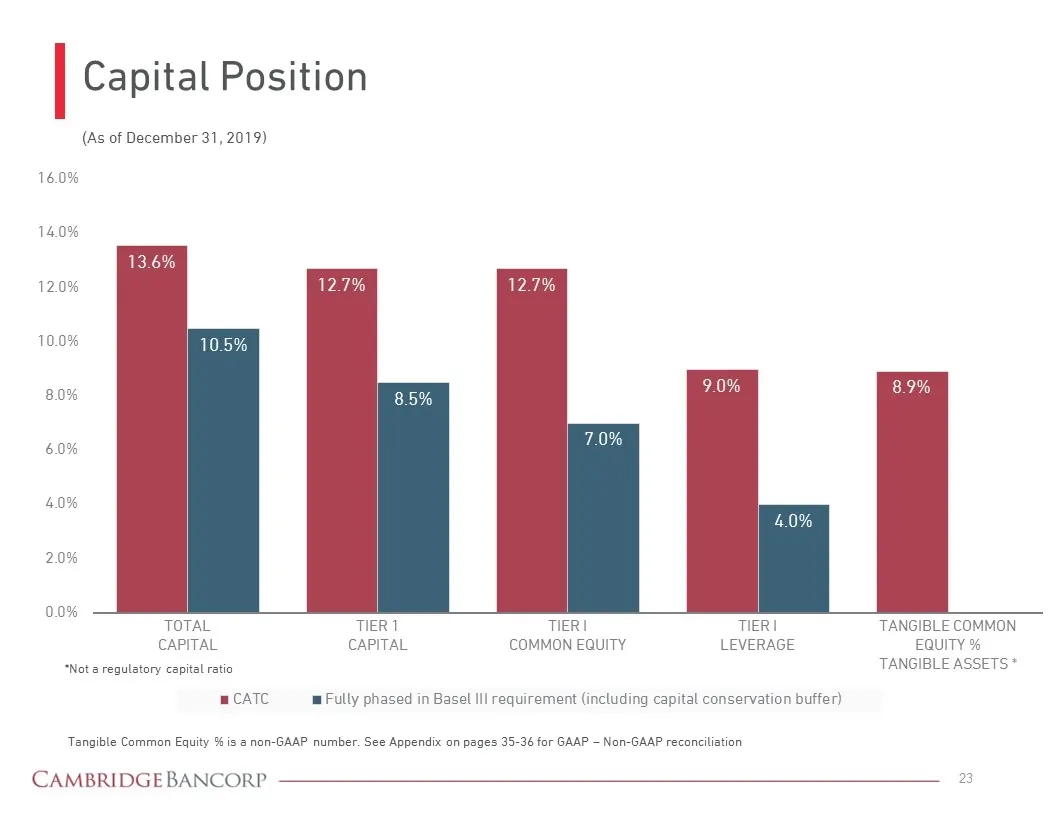
Capital Position (As of December 31, 2019) Tangible Common Equity % is a non-GAAP number. See Appendix on pages 35-36 for GAAP – Non-GAAP reconciliation

Slide 24: Stock Performance & Dividend
Stock Performance & Dividend
Slide 25: Focus on Shareholder Value: Stock Price Performance
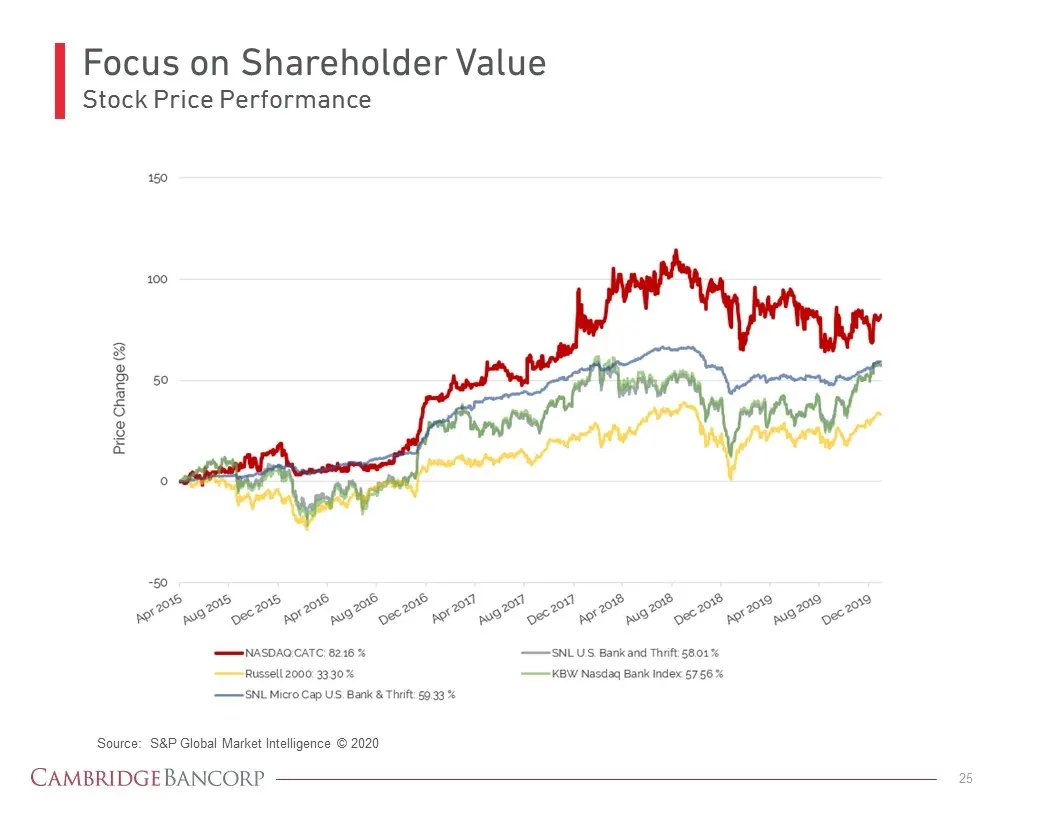
Focus on Shareholder Value Stock Price Performance Source: S&P Global Market Intelligence © 2020
Slide 26: Dividends Declared Per Share
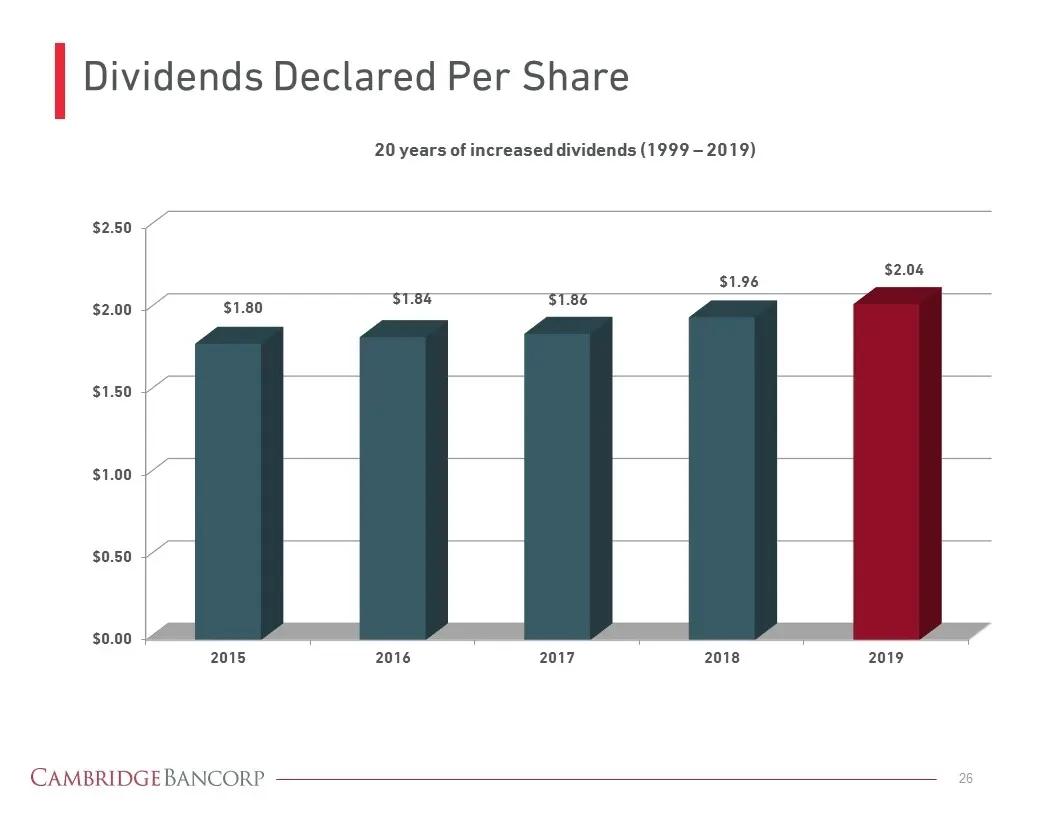
Dividends Declared Per Share 20 years of increased dividends (1999 – 2019)
Slide 27: Merger with Wellesley Bank
Merger with Wellesley Bank CAMBRIDGE BANCORP
Slide 28: Overview of Merger with Wellesley Bancorp, Inc.
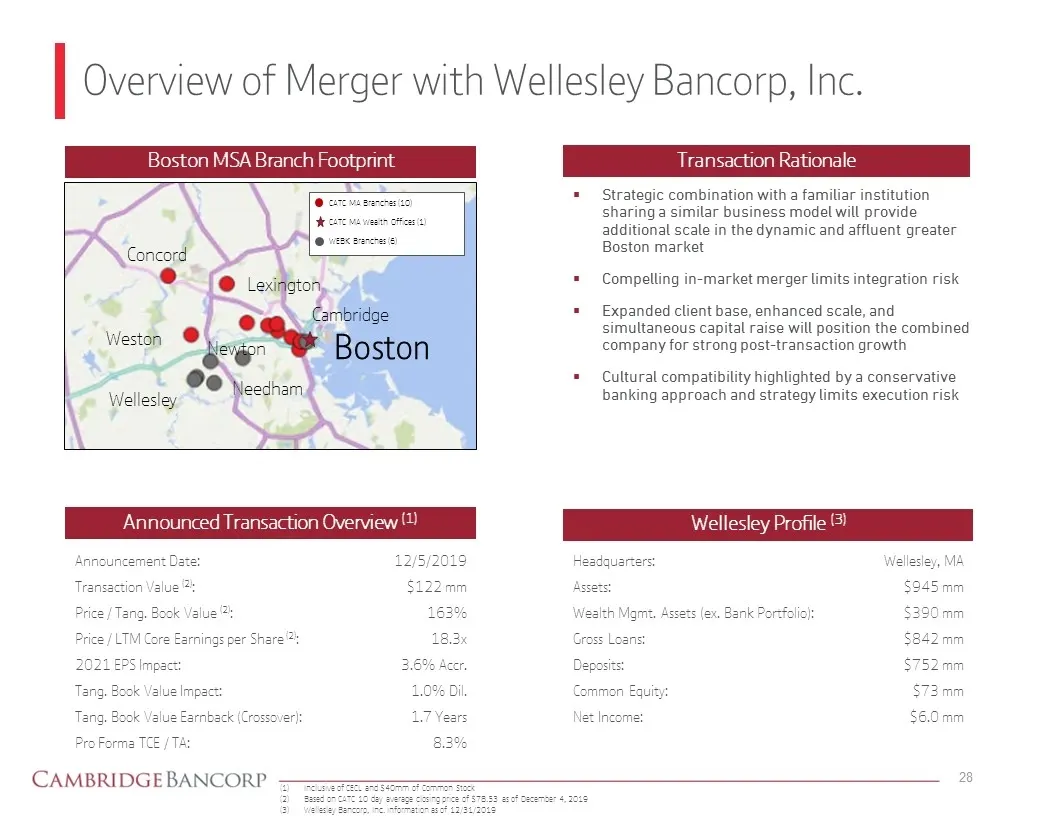
Overview of Merger with Wellesley Bancorp, Inc. Announced Transaction Overview (1) Announcement Date: Transaction Value (2): Price / Tang. Book Value (2): Price / LTM Core Earnings per Share (2): 2021 EPS Impact: Tang. Book Value Impact: Tang. Book Value Earnback (Crossover): Pro Forma TCE / TA: 12/
Slide 29: Cambridge Trust – Investment Merits
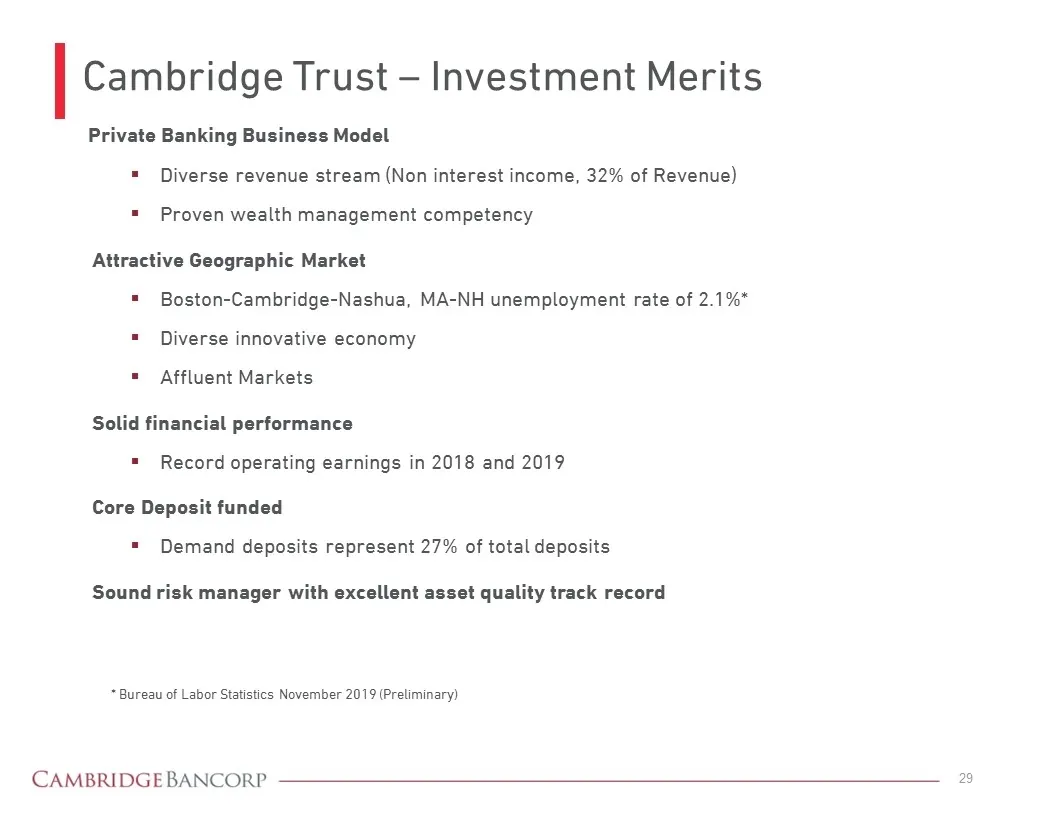
Cambridge Trust – Investment Merits Private Banking Business Model Diverse revenue stream (Non interest income, 32% of Revenue) Proven wealth management competency Attractive Geographic Market Boston-Cambridge-Nashua, MA-NH unemployment rate of 2.1%* Diverse innovative economy Affluent Markets Solid
Slide 30: Appendix
CAMBRIDGE BANCORP Appendix
Slide 31: Appendix – Organic Growth Table
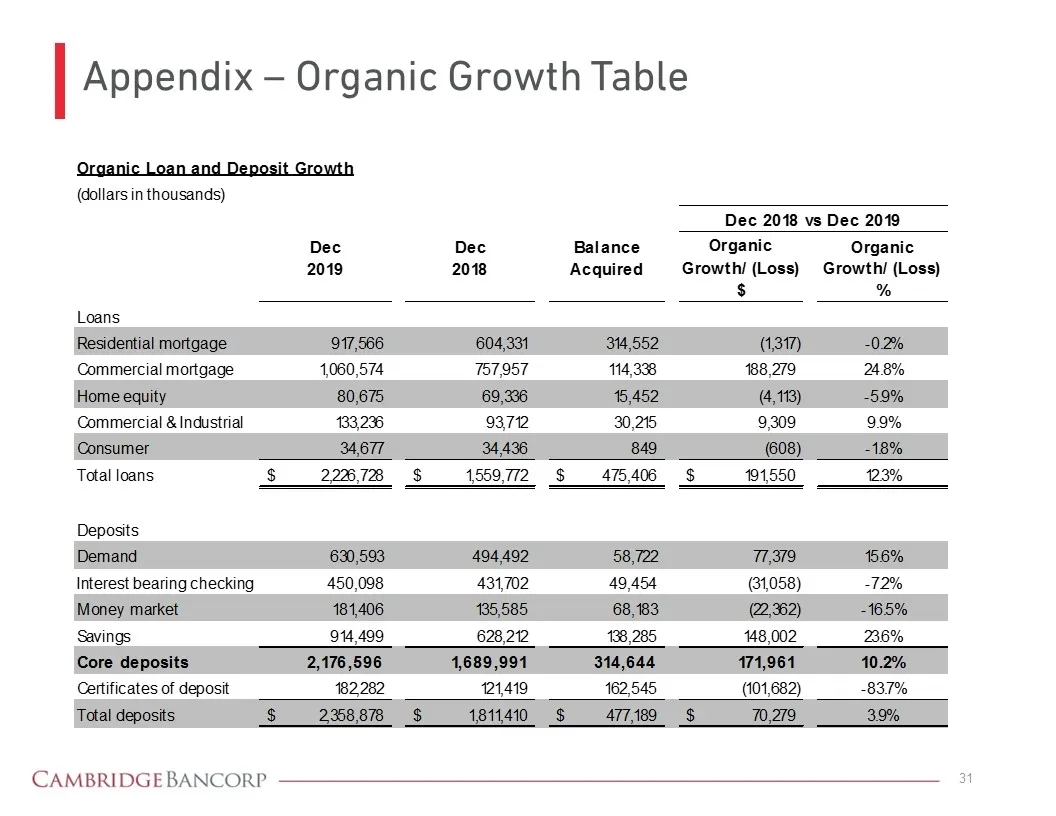
Appendix – Organic Growth Table
Slide 32: Appendix – CATC Financial Snapshot
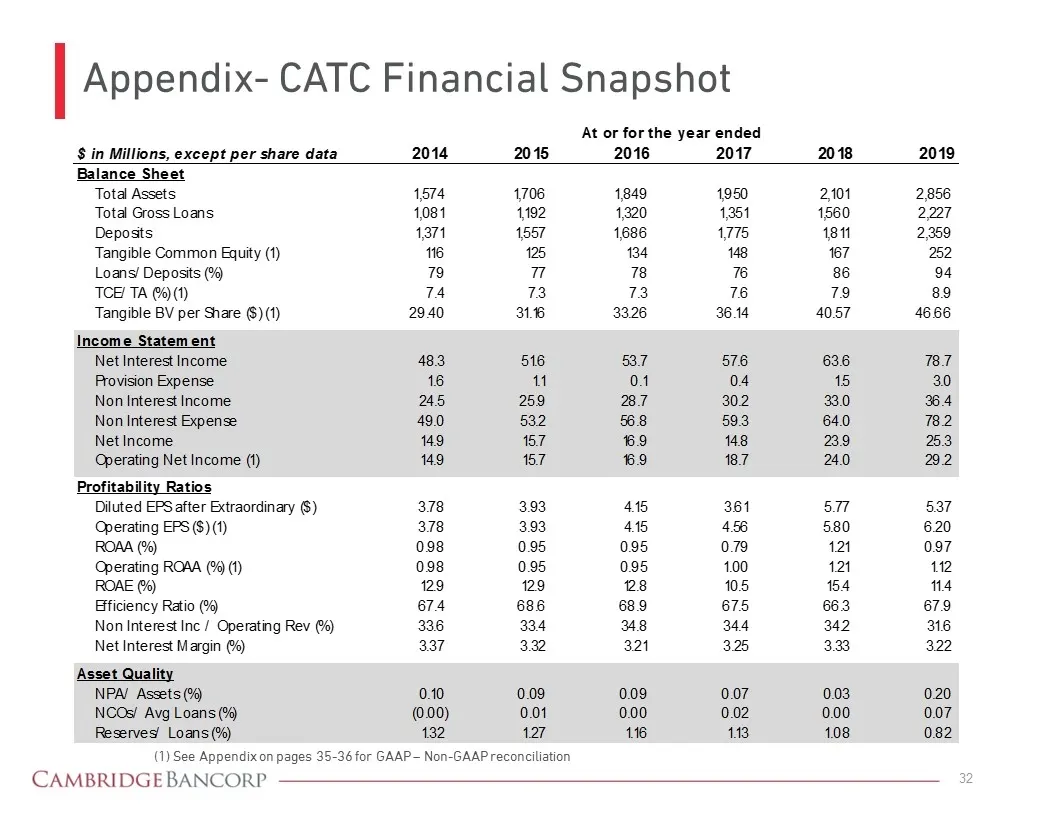
Appendix- CATC Financial Snapshot (1) See Appendix on pages 35-36 for GAAP – Non-GAAP reconciliation
Slide 33: Appendix: Interest Rate Risk Profile
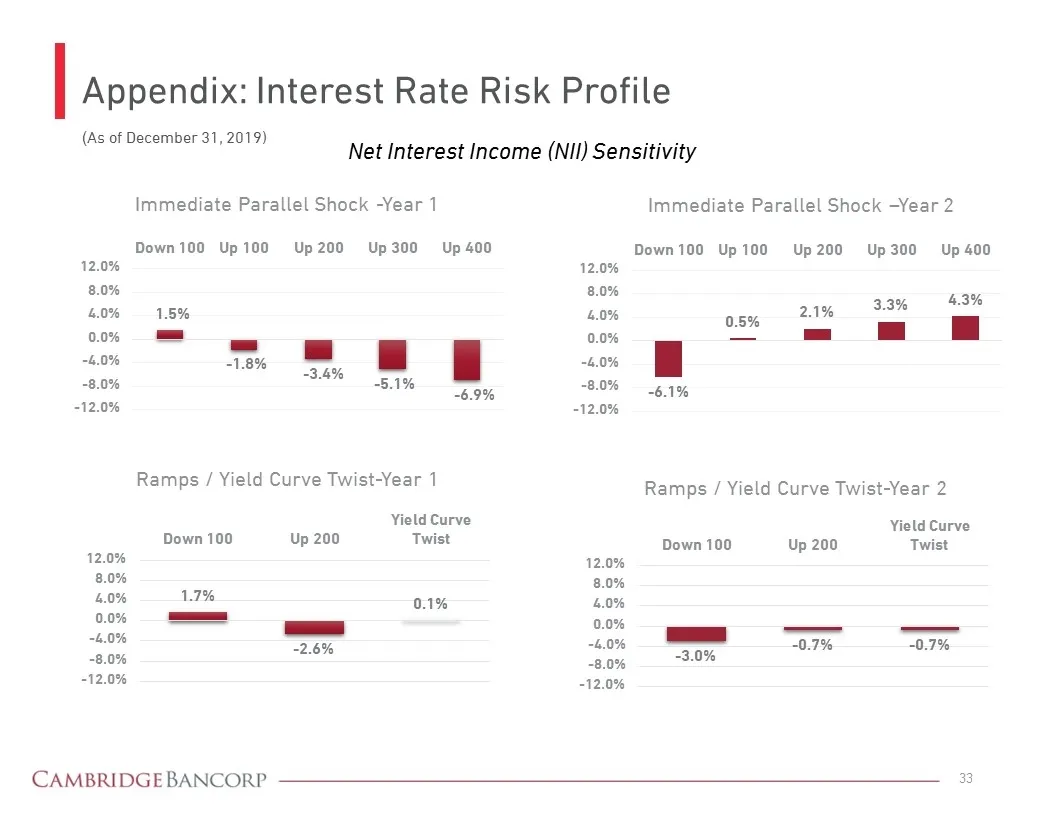
Appendix: Interest Rate Risk Profile Net Interest Income (NII) Sensitivity (As of December 31, 2019)
Slide 34: Appendix: GAAP to Non-GAAP Reconciliations
Appendix: GAAP to Non-GAAP Reconciliations
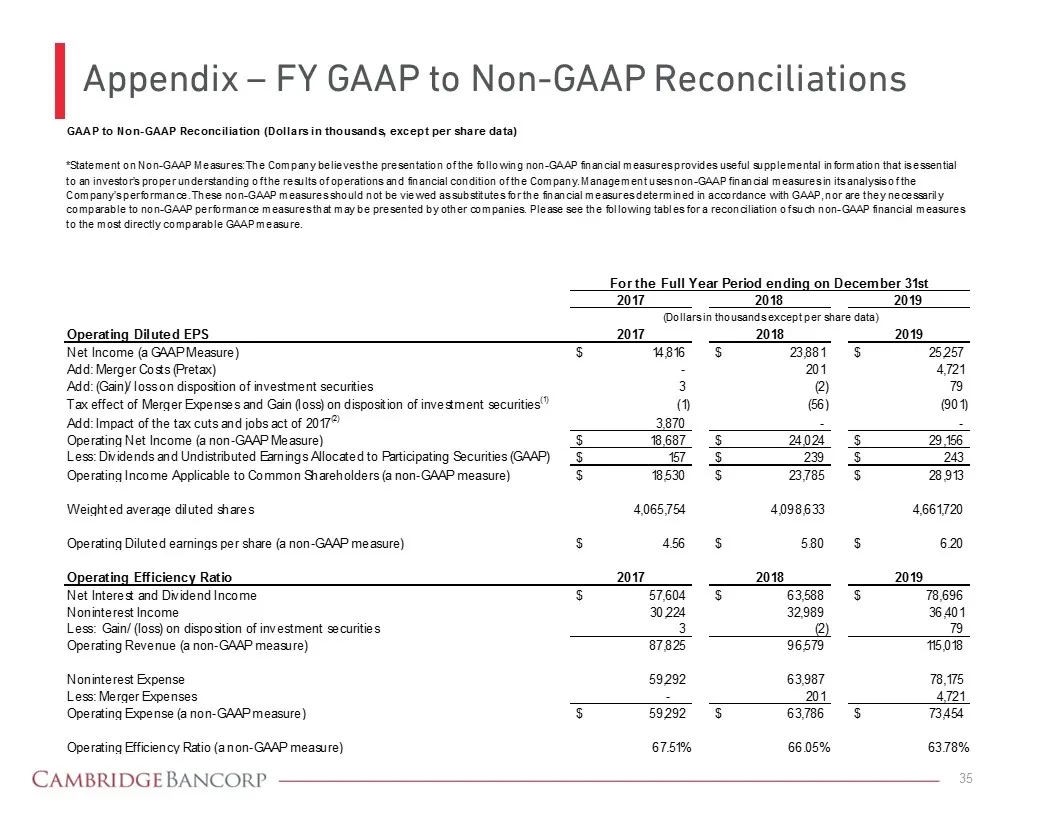
Slide 35: Appendix – FY GAAP to Non-GAAP Reconciliations
Appendix – FY GAAP to Non-GAAP Reconciliations
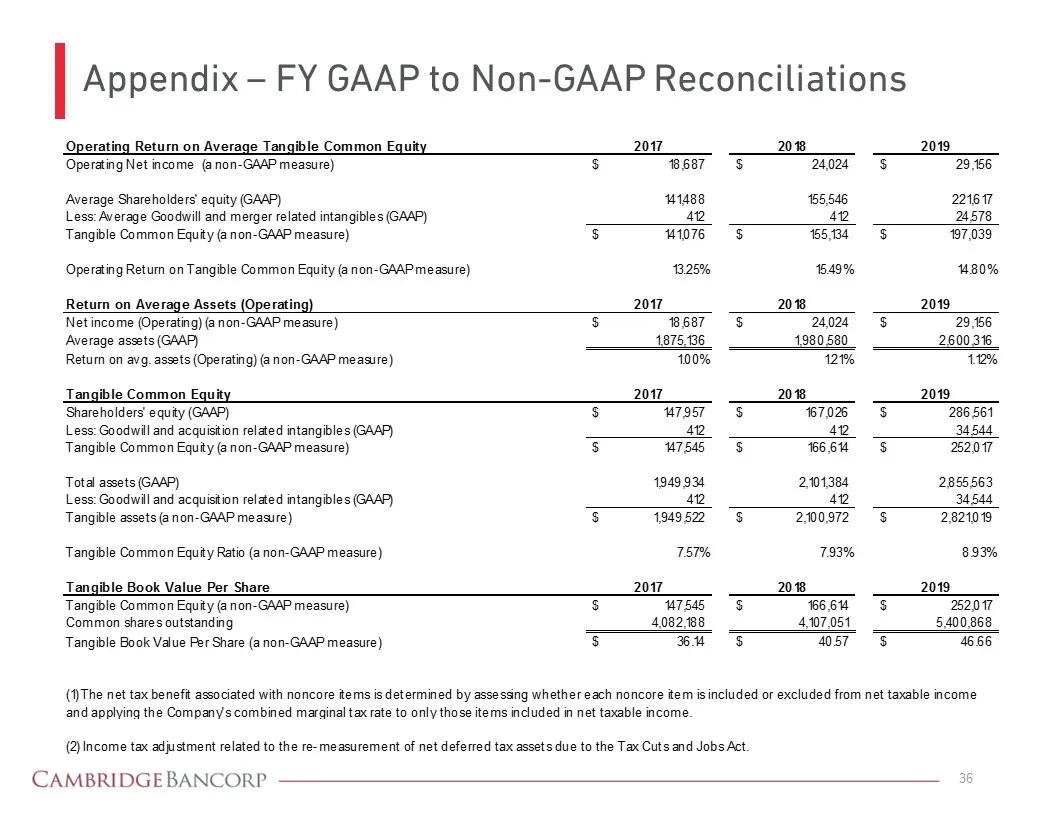
Slide 36: Appendix – FY GAAP to Non-GAAP Reconciliations
Appendix – FY GAAP to Non-GAAP Reconciliations
Slide 37: Cambridge Bancorp Parent of Cambridge Trust Company
Cambridge Bancorp Parent of Cambridge Trust Company Denis K. Sheahan Chairman and Chief Executive Officer 617-441-1533 Michael F. Carotenuto Senior Vice President and Chief Financial Officer 617-520-5520
Source: SEC EDGAR · 8-K filed Feb 3, 2020
More decks from Cambridge Bancorp
 Investor Presentation (April 2024)18 slides · Apr 23, 2024
 Investor Presentation (July 2023)27 slides · Jul 18, 2023
 Investor Presentation (April 2023)27 slides · Apr 25, 2023
 Investor Presentation (January 2023)30 slides · Jan 24, 2023
 Investor Presentation (October 2022)31 slides · Oct 18, 2022
 Investor Presentation (July 2022)31 slides · Jul 19, 2022