Aspen Insurance Holdings Ltd · NYSE:AHL/PE
Aspen Insurance — Q4 2011 Earnings Presentation
15 slides from Aspen Insurance's earnings presentation, Feb 6, 2012

Slide 1: Q4 2011 Earnings Conference Call
Q4 2011 EARNINGS CONFERENCE CALL February 7, 2012 Chris O'Kane Chief Executive OfficerRichard Houghton Chief Financial OfficerAspen Insurance Holdings Limited
Slide 2: Safe Harbor Disclosure
AHL: NYSE SAFE HARBOR DISCLOSURE 2 This slide presentation is for information purposes only. It should be read in conjunction with our financial supplement posted on our website on the Investor Relations page and with other documents filed or to be filed shortly by Aspen Insurance Holdings Limited (
Slide 3: Financial Highlights: Q4 2011
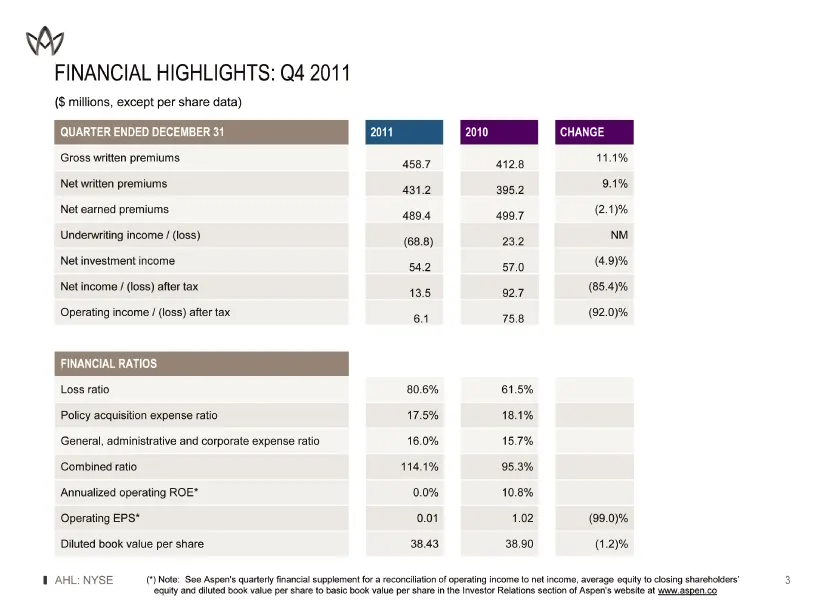
FINANCIAL HIGHLIGHTS: Q4 2011 AHL: NYSE 3 ($ millions, except per share data) (*) Note: See Aspen's quarterly financial supplement for a reconciliation of operating income to net income, average equity to closing shareholders' equity and diluted book value per share to basic book value per share in
Slide 4: Financial Highlights: Year to Date 2011
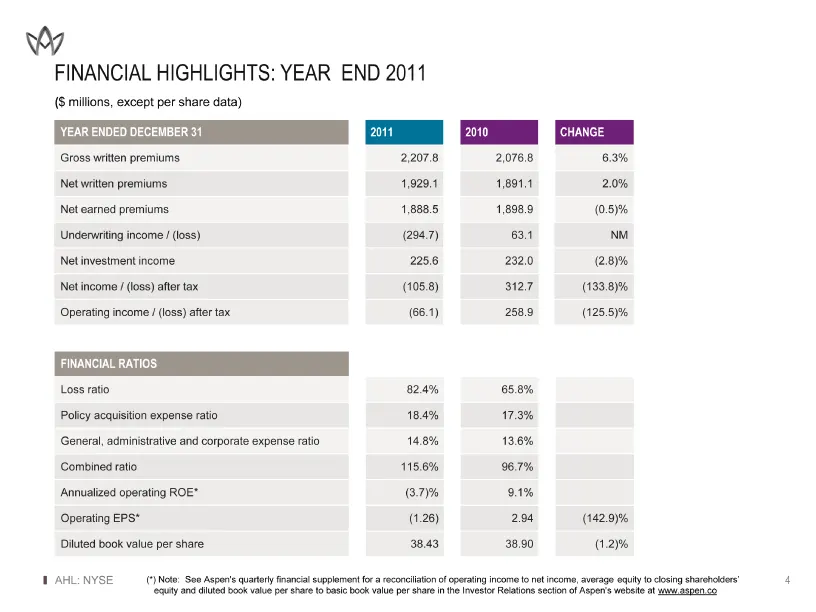
FINANCIAL HIGHLIGHTS: YEAR TO DATE 2011 AHL: NYSE 4 ($ millions, except per share data) (*) Note: See Aspen's quarterly financial supplement for a reconciliation of operating income to net income, average equity to closing shareholders' equity and diluted book value per share to basic book value per
Slide 5: Growth in Book Value per Share and Net Income ROE
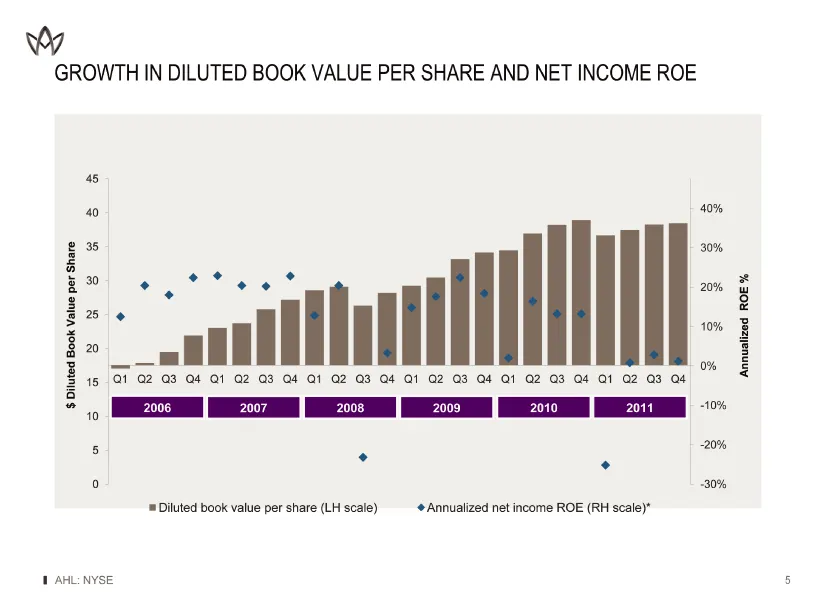
GROWTH IN BOOK VALUE PER SHARE AND NET INCOME ROE AHL: NYSE 5 GROWTH IN BOOK VALUE PER SHARE AND NET INCOME ROE (CHART) $ Diluted Book Value per Share Annualized ROE %
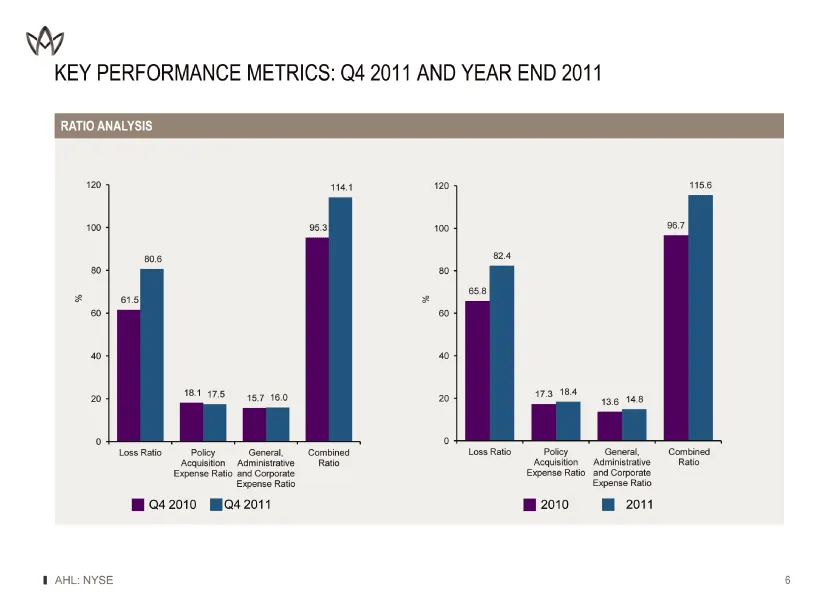
Slide 6: Ratio Analysis: Key Performance Metrics
RATIO ANALYSIS AHL: NYSE 7 KEY PERFORMANCE METRICS: Q4 2011 AND YEAR TO DATE 2011 Q4 2010 Q4 2011 2010 2011 (CHART) (CHART)
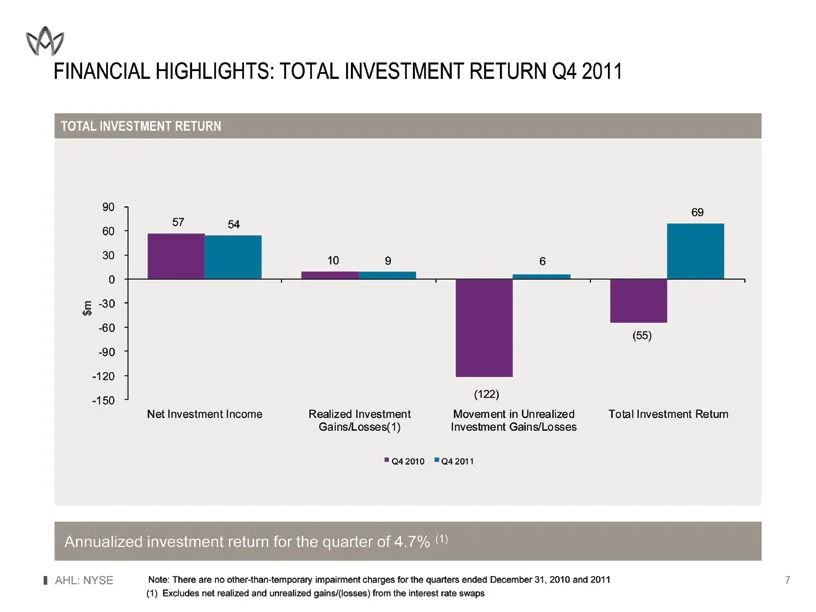
Slide 7: Total Investment Return: Q4 2011
AHL: NYSE 8 TOTAL INVESTMENT RETURN FINANCIAL HIGHLIGHTS: TOTAL INVESTMENT RETURN Q4 2011 Annualized investment return for the quarter of 4.7% (1) (CHART) Note: There are no other-than-temporary impairment charges for the quarters ended December 31, 2010 and 2011 (1) Excludes net realized and unreal
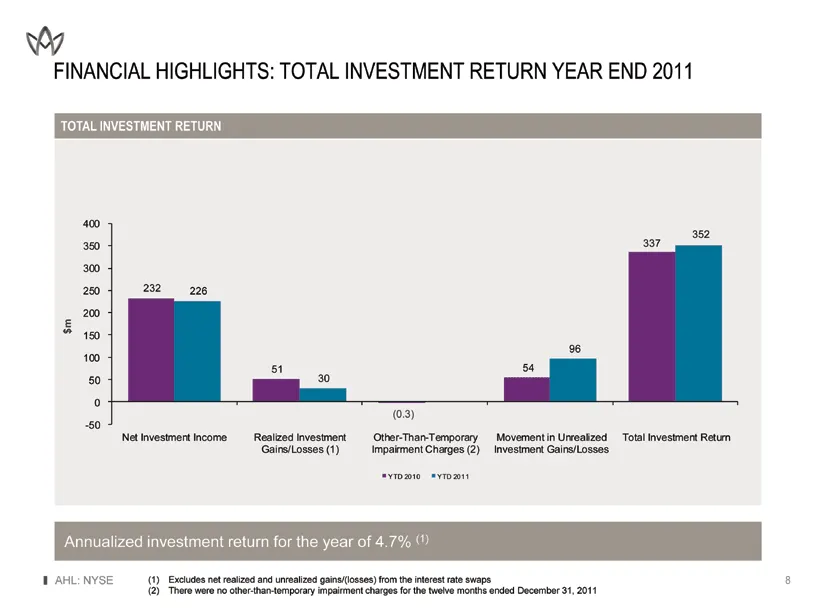
Slide 8: Total Investment Return: Year to Date 2011
AHL: NYSE 9 TOTAL INVESTMENT RETURN FINANCIAL HIGHLIGHTS: TOTAL INVESTMENT RETURN YEAR TO DATE 2011 Annualized investment return for the year of 4.7% Excludes net realized and unrealized gains/(losses) from the interest rate swapsThere were no other-than-temporary impairment charges for the twelve m
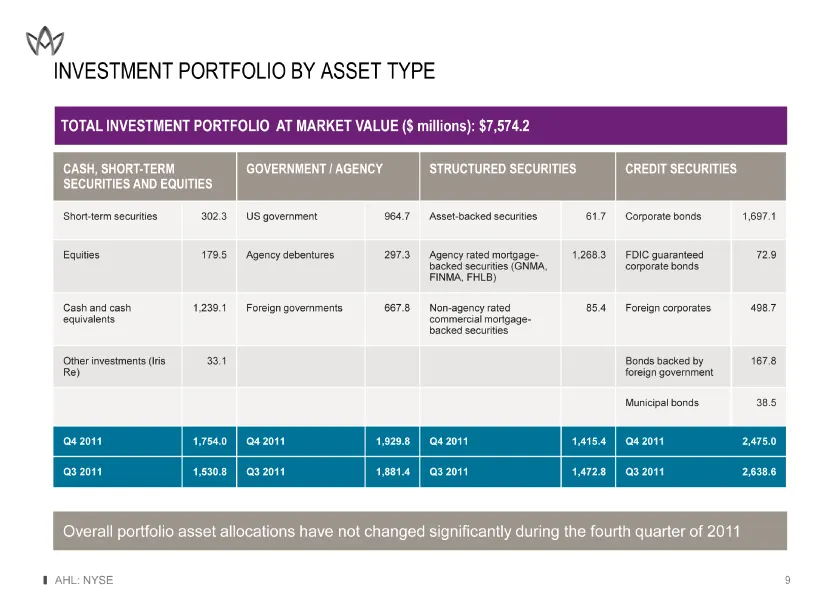
Slide 9: Cash, Short-Term Securities and Equities; Investment Portfolio by Asset Type
AHL: NYSE 10 CASH, SHORT-TERM SECURITIES AND EQUITIES CASH, SHORT-TERM SECURITIES AND EQUITIES GOVERNMENT / AGENCY GOVERNMENT / AGENCY STRUCTURED SECURITIES STRUCTURED SECURITIES CREDIT SECURITIES CREDIT SECURITIES Short-term securities 302.3 US government 964.7 Asset-backed securities 61.7 Corporat
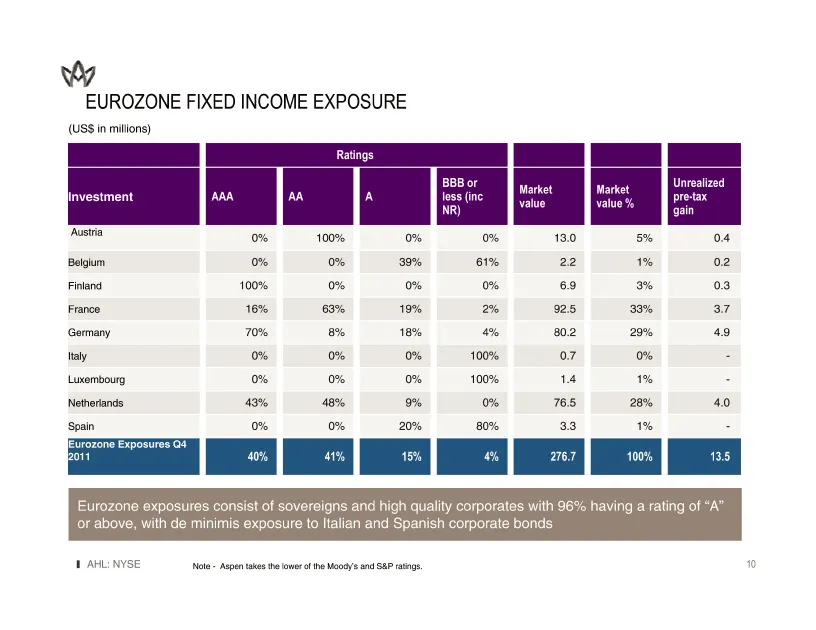
Slide 10: Eurozone Fixed Income Exposure
AHL: NYSE 11 Ratings Ratings Ratings Ratings Investment AAA AA A BBB or less (inc NR) Market value Market value % Unrealized pre-tax position Austria 0% 100% 0% 0% 13.0 5% 0.4 Belgium 0% 0% 39% 61% 2.2 1% 0.2 Finland 100% 0% 0% 0% 6.9 3% 0.3 France 16% 63% 19% 2% 92.5 33% 3.7 Germany 70% 8% 18% 4% 8
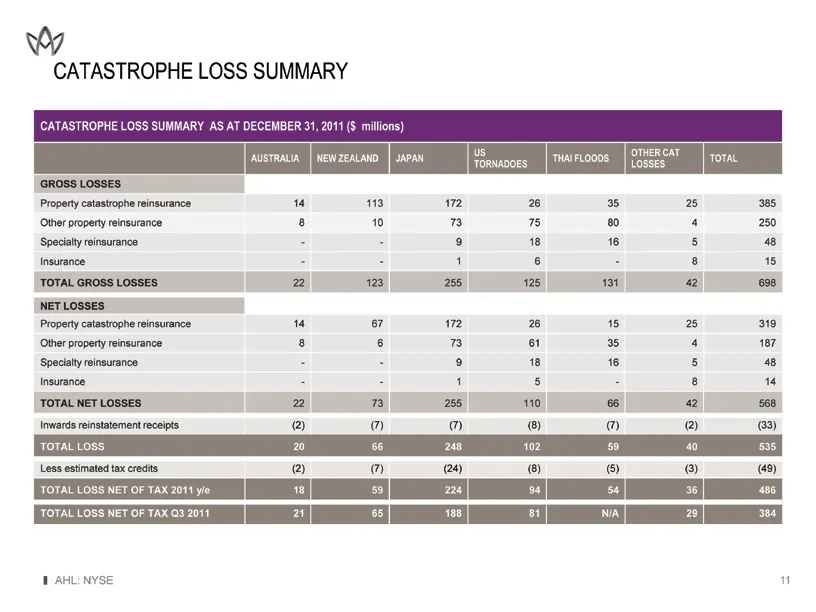
Slide 11: Catastrophe Loss Summary
AHL: NYSE 12 CATASTROPHE LOSS SUMMARY CATASTROPHE LOSS SUMMARY AS AT DECEMBER 31, 2011 ($ millions) CATASTROPHE LOSS SUMMARY AS AT DECEMBER 31, 2011 ($ millions) CATASTROPHE LOSS SUMMARY AS AT DECEMBER 31, 2011 ($ millions) CATASTROPHE LOSS SUMMARY AS AT DECEMBER 31, 2011 ($ millions) CATASTROPHE LO
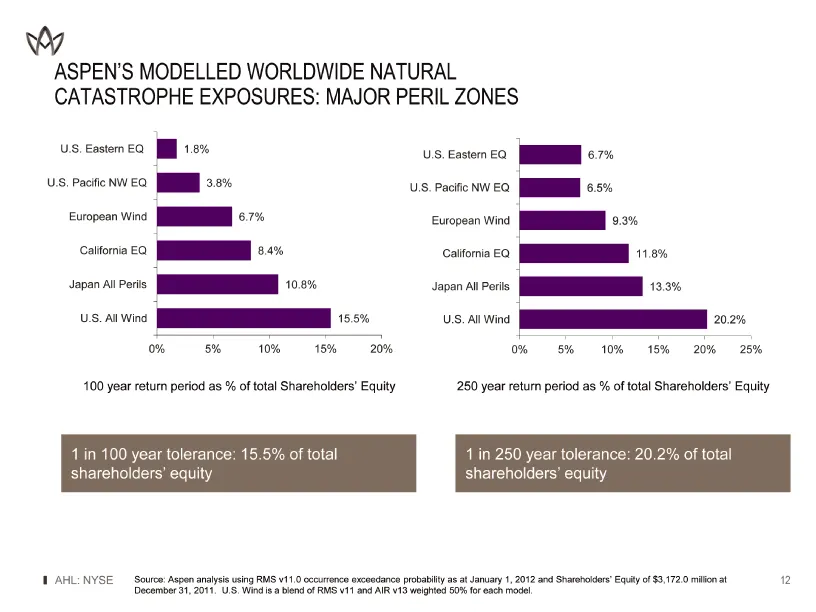
Slide 12: Modelled Worldwide Natural Catastrophe Exposures: Major Peril Zones
(CHART) AHL: NYSE ASPEN'S MODELLED WORLDWIDE NATURAL CATASTROPHE EXPOSURES: MAJOR PERIL ZONES 14 Source: Aspen analysis using RMS v11.0 occurrence exceedance probability as at January 1, 2012 and Shareholders' Equity of $3,172.0 million at December 31, 2011. U.S. Wind is a blend of RMS v11 and AIR v
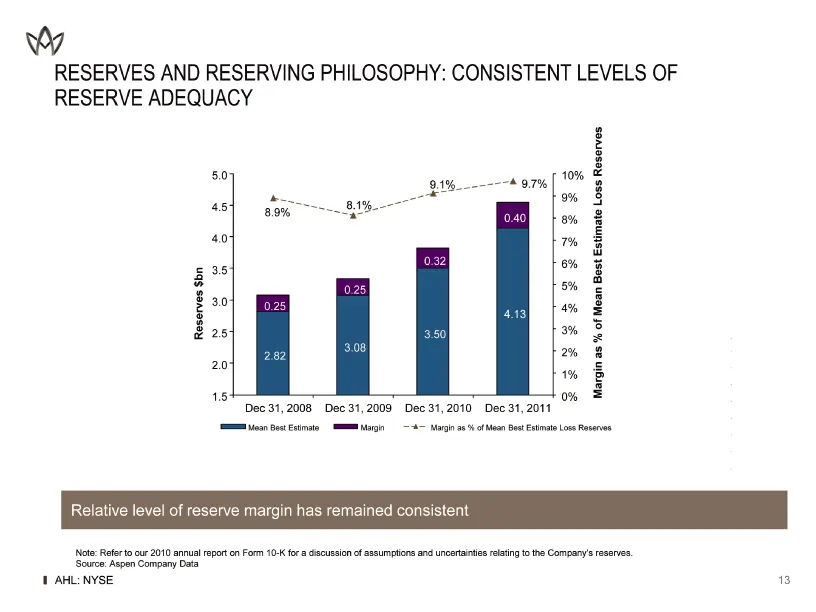
Slide 13: Reserves and Reserving Philosophy: Consistent Levels of Reserve Adequacy
RESERVES AND RESERVING PHILOSOPHY: CONSISTENT LEVELS OF RESERVE ADEQUACY 15 Note: Refer to our 2010 annual report on Form 10-K for a discussion of assumptions and uncertainties relating to the Company's reserves.Source: Aspen Company Data AHL: NYSE Relative level of reserve margin has remained consi
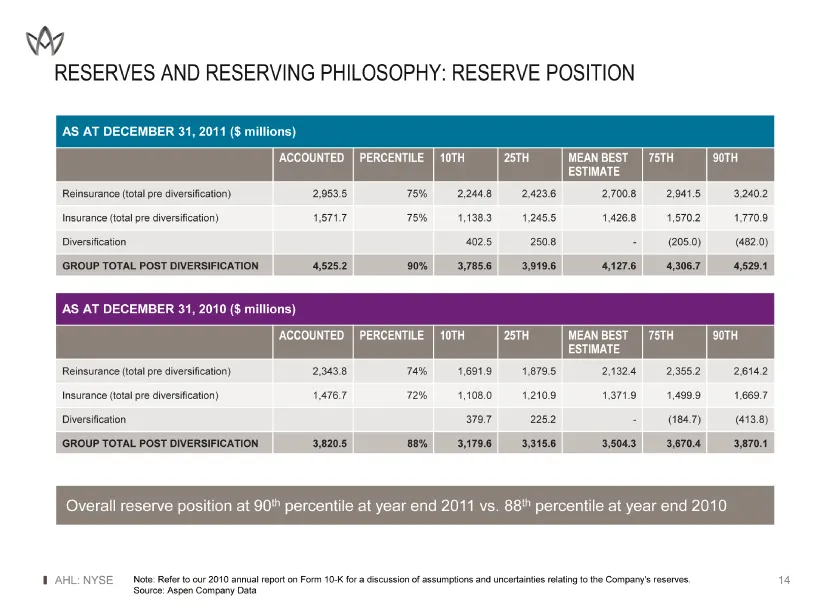
Slide 14: Reserves and Reserving Philosophy: Reserve Position
AHL: NYSE 16 RESERVES AND RESERVING PHILOSOPHY: RESERVE POSITION AS AT DECEMBER 31, 2011 ($ millions) AS AT DECEMBER 31, 2011 ($ millions) AS AT DECEMBER 31, 2011 ($ millions) AS AT DECEMBER 31, 2011 ($ millions) AS AT DECEMBER 31, 2011 ($ millions) AS AT DECEMBER 31, 2011 ($ millions) AS AT DECEMBE
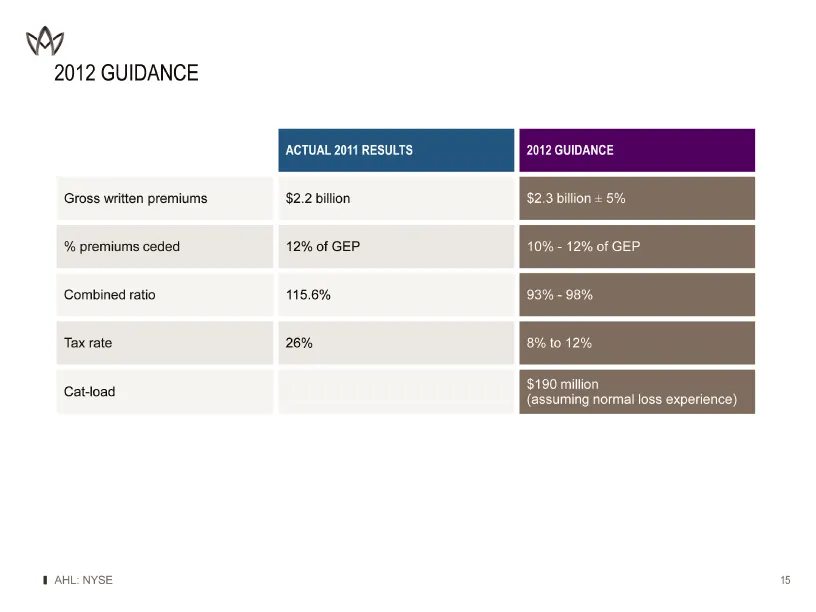
Slide 15: 2012 Guidance
AHL: NYSE 17 2012 GUIDANCE ACTUAL 2011 RESULTS 2012 GUIDANCE Gross written premiums $2.2 billion $2.3 billion +- 5% % premiums ceded 12% of GEP 10% - 12% of GEP Combined ratio 115.6% 93% - 98% Tax rate 26% 8% to 12% Cat-load $190 million (assuming normal loss experience)
Source: SEC EDGAR · 8-K filed Feb 6, 2012
More decks from Aspen Insurance Holdings Ltd
 Q1 2018 Earnings Presentation13 slides · May 2, 2018
 Q3 2017 Earnings Presentation20 slides · Nov 15, 2017
 Q2 2017 Earnings Presentation20 slides · Jul 26, 2017
 Q1 2017 Earnings Presentation20 slides · Apr 26, 2017
 Q4 2016 Earnings Presentation16 slides · Feb 14, 2017
 Q3 2016 Earnings Presentation16 slides · Oct 26, 2016