Lexinfintech Holdings Ltd. · NASDAQ:LX
Lexinfintech — Q3 2021 Earnings Presentation
18 slides from Lexinfintech's earnings presentation, 2021

Slide 1: Investor Presentation 3Q21 Results
Investor Presentation 3Q21 Results
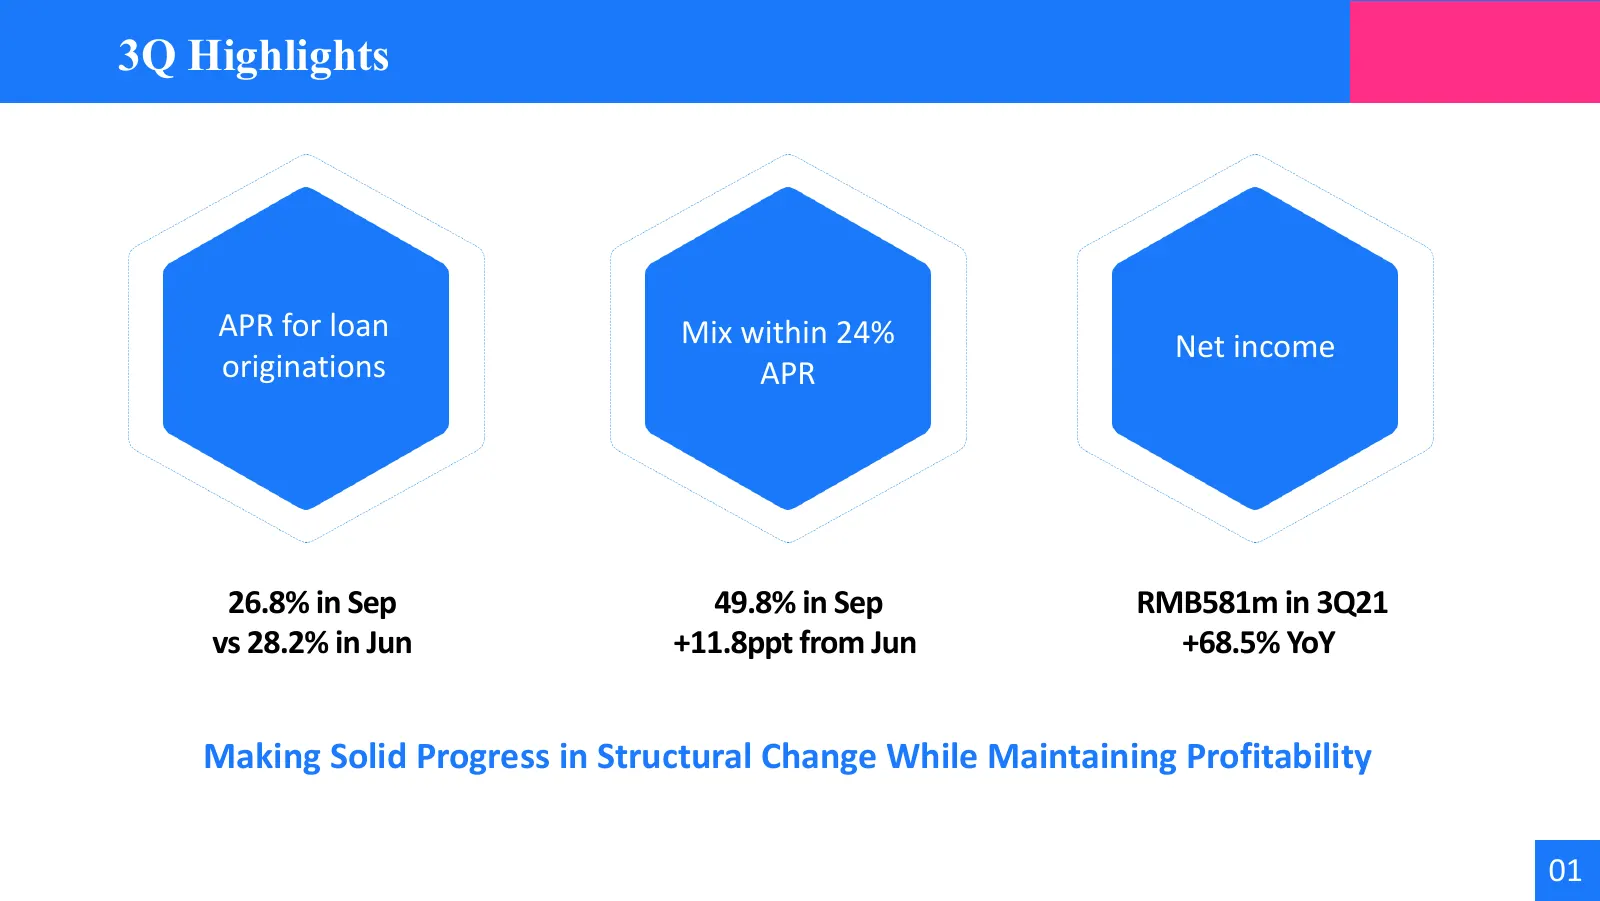
Slide 2: 3Q Highlights
3Q Highlights APR for loan Mix within 24% Net income originations APR 26.8% in Sep 49.8% in Sep RMB581m in 3Q21 vs 28.2% in Jun +11.8ppt from Jun +68.5% YoY Making Solid Progress in Structural Change While Maintaining Profitability 01
Slide 3: Operational Update
OQ] Operational Update
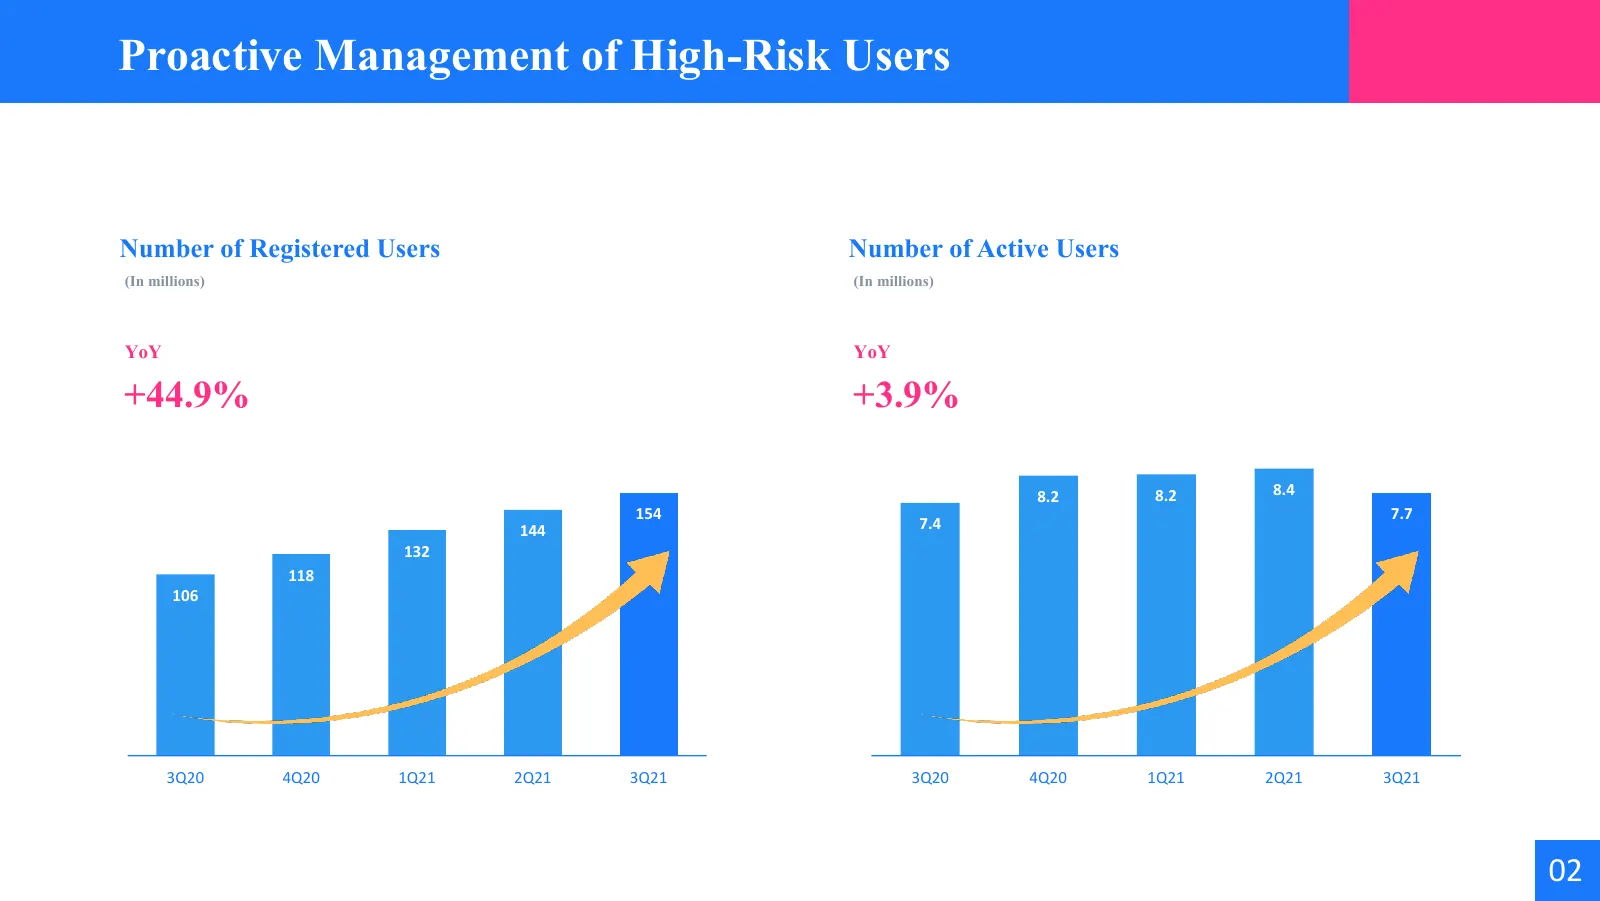
Slide 4: Proactive Management of High-Risk Users
Proactive Management of High-Risk Users Number of Registered Users Number of Active Users (In millions) (In millions) YoY YoY +44.9% +3.9% 8.2 8.2 8.4 154 7.7 144 7.4 132 118 106 3Q20 4Q20 1Q21 2Q21 3Q21 3Q20 4Q20 1Q21 2Q21 3Q21 02
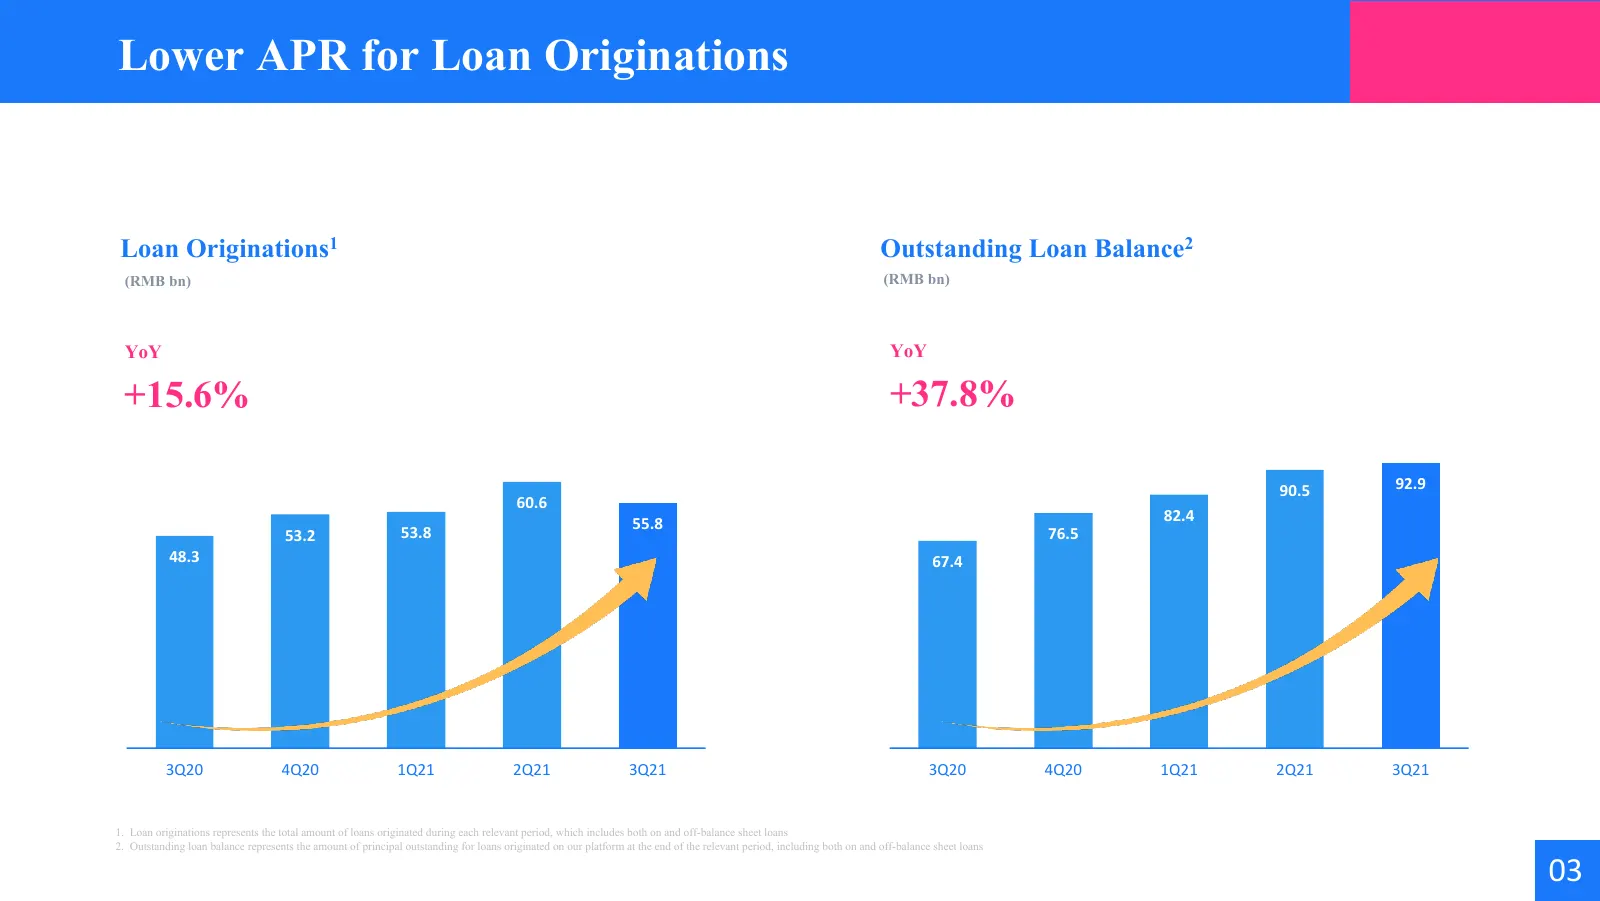
Slide 5: Lower APR for Loan Originations
Lower APR for Loan Originations Loan Originations1 Outstanding Loan Balance2 (RMB bn) (RMB bn) YoY YoY +15.6% +37.8% 90.5 92.9 60.6 55.8 82.4 53.2 53.8 76.5 48.3 67.4 3Q20 4Q20 1Q21 2Q21 3Q21 3Q20 4Q20 1Q21 2Q21 3Q21 1. Loan originations represents the total amount of loans originated during each re
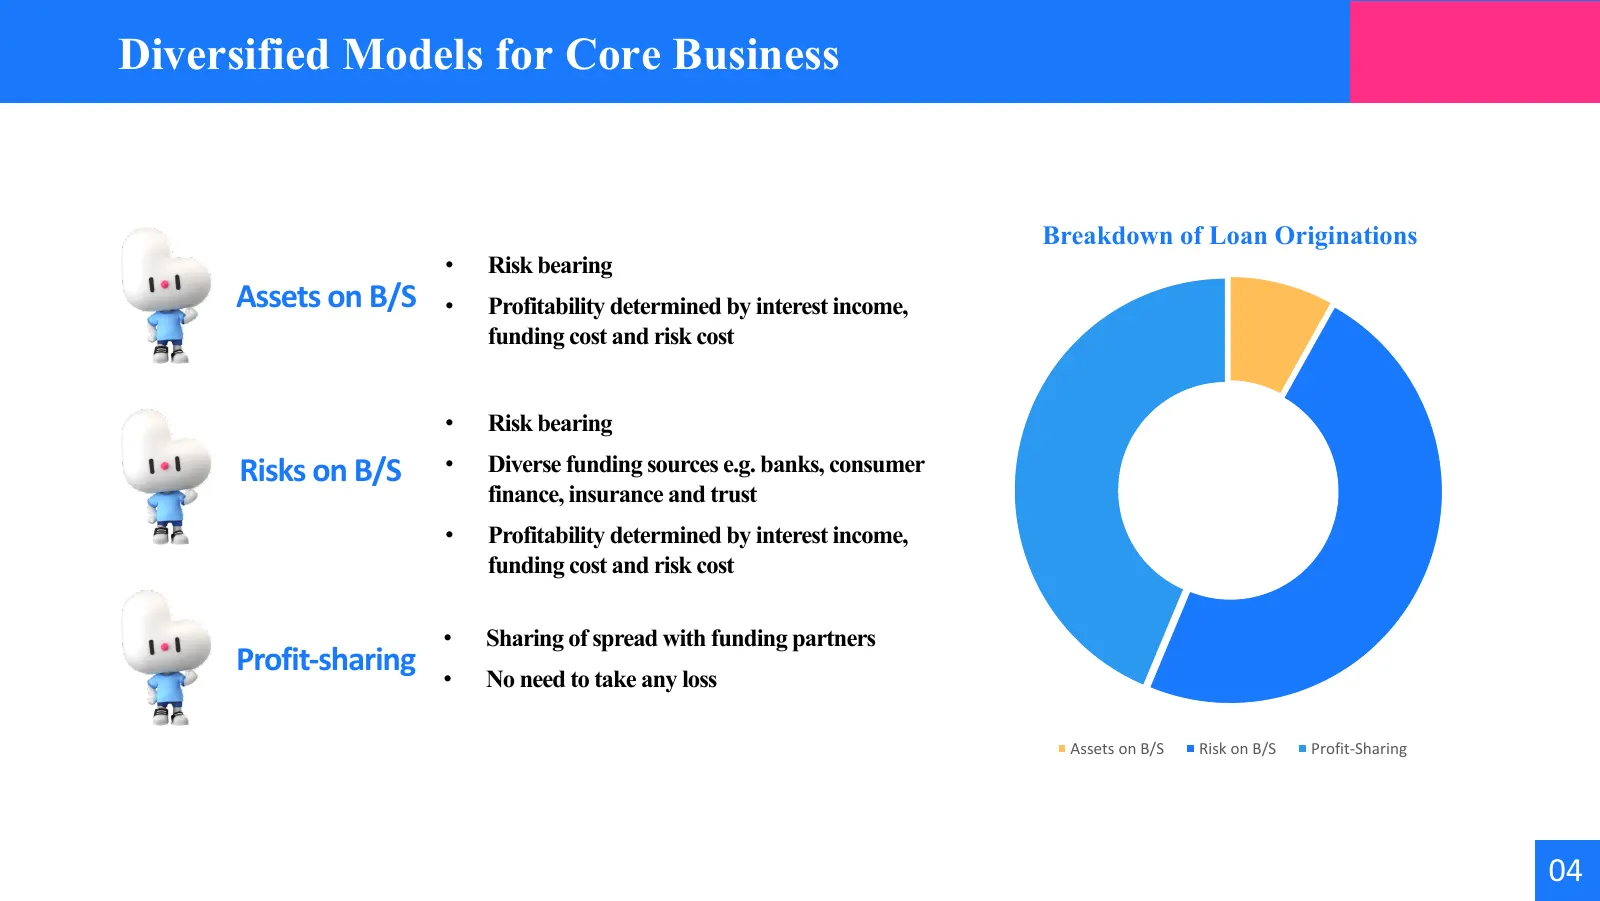
Slide 6: Diversified Models for Core Business
Diversified Models for Core Business Breakdown of Loan Originations • Risk bearing Assets on B/S • Profitability determined by interest income, funding cost and risk cost • Risk bearing Risks on B/S • Diverse funding sources e.g. banks, consumer finance, insurance and trust • Profitability determine
Slide 7: Financial Update
02 Financial Update
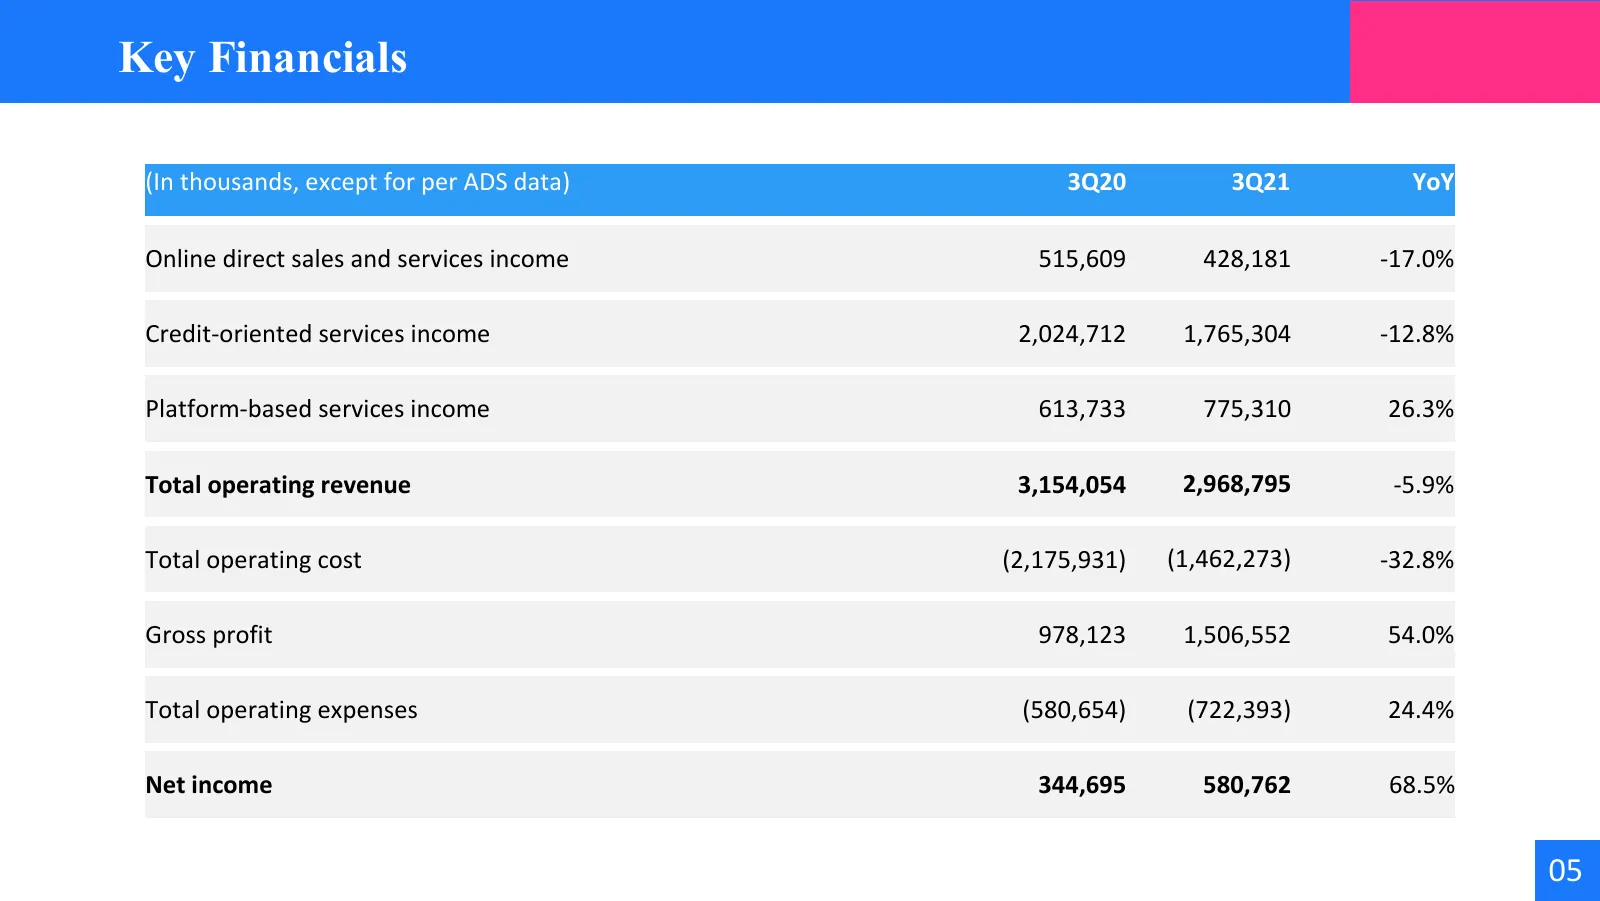
Slide 8: Key Financials
Key Financials (In thousands, except for per ADS data) 3Q20 3Q21 YoY Online direct sales and services income 515,609 428,181 -17.0% Credit-oriented services income 2,024,712 1,765,304 -12.8% Platform-based services income 613,733 775,310 26.3% Total operating revenue 3,154,054 2,968,795 -5.9% Total
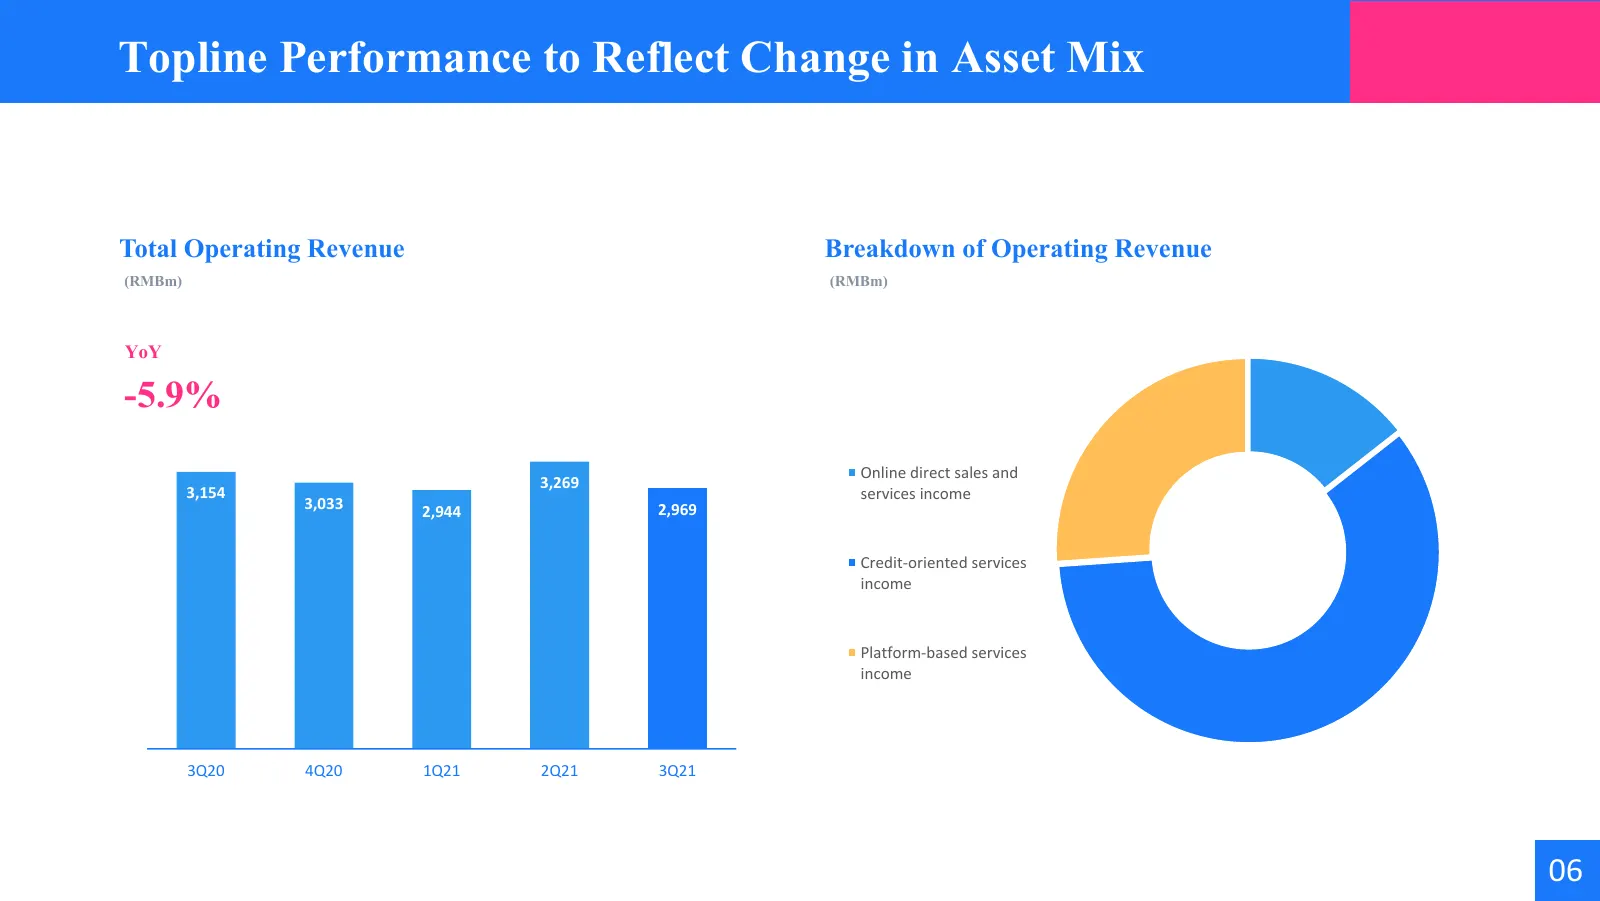
Slide 9: Topline Performance to Reflect Change in Asset Mix
Topline Performance to Reflect Change in Asset Mix Total Operating Revenue Breakdown of Operating Revenue (RMBm) (RMBm) YoY -5.9% Online direct sales and 3,269 3,154 services income 3,033 2,944 2,969 Credit-oriented services income Platform-based services income 3Q20 4Q20 1Q21 2Q21 3Q21 06
Slide 10: Quality of Business Maintained
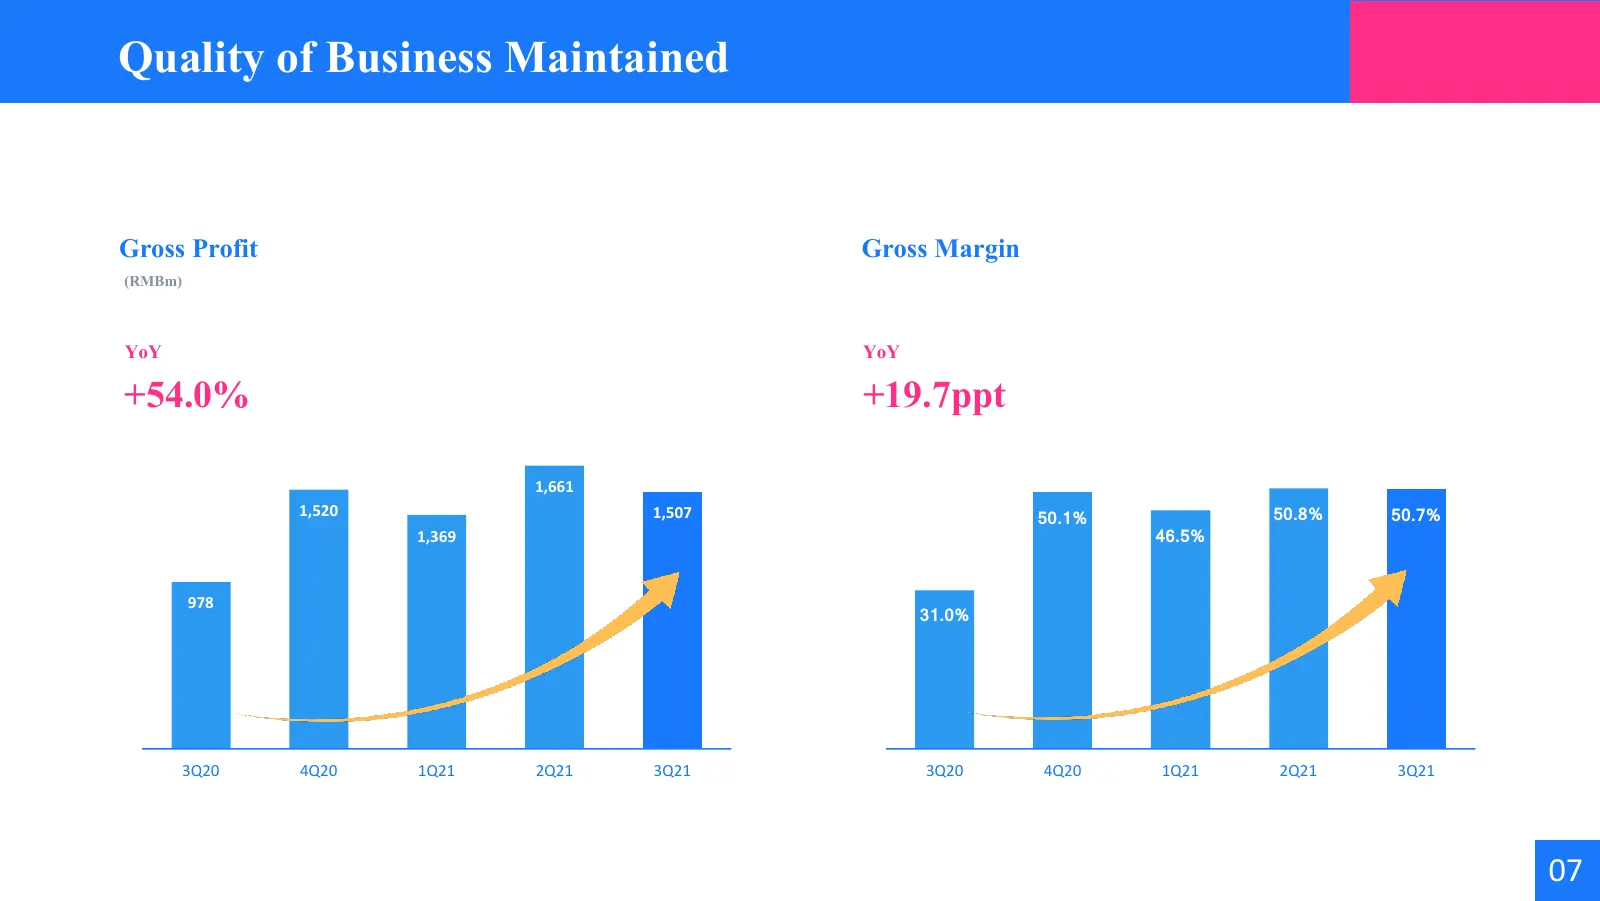
Quality of Business Maintained Gross Profit Gross Margin (RMBm) YoY YoY +54.0% +19.7ppt 1,661 1,520 1,507 50.1% 50.8% 50.7% 1,369 46.5% 978 31.0% 3Q20 4Q20 1Q21 2Q21 3Q21 3Q20 4Q20 1Q21 2Q21 3Q21 07
Slide 11: More Focus on Operational Efficiency
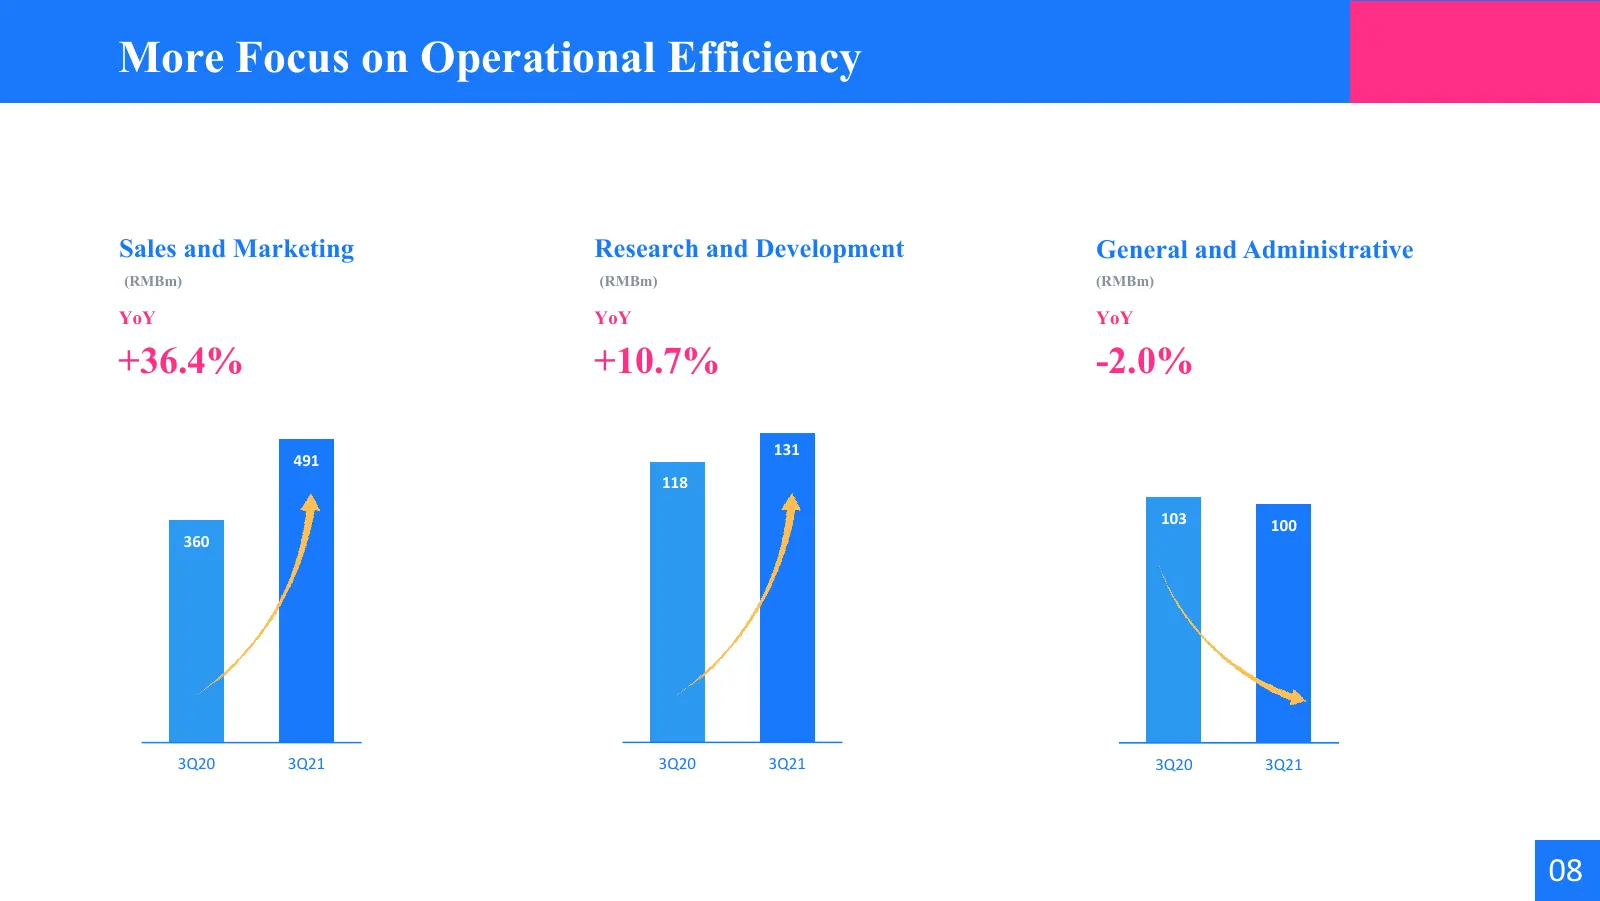
More Focus on Operational Efficiency Sales and Marketing Research and Development General and Administrative (RMBm) (RMBm) (RMBm) YoY YoY YoY +36.4% +10.7% -2.0% 131 491 118 103 100 360 3Q20 3Q21 3Q20 3Q21 3Q20 3Q21 08
Slide 12: Solid Profitability During Business Optimisation
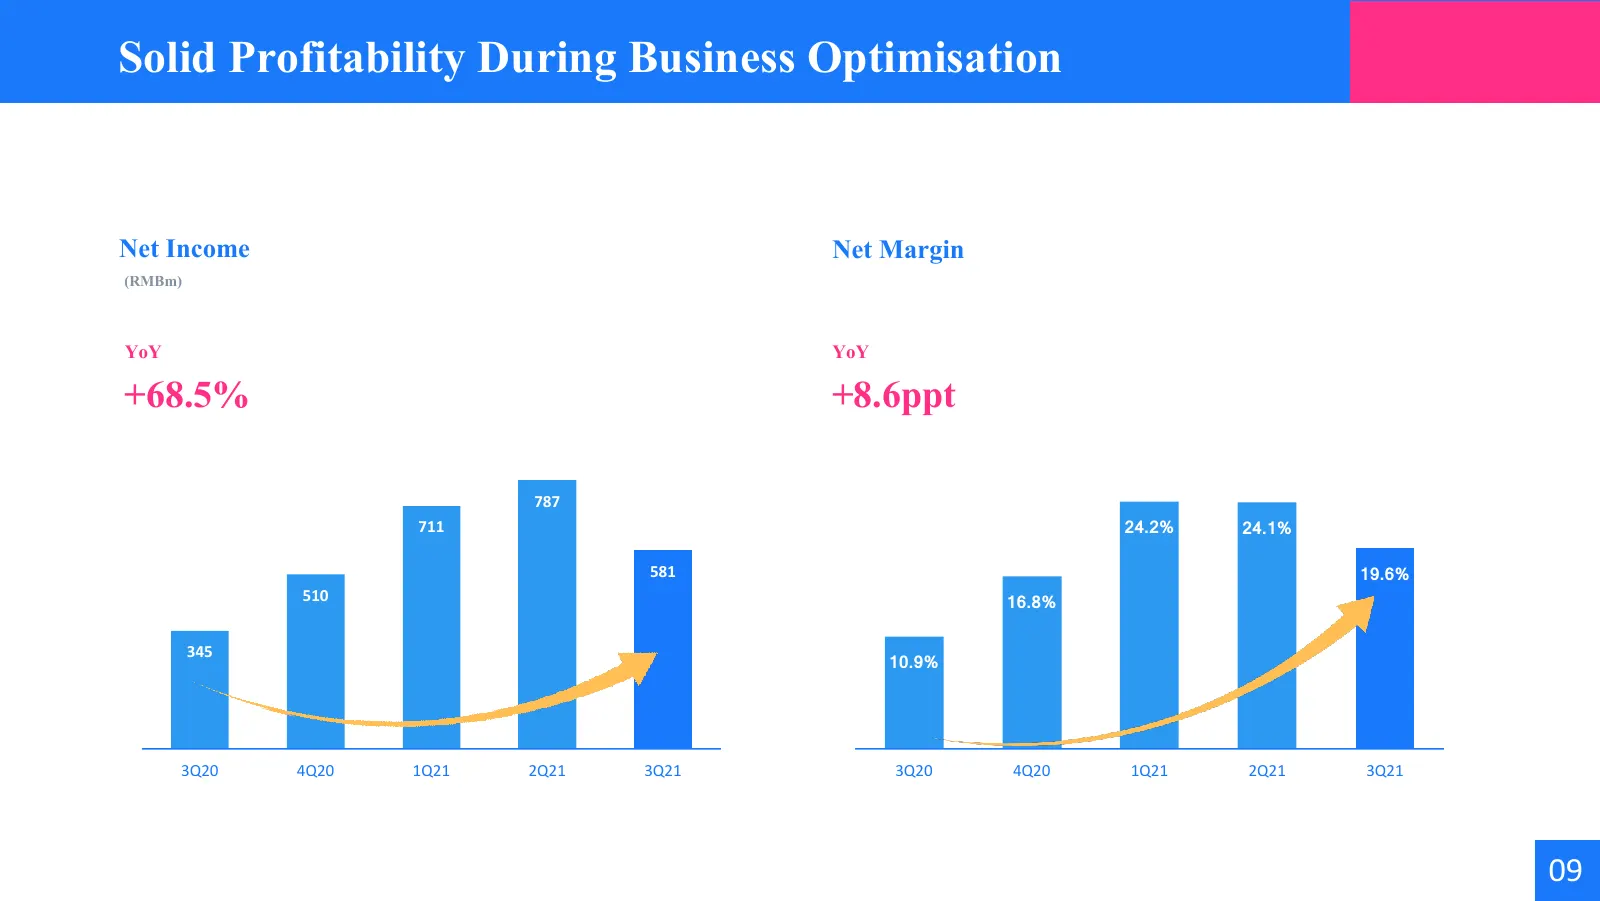
Solid Profitability During Business Optimisation Net Income Net Margin (RMBm) YoY YoY +68.5% +8.6ppt 787 711 24.2% 24.1% 581 19.6% 510 16.8% 345 10.9% 3Q20 4Q20 1Q21 2Q21 3Q21 3Q20 4Q20 1Q21 2Q21 3Q21 09
Slide 13: Asset Quality Trend Within Expectations
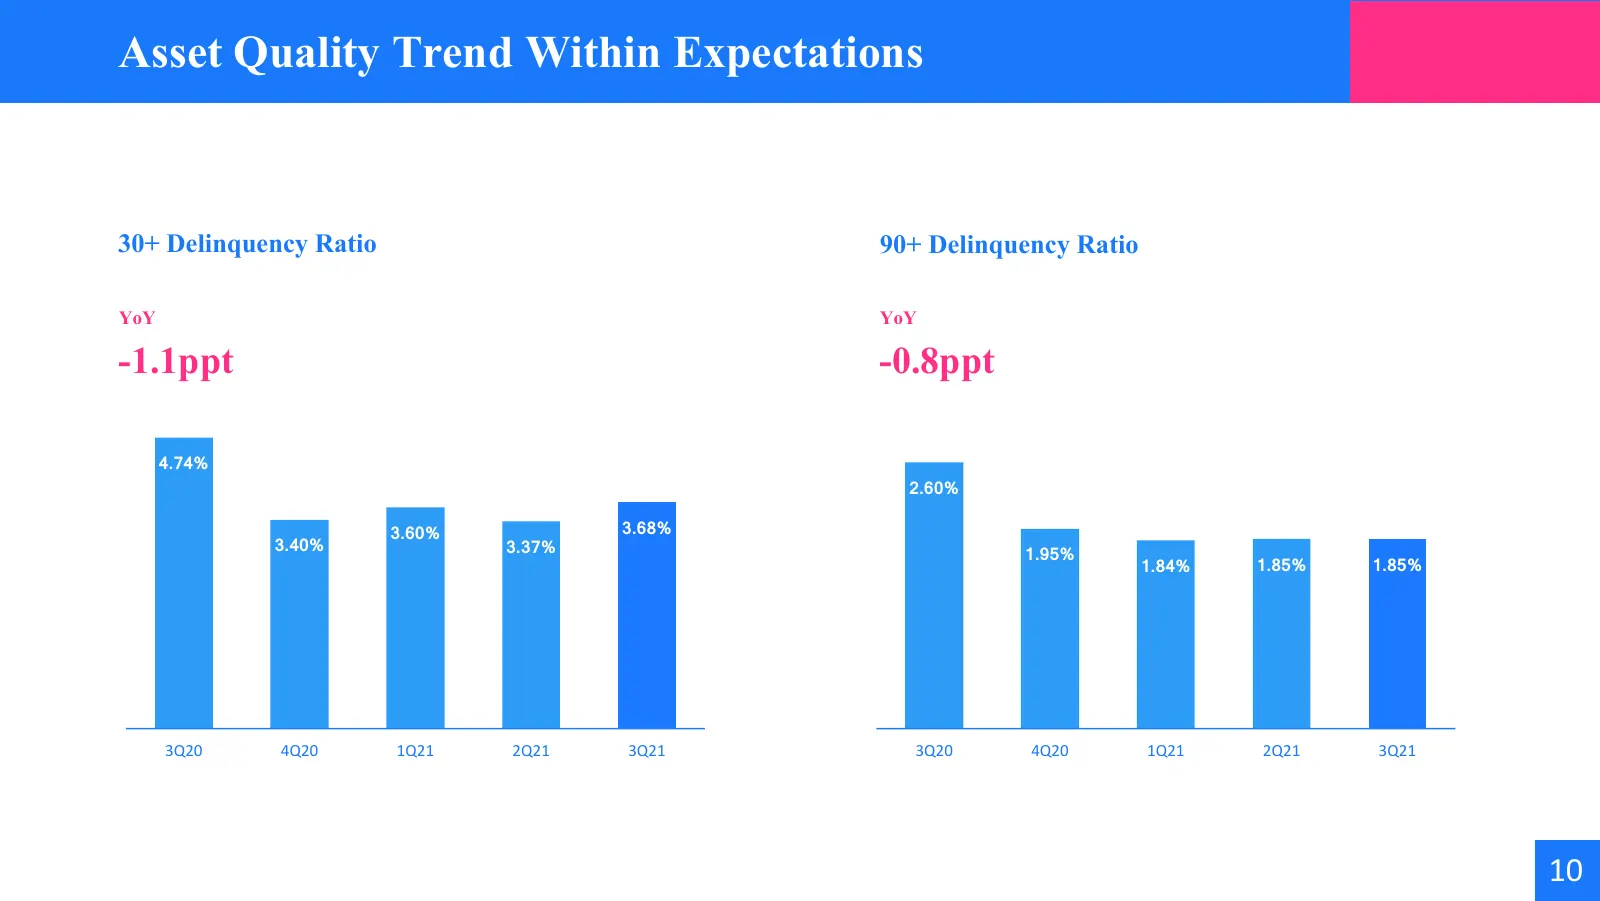
Asset Quality Trend Within Expectations 30+ Delinquency Ratio 90+ Delinquency Ratio YoY YoY -1.1ppt -0.8ppt 4.74% 2.60% 3.60% 3.68% 3.40% 3.37% 1.95% 1.84% 1.85% 1.85% 3Q20 4Q20 1Q21 2Q21 3Q21 3Q20 4Q20 1Q21 2Q21 3Q21 10
Slide 14: Appendix
03 Appendix
Slide 15: Balance Sheet (1)
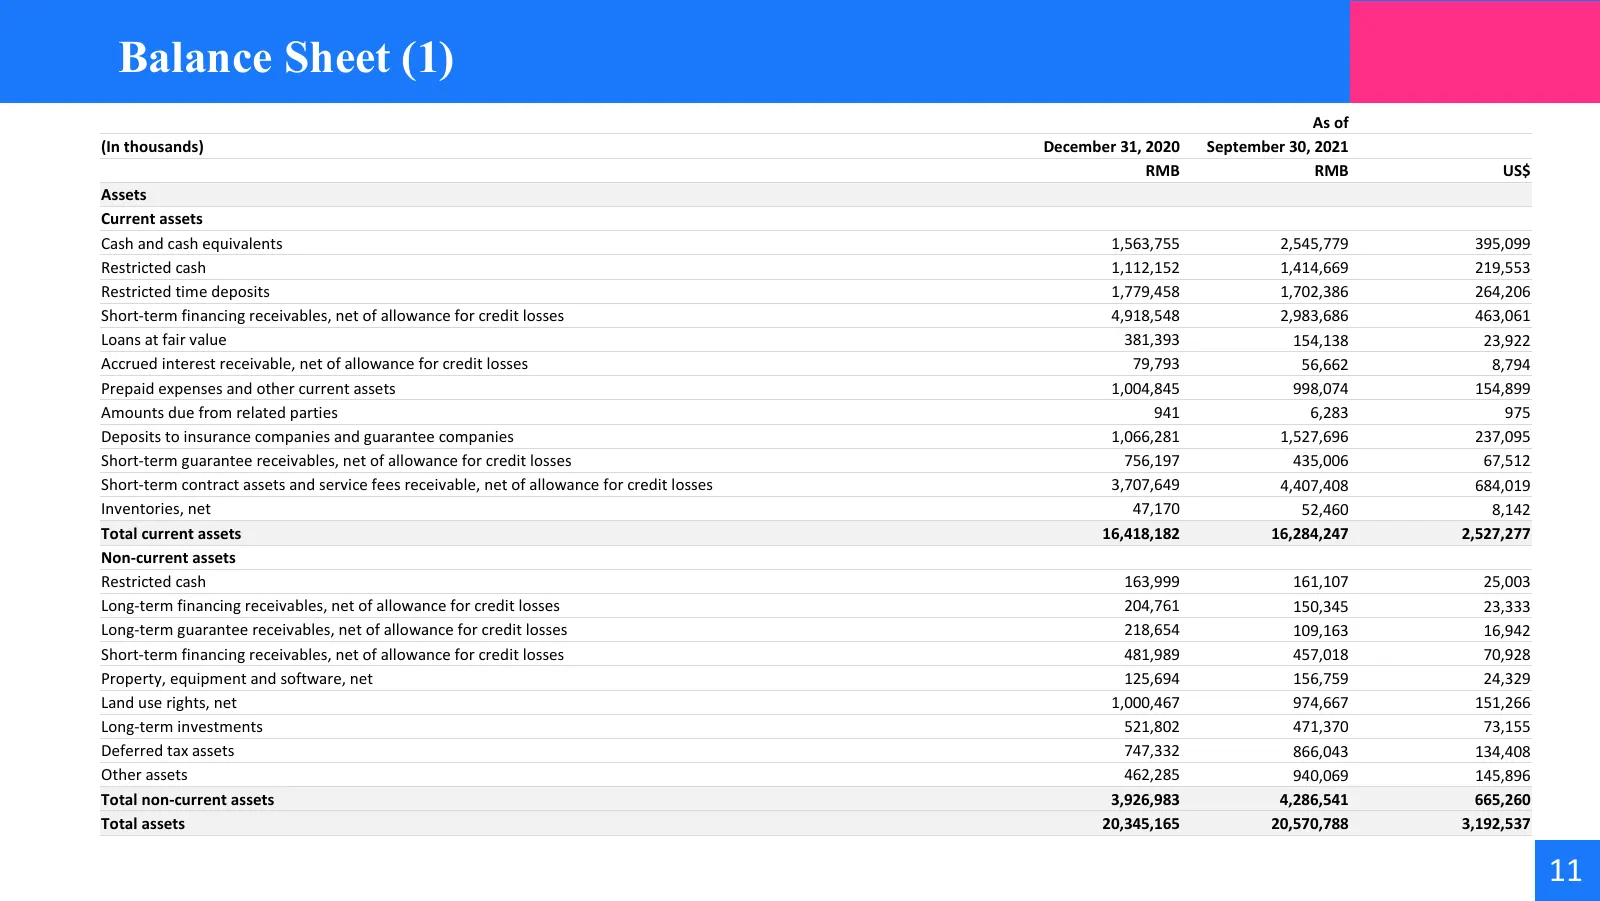
Balance Sheet (1) As of (In thousands) December 31, 2020 September 30, 2021 RMB RMB US$ Assets Current assets Cash and cash equivalents 1,563,755 2,545,779 395,099 Restricted cash 1,112,152 1,414,669 219,553 Restricted time deposits 1,779,458 1,702,386 264,206 Short-term financing receivables, net o
Slide 16: Balance Sheet (2)
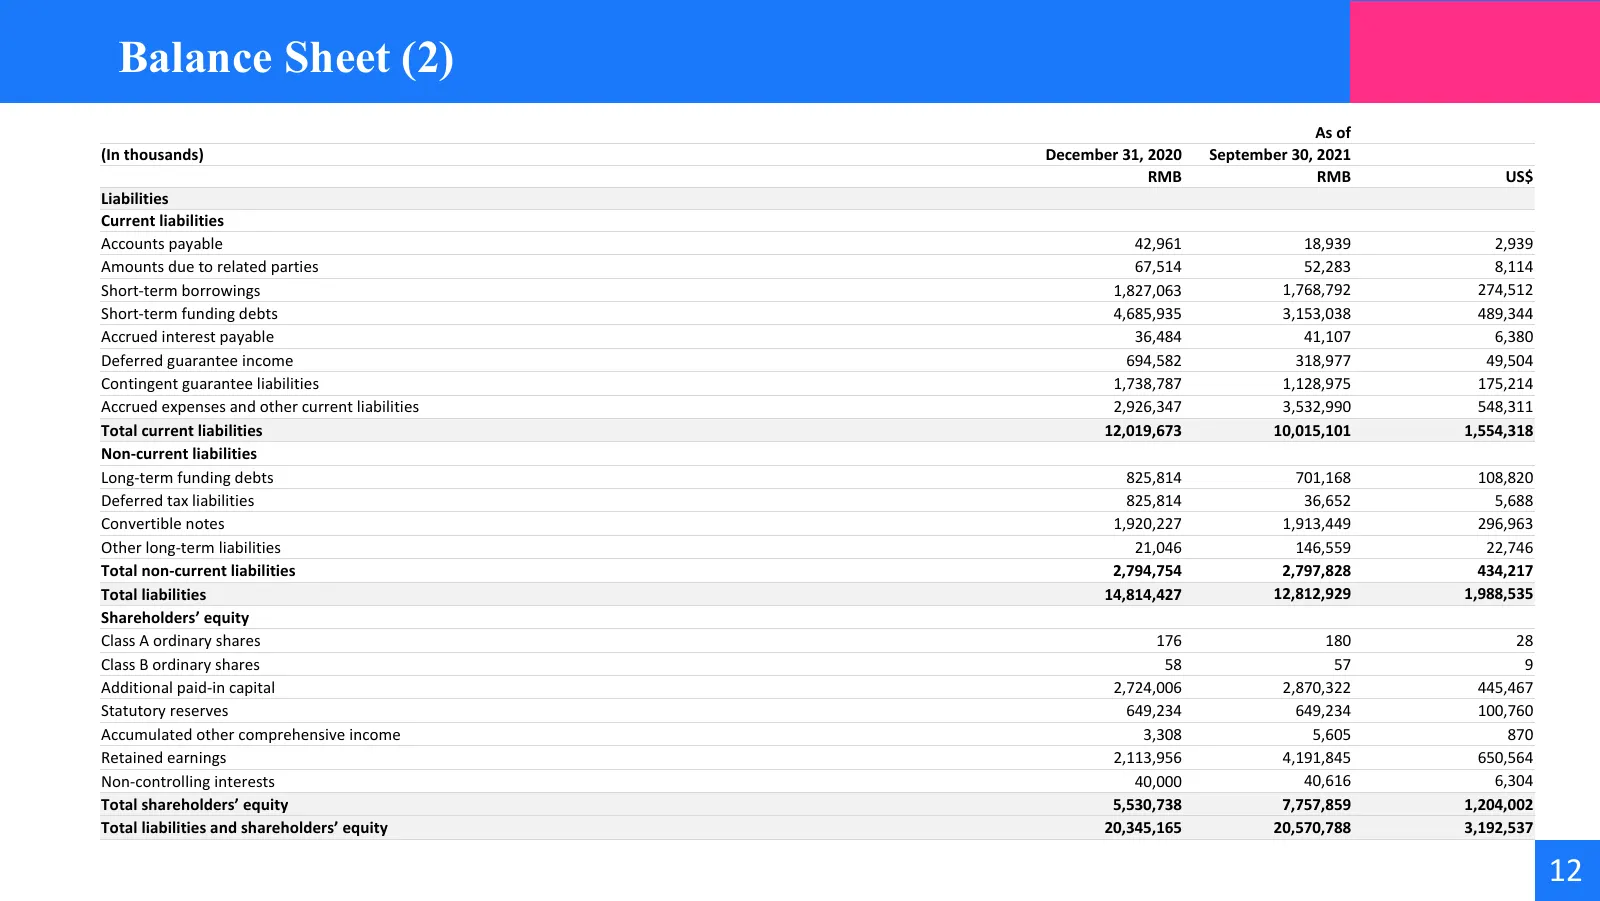
Balance Sheet (2) As of (In thousands) December 31, 2020 September 30, 2021 RMB RMB US$ Liabilities Current liabilities Accounts payable 42,961 18,939 2,939 Amounts due to related parties 67,514 52,283 8,114 Short-term borrowings 1,827,063 1,768,792 274,512 Short-term funding debts 4,685,935 3,153,0
Slide 17: P&L Statement (1)
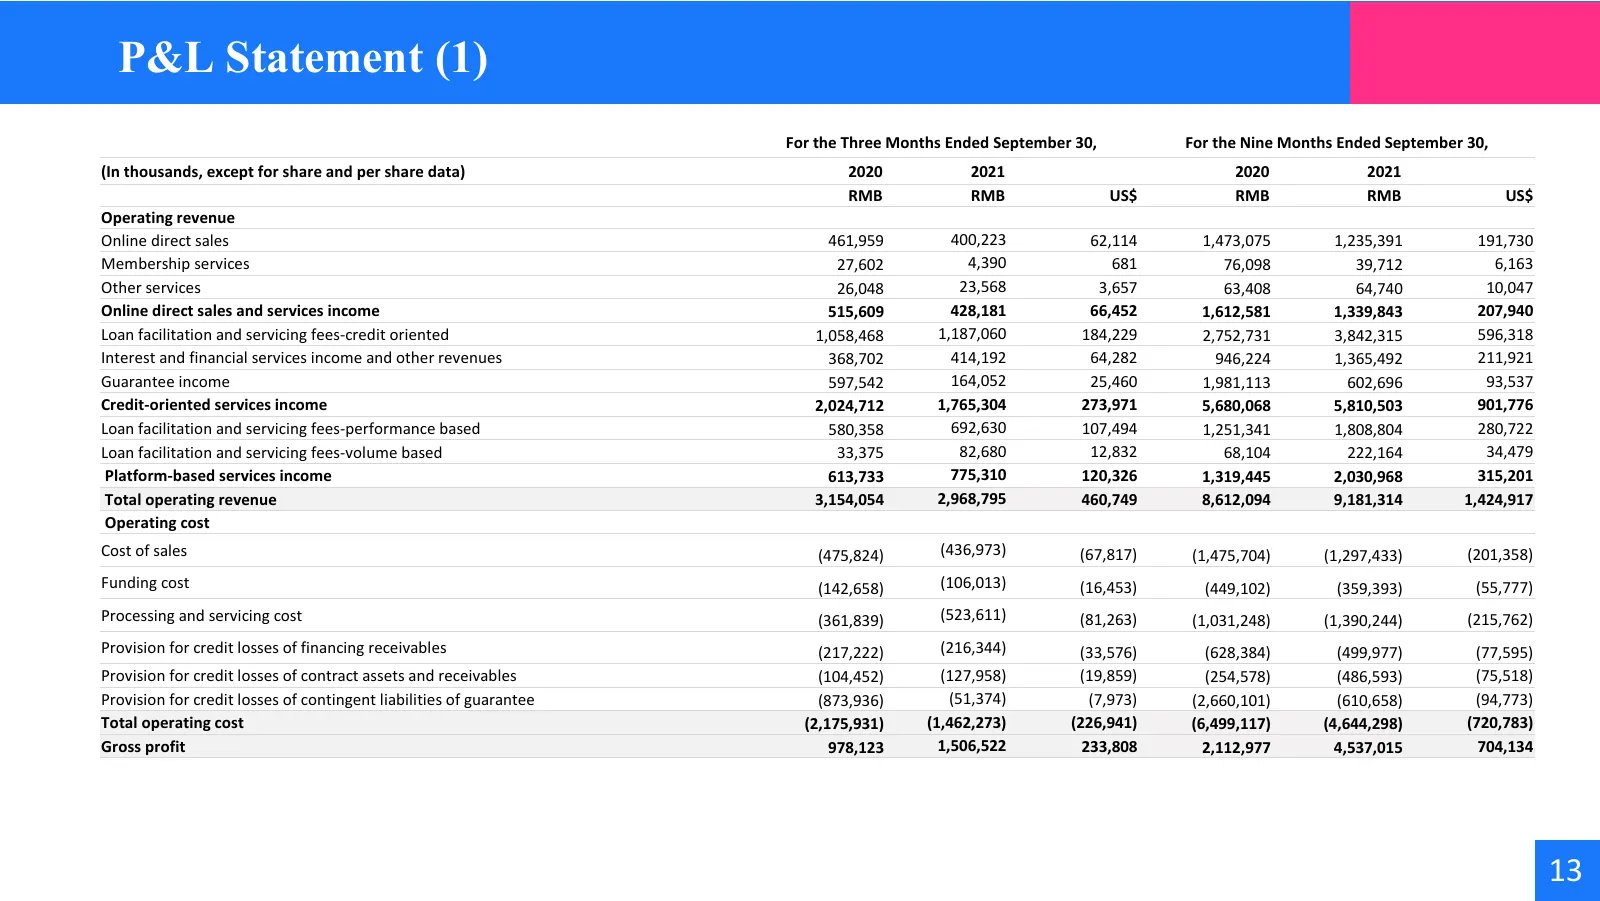
P&L Statement (1) For the Three Months Ended September 30, For the Nine Months Ended September 30, (In thousands, except for share and per share data) 2020 2021 2020 2021 RMB RMB US$ RMB RMB US$ Operating revenue Online direct sales 461,959 400,223 62,114 1,473,075 1,235,391 191,730 Membership servi
Slide 18: P&L Statement (2)
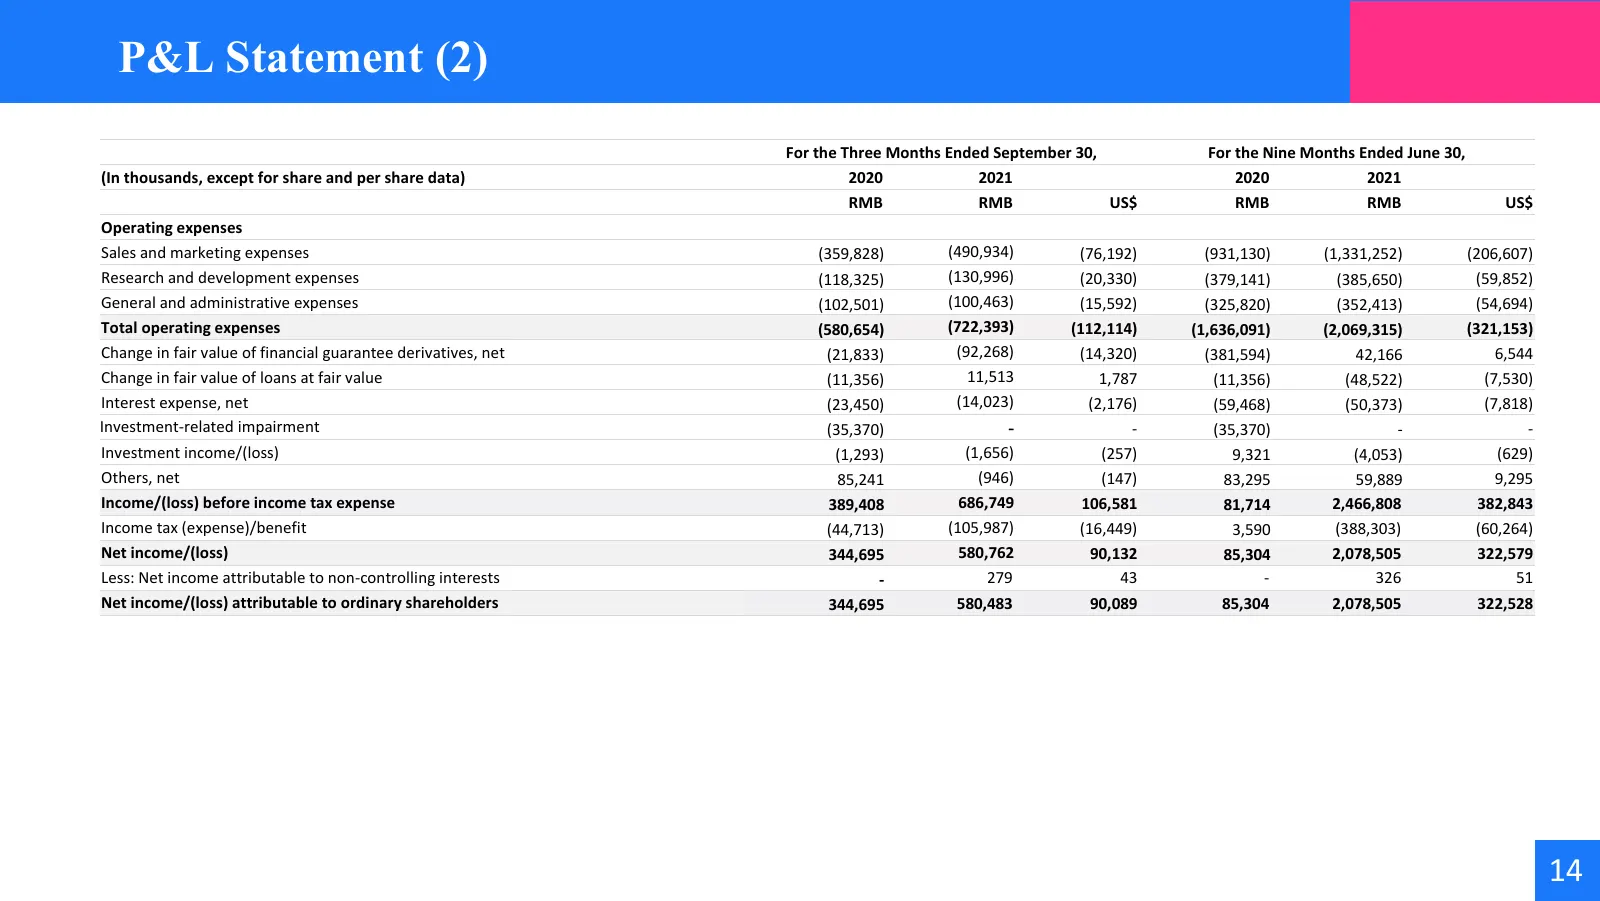
P&L Statement (2) For the Three Months Ended September 30, For the Nine Months Ended June 30, (In thousands, except for share and per share data) 2020 2021 2020 2021 RMB RMB US$ RMB RMB US$ Operating expenses Sales and marketing expenses (359,828) (490,934) (76,192) (931,130) (1,331,252) (206,607) R
Source: company website