Crescent Capital BDC, Inc. · NASDAQ:CCAP
Crescent Capital BDC — Q3 2026 Earnings Presentation
18 slides from Crescent Capital BDC's earnings presentation, Nov 10, 2026
Slide 1: Crescent Capital BDC, Inc. Quarterly Earnings Presentation
Crescent Capital BDC, Inc. Quarterly Earnings Presentation September 30, 2026
Slide 2: Disclaimer and Forward-Looking Statement
Disclaimer and Forward-Looking Statement This presentation (the “Presentation”) has been prepared by Crescent Capital BDC, This Presentation may contain forward-looking statements that involve substantial Inc. (together with its consolidated subsidiaries, “CCAP,” “Crescent BDC” or the risks and unce
Slide 3: Crescent Capital BDC, Inc. (CCAP)
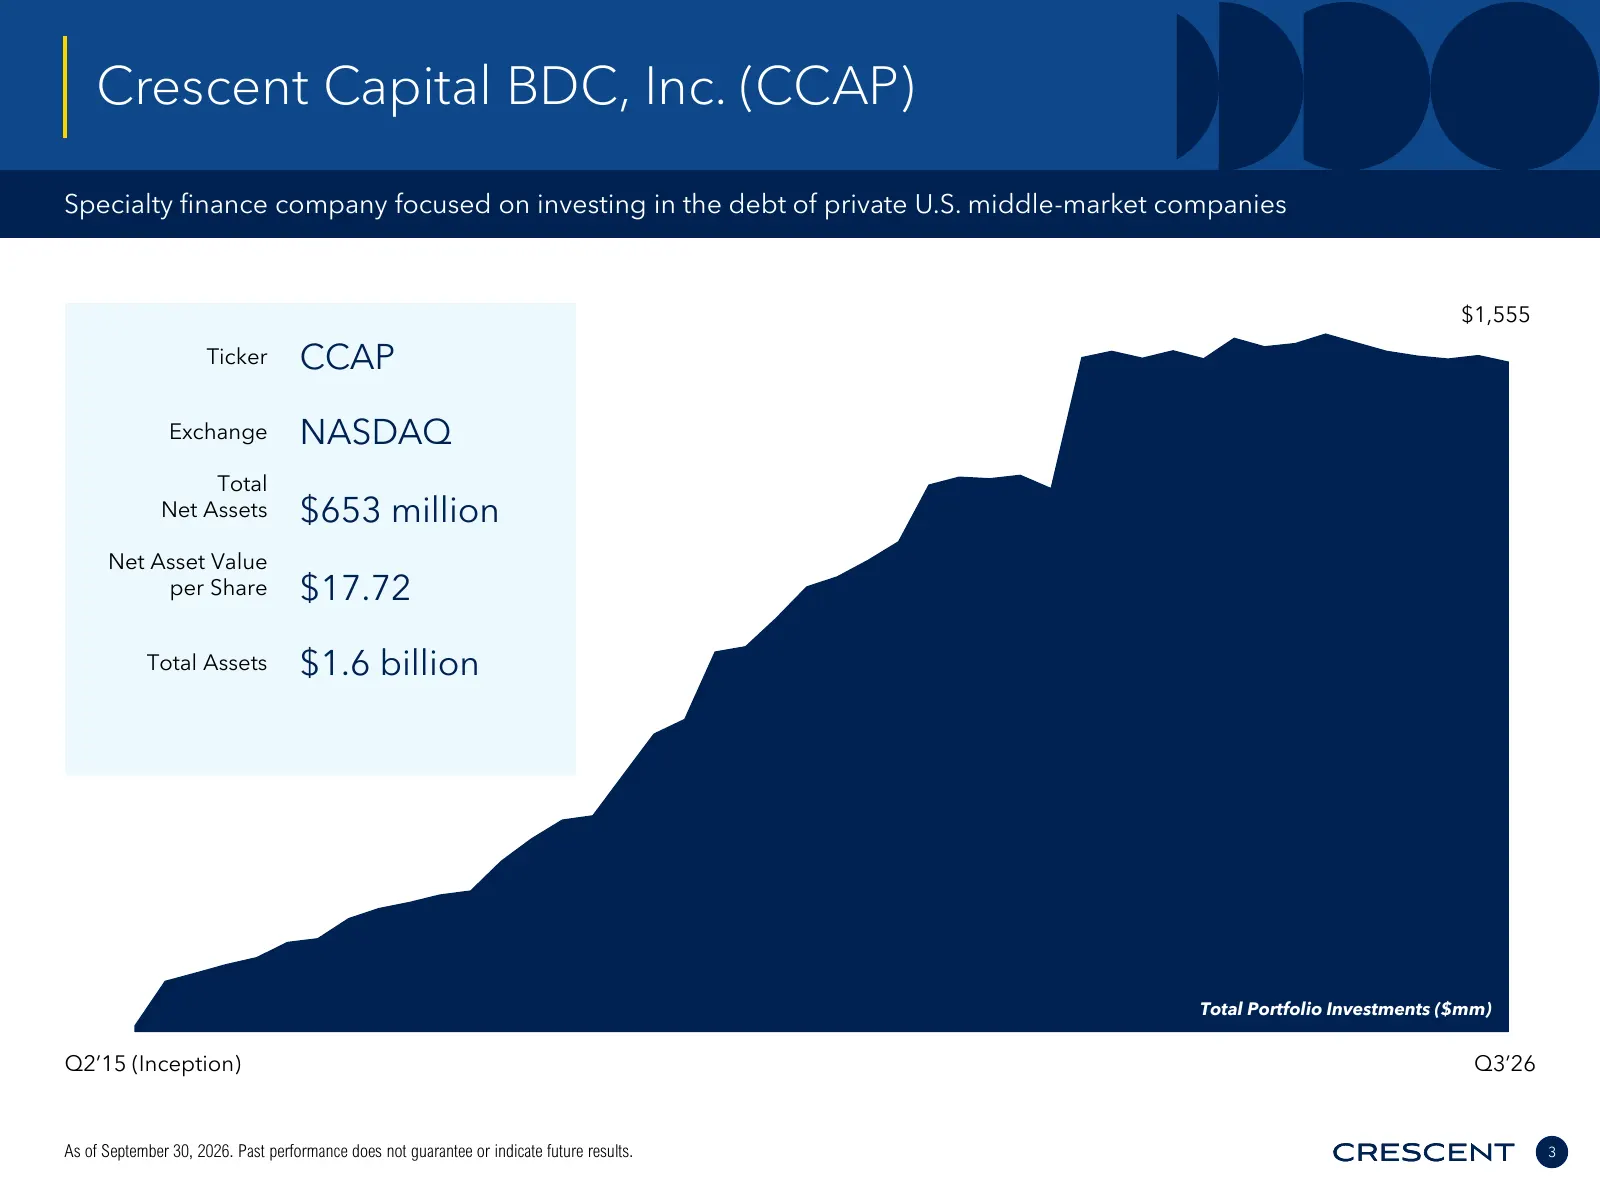
Crescent Capital BDC, Inc. (CCAP) Specialty finance company focused on investing in the debt of private U.S. middle-market companies $1,555 Ticker CCAP Exchange NASDAQ Total Net Assets $653 million Net Asset Value per Share $17.72 Total Assets $1.6 billion Total Portfolio Investments ($mm) Q2’15 (In
Slide 4: Summary of Financial Results
Current or prospective client name Summary of Financial Results 4
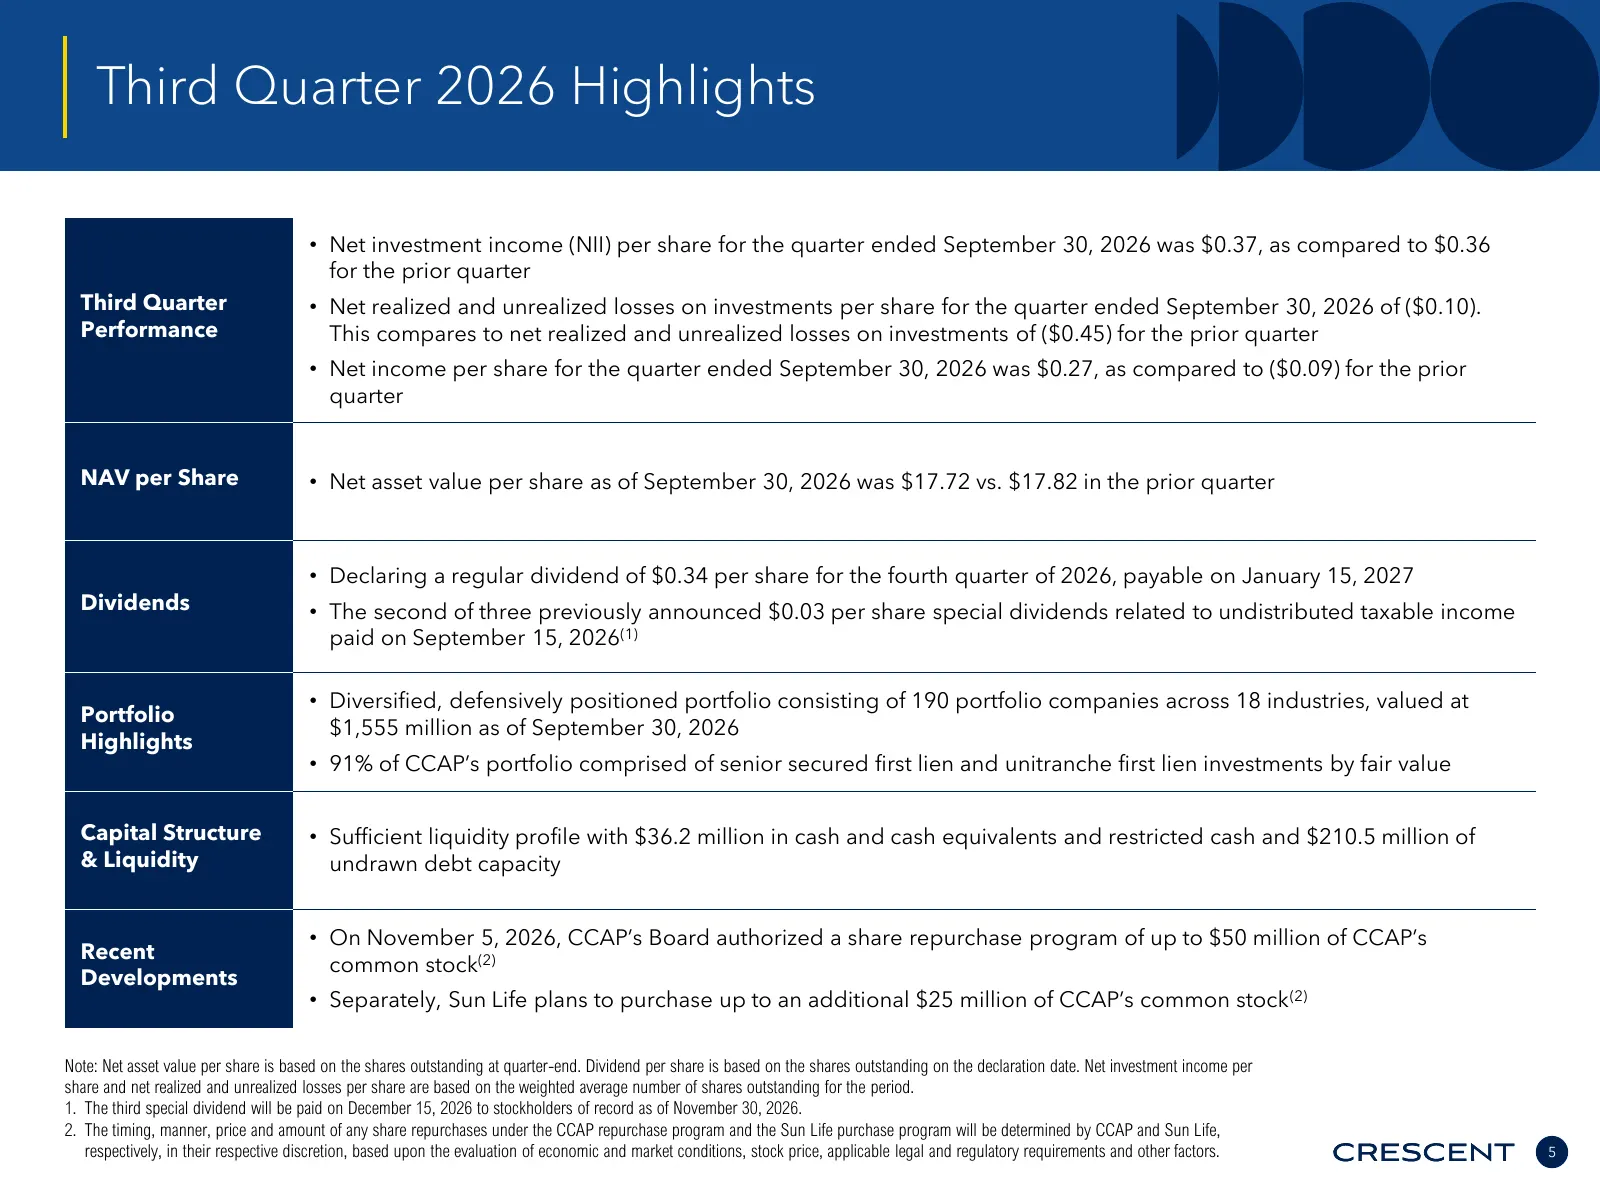
Slide 5: Third Quarter 2026 Highlights
Third Quarter 2026 Highlights • Net investment income (NII) per share for the quarter ended September 30, 2026 was $0.37, as compared to $0.36 for the prior quarter Third Quarter • Net realized and unrealized losses on investments per share for the quarter ended September 30, 2026 of ($0.10). Perfor
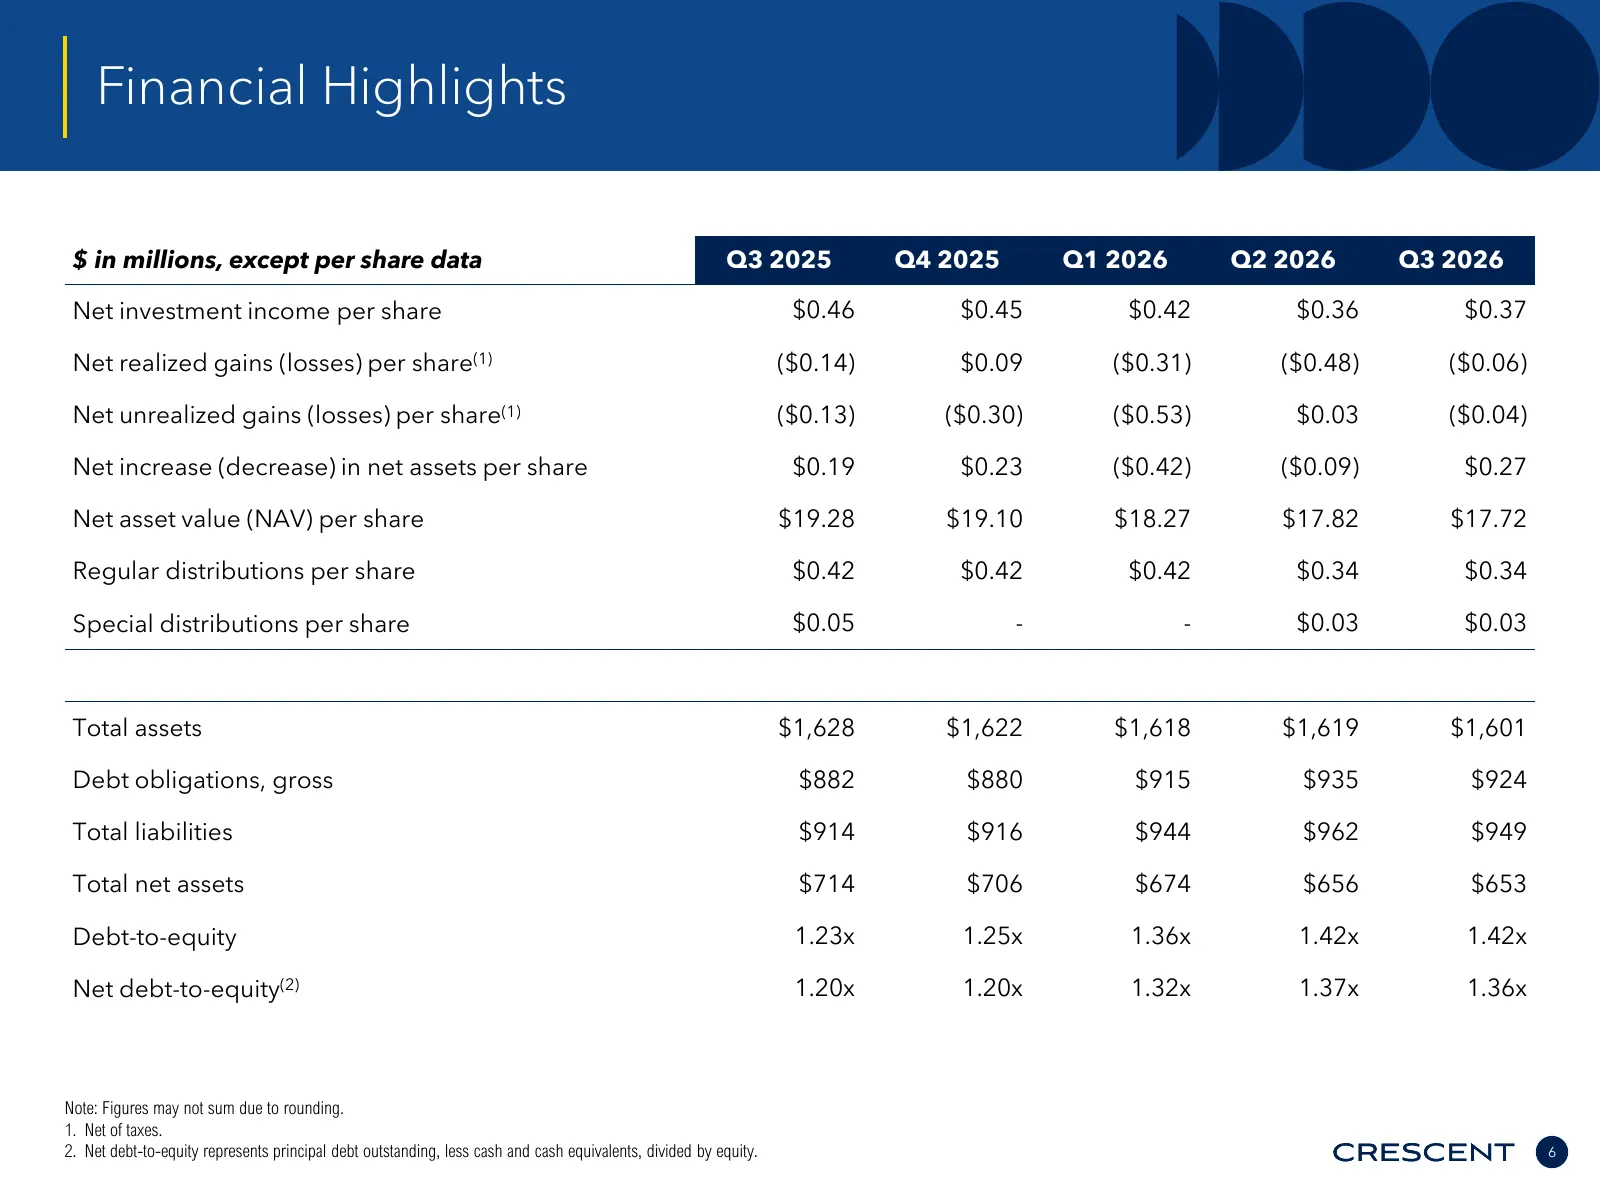
Slide 6: Financial Highlights
Financial Highlights $ in millions, except per share data Q3 2025 Q4 2025 Q1 2026 Q2 2026 Q3 2026 Net investment income per share $0.46 $0.45 $0.42 $0.36 $0.37 Net realized gains (losses) per share(1) ($0.14) $0.09 ($0.31) ($0.48) ($0.06) Net unrealized gains (losses) per share(1) ($0.13) ($0.30) ($
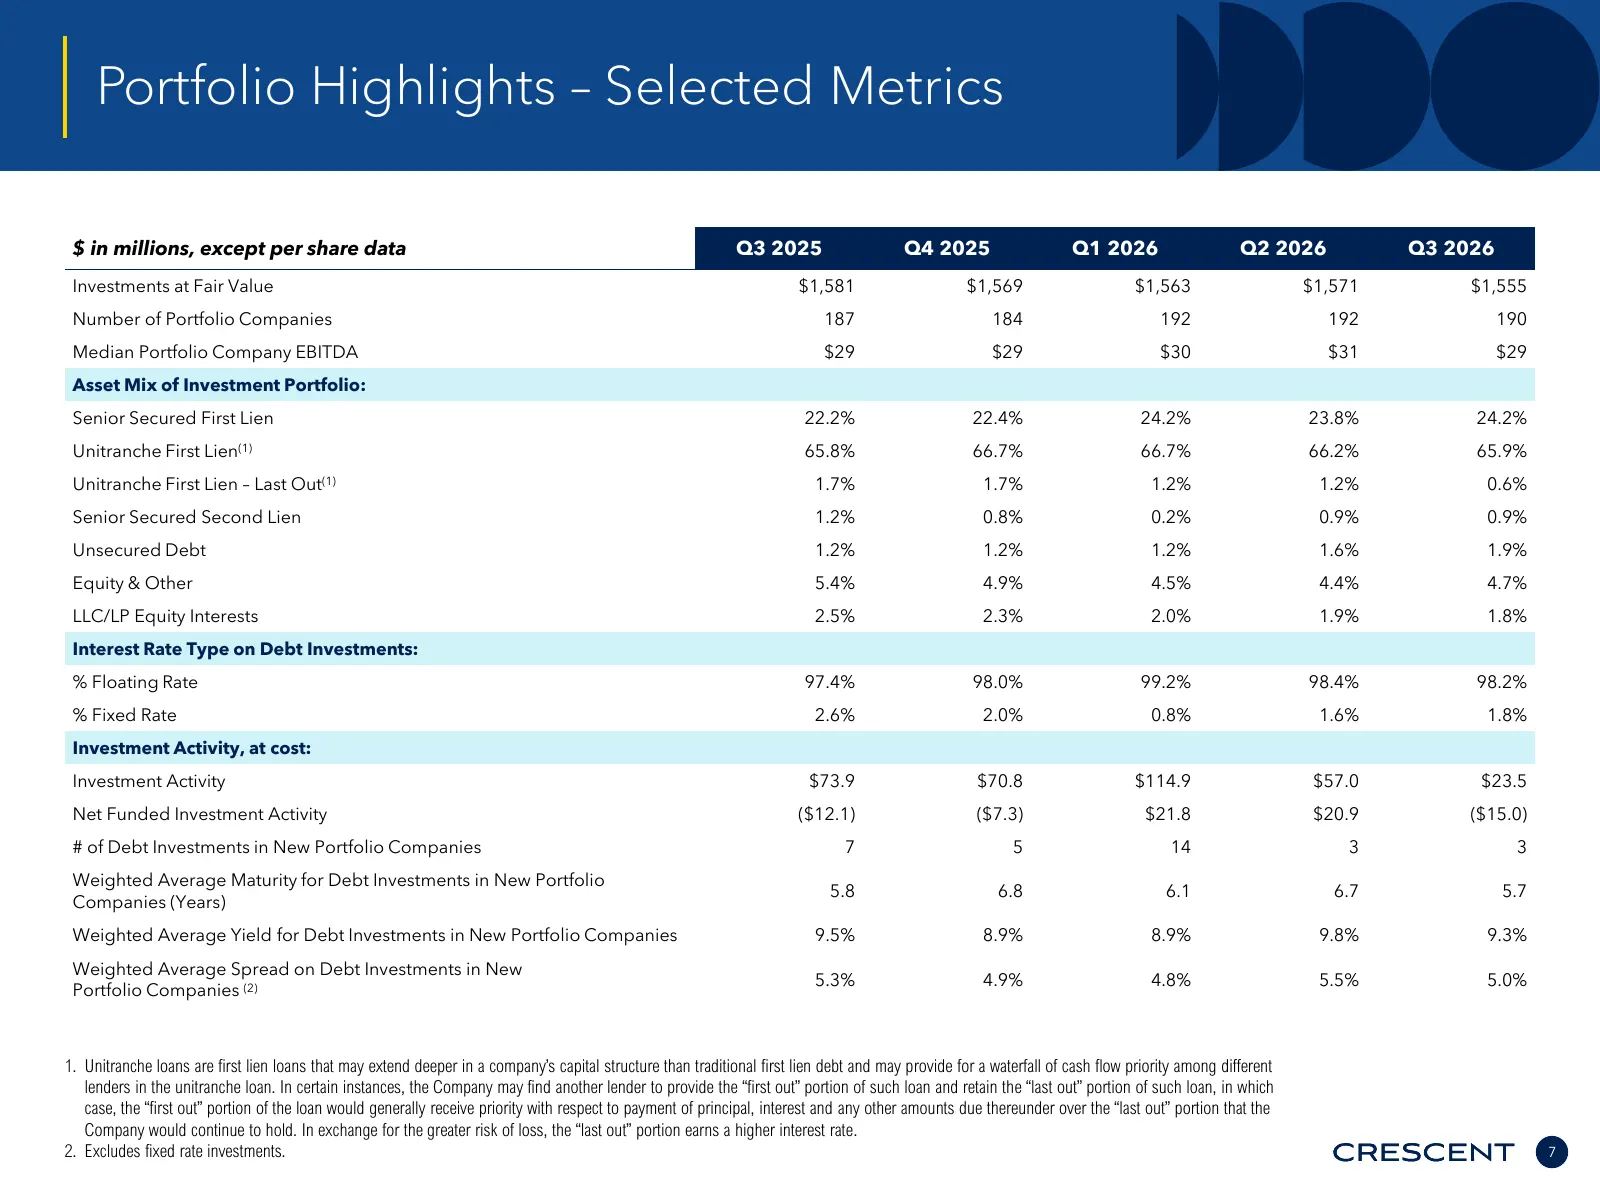
Slide 7: Portfolio Highlights – Selected Metrics
Portfolio Highlights – Selected Metrics $ in millions, except per share data Q3 2025 Q4 2025 Q1 2026 Q2 2026 Q3 2026 Investments at Fair Value $1,581 $1,569 $1,563 $1,571 $1,555 Number of Portfolio Companies 187 184 192 192 190 Median Portfolio Company EBITDA $29 $29 $30 $31 $29 Asset Mix of Investm
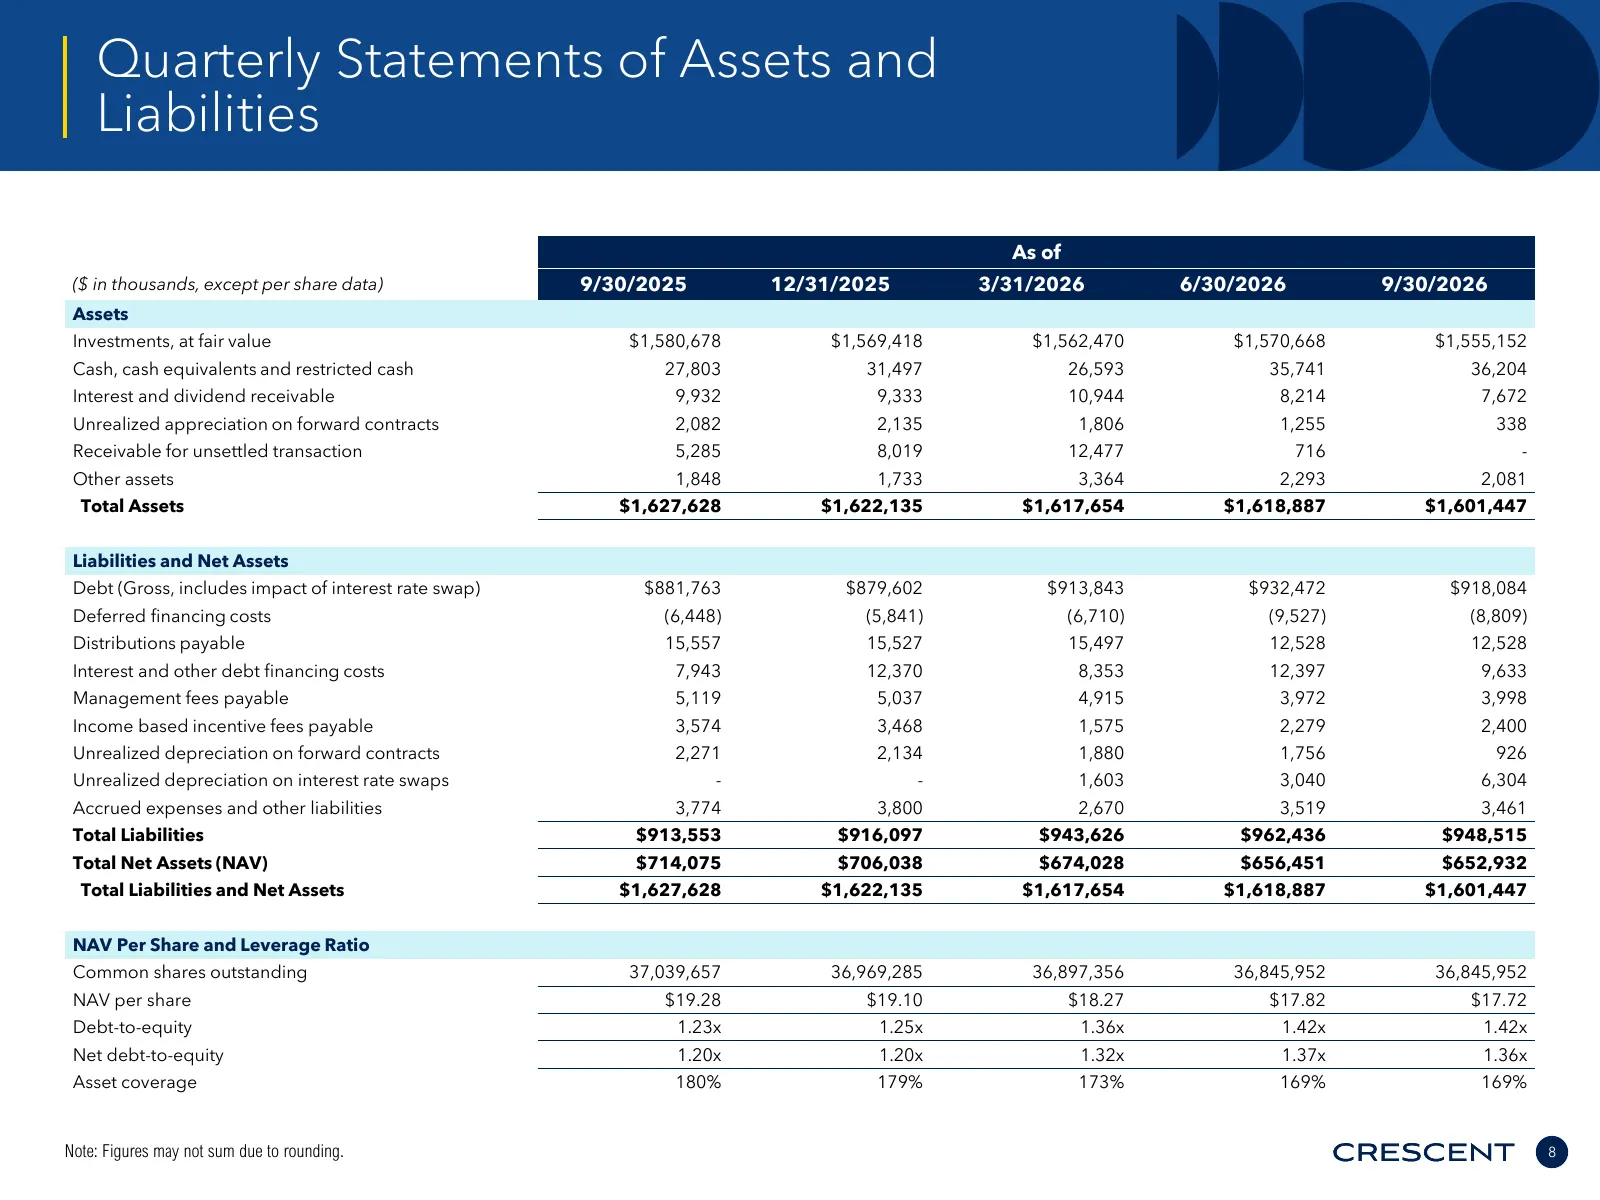
Slide 8: Quarterly Statements of Assets and Liabilities
Quarterly Statements of Assets and Liabilities As of ($ in thousands, except per share data) 9/30/2025 12/31/2025 3/31/2026 6/30/2026 9/30/2026 Assets Investments, at fair value $1,580,678 $1,569,418 $1,562,470 $1,570,668 $1,555,152 Cash, cash equivalents and restricted cash 27,803 31,497 26,593 35,
Slide 9: Net Asset Value per Share Bridge
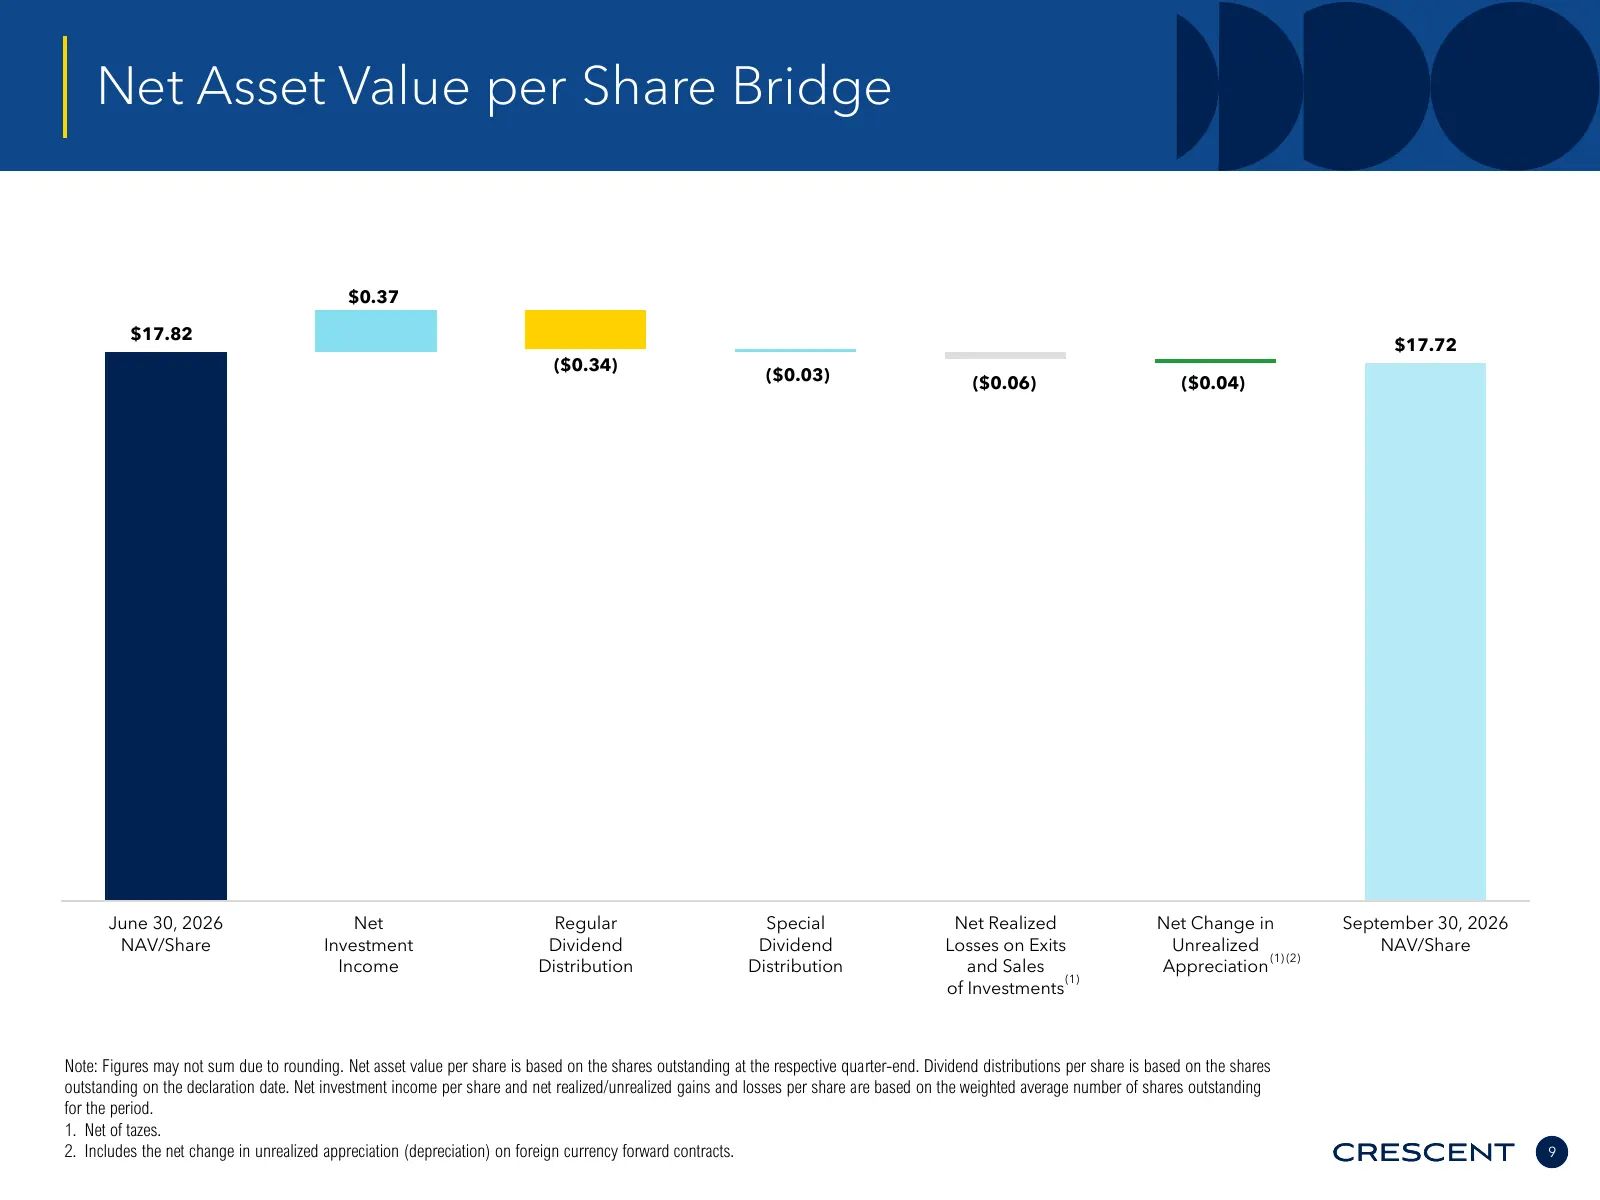
Net Asset Value per Share Bridge $0.37 $17.82 $17.72 ($0.34) ($0.03) ($0.06) ($0.04) June 30, 2026 Net Regular Special Net Realized Net Change in September 30, 2026 NAV/Share Investment Dividend Dividend Losses on Exits Unrealized NAV/Share (1) (2) Income Distribution Distribution and Sales Apprecia
Slide 10: Operating Results Detail
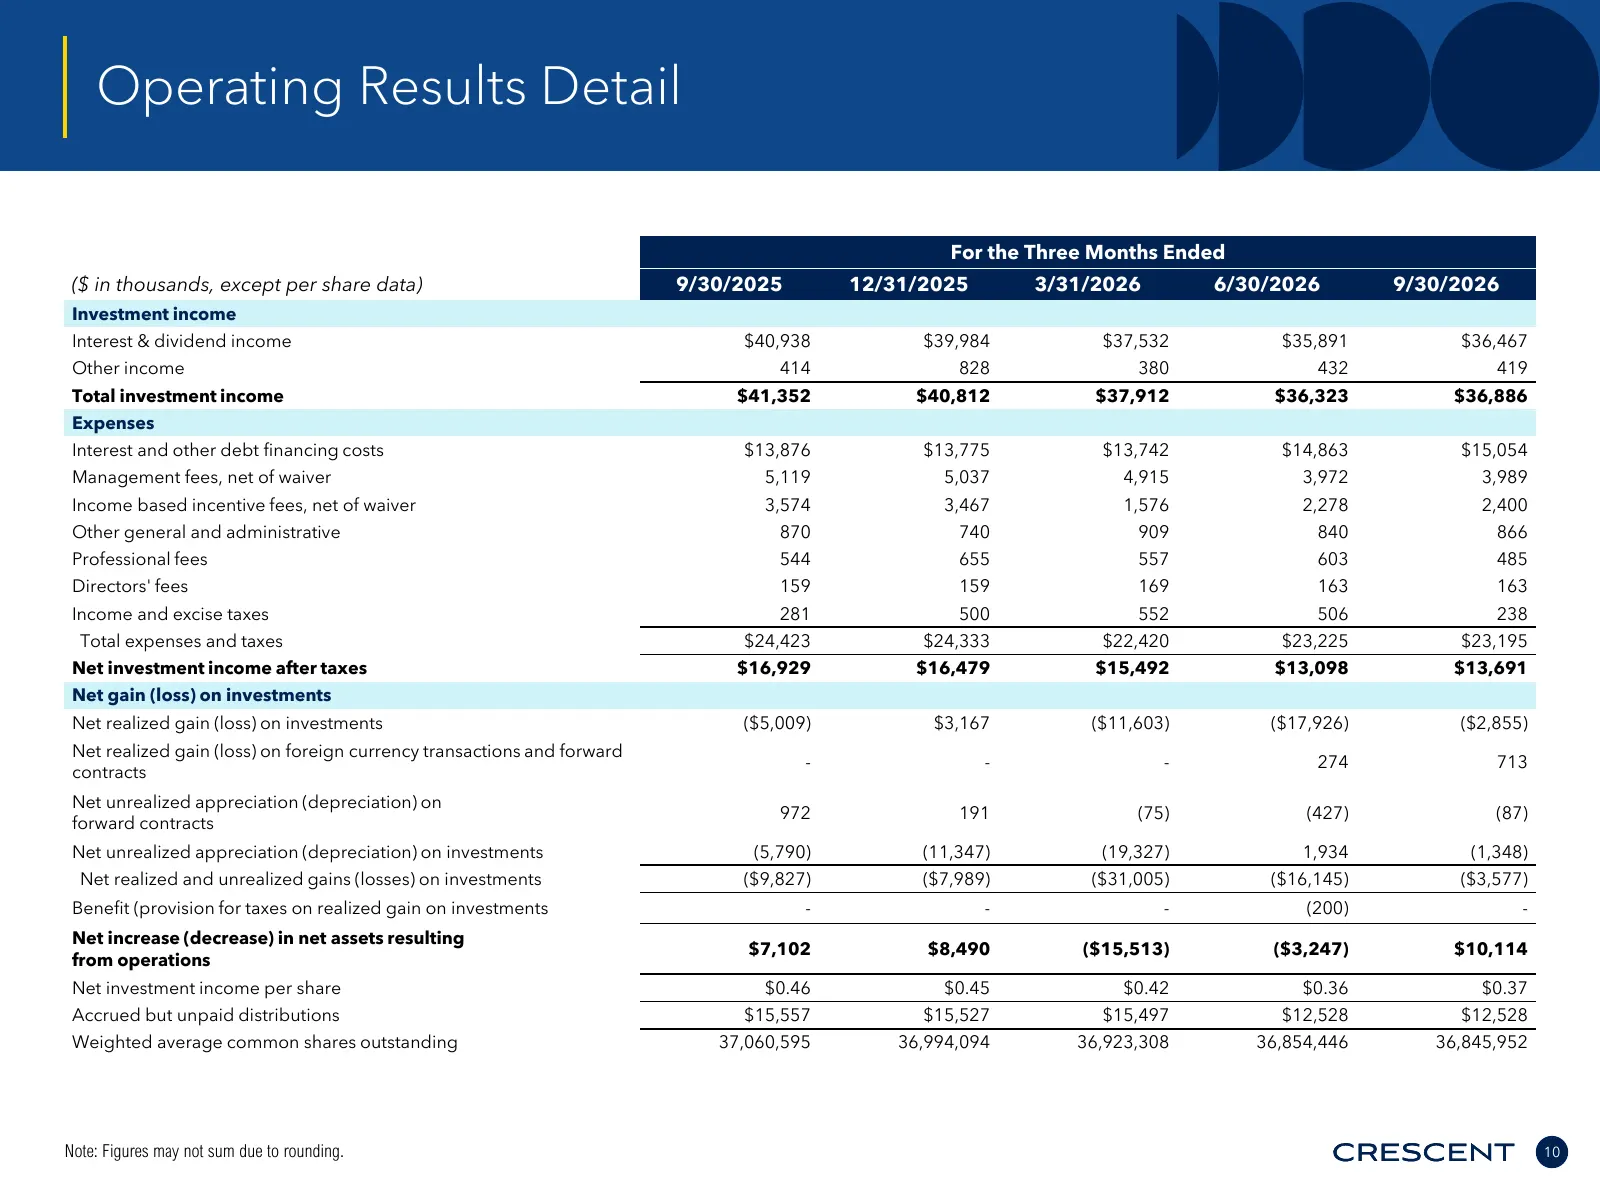
Operating Results Detail For the Three Months Ended ($ in thousands, except per share data) 9/30/2025 12/31/2025 3/31/2026 6/30/2026 9/30/2026 Investment income Interest & dividend income $40,938 $39,984 $37,532 $35,891 $36,467 Other income 414 828 380 432 419 Total investment income $41,352 $40,812
Slide 11: Portfolio Highlights
Current or prospective client name Portfolio Highlights 11
Slide 12: Disciplined Portfolio Construction
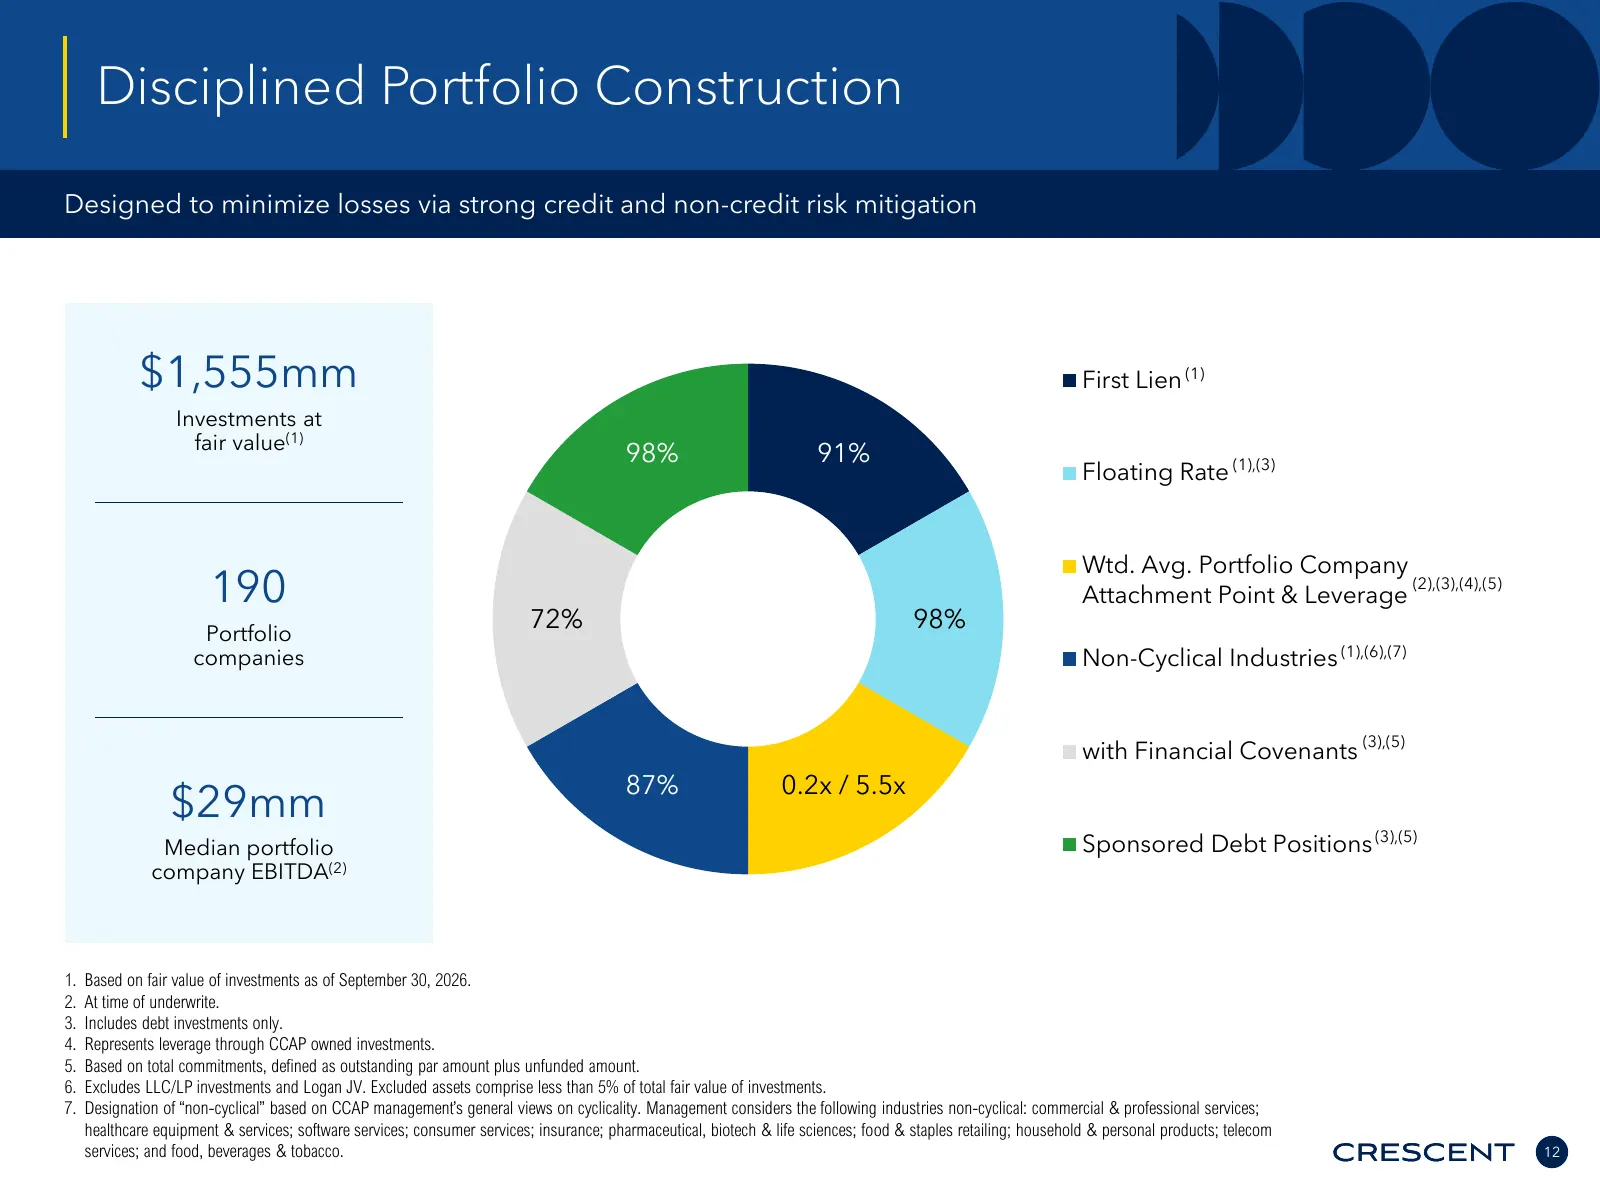
Disciplined Portfolio Construction Designed to minimize losses via strong credit and non-credit risk mitigation $1,555mm First Lien (1) Investments at fair value(1) 98% 91% Floating Rate (1),(3) Wtd. Avg. Portfolio Company 190 Attachment Point & Leverage (2),(3),(4),(5) Portfolio 72% 98% companies N
Slide 13: Portfolio Diversity
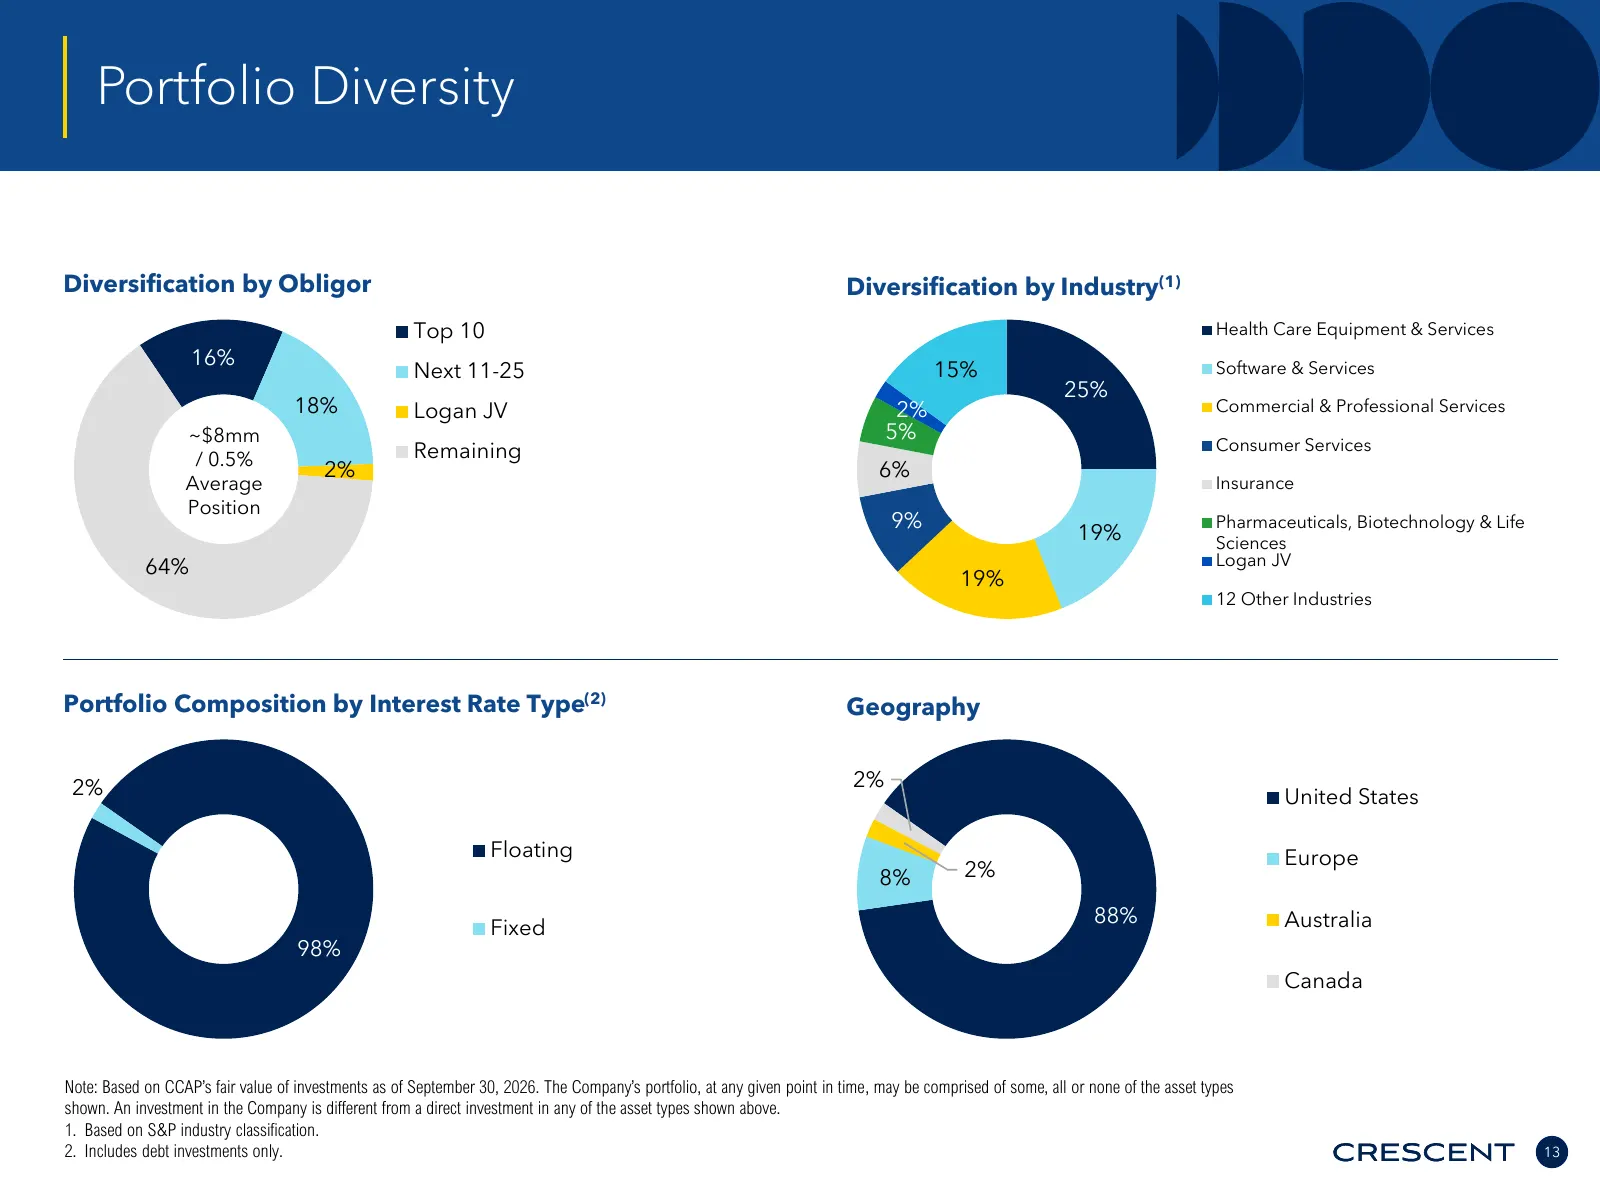
Portfolio Diversity Diversification by Obligor Diversification by Industry(1) Top 10 Health Care Equipment & Services 16% Next 11-25 15% Software & Services 25% 18% Logan JV 2% Commercial & Professional Services ~$8mm 5% Remaining Consumer Services / 0.5% 2% 6% Average Insurance Position 9% Pharmace
Slide 14: Investment Activity
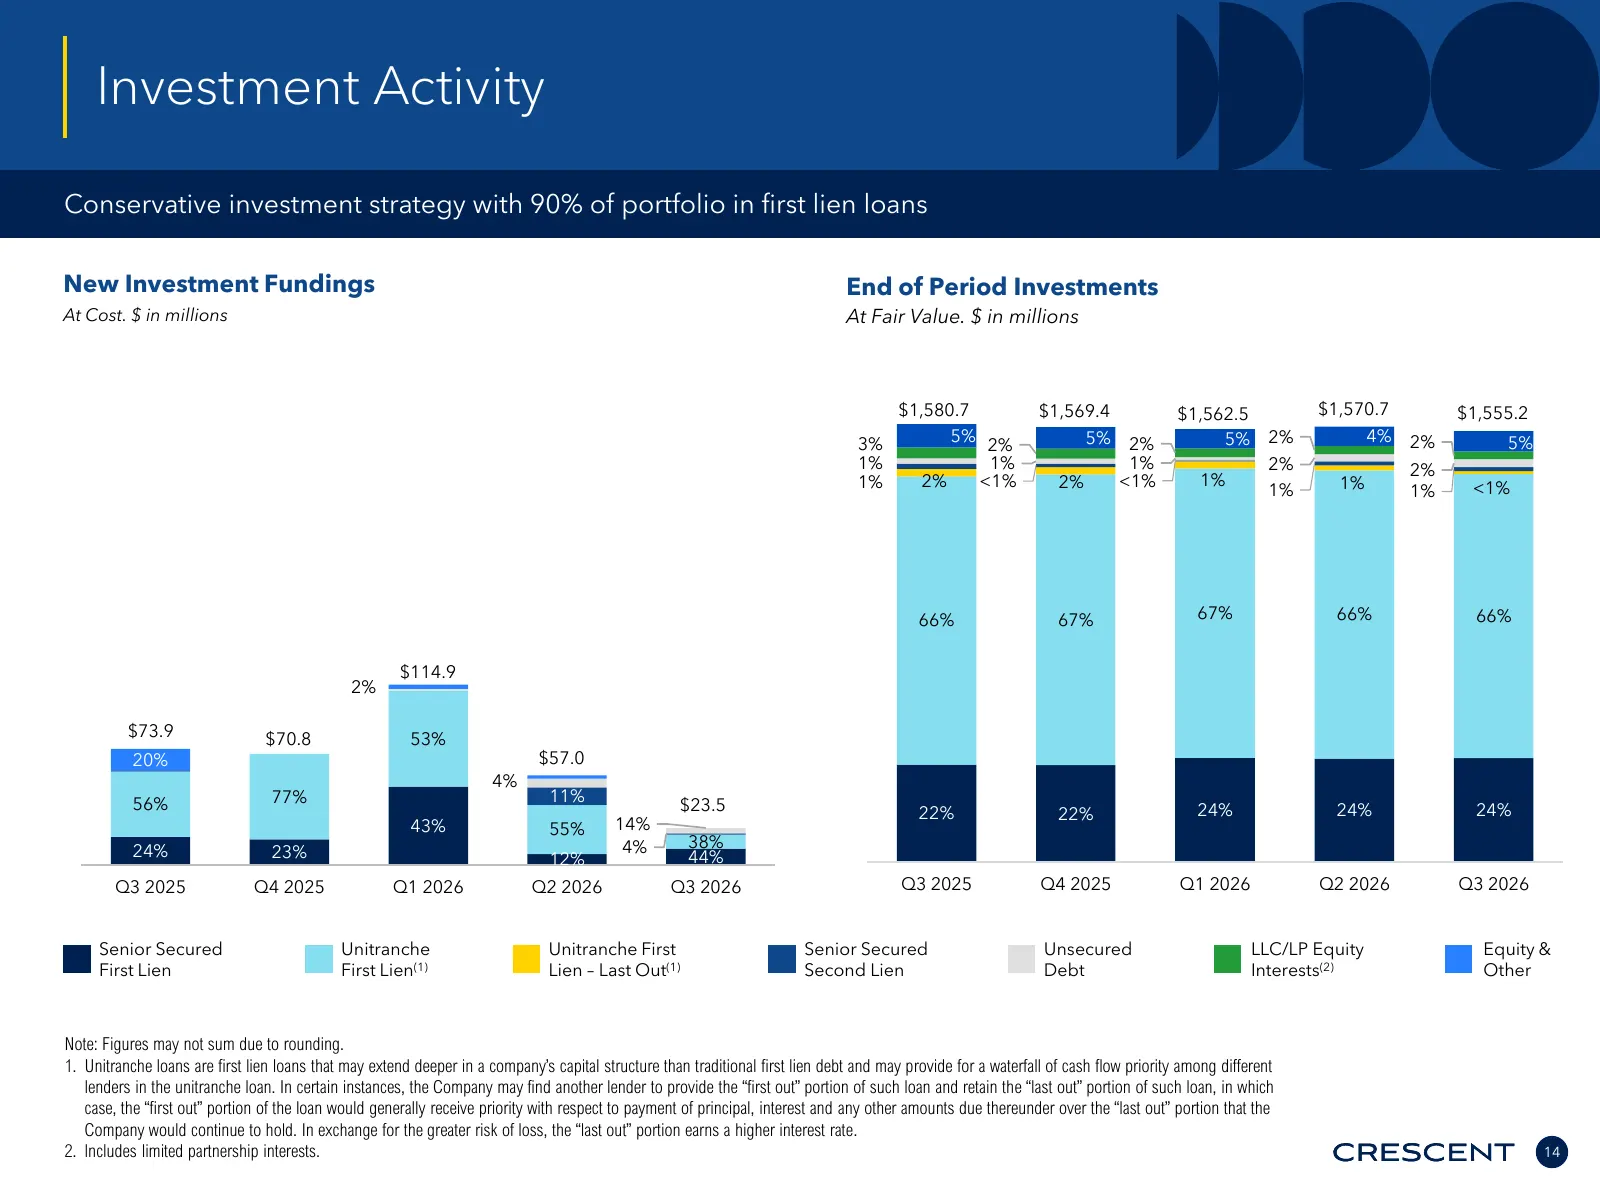
Investment Activity Conservative investment strategy with 90% of portfolio in first lien loans New Investment Fundings End of Period Investments At Cost. $ in millions At Fair Value. $ in millions $1,580.7 $1,569.4 $1,562.5 $1,570.7 $1,555.2 3% 5% 2% 5% 2% 5% 2% 4% 2% 5% 1% 1% 1% 2% 2% 1% 2% <1% 2%
Slide 15: Portfolio Net Interest Margin
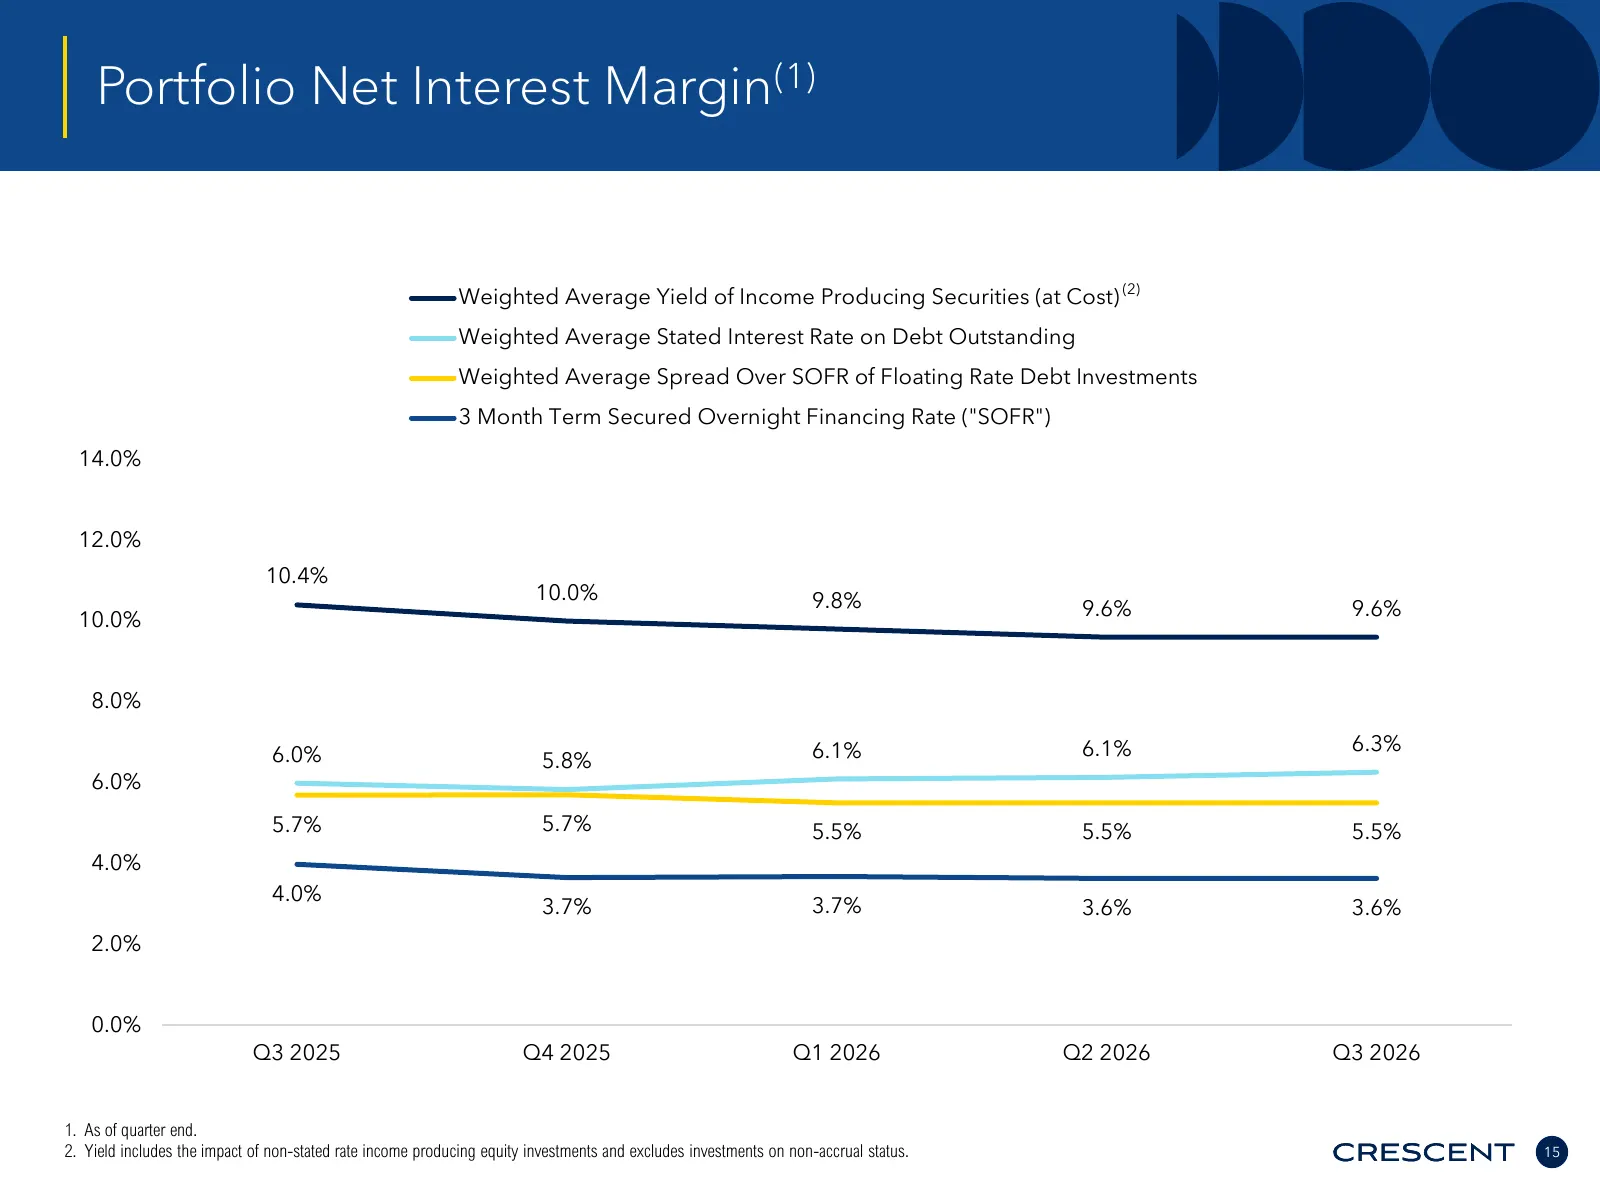
Portfolio Net Interest Margin(1) Weighted Average Yield of Income Producing Securities (at Cost) (2) Weighted Average Stated Interest Rate on Debt Outstanding Weighted Average Spread Over SOFR of Floating Rate Debt Investments 3 Month Term Secured Overnight Financing Rate ("SOFR") 14.0% 12.0% 10.4%
Slide 16: Investment Portfolio Performance Ratings
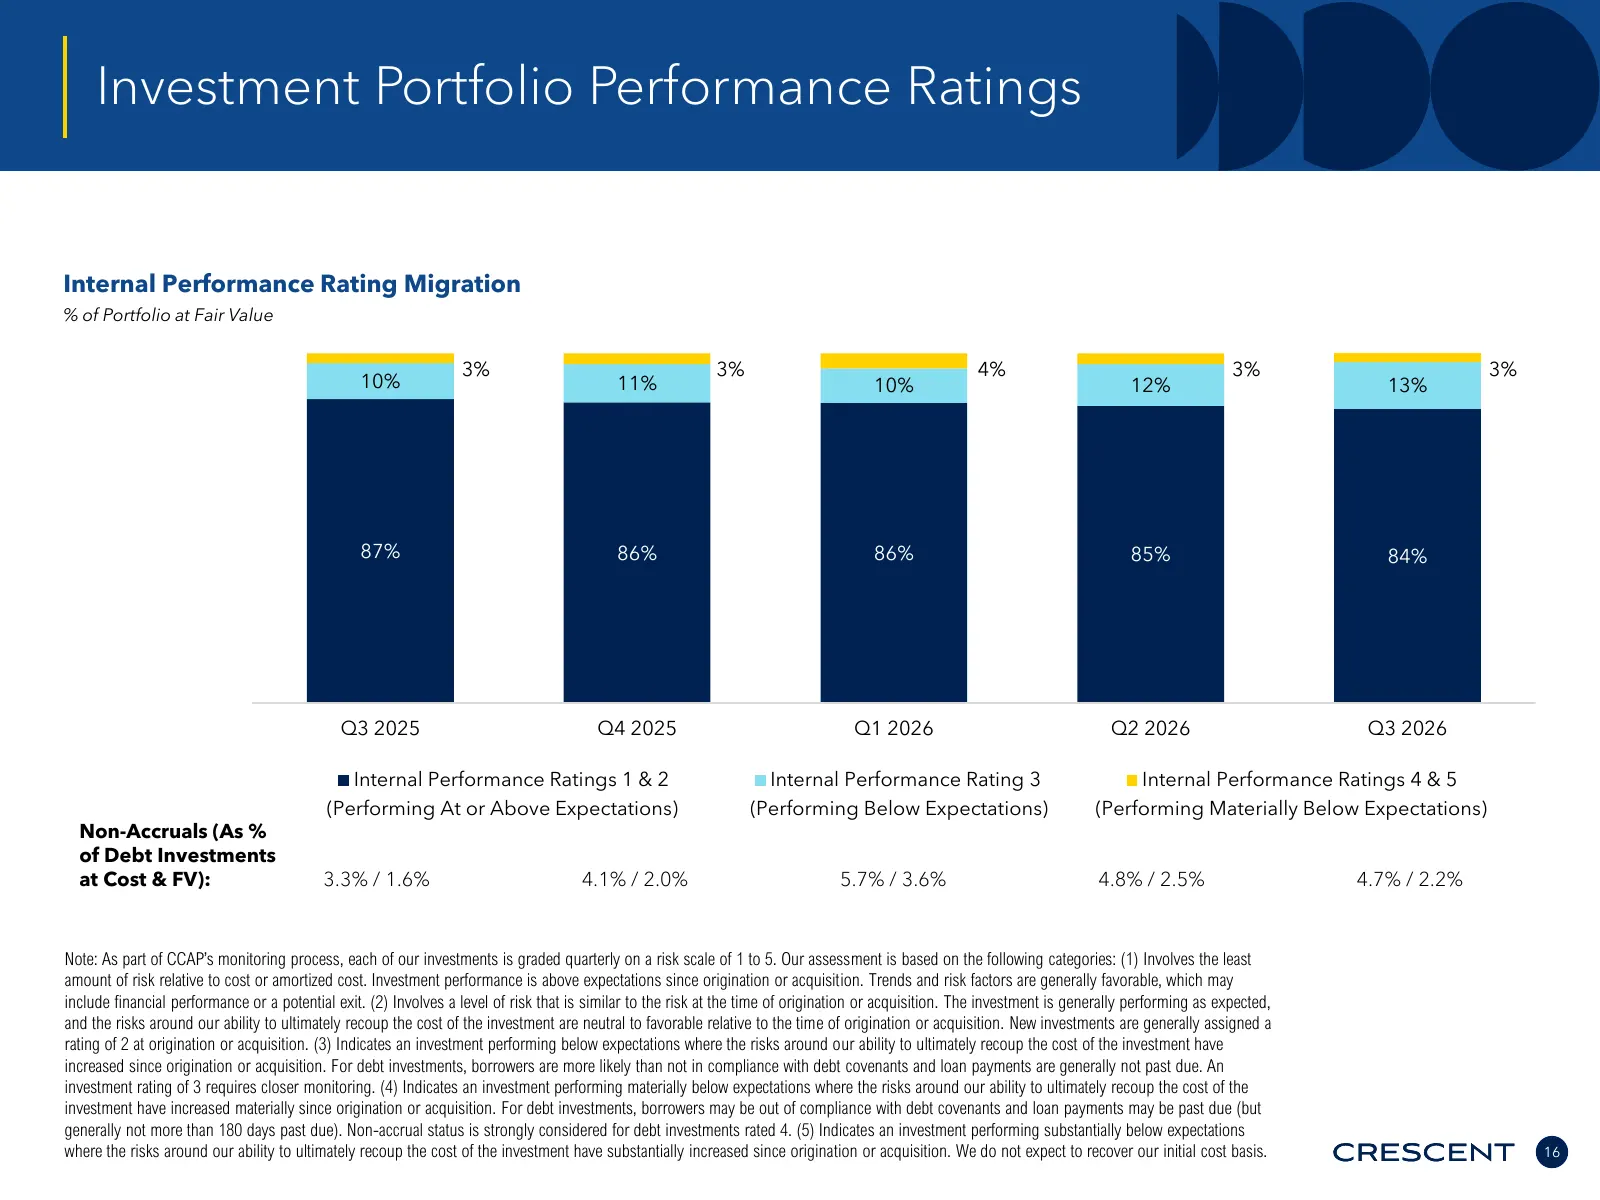
Investment Portfolio Performance Ratings Internal Performance Rating Migration % of Portfolio at Fair Value 3% 3% 4% 3% 3% 10% 11% 10% 12% 13% 87% 86% 86% 85% 84% Q3 2025 Q4 2025 Q1 2026 Q2 2026 Q3 2026 Internal Performance Ratings 1 & 2 Internal Performance Rating 3 Internal Performance Ratings 4 &
Slide 17: Capital Structure
Current or prospective client name Capital Structure 17
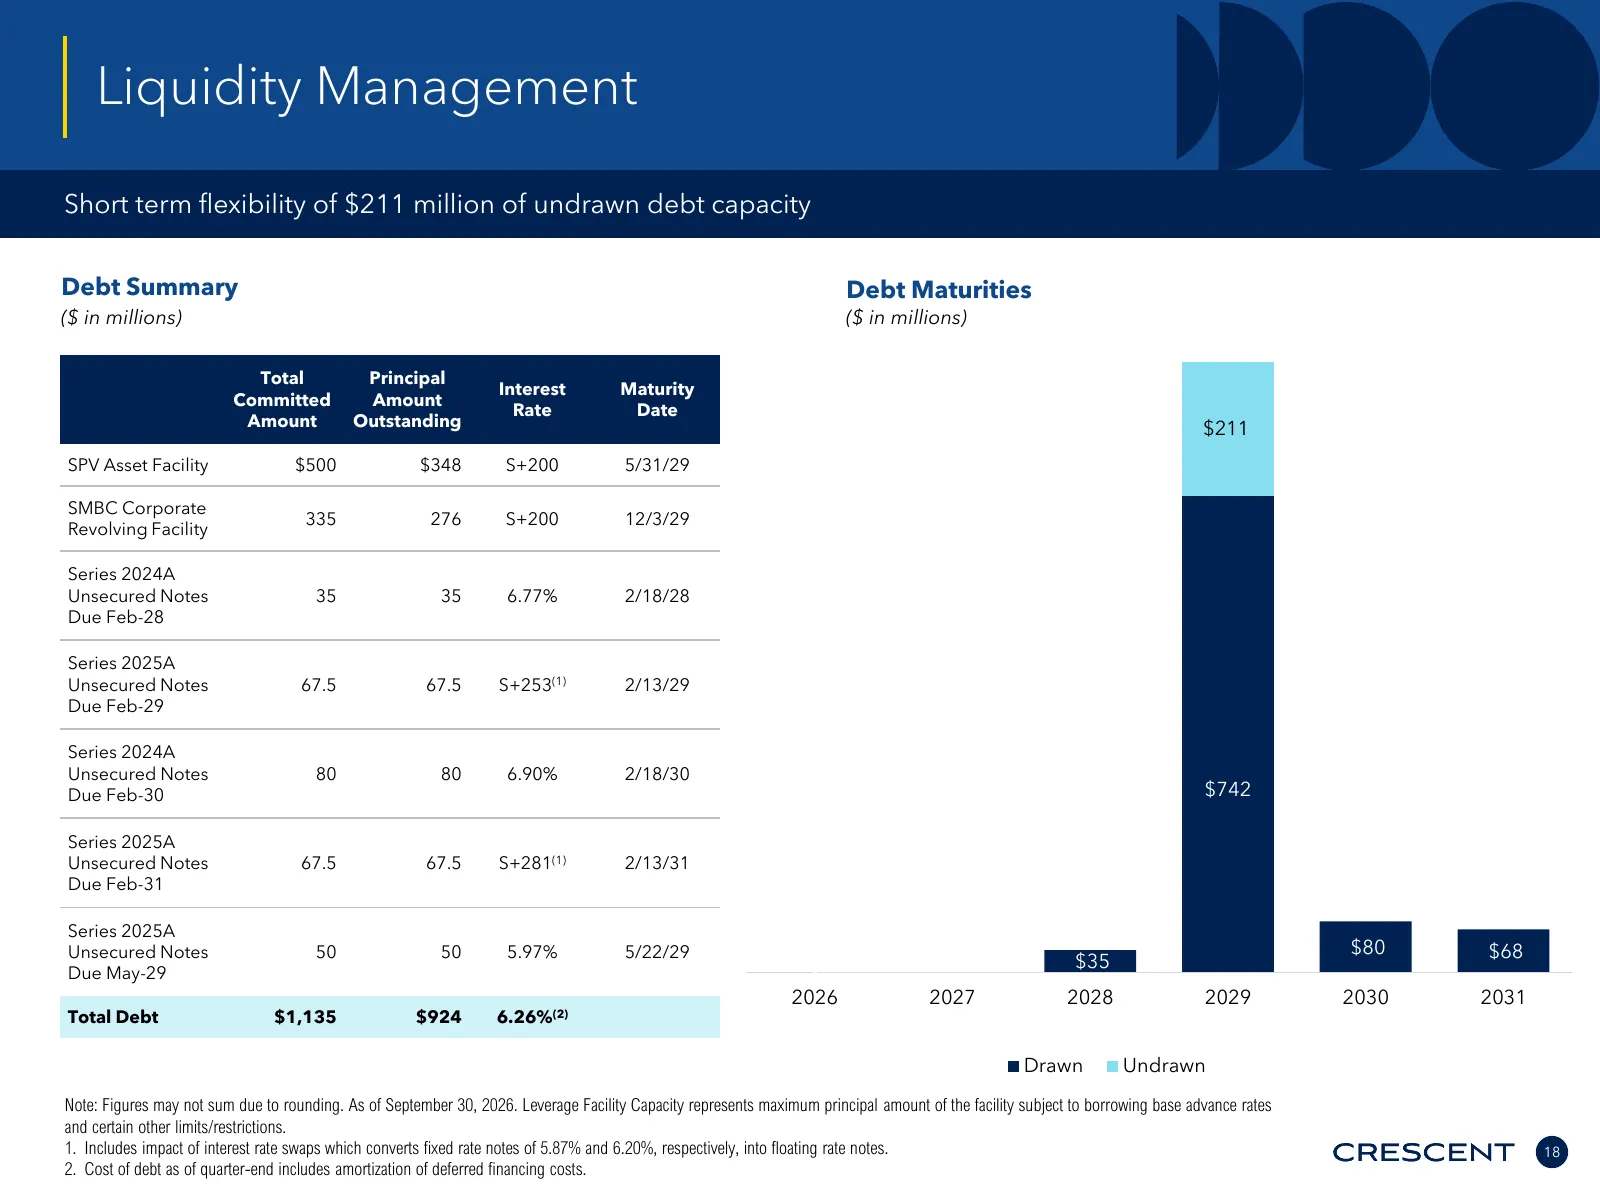
Slide 18: Liquidity Management
Liquidity Management Short term flexibility of $211 million of undrawn debt capacity Debt Summary Debt Maturities ($ in millions) ($ in millions) Total Principal Interest Maturity Committed Amount Rate Date Amount Outstanding $211 SPV Asset Facility $500 $348 S+200 5/31/29 SMBC Corporate 335 276 S+2
Source: company website
More decks from Crescent Capital BDC, Inc.
 Q2 2026 Earnings Presentation19 slides · Aug 11, 2026
 Q1 2026 Earnings Presentation19 slides · May 14, 2026
 Q4 2025 Earnings Presentation19 slides · Feb 26, 2026
 Q3 2025 Earnings Presentation19 slides · Nov 13, 2025
 Q2 2025 Earnings Presentation19 slides · Aug 14, 2025
 Q1 2025 Earnings Presentation19 slides · May 15, 2025