Ayala Land Inc. · PSE:ALI
Ayala Land — Investor Presentation (September 2014)
39 slides from Ayala Land's investor presentation, September 2014
Slide 1: Investor Presentation
Investor Presentation September 2014
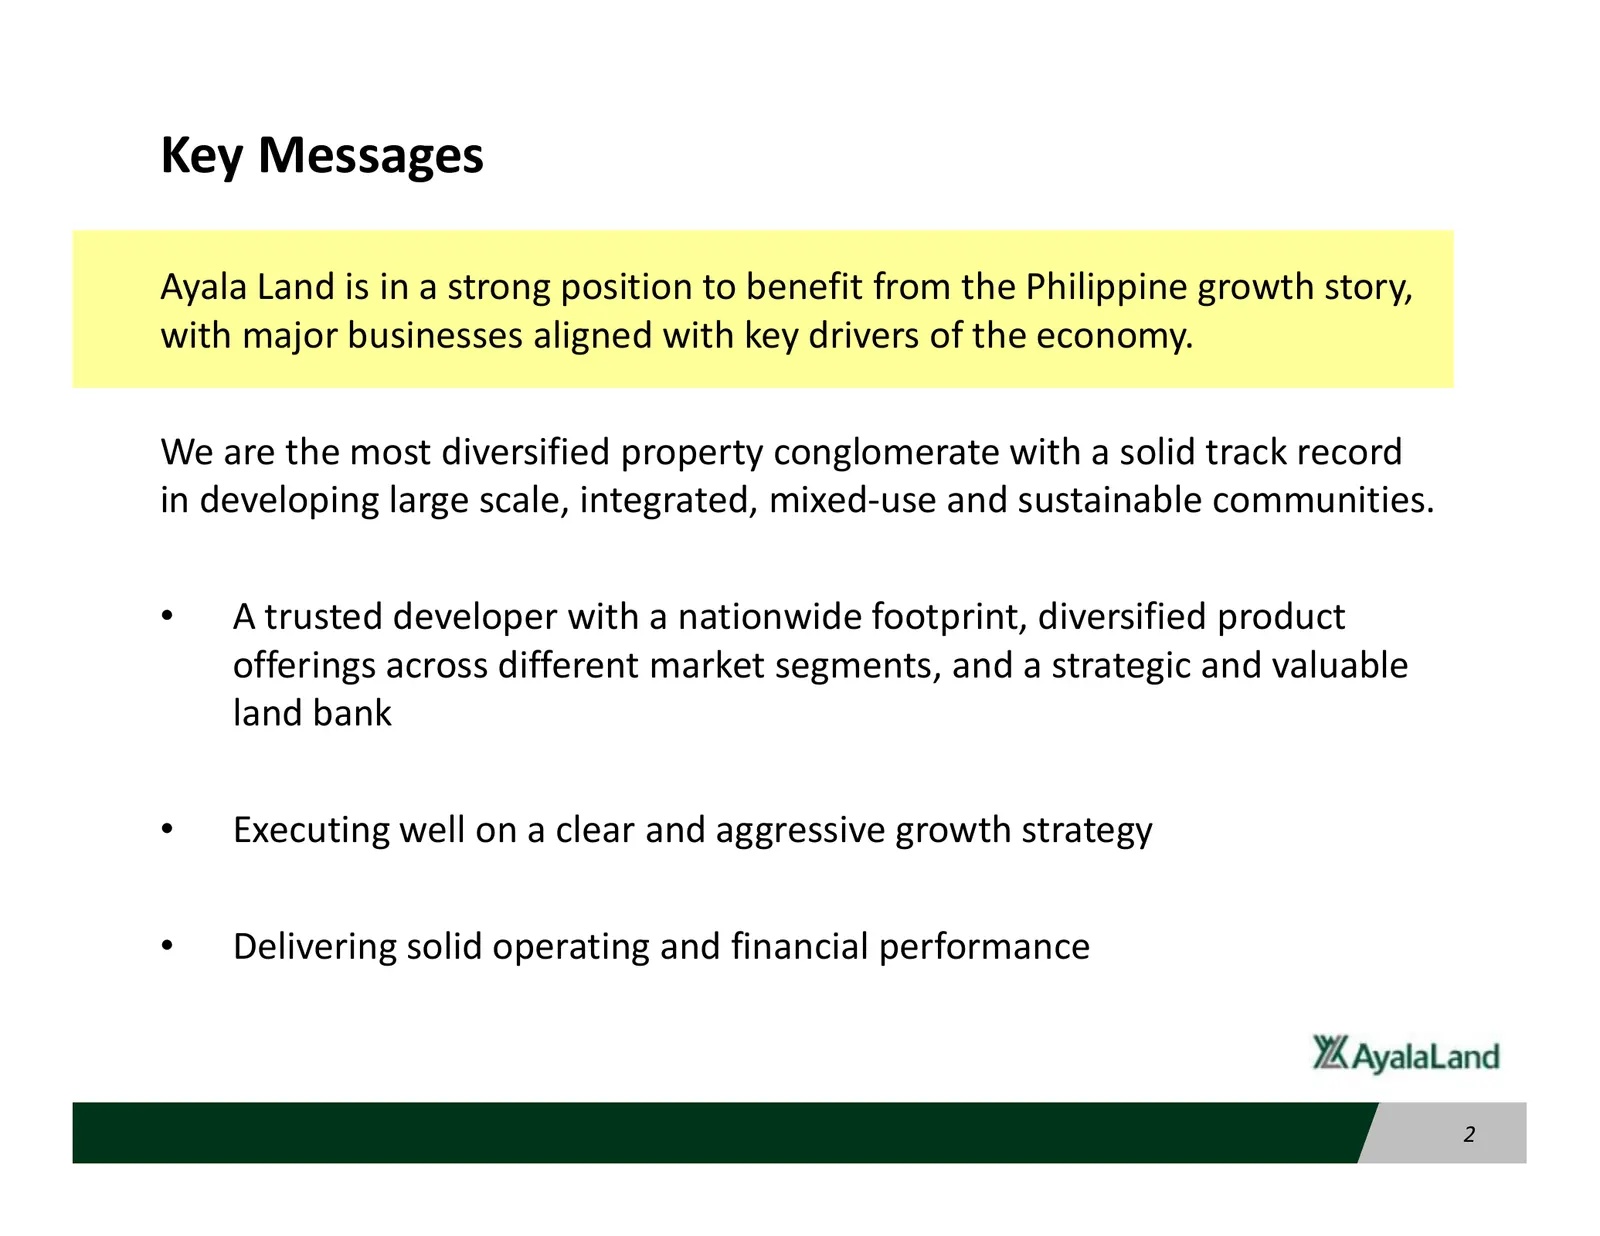
Slide 2: Key Messages
Key Messages Ayala Land is in a strong position to benefit from the Philippine growth story, with major businesses aligned with key drivers of the economy. We are the most diversified property conglomerate with a solid track record in developing large scale, integrated, mixed-use and sustainable com
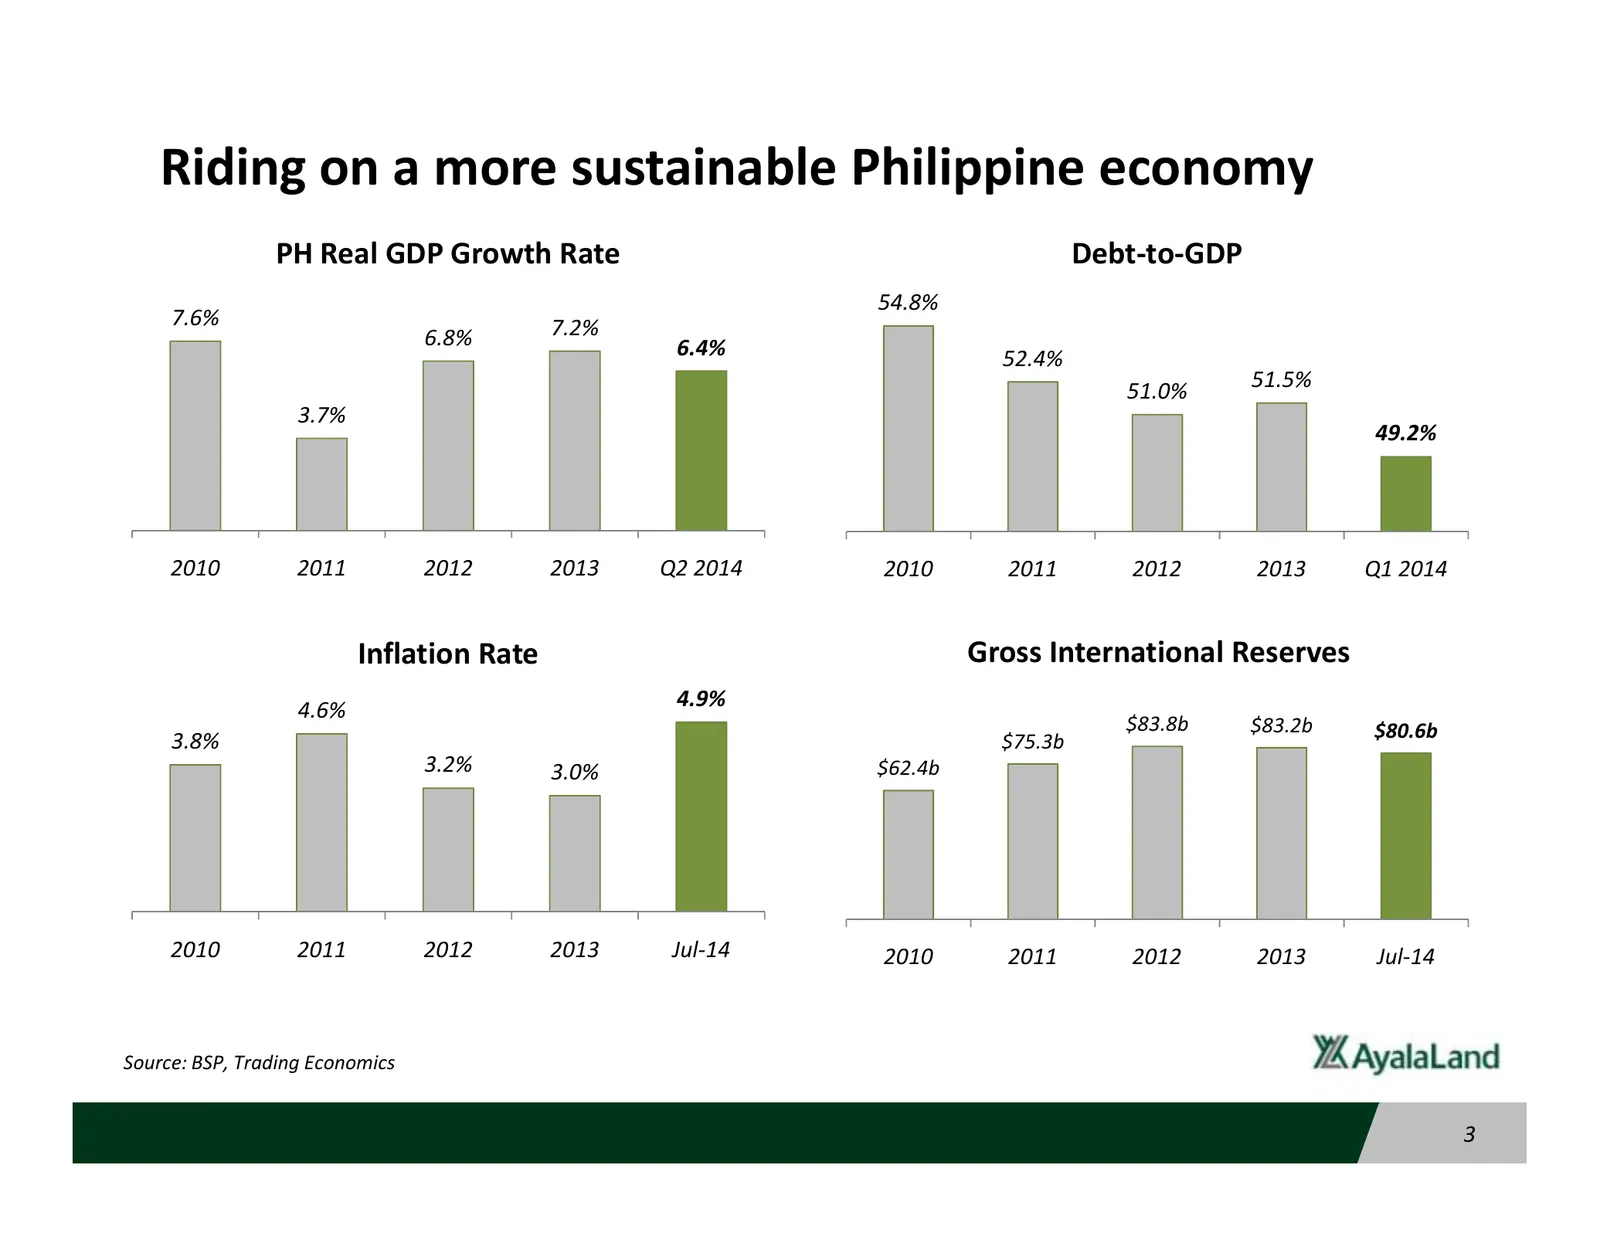
Slide 3: Riding on a more sustainable Philippine economy
Riding on a more sustainable Philippine economy PH Real GDP Growth Rate Debt-to-GDP 54.8% 7.6% 7.2% 6.8% 6.4% 52.4% 51.0% 51.5% 3.7% 49.2% 2010 2011 2012 2013 Q2 2014 2010 2011 2012 2013 Q1 2014 Inflation Rate Gross International Reserves 4.6% 4.9% $83.8b $83.2b $80.6b 3.8% $75.3b 3.2% 3.0% $62.4b 2
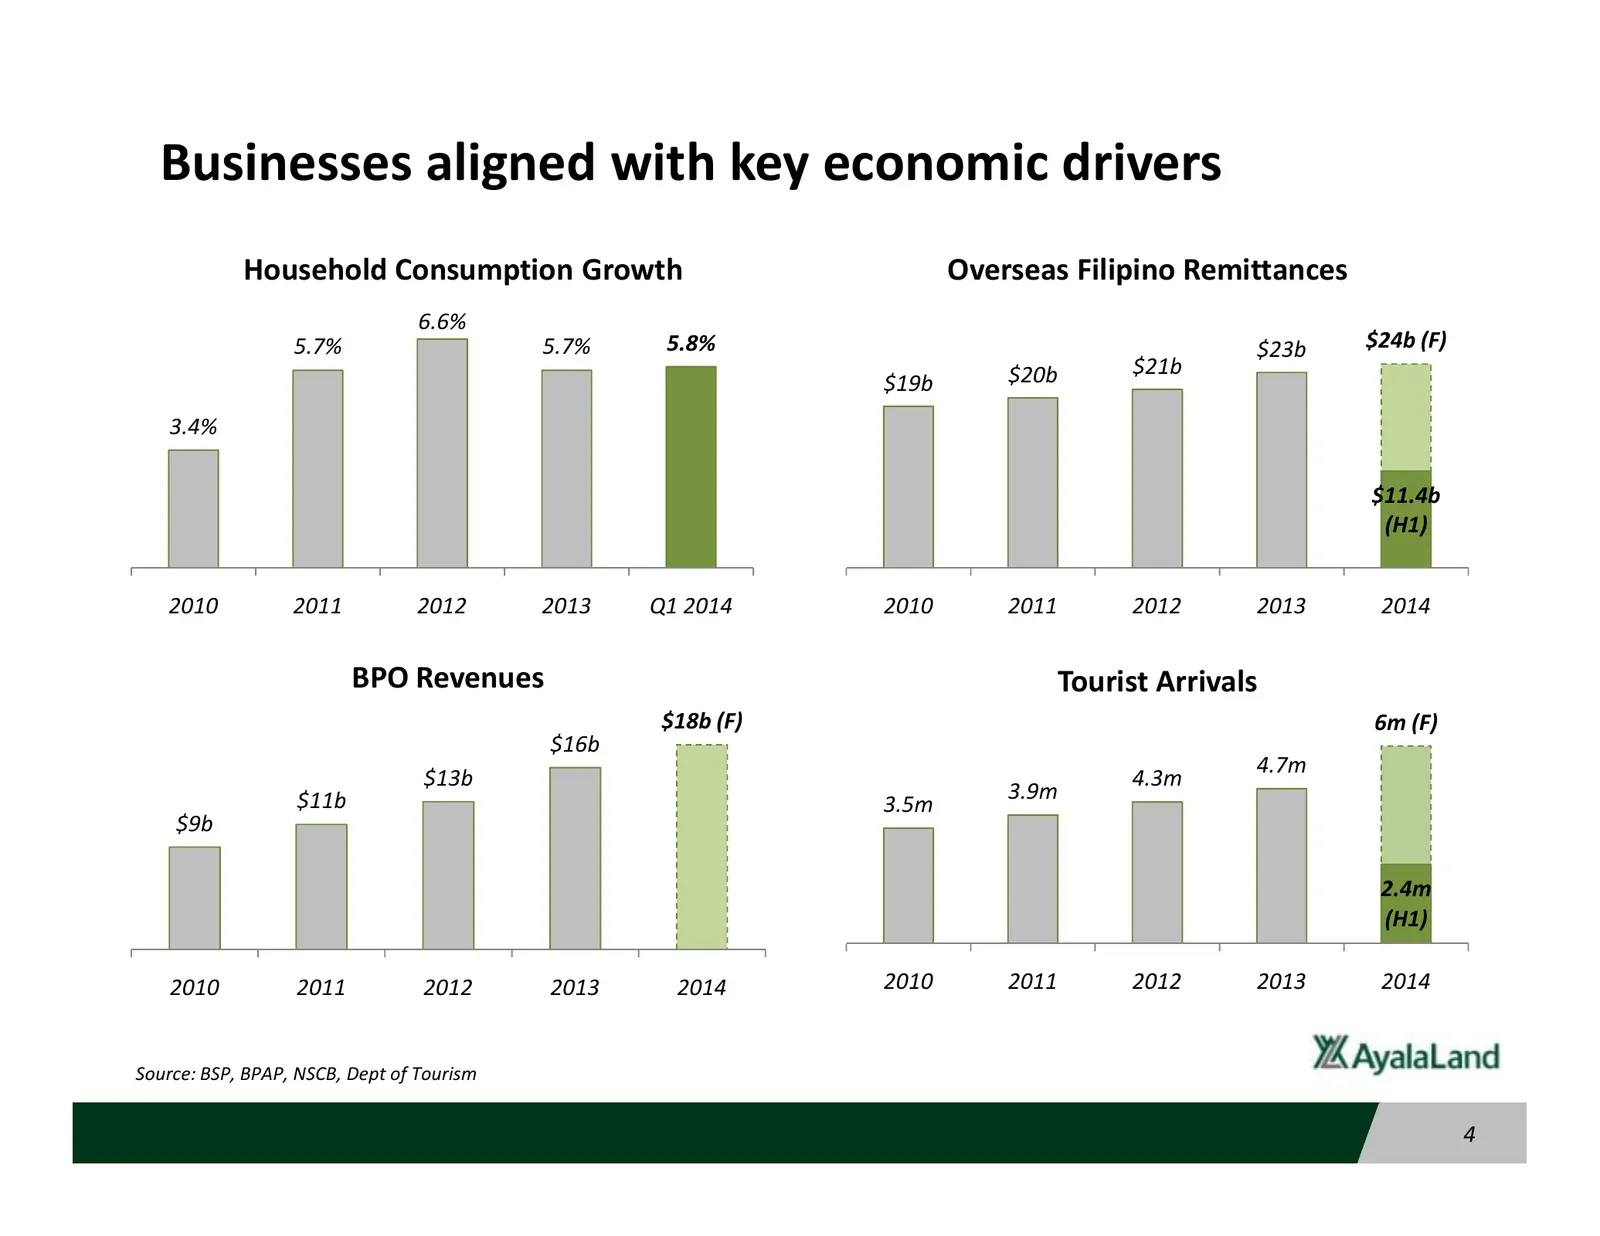
Slide 4: Businesses aligned with key economic drivers
Businesses aligned with key economic drivers Household Consumption Growth Overseas Filipino Remittances 6.6% 5.7% 5.7% 5.8% $23b $24b (F) $20b $21b $19b 3.4% $11.4b (H1) 2010 2011 2012 2013 Q1 2014 2010 2011 2012 2013 2014 BPO Revenues Tourist Arrivals $18b (F) 6m (F) $16b 4.7m $13b 4.3m $11b 3.9m 3
Slide 5: Key Messages
Key Messages Ayala Land is in a strong position to benefit from the Philippine growth story, with major businesses aligned with key drivers of the economy. We are the most diversified property conglomerate with a solid track record in developing large scale, integrated, mixed-use and sustainable com
Slide 6: Ayala Land: The leading and most diversified property developer in the Philippines
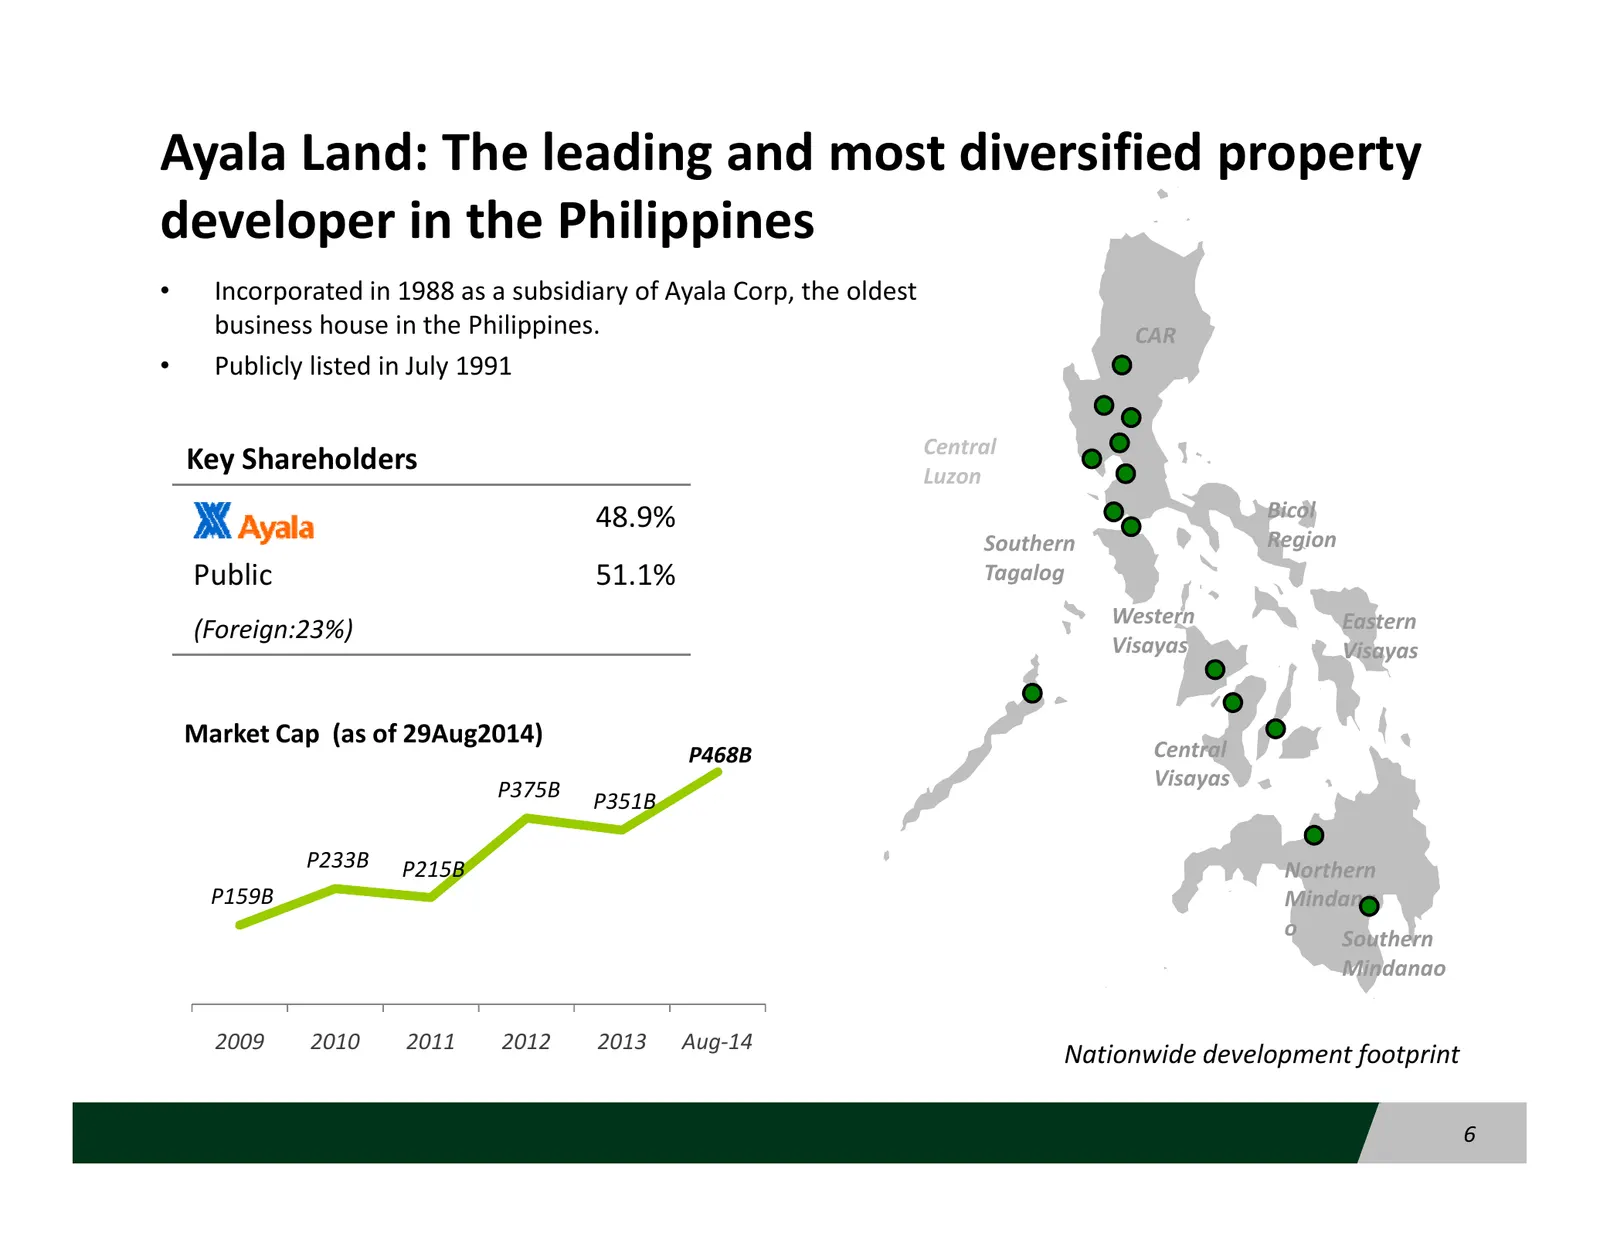
Ayala Land: The leading and most diversified property developer in the Philippines • Incorporated in 1988 as a subsidiary of Ayala Corp, the oldest business house in the Philippines. CAR • Publicly listed in July 1991 Central Key Shareholders Luzon 48.9% Bicol Southern Region Public 51.1% Tagalog We
Slide 7: Solid track record in developing large scale, integrated and mixed-use estates
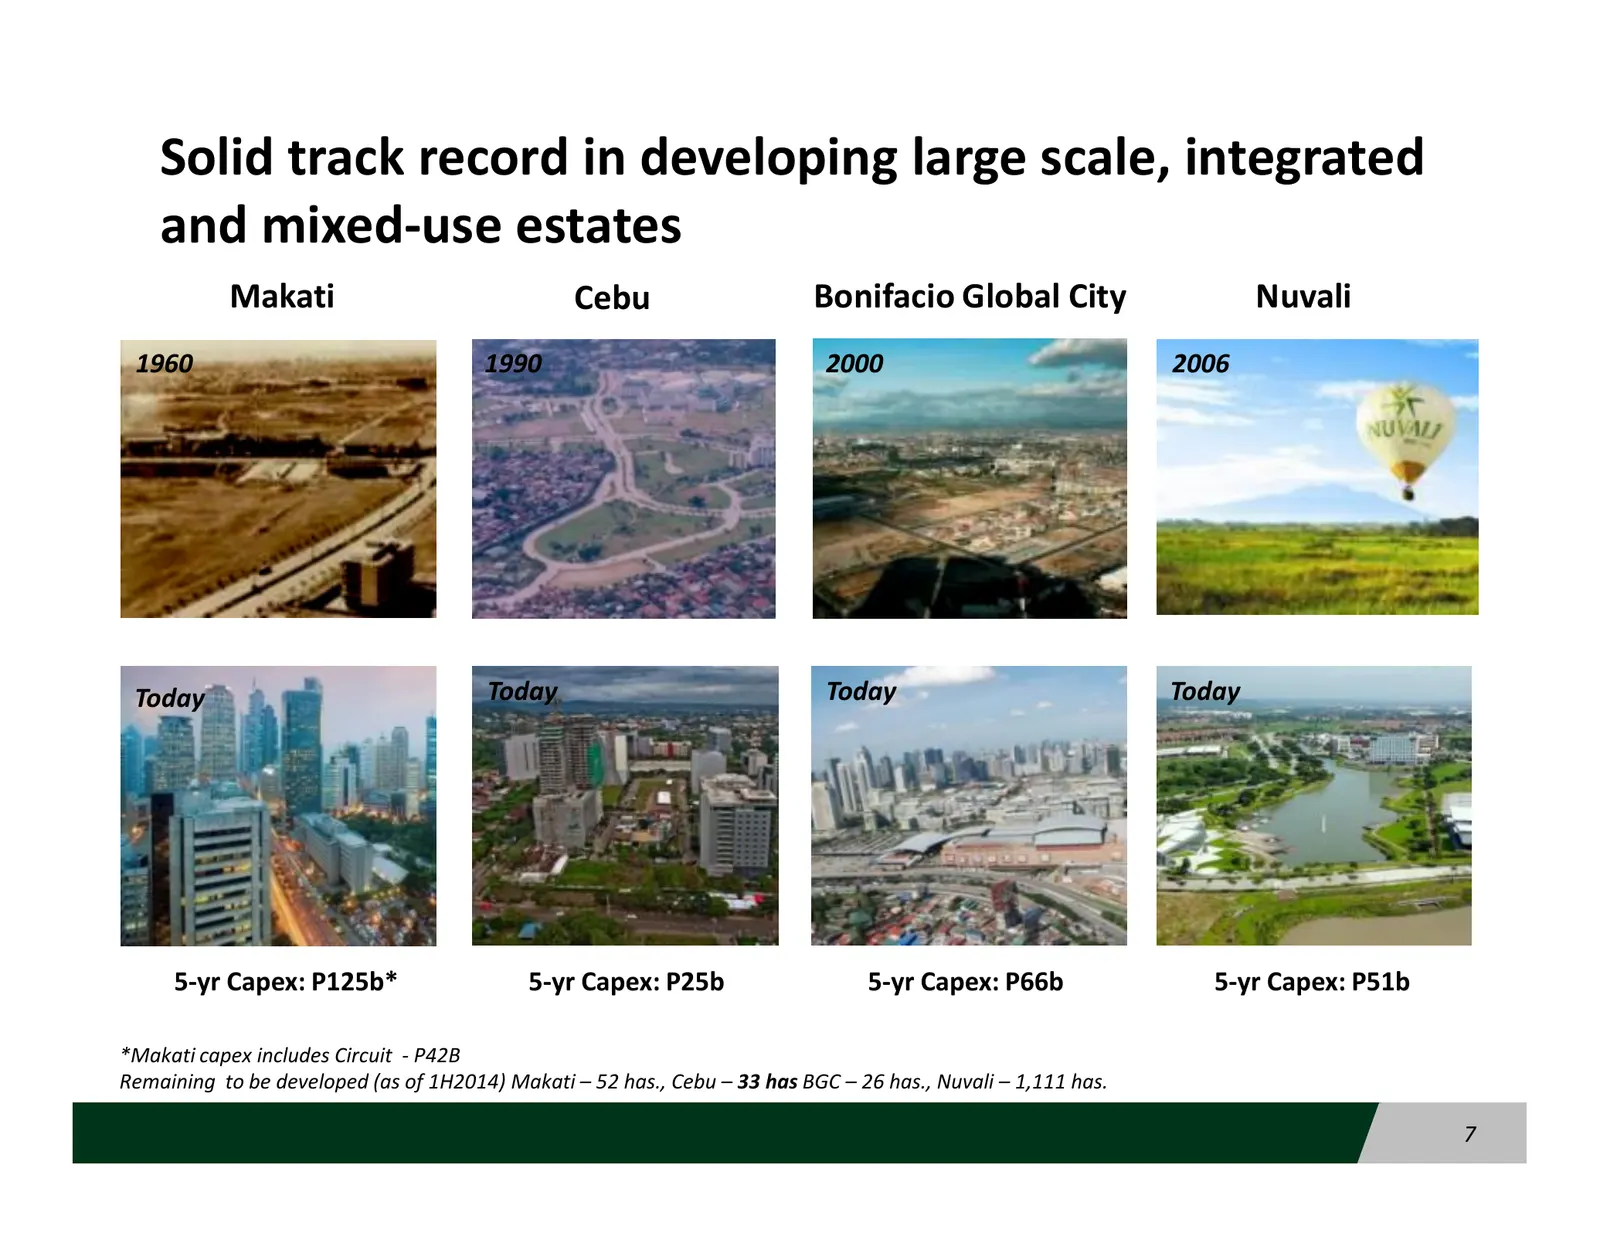
Solid track record in developing large scale, integrated and mixed-use estates Makati Cebu Bonifacio Global City Nuvali 1960 1990 2000 2006 Today Today Today Today 5-yr Capex: P125b* 5-yr Capex: P25b 5-yr Capex: P66b 5-yr Capex: P51b *Makati capex includes Circuit - P42B Remaining to be developed (a
Slide 8: Expanding presence in new estates: Metro Manila
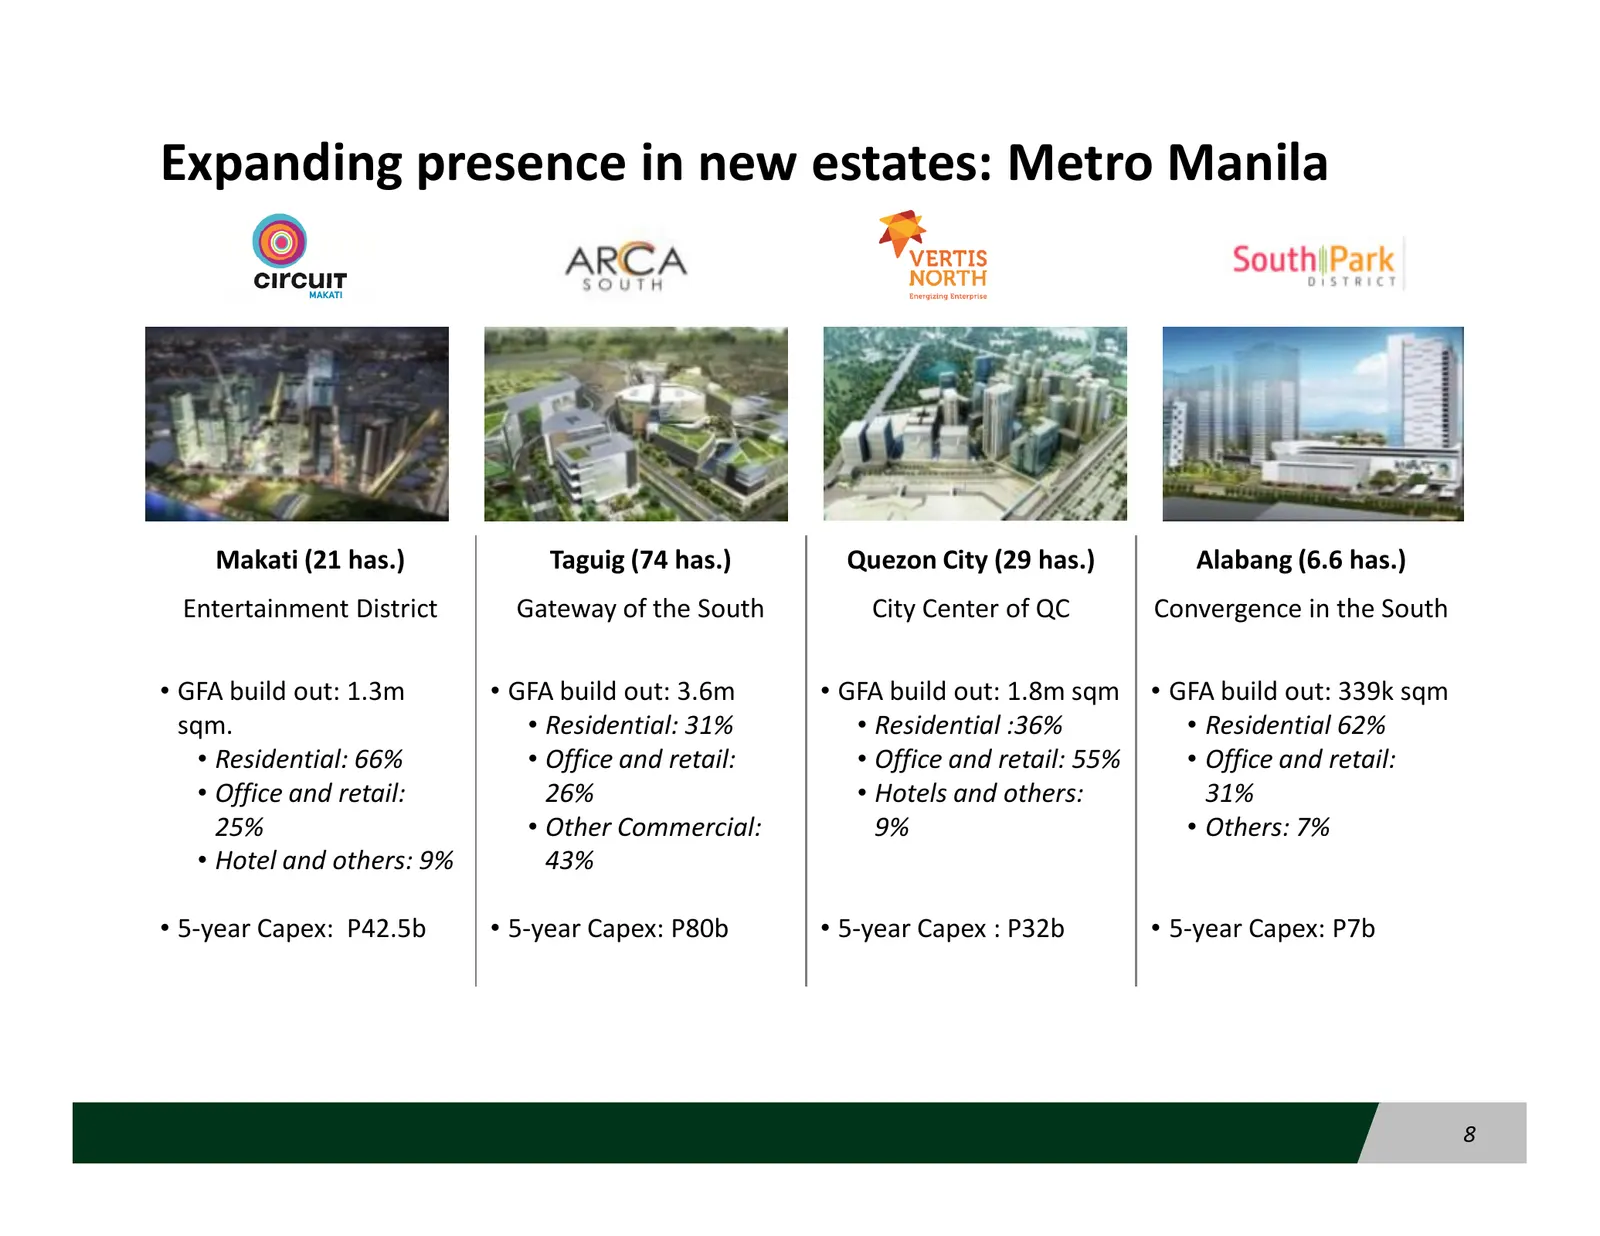
Expanding presence in new estates: Metro Manila Makati (21 has.) Taguig (74 has.) Quezon City (29 has.) Alabang (6.6 has.) Entertainment District Gateway of the South City Center of QC Convergence in the South • GFA build out: 1.3m • GFA build out: 3.6m • GFA build out: 1.8m sqm • GFA build out: 339
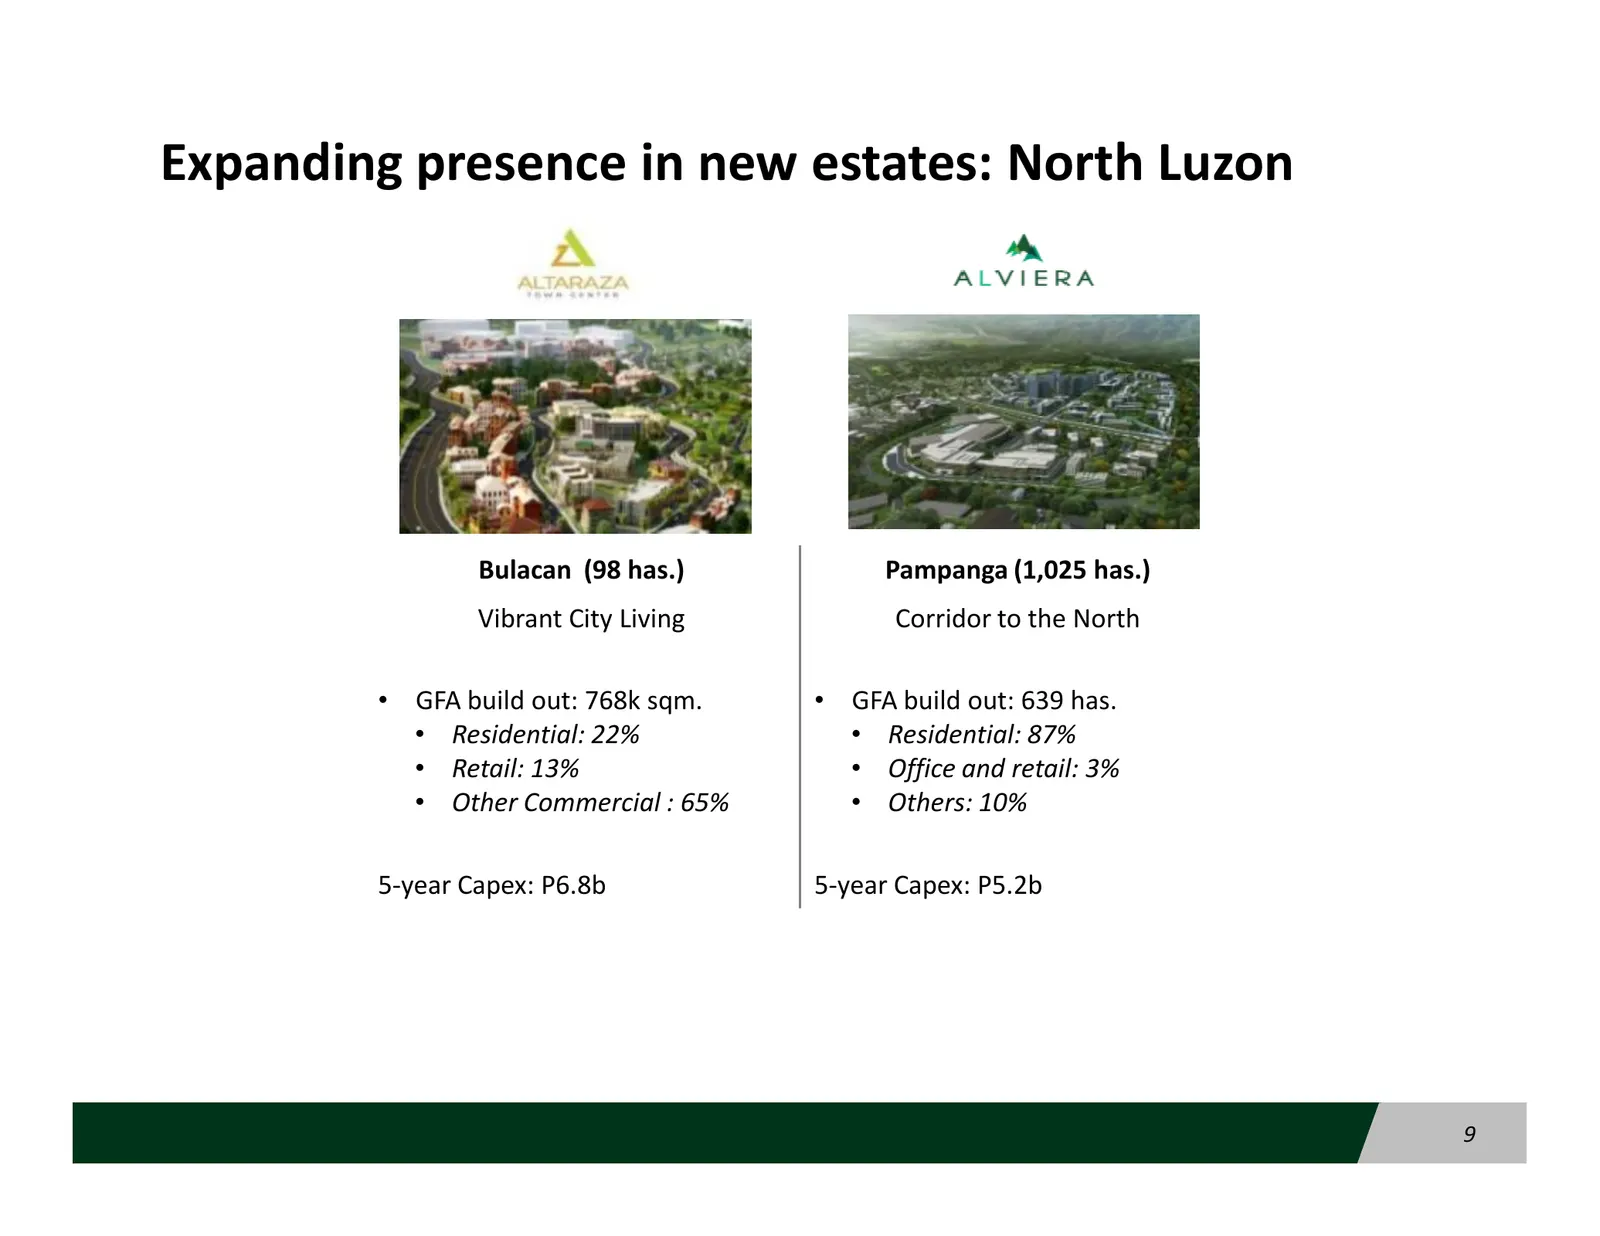
Slide 9: Expanding presence in new estates: North Luzon
Expanding presence in new estates: North Luzon Bulacan (98 has.) Pampanga (1,025 has.) Vibrant City Living Corridor to the North • GFA build out: 768k sqm. • GFA build out: 639 has. • Residential: 22% • Residential: 87% • Retail: 13% • Office and retail: 3% • Other Commercial : 65% • Others: 10% 5-y
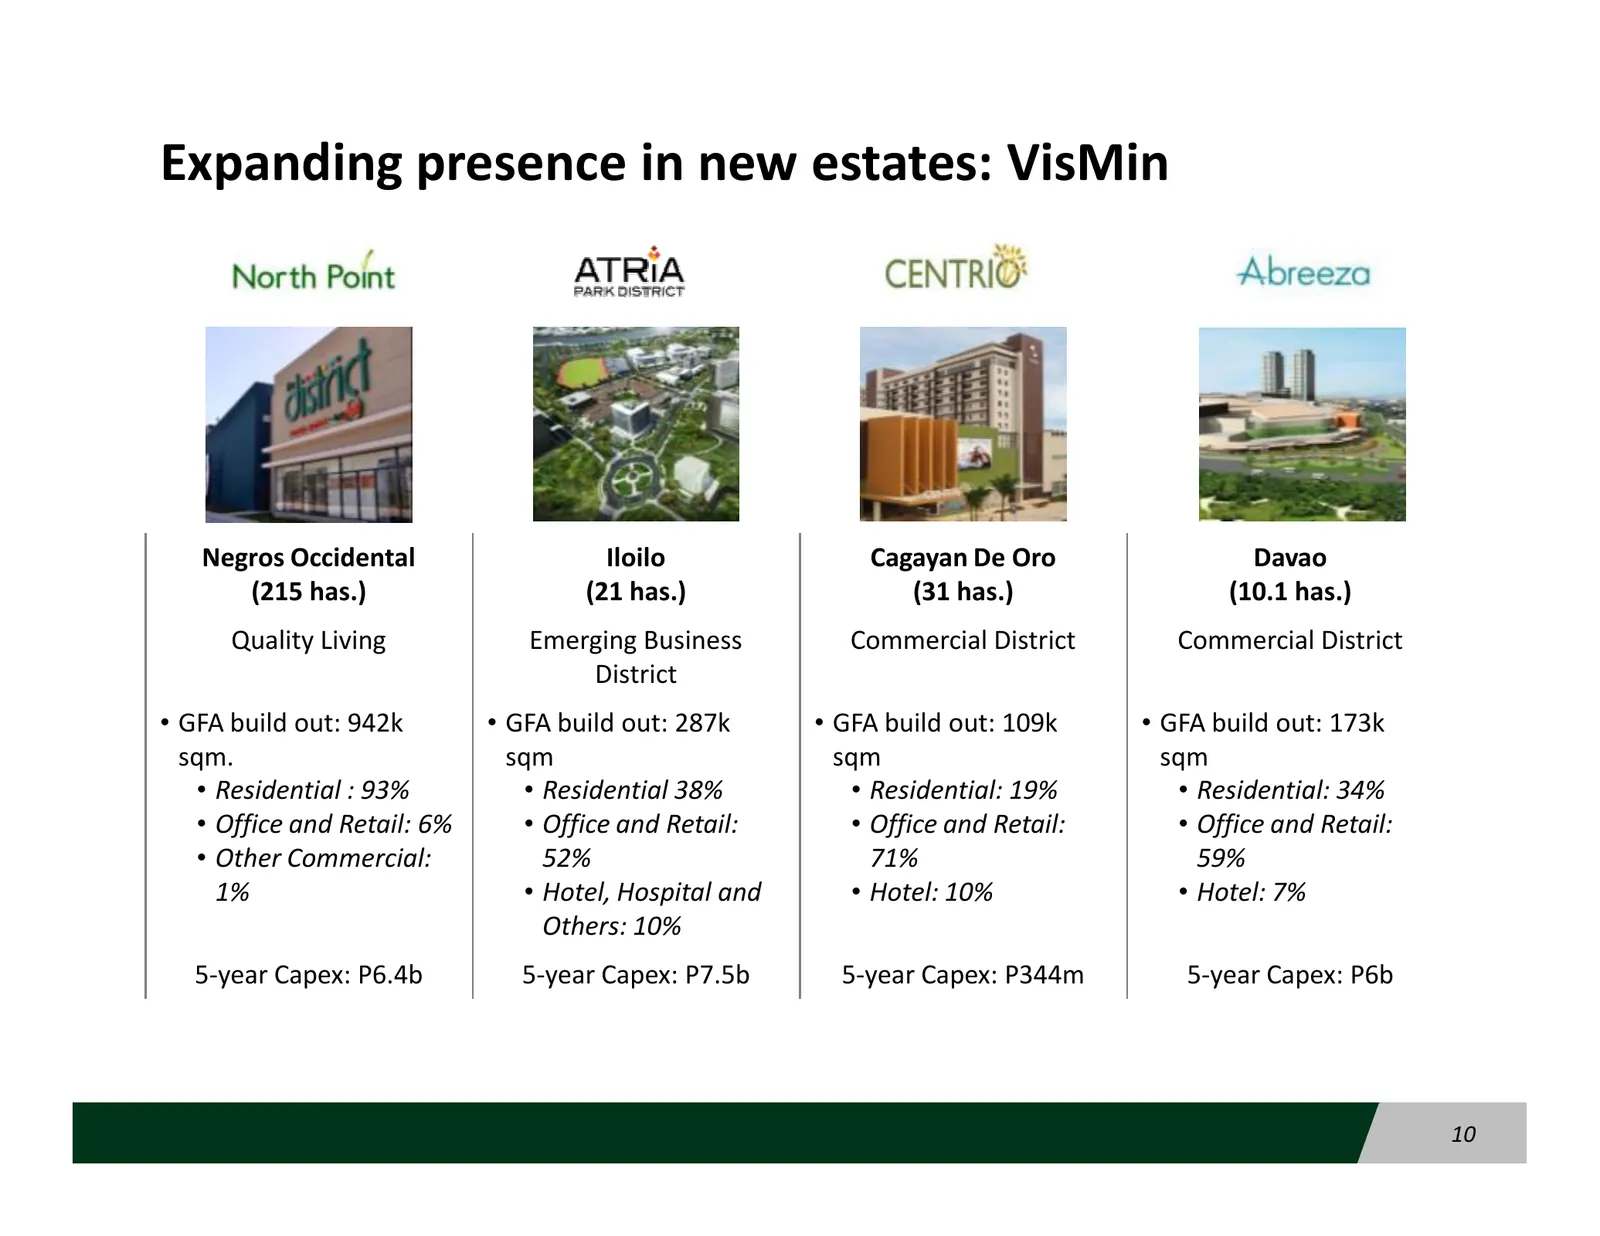
Slide 10: Expanding presence in new estates: VisMin
Expanding presence in new estates: VisMin Negros Occidental Iloilo Cagayan De Oro Davao (215 has.) (21 has.) (31 has.) (10.1 has.) Quality Living Emerging Business Commercial District Commercial District District • GFA build out: 942k • GFA build out: 287k • GFA build out: 109k • GFA build out: 173k
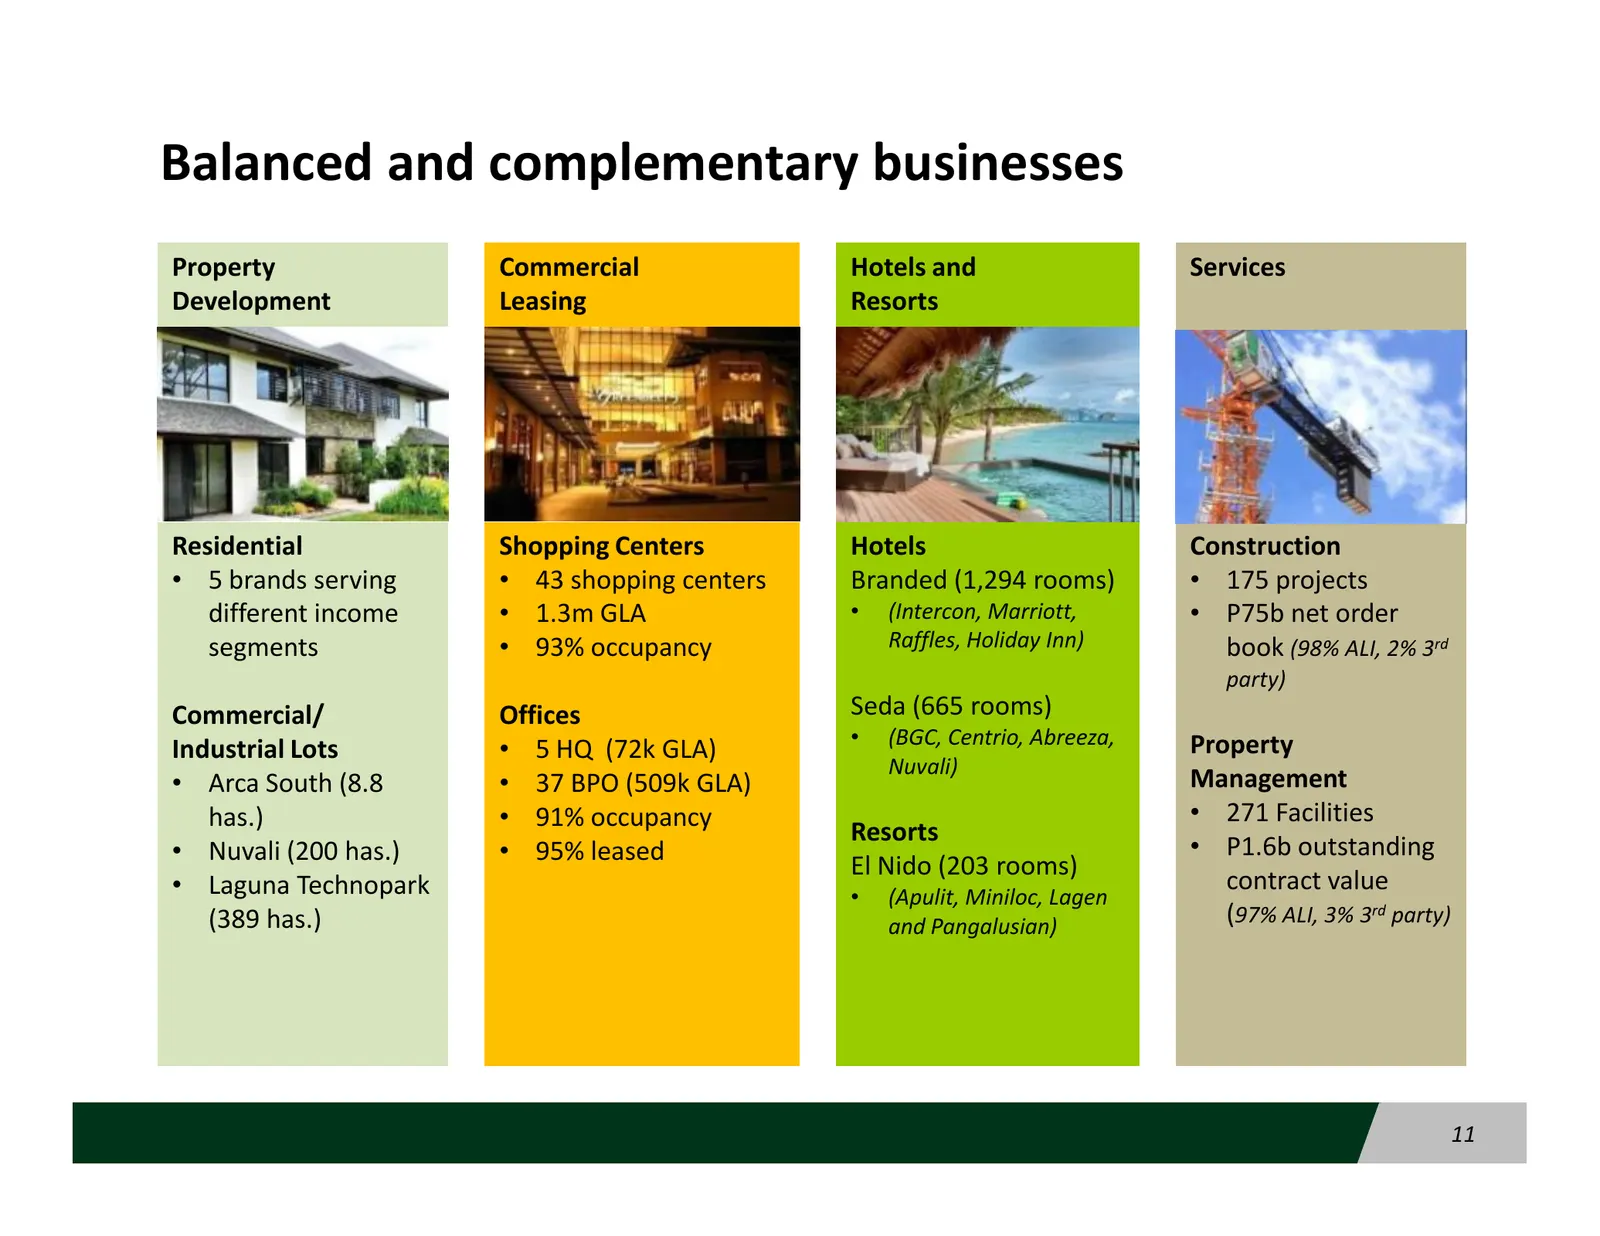
Slide 11: Balanced and complementary businesses
Balanced and complementary businesses Property Commercial Hotels and Services Development Leasing Resorts Residential Shopping Centers Hotels Construction • 5 brands serving • 43 shopping centers Branded (1,294 rooms) • 175 projects different income • 1.3m GLA • (Intercon, Marriott, • P75b net order
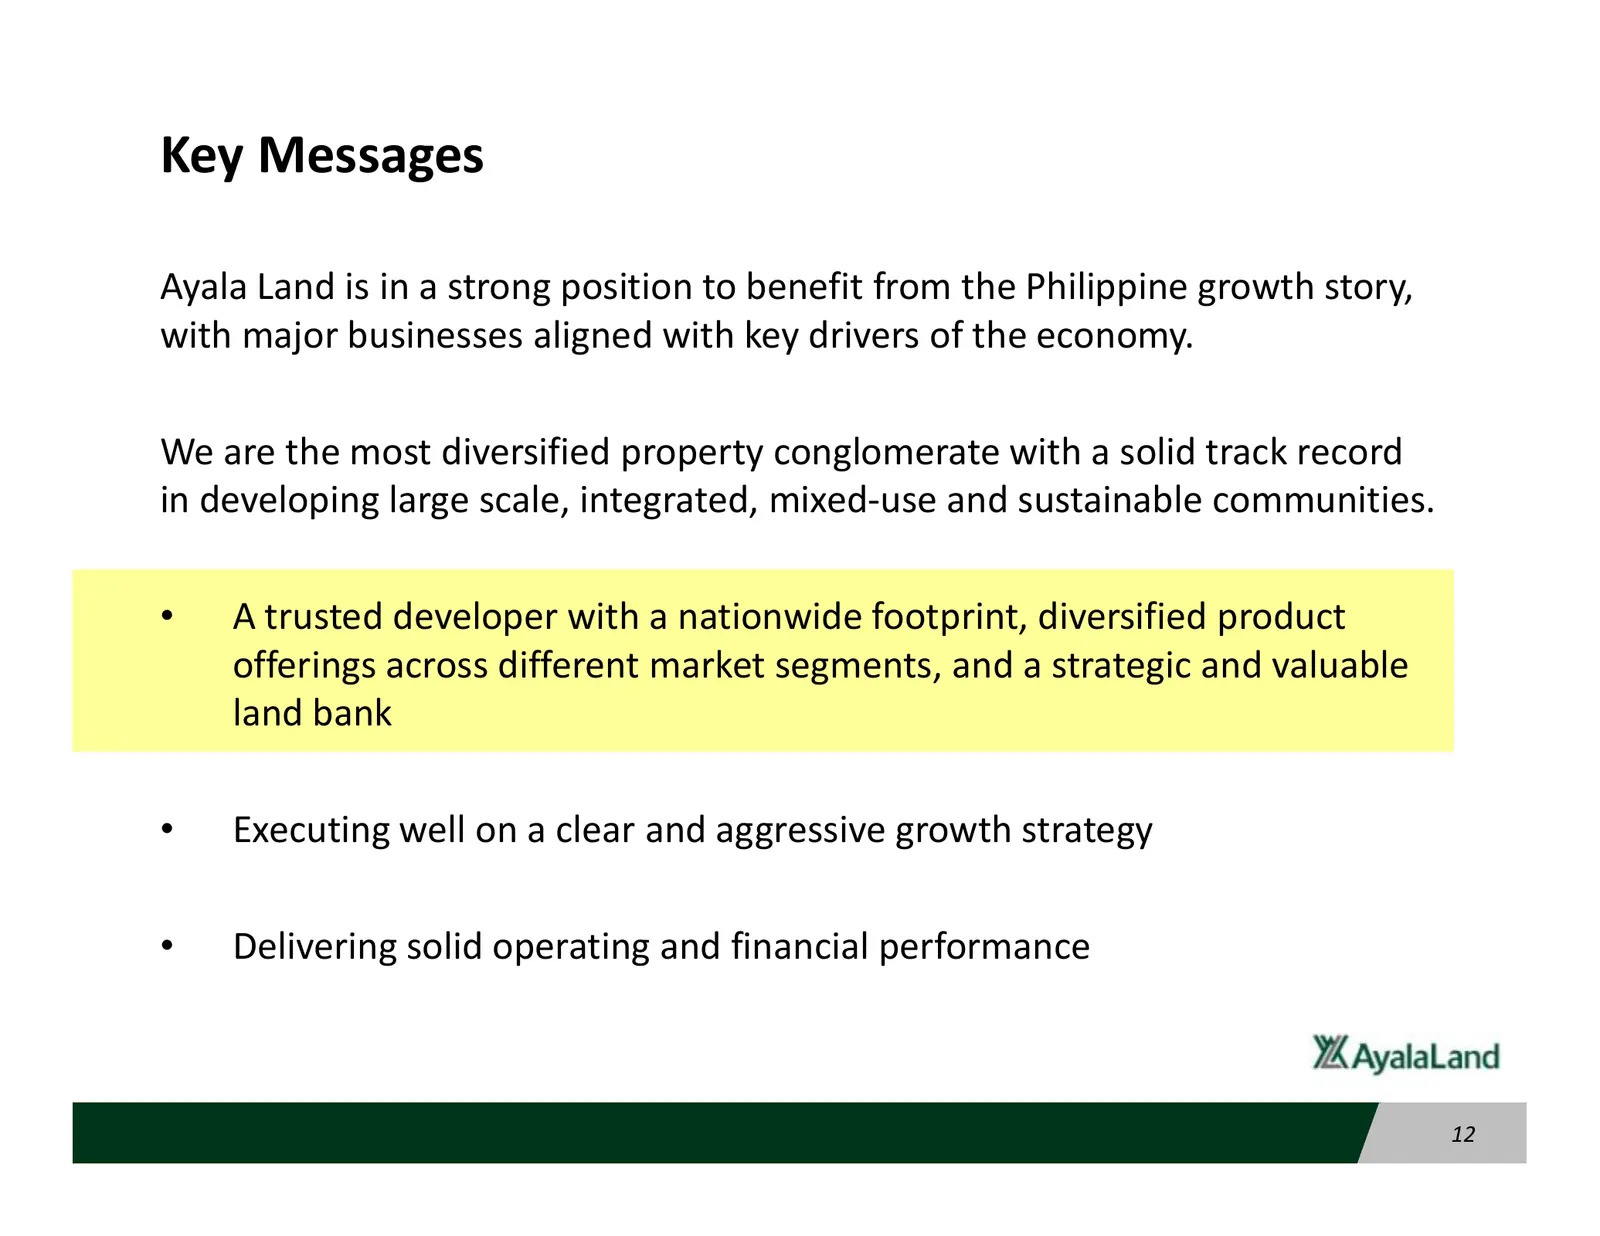
Slide 12: Key Messages
Key Messages Ayala Land is in a strong position to benefit from the Philippine growth story, with major businesses aligned with key drivers of the economy. We are the most diversified property conglomerate with a solid track record in developing large scale, integrated, mixed-use and sustainable com
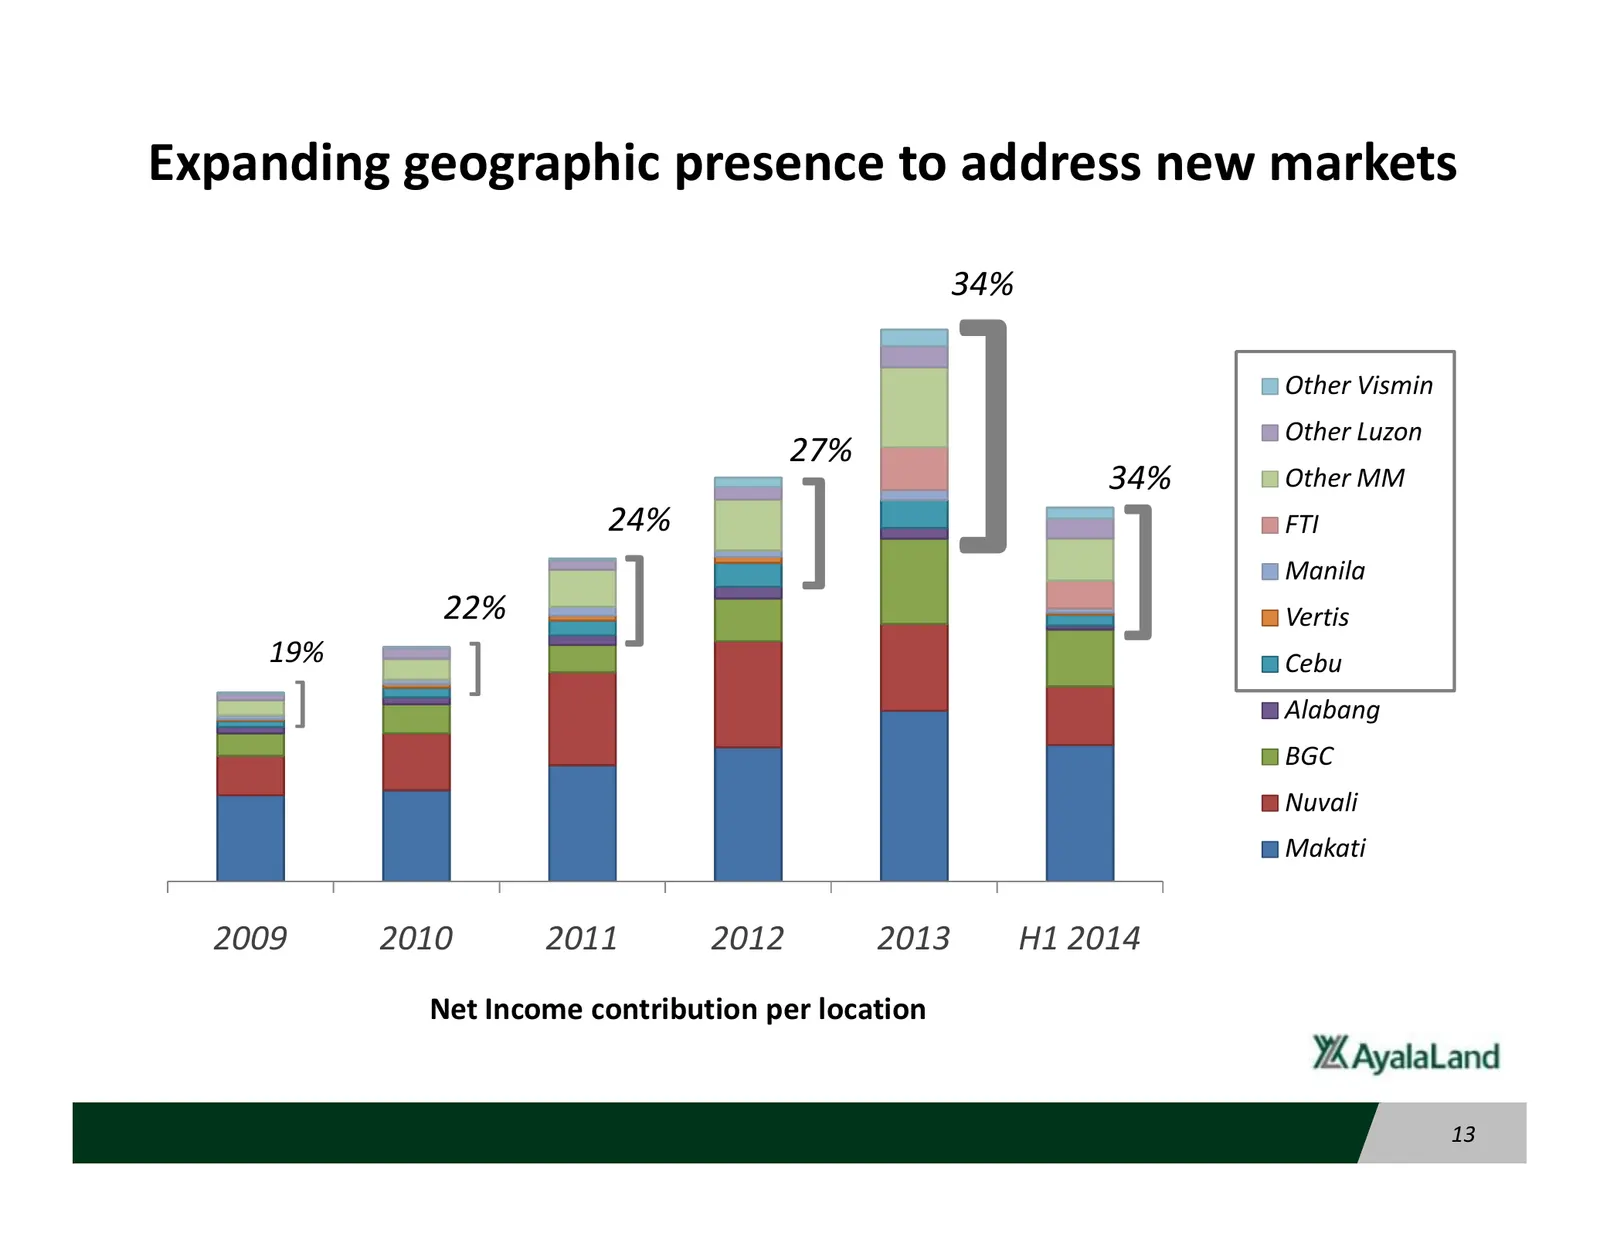
Slide 13: Expanding geographic presence to address new markets
Expanding geographic presence to address new markets 34% 22% 24% ] ] 27% ] ] 34% Other Vismin Other Luzon Other MM FTI Manila Vertis 19% ] Cebu ] Alabang BGC Nuvali Makati 2009 2010 2011 2012 2013 H1 2014 Net Income contribution per location 13
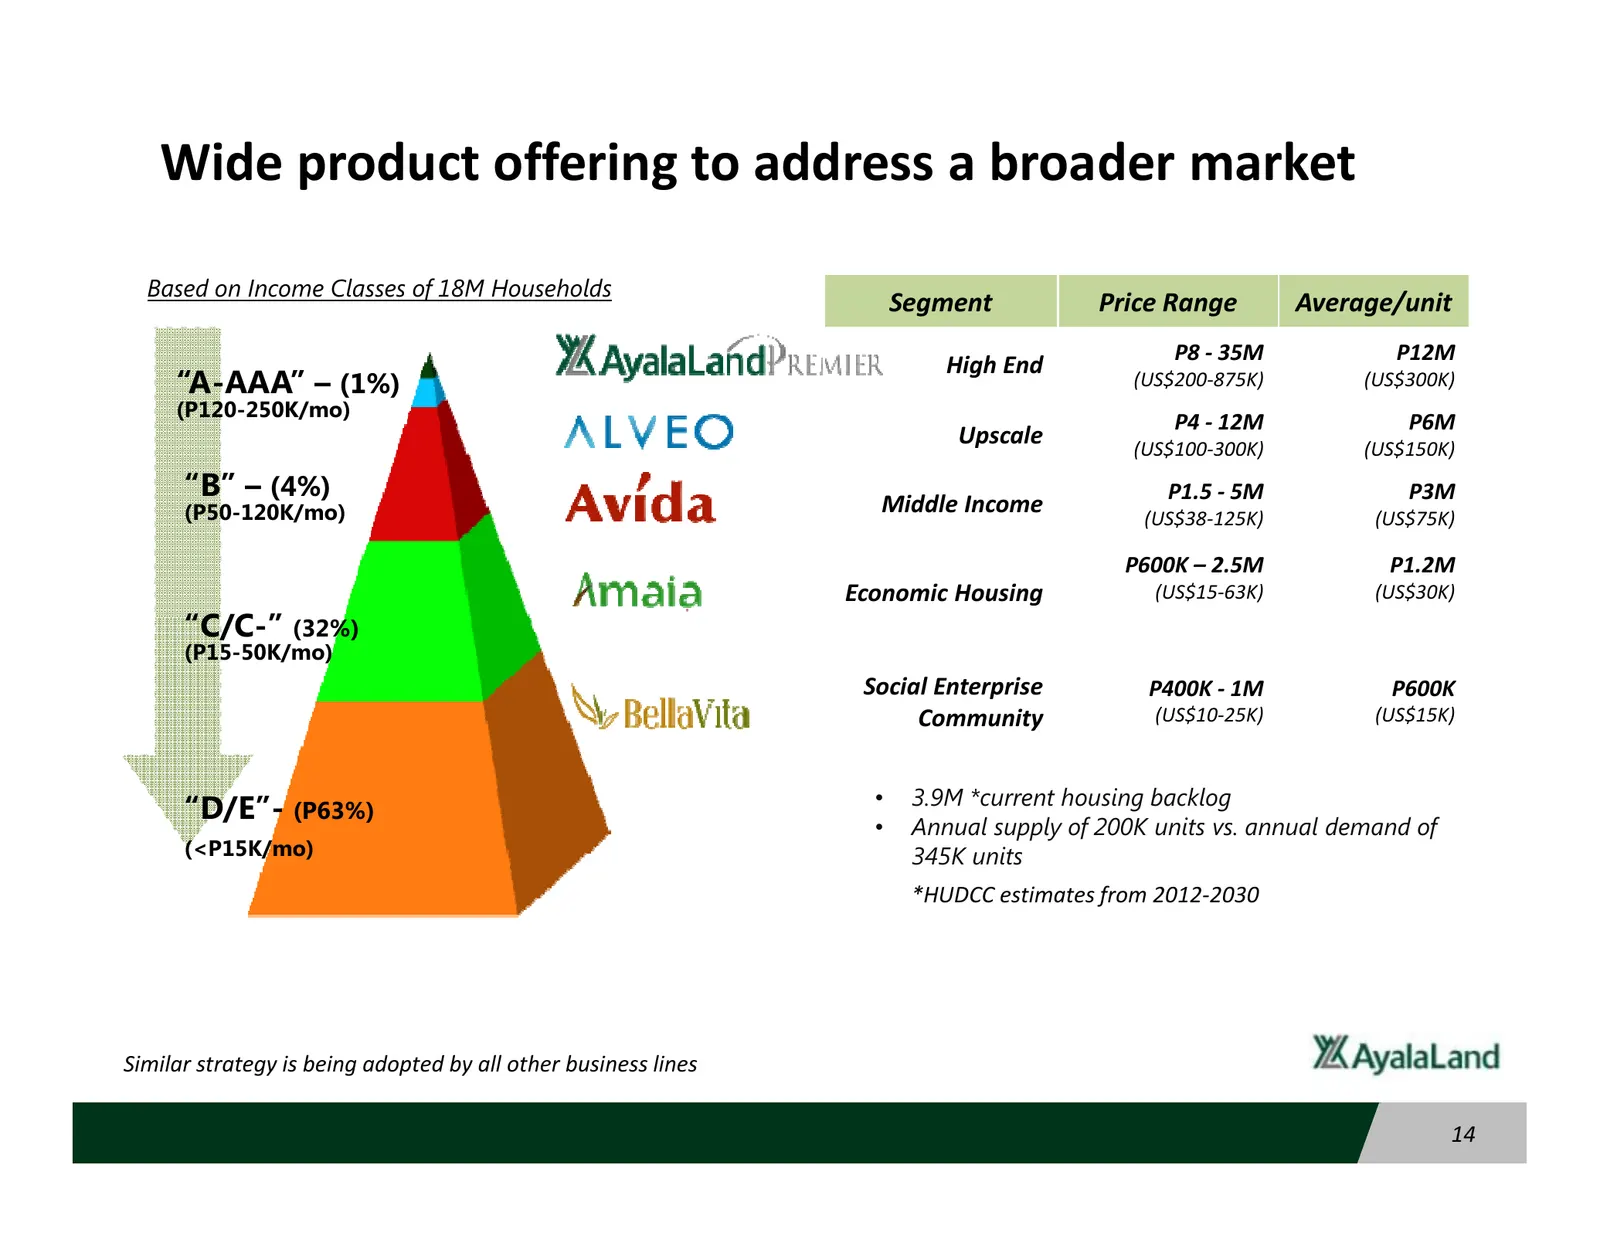
Slide 14: Wide product offering to address a broader market
Wide product offering to address a broader market Based on Income Classes of 18M Households Segment Price Range Average/unit P8 - 35M P12M High End “A-AAA” – (1%) (US$200-875K) (US$300K) (P120-250K/mo) P4 - 12M P6M Upscale (US$100-300K) (US$150K) “B” – (4%) Middle Income P1.5 - 5M P3M (P50-120K/mo)
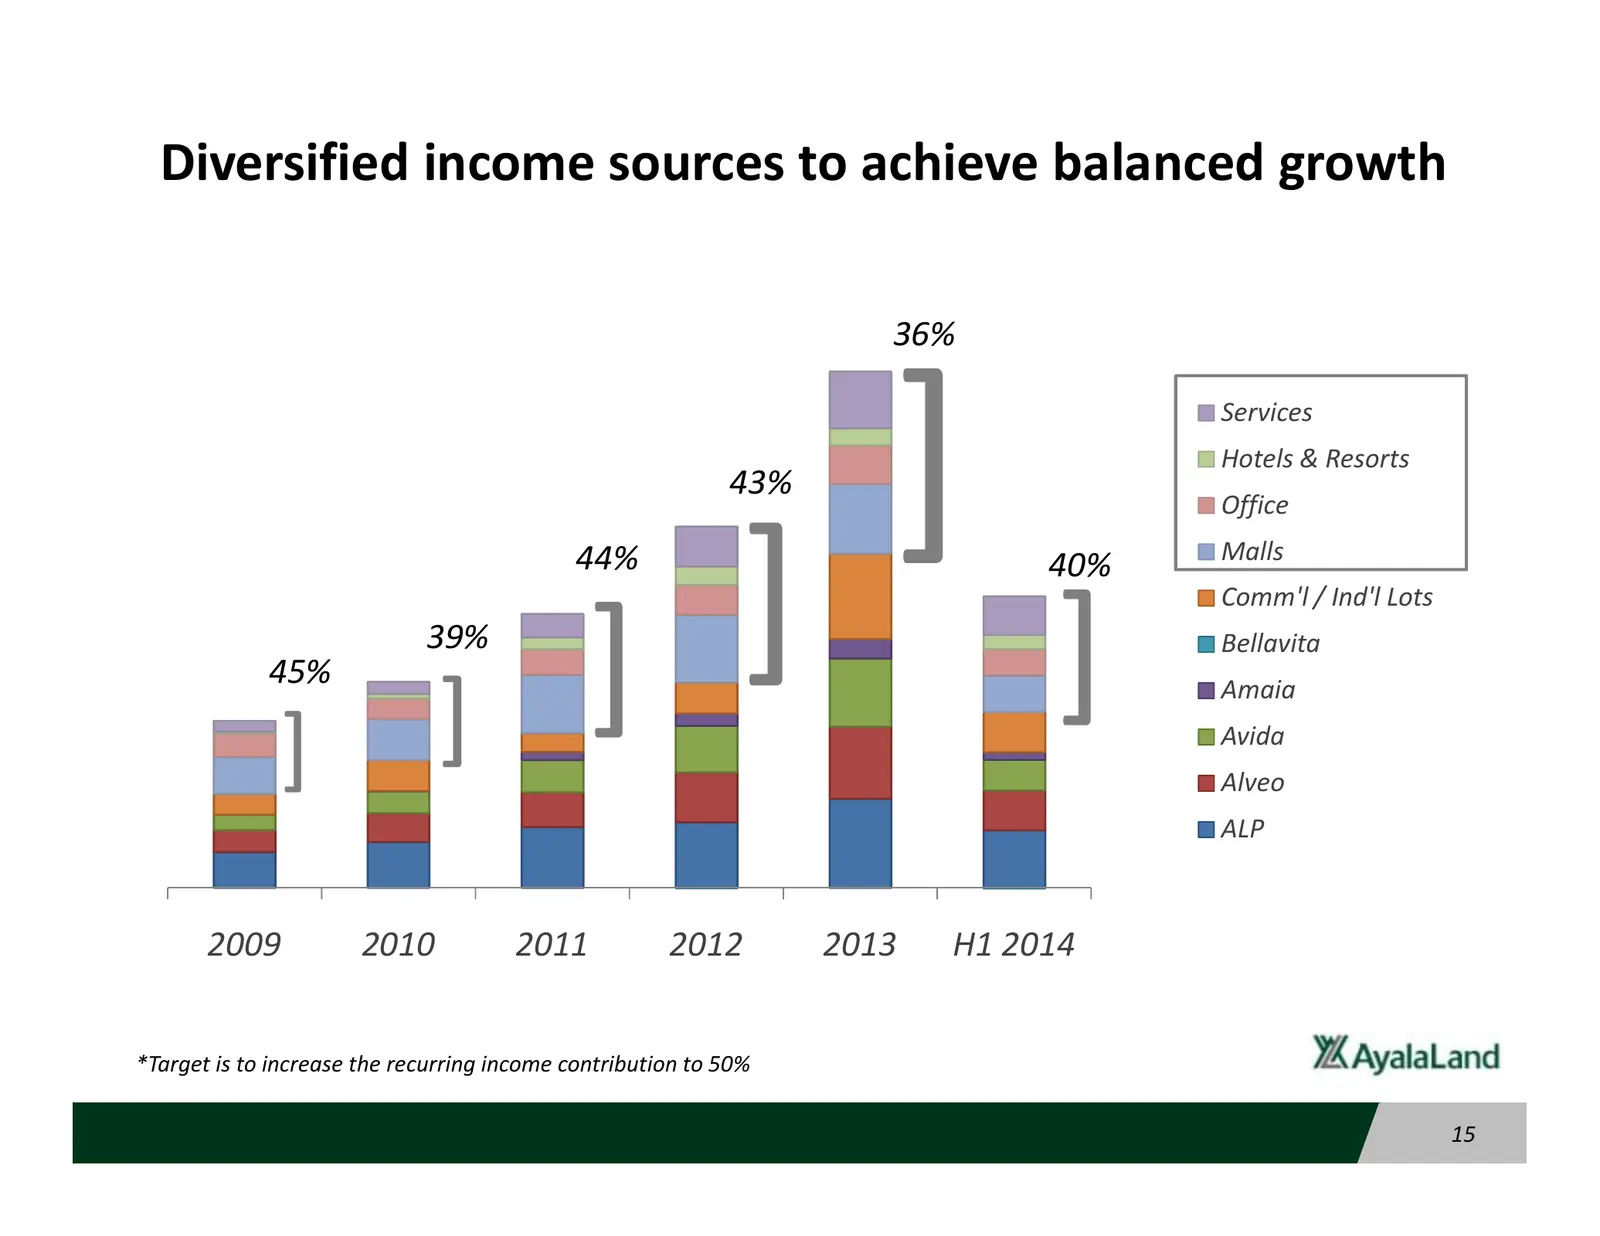
Slide 15: Diversified income sources to achieve balanced growth
Diversified income sources to achieve balanced growth 36% 43% ] Services Hotels & Resorts Office 45% 39% ] ] ] 44% 40% ] Malls Comm'l / Ind'l Lots Bellavita Amaia ] Avida Alveo ALP 2009 2010 2011 2012 2013 H1 2014 *Target is to increase the recurring income contribution to 50% 15
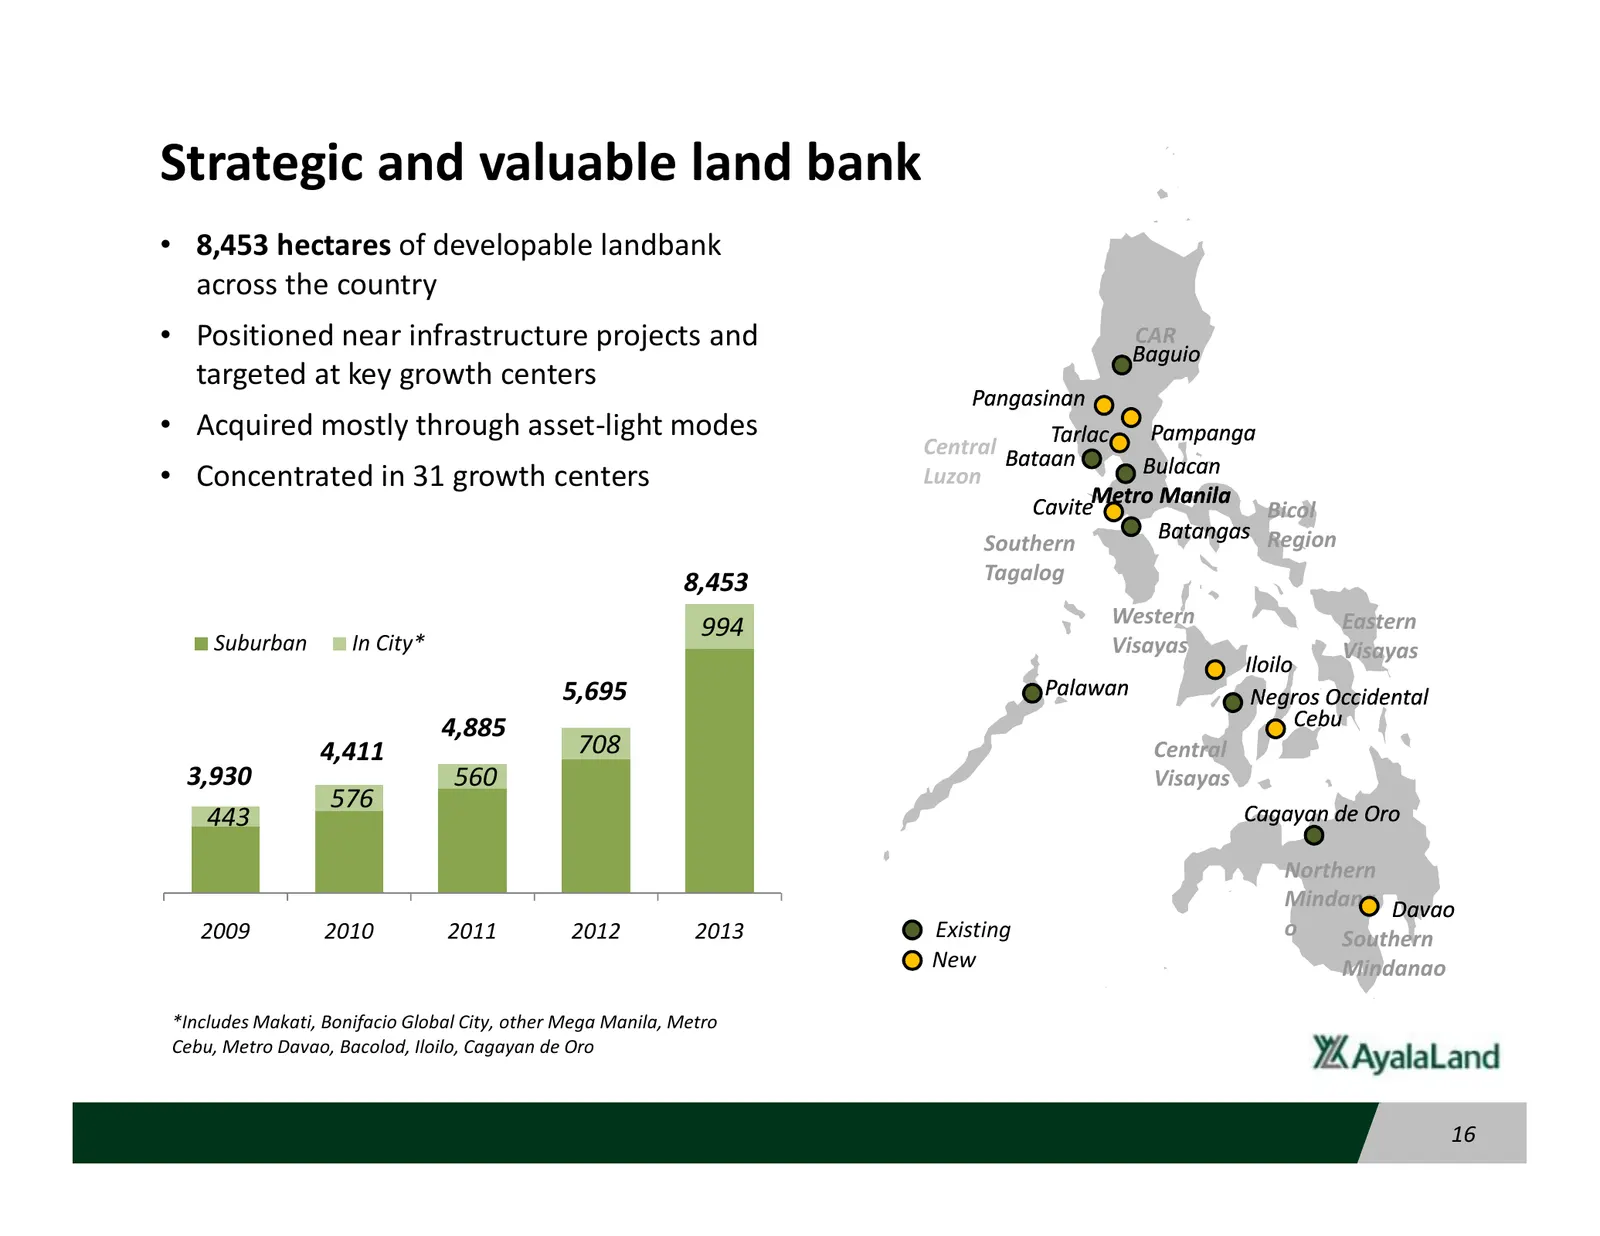
Slide 16: Strategic and valuable land bank
Strategic and valuable land bank • 8,453 hectares of developable landbank across the country • Positioned near infrastructure projects and CAR Baguio targeted at key growth centers Pangasinan • Acquired mostly through asset-light modes Tarlac Pampanga Central Bataan Bulacan • Concentrated in 31 grow
Slide 17: Key Messages
Key Messages Ayala Land is in a strong position to benefit from the Philippine growth story, with major businesses aligned with key drivers of the economy. We are the most diversified property conglomerate with a solid track record in developing large scale, integrated, mixed-use and sustainable com
Slide 18: Earnings target surpassed on the 4th year of our plan
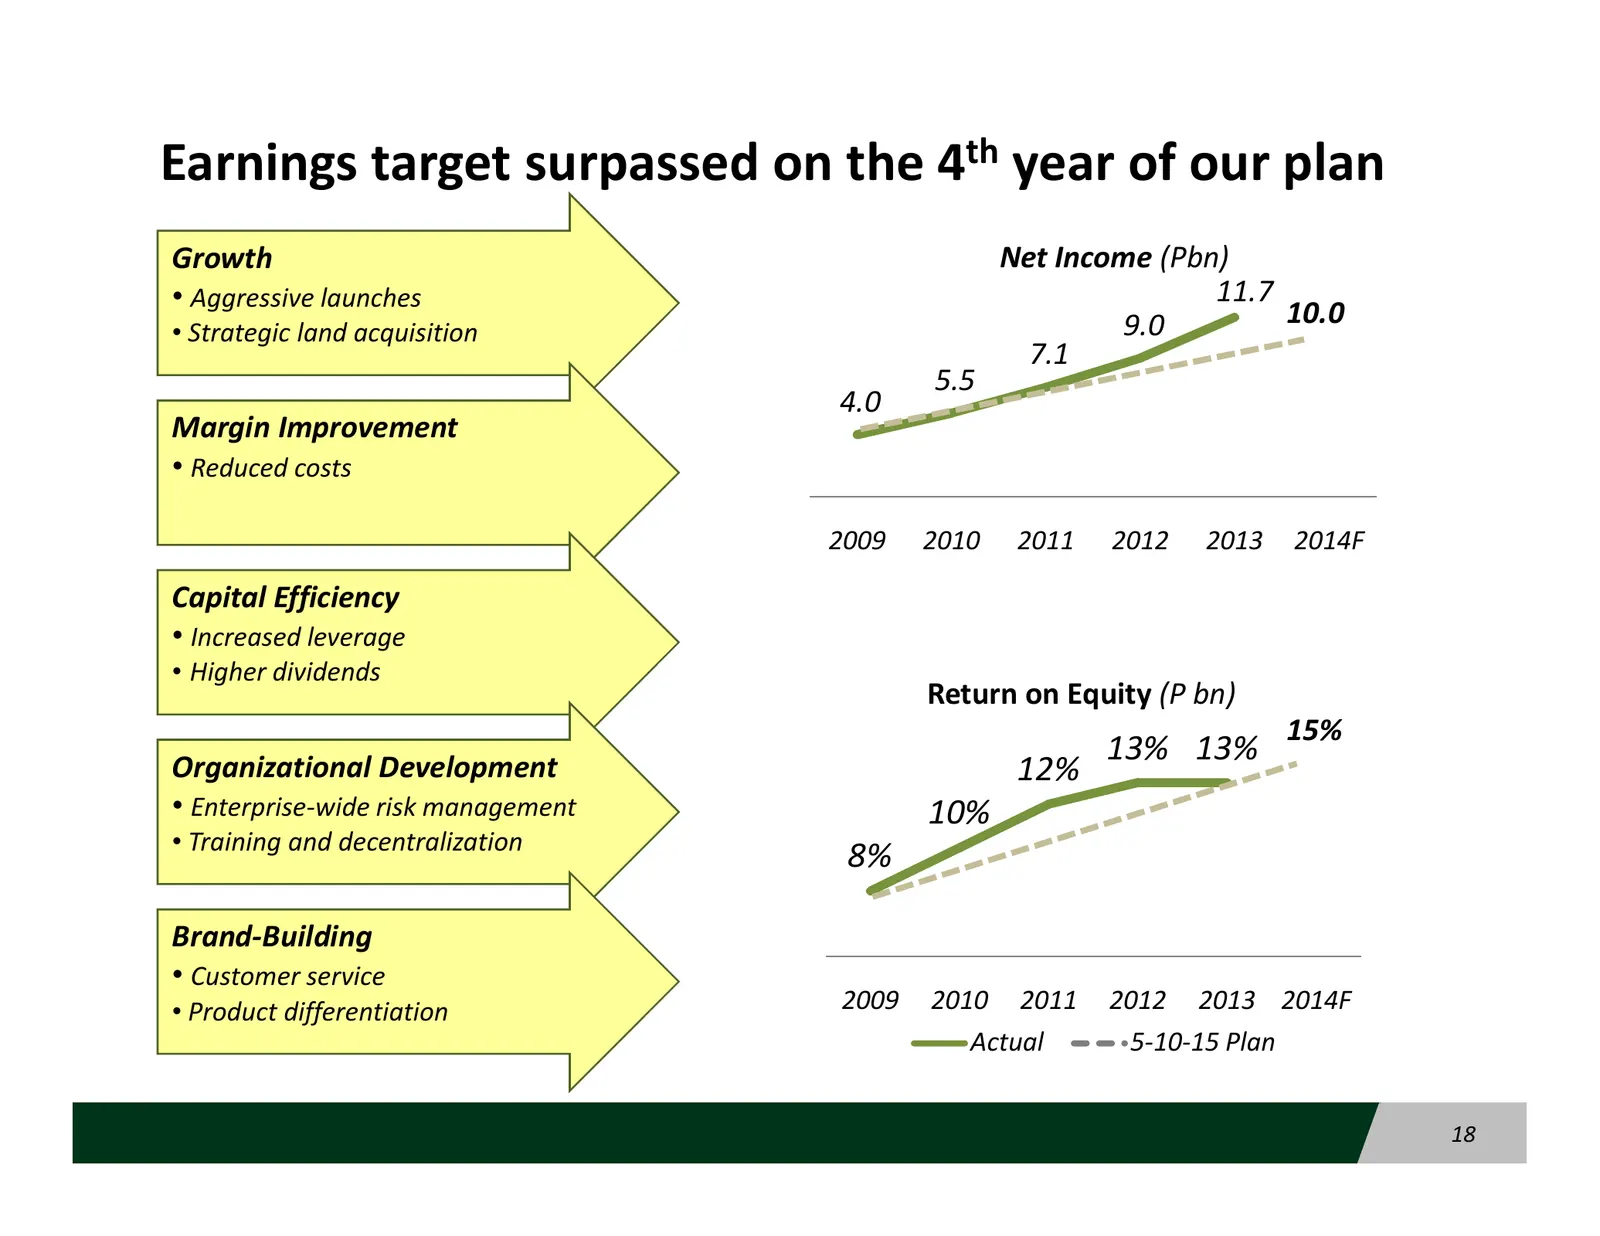
Earnings target surpassed on the 4th year of our plan Growth Net Income (Pbn) • Aggressive launches 11.7 9.0 10.0 • Strategic land acquisition 7.1 5.5 4.0 Margin Improvement • Reduced costs 2009 2010 2011 2012 2013 2014F Capital Efficiency • Increased leverage • Higher dividends Return on Equity (P
Slide 19: On track with building up the investment portfolio
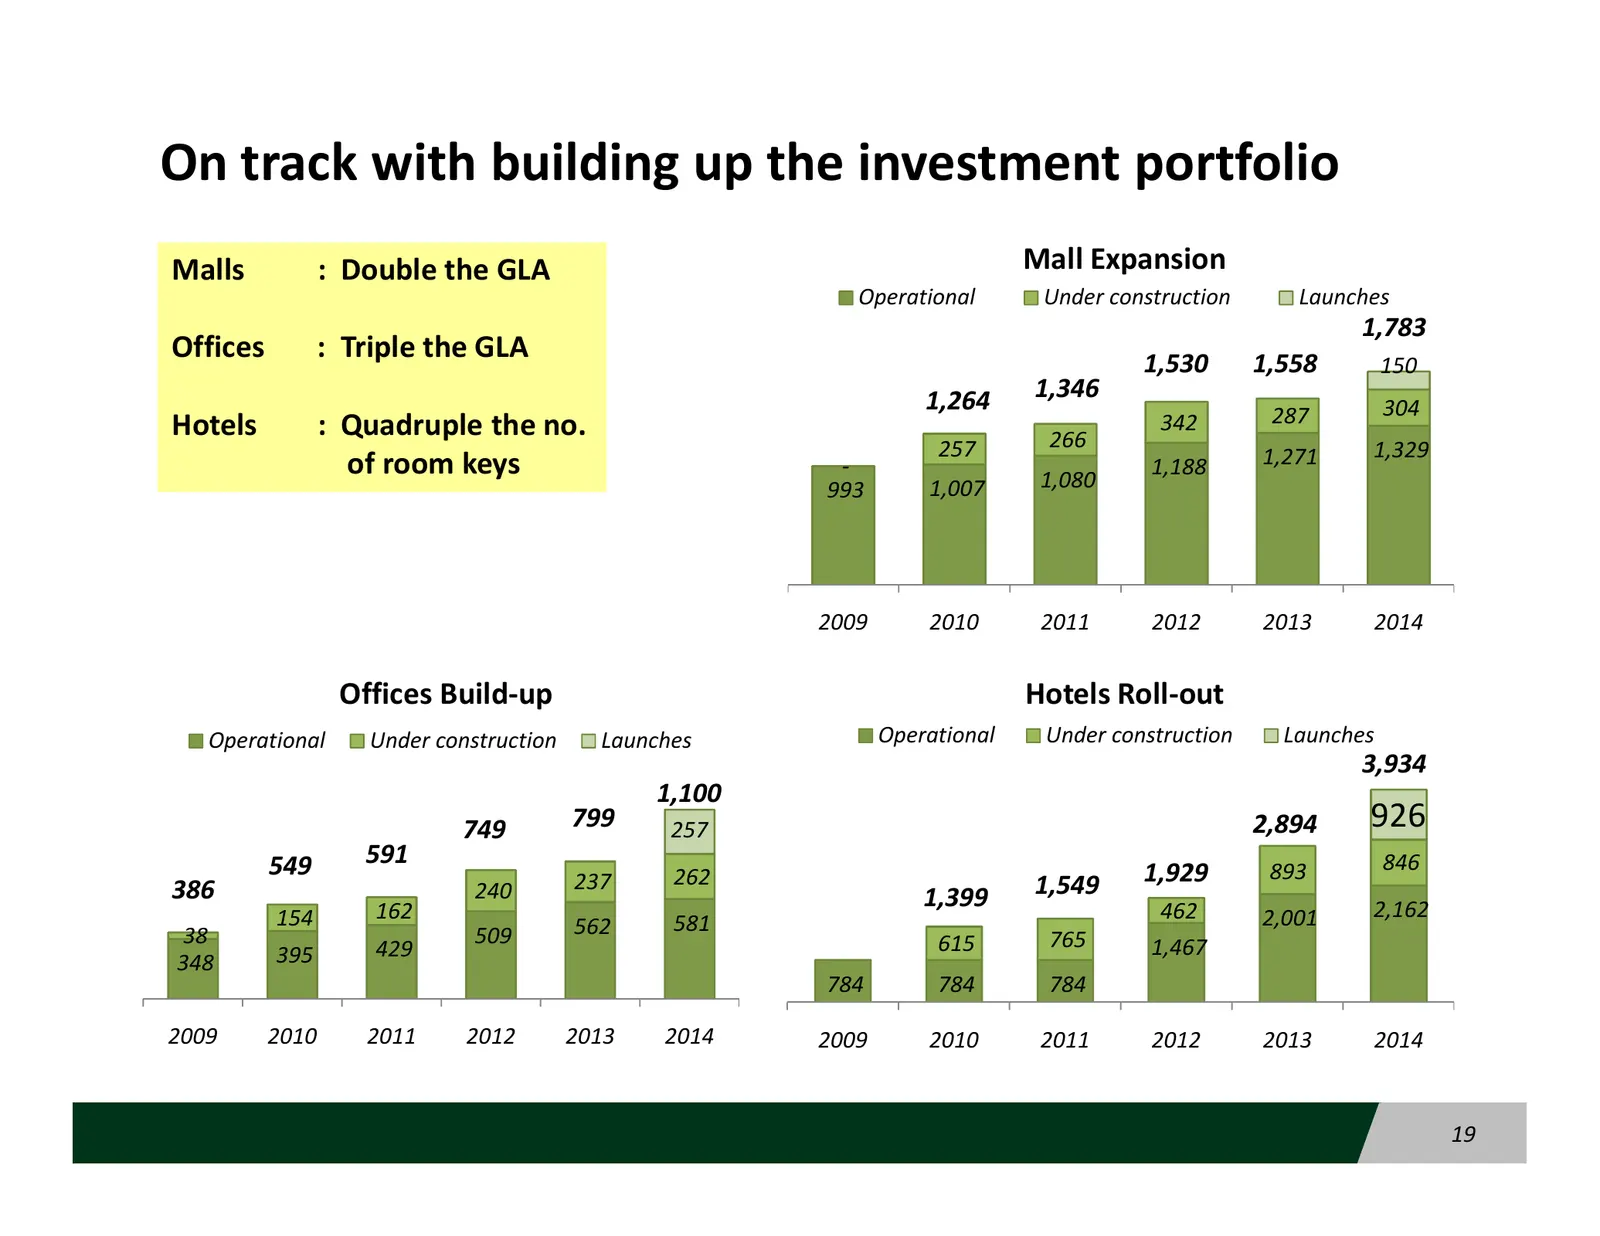
On track with building up the investment portfolio Malls : Double the GLA Mall Expansion Operational Under construction Launches 1,783 Offices : Triple the GLA 1,530 1,558 150 1,264 1,346 287 304 Hotels : Quadruple the no. 266 342 257 1,271 1,329 of room keys - 1,080 1,188 993 1,007 2009 2010 2011 2
Slide 20: Effective execution through "subsidiarization"
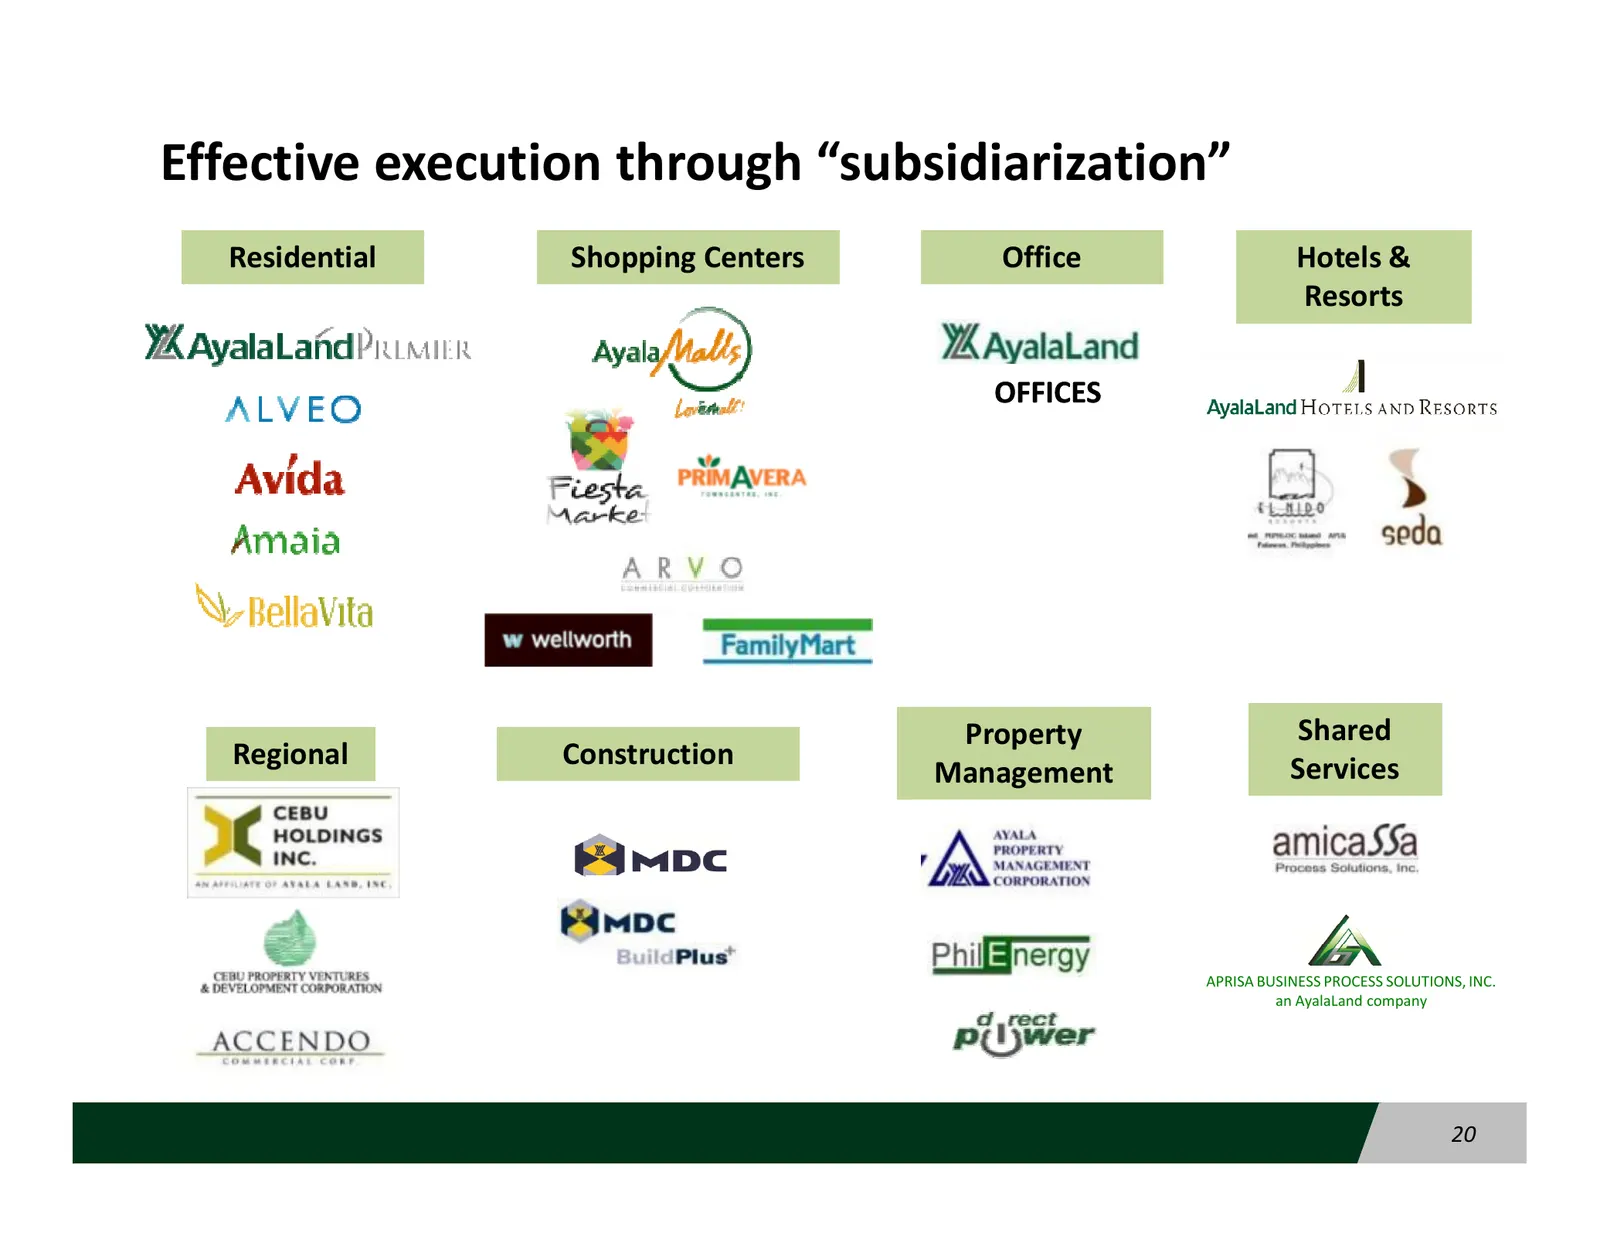
Effective execution through “subsidiarization” Residential Shopping Centers Office Hotels & Resorts OFFICES Property Shared Regional Construction Services Management APRISA BUSINESS PROCESS SOLUTIONS, INC. an AyalaLand company 20
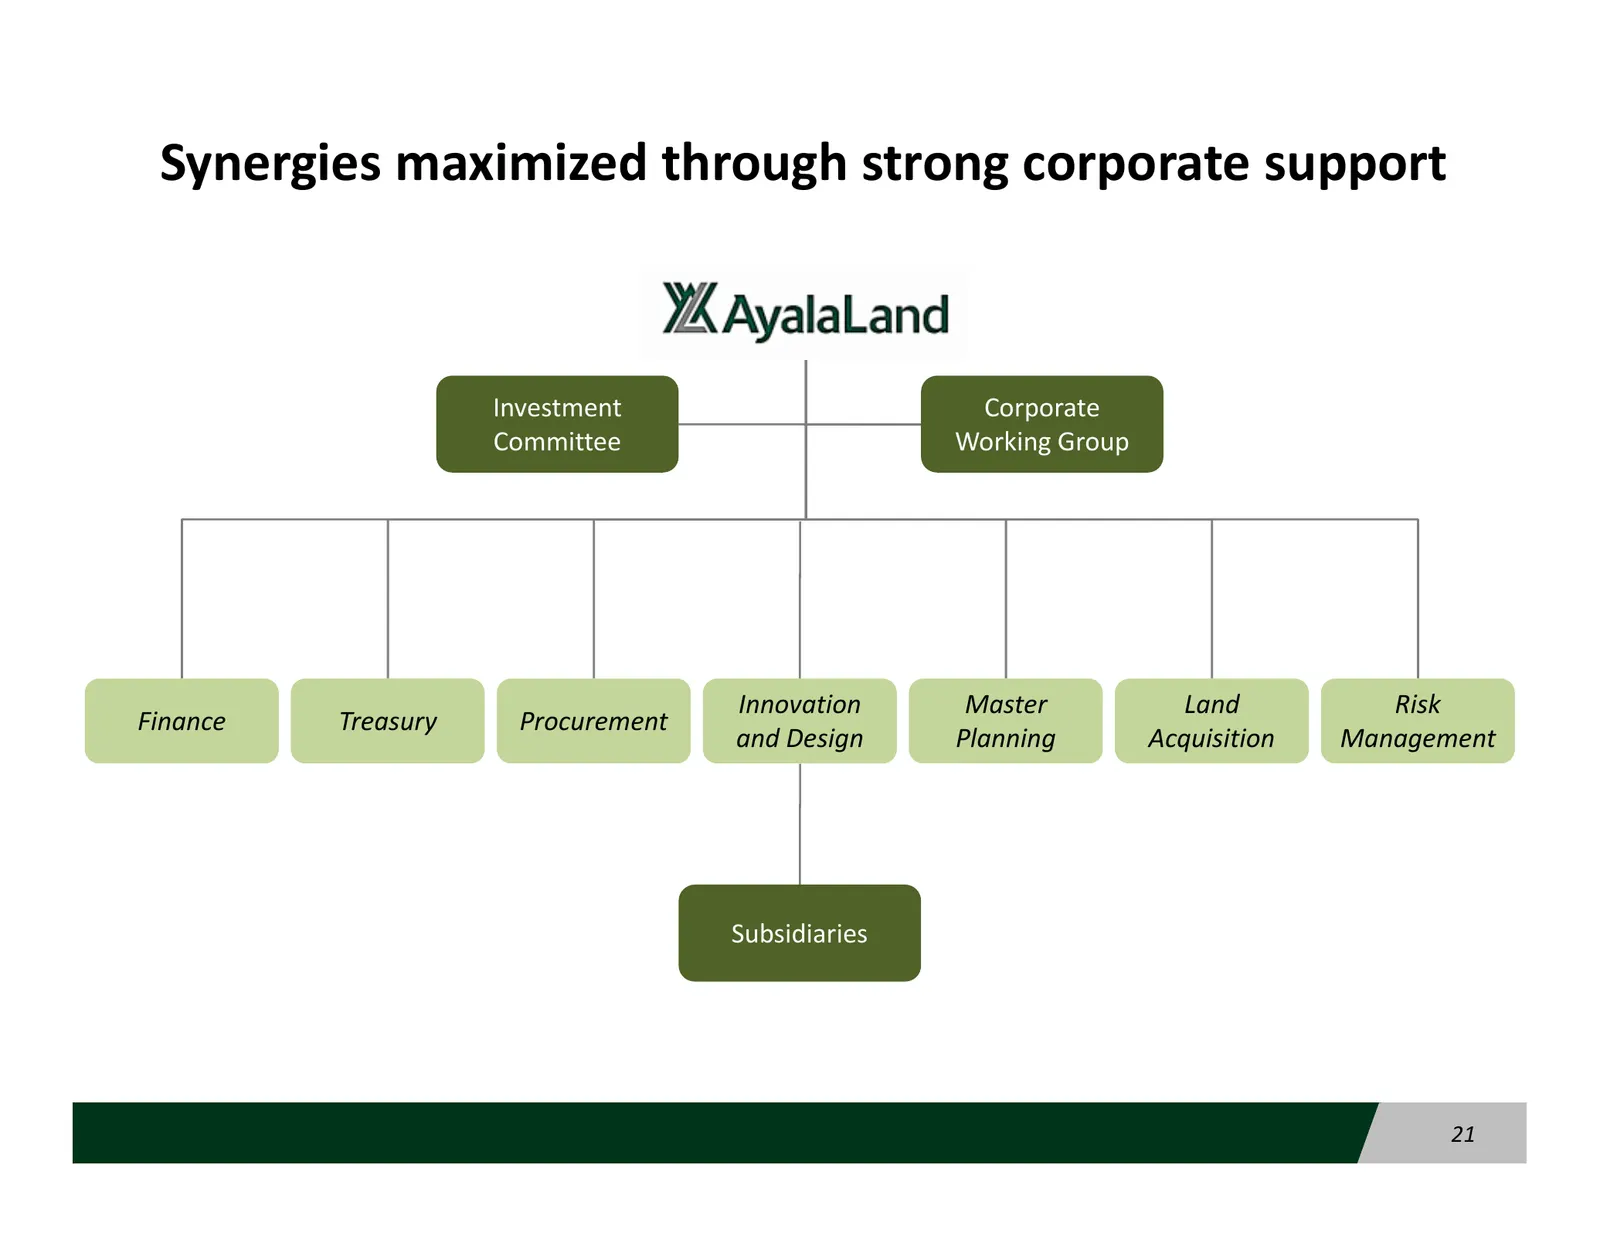
Slide 21: Synergies maximized through strong corporate support
Synergies maximized through strong corporate support Investment Corporate Committee Working Group Innovation Master Land Risk Finance Treasury Procurement and Design Planning Acquisition Management Subsidiaries 21
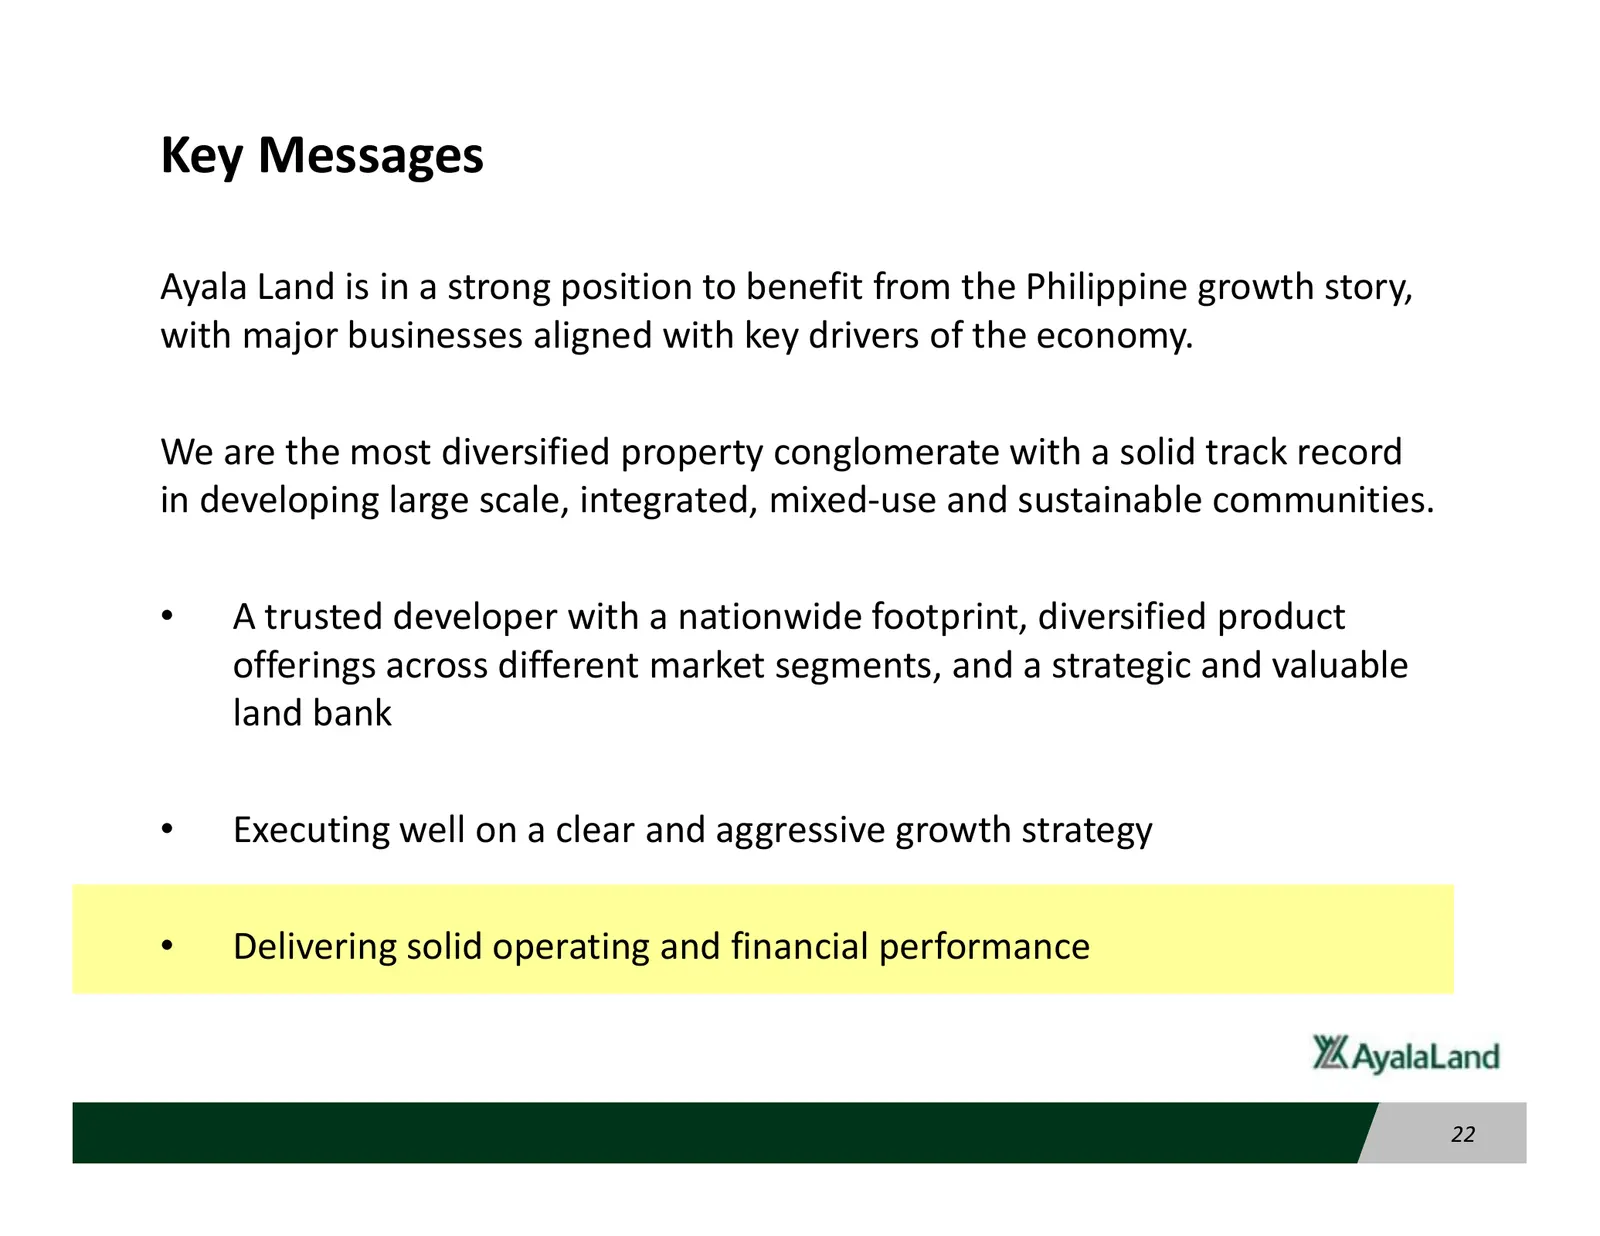
Slide 22: Key Messages
Key Messages Ayala Land is in a strong position to benefit from the Philippine growth story, with major businesses aligned with key drivers of the economy. We are the most diversified property conglomerate with a solid track record in developing large scale, integrated, mixed-use and sustainable com
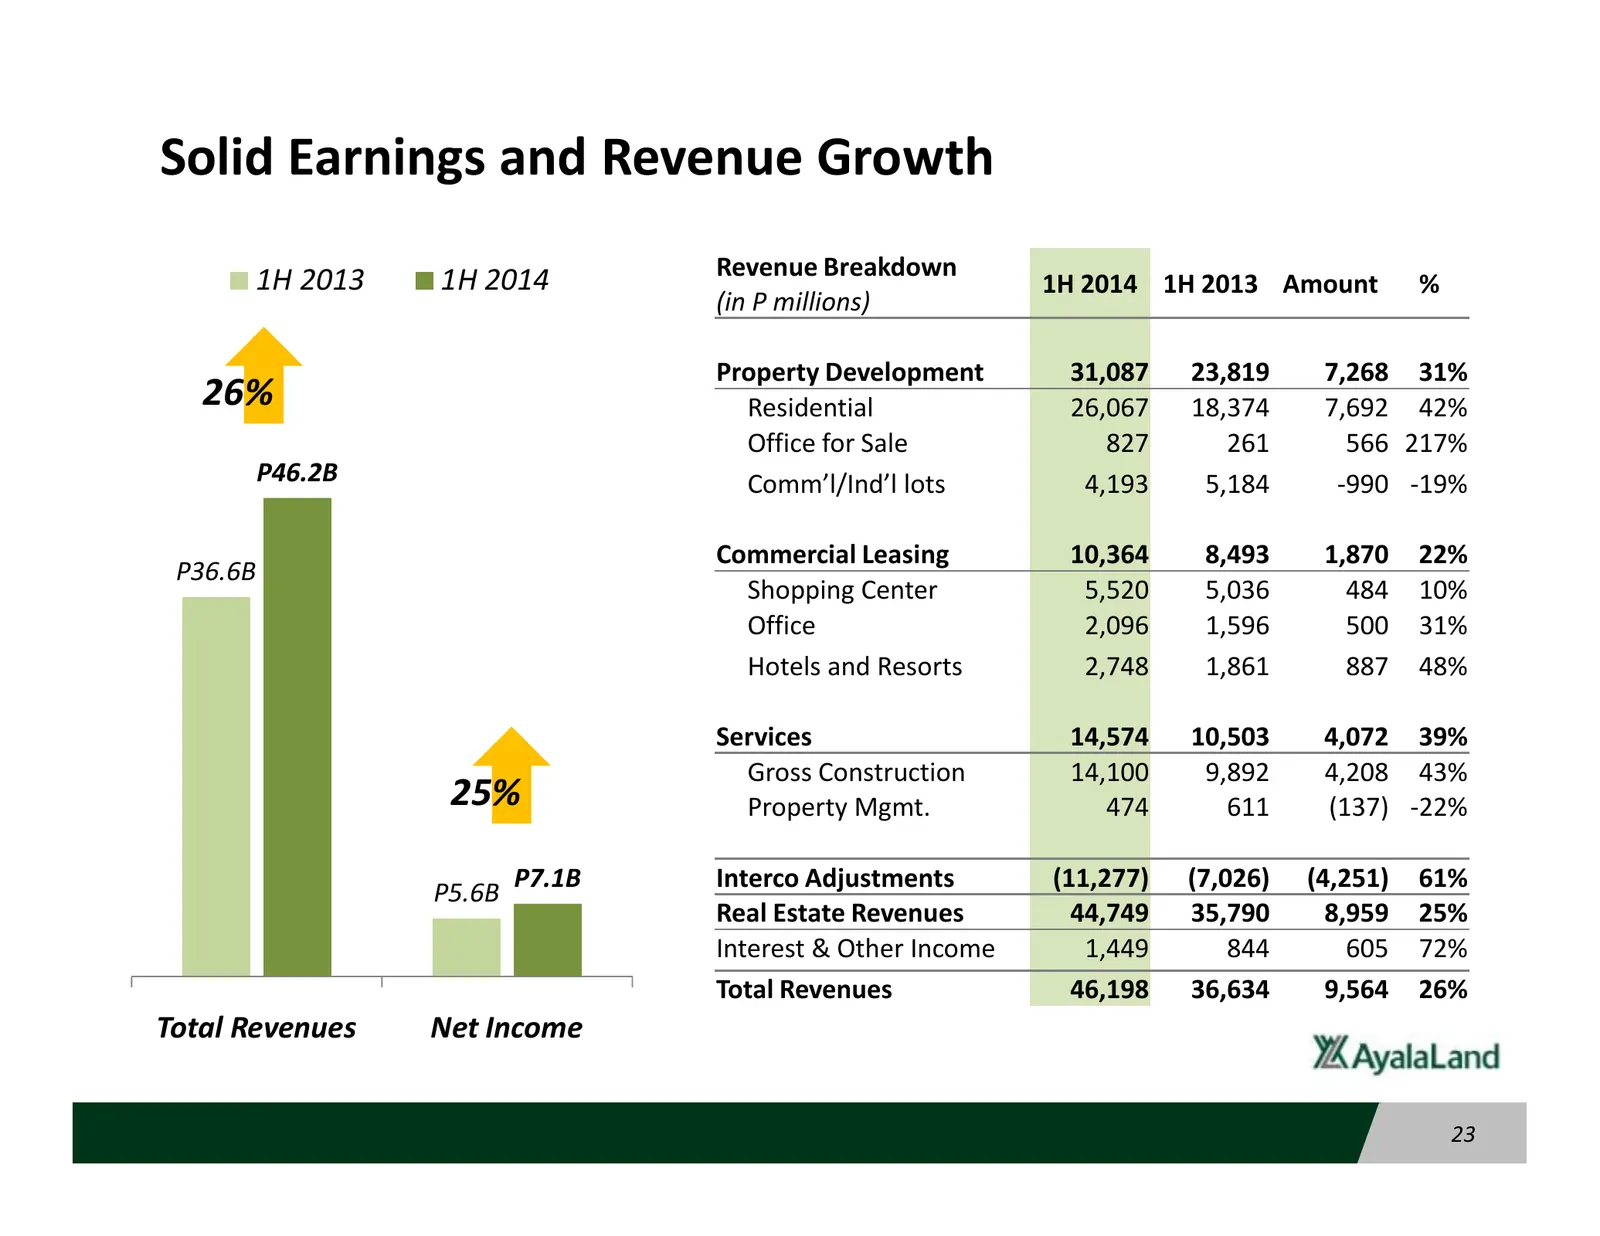
Slide 23: Solid Earnings and Revenue Growth
Solid Earnings and Revenue Growth 1H 2013 1H 2014 Revenue Breakdown 1H 2014 1H 2013 Amount % (in P millions) Property Development 31,087 23,819 7,268 31% 26% Residential 26,067 18,374 7,692 42% Office for Sale 827 261 566 217% P46.2B Comm’l/Ind’l lots 4,193 5,184 -990 -19% Commercial Leasing 10,364
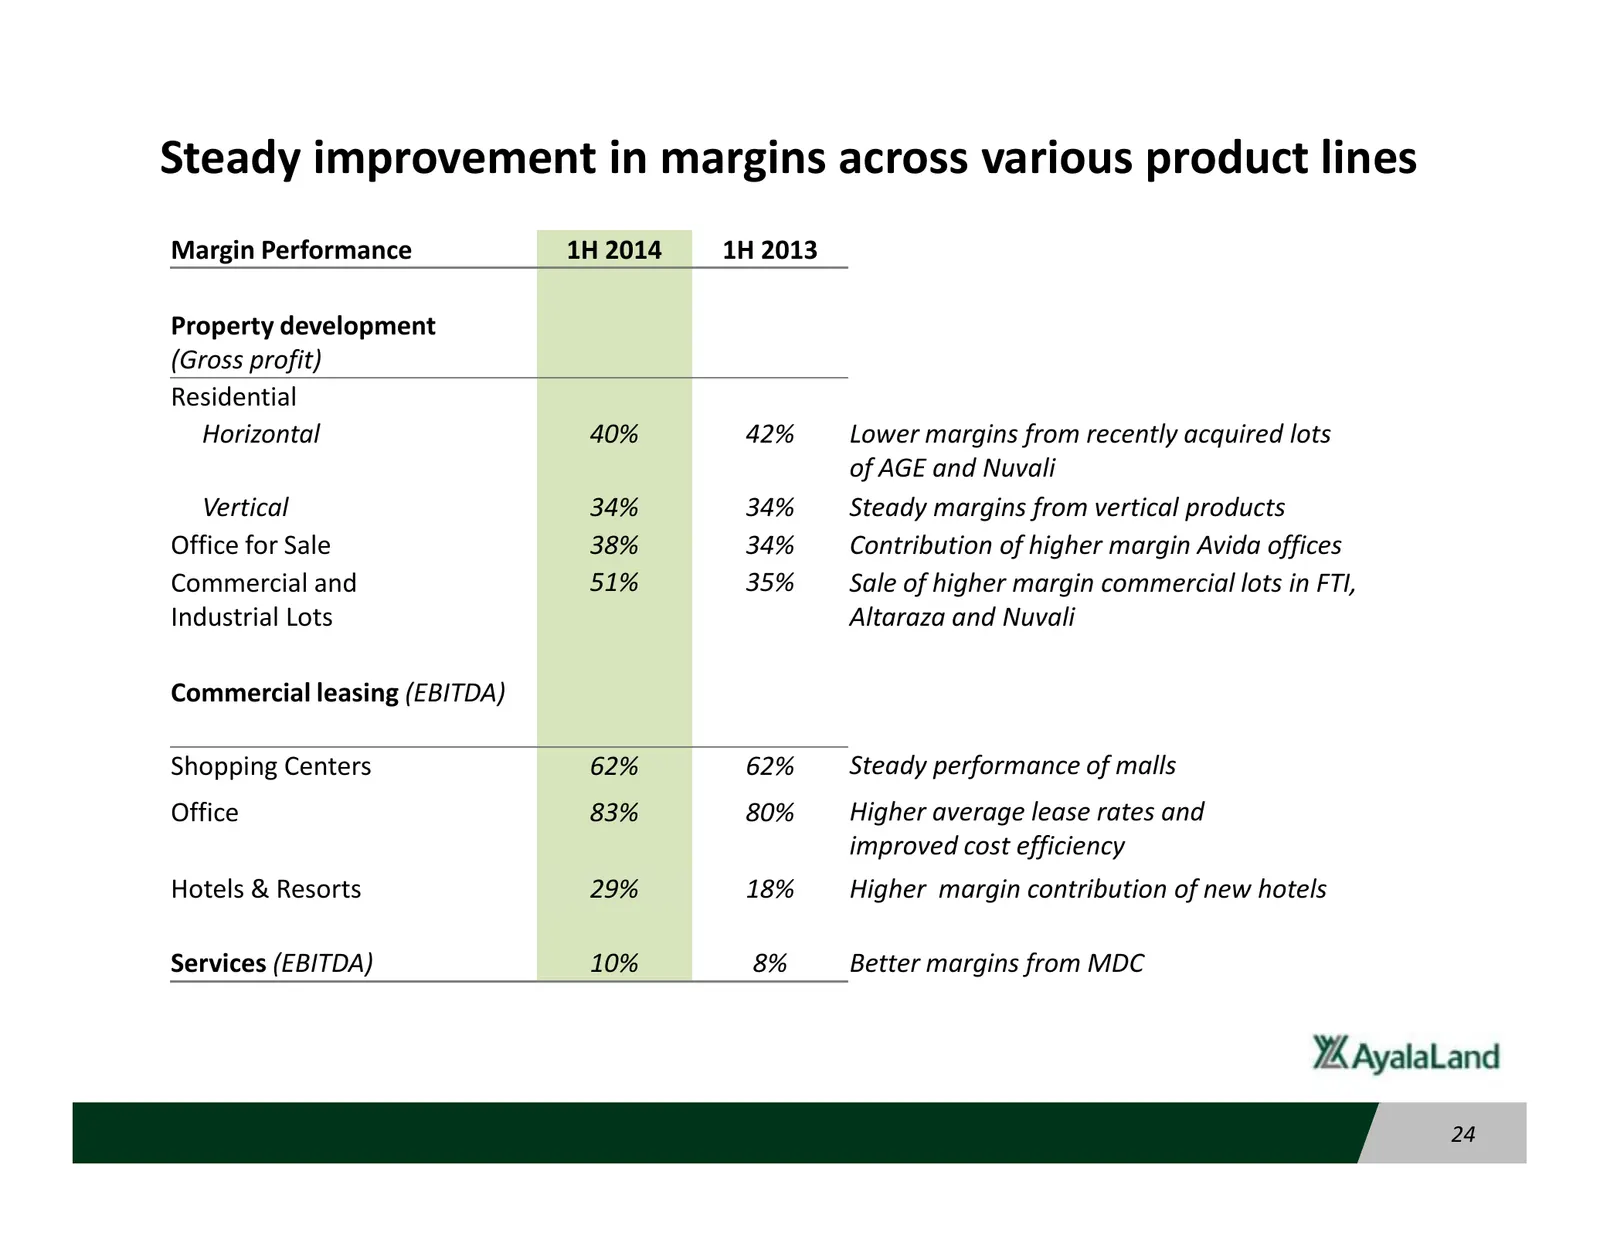
Slide 24: Steady improvement in margins across various product lines
Steady improvement in margins across various product lines Margin Performance 1H 2014 1H 2013 Property development (Gross profit) Residential Horizontal 40% 42% Lower margins from recently acquired lots of AGE and Nuvali Vertical 34% 34% Steady margins from vertical products Office for Sale 38% 34%
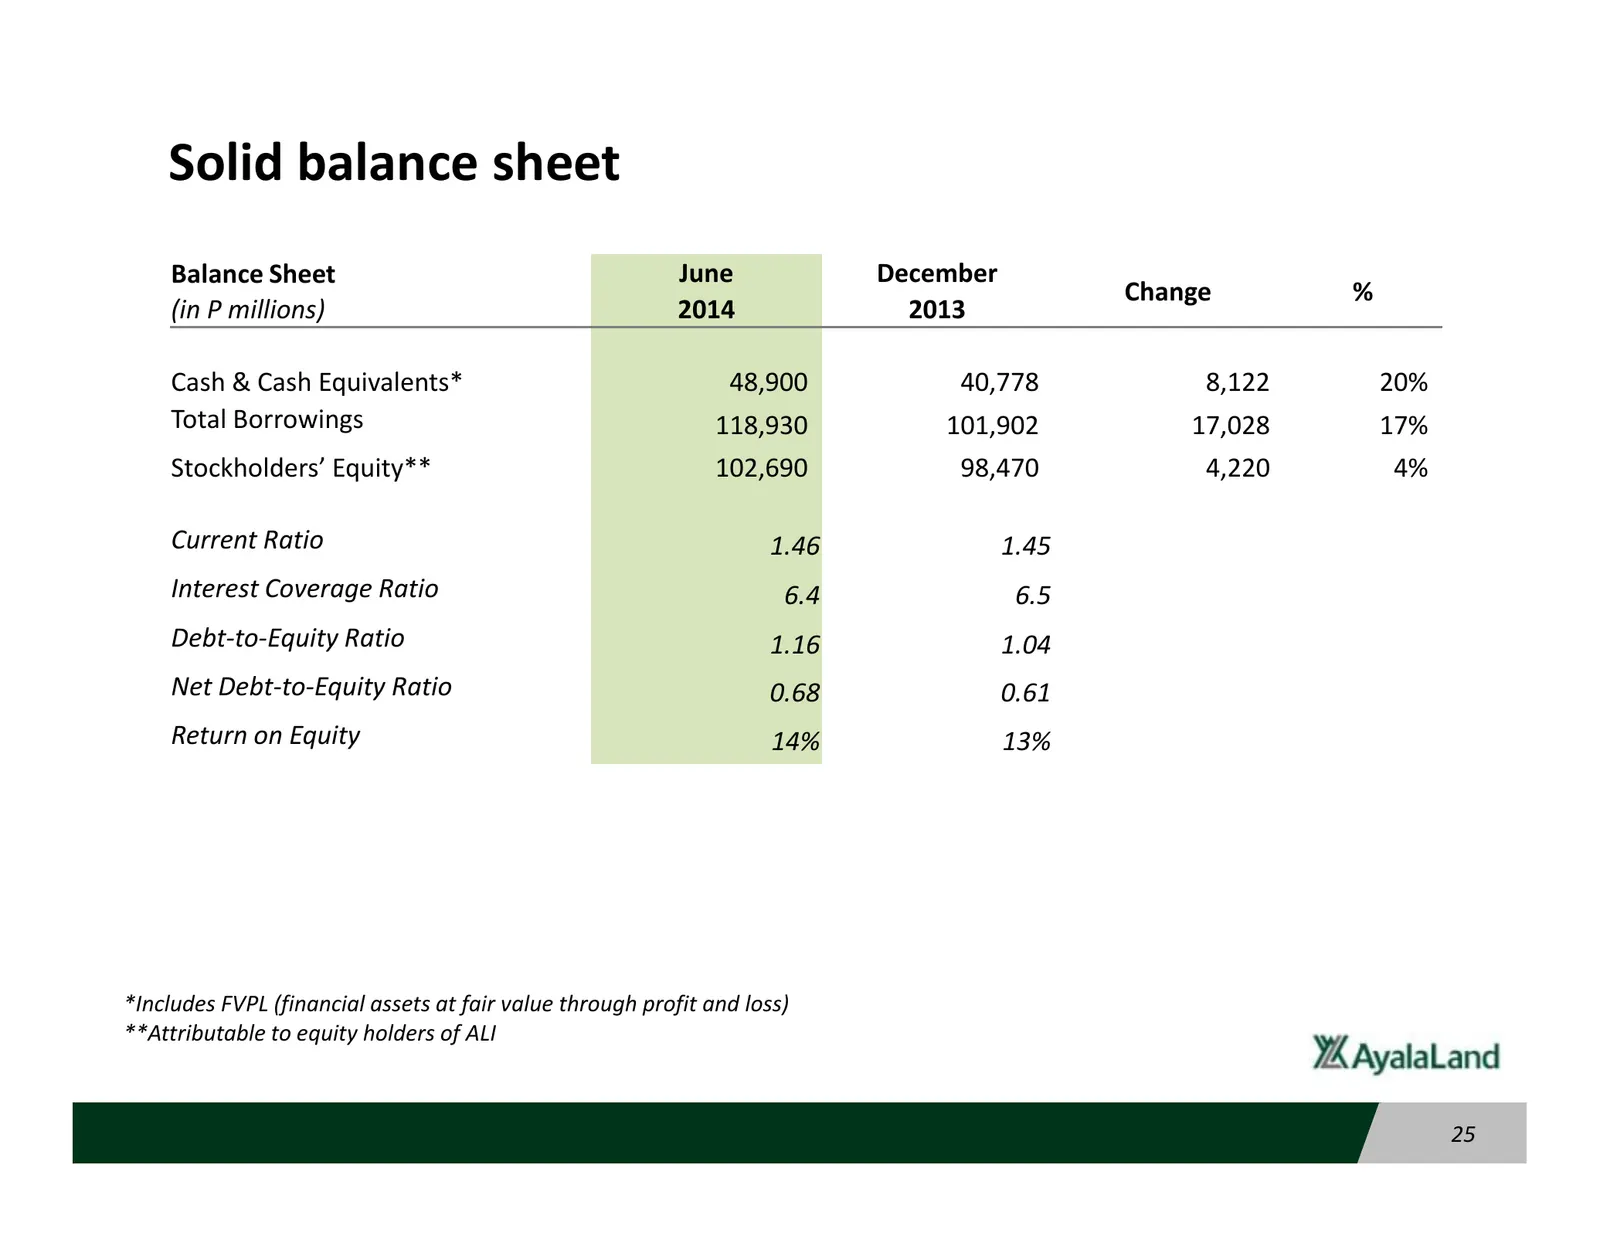
Slide 25: Solid balance sheet
Solid balance sheet Balance Sheet June December Change % (in P millions) 2014 2013 Cash & Cash Equivalents* 48,900 40,778 8,122 20% Total Borrowings 118,930 101,902 17,028 17% Stockholders’ Equity** 102,690 98,470 4,220 4% Current Ratio 1.46 1.45 Interest Coverage Ratio 6.4 6.5 Debt-to-Equity Ratio
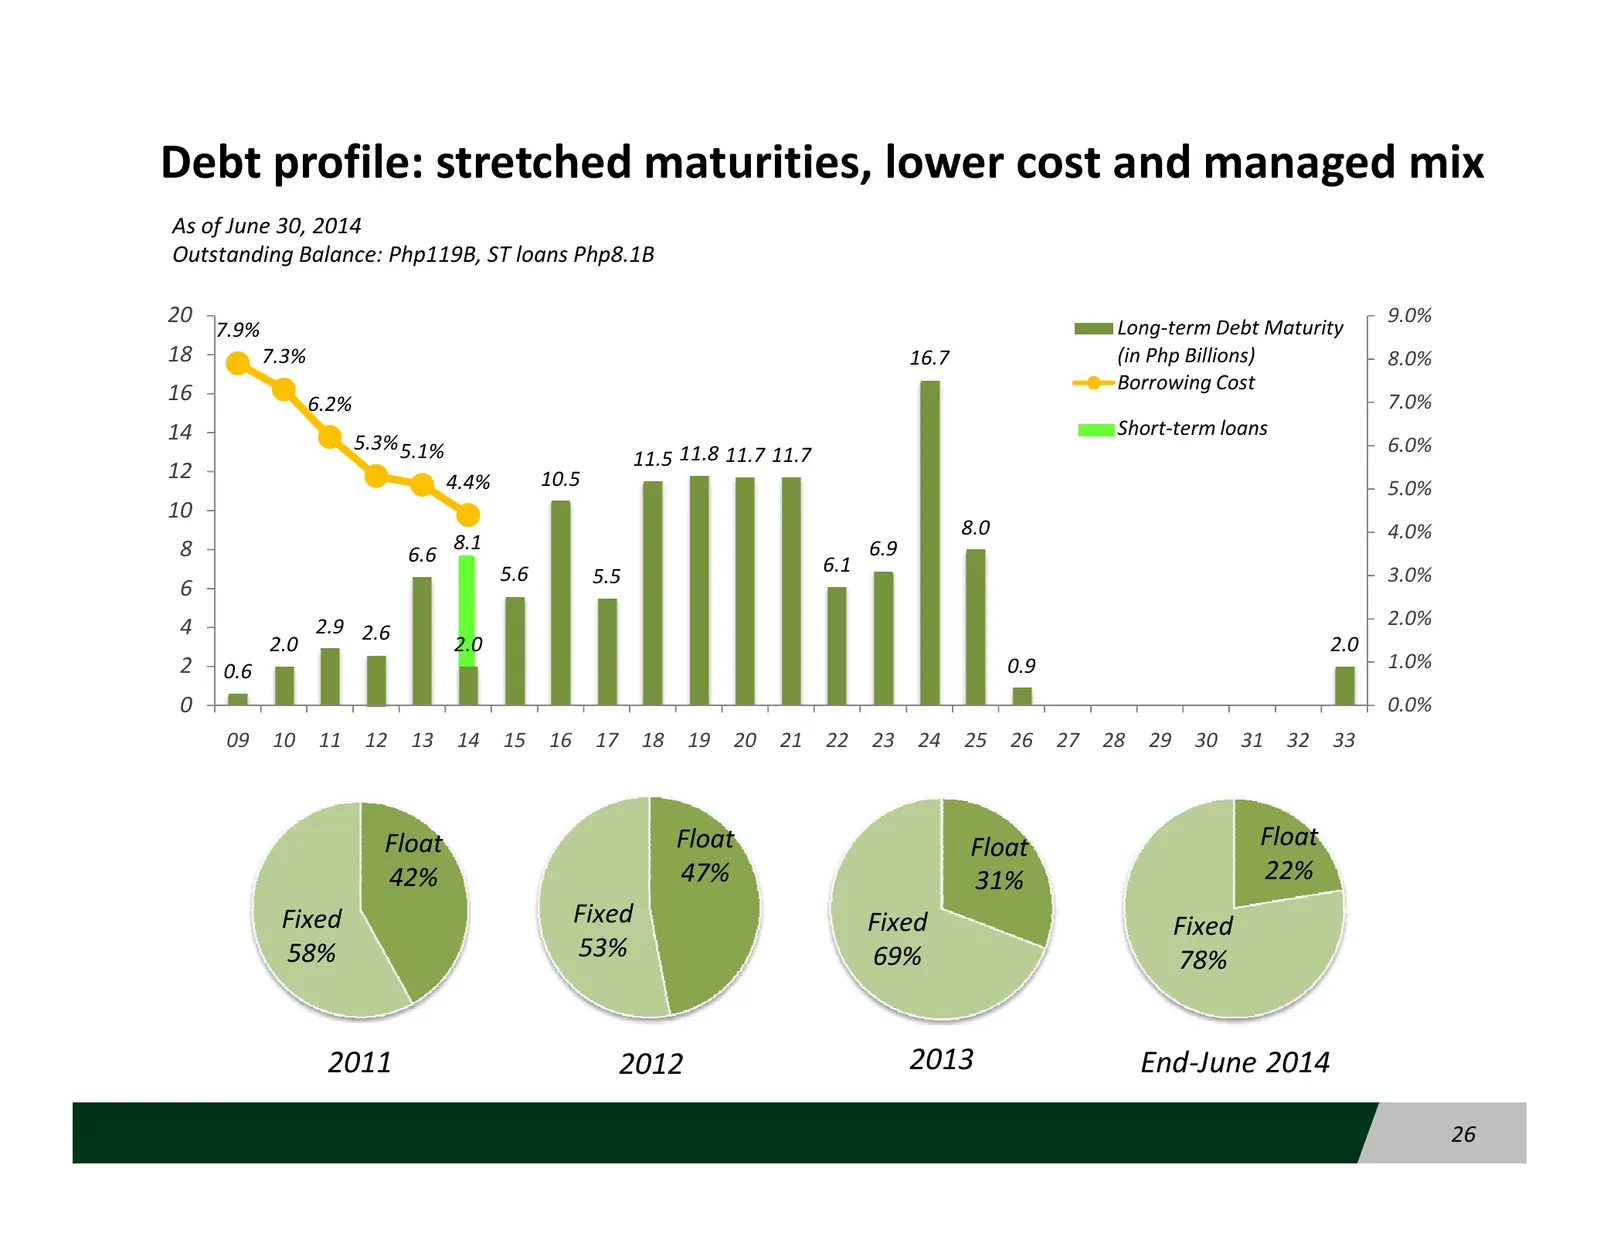
Slide 26: Debt profile: stretched maturities, lower cost and managed mix
Debt profile: stretched maturities, lower cost and managed mix As of June 30, 2014 Outstanding Balance: Php119B, ST loans Php8.1B 20 9.0% 7.9% Long-term Debt Maturity 18 7.3% 16.7 (in Php Billions) 8.0% Borrowing Cost 16 6.2% 7.0% 14 Short-term loans 5.3% 5.1% 6.0% 11.5 11.8 11.7 11.7 12 4.4% 10.5 5
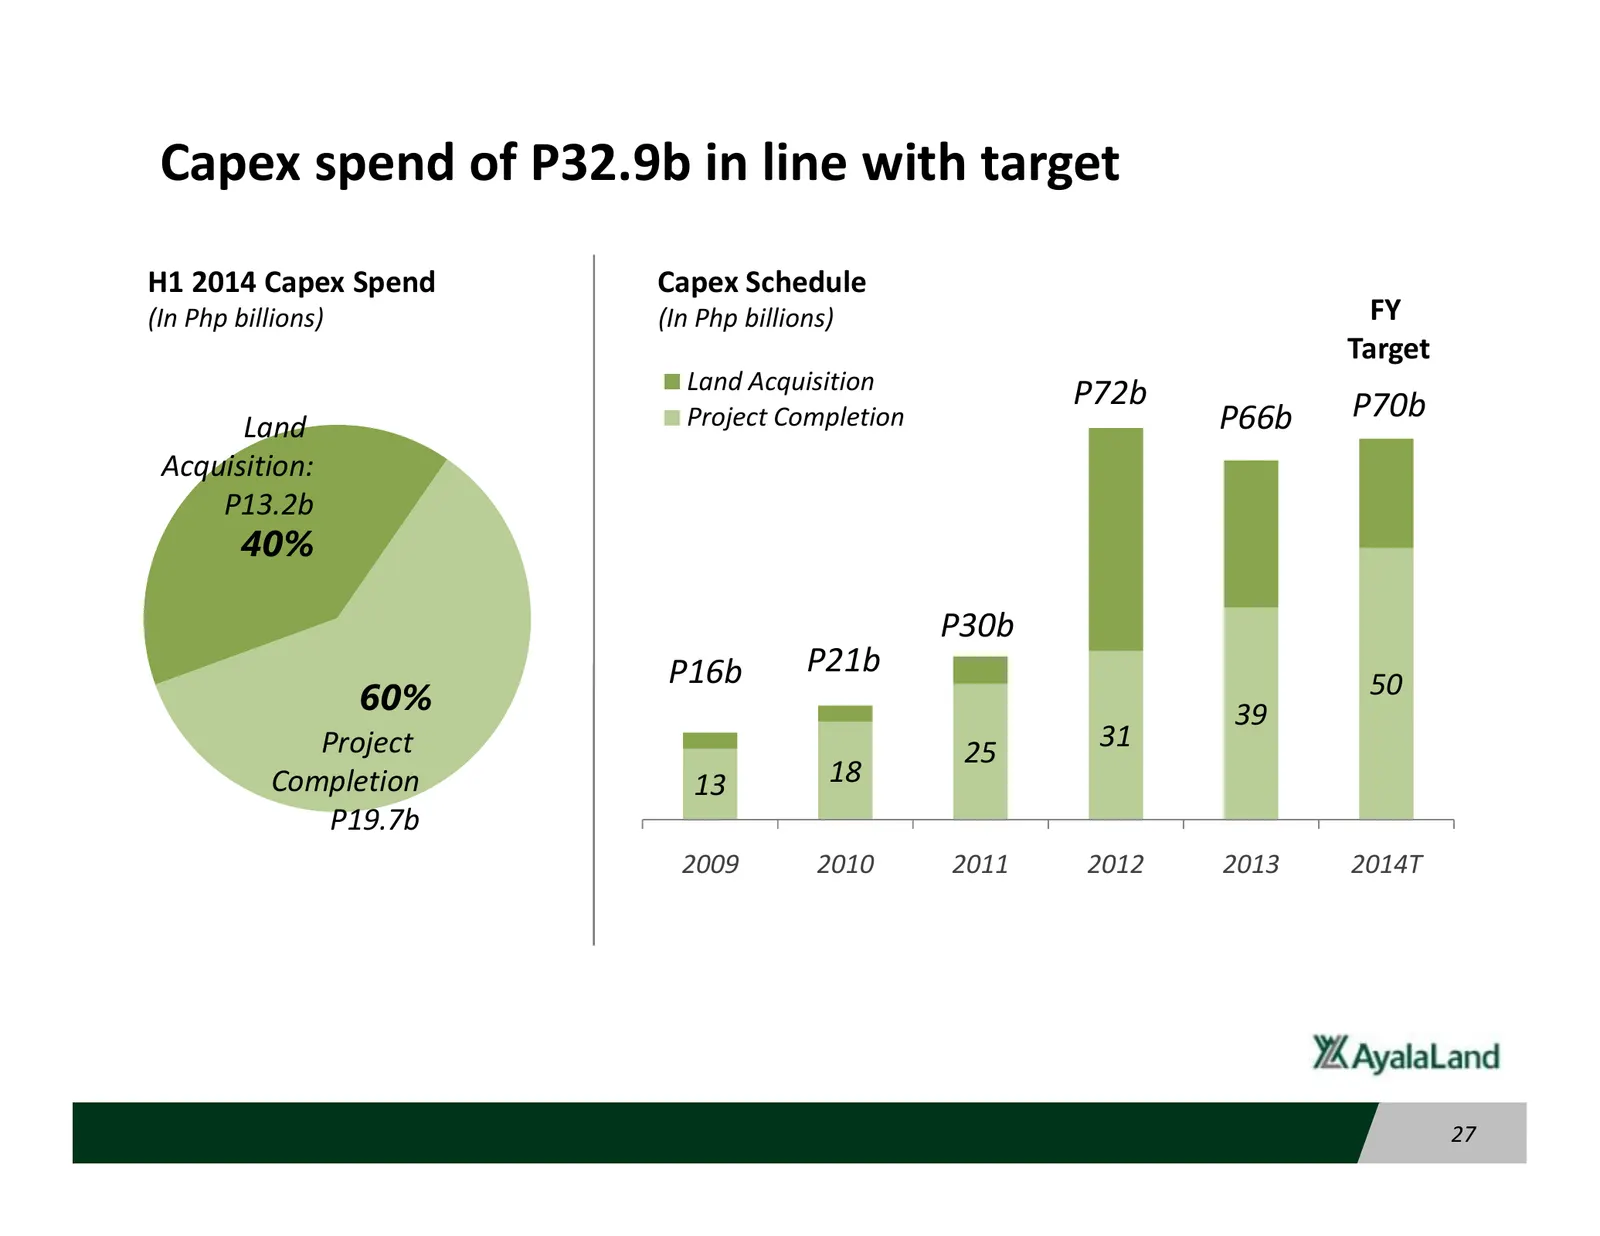
Slide 27: Capex spend of P32.9b in line with target
Capex spend of P32.9b in line with target H1 2014 Capex Spend Capex Schedule (In Php billions) (In Php billions) FY Target Land Acquisition P72b P70b Land Project Completion P66b Acquisition: P13.2b 40% P30b P16b P21b 60% 50 39 Project 31 25 Completion 13 18 P19.7b 2009 2010 2011 2012 2013 2014T 27
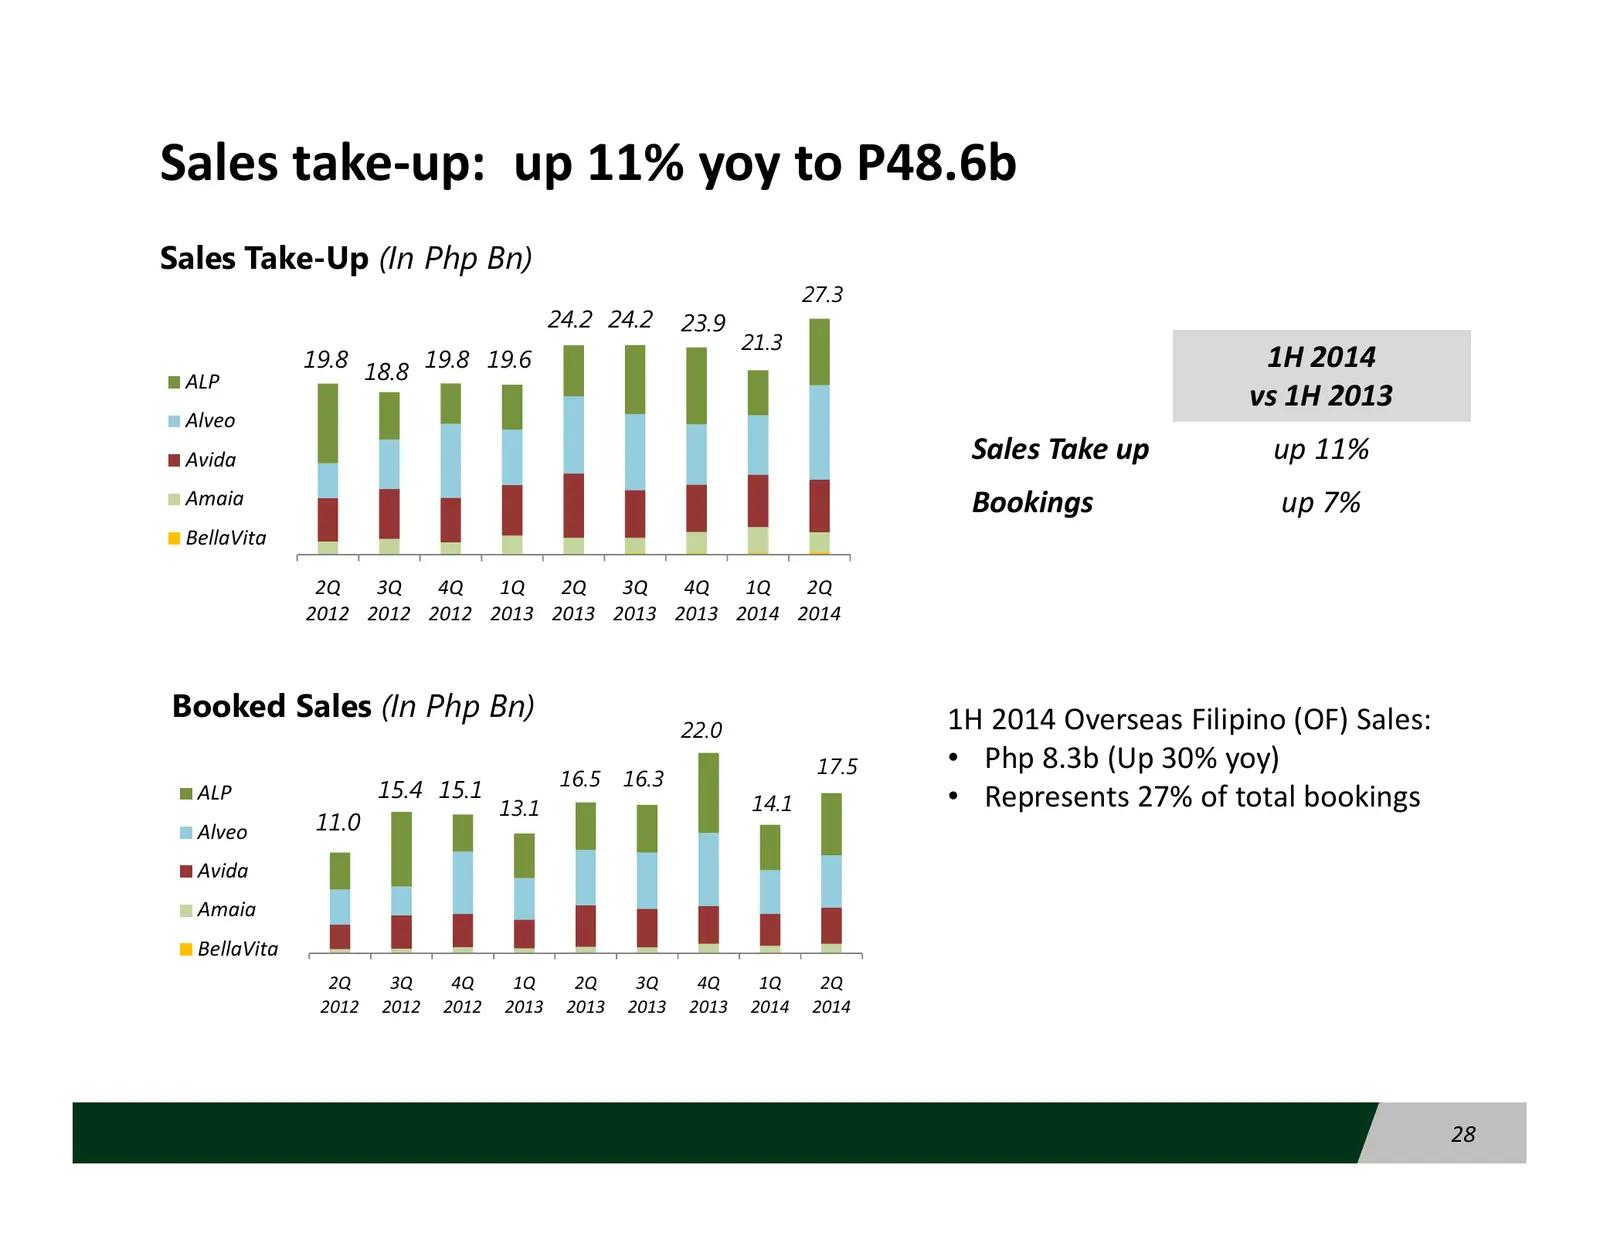
Slide 28: Sales take-up: up 11% yoy to P48.6b
Sales take-up: up 11% yoy to P48.6b Sales Take-Up (In Php Bn) 27.3 24.2 24.2 23.9 21.3 19.8 18.8 19.8 19.6 1H 2014 ALP vs 1H 2013 Alveo Avida Sales Take up up 11% Amaia Bookings up 7% BellaVita 2Q 3Q 4Q 1Q 2Q 3Q 4Q 1Q 2Q 2012 2012 2012 2013 2013 2013 2013 2014 2014 Booked Sales (In Php Bn) 1H 2014 O
Slide 29: Steady growth in unbooked revenues
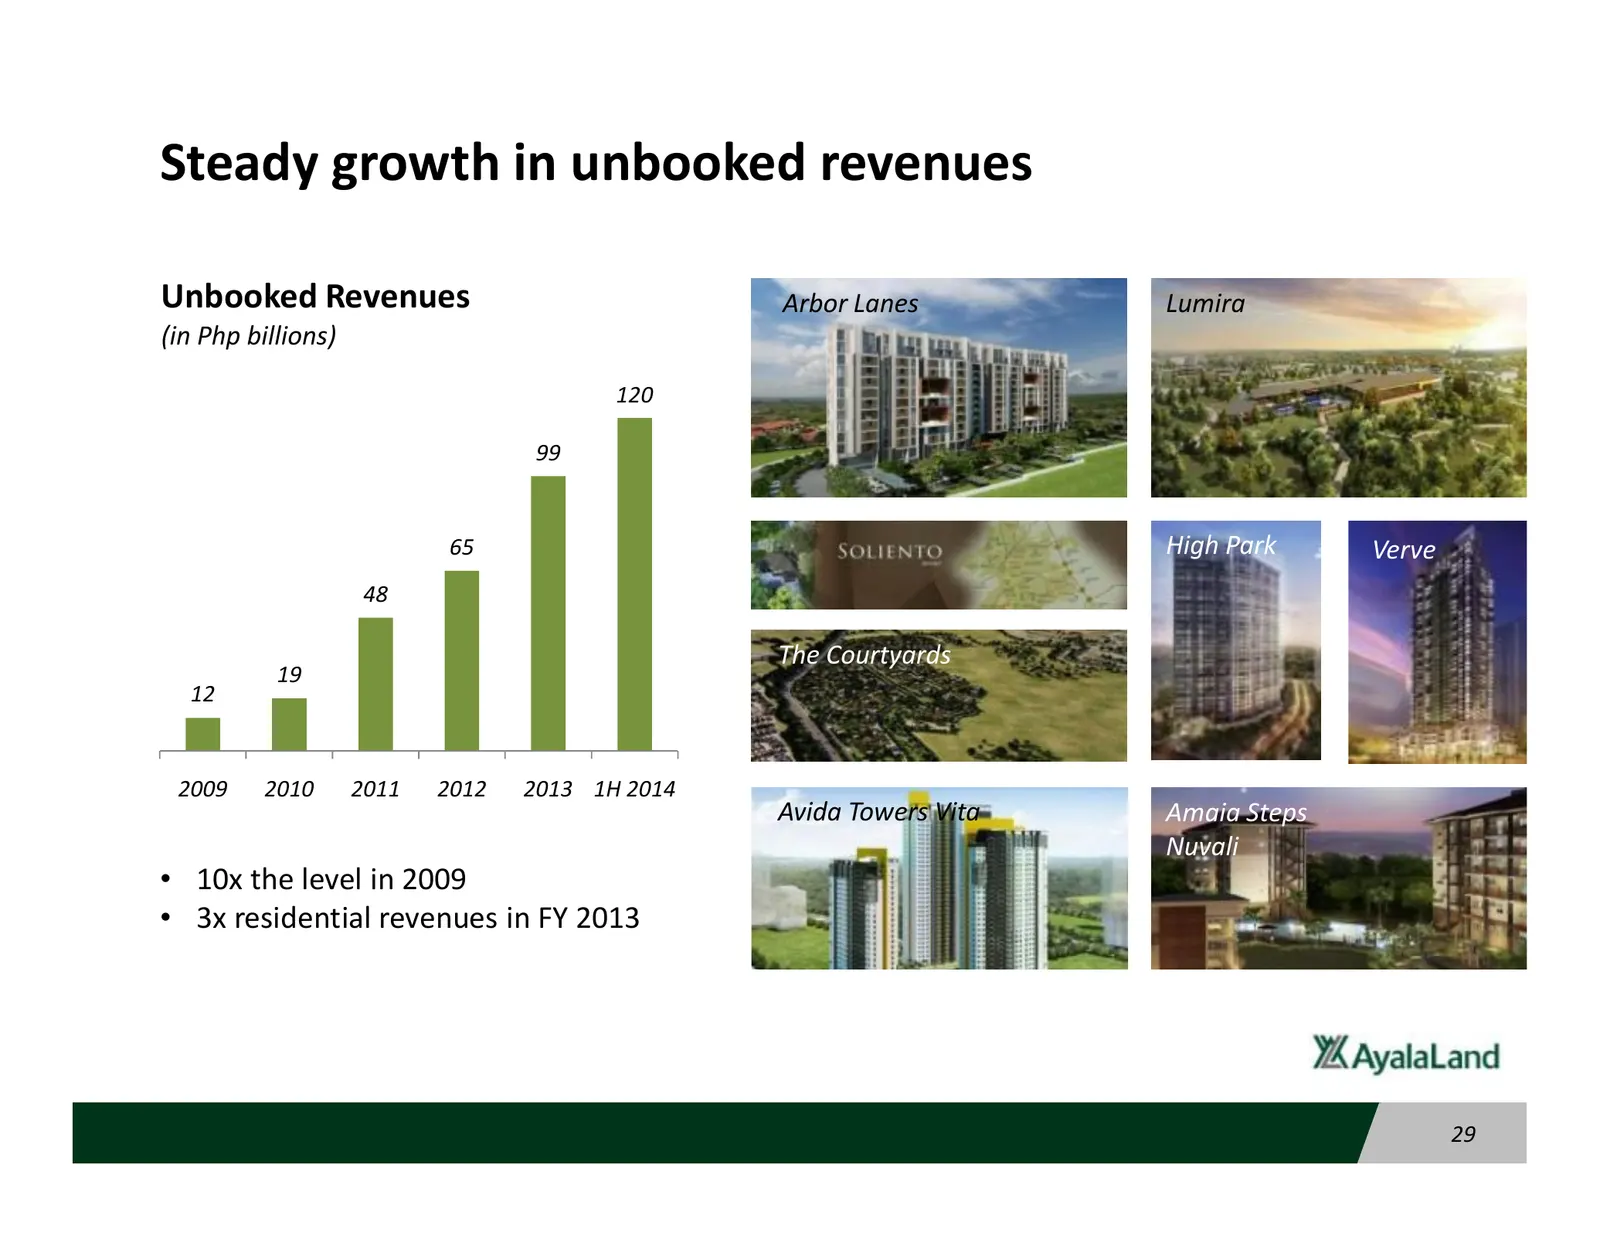
Steady growth in unbooked revenues Unbooked Revenues Arbor Lanes Lumira (in Php billions) 120 99 65 High Park Verve 48 The Courtyards 19 12 2009 2010 2011 2012 2013 1H 2014 Avida Towers Vita Amaia Steps Nuvali • 10x the level in 2009 • 3x residential revenues in FY 2013 29
Slide 30: Shopping Centers: GLA up 10% yoy
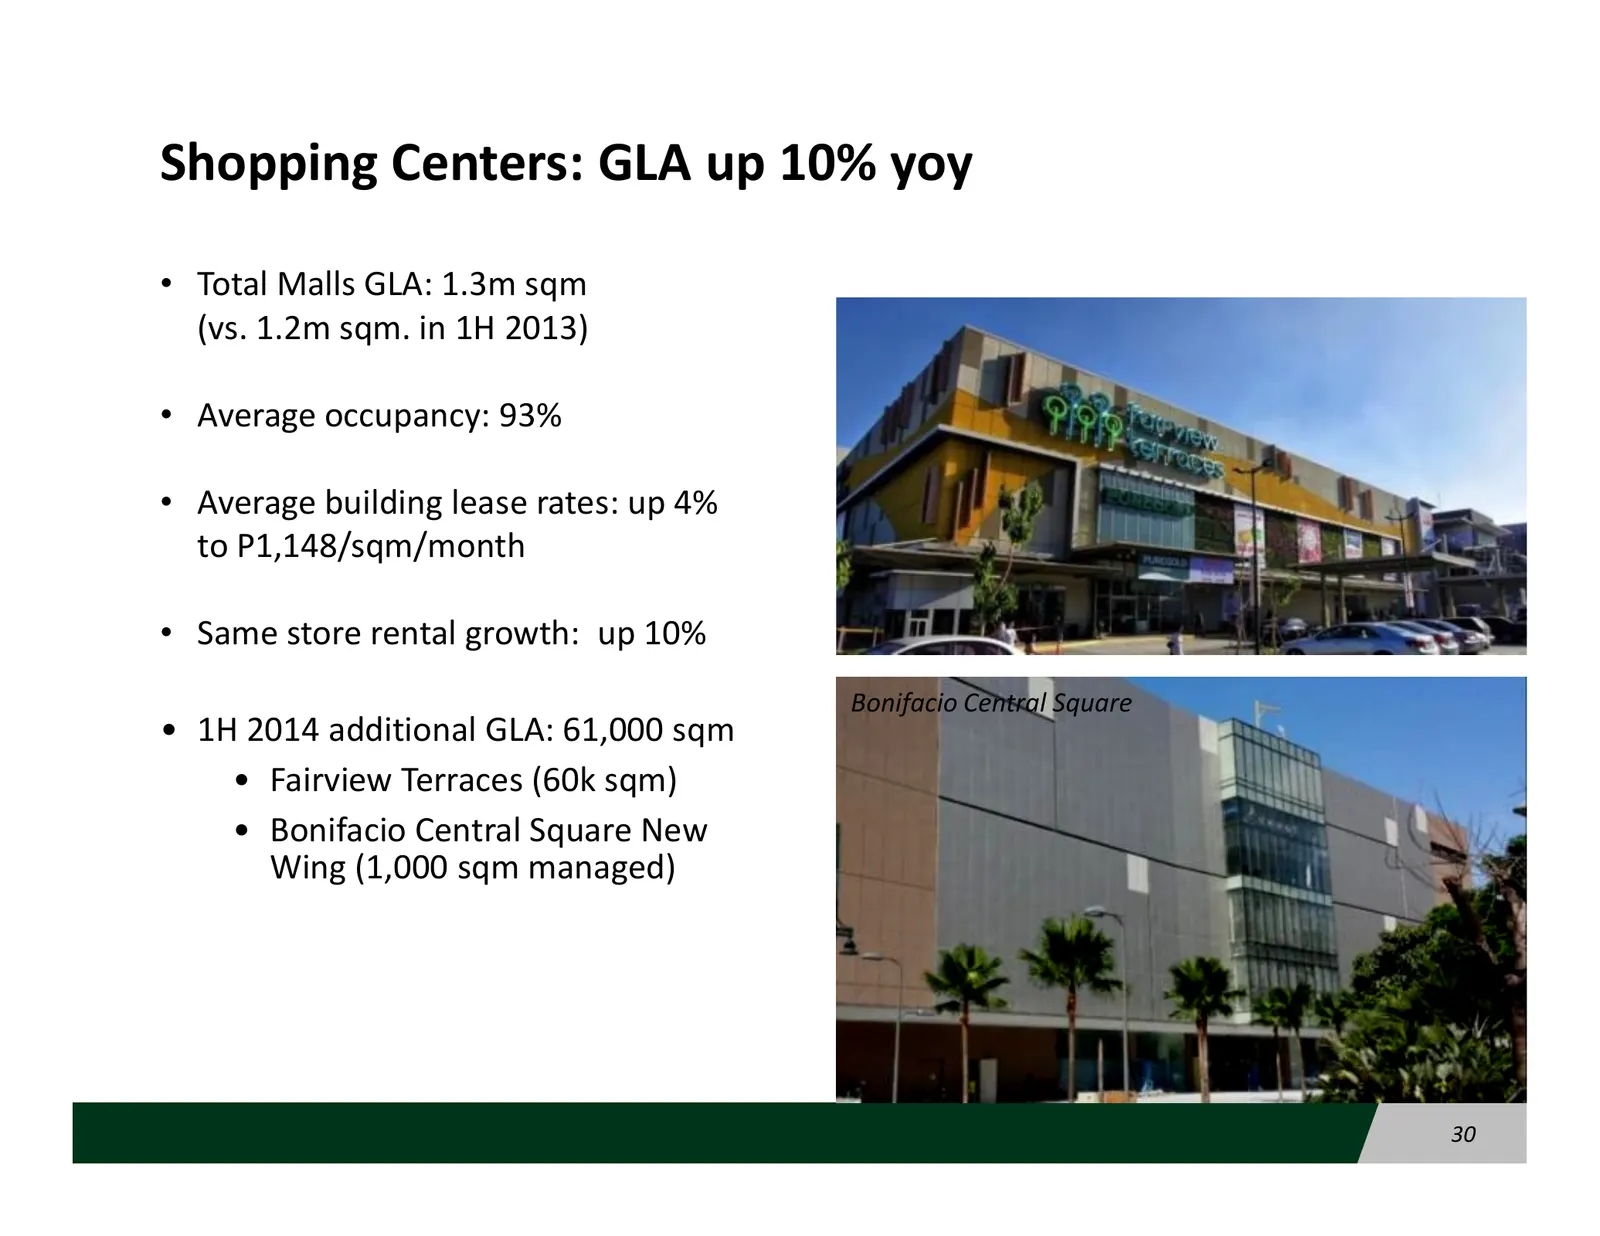
Shopping Centers: GLA up 10% yoy • Total Malls GLA: 1.3m sqm (vs. 1.2m sqm. in 1H 2013) • Average occupancy: 93% • Average building lease rates: up 4% to P1,148/sqm/month • Same store rental growth: up 10% Bonifacio Central Square • 1H 2014 additional GLA: 61,000 sqm • Fairview Terraces (60k sqm) •
Slide 31: Shopping Centers Update
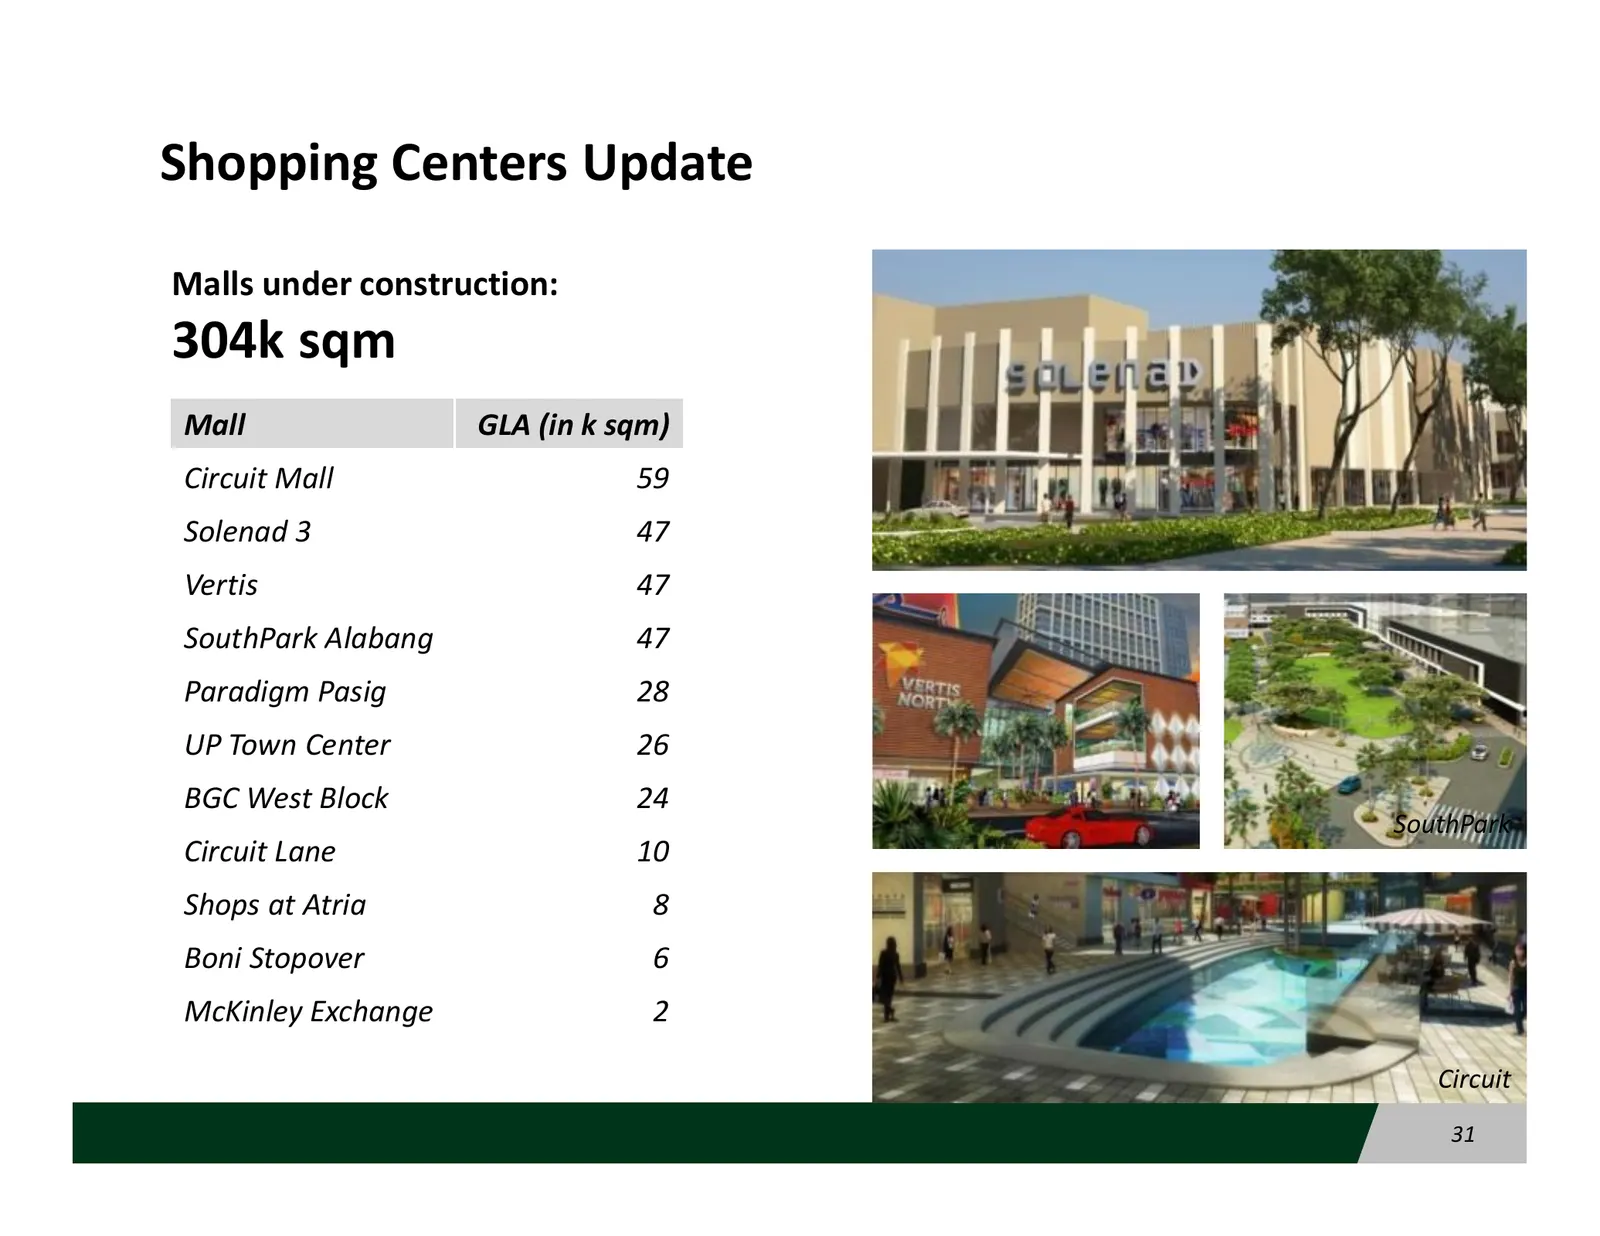
Shopping Centers Update Malls under construction: 304k sqm Mall GLA (in k sqm) Circuit Mall 59 Solenad 3 47 Vertis 47 SouthPark Alabang 47 Paradigm Pasig 28 UP Town Center 26 BGC West Block 24 SouthPark Circuit Lane 10 Shops at Atria 8 Boni Stopover 6 McKinley Exchange 2 Circuit 31
Slide 32: Offices: GLA up 8% yoy
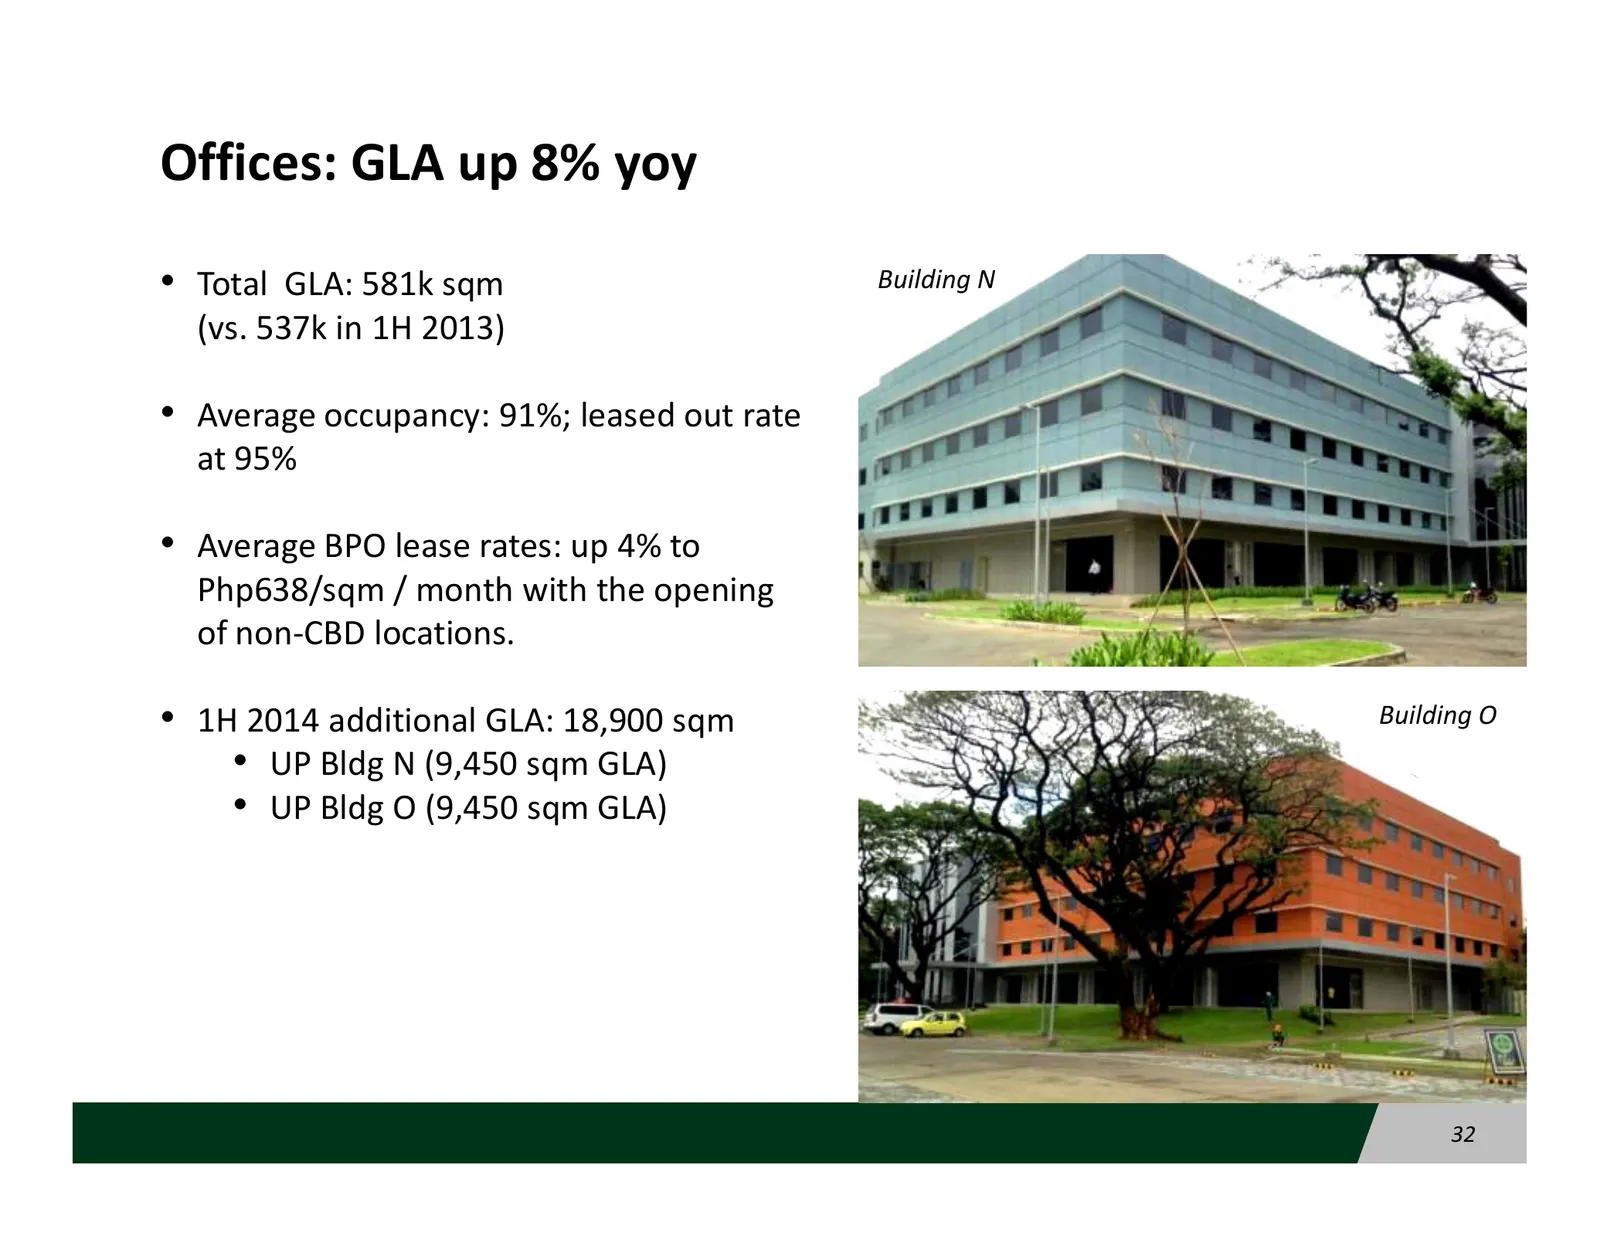
Offices: GLA up 8% yoy • Total GLA: 581k sqm Building N (vs. 537k in 1H 2013) • Average occupancy: 91%; leased out rate at 95% • Average BPO lease rates: up 4% to Php638/sqm / month with the opening of non-CBD locations. • 1H 2014 additional GLA: 18,900 sqm Building O • UP Bldg N (9,450 sqm GLA) • U
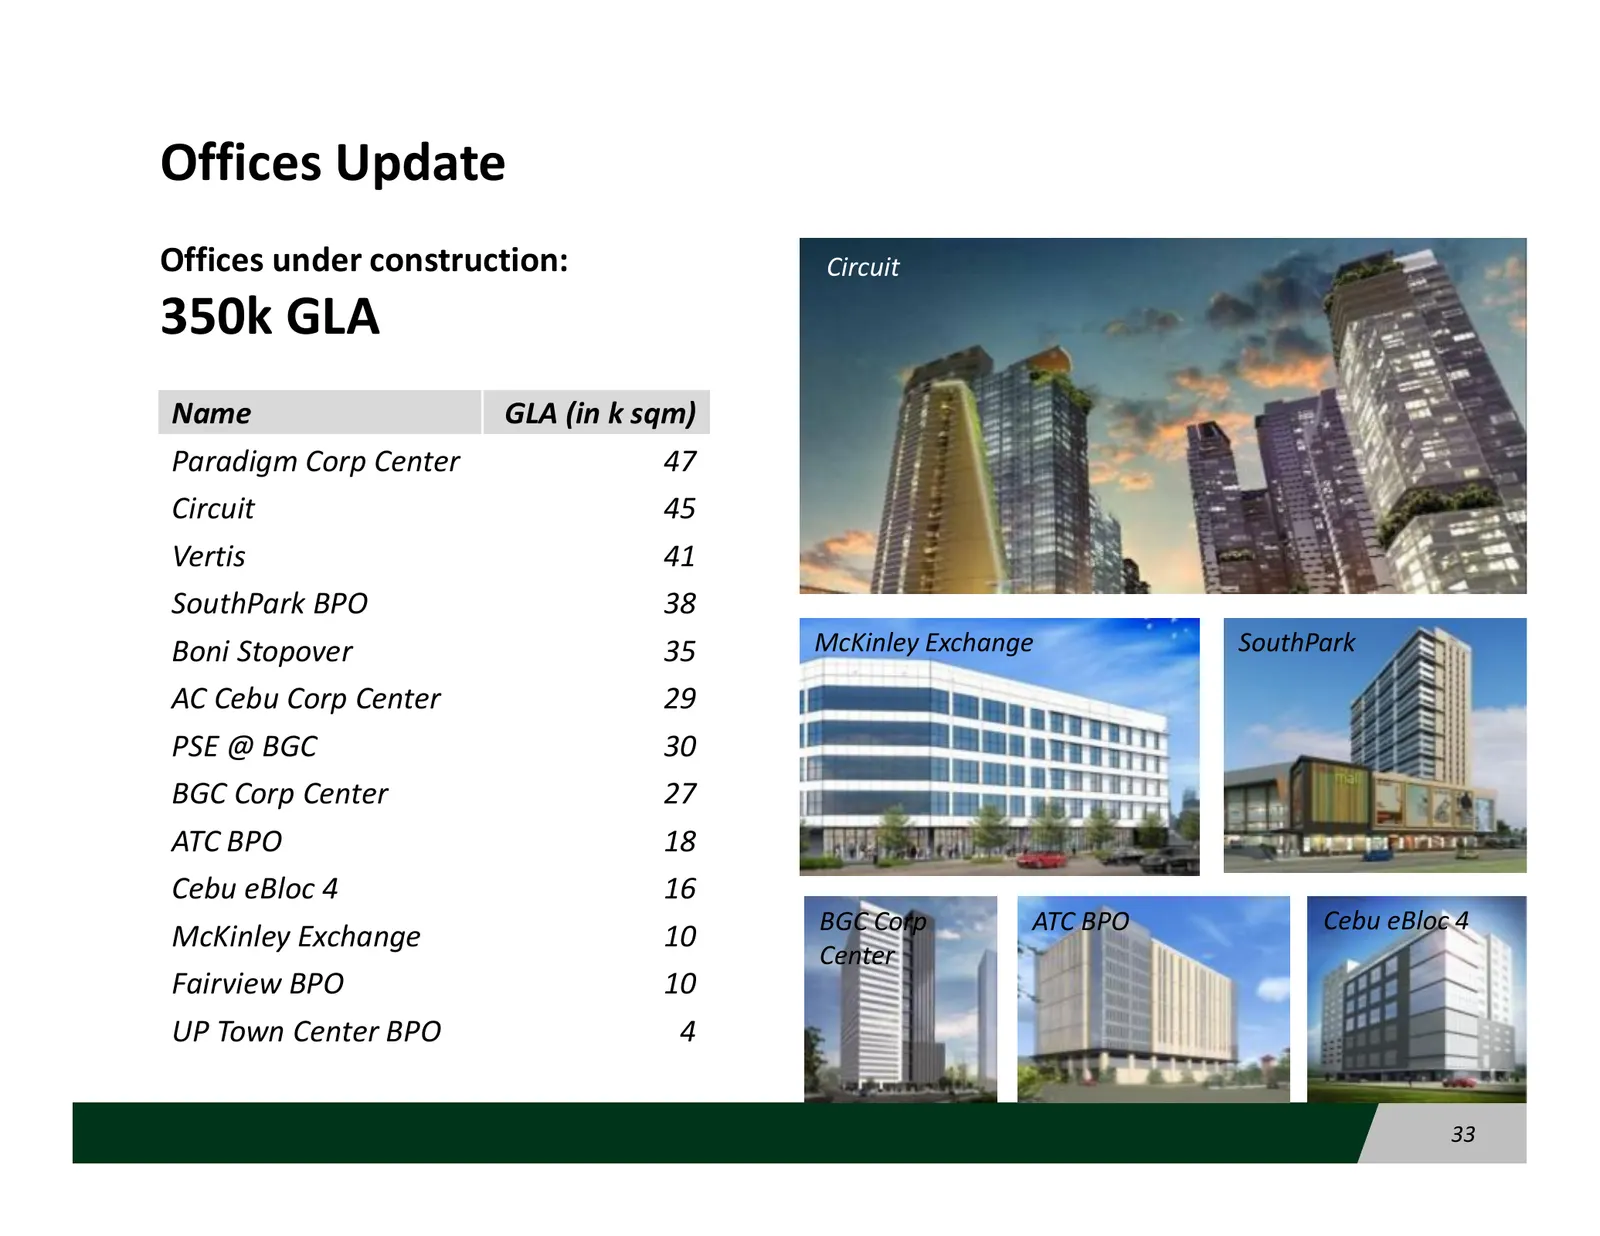
Slide 33: Offices Update
Offices Update Offices under construction: Circuit 350k GLA Name GLA (in k sqm) Paradigm Corp Center 47 Circuit 45 Vertis 41 SouthPark BPO 38 Boni Stopover 35 McKinley Exchange SouthPark AC Cebu Corp Center 29 PSE @ BGC 30 BGC Corp Center 27 ATC BPO 18 Cebu eBloc 4 16 BGC Corp ATC BPO Cebu eBloc 4 M
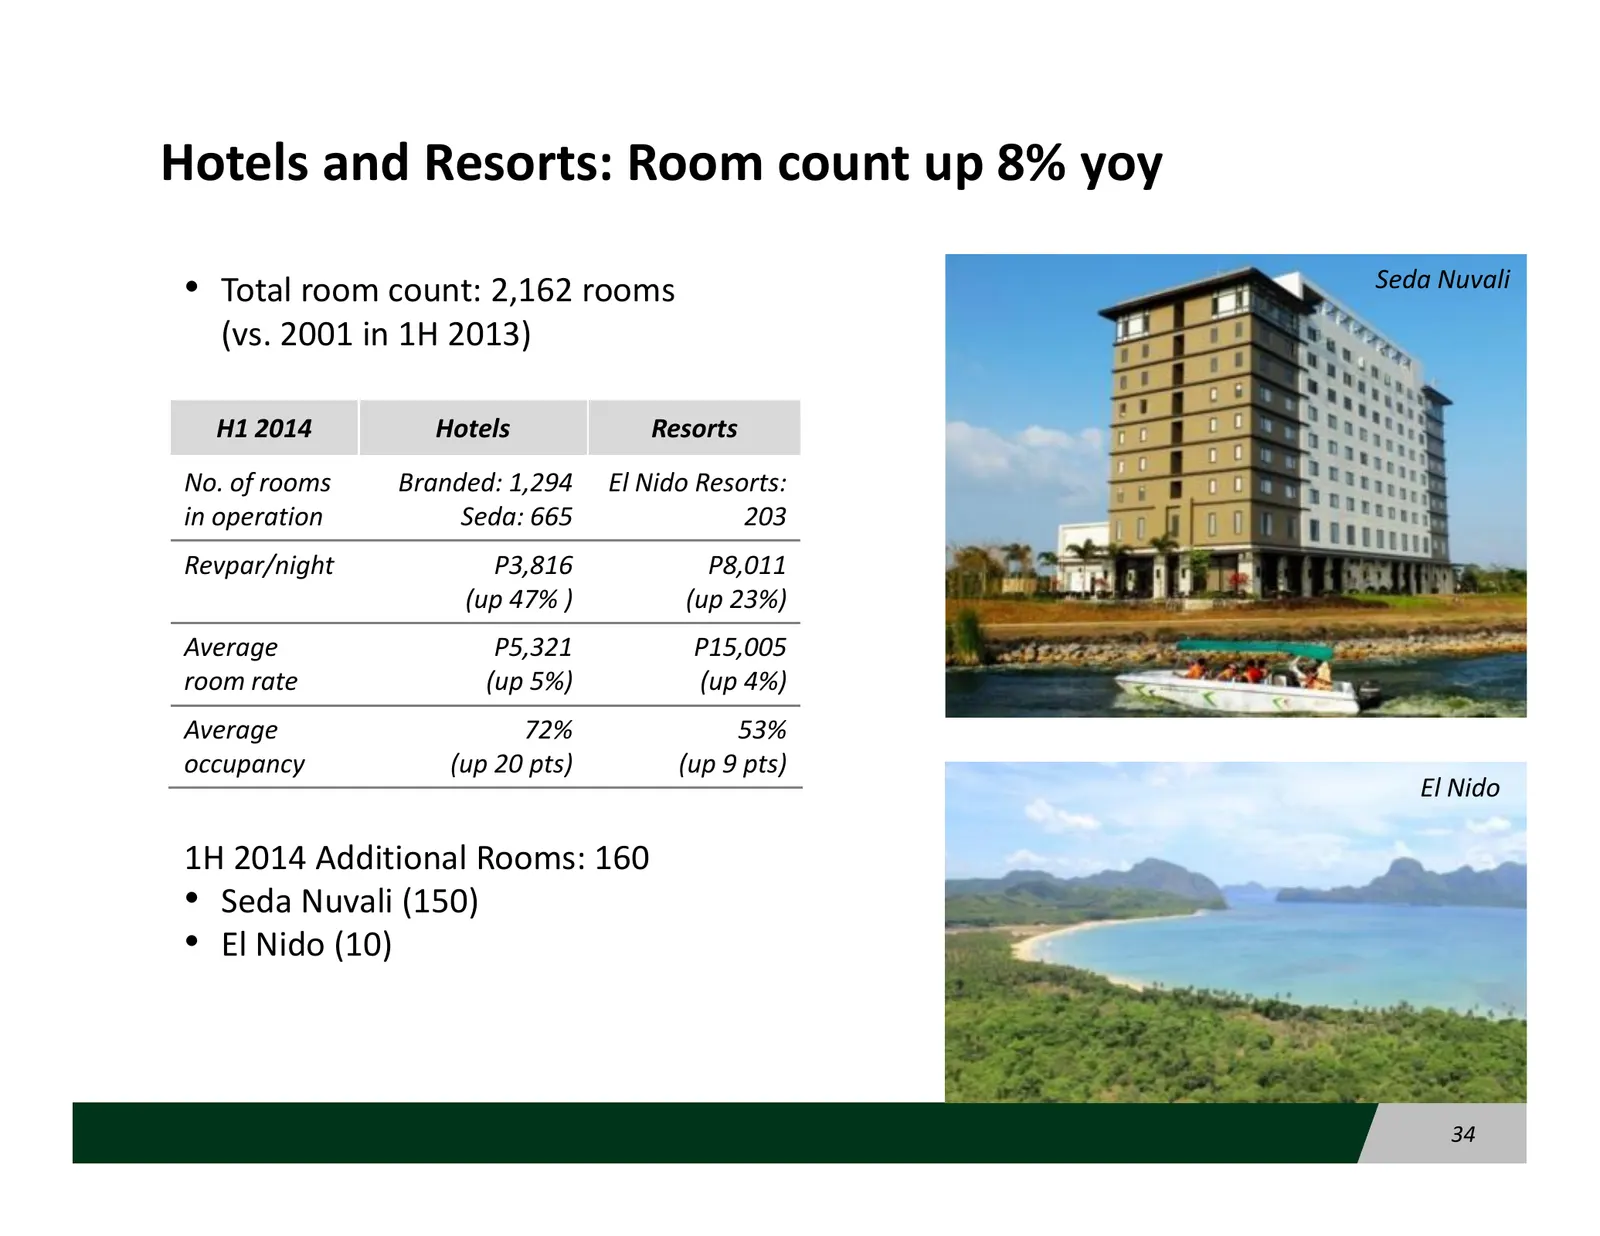
Slide 34: Hotels and Resorts: Room count up 8% yoy
Hotels and Resorts: Room count up 8% yoy • Total room count: 2,162 rooms Seda Nuvali (vs. 2001 in 1H 2013) H1 2014 Hotels Resorts No. of rooms Branded: 1,294 El Nido Resorts: in operation Seda: 665 203 Revpar/night P3,816 P8,011 (up 47% ) (up 23%) Average P5,321 P15,005 room rate (up 5%) (up 4%) Ave
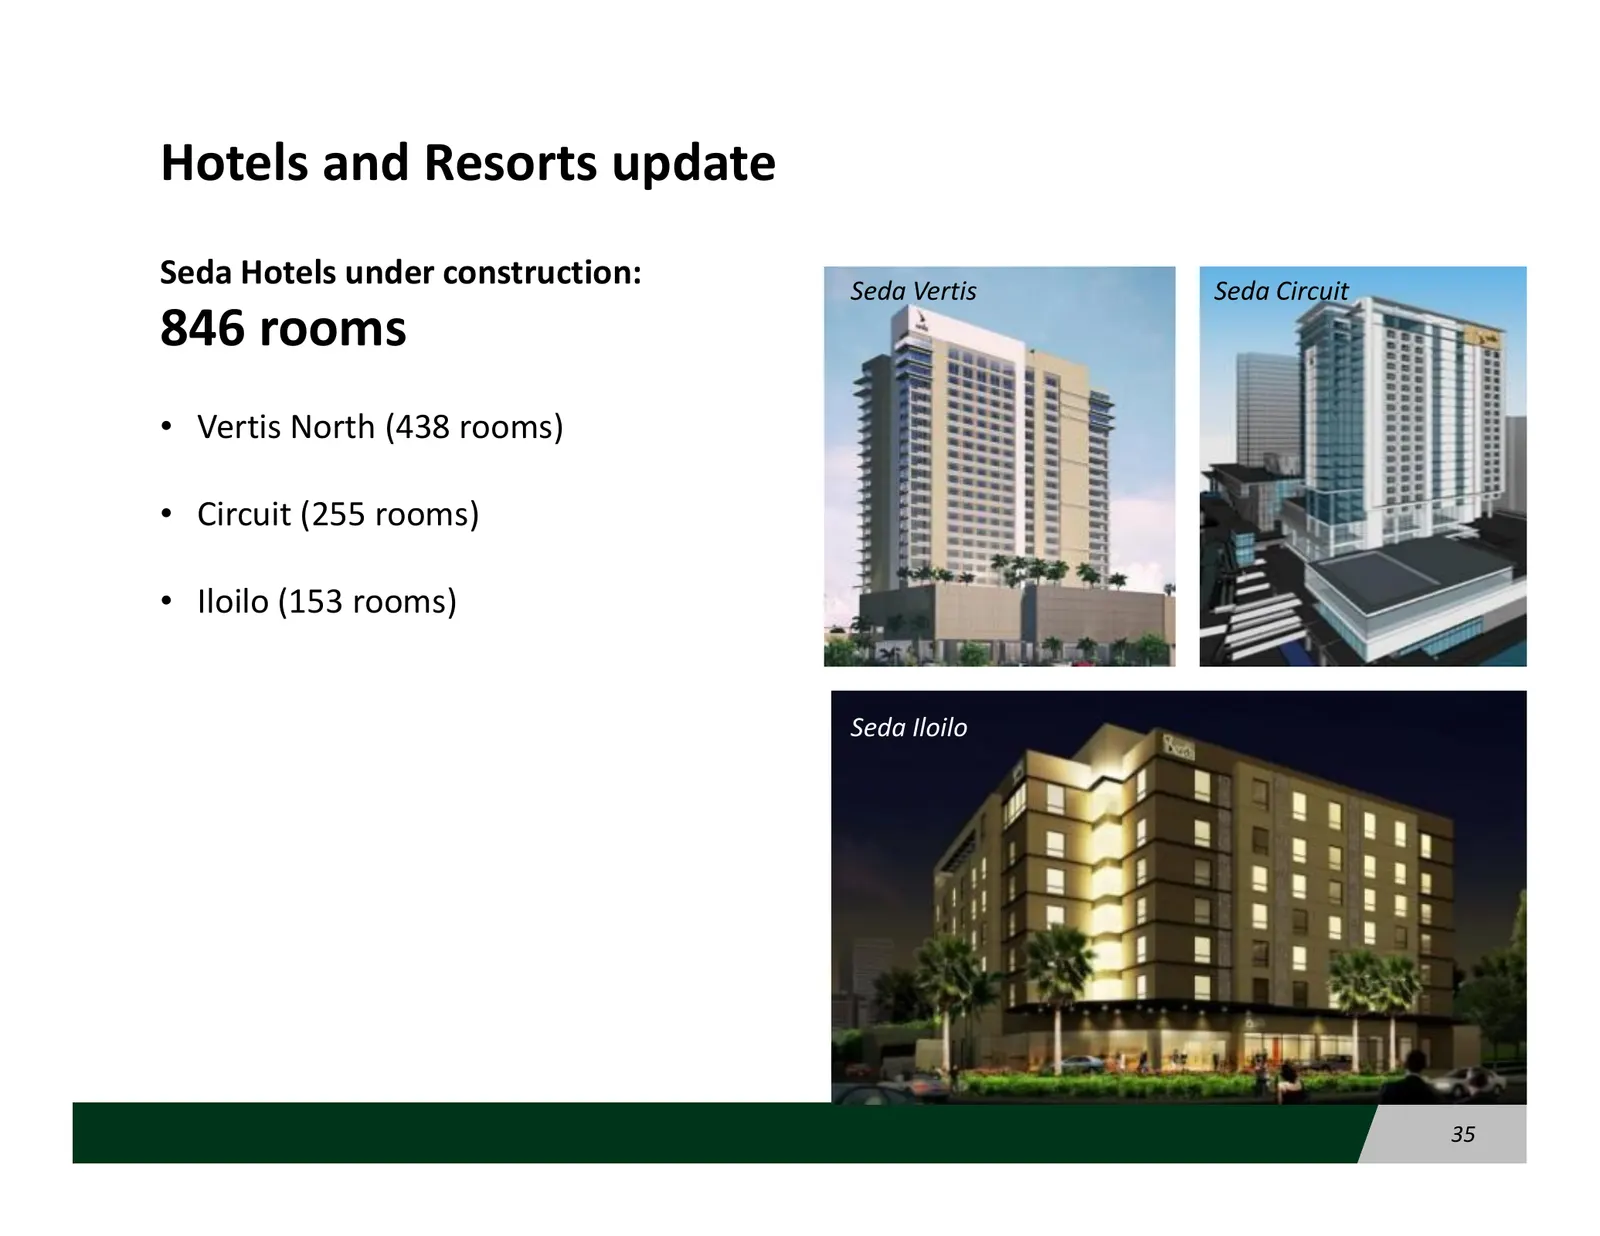
Slide 35: Hotels and Resorts update
Hotels and Resorts update Seda Hotels under construction: Seda Vertis Seda Circuit 846 rooms • Vertis North (438 rooms) • Circuit (255 rooms) • Iloilo (153 rooms) Seda Iloilo 35
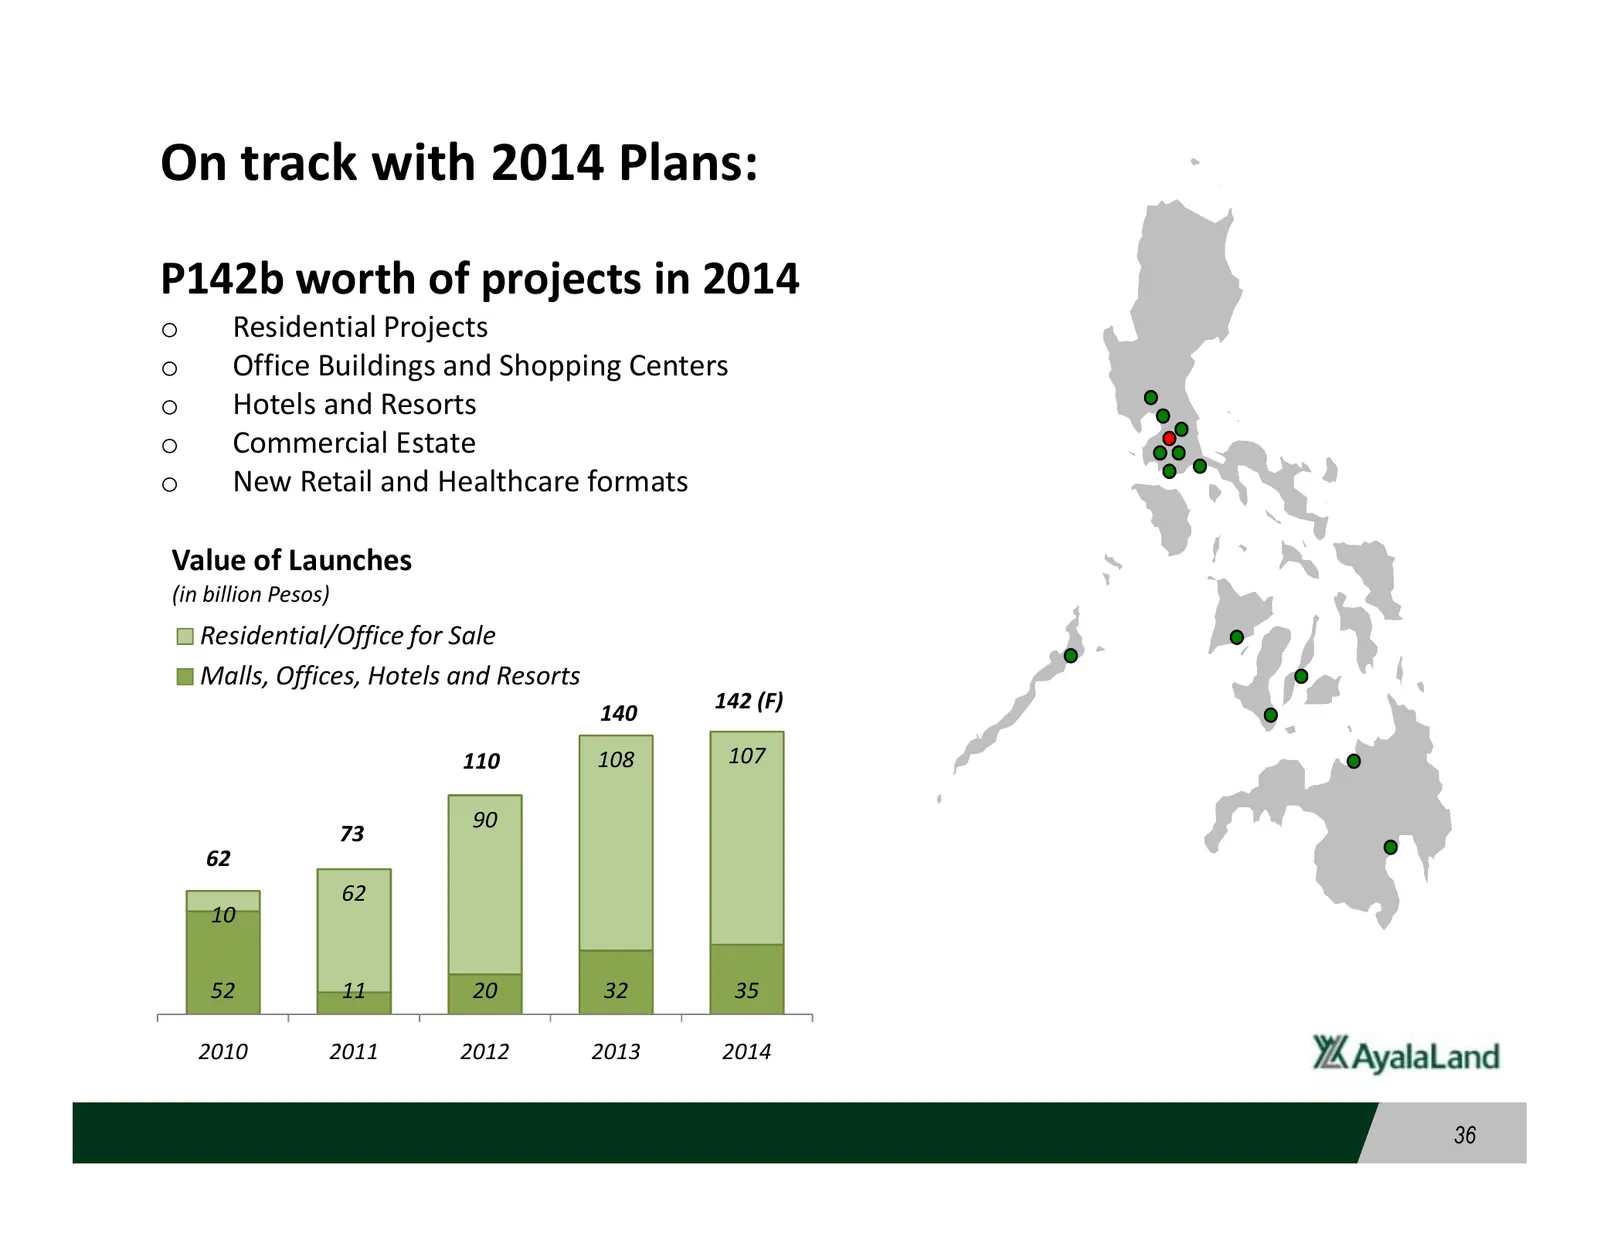
Slide 36: On track with 2014 Plans:
On track with 2014 Plans: P142b worth of projects in 2014 o Residential Projects o Office Buildings and Shopping Centers o Hotels and Resorts o Commercial Estate o New Retail and Healthcare formats Value of Launches (in billion Pesos) Residential/Office for Sale Malls, Offices, Hotels and Resorts 14
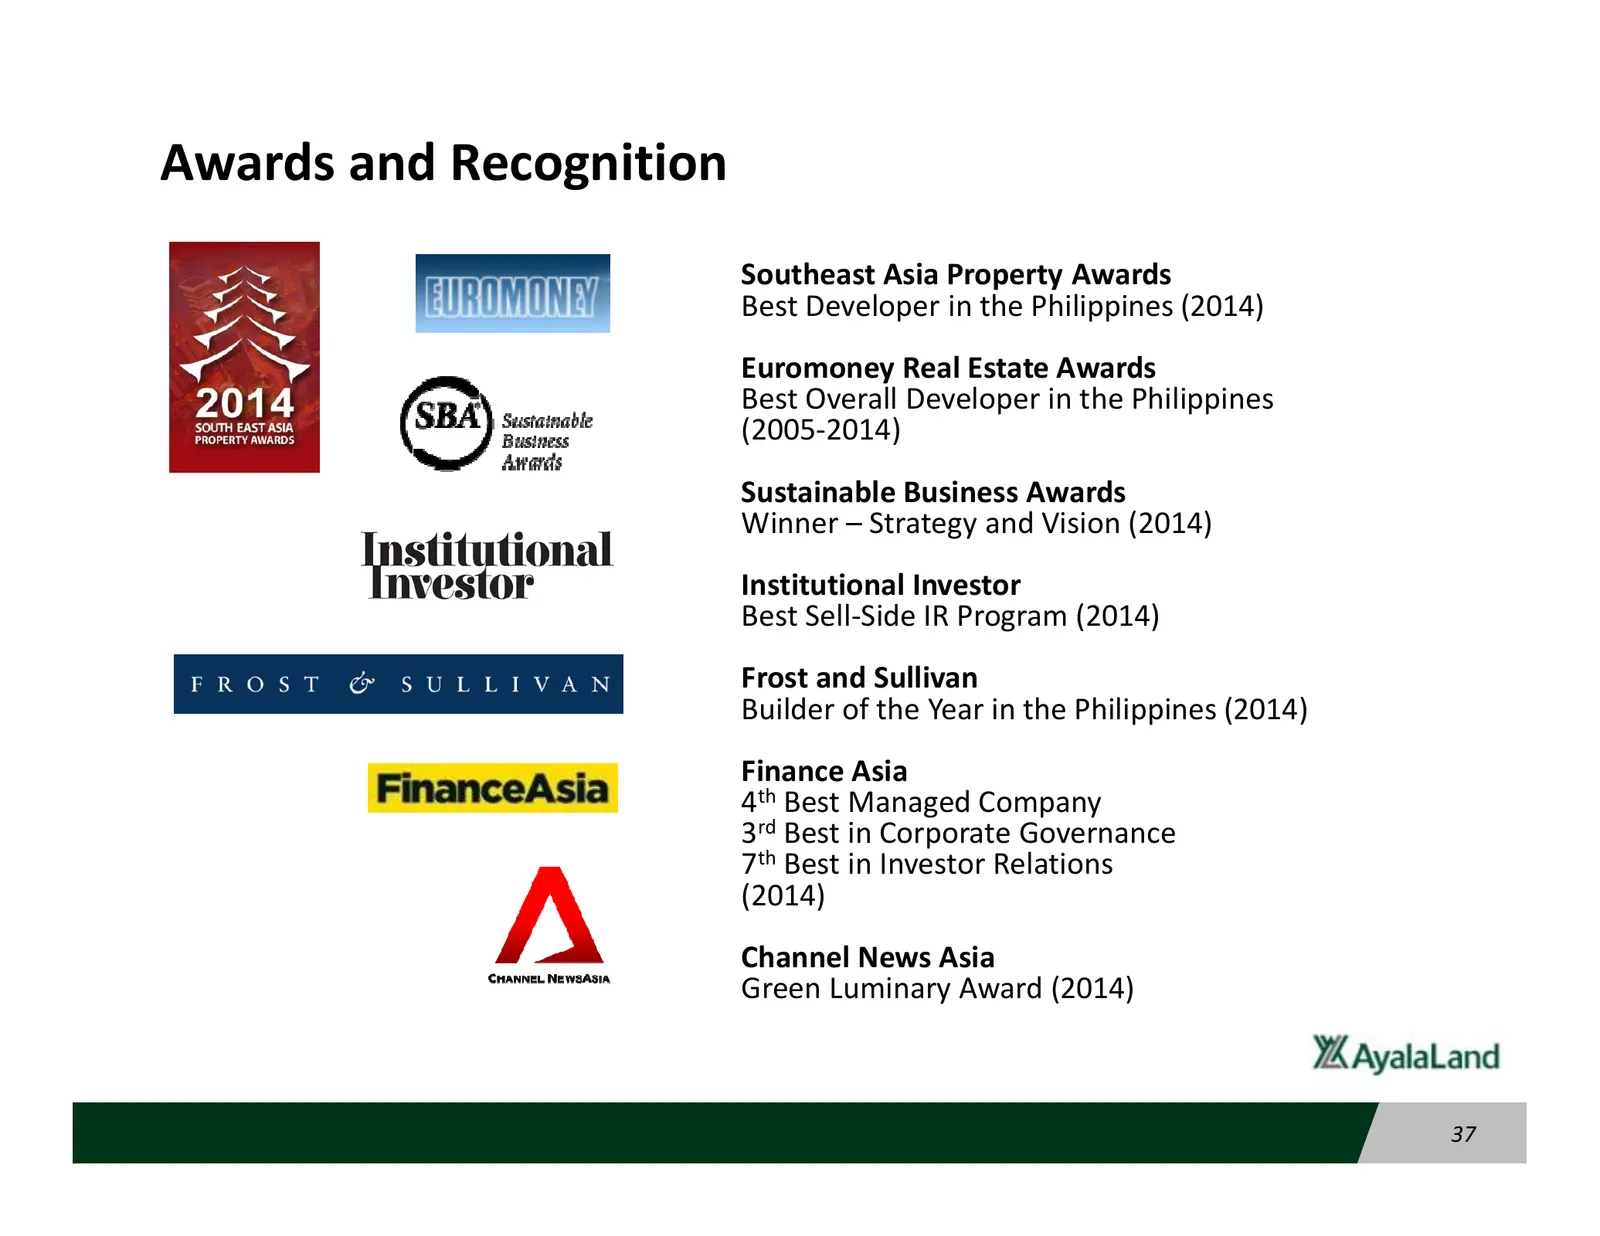
Slide 37: Awards and Recognition
Awards and Recognition Southeast Asia Property Awards Best Developer in the Philippines (2014) Euromoney Real Estate Awards Best Overall Developer in the Philippines (2005-2014) Sustainable Business Awards Winner – Strategy and Vision (2014) Institutional Investor Best Sell-Side IR Program (2014) Fr
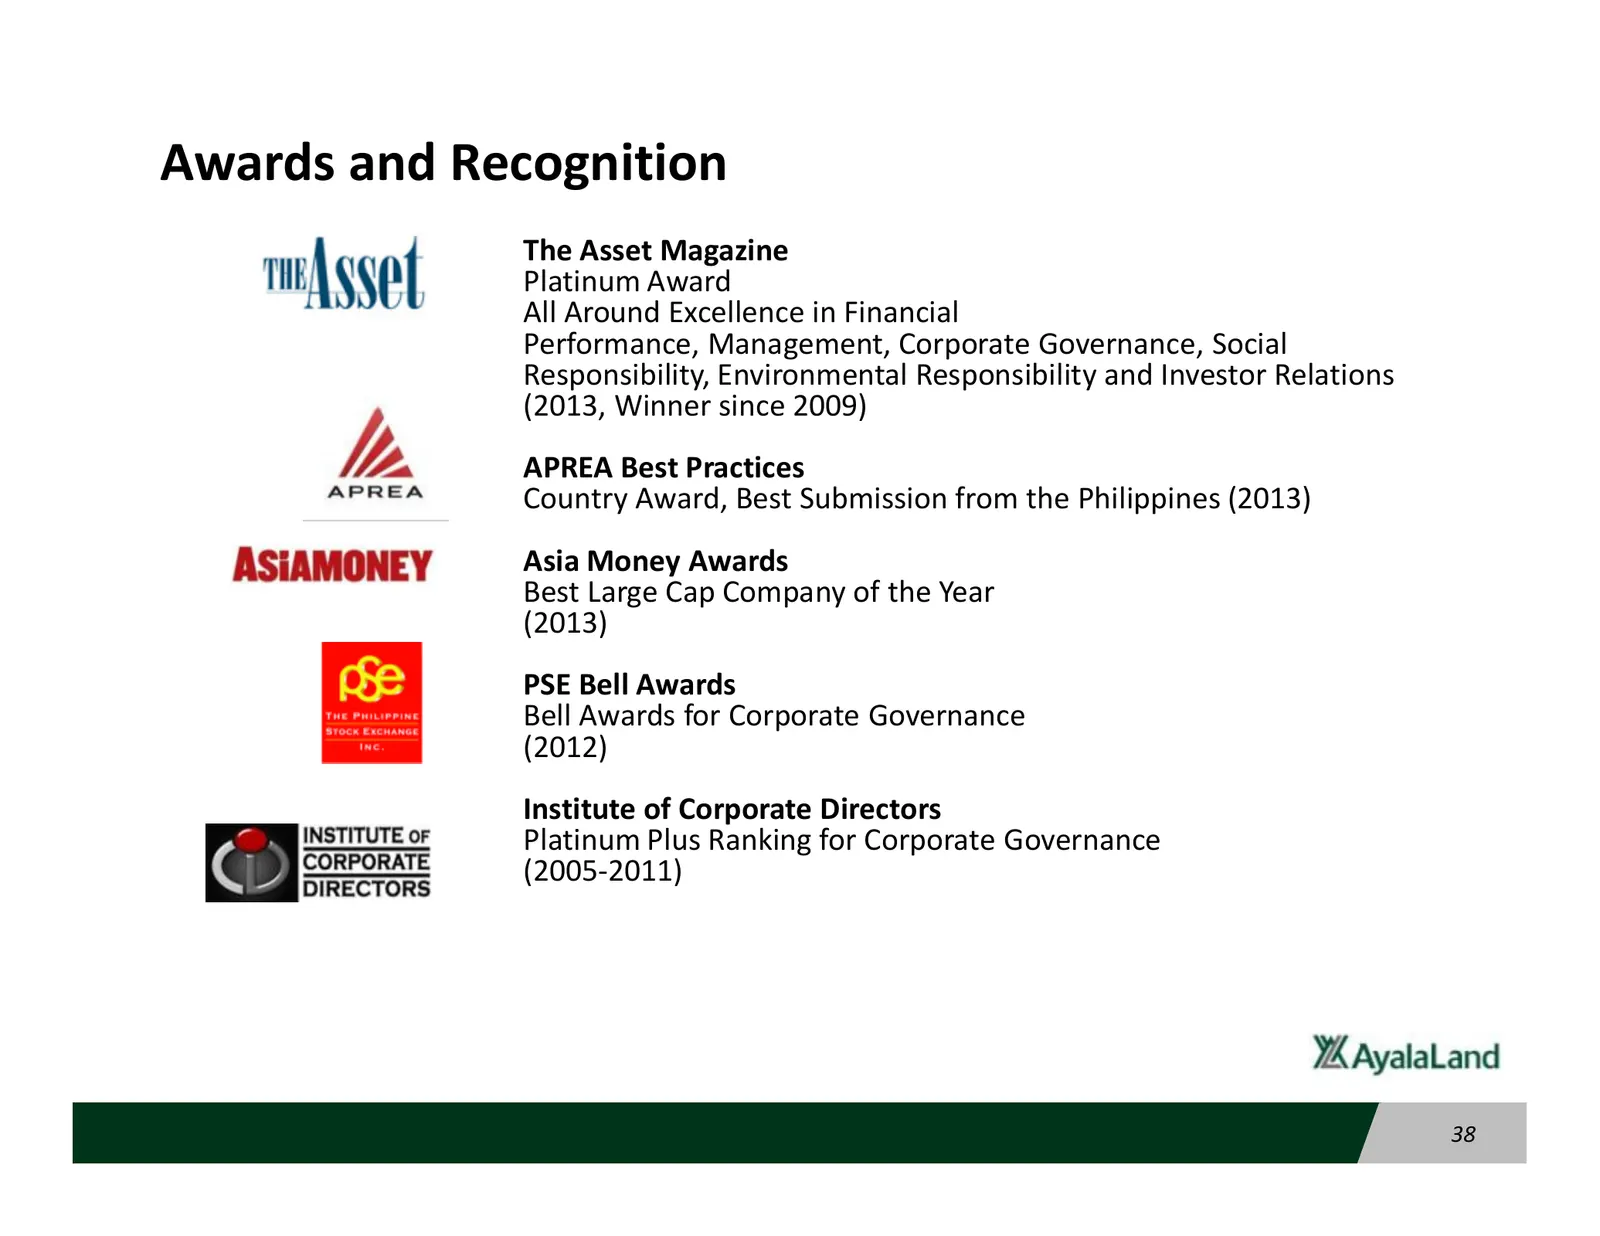
Slide 38: Awards and Recognition
Awards and Recognition The Asset Magazine Platinum Award All Around Excellence in Financial Performance, Management, Corporate Governance, Social Responsibility, Environmental Responsibility and Investor Relations (2013, Winner since 2009) APREA Best Practices Country Award, Best Submission from the
Slide 39: Thank You.
Thank You. INVESTOR RELATIONS 30F Tower One and Exchange Plaza, Ayala Triangle, Makati City T +9083676 │ F +632 7506790 iru@ayalaland.com.ph www.ayalaland.com.ph
Source: Internet Archive copy of ir.ayalaland.com.ph
More decks from Ayala Land Inc.
 Q1 2026 Earnings Presentation15 slides · Apr 30, 2026
 Q4 2025 Earnings Presentation16 slides · Feb 20, 2026
 Q1 2025 Earnings Presentation10 slides · May 6, 2025
 FY2024 Earnings Presentation15 slides · Feb 20, 2025
 Q1 2024 Earnings Presentation37 slides · May 16, 2024
 Q1 2024 Earnings Presentation12 slides · May 8, 2024