Seche Environnement SA · EURONEXT:SCHP
Seche Environnement SA — 9M 2019 Earnings Presentation
13 slides from Seche Environnement SA's earnings presentation, Oct 22, 2019

Slide 1: Activity at September 30, 2019
Activity at September 30, 2019 Conference call of October 22, 2019
Slide 2: Highlights of the period
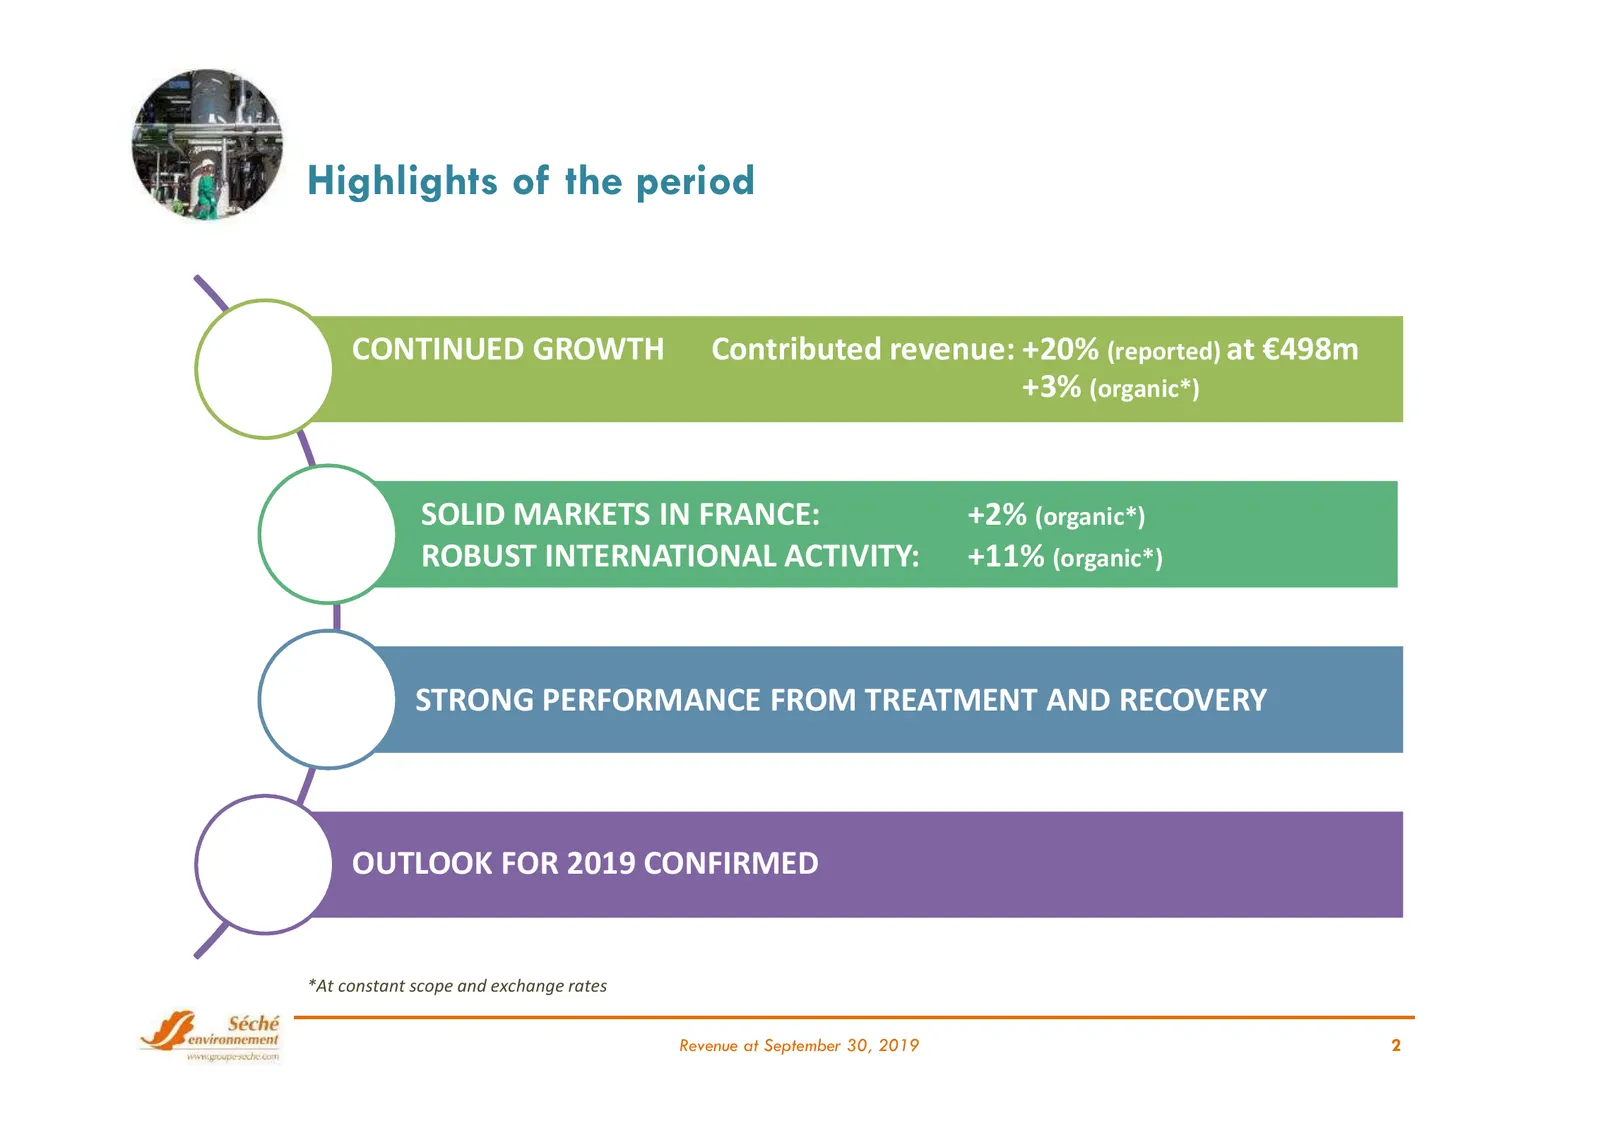
Highlights of the period CONTINUED GROWTH Contributed revenue: +20% (reported) at €498m +3% (organic*) SOLID MARKETS IN FRANCE: +2% (organic*) ROBUST INTERNATIONAL ACTIVITY: +11% (organic*) STRONG PERFORMANCE FROM TREATMENT AND RECOVERY OUTLOOK FOR 2019 CONFIRMED *At constant scope and exchange rate
Slide 3: Sharp growth in 9-month contributed revenue: +20%
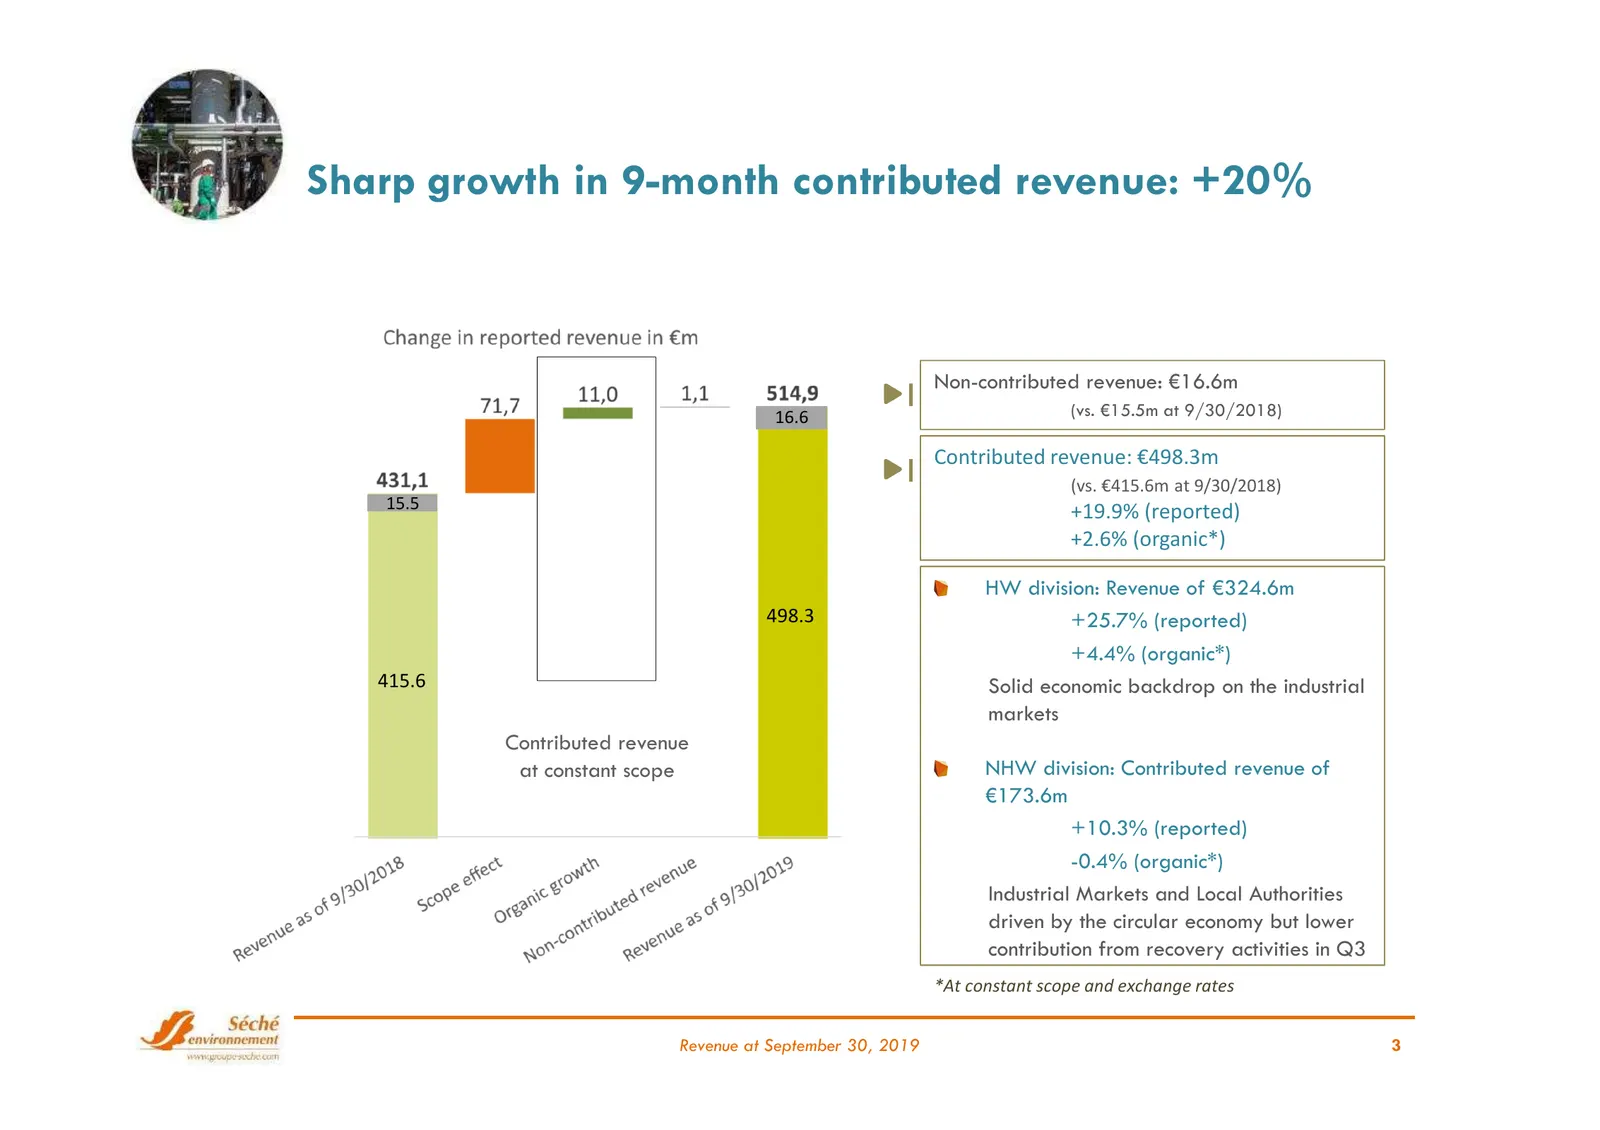
Sharp growth in 9-month contributed revenue: +20% Non-contributed revenue: €16.6m 16.6 (vs. €15.5m at 9/30/2018) Contributed revenue: €498.3m (vs. €415.6m at 9/30/2018) 15.5 +19.9% (reported) +2.6% (organic*) HW division: Revenue of €324.6m 498.3 +25.7% (reported) +4.4% (organic*) 415.6 Solid econom
Slide 4: France: Solid markets, International: Robust sales
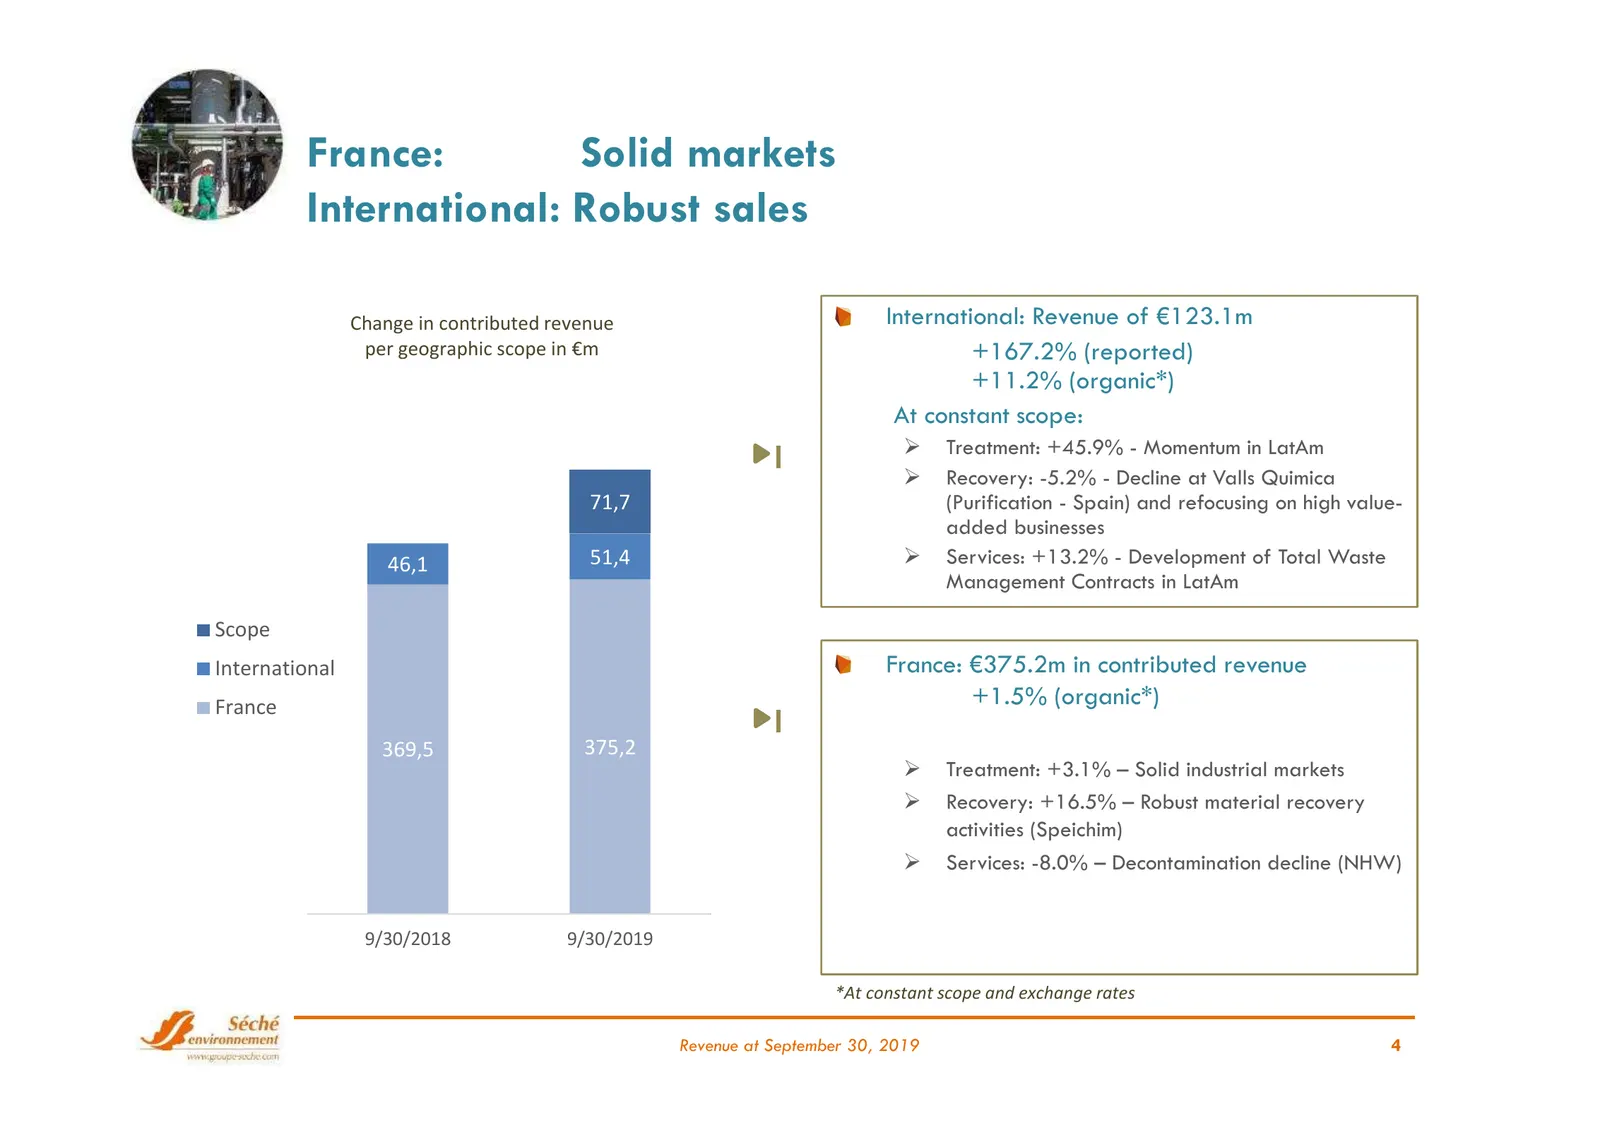
France: Solid markets International: Robust sales Change in contributed revenue International: Revenue of €123.1m per geographic scope in €m +167.2% (reported) +11.2% (organic*) At constant scope: Treatment: +45.9% - Momentum in LatAm Recovery: -5.2% - Decline at Valls Quimica 71,7 (Purification
Slide 5: Quality organic growth in Q3 2019
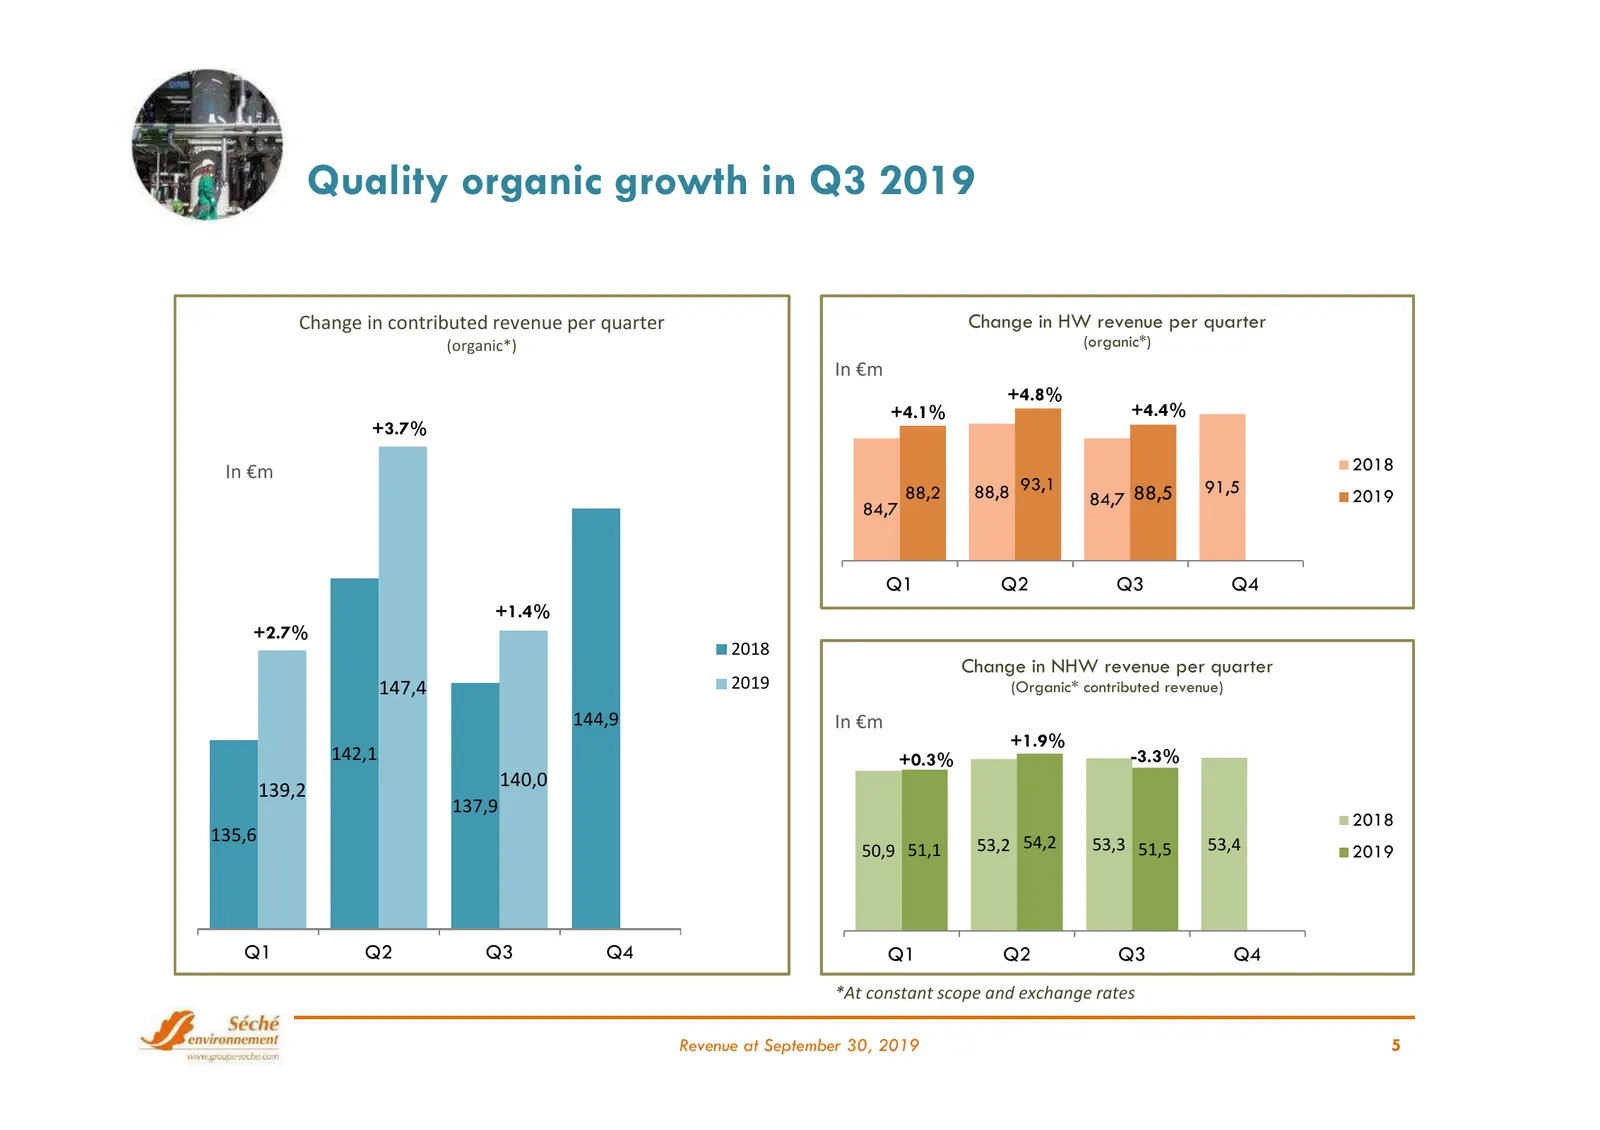
Quality organic growth in Q3 2019 Change in contributed revenue per quarter Change in HW revenue per quarter (organic*) (organic*) In €m +4.8% +4.1% +4.4% +3.7% In €m 2018 88,2 88,8 93,1 84,7 88,5 91,5 2019 84,7 Q1 Q2 Q3 Q4 +1.4% +2.7% 2018 Change in NHW revenue per quarter 147,4 2019 (Organic* cont
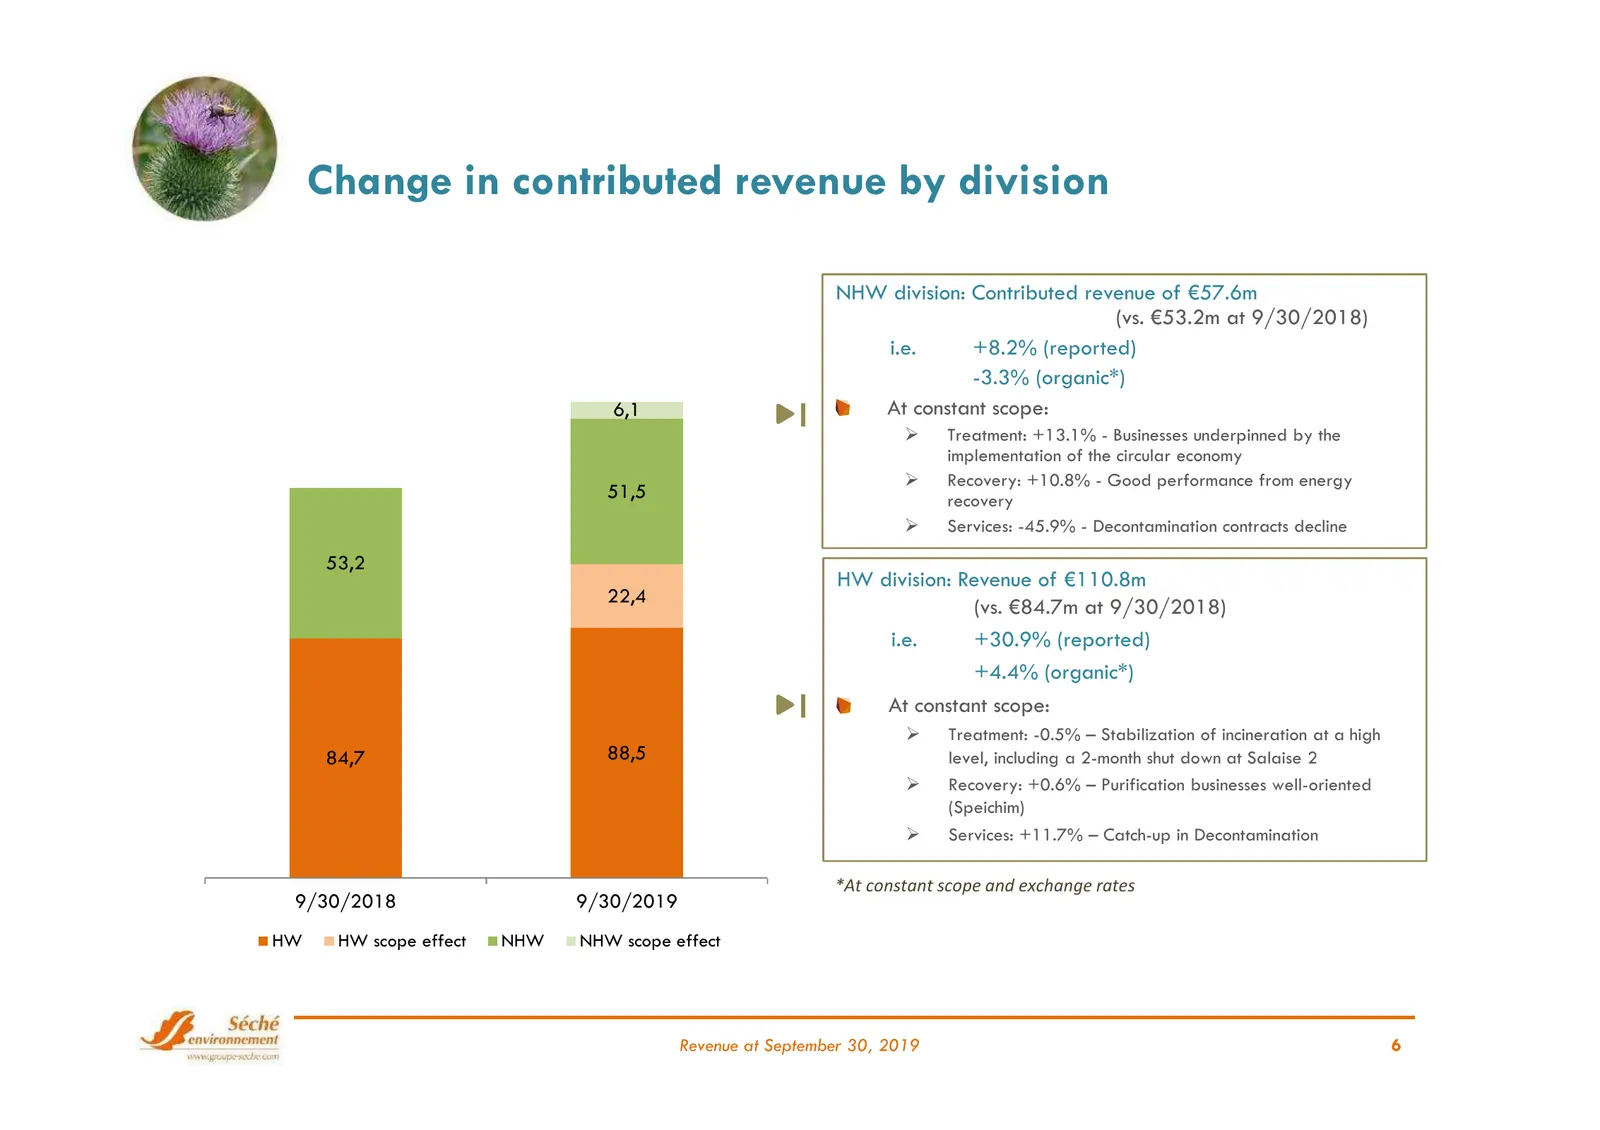
Slide 6: Change in contributed revenue by division
Change in contributed revenue by division NHW division: Contributed revenue of €57.6m (vs. €53.2m at 9/30/2018) i.e. +8.2% (reported) -3.3% (organic*) 6,1 At constant scope: Treatment: +13.1% - Businesses underpinned by the implementation of the circular economy Recovery: +10.8% - Good performan
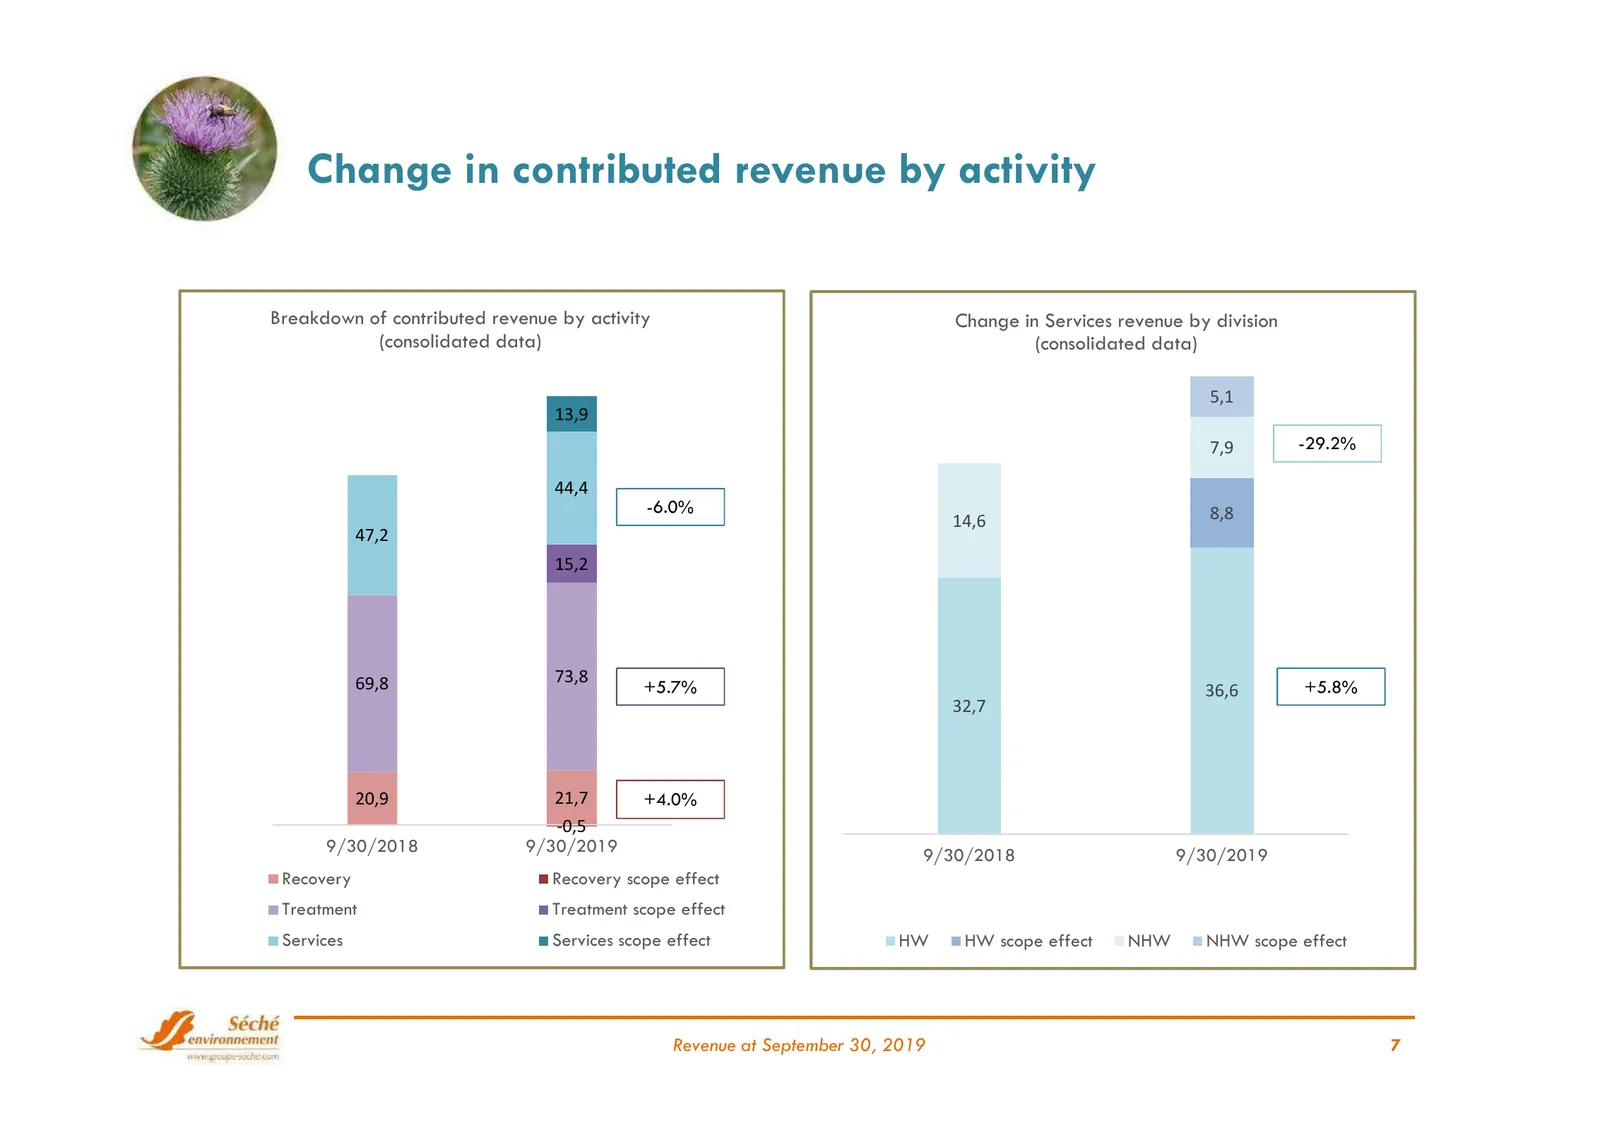
Slide 7: Change in contributed revenue by activity
Change in contributed revenue by activity Breakdown of contributed revenue by activity Change in Services revenue by division (consolidated data) (consolidated data) 5,1 13,9 7,9 -29.2% 44,4 -6.0% 8,8 14,6 47,2 15,2 69,8 73,8 +5.7% 36,6 +5.8% 32,7 20,9 21,7 +4.0% -0,5 9/30/2018 9/30/2019 9/30/2018 9
Slide 8: 2019 Targets confirmed
2019 Targets confirmed* Stable macro-economic environment • HW division: Industrial production maintained at a high level • NHW division: Solid markets on the back of the implementation of the circular economy Change in the availability of some facilities in Q4 • Salaise 2: Revamping finalized in Oc
Slide 9: Questions? Answers
Questions? Answers Contact: Manuel Andersen Head of Investor Relations m.andersen@groupe-seche.com
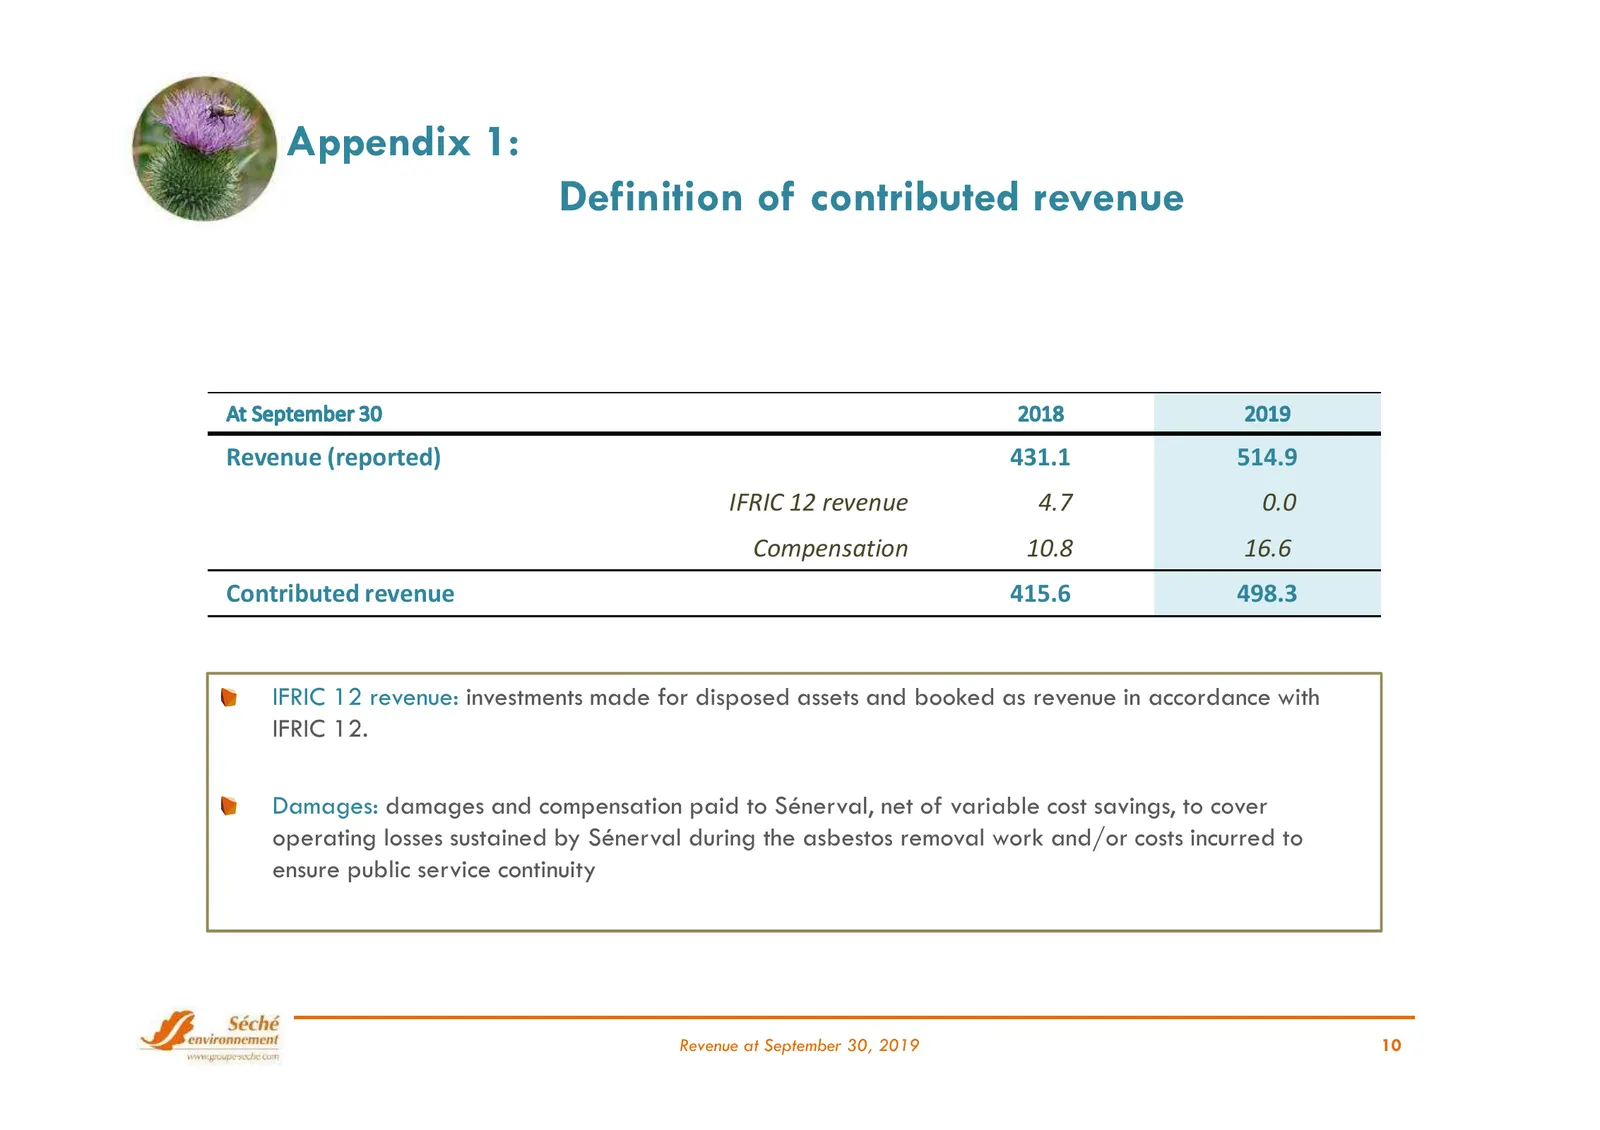
Slide 10: Appendix 1: Definition of contributed revenue
Appendix 1: Definition of contributed revenue Revenue (reported) 431.1 514.9 IFRIC 12 revenue 4.7 0.0 Compensation 10.8 16.6 Contributed revenue 415.6 498.3 IFRIC 12 revenue: investments made for disposed assets and booked as revenue in accordance with IFRIC 12. Damages: damages and compensation pai
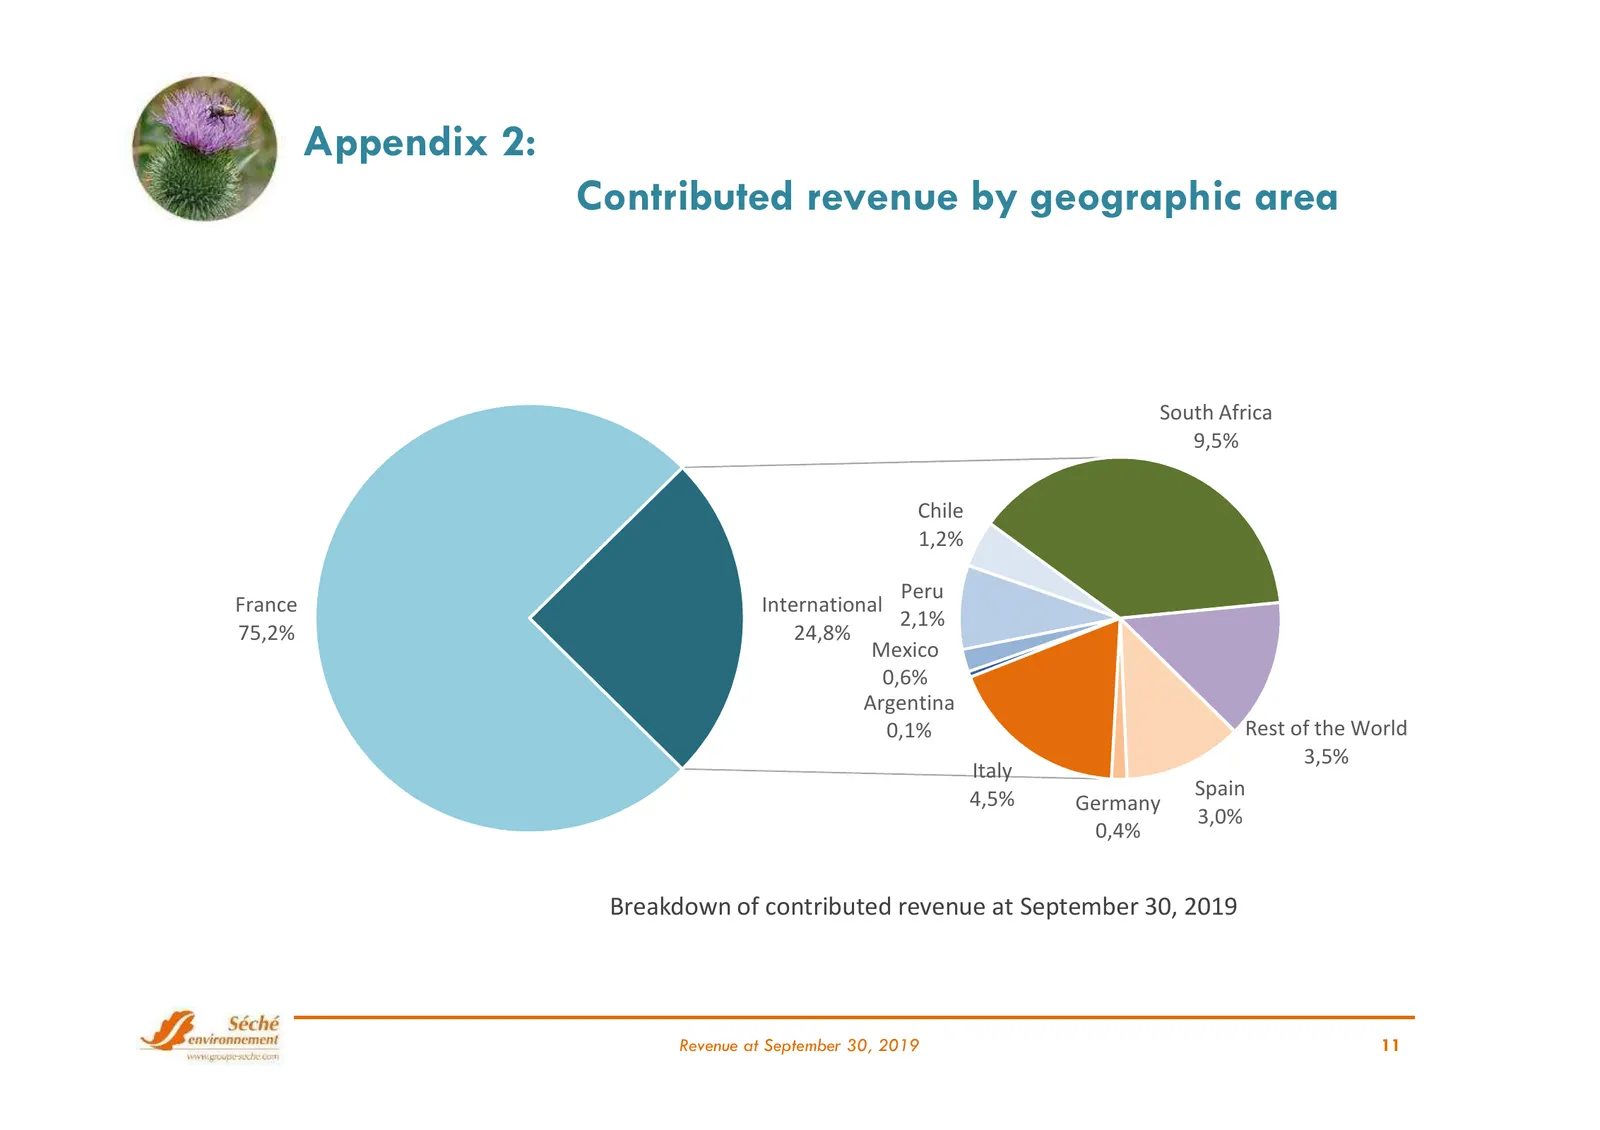
Slide 11: Appendix 2: Contributed revenue by geographic area
Appendix 2: Contributed revenue by geographic area South Africa 9,5% Chile 1,2% Peru France International 2,1% 75,2% 24,8% Mexico 0,6% Argentina 0,1% Rest of the World 3,5% Italy 4,5% Spain Germany 3,0% 0,4% Breakdown of contributed revenue at September 30, 2019 Revenue at September 30, 2019 11
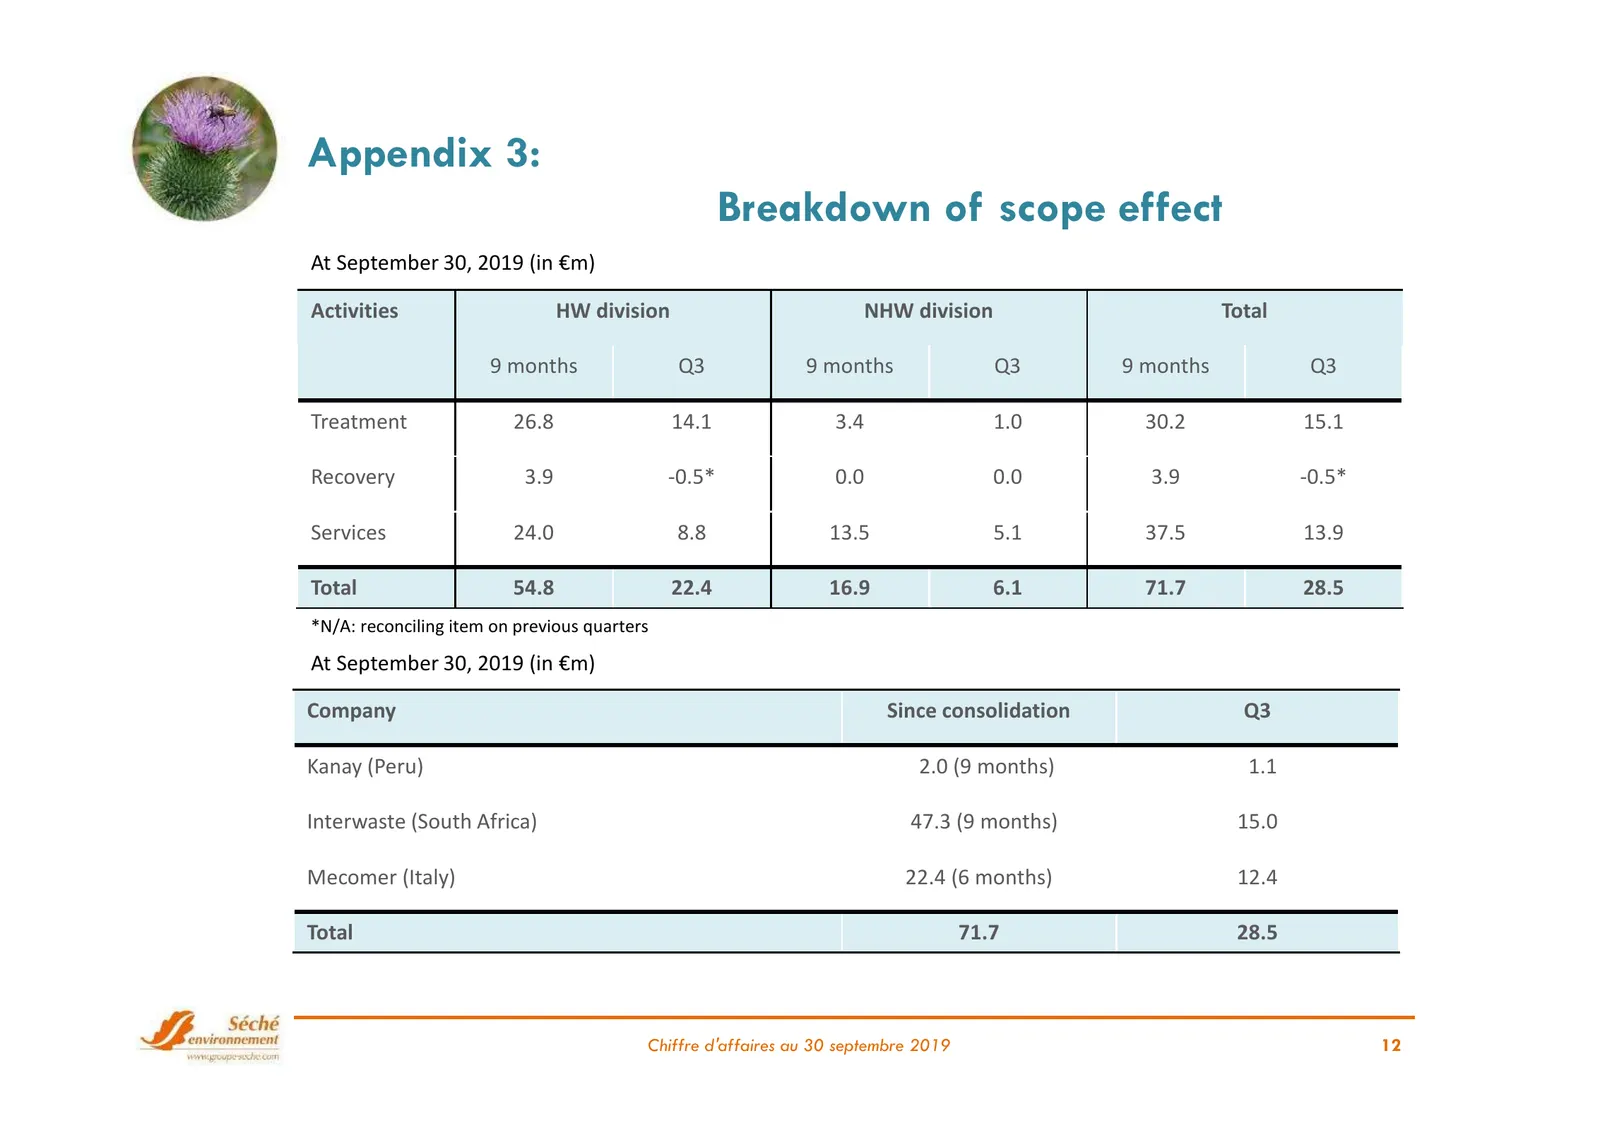
Slide 12: Appendix 3: Breakdown of scope effect
Appendix 3: Breakdown of scope effect At September 30, 2019 (in €m) Activities HW division NHW division Total 9 months Q3 9 months Q3 9 months Q3 Treatment 26.8 14.1 3.4 1.0 30.2 15.1 Recovery 3.9 -0.5* 0.0 0.0 3.9 -0.5* Services 24.0 8.8 13.5 5.1 37.5 13.9 Total 54.8 22.4 16.9 6.1 71.7 28.5 *N/A: r
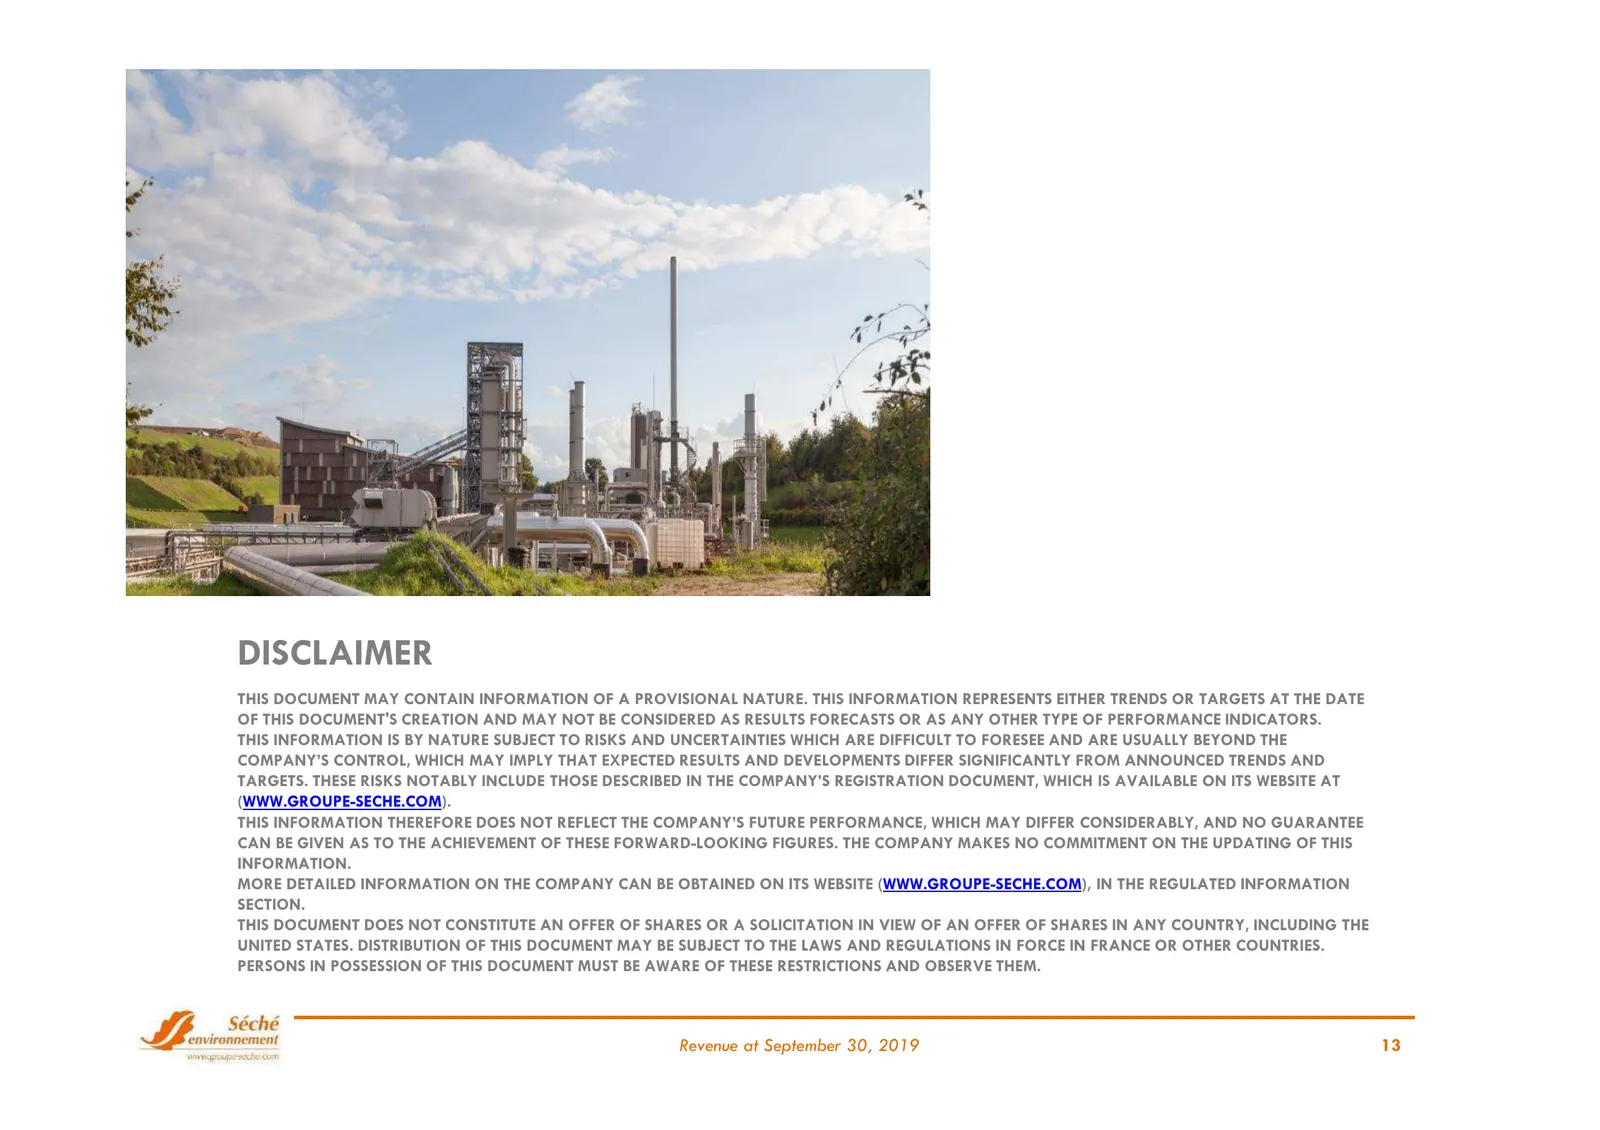
Slide 13: Disclaimer
DISCLAIMER THIS DOCUMENT MAY CONTAIN INFORMATION OF A PROVISIONAL NATURE. THIS INFORMATION REPRESENTS EITHER TRENDS OR TARGETS AT THE DATE OF THIS DOCUMENT'S CREATION AND MAY NOT BE CONSIDERED AS RESULTS FORECASTS OR AS ANY OTHER TYPE OF PERFORMANCE INDICATORS. THIS INFORMATION IS BY NATURE SUBJECT
Source: Internet Archive copy of groupe-seche.com
More decks from Seche Environnement SA
 Groupe Séché Environnement — Q3 2026 Earnings Presentation13 slides · Oct 27, 2026
 H1 2026 Earnings Presentation34 slides · Sep 9, 2026
 H1 2026 Earnings Presentation34 slides · Sep 9, 2026
 Q1 2026 Earnings Presentation10 slides · Apr 23, 2026
 FY2025 Earnings Presentation43 slides · Mar 10, 2026
 Q3 2025 Earnings Presentation13 slides · Oct 28, 2025