Valvoline Inc. · NYSE:VVV
Valvoline — Investor Day (December 2025)
85 slides from Valvoline's investor day presentation, Dec 11, 2025
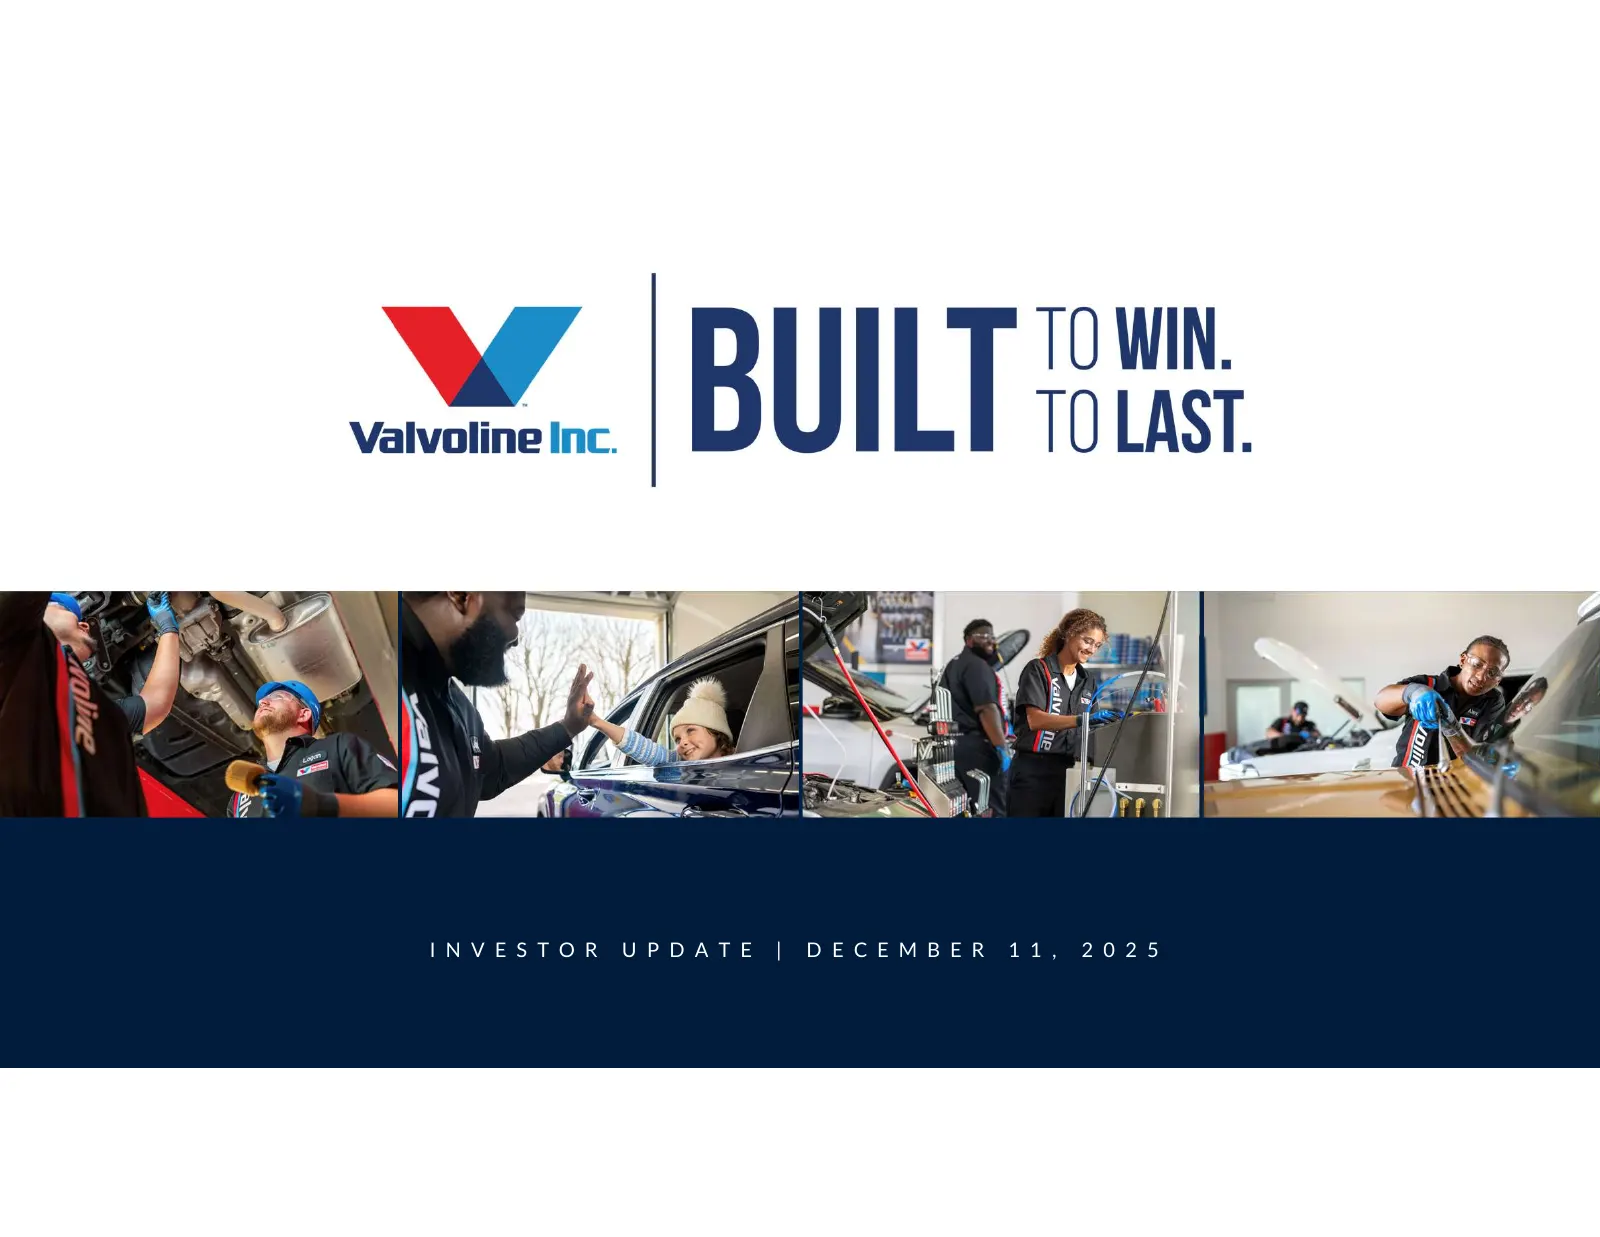
Slide 1: Investor Update, December 11, 2025
I N V E S T O R U P D A T E | D E C E M B E R 1 1 , 2 0 2 5
Slide 2: Welcome and Agenda
Welcome and Agenda Built to Win & Built to Last Lori Flees, President & Chief Executive Officer Operational Excellence Agenda Linne Fulcher, Chief Operating Officer Break Franchise Advantage & Growth Drivers Adam Worsham, Chief Franchising Officer Clear Roadmap to Accelerating Growth and Driving Per
Slide 3: Safe Harbor
Safe Harbor Forward-Looking Statements Certain statements herein, other than statements of historical fact, are forward-looking statements within the meaning of the Private Securities Litigation Reform Act of 1995. Such forward-looking statements may include, without limitation, statements about the

Slide 4: YYZ Valvoline inc.
YYZ Valvoline inc.
Slide 5: Built to Win & Built to Last
Built to Win & Built to Last Lori Flees, President & Chief Executive Officer 5
Slide 6: Today's Focus
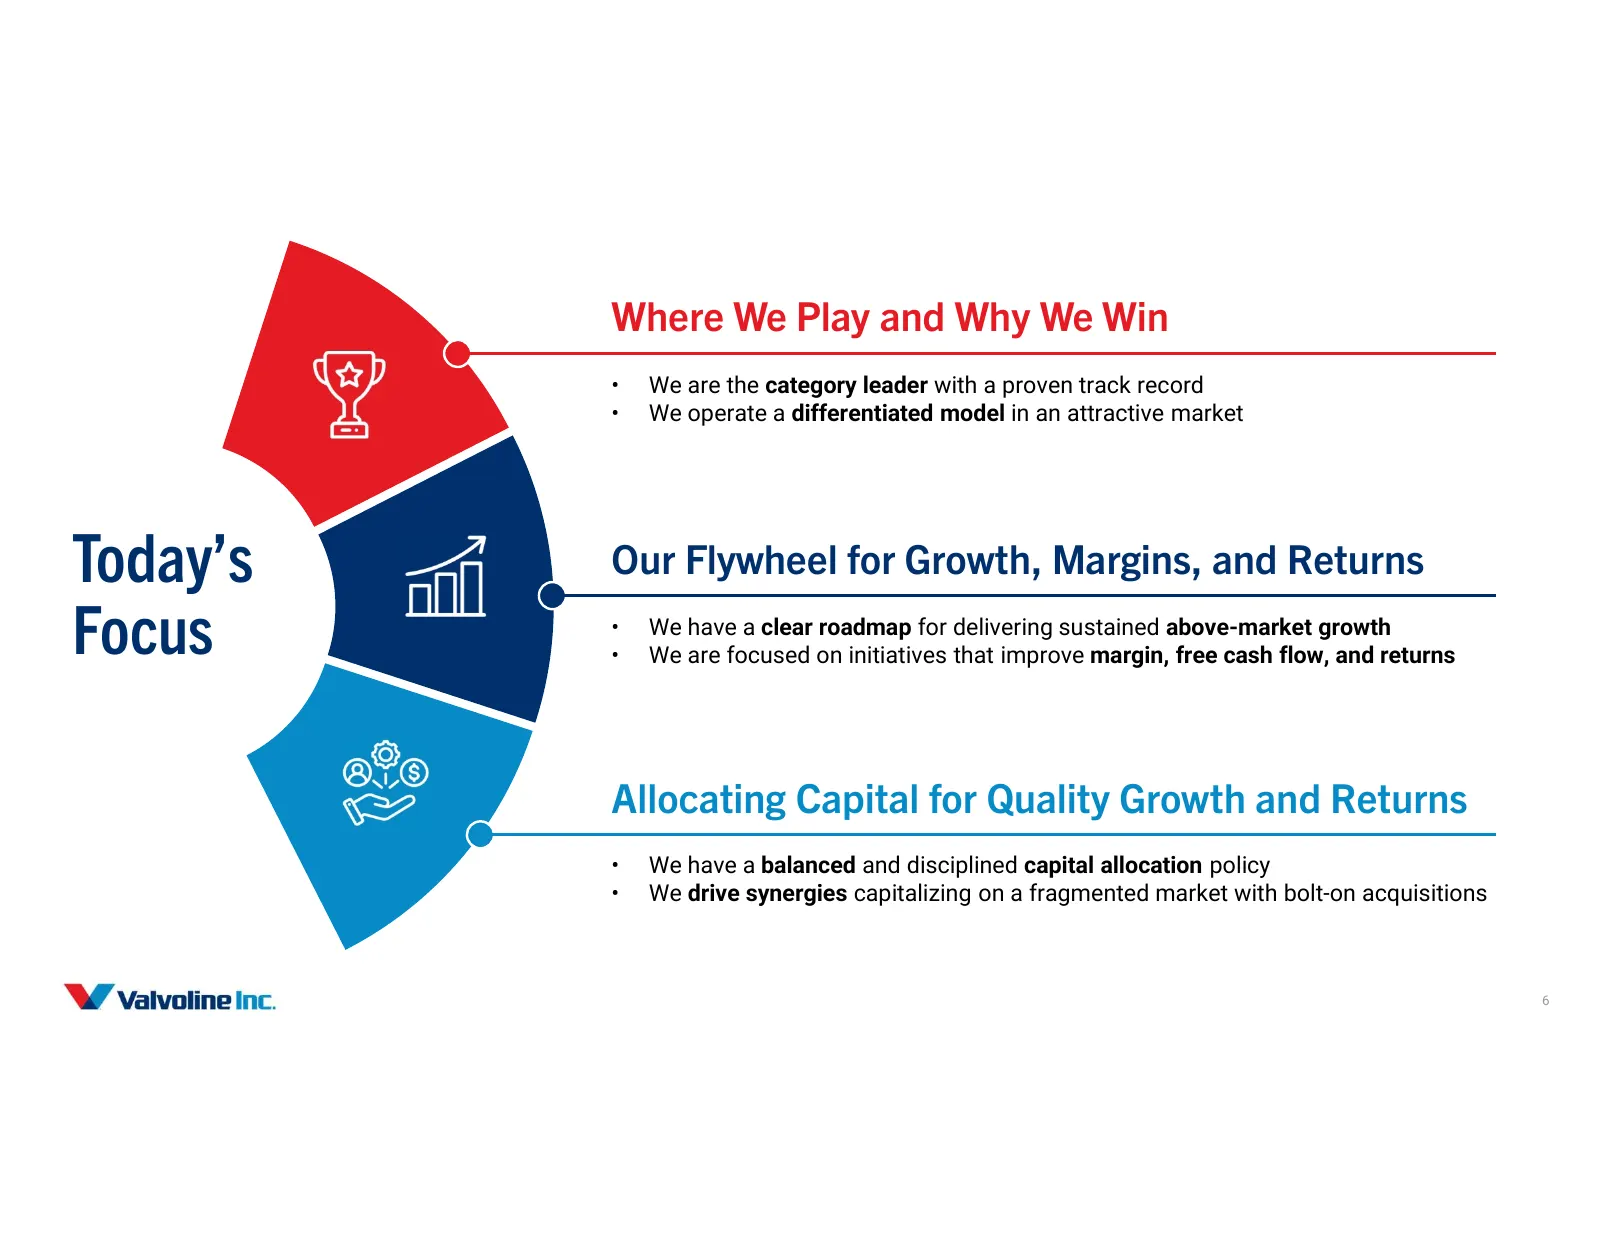
Where We Play and Why We Win • We are the category leader with a proven track record • We operate a differentiated model in an attractive market Today’s Our Flywheel for Growth, Margins, and Returns Focus • • We have a clear roadmap for delivering sustained above-market growth We are focused on init
Slide 7: Valvoline has a Legacy of Delivering Value
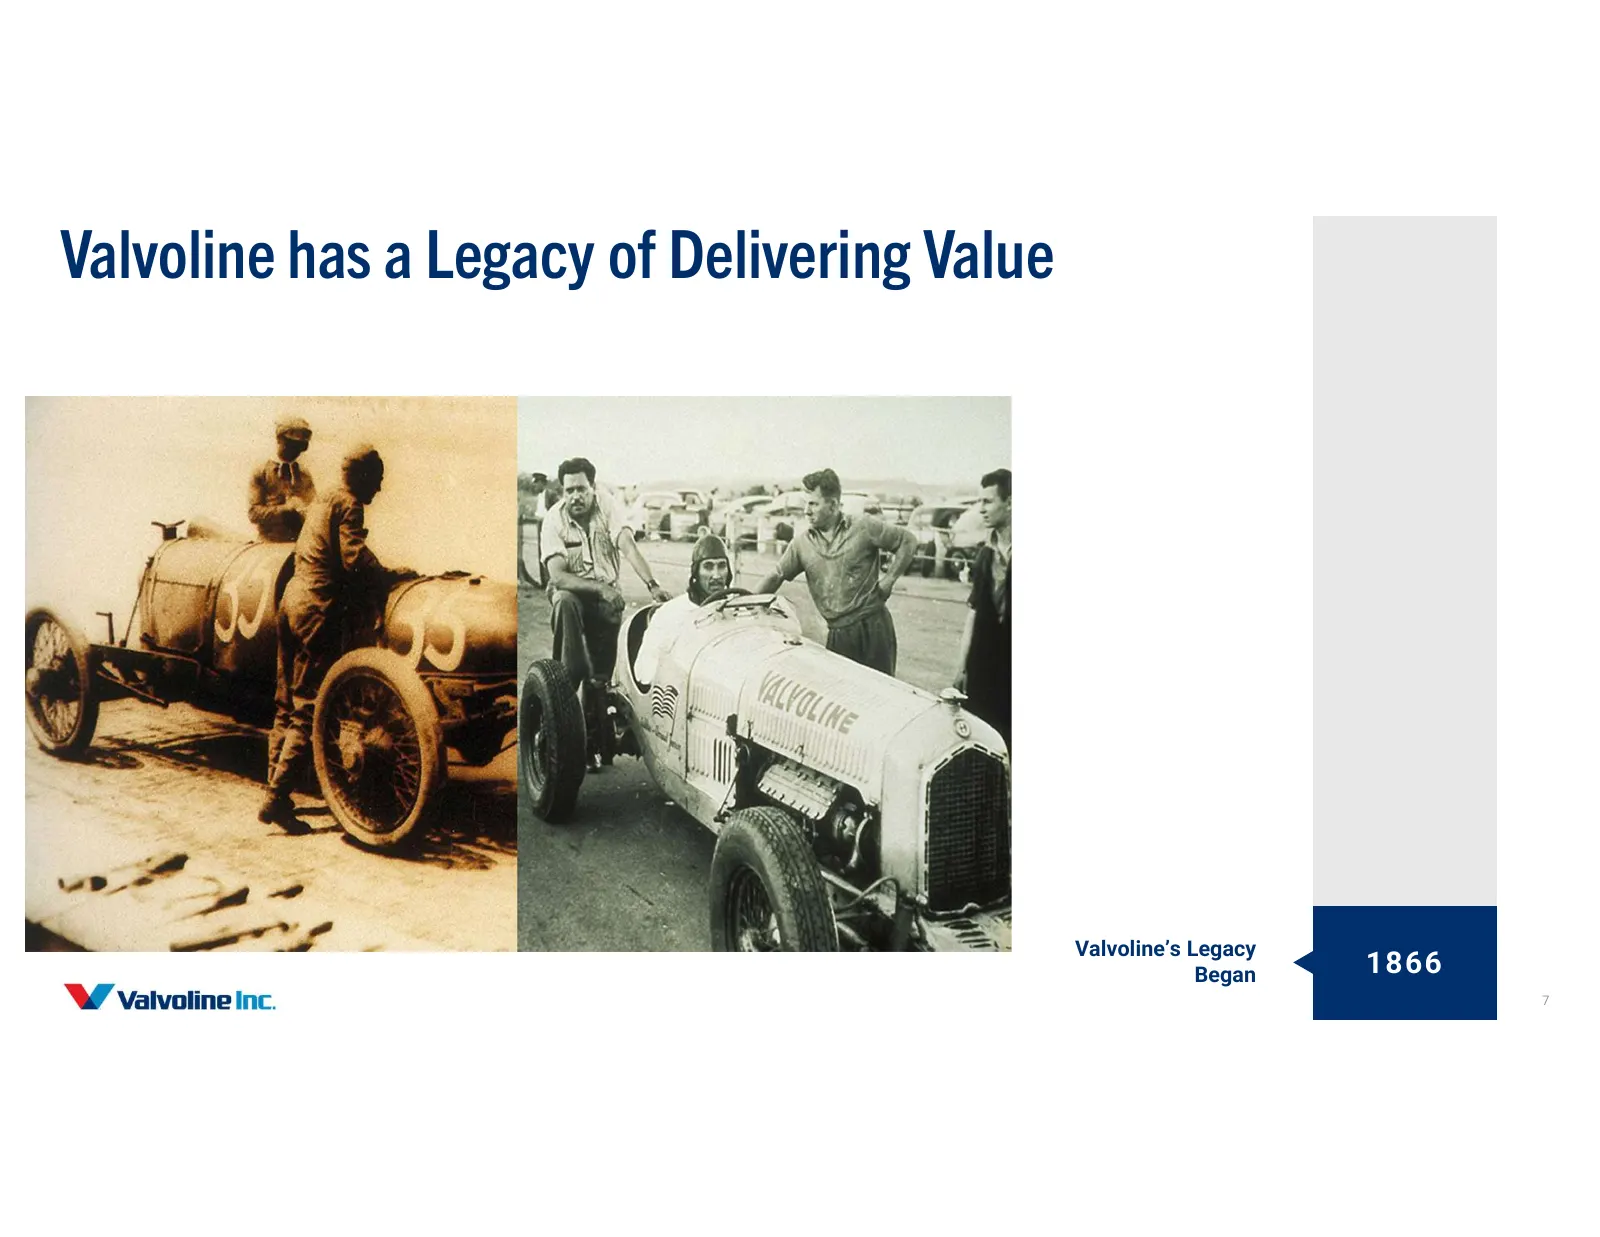
Valvoline has a Legacy of Delivering Value TODAY 2023 2021 2016 1989 1986 Valvoline’s Legacy Began 1866 7
Slide 8: Valvoline has a Legacy of Delivering Value
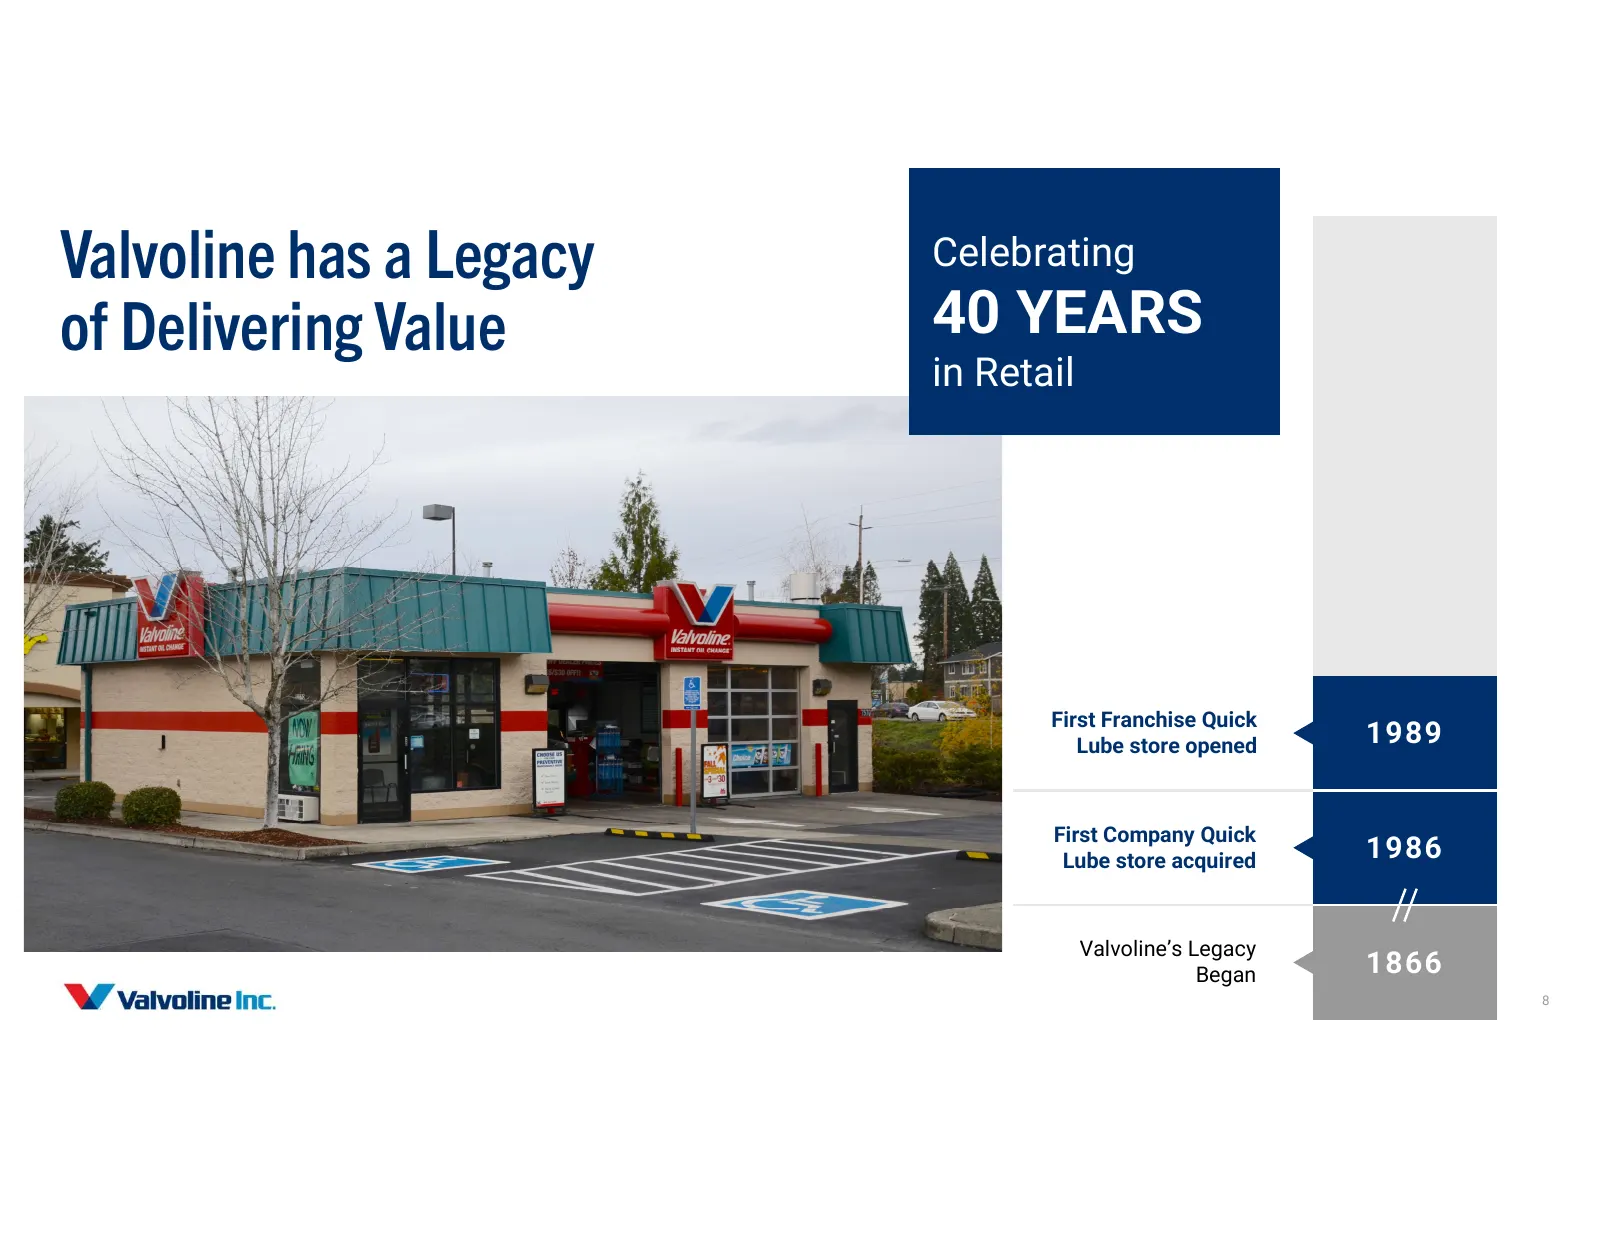
Valvoline has a Legacy Celebrating TODAY of Delivering Value 40 YEARS in Retail 2023 2021 2016 First Franchise Quick Lube store opened 1989 First Company Quick Lube store acquired 1986 Valvoline’s Legacy Began 1866 8
Slide 9: Valvoline has a Legacy of Delivering Value
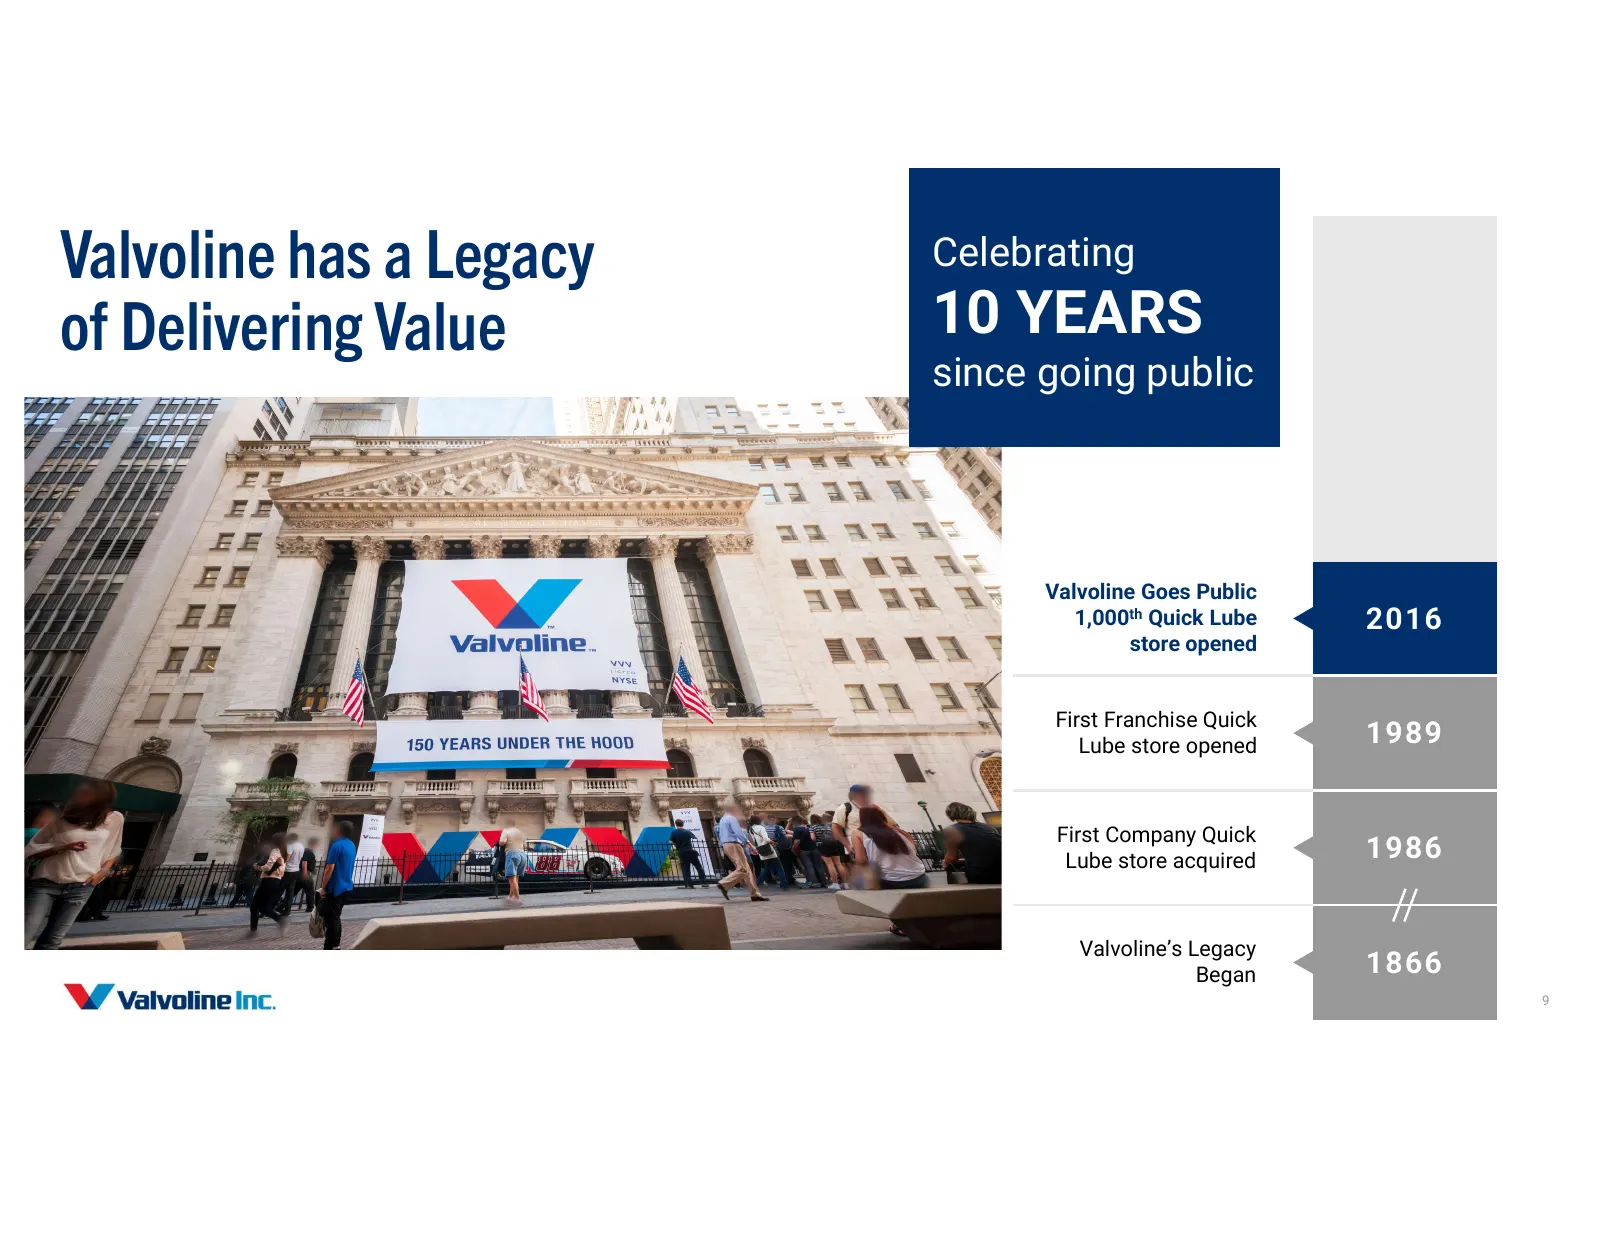
Valvoline has a Legacy Celebrating TODAY of Delivering Value 10 YEARS since going public 2023 2021 Valvoline Goes Public 1,000th Quick Lube 2016 store opened First Franchise Quick Lube store opened 1989 First Company Quick Lube store acquired 1986 Valvoline’s Legacy Began 1866 9
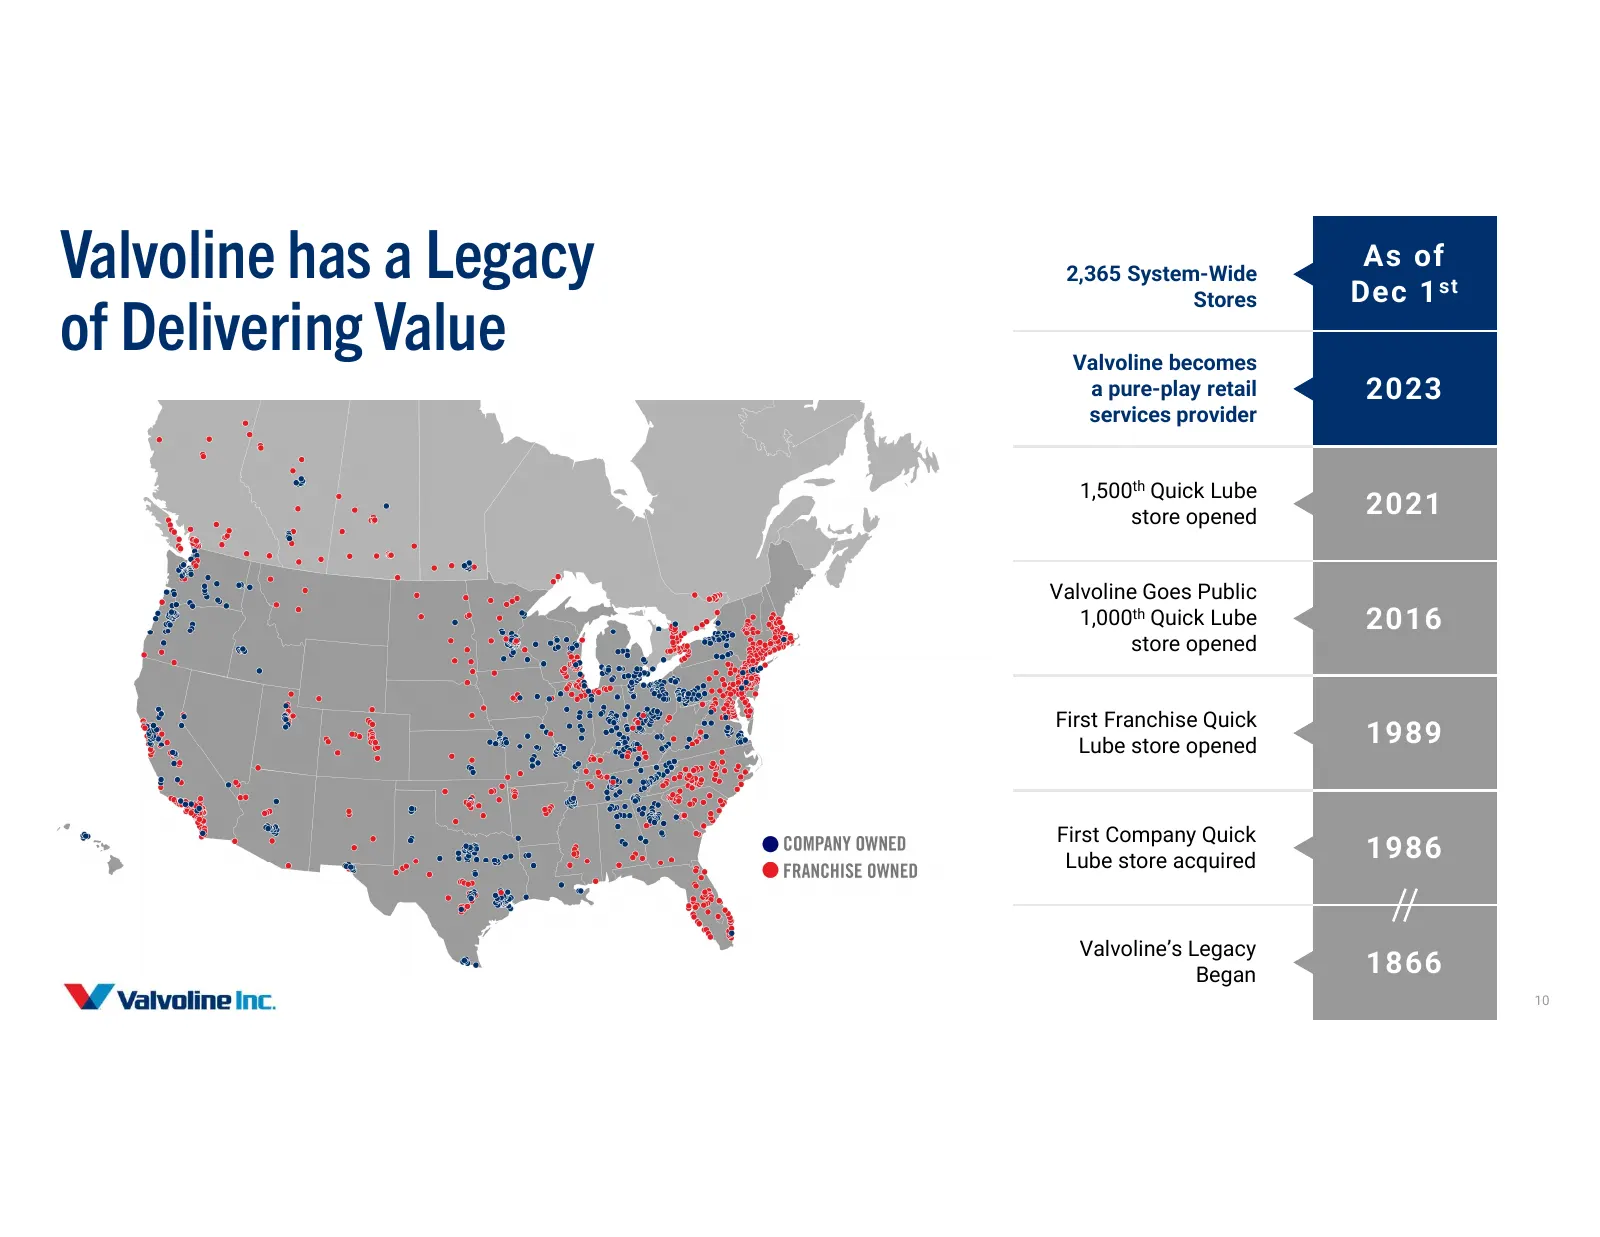
Slide 10: Valvoline has a Legacy of Delivering Value
Valvoline has a Legacy 2,365 System-Wide As of Dec 1 st of Delivering Value Stores Valvoline becomes a pure-play retail 2023 services provider 1,500th Quick Lube store opened 2021 Valvoline Goes Public 1,000th Quick Lube 2016 store opened First Franchise Quick Lube store opened 1989 First Company Qu
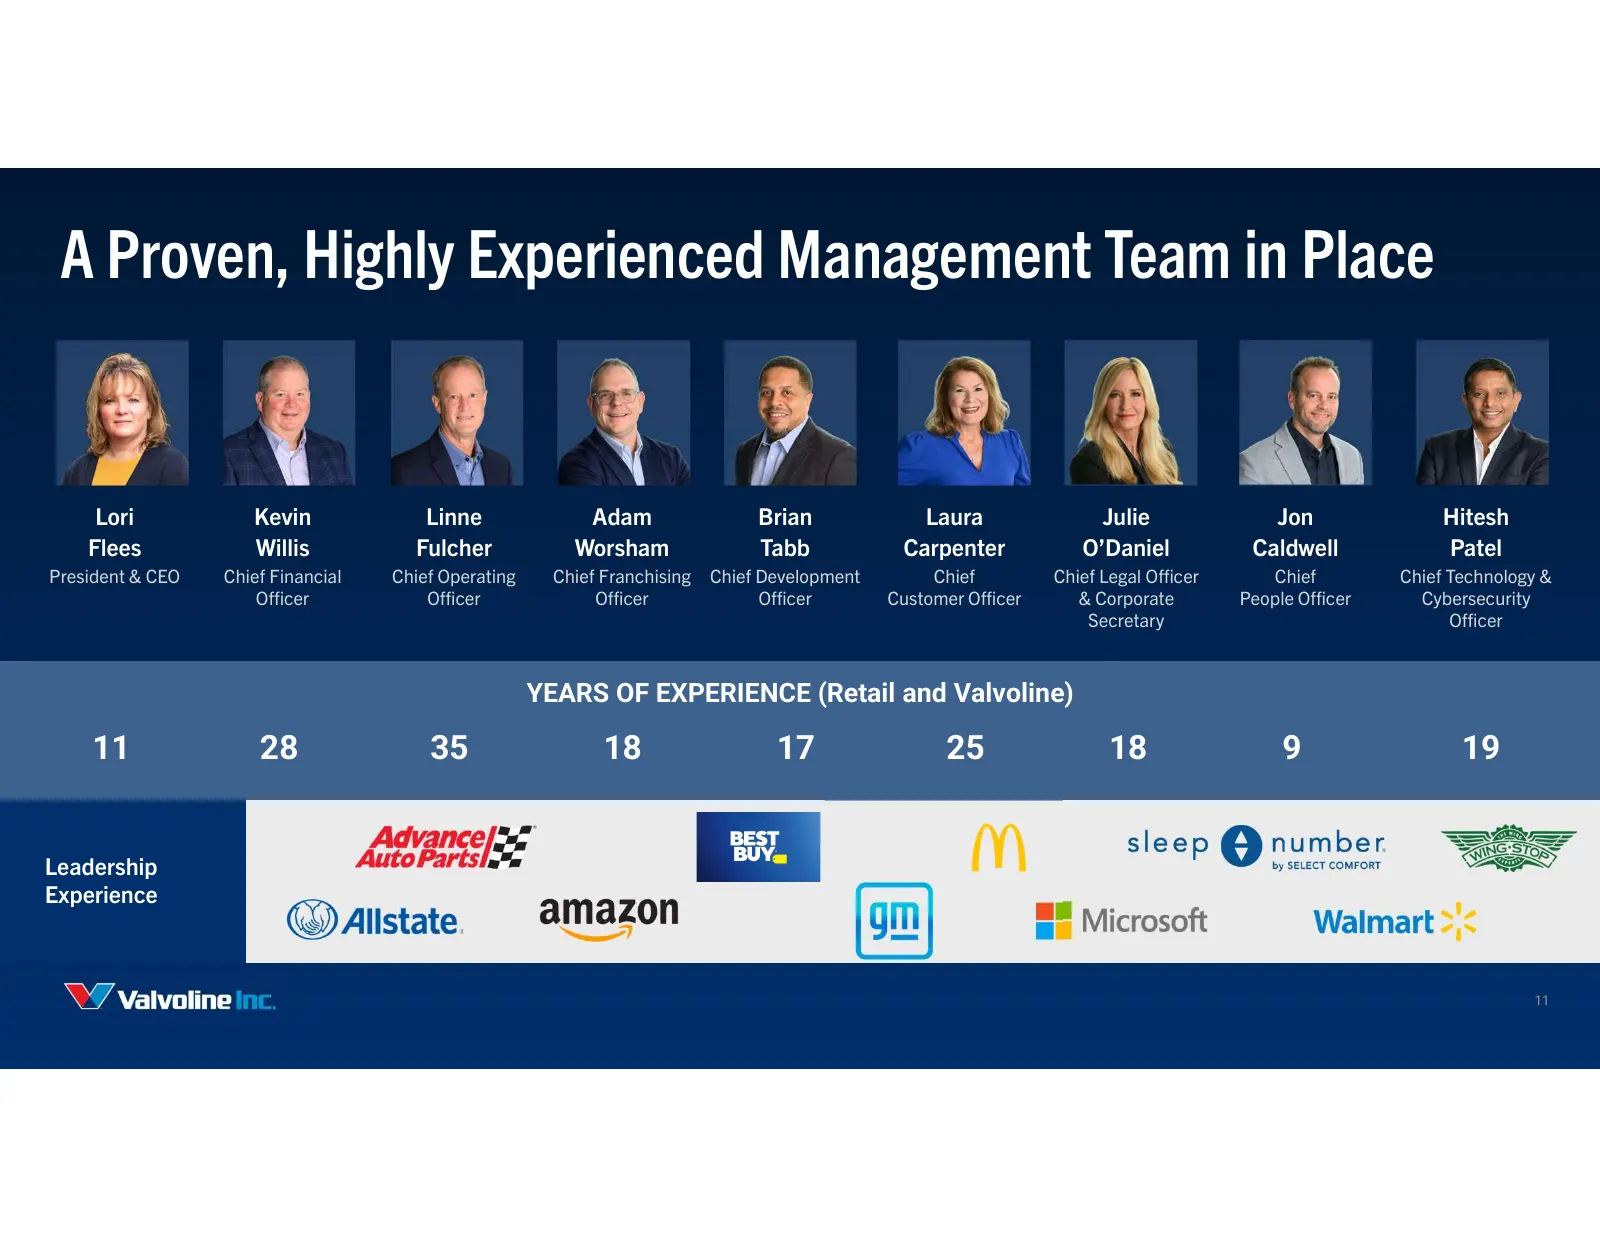
Slide 11: A Proven, Highly Experienced Management Team in Place
A Proven, Highly Experienced Management Team in Place Lori Kevin Linne Adam Brian Laura Julie Jon Hitesh Flees Willis Fulcher Worsham Tabb Carpenter O’Daniel Caldwell Patel President & CEO Chief Financial Chief Operating Chief Franchising Chief Development Chief Chief Legal Officer Chief Chief Techn
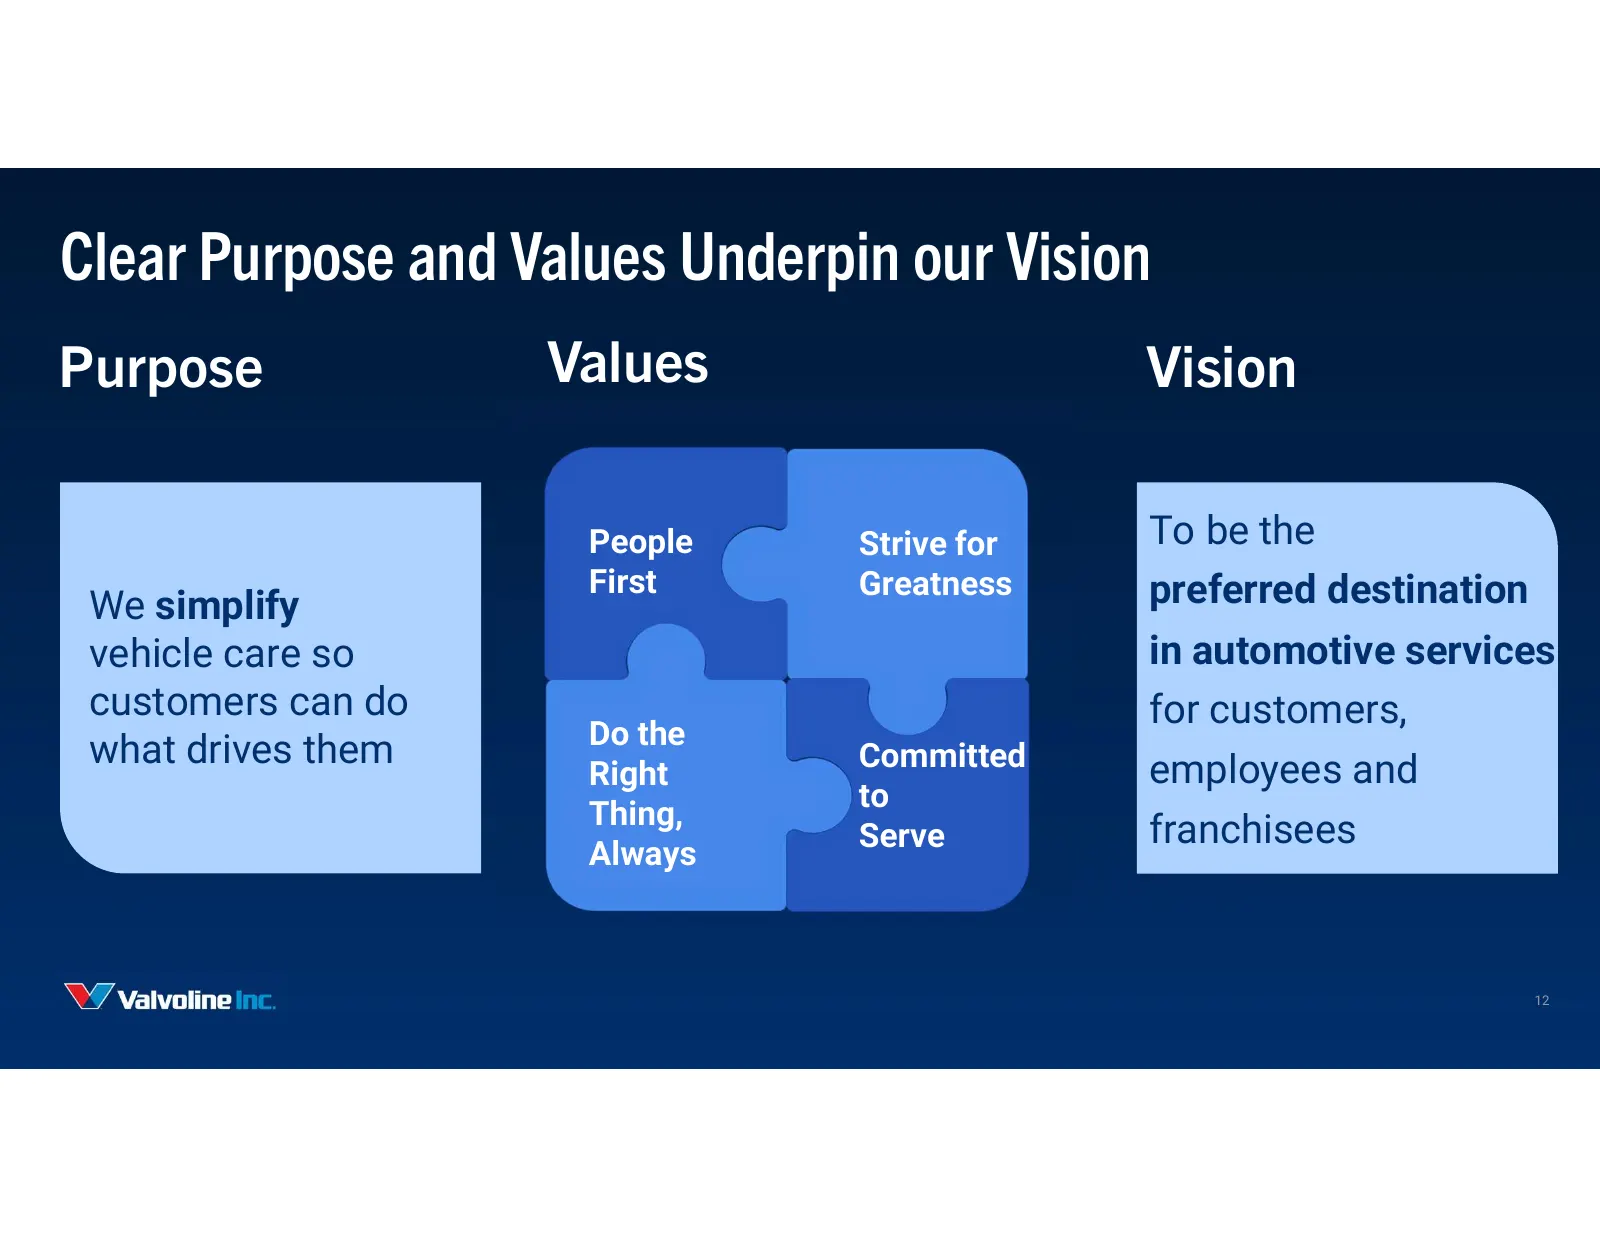
Slide 12: Clear Purpose and Values Underpin our Vision
Clear Purpose and Values Underpin our Vision Purpose Values Vision People Strive for To be the First Greatness preferred destination We simplify vehicle care so in automotive services customers can do for customers, Do the what drives them Committed Right employees and to Thing, Serve franchisees Al
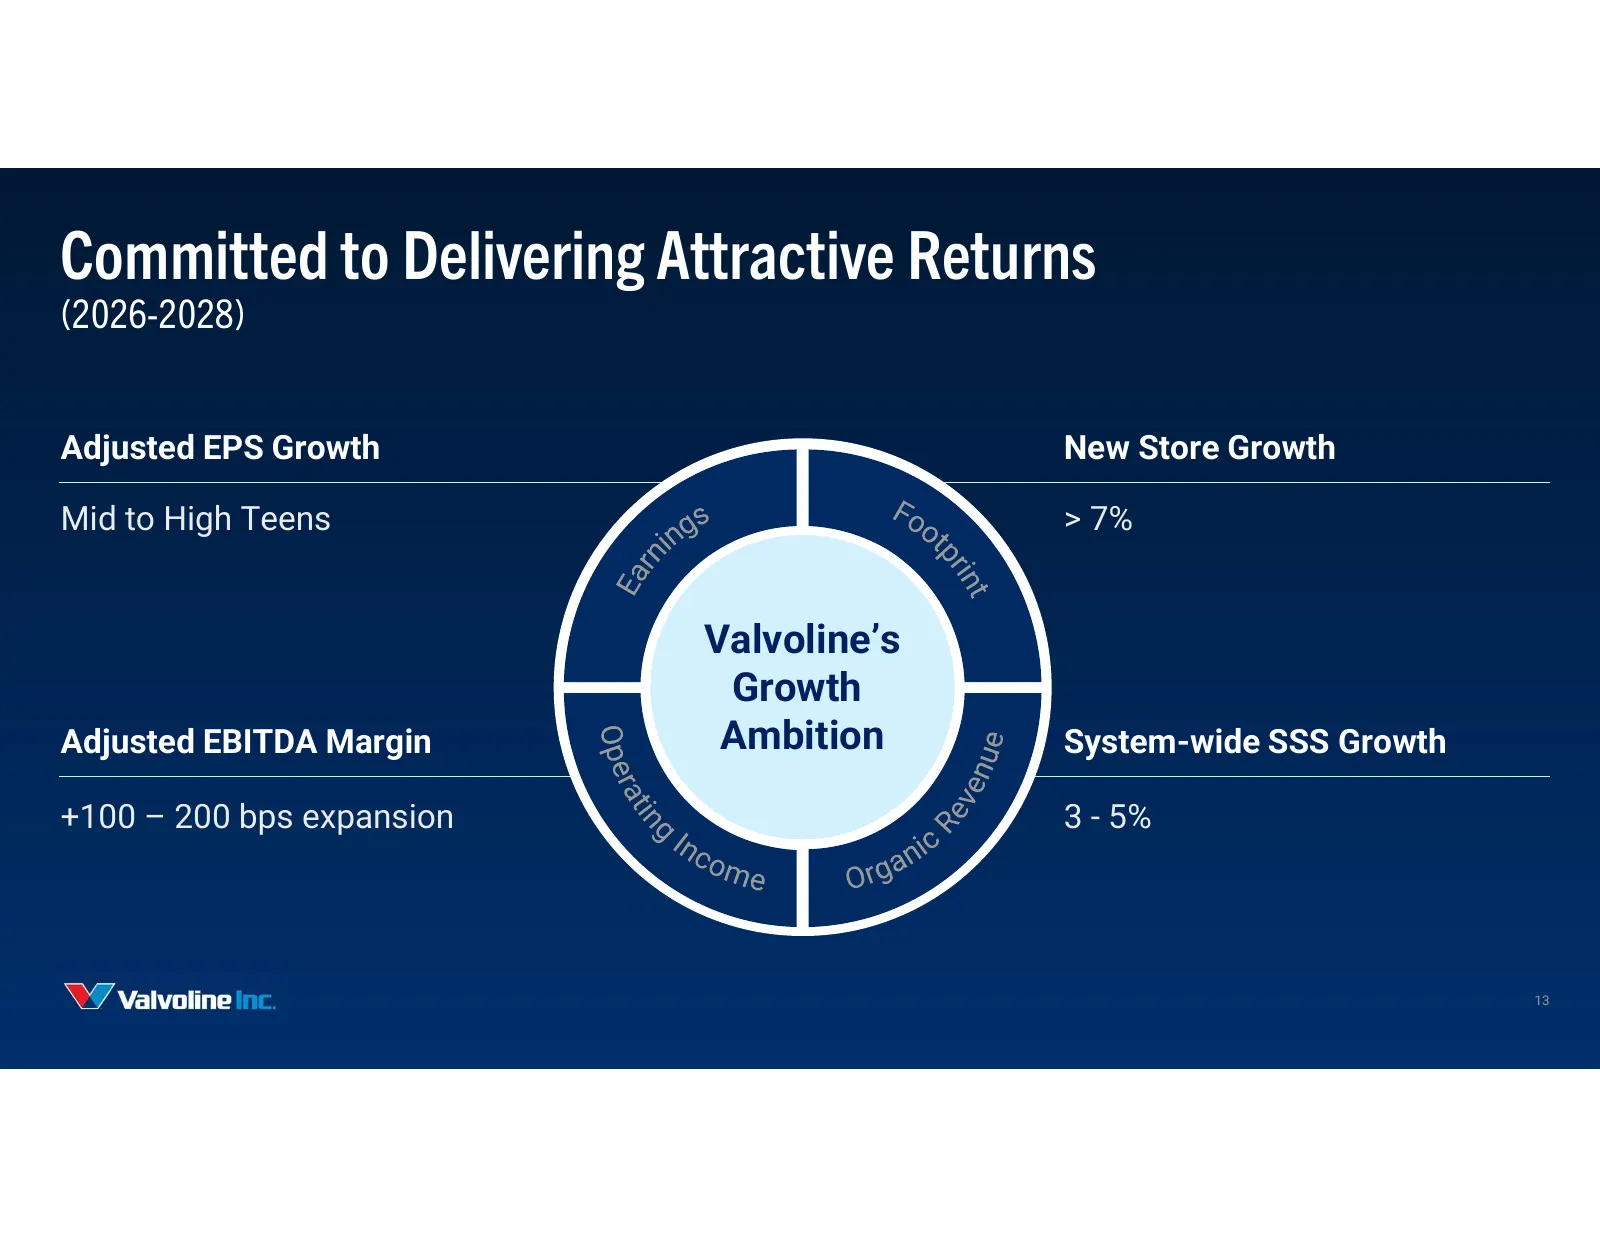
Slide 13: Committed to Delivering Attractive Returns
Committed to Delivering Attractive Returns (2026-2028) Adjusted EPS Growth New Store Growth Mid to High Teens > 7% Valvoline’s Growth Adjusted EBITDA Margin Ambition System-wide SSS Growth +100 – 200 bps expansion 3 - 5% 13
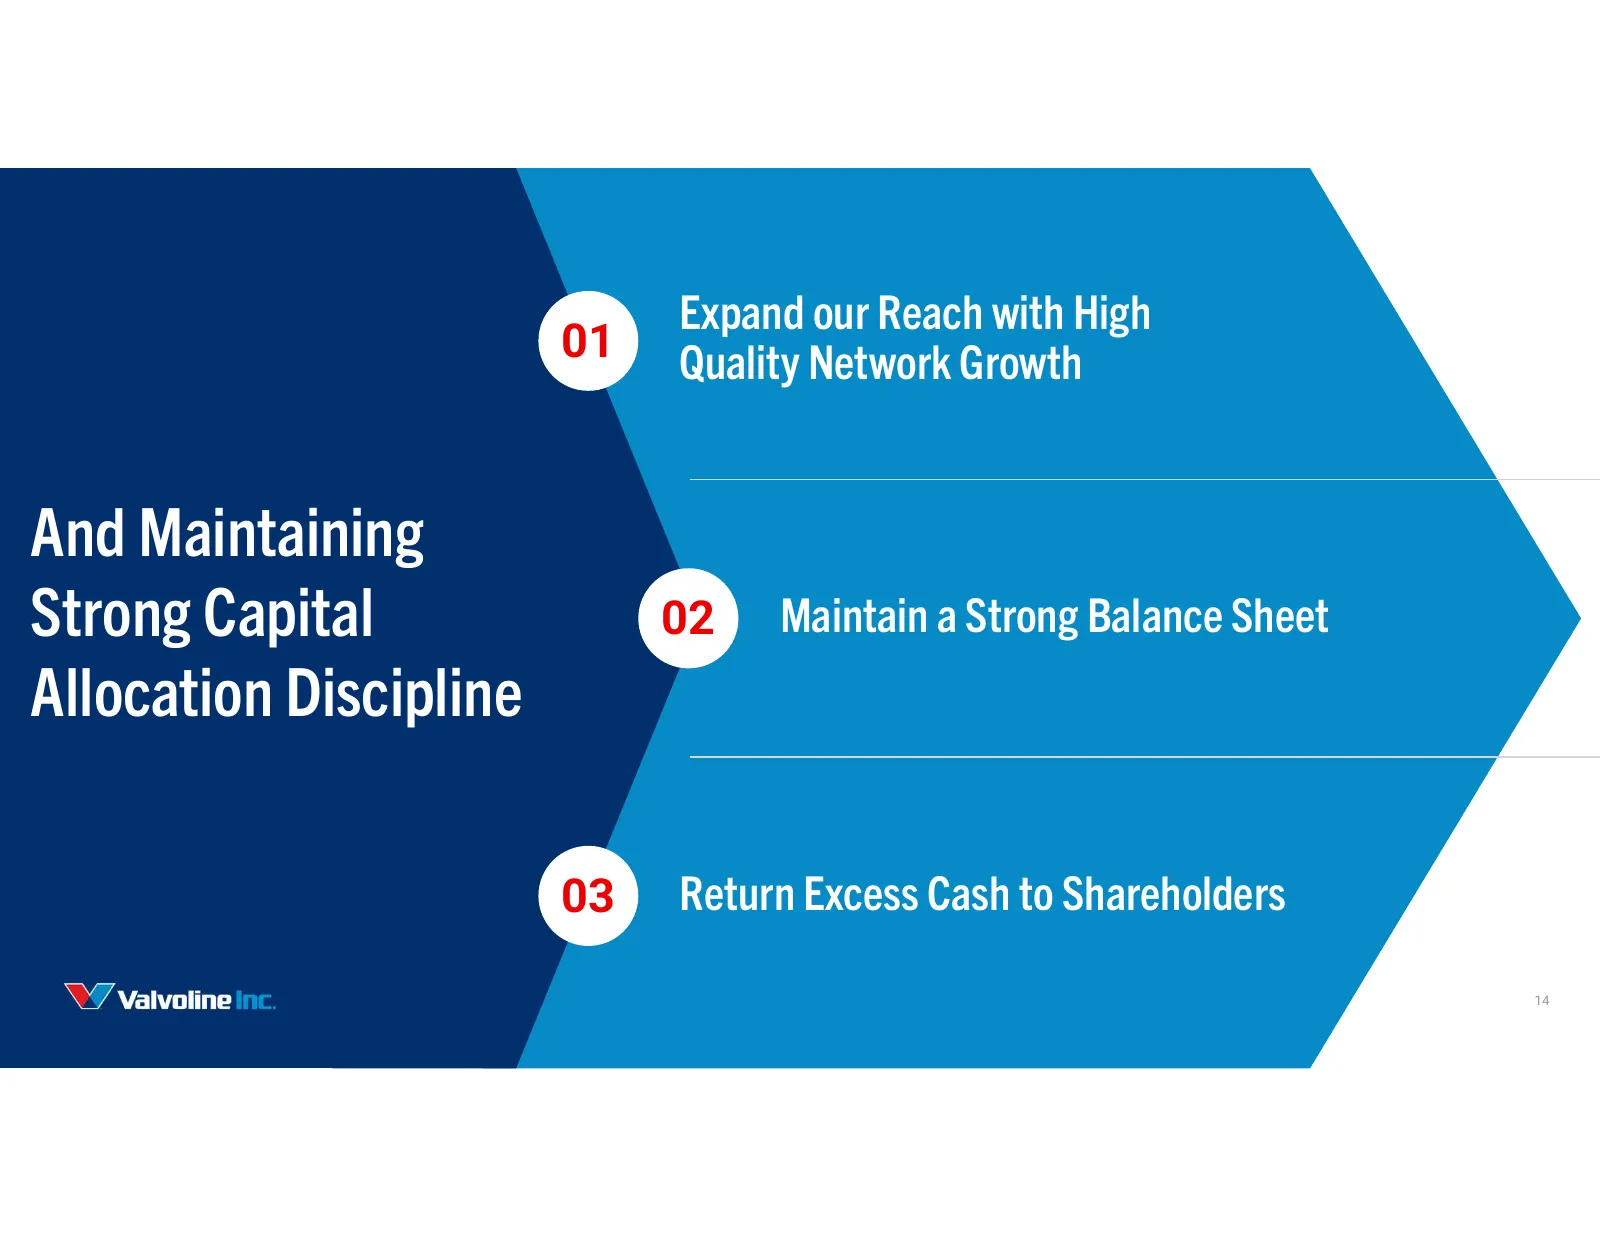
Slide 14: And Maintaining Strong Capital Allocation Discipline
Expand our Reach with High 01 Quality Network Growth And Maintaining Strong Capital 02 Maintain a Strong Balance Sheet Allocation Discipline 03 Return Excess Cash to Shareholders 14
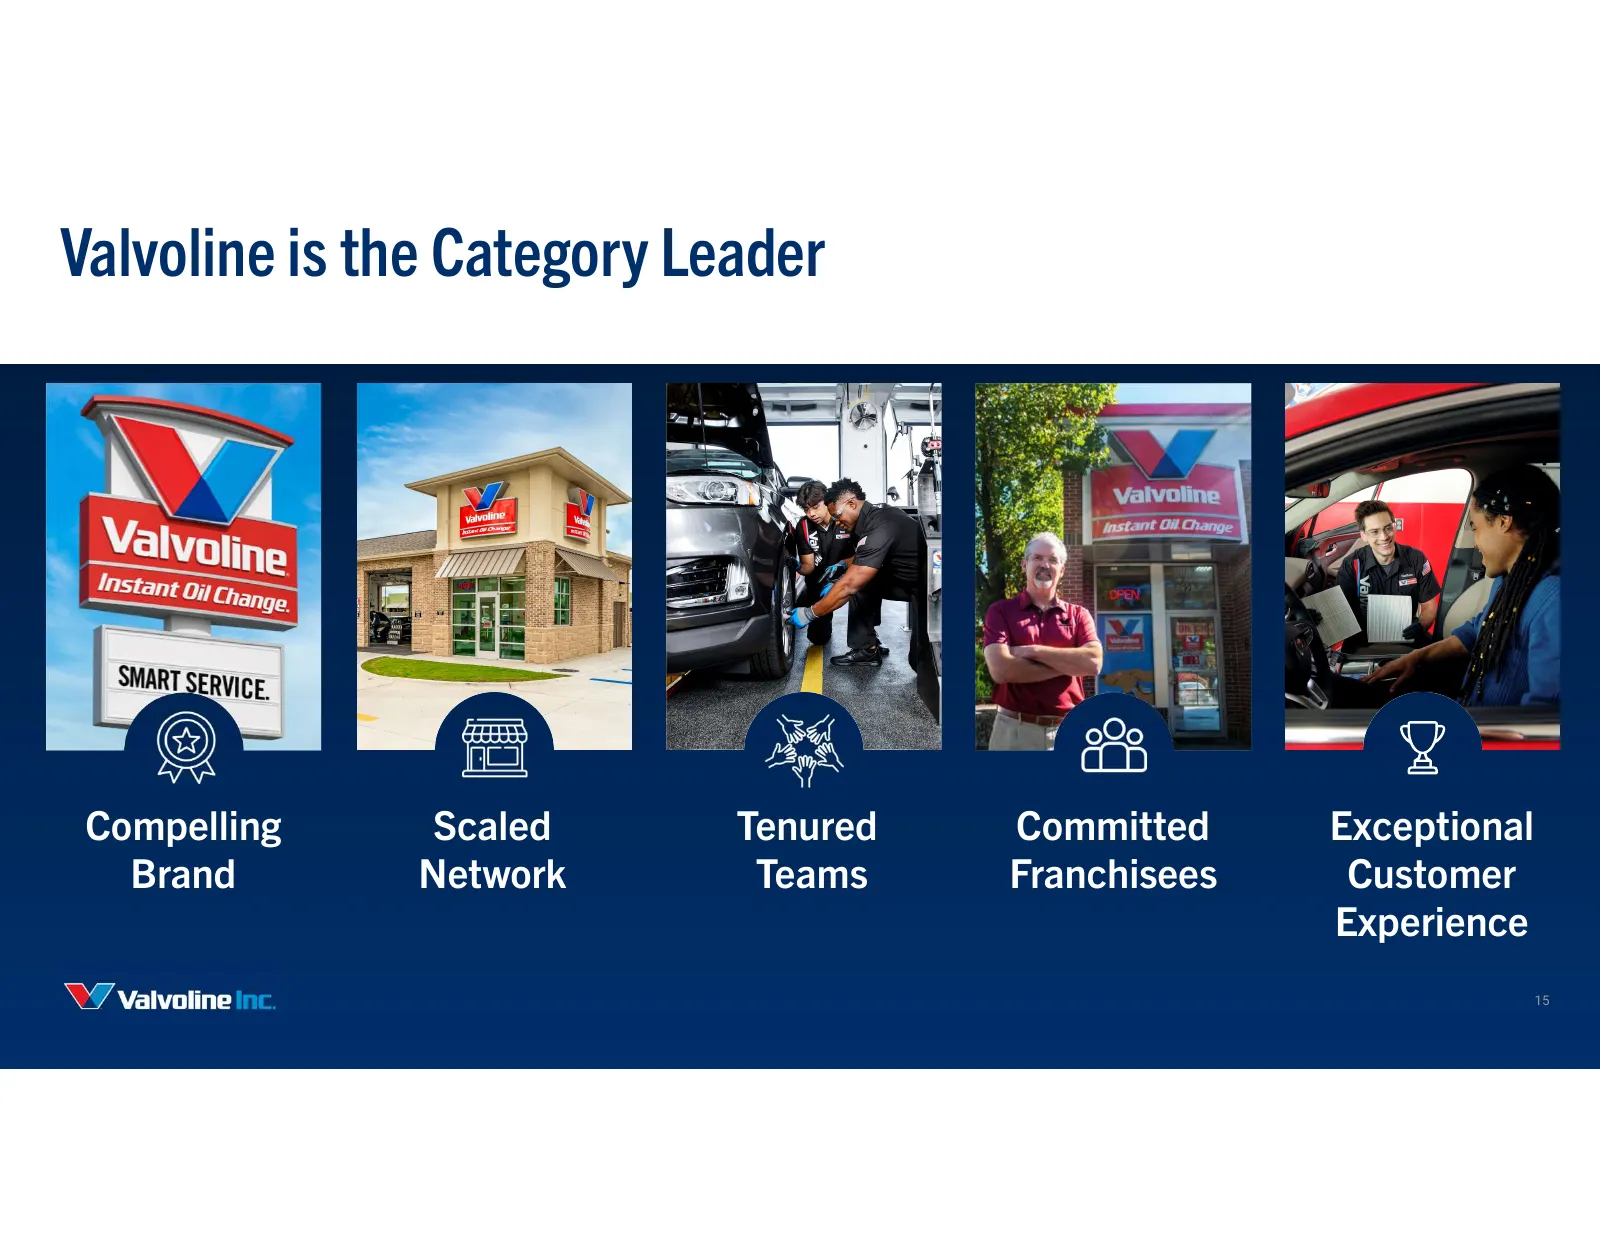
Slide 15: Valvoline is the Category Leader
Valvoline is the Category Leader Compelling Scaled Tenured Committed Exceptional Brand Network Teams Franchisees Customer Experience 15
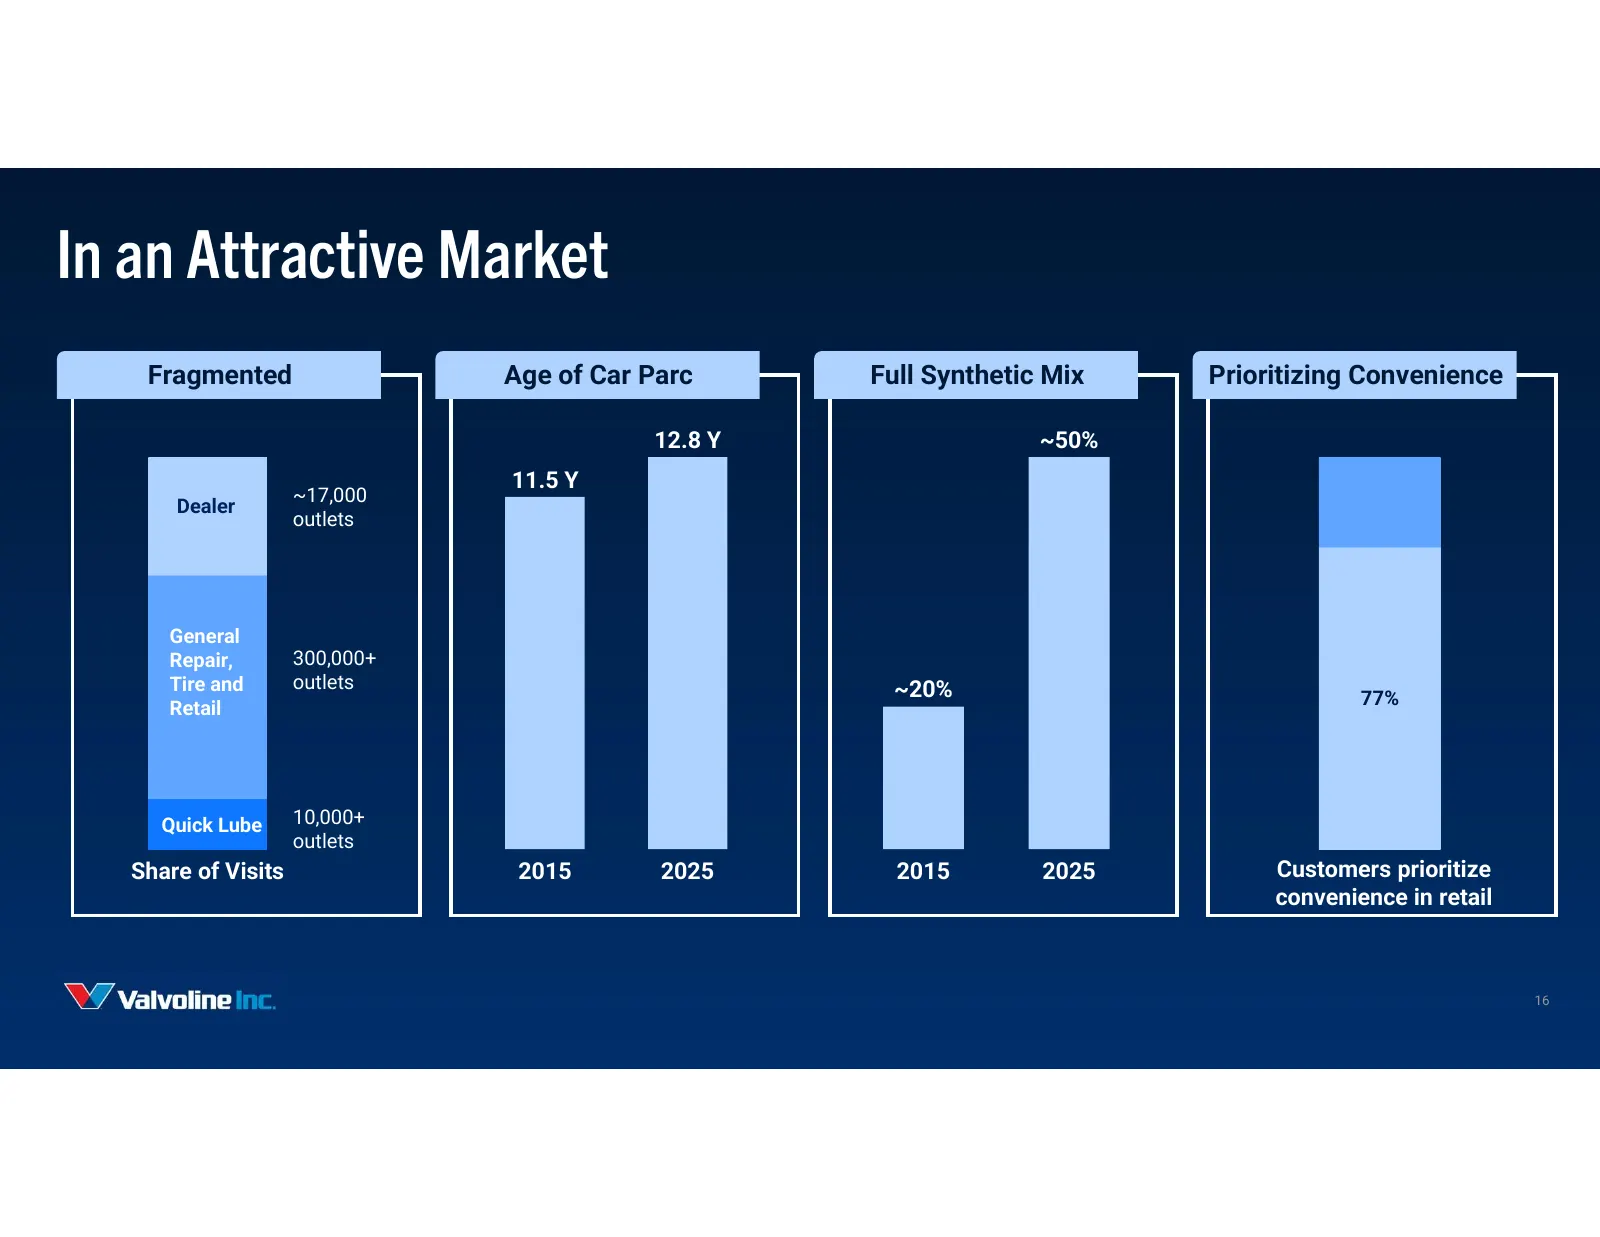
Slide 16: In an Attractive Market
In an Attractive Market Fragmented Age of Car Parc Full Synthetic Mix Prioritizing Convenience 12.8 Y ~50% 11.5 Y ~17,000 Dealer outlets General Repair, 300,000+ Tire and outlets ~20% Retail 77% Quick Lube 10,000+ outlets Share of Visits 2015 2025 2015 2025 Customers prioritize convenience in retail
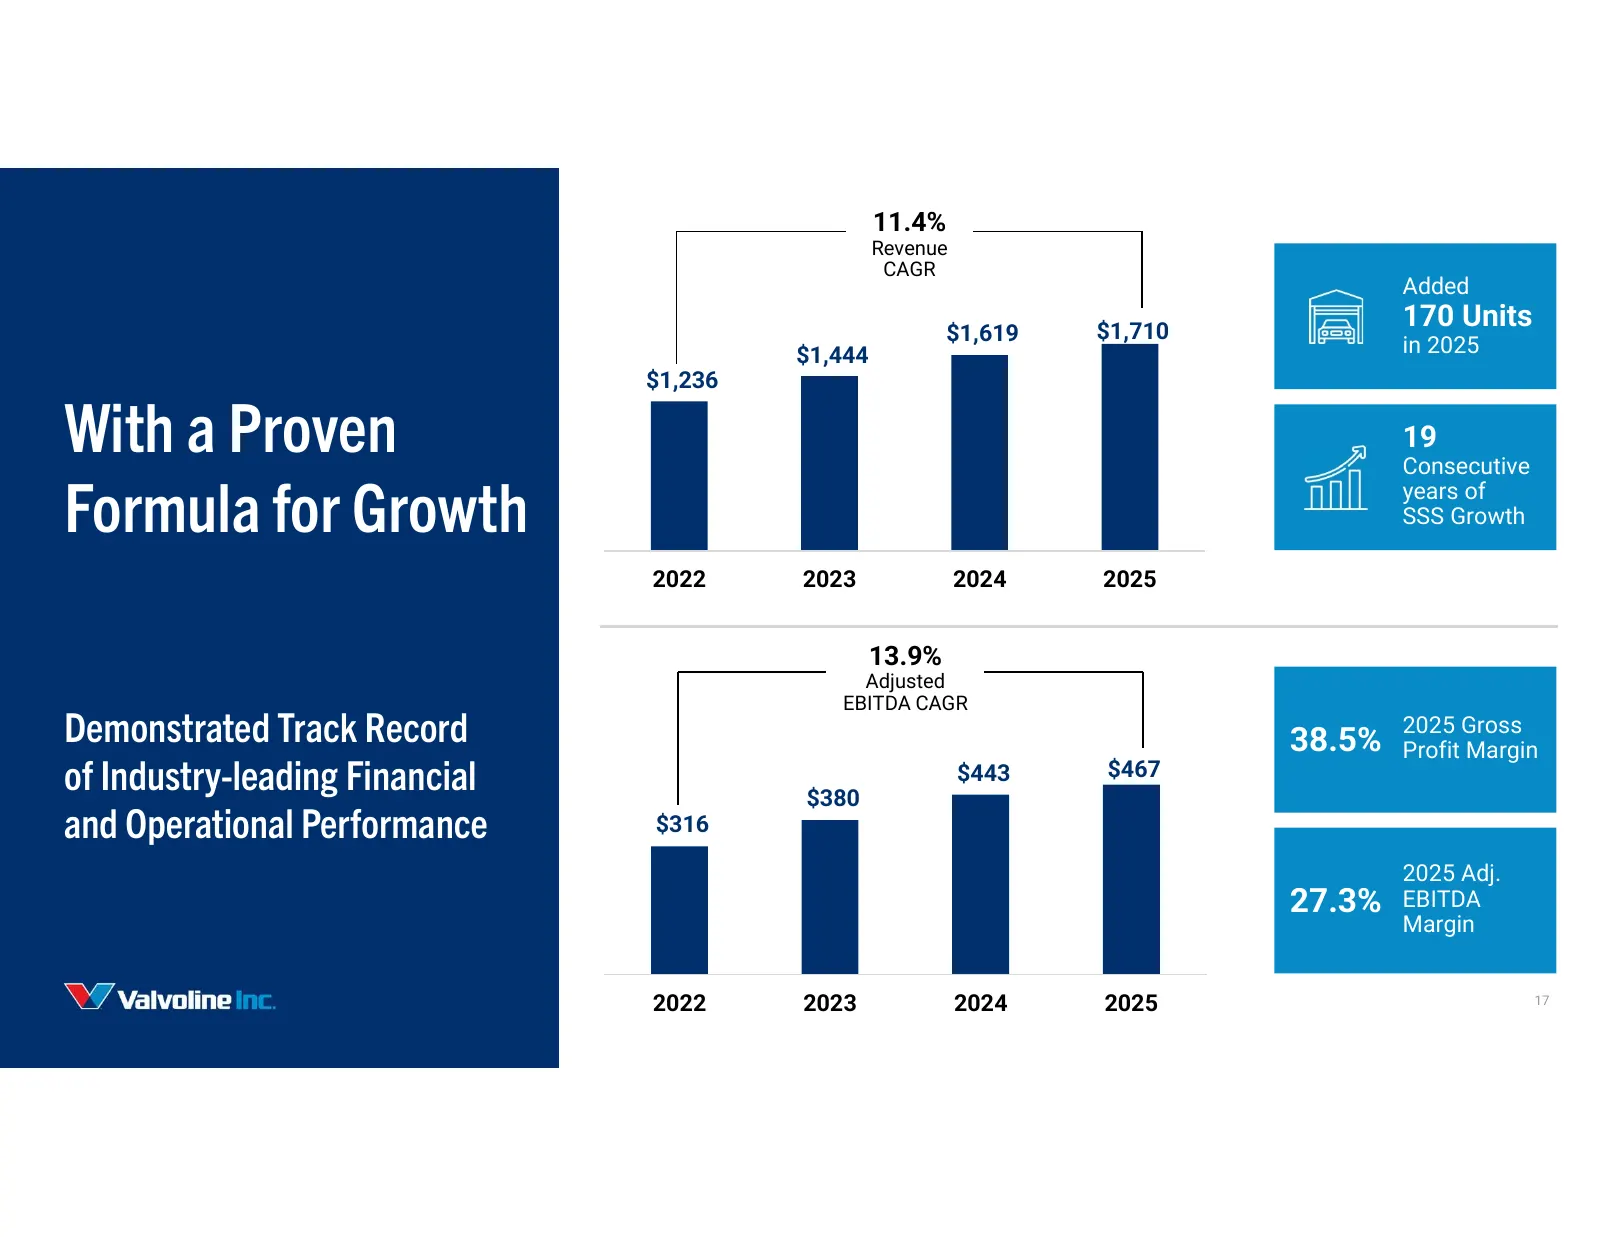
Slide 17: With a Proven Formula for Growth
11.4% Revenue CAGR Added $1,710 170 Units $1,619 in 2025 $1,444 $1,236 With a Proven 19 Consecutive Formula for Growth years of SSS Growth 2022 2023 2024 2025 13.9% Adjusted EBITDA CAGR Demonstrated Track Record 2025 Gross 38.5% Profit Margin of Industry-leading Financial $380 $443 $467 and Operatio
Slide 18: Enabled by Differentiated Assets and Capabilities
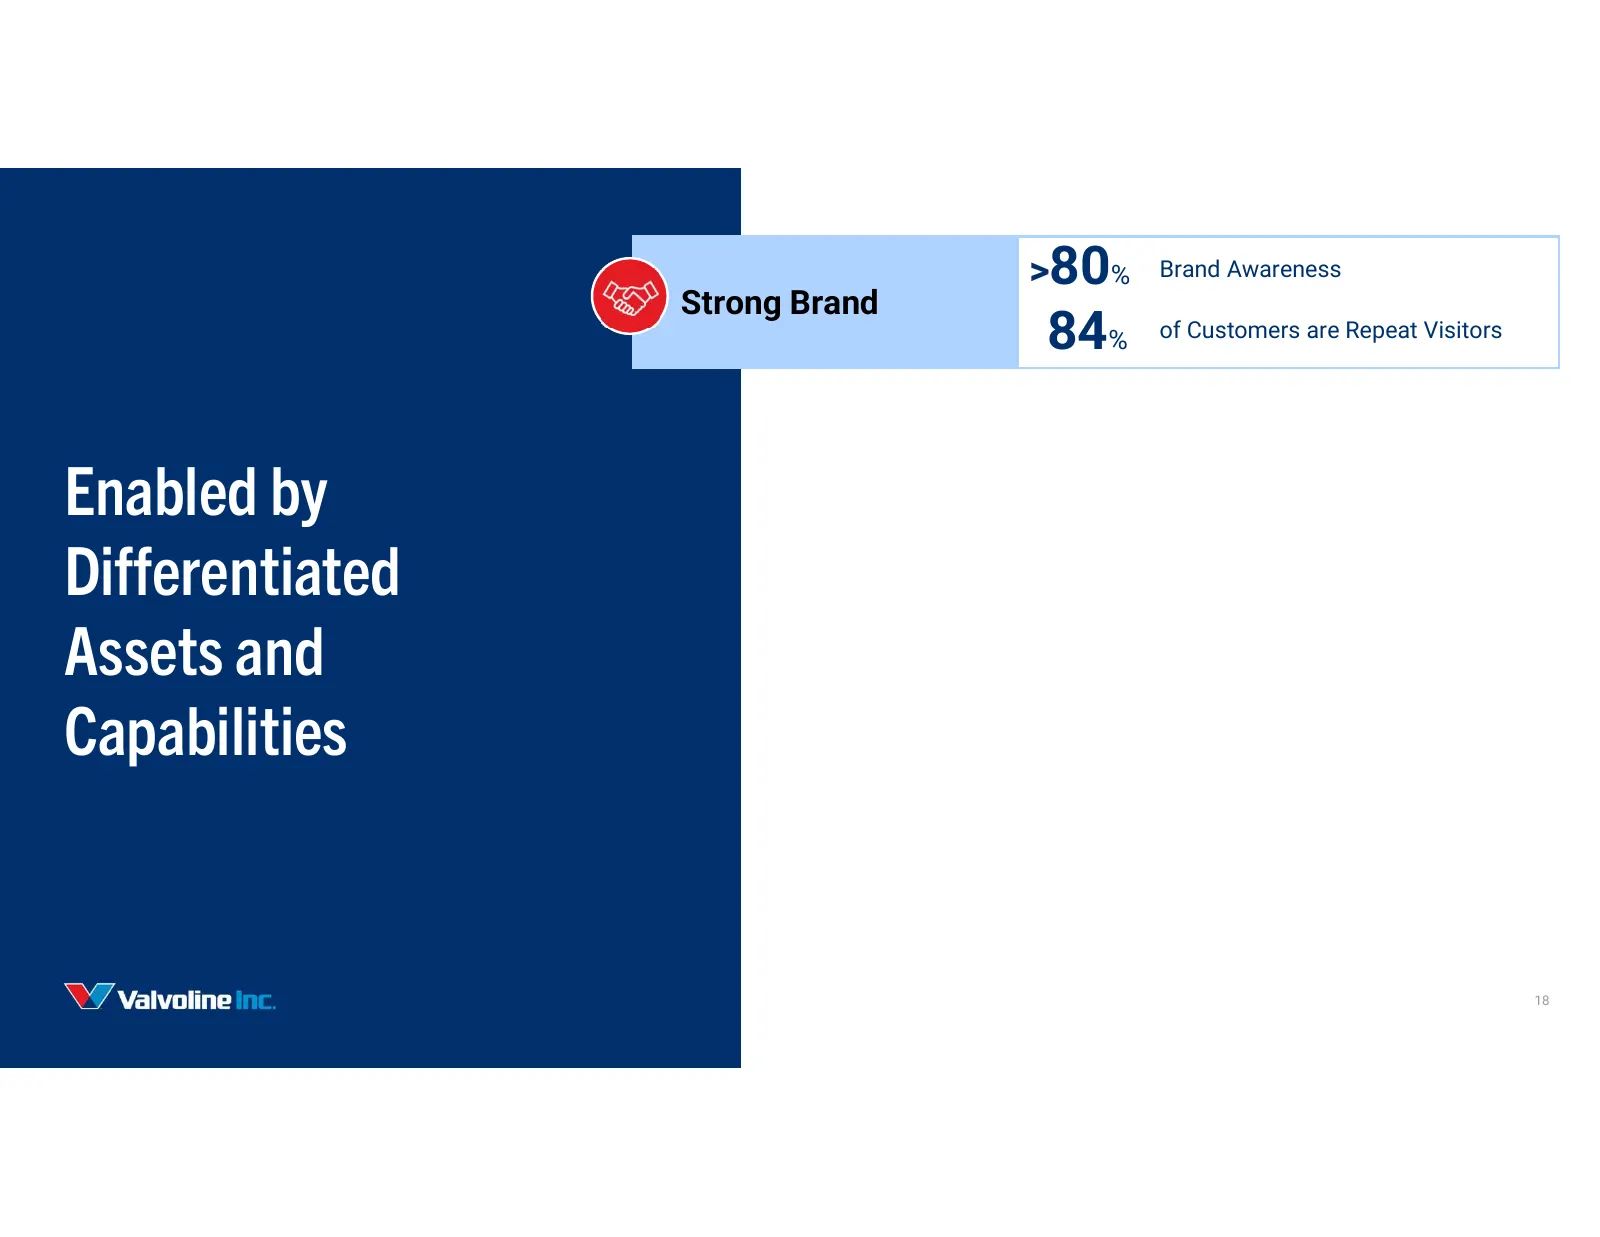
>80% Brand Awareness Strong Brand 84% of Customers are Repeat Visitors Enabled by Differentiated Assets and Capabilities 18
Slide 19: Enabled by Differentiated Assets and Capabilities
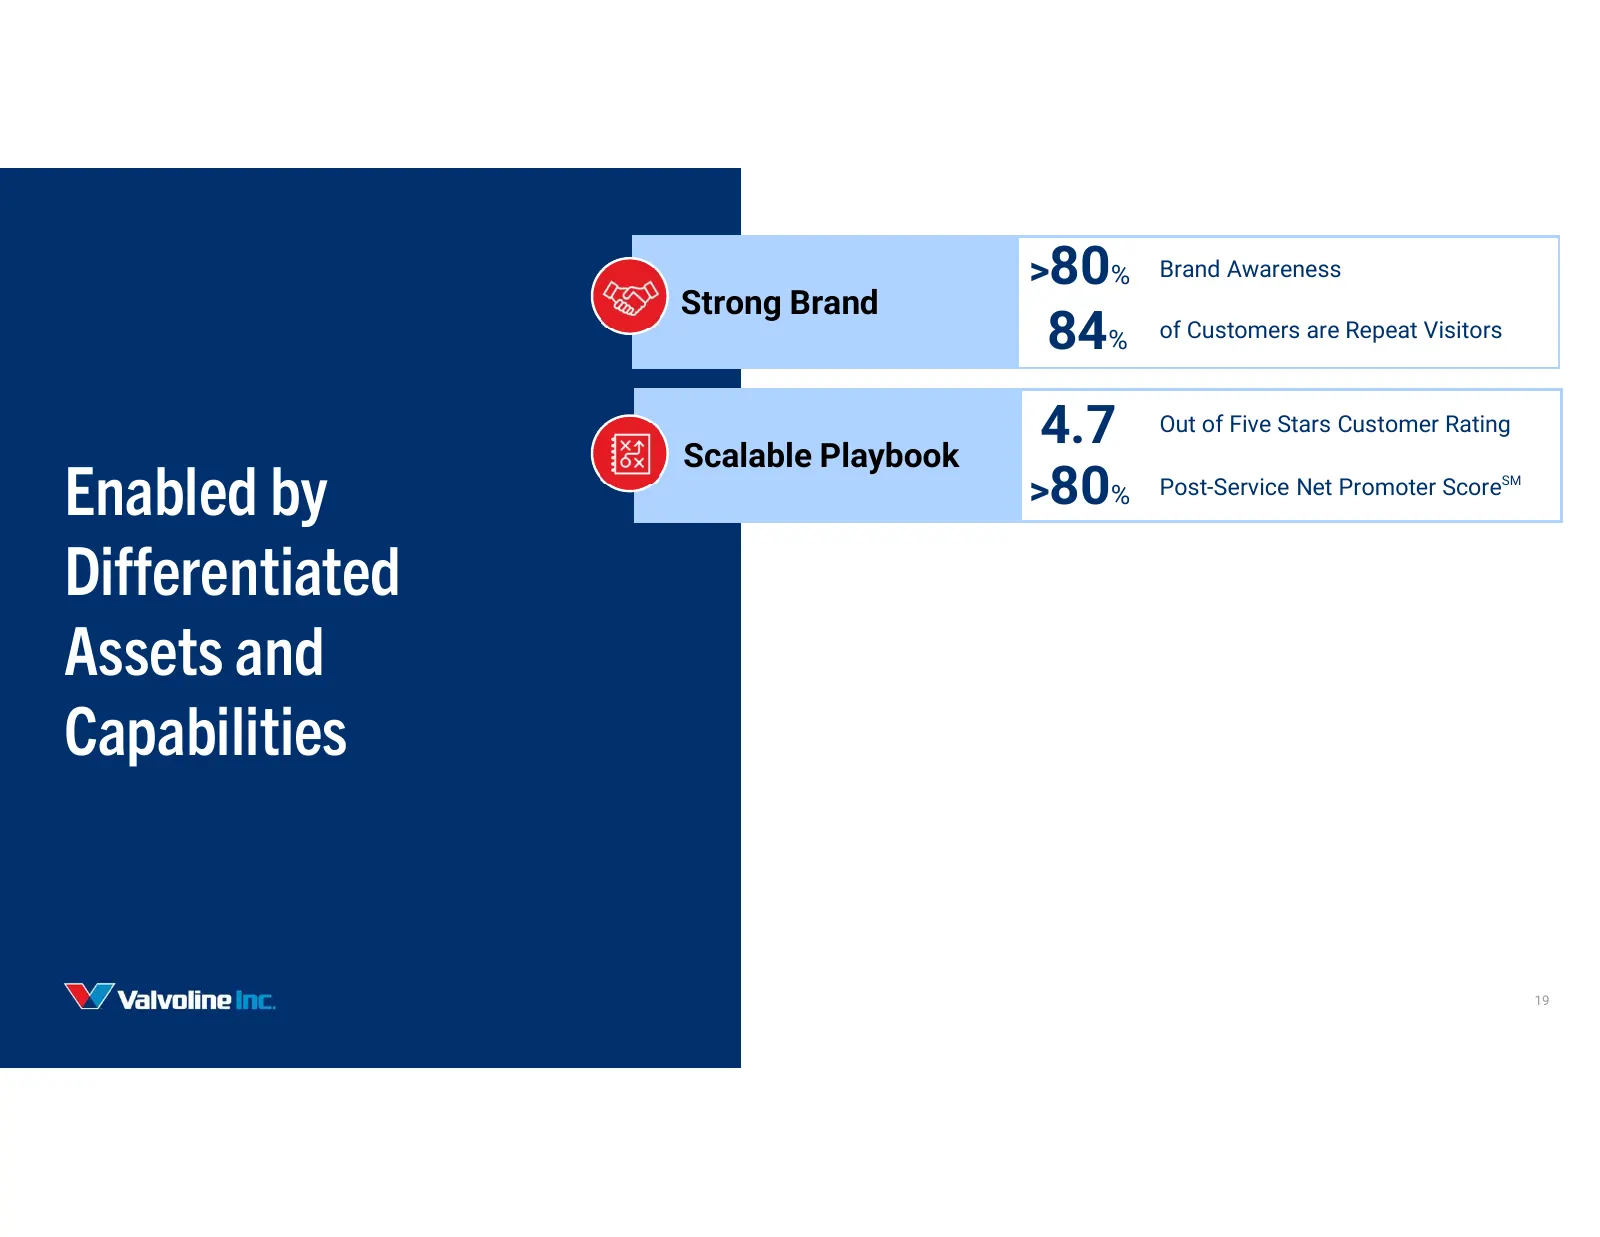
>80% Brand Awareness Strong Brand 84% of Customers are Repeat Visitors Scalable Playbook 4.7 Out of Five Stars Customer Rating Enabled by >80% Post-Service Net Promoter Score SM Differentiated Assets and Capabilities 19
Slide 20: Enabled by Differentiated Assets and Capabilities
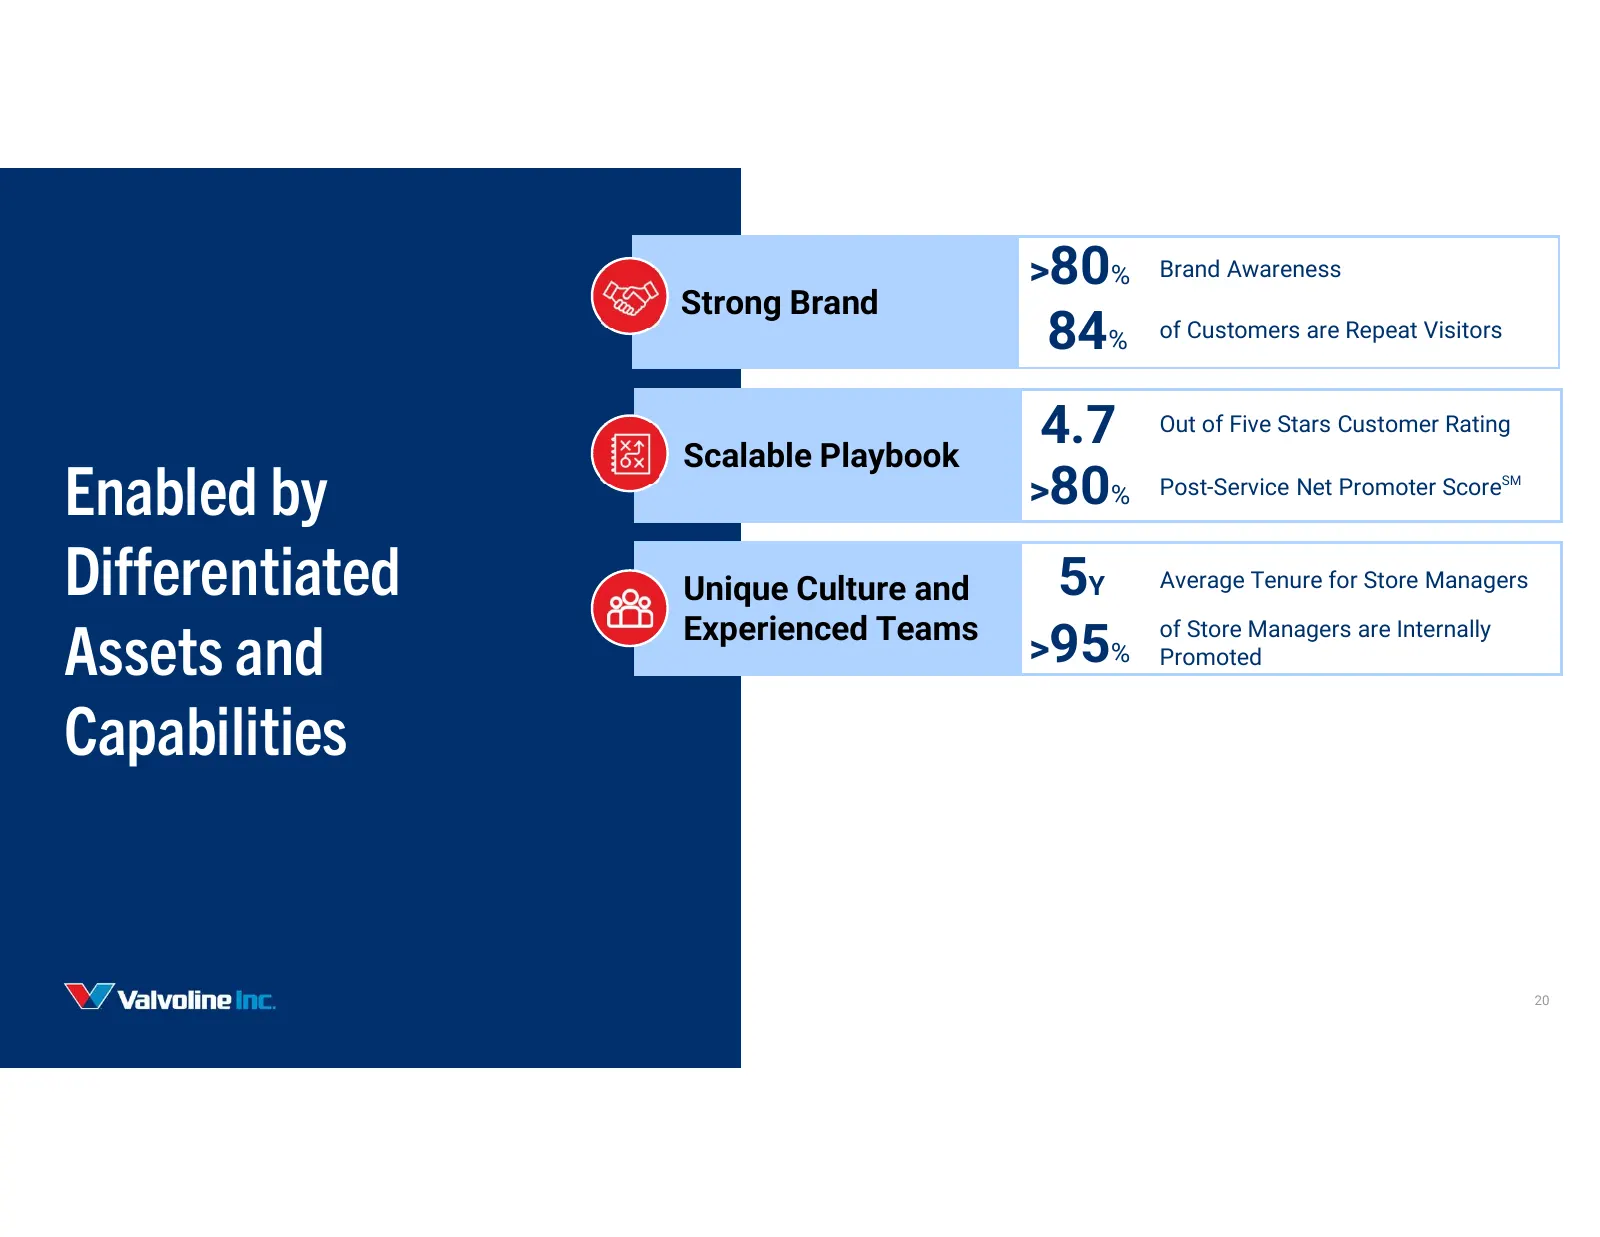
>80% Brand Awareness Strong Brand 84% of Customers are Repeat Visitors Scalable Playbook 4.7 Out of Five Stars Customer Rating Enabled by >80% Post-Service Net Promoter Score SM Differentiated Unique Culture and 5Y Average Tenure for Store Managers Experienced Teams Assets and >95% Promoted of Store
Slide 21: Enabled by Differentiated Assets and Capabilities
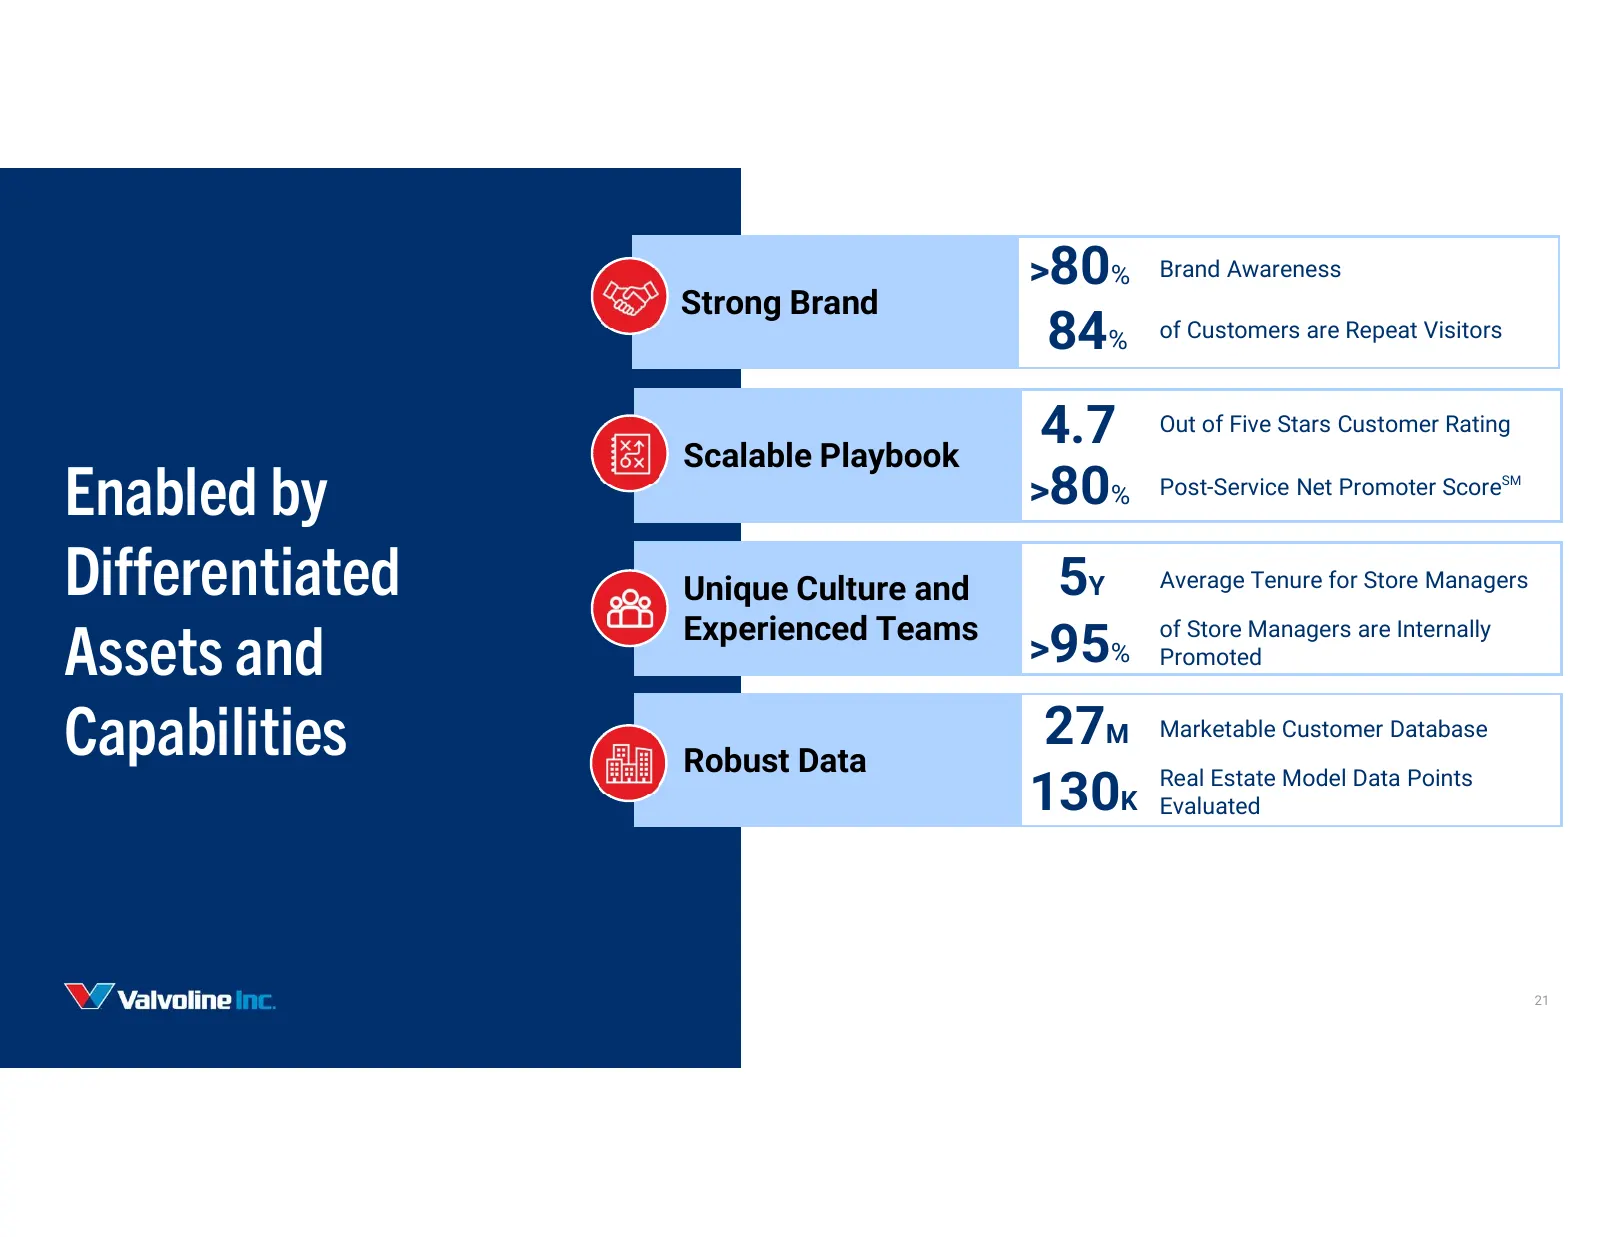
>80% Brand Awareness Strong Brand 84% of Customers are Repeat Visitors Scalable Playbook 4.7 Out of Five Stars Customer Rating Enabled by >80% Post-Service Net Promoter Score SM Differentiated Unique Culture and 5Y Average Tenure for Store Managers Experienced Teams Assets and >95% Promoted of Store
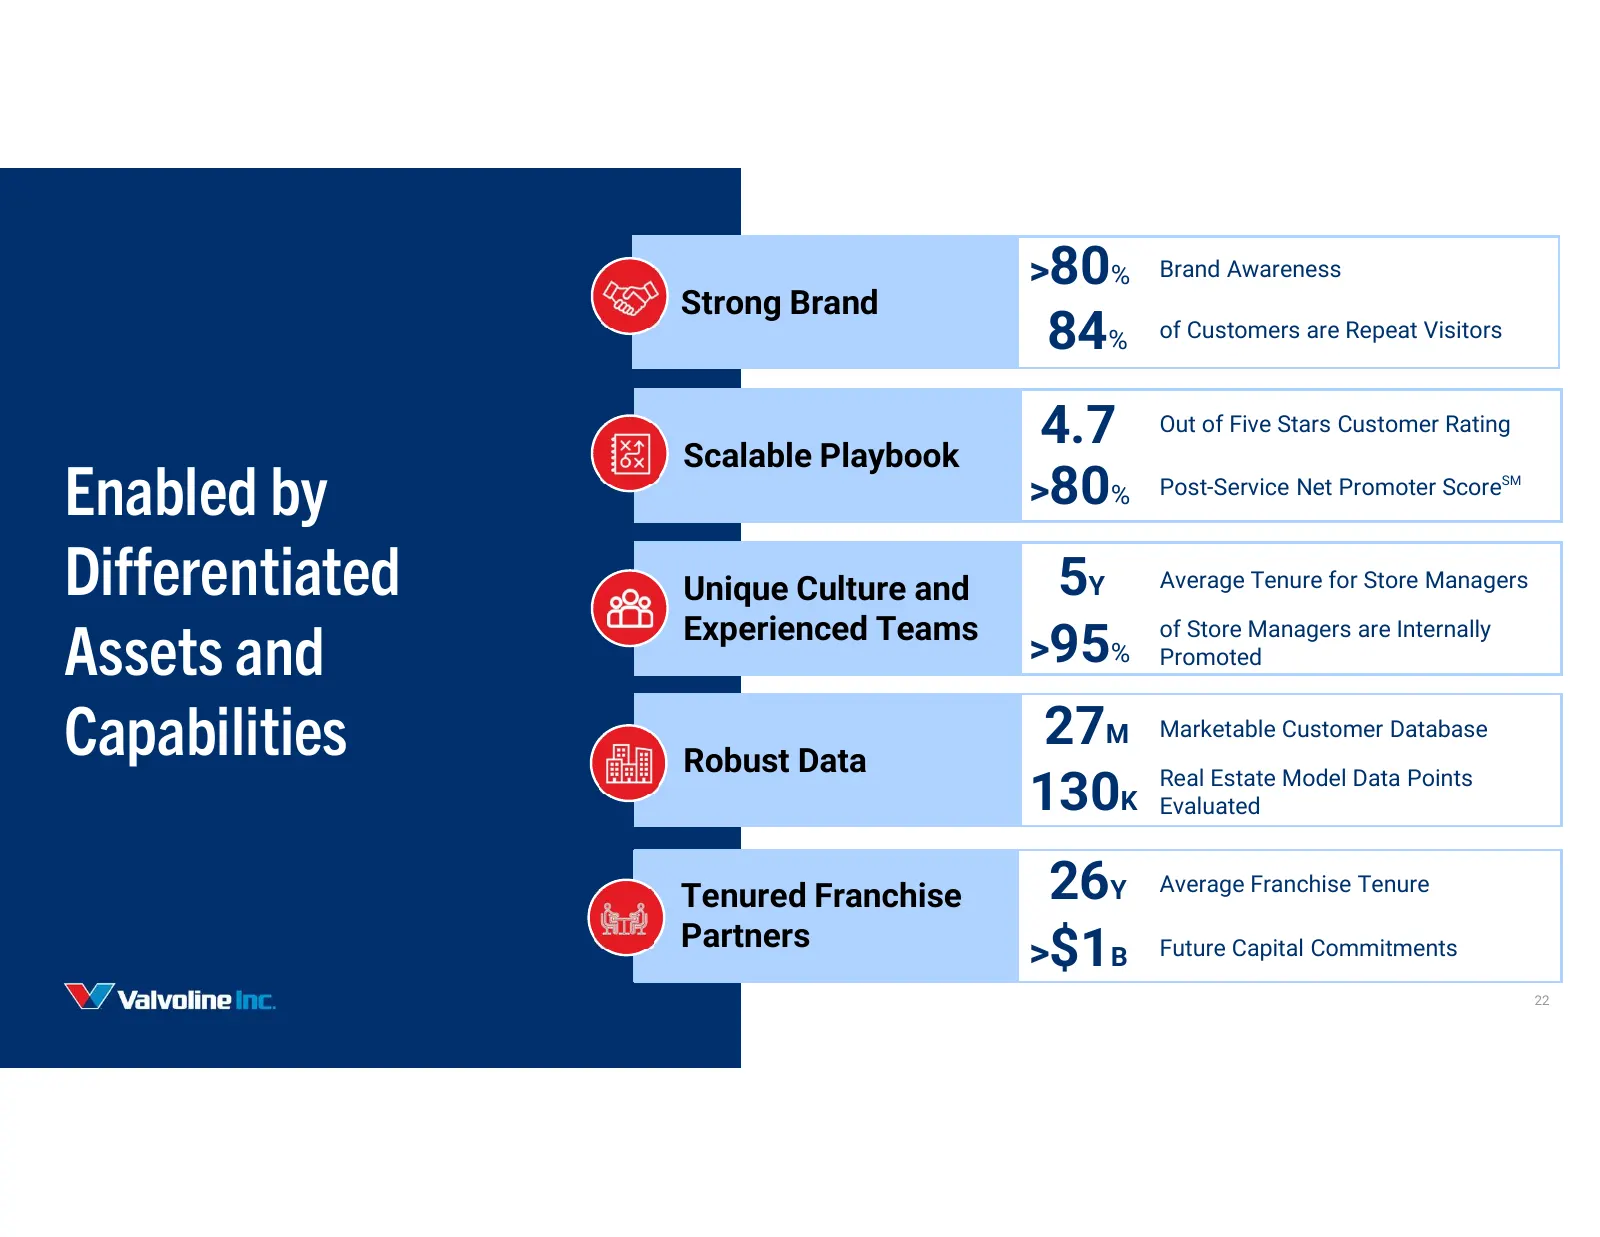
Slide 22: Enabled by Differentiated Assets and Capabilities
>80% Brand Awareness Strong Brand 84% of Customers are Repeat Visitors Scalable Playbook 4.7 Out of Five Stars Customer Rating Enabled by >80% Post-Service Net Promoter Score SM Differentiated Unique Culture and 5Y Average Tenure for Store Managers Experienced Teams Assets and >95% Promoted of Store
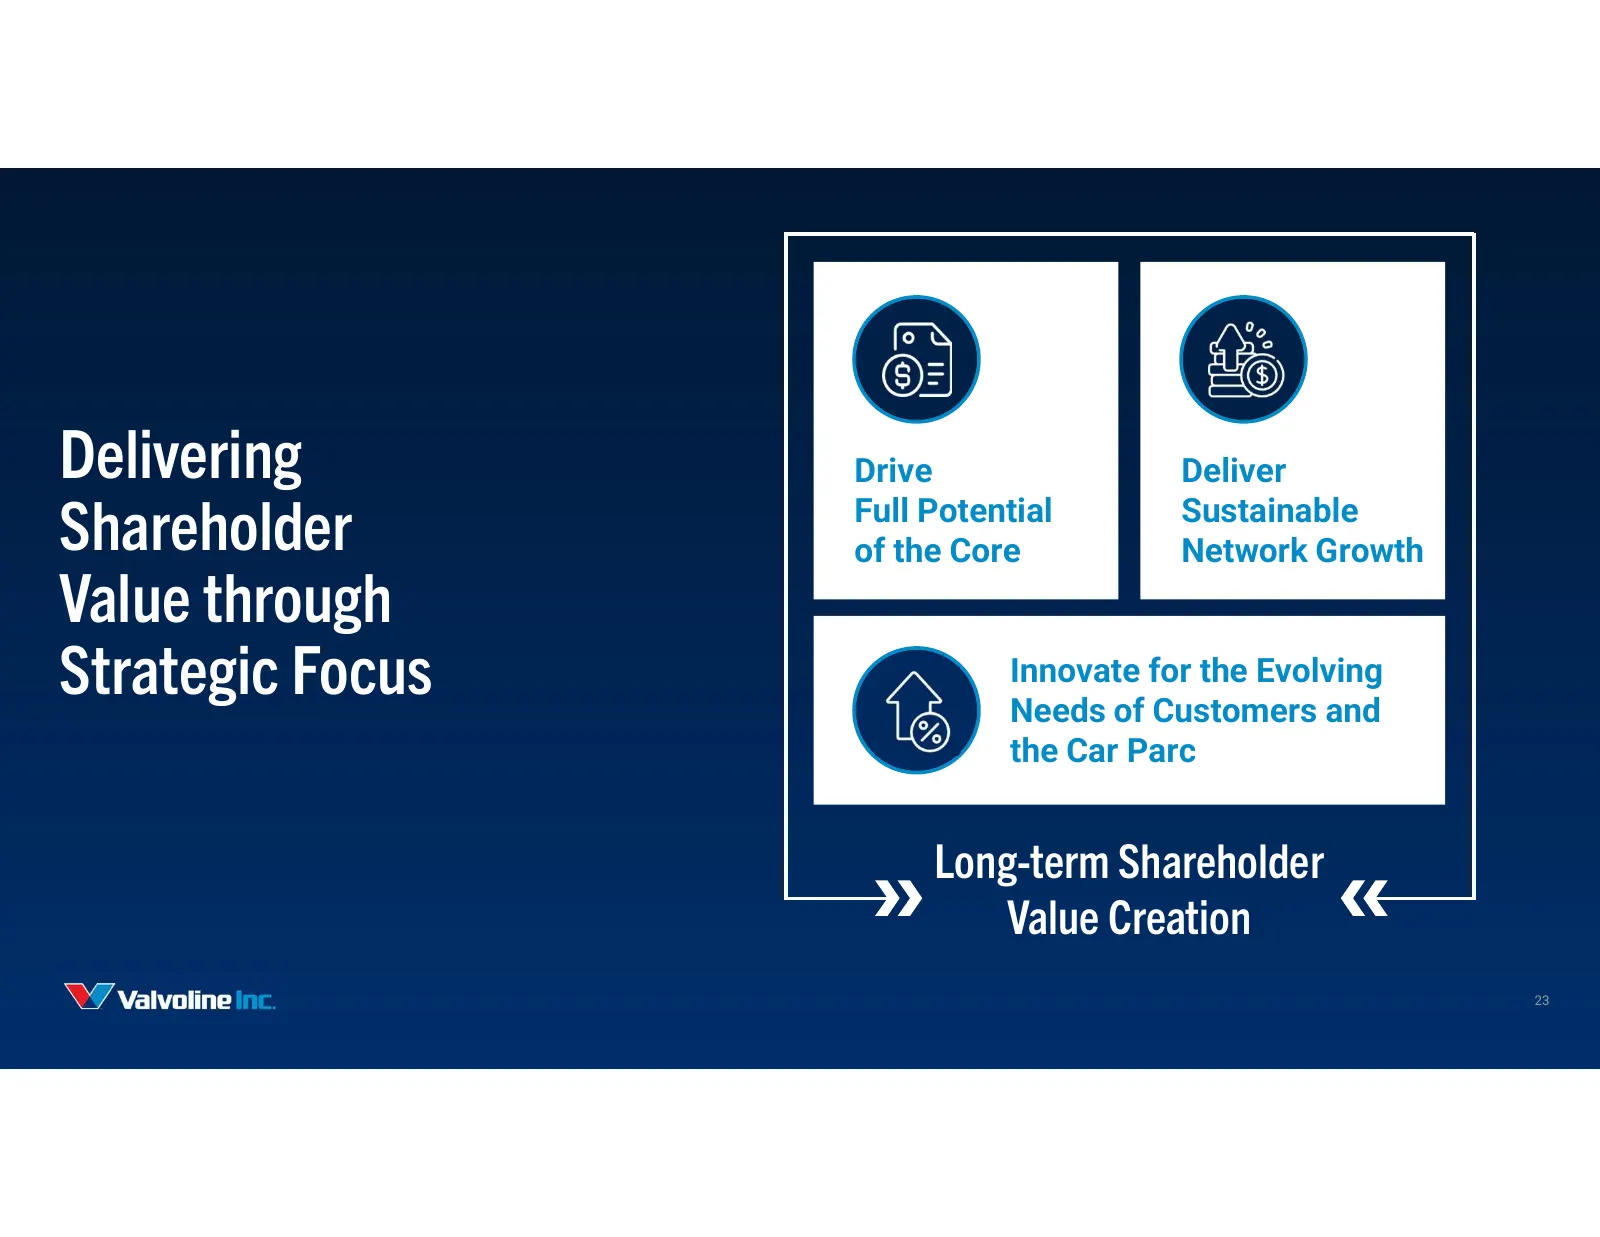
Slide 23: Delivering Shareholder Value through Strategic Focus
Delivering Drive Deliver Shareholder Full Potential of the Core Sustainable Network Growth Value through Strategic Focus Innovate for the Evolving Needs of Customers and the Car Parc Long-term Shareholder Value Creation 23
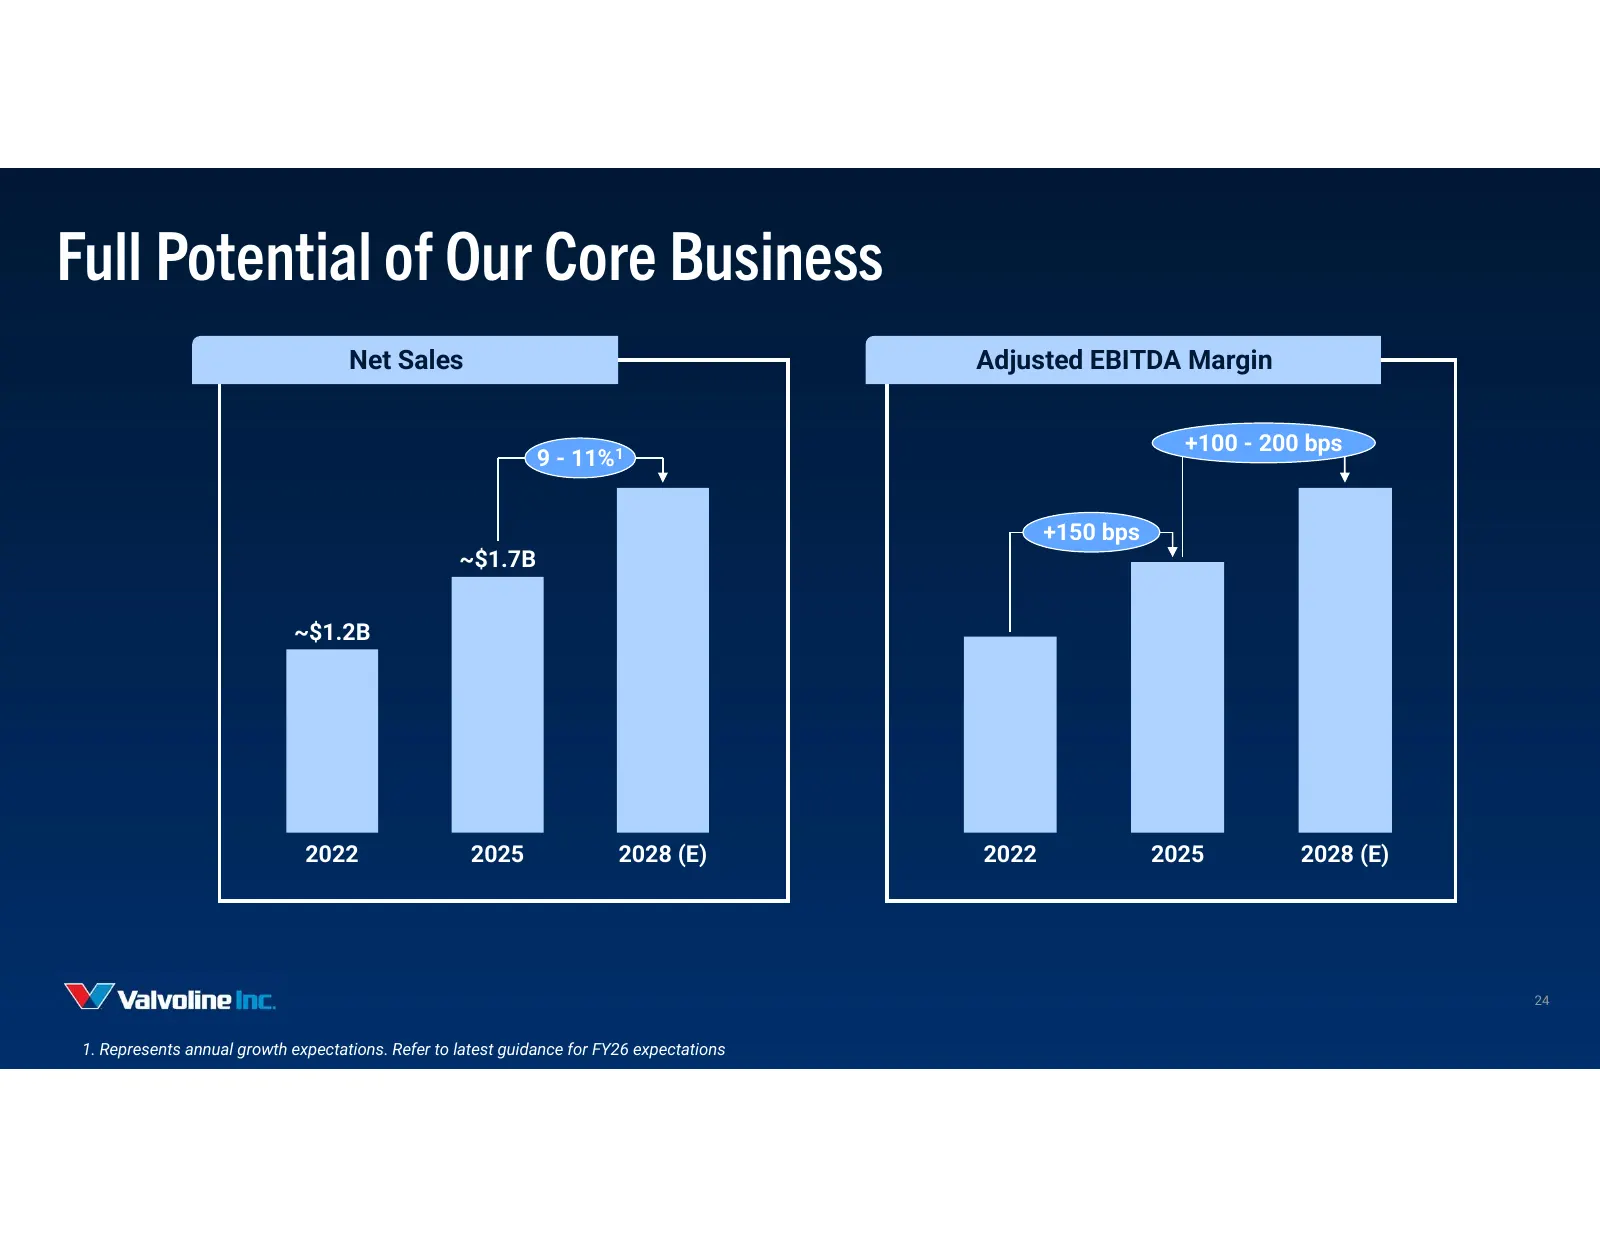
Slide 24: Full Potential of Our Core Business
Full Potential of Our Core Business Net Sales Adjusted EBITDA Margin +100 - 200 bps 9 - 11%1 +150 bps ~$1.7B ~$1.2B 2022 2025 2028 (E) 2022 2025 2028 (E) 24 1. Represents annual growth expectations. Refer to latest guidance for FY26 expectations
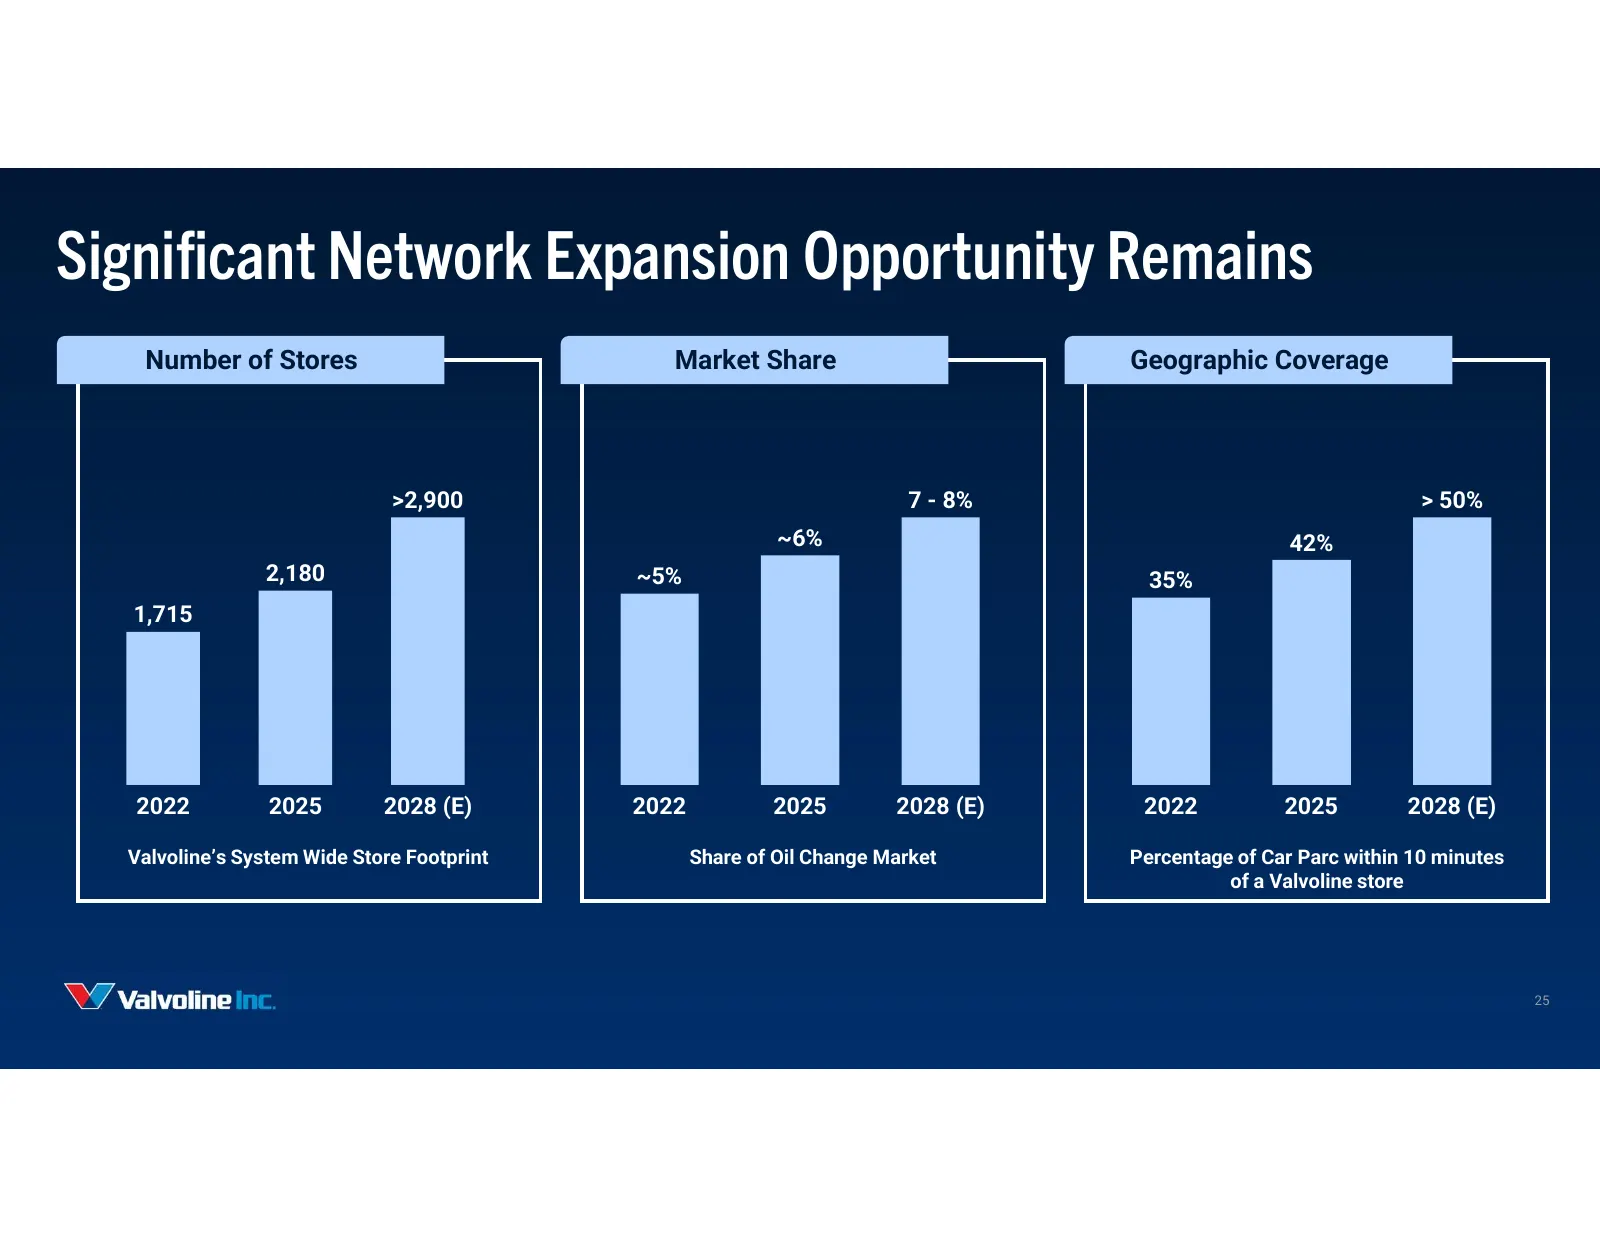
Slide 25: Significant Network Expansion Opportunity Remains
Significant Network Expansion Opportunity Remains Number of Stores Market Share Geographic Coverage >2,900 7 - 8% > 50% ~6% 42% 2,180 ~5% 35% 1,715 2022 2025 2028 (E) 2022 2025 2028 (E) 2022 2025 2028 (E) Valvoline’s System Wide Store Footprint Share of Oil Change Market Percentage of Car Parc withi
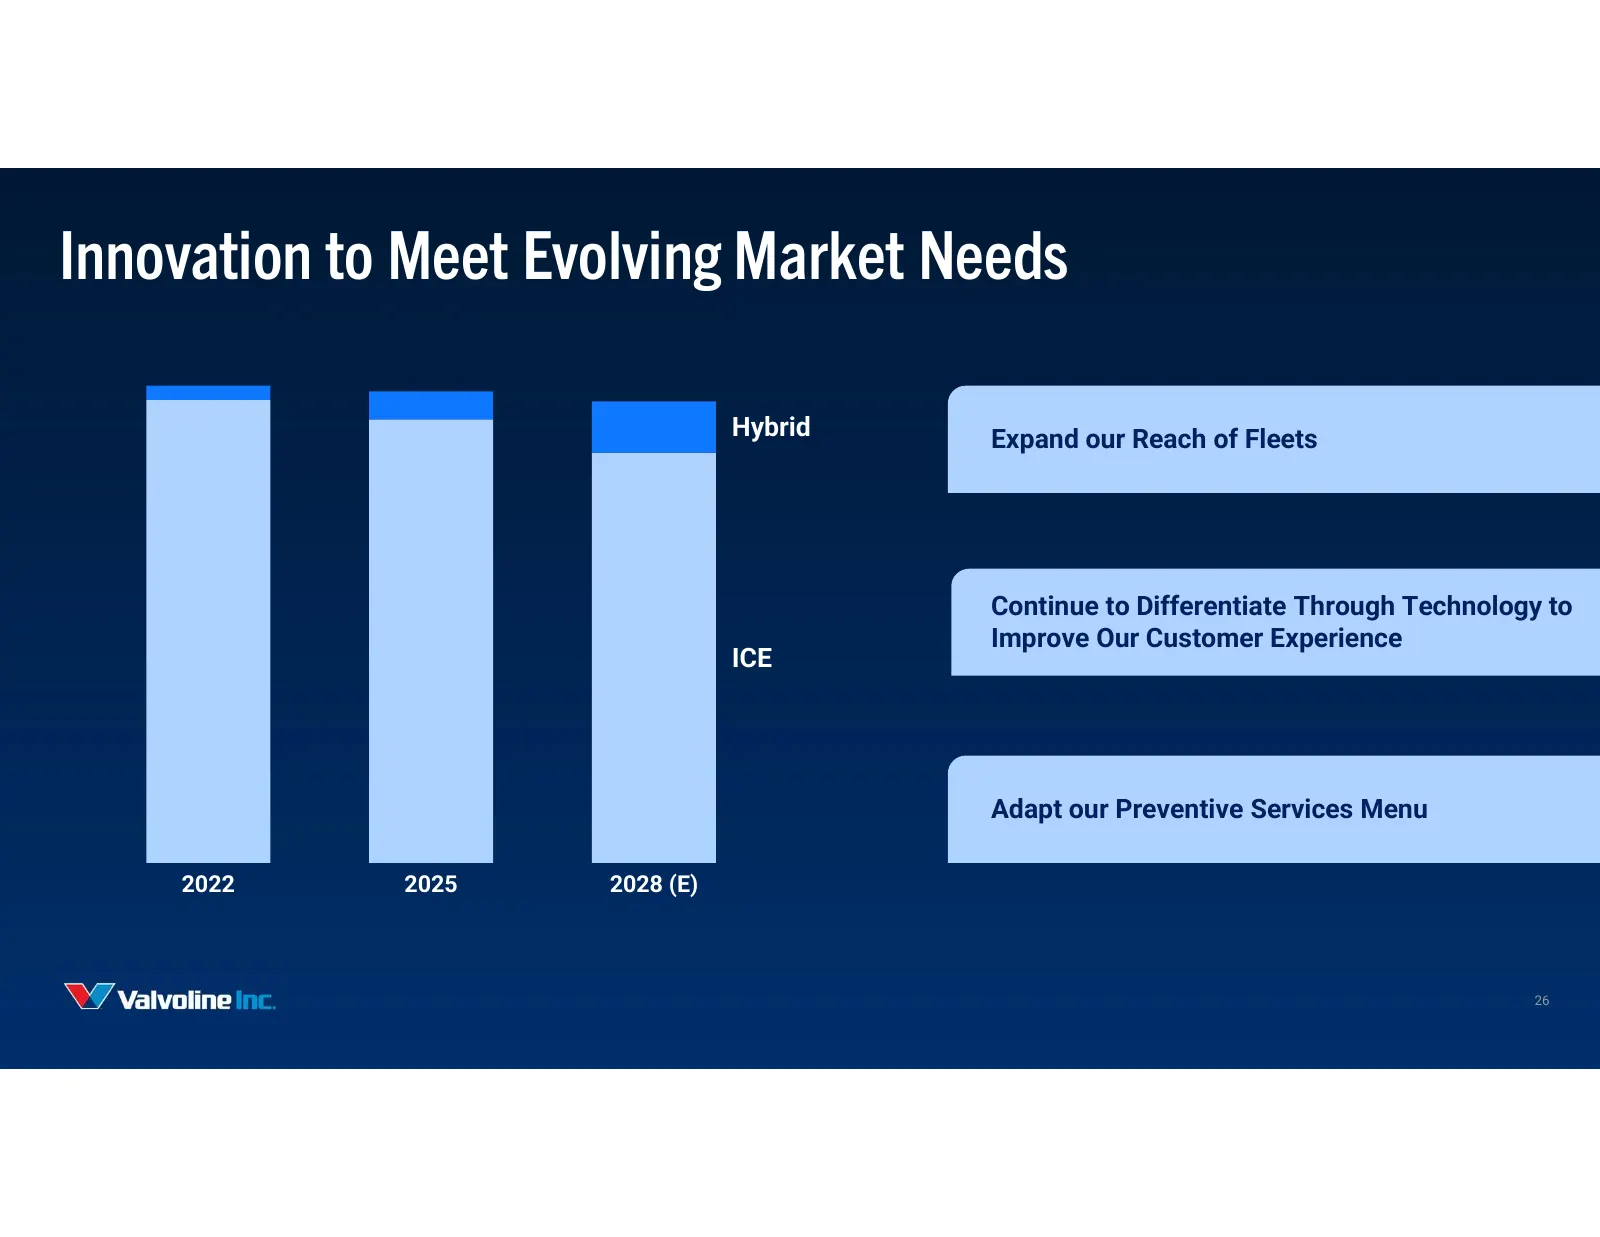
Slide 26: Innovation to Meet Evolving Market Needs
Innovation to Meet Evolving Market Needs Hybrid Expand our Reach of Fleets Continue to Differentiate Through Technology to Improve Our Customer Experience ICE Adapt our Preventive Services Menu 2022 2025 2028 (E) 26
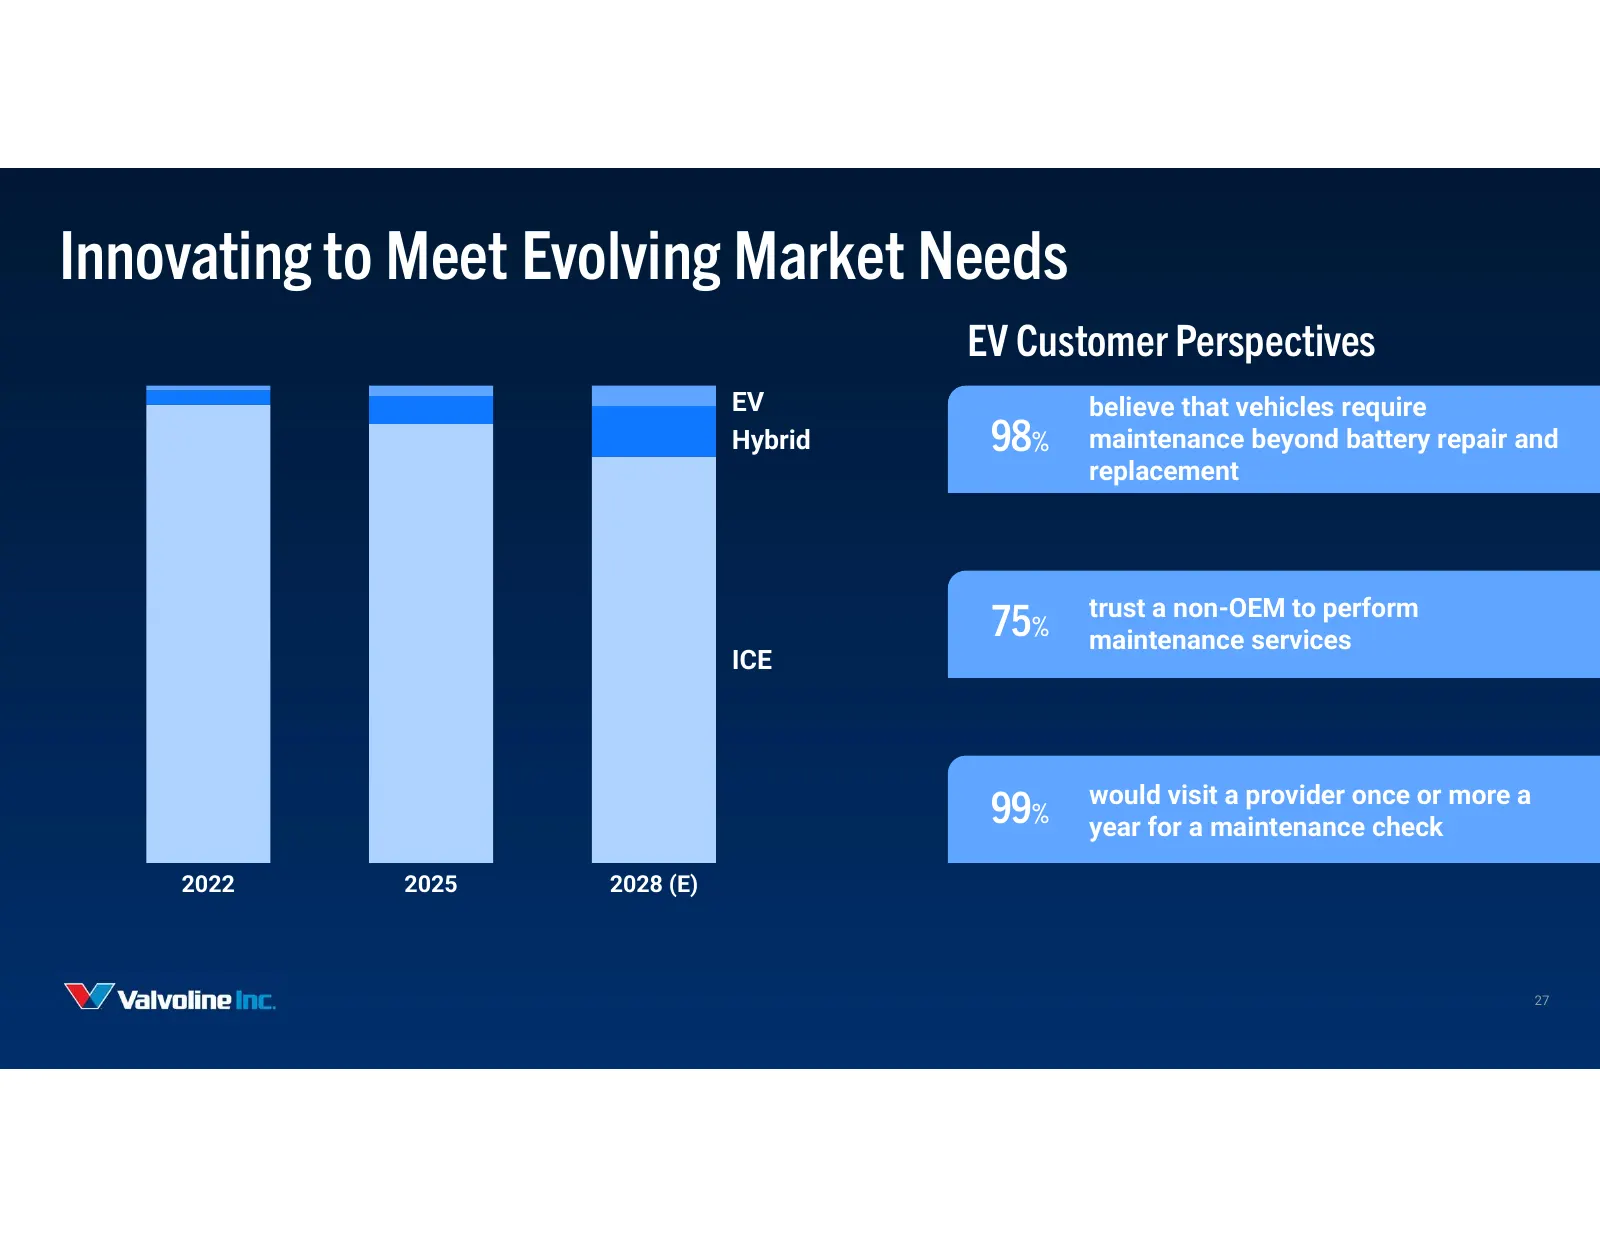
Slide 27: Innovating to Meet Evolving Market Needs
Innovating to Meet Evolving Market Needs EV Customer Perspectives EV believe that vehicles require Hybrid 98% maintenance beyond battery repair and replacement trust a non-OEM to perform 75% maintenance services ICE would visit a provider once or more a 99% year for a maintenance check 2022 2025 202
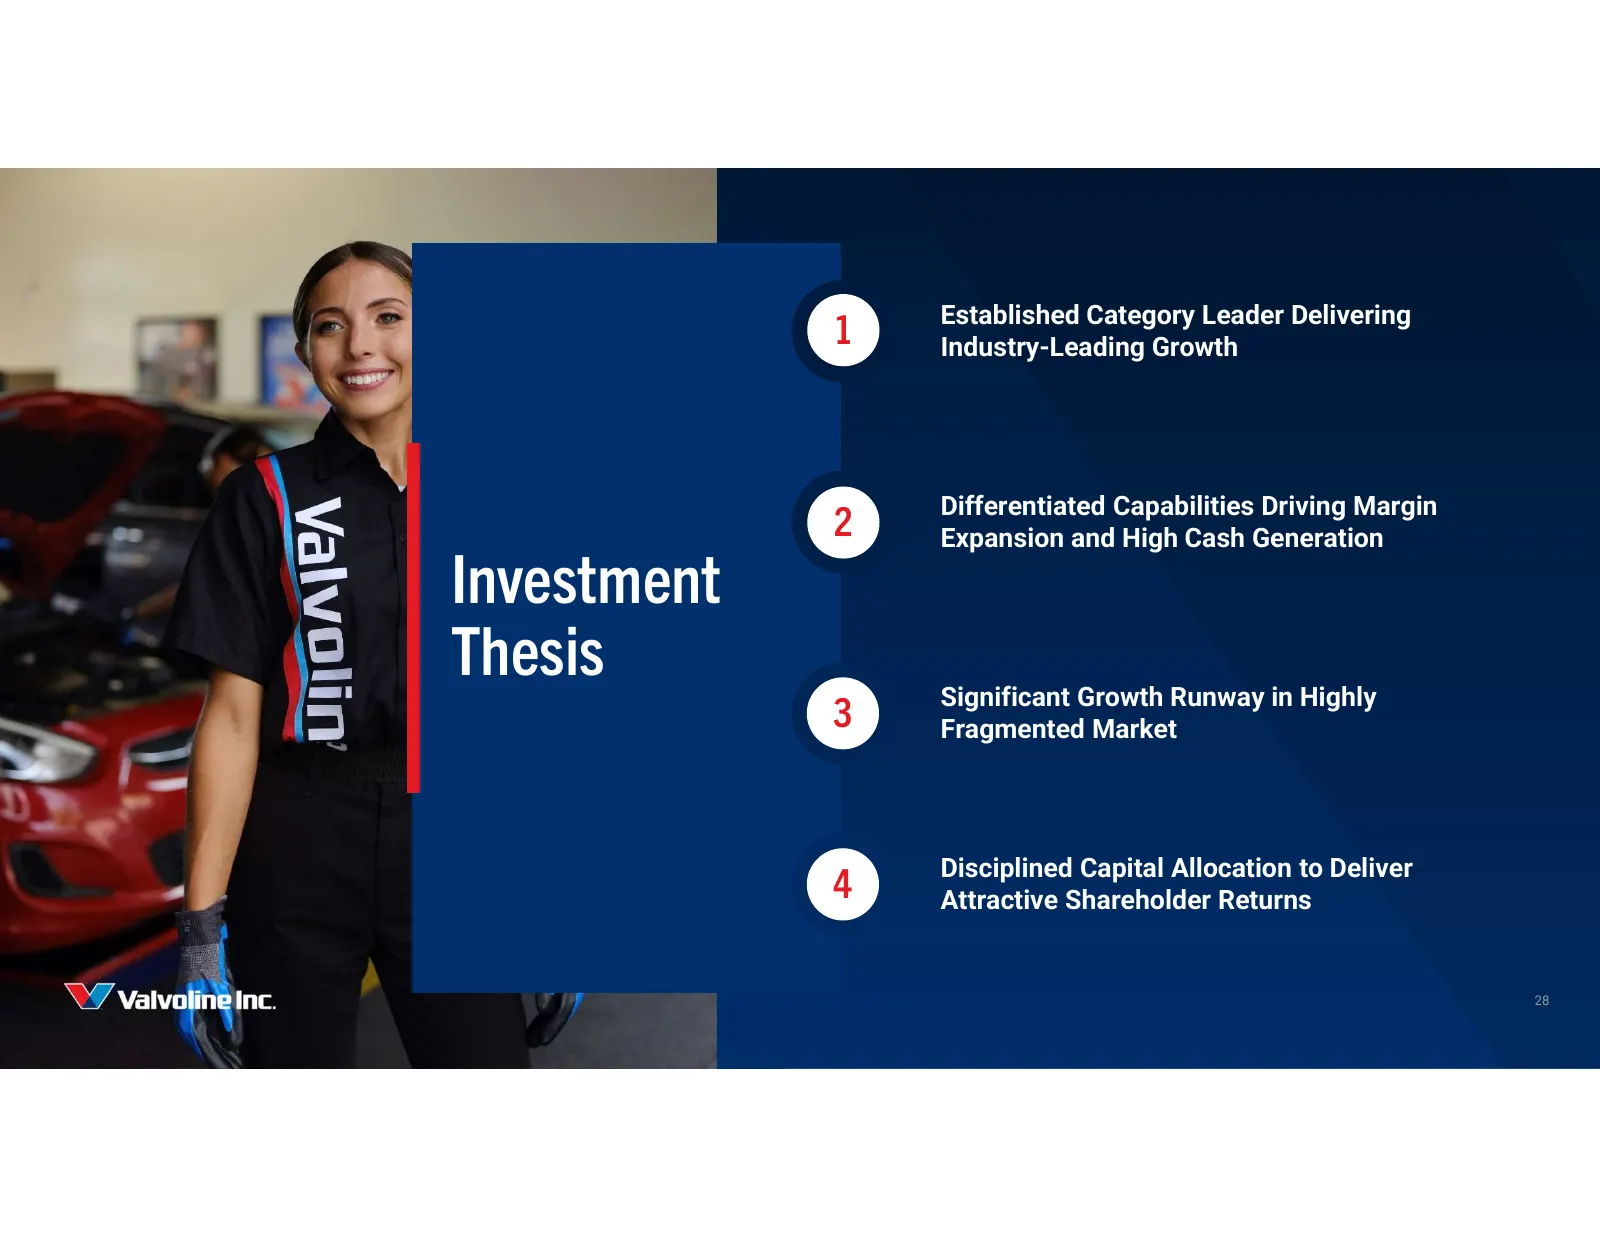
Slide 28: Investment Thesis
Established Category Leader Delivering 1 Industry-Leading Growth Differentiated Capabilities Driving Margin 2 Expansion and High Cash Generation Investment Investment Thesis Thesis Significant Growth Runway in Highly 3 Fragmented Market Disciplined Capital Allocation to Deliver 4 Attractive Sharehol
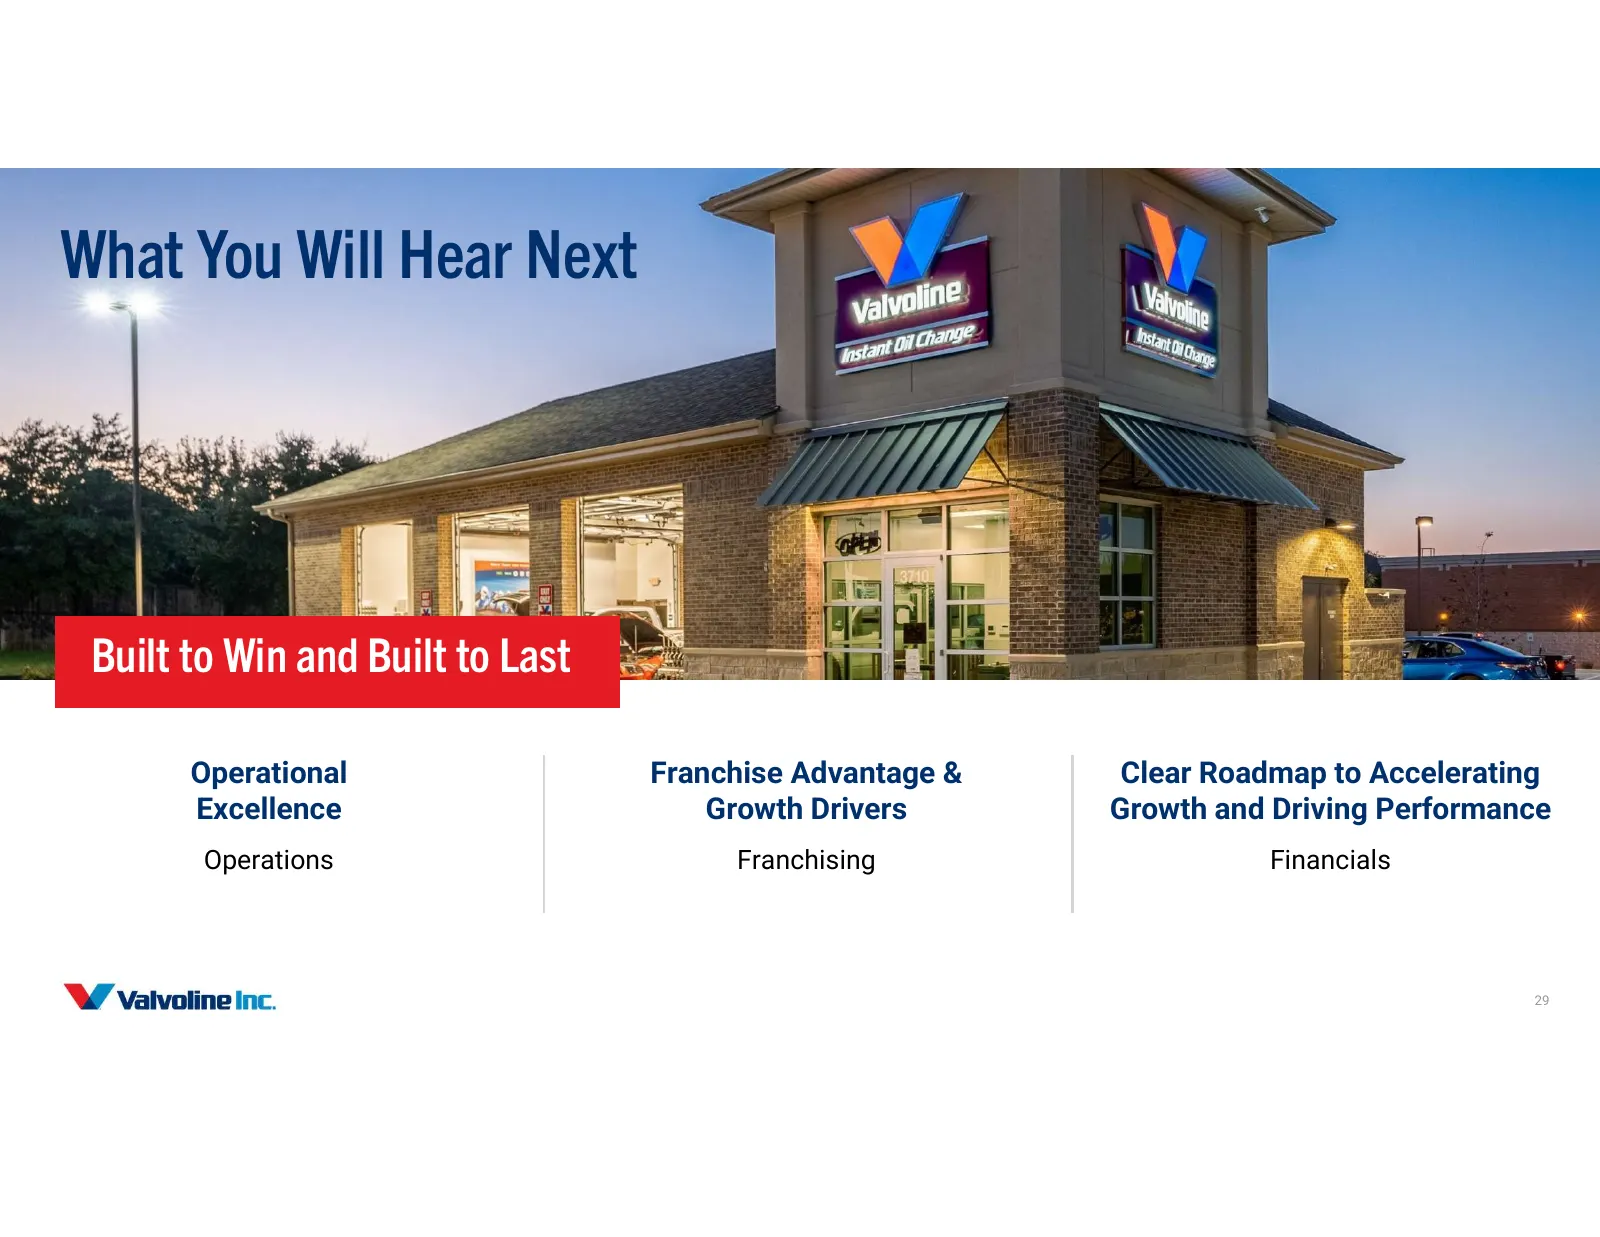
Slide 29: What You Will Hear Next
What You Will Hear Next Built to Win and Built to Last Operational Franchise Advantage & Clear Roadmap to Accelerating Excellence Growth Drivers Growth and Driving Performance Operations Franchising Financials 29

Slide 30: YYZ Valvoline Inc.
YYZ Valvoline Inc.
Slide 31: Operational Excellence
Operational Excellence Linne Fulcher, Chief Operating Officer 31
Slide 32: Key Takeaways
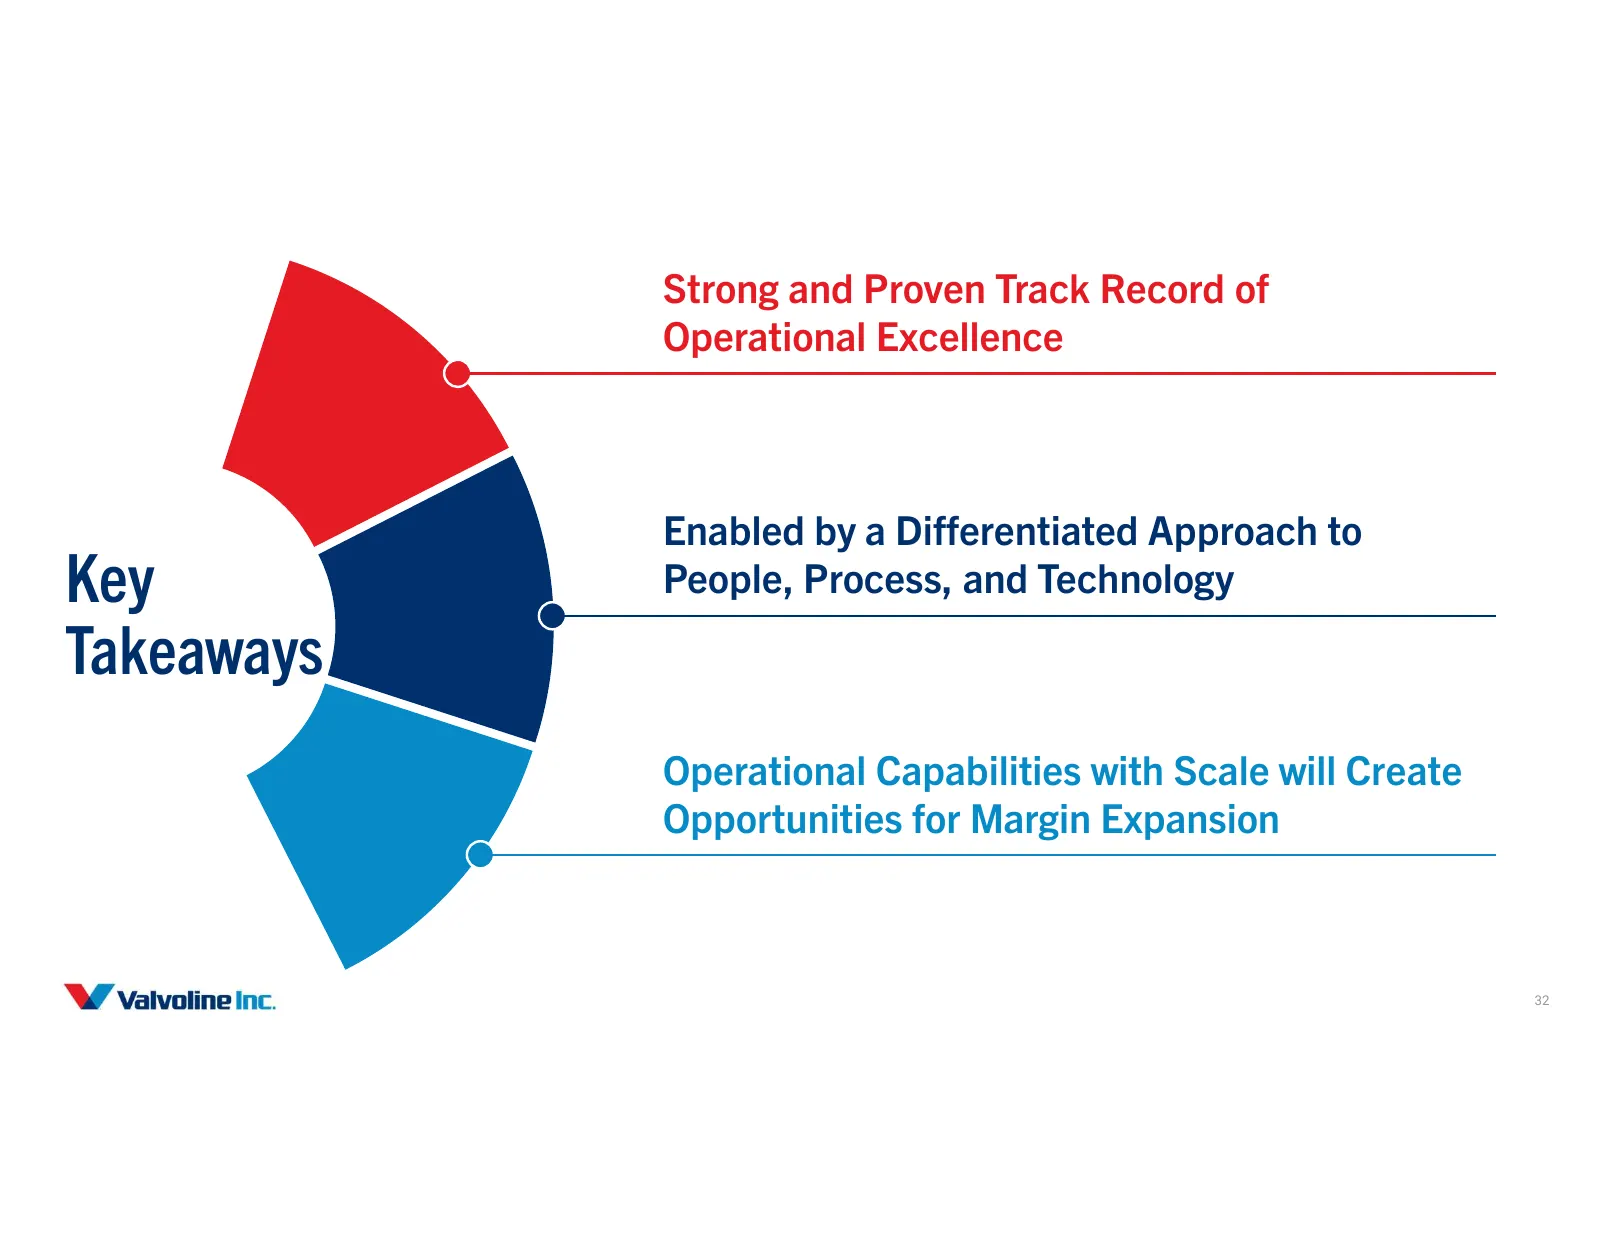
Strong and Proven Track Record of Operational Excellence Enabled by a Differentiated Approach to Key People, Process, and Technology Takeaways Operational Capabilities with Scale will Create Opportunities for Margin Expansion 32
Slide 33: Proven Record of Operational Excellence
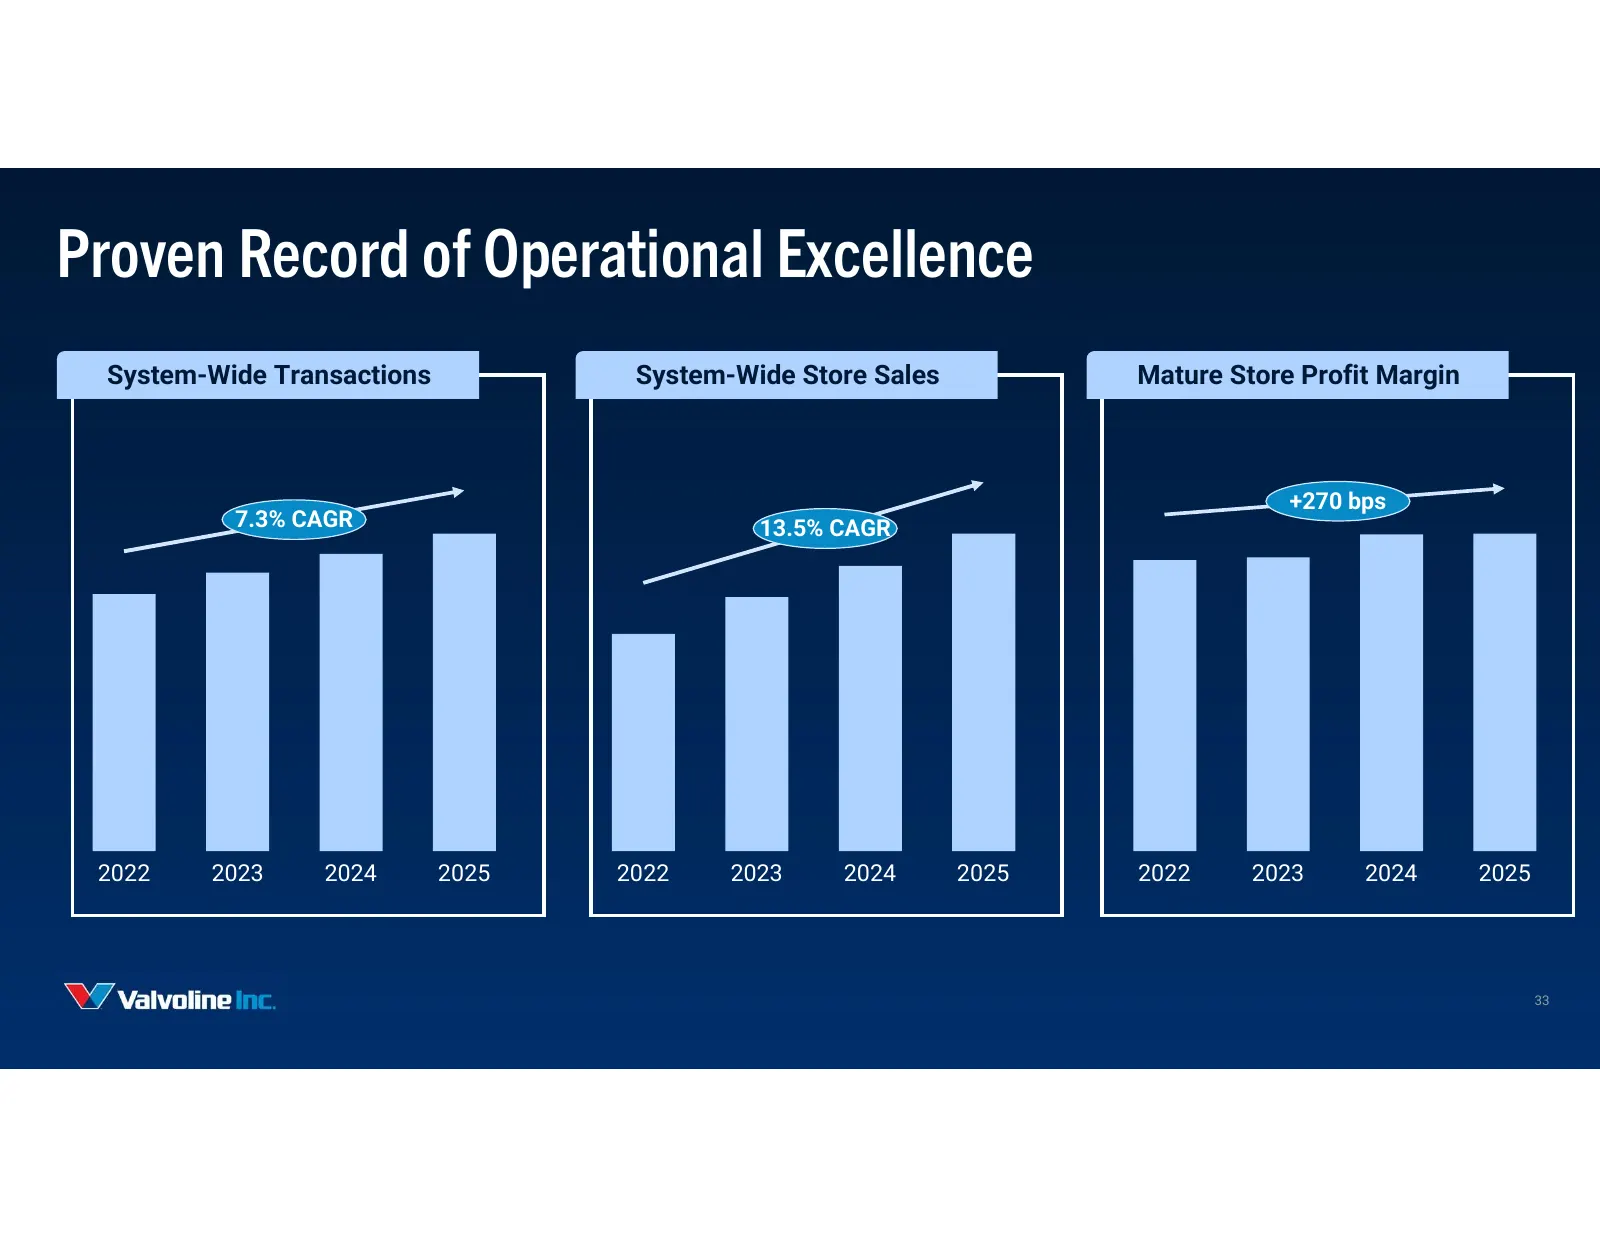
Proven Record of Operational Excellence System-Wide Transactions System-Wide Store Sales Mature Store Profit Margin +270 bps 7.3% CAGR 13.5% CAGR 2022 2023 2024 2025 2022 2023 2024 2025 2022 2023 2024 2025 33
Slide 34: Delivering a Consistently High Customer Experience
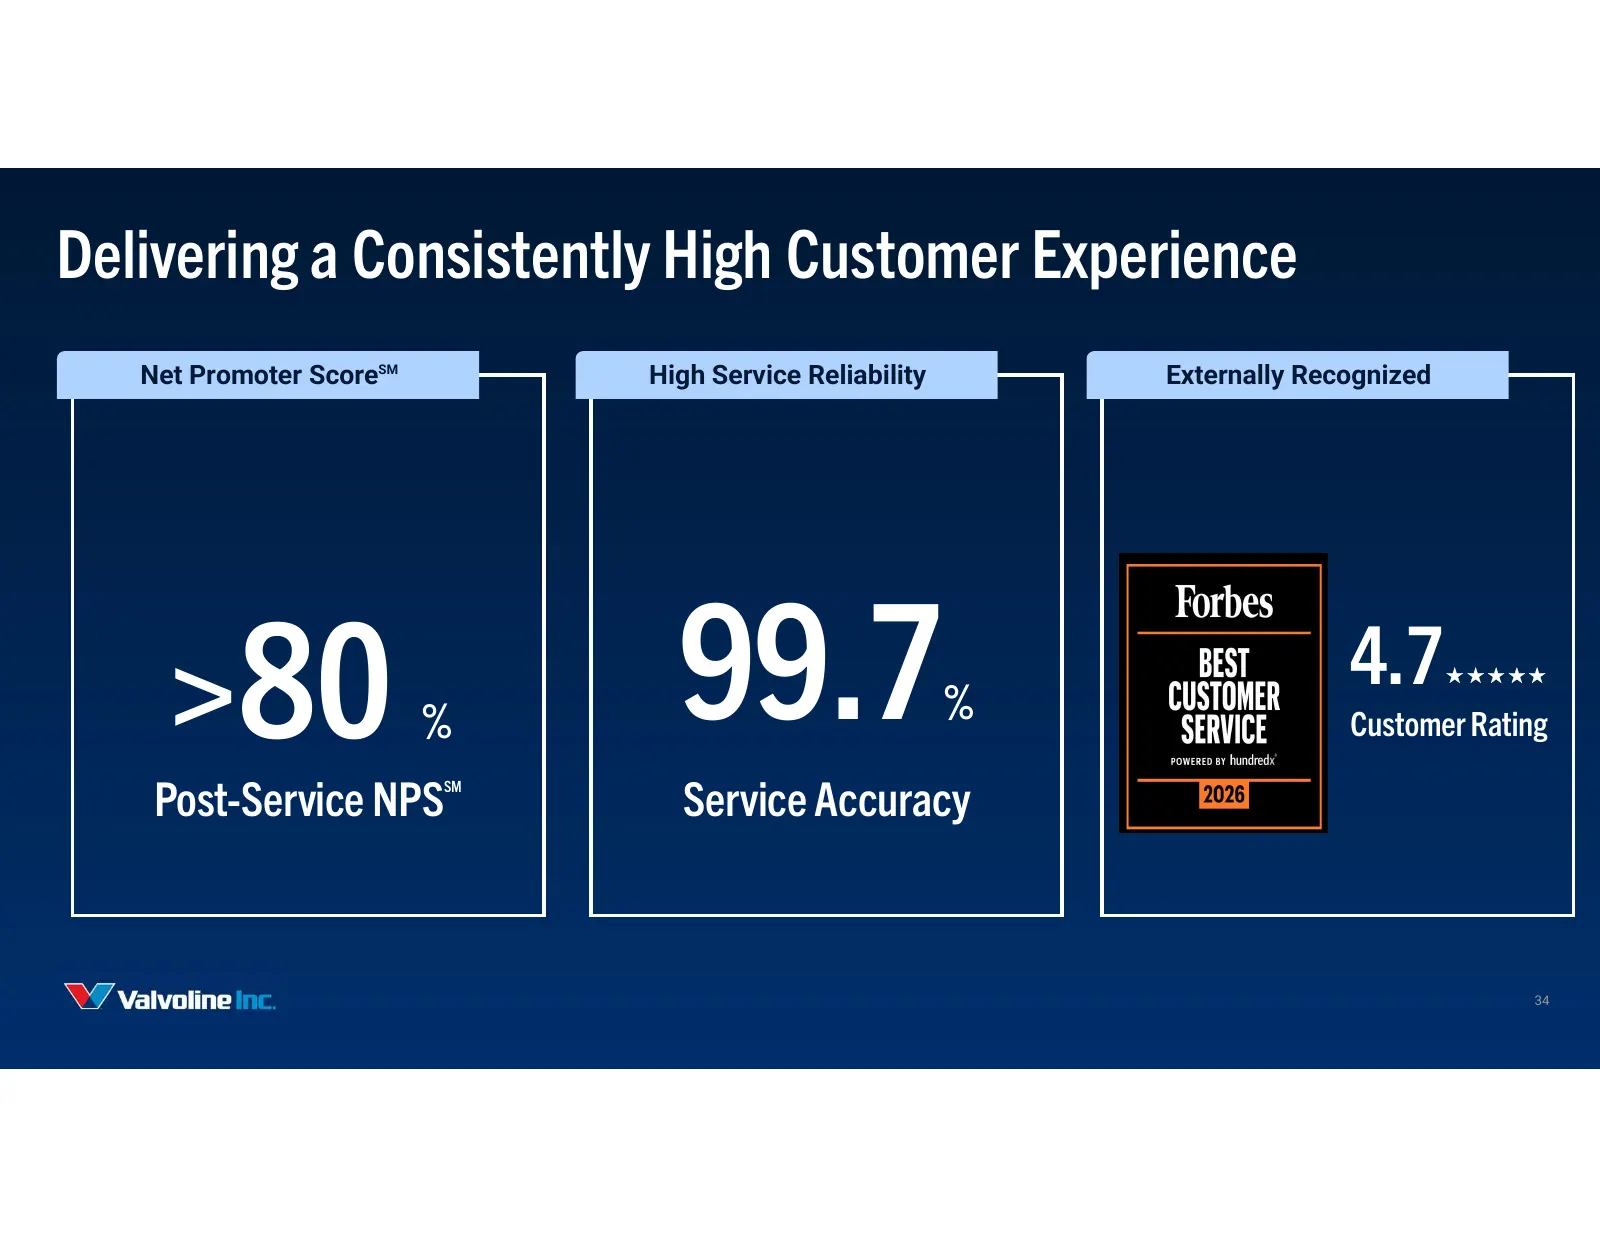
Delivering a Consistently High Customer Experience Net Promoter ScoreSM High Service Reliability Externally Recognized >80 % 99.7 % 4.7 Customer Rating Post-Service NPS SM Service Accuracy 34
Slide 35: Differentiated Approach Leads to Strong Margin Capture
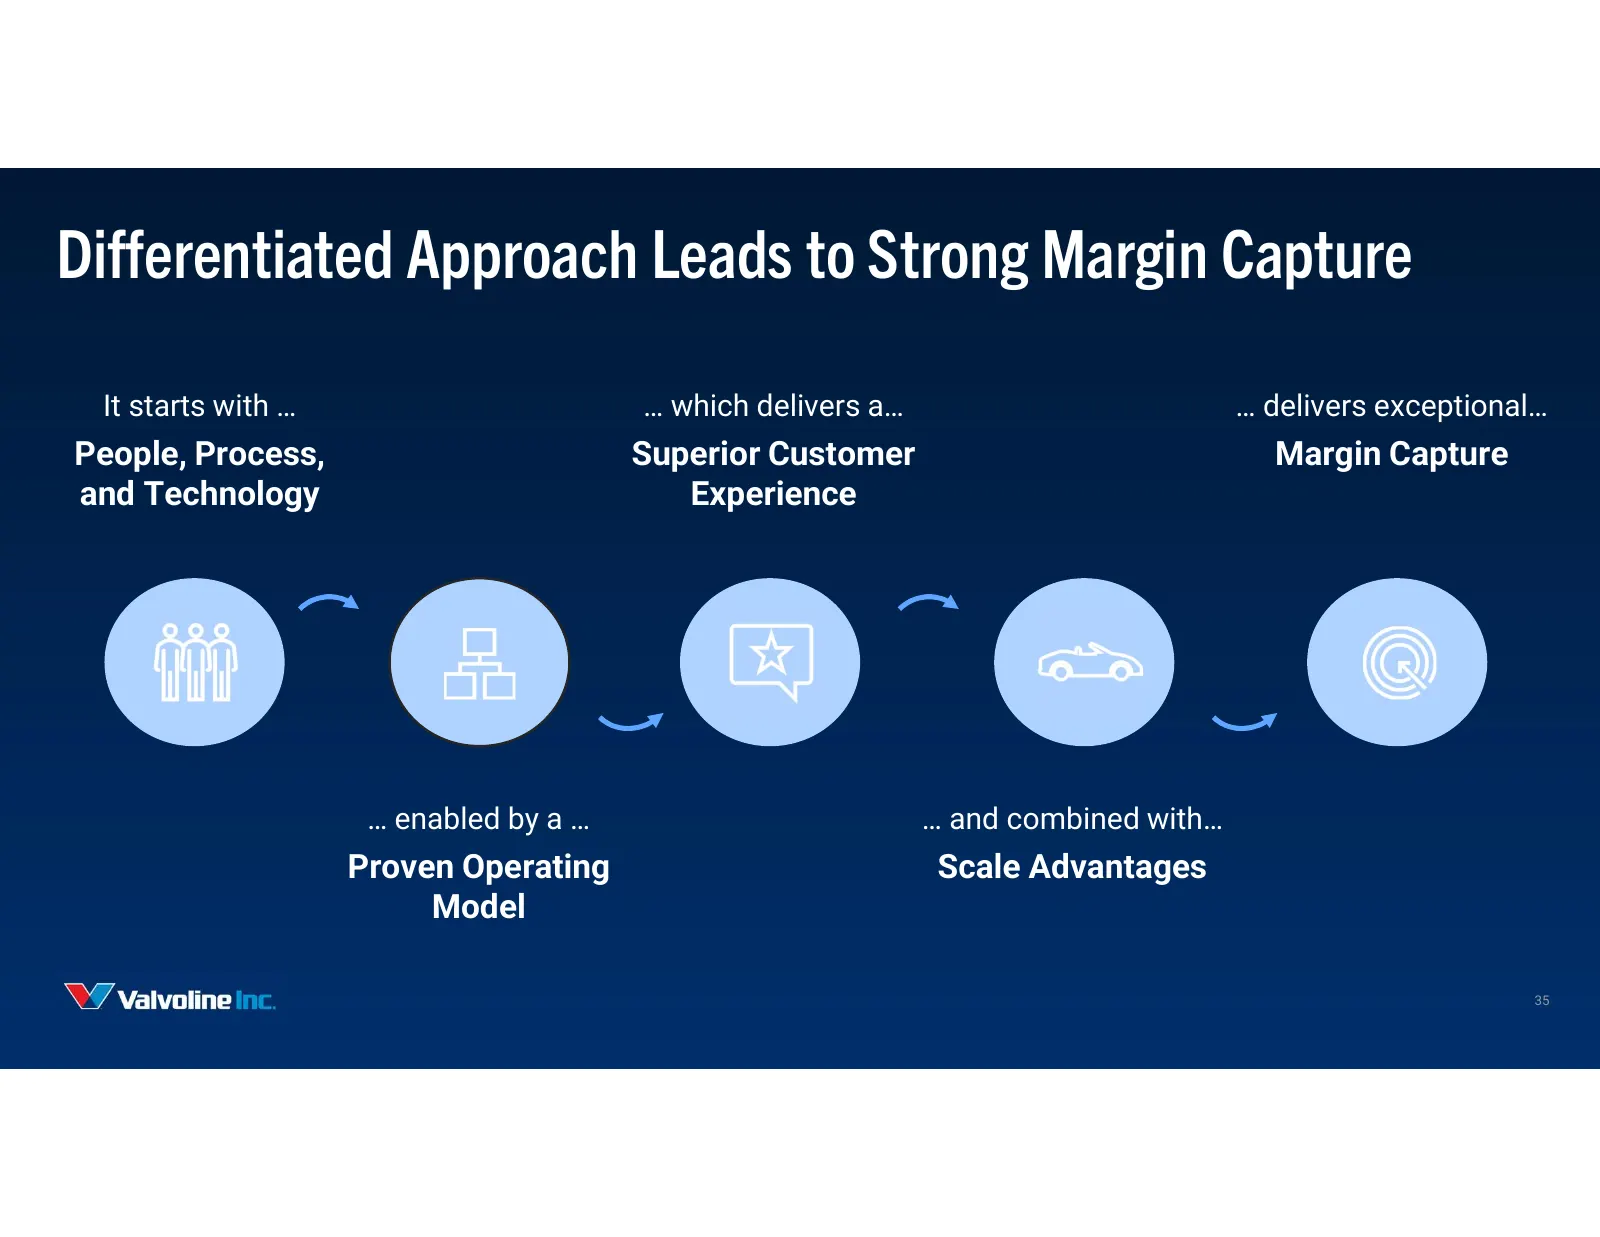
Differentiated Approach Leads to Strong Margin Capture It starts with … … which delivers a… … delivers exceptional… People, Process, Superior Customer Margin Capture and Technology Experience … enabled by a … … and combined with… Proven Operating Scale Advantages Model 35
Slide 36: It all Starts with Our People
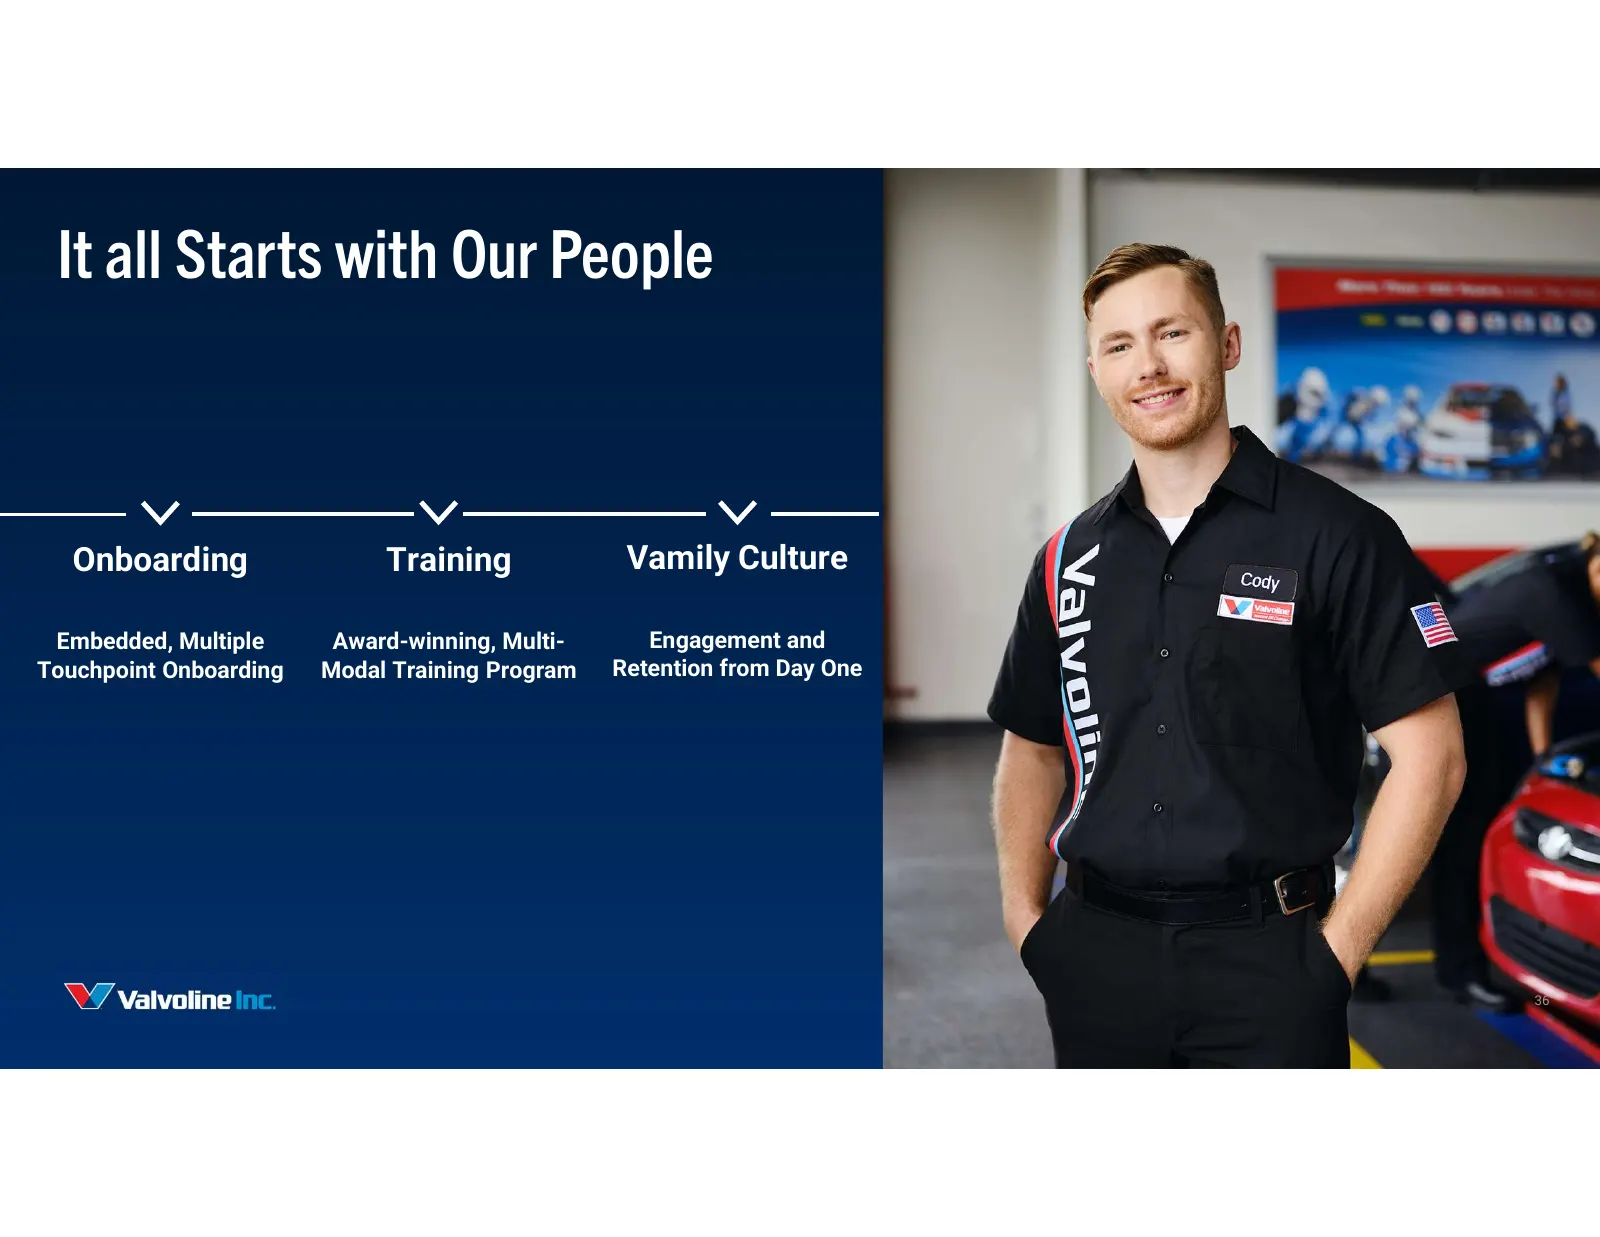
It all Starts with Our People Onboarding Training Vamily Culture Embedded, Multiple Award-winning, Multi- Engagement and Touchpoint Onboarding Modal Training Program Retention from Day One 36 36
Slide 37: Providing Them a Path to Growth
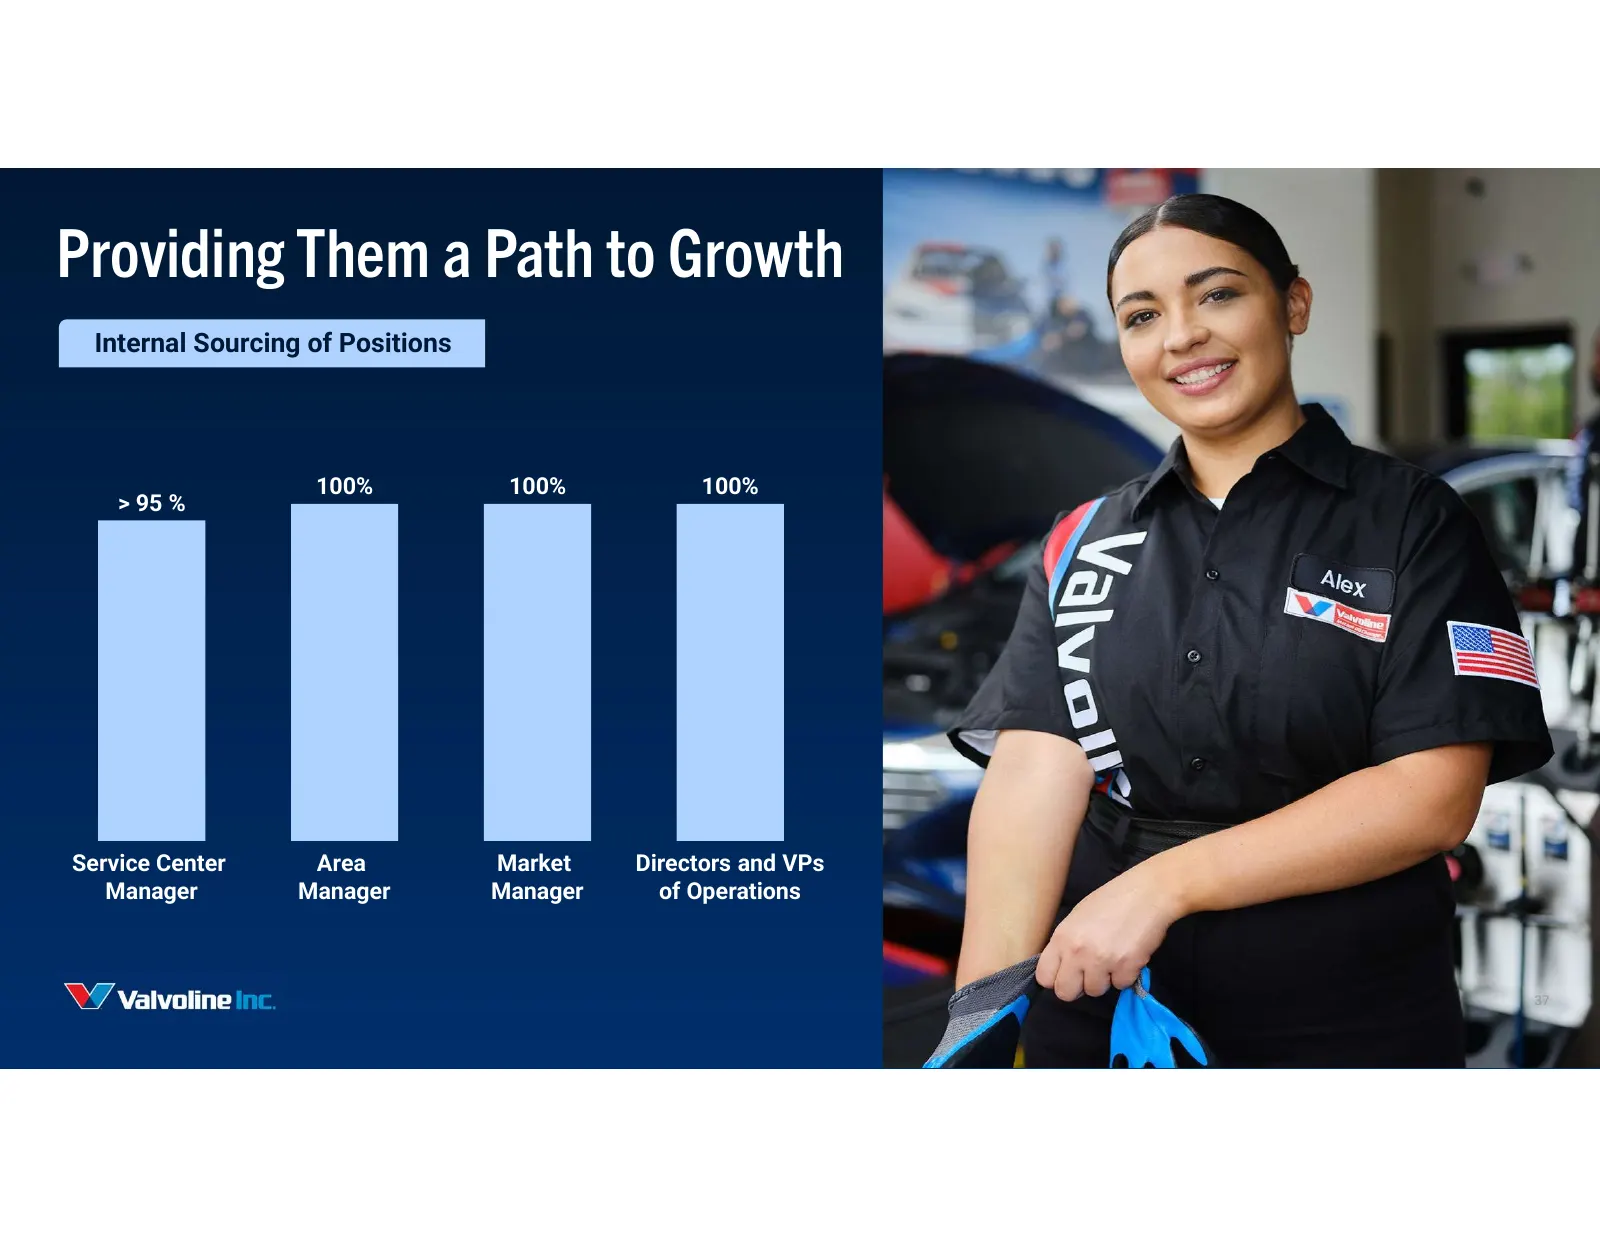
Providing Them a Path to Growth Internal Sourcing of Positions 100% 100% 100% > 95 % Service Center Area Market Directors and VPs Manager Manager Manager of Operations 37 37
Slide 38: SuperPro Drives Consistent Operational Execution in Store
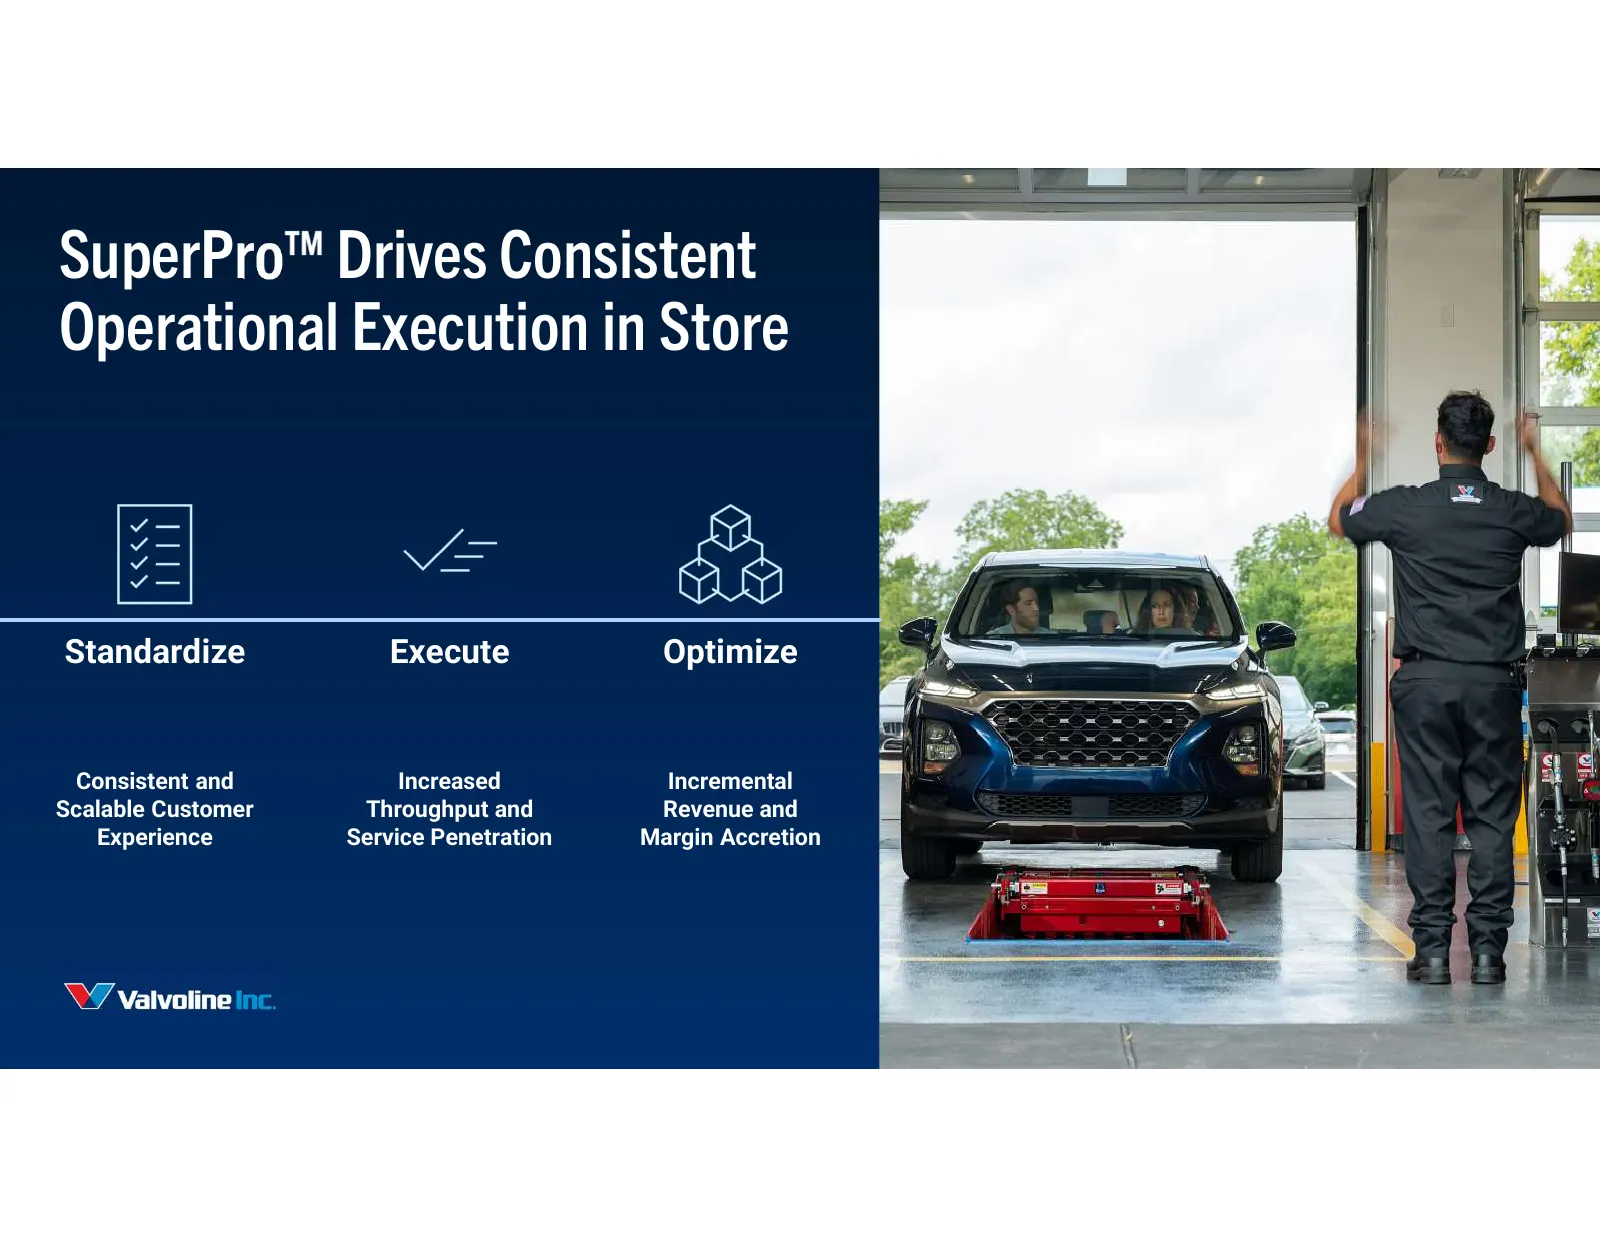
SuperPro Drives Consistent Operational Execution in Store Standardize Execute Optimize Consistent and Increased Incremental Scalable Customer Throughput and Revenue and Experience Service Penetration Margin Accretion 38 38
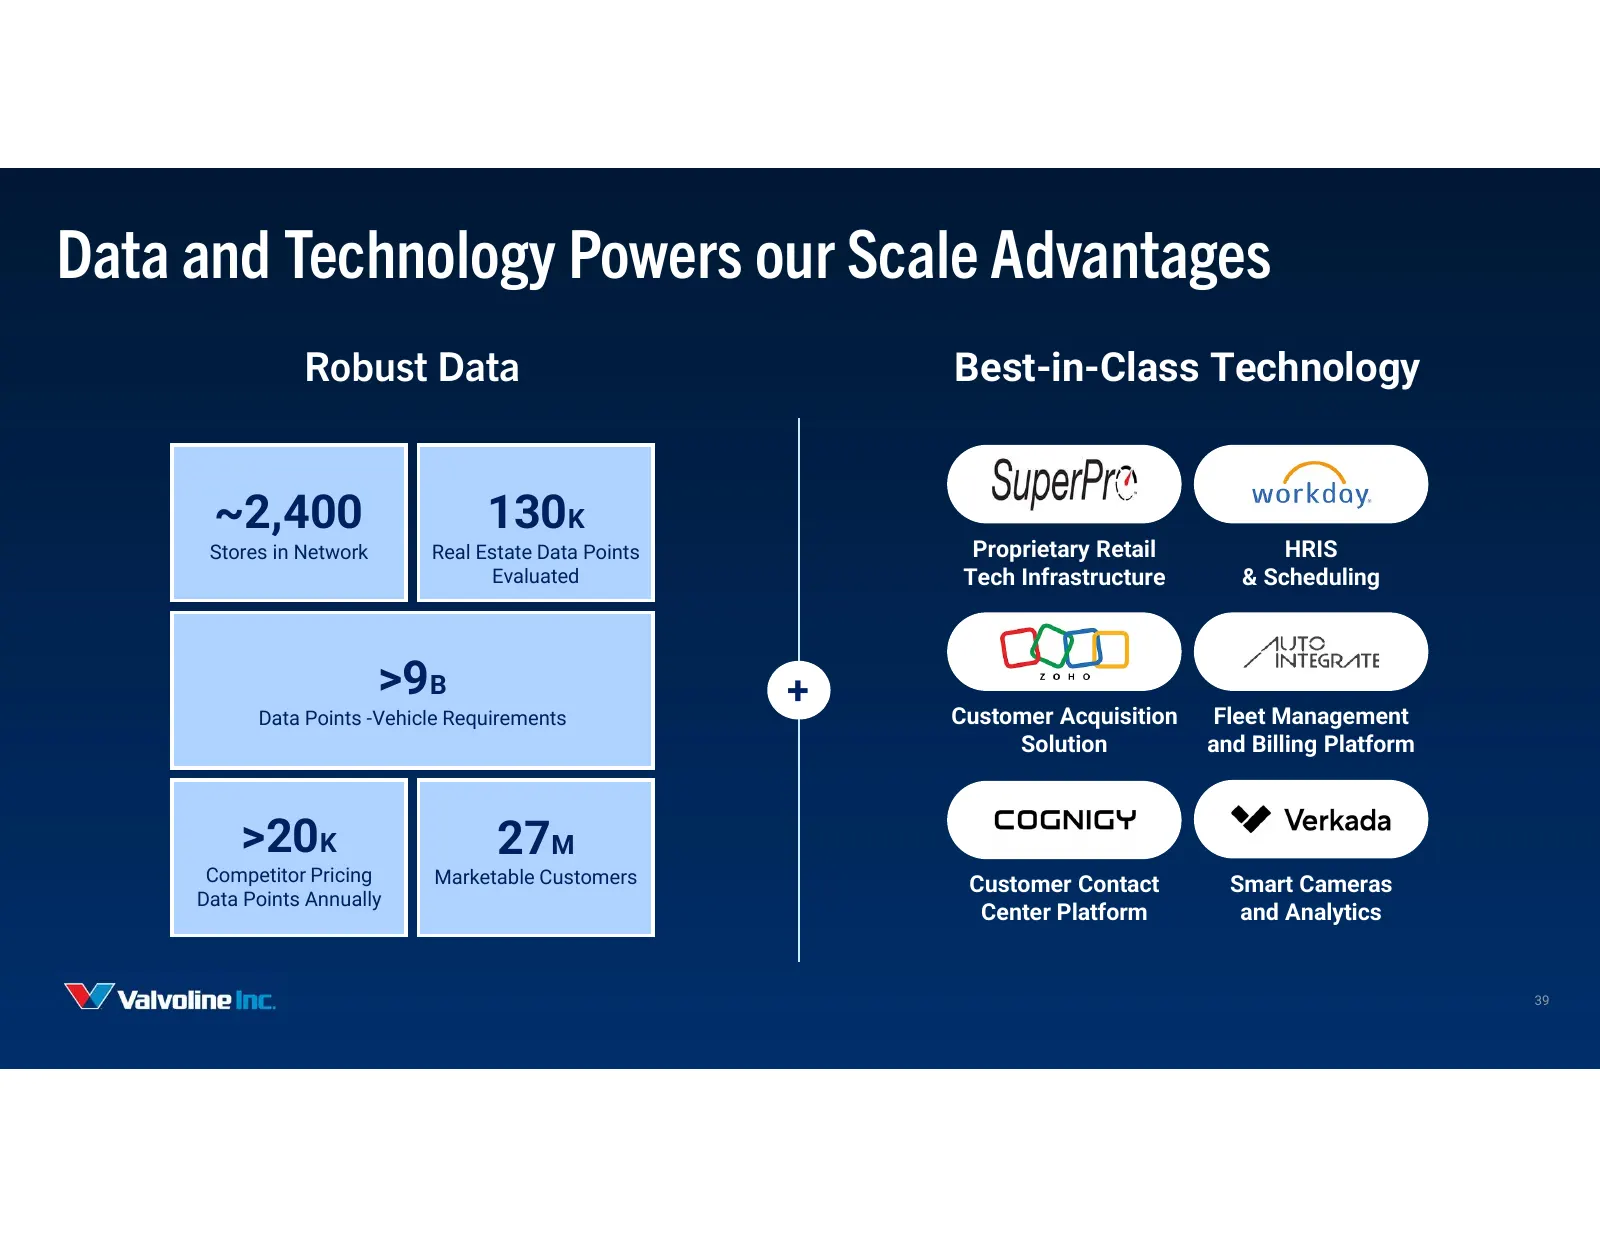
Slide 39: Data and Technology Powers our Scale Advantages
Data and Technology Powers our Scale Advantages Robust Data Best-in-Class Technology ~2,400 130K Stores in Network Real Estate Data Points Proprietary Retail HRIS Evaluated Tech Infrastructure & Scheduling >9B + Data Points -Vehicle Requirements Customer Acquisition Fleet Management Solution and Bil
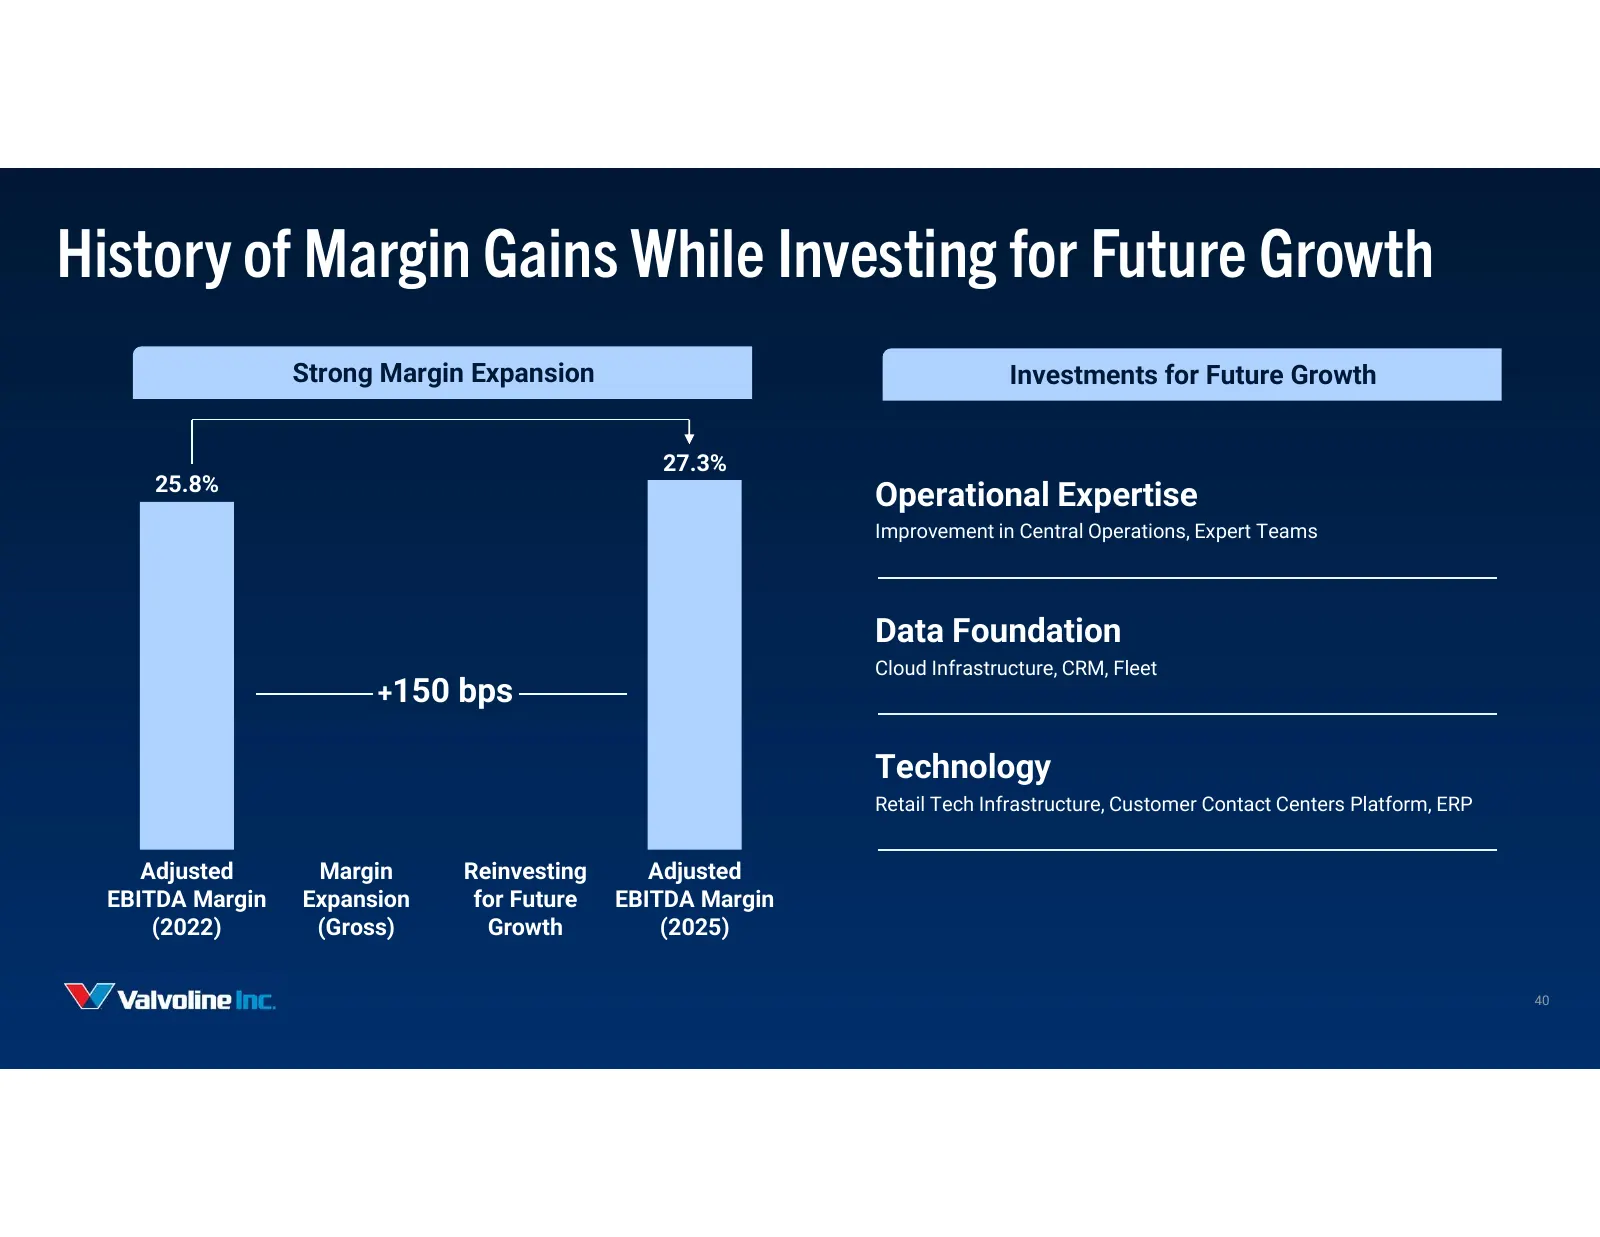
Slide 40: History of Margin Gains While Investing for Future Growth
History of Margin Gains While Investing for Future Growth Strong Margin Expansion Investments for Future Growth 27.3% 25.8% Operational Expertise Improvement in Central Operations, Expert Teams Data Foundation Cloud Infrastructure, CRM, Fleet +150 bps Technology Retail Tech Infrastructure, Customer
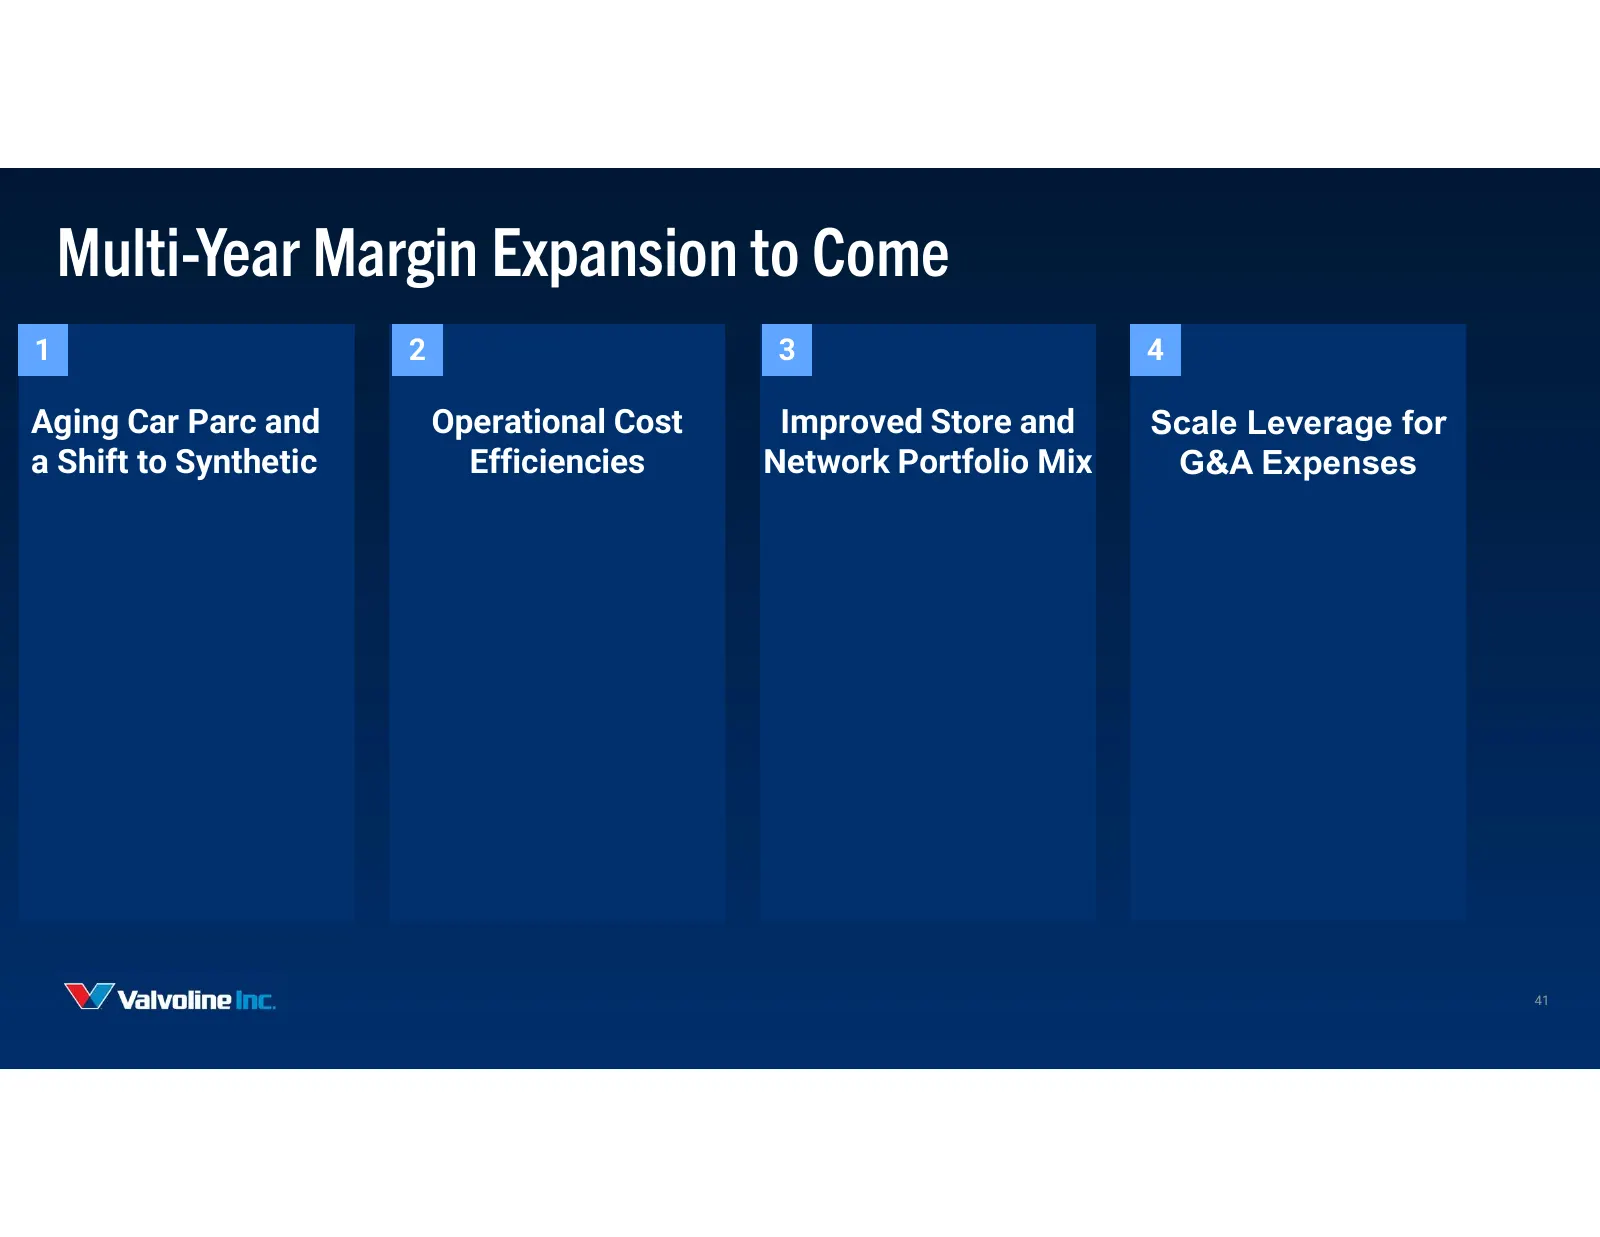
Slide 41: Multi-Year Margin Expansion to Come
Multi-Year Margin Expansion to Come 1 2 3 4 Aging Car Parc and Operational Cost Improved Store and Scale Leverage for a Shift to Synthetic Efficiencies Network Portfolio Mix G&A Expenses 41
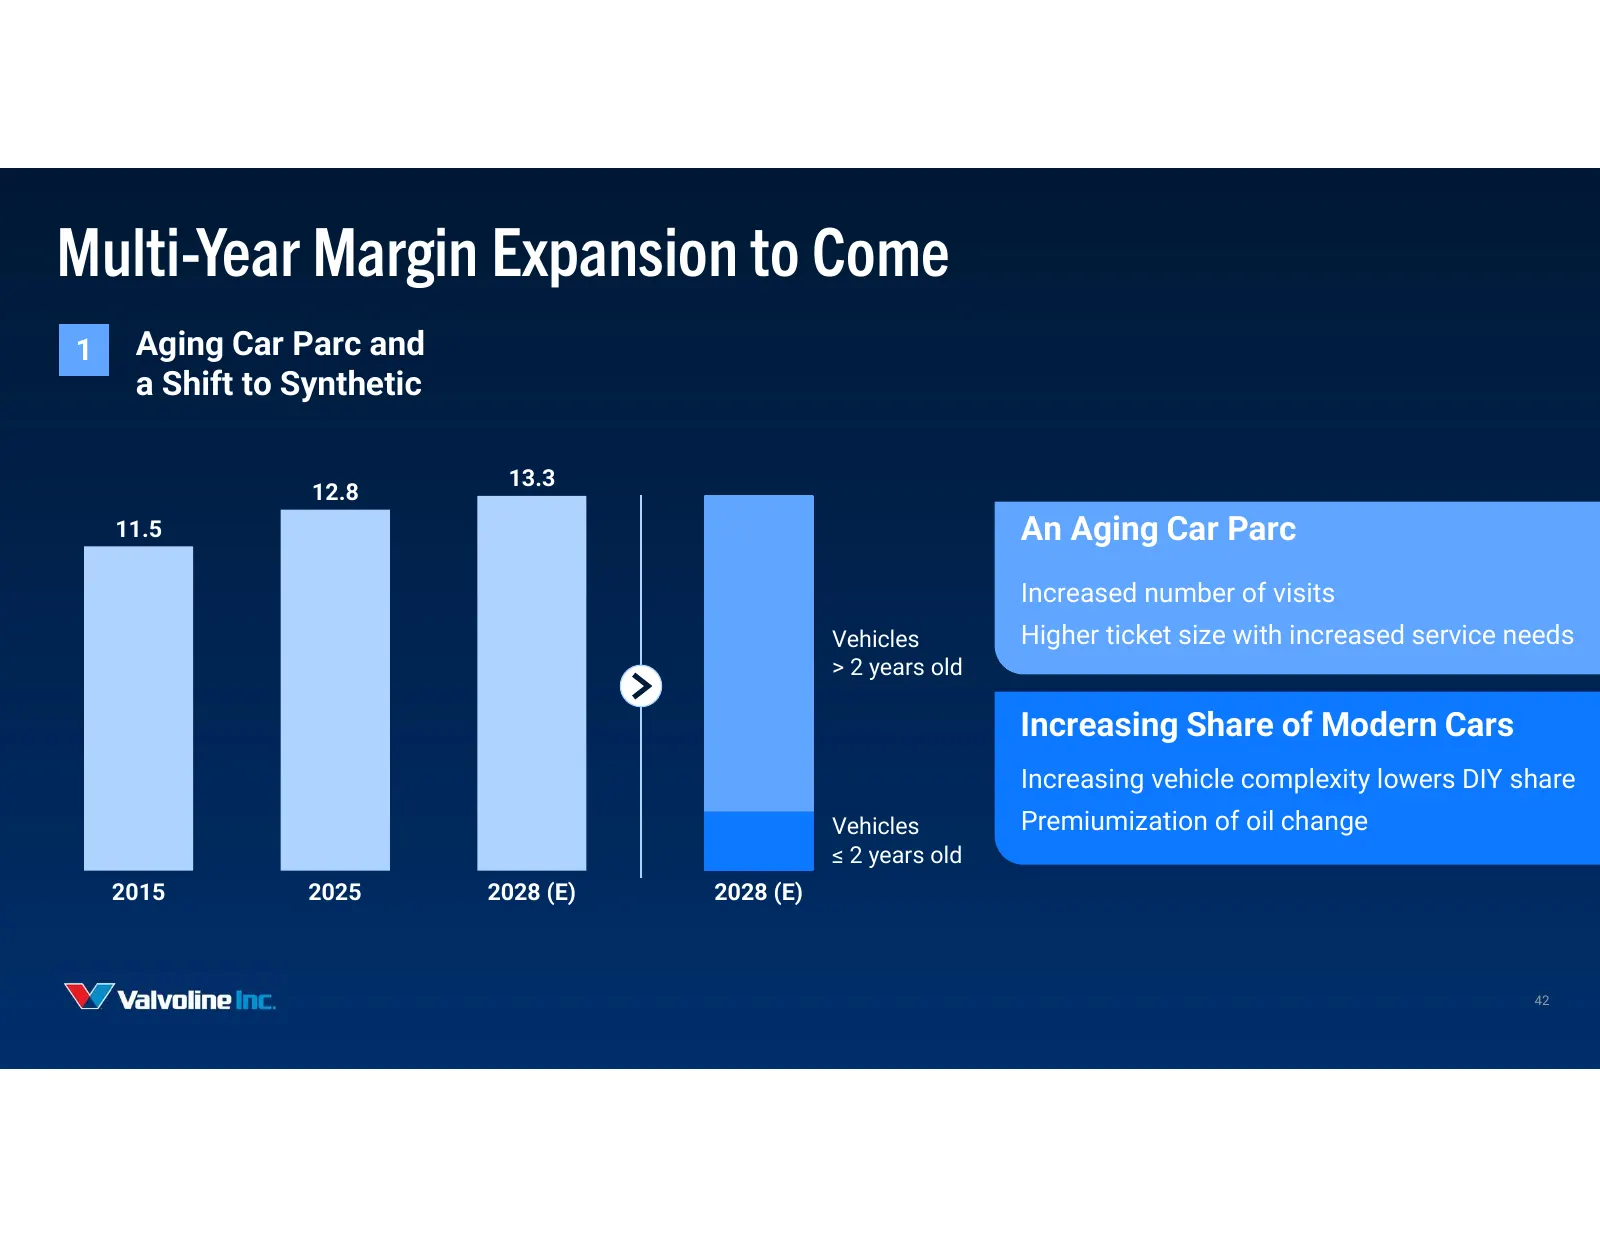
Slide 42: Multi-Year Margin Expansion to Come
Multi-Year Margin Expansion to Come 1 Aging Car Parc and a Shift to Synthetic 13.3 12.8 11.5 An Aging Car Parc Increased number of visits Vehicles Higher ticket size with increased service needs > 2 years old Increasing Share of Modern Cars Increasing vehicle complexity lowers DIY share Vehicles Pre
Slide 43: Multi-Year Margin Expansion to Come
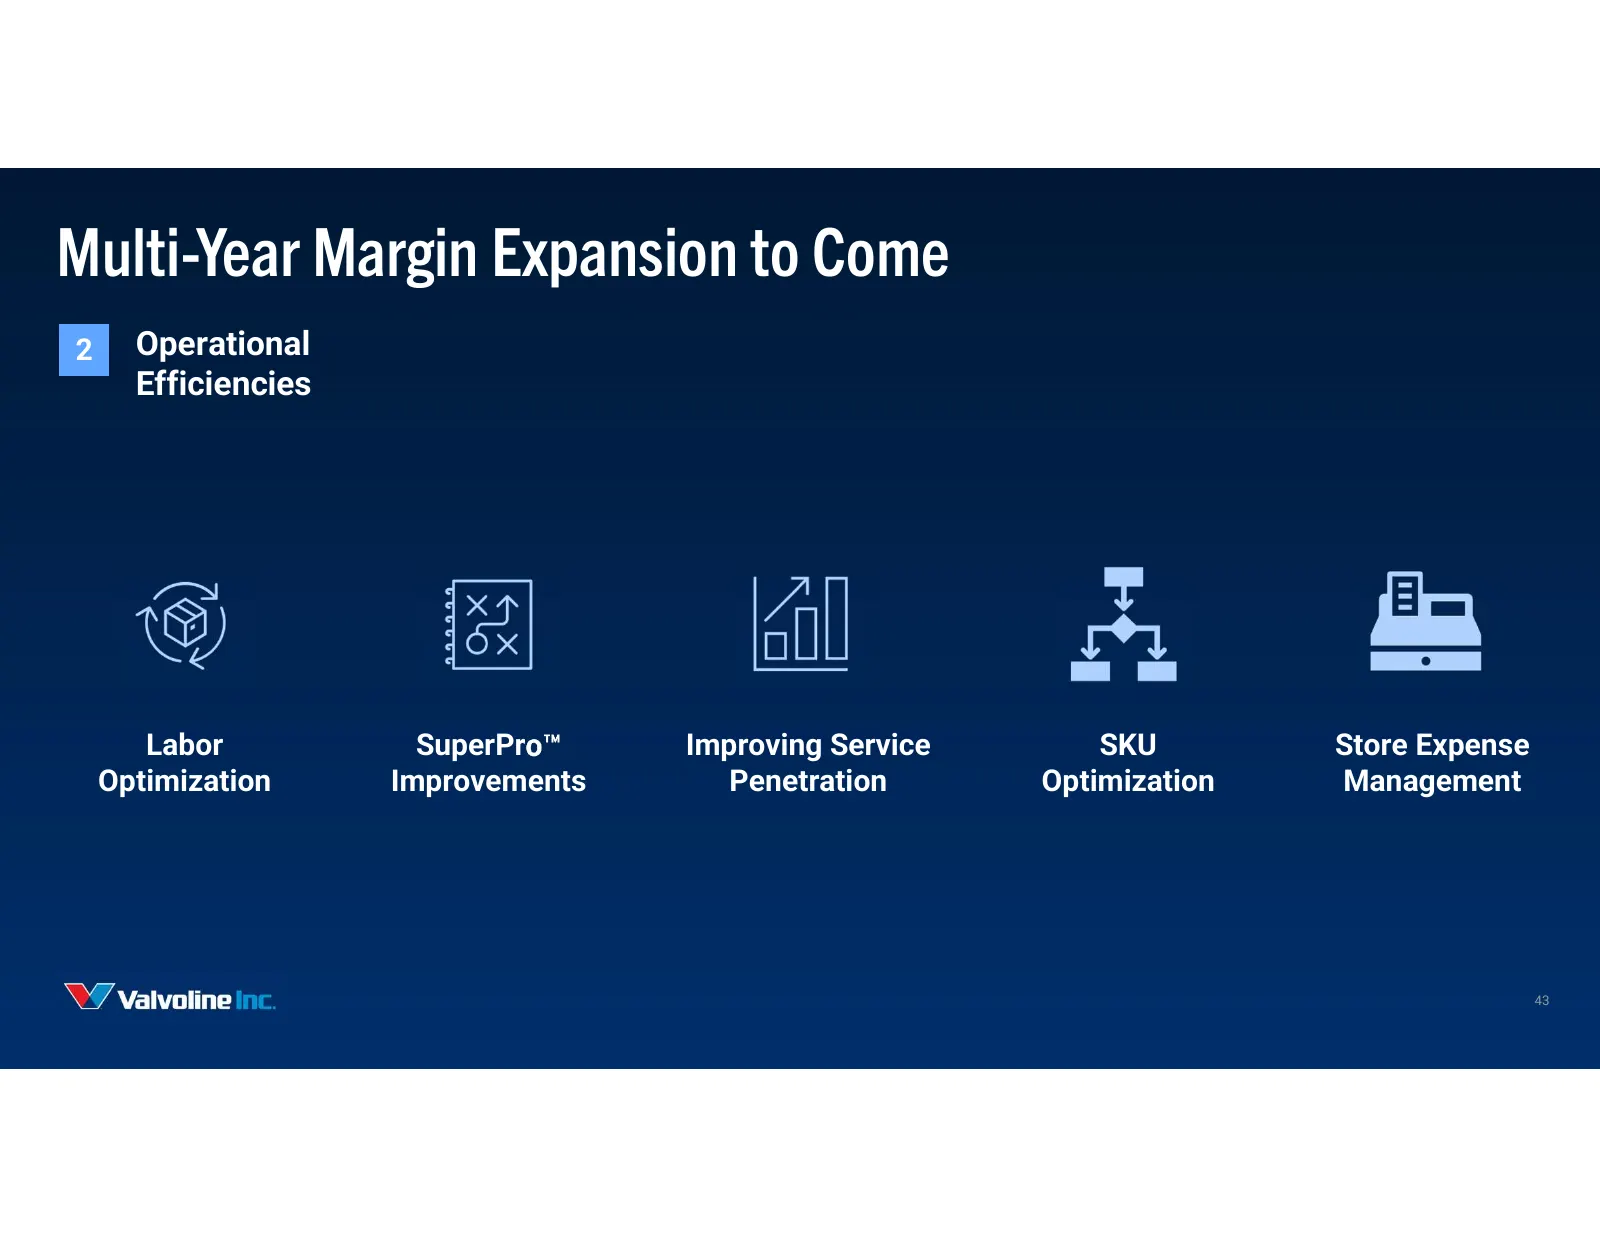
Multi-Year Margin Expansion to Come 2 Operational Efficiencies Labor SuperPro Improving Service SKU Store Expense Optimization Improvements Penetration Optimization Management 43
Slide 44: Multi-Year Margin Expansion to Come
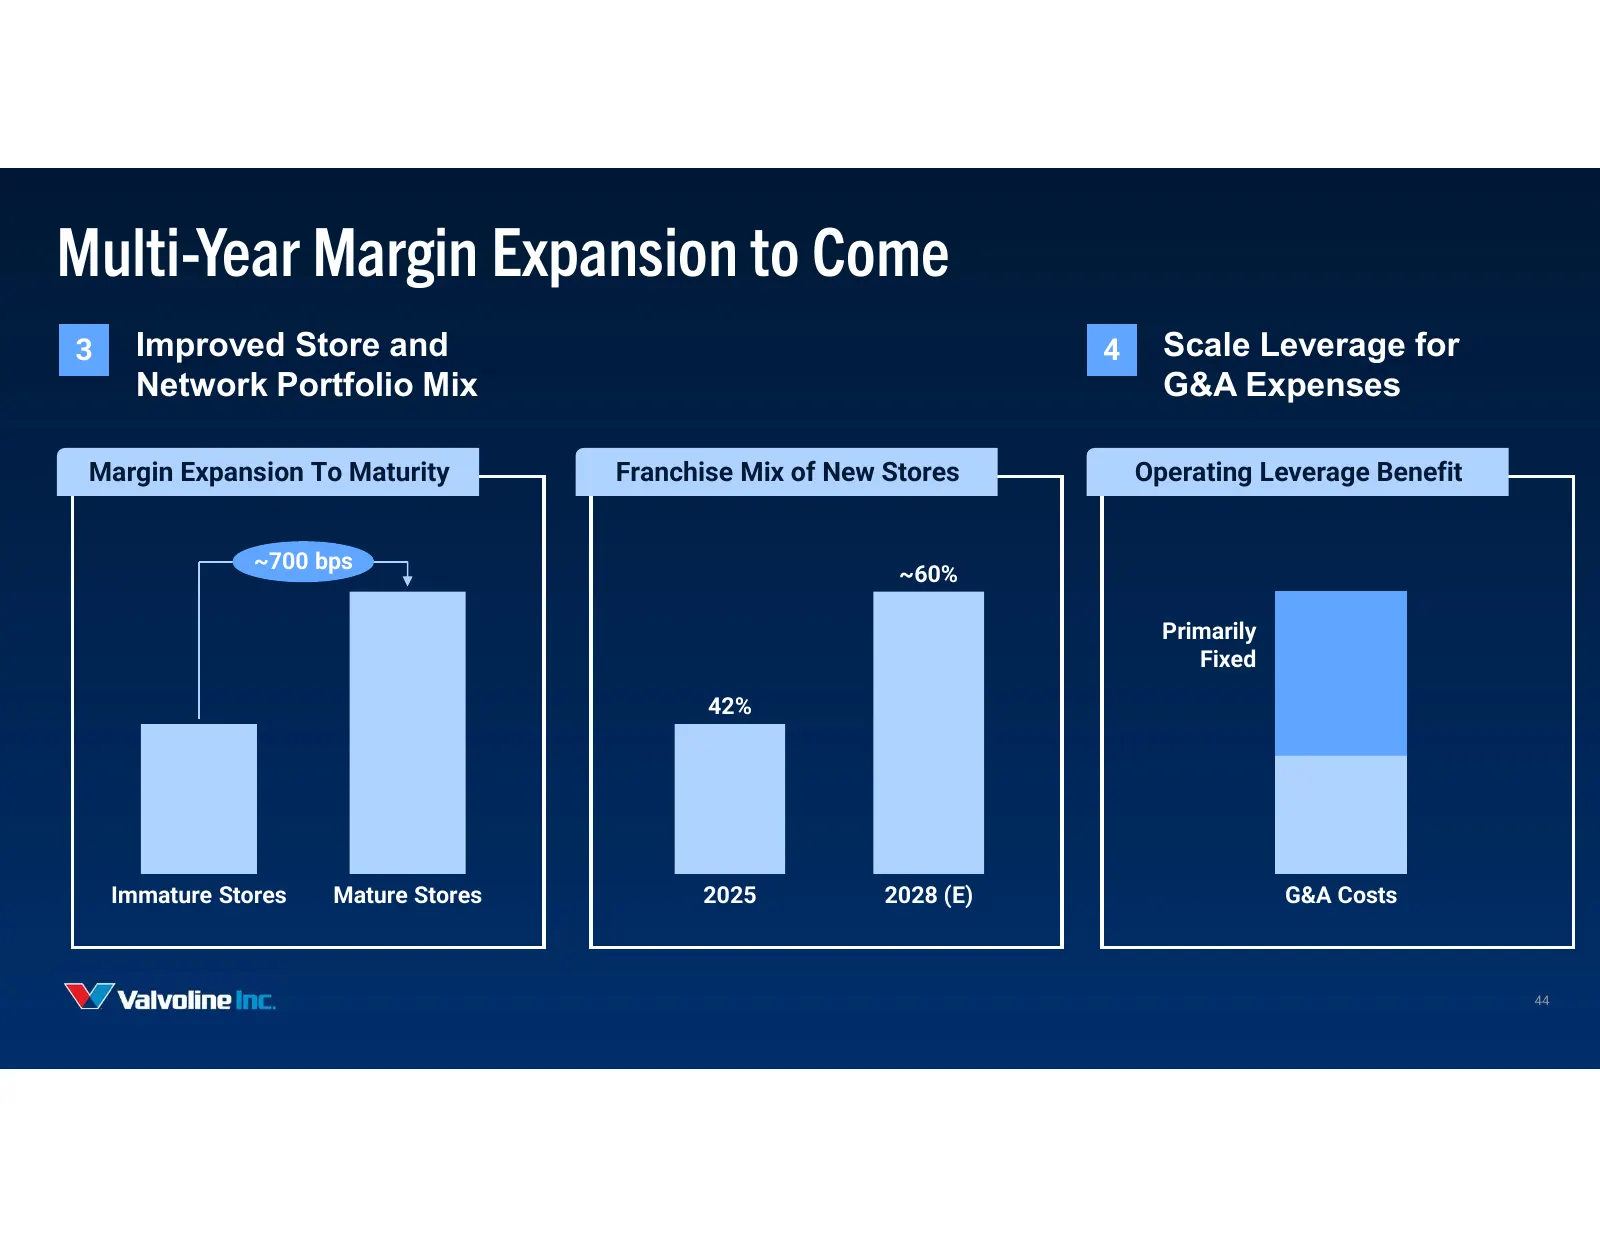
Multi-Year Margin Expansion to Come 3 Improved Store and 4 Scale Leverage for Network Portfolio Mix G&A Expenses Margin Expansion To Maturity Franchise Mix of New Stores Operating Leverage Benefit ~700 bps ~60% Primarily Fixed 42% Immature Stores Mature Stores 2025 2028 (E) G&A Costs 44
Slide 45: EBITDA Margin Expansion Roadmap
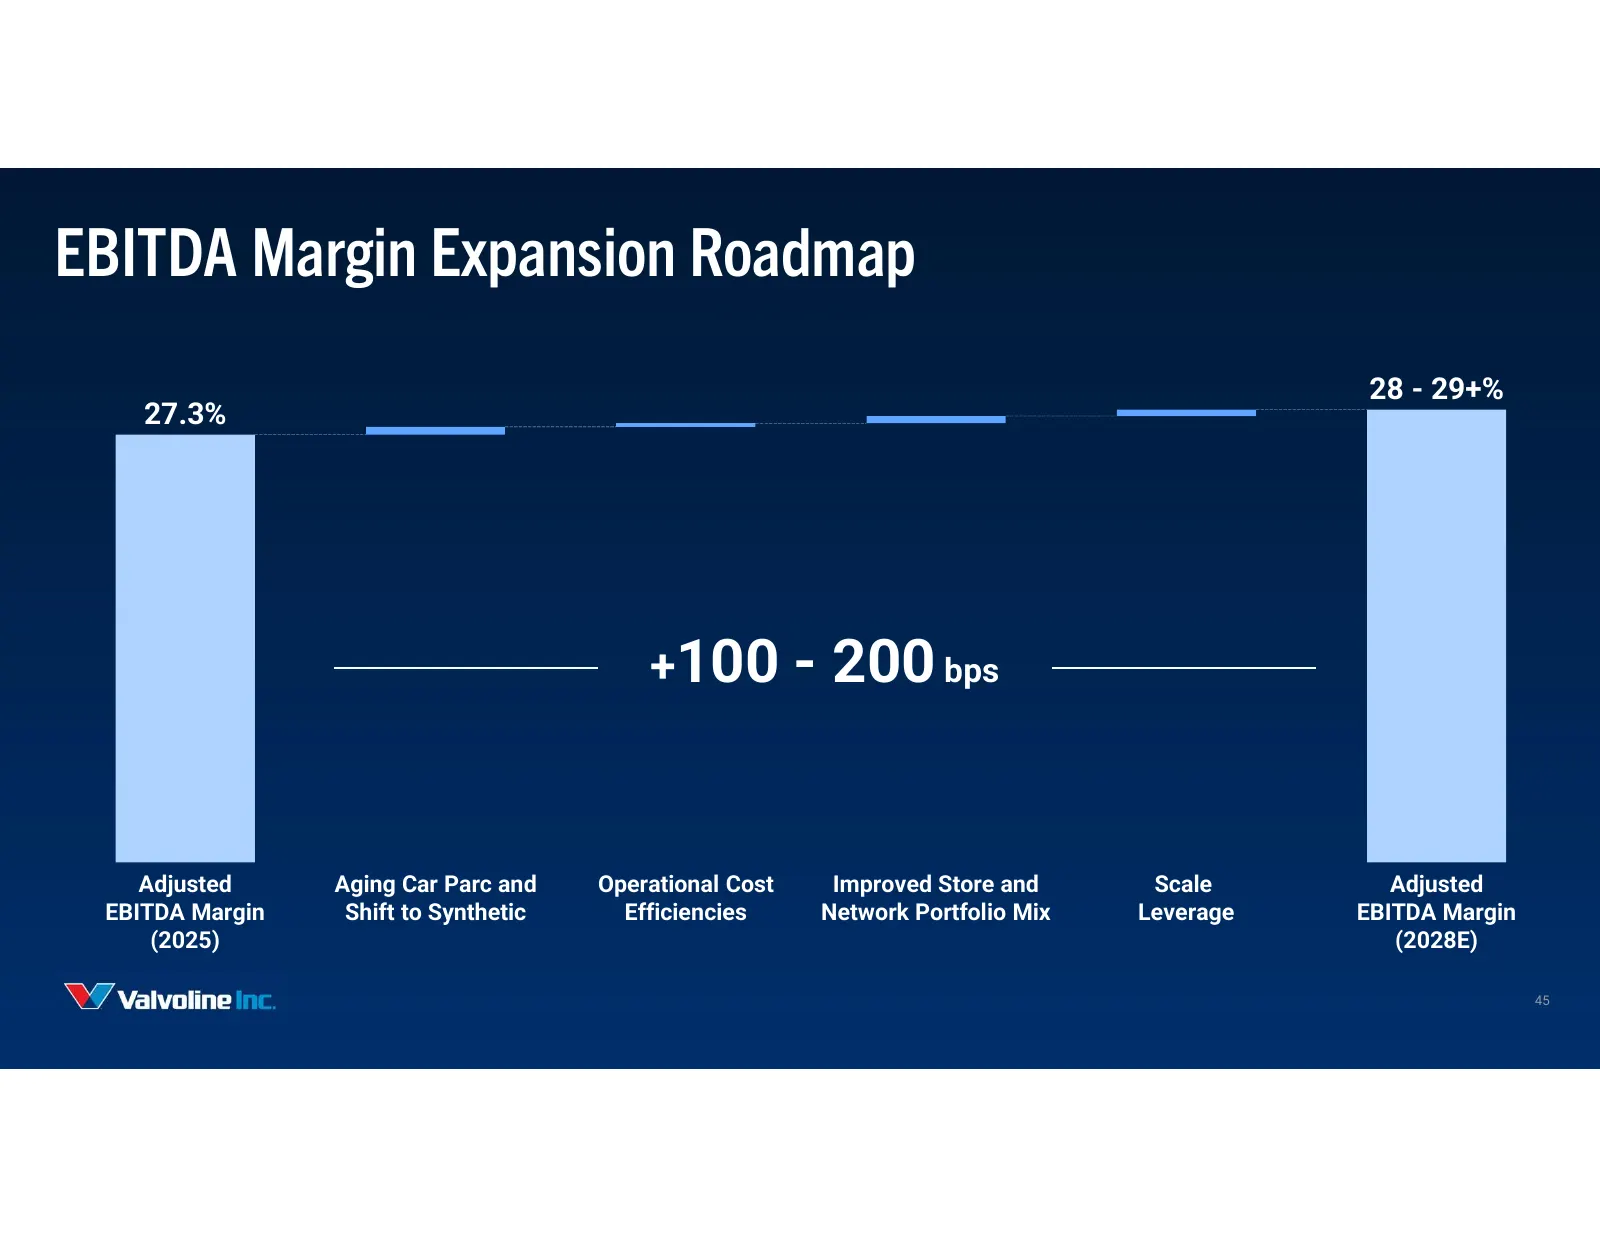
EBITDA Margin Expansion Roadmap 28 - 29+% 27.3% +100 - 200 bps Adjusted Aging Car Parc and Operational Cost Improved Store and Scale Adjusted EBITDA Margin Shift to Synthetic Efficiencies Network Portfolio Mix Leverage EBITDA Margin (2025) (2028E) 45
Slide 46: Key Takeaways
Strong and Proven Track Record of 1 Operational Excellence Key Key Enabled by a Differentiated Approach to 2 Takeaways Takeaways People, Process, and Technology Operational Capabilities with Scale will 3 Deliver Margin Expansion 46
Slide 47: Break
wf,.| BUILT ous We Will Return Shortly

Slide 48: YYZ Valvoline inc.
YYZ Valvoline inc.
Slide 49: Franchise Advantage & Growth Drivers
Franchise Advantage & Growth Drivers Adam Worsham, Chief Franchising Officer 49
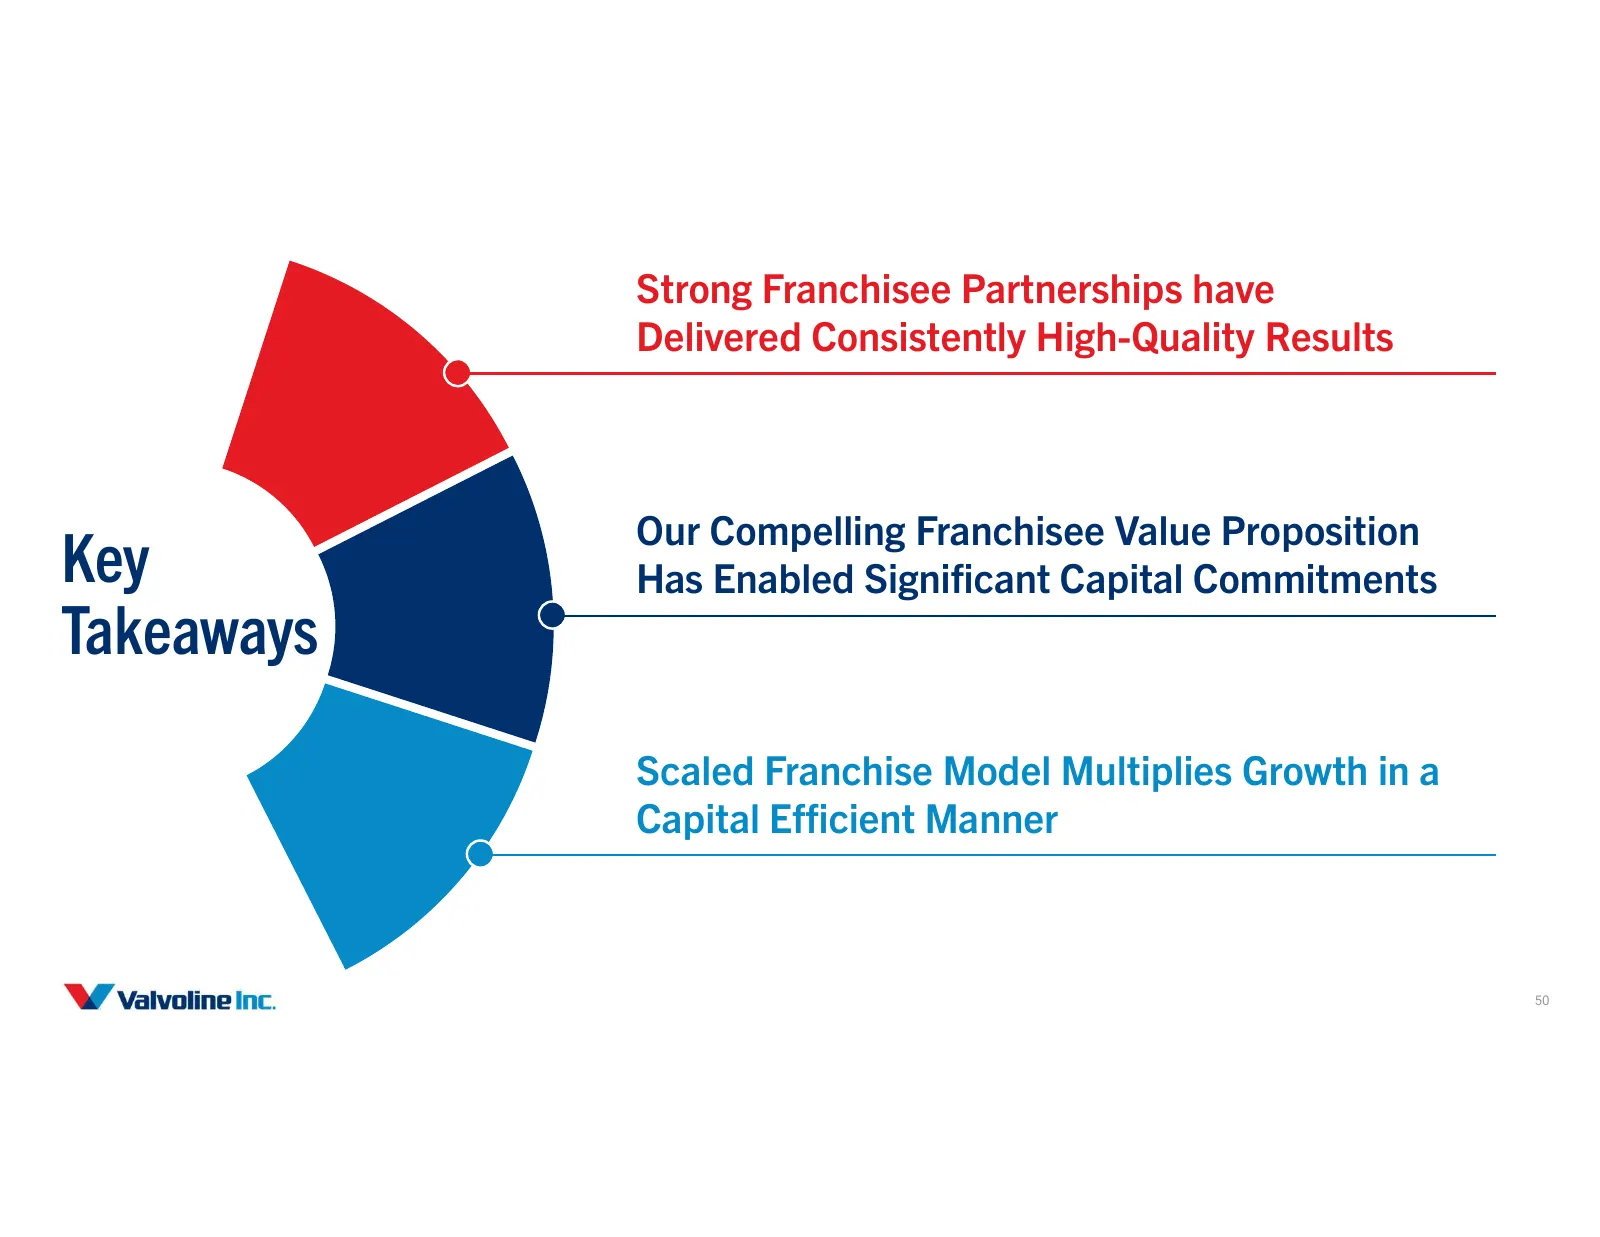
Slide 50: Key Takeaways
Strong Franchisee Partnerships have Delivered Consistently High-Quality Results Our Compelling Franchisee Value Proposition Key Has Enabled Significant Capital Commitments Takeaways Scaled Franchise Model Multiplies Growth in a Capital Efficient Manner 50
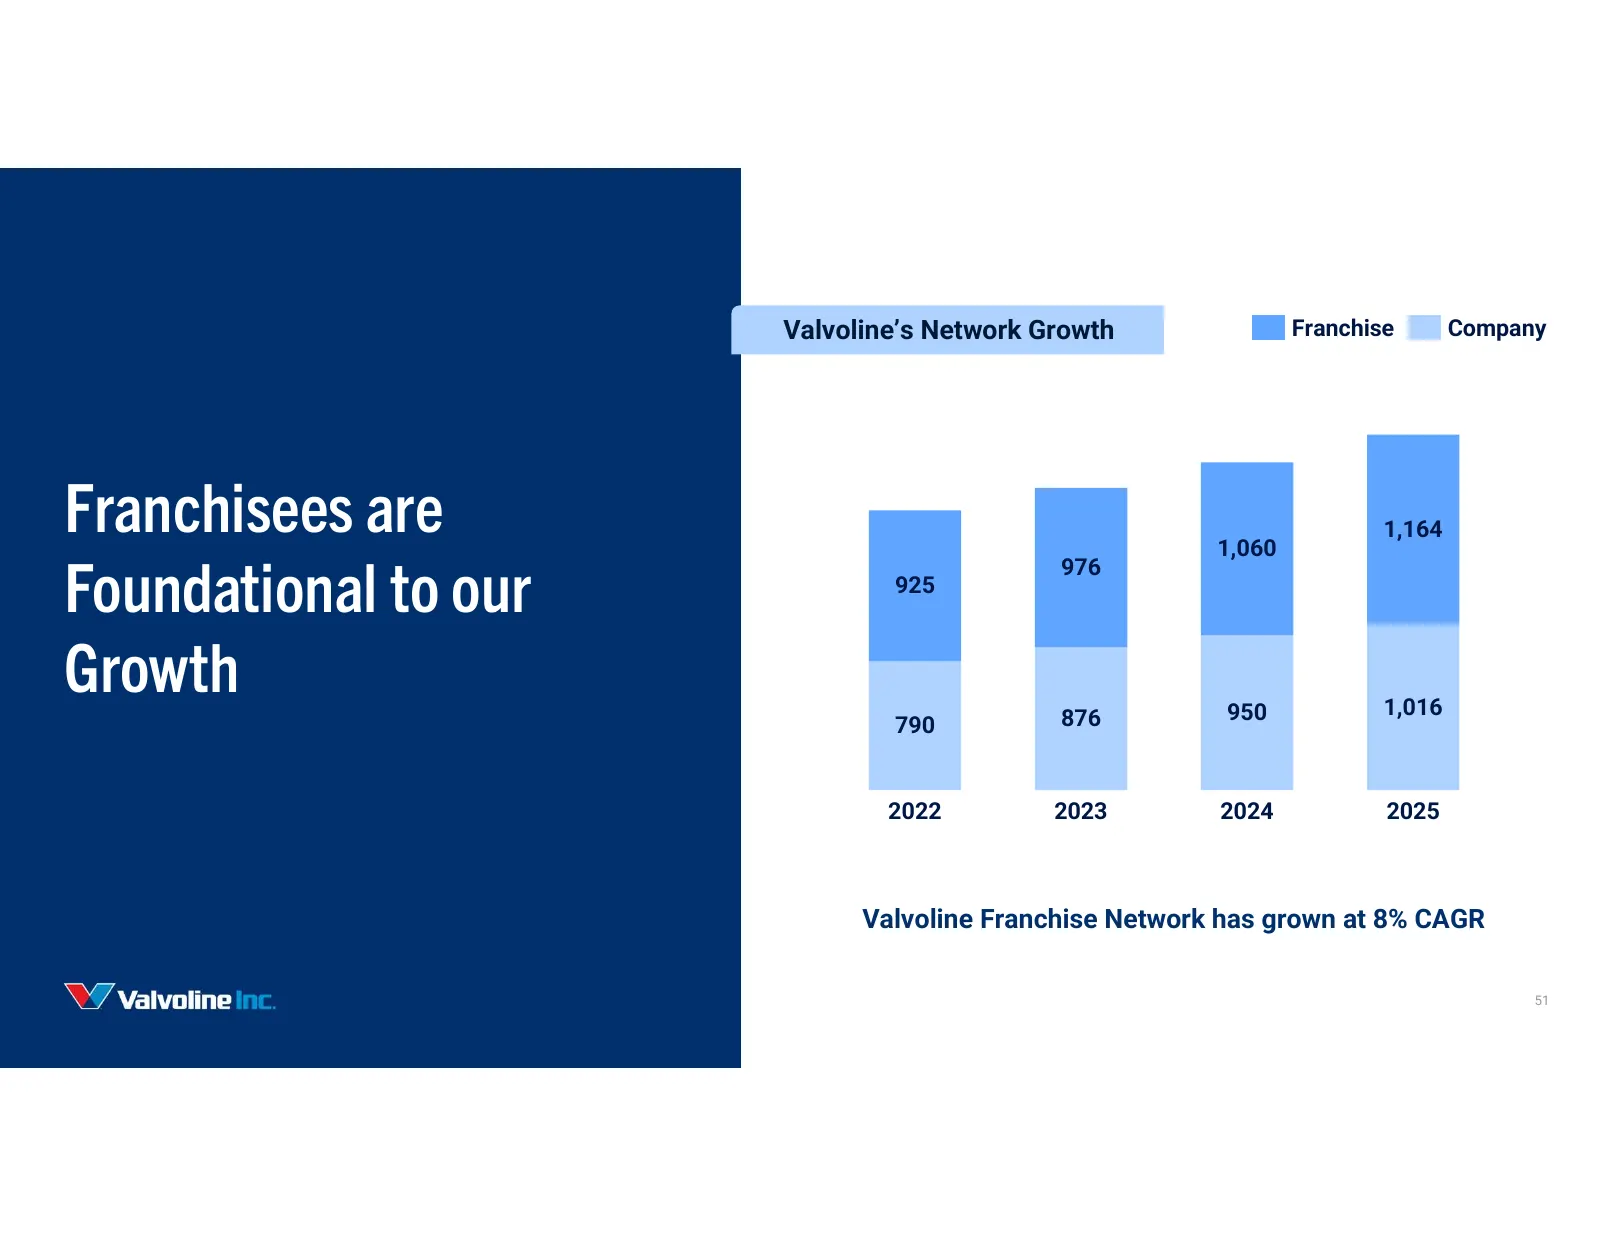
Slide 51: Franchisees are Foundational to our Growth
Valvoline’s Network Growth Franchise Company Franchisees are 1,060 1,164 Foundational to our 976 925 Growth 950 1,016 790 876 2022 2023 2024 2025 Valvoline Franchise Network has grown at 8% CAGR 51
Slide 52: Franchisees are Foundational to our Growth
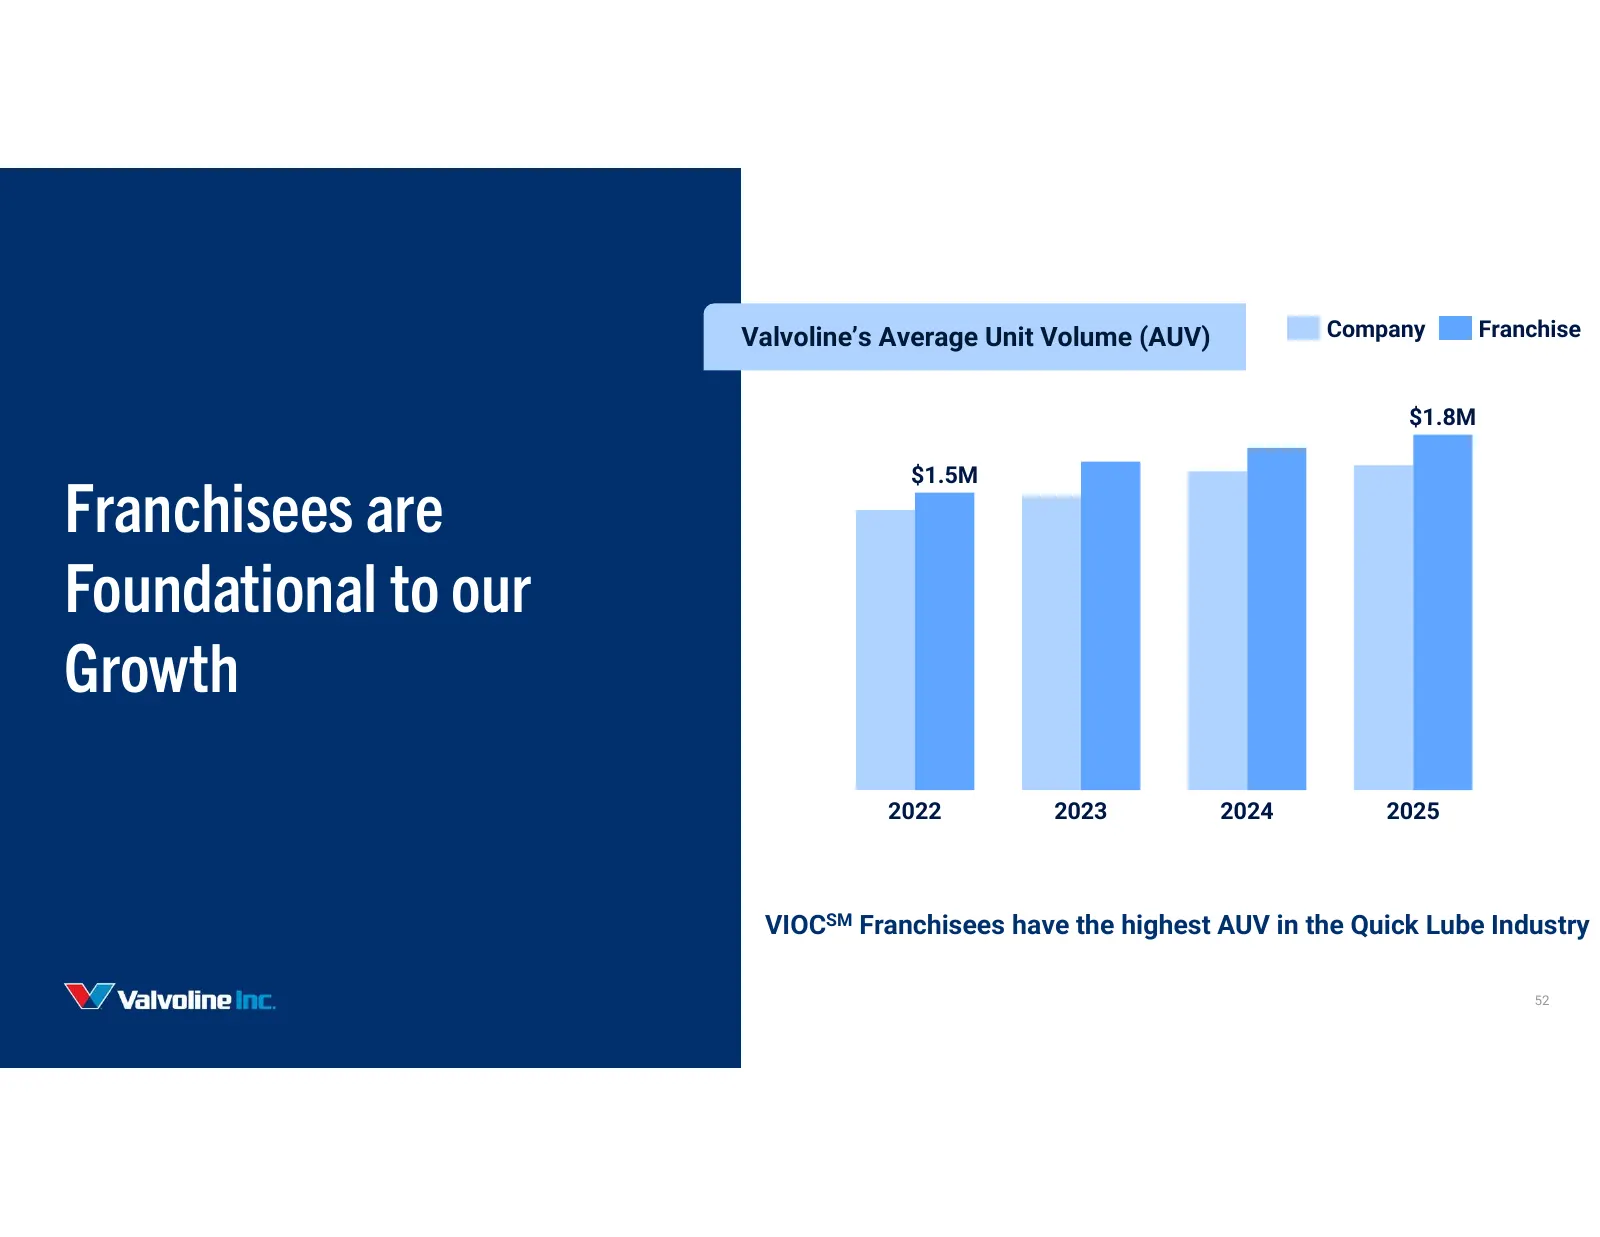
Valvoline’s Average Unit Volume (AUV) Company Franchise $1.8M $1.5M Franchisees are Foundational to our Growth 2022 2023 2024 2025 VIOCSM Franchisees have the highest AUV in the Quick Lube Industry 52
Slide 53: Our Value Proposition: True Partnership
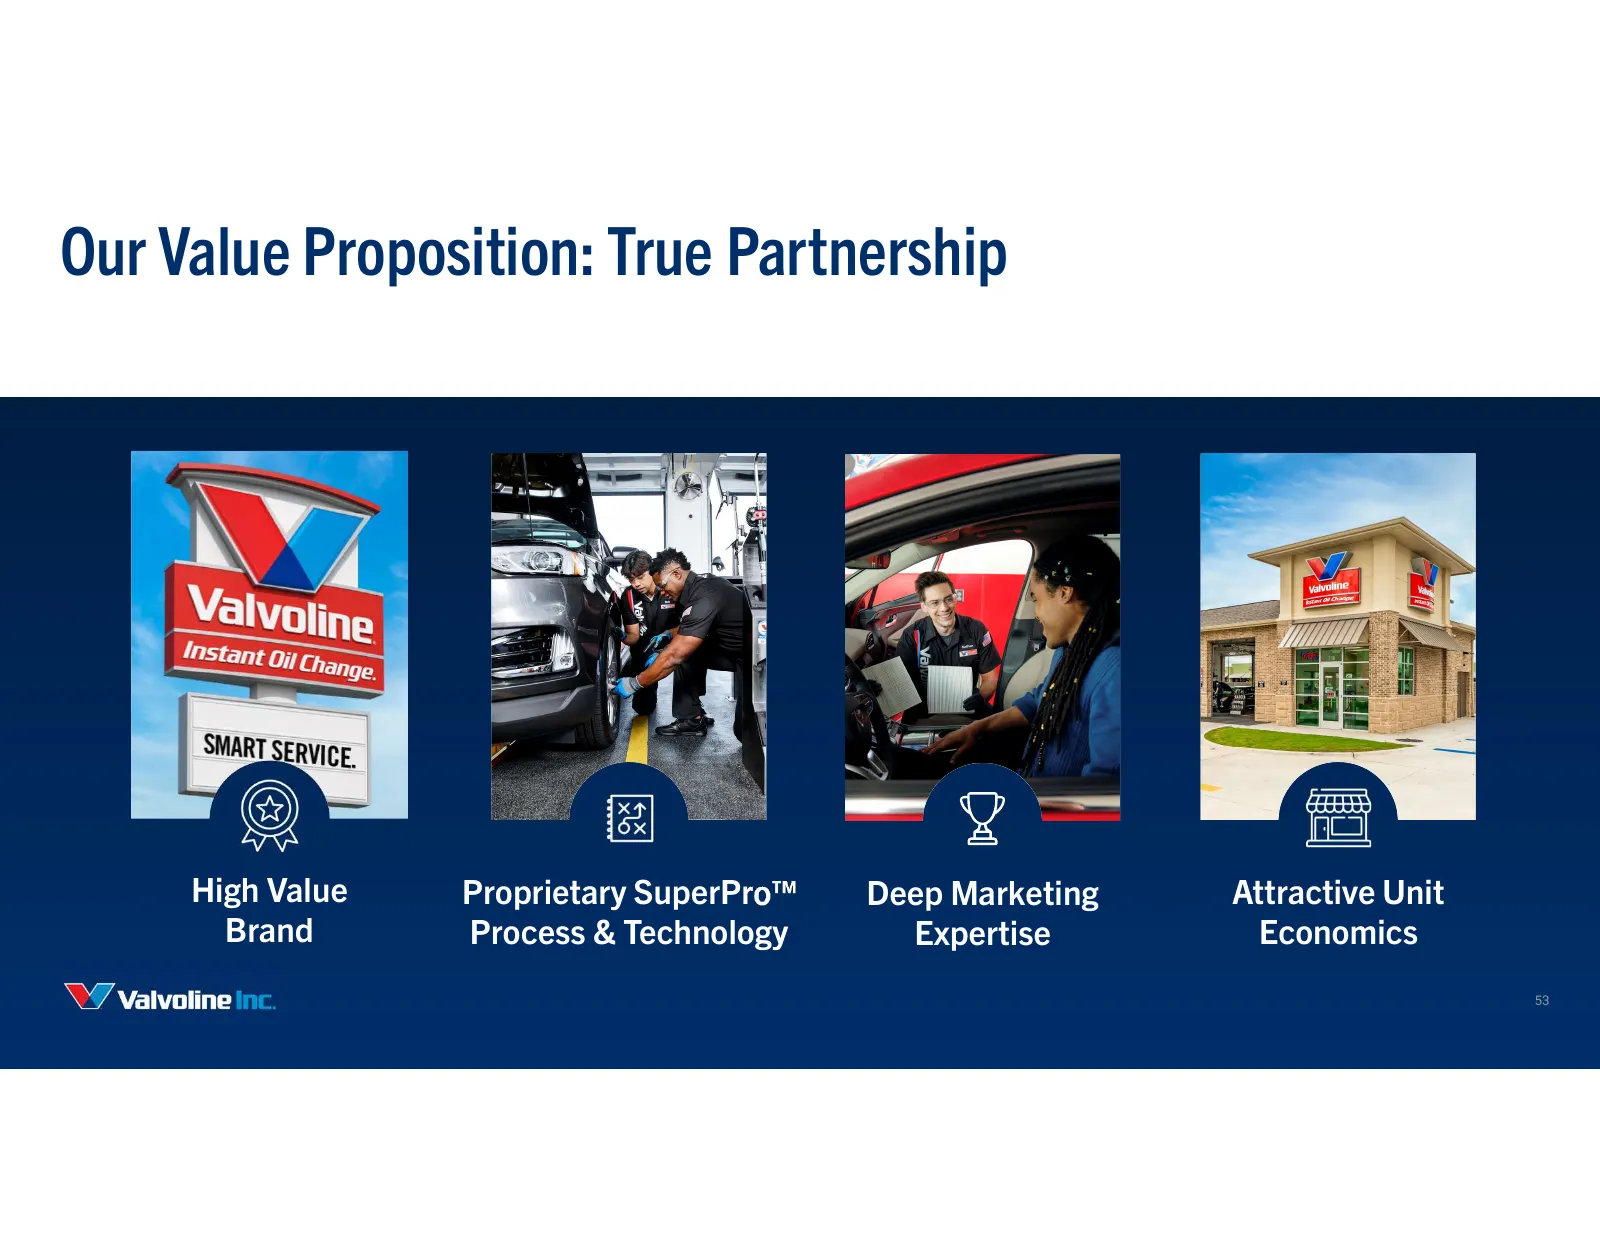
Our Value Proposition: True Partnership High Value Proprietary SuperPro Deep Marketing Attractive Unit Brand Process & Technology Expertise Economics 53
Slide 54: Franchisor of Choice Delivering Best-in-Class Results
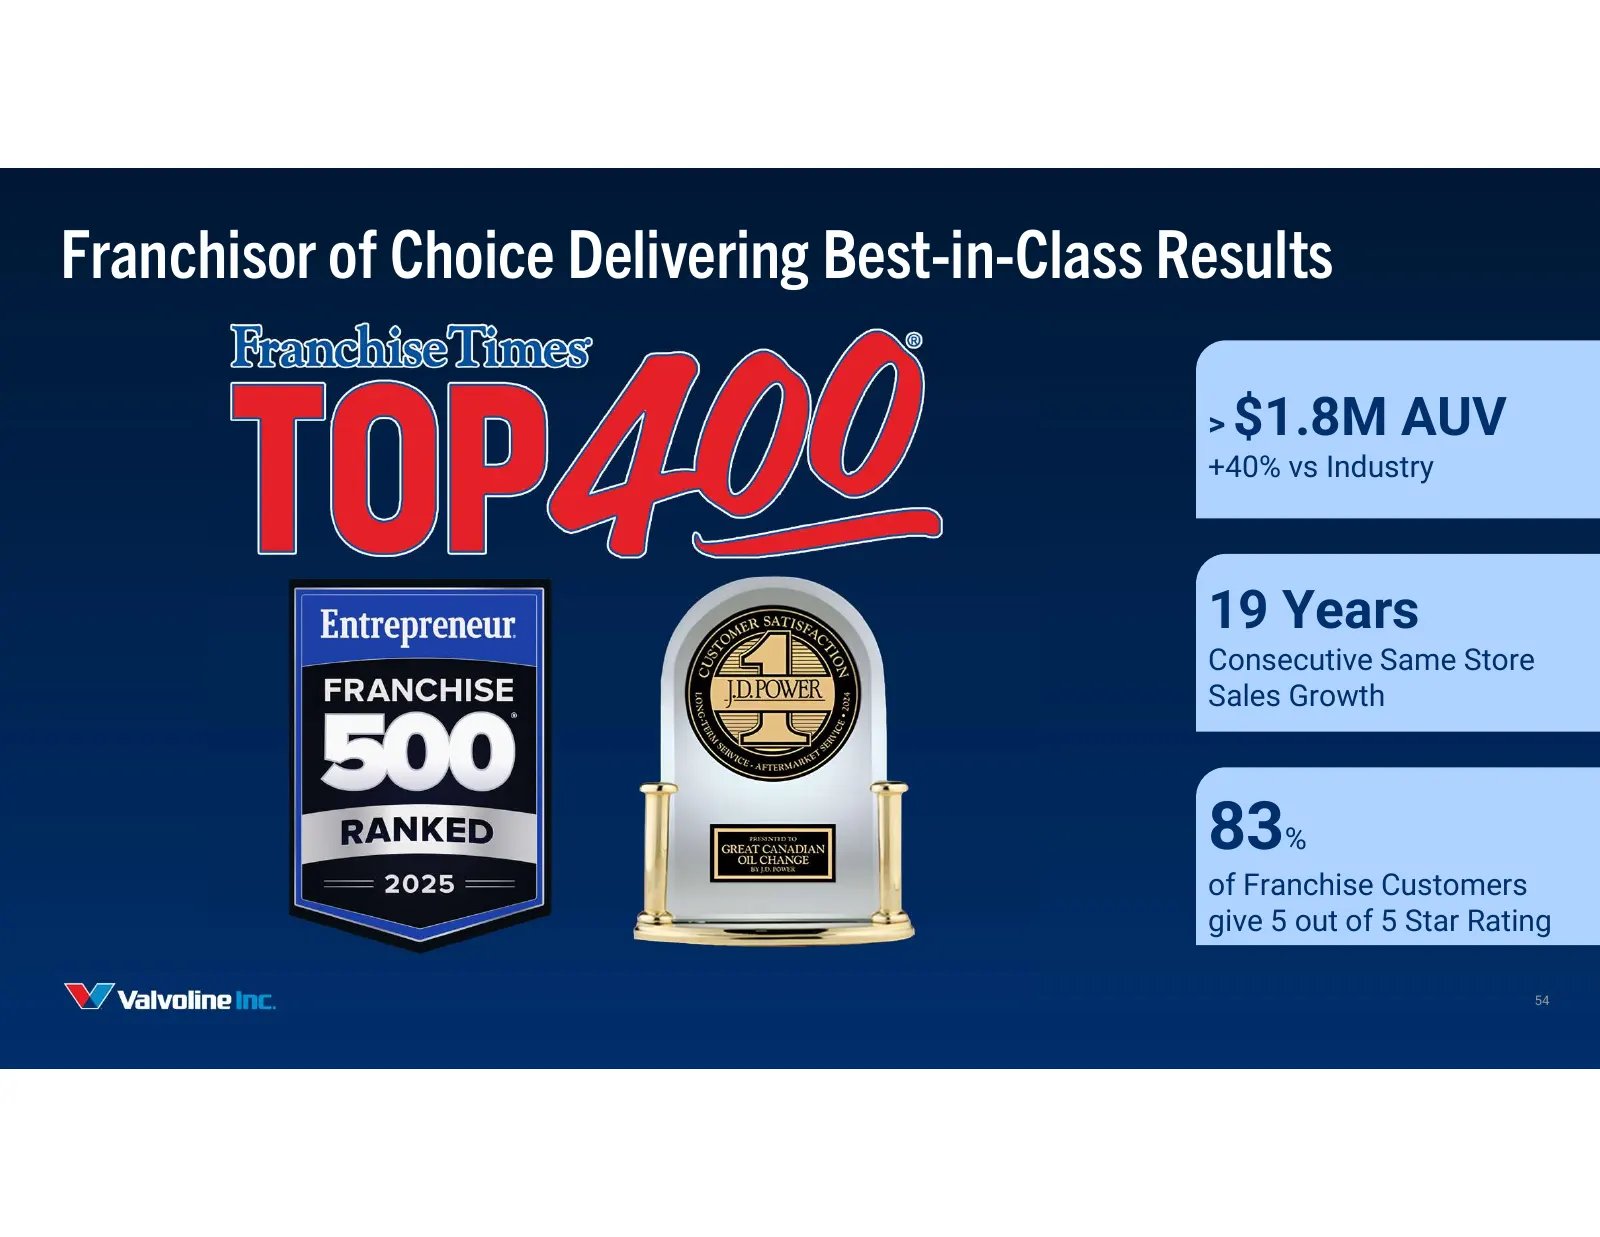
Franchisor of Choice Delivering Best-in-Class Results > $1.8M AUV +40% vs Industry 19 Years Consecutive Same Store Sales Growth 83% of Franchise Customers give 5 out of 5 Star Rating 54
Slide 55: Established Partner Profile
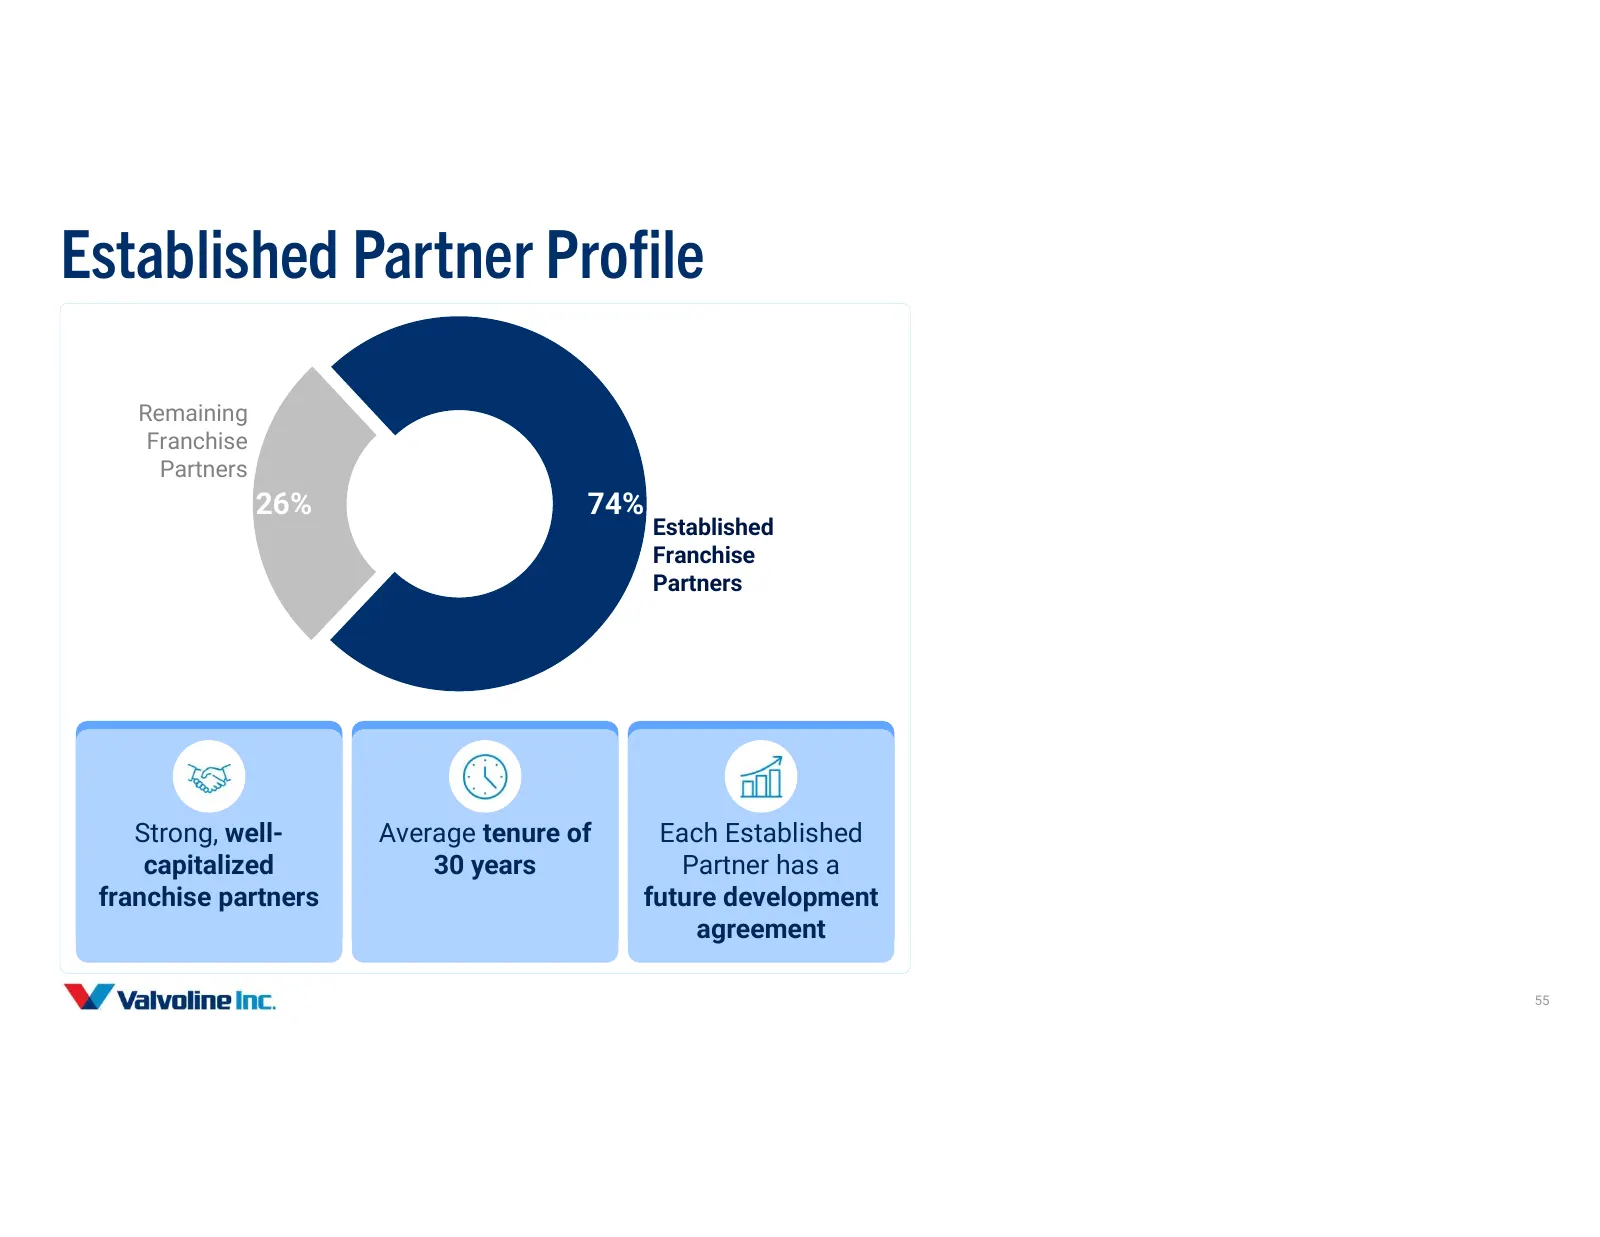
Established Partner Profile Remaining Franchise Partners 26% 74% Established Franchise Partners Strong, well- Average tenure of Each Established capitalized 30 years Partner has a franchise partners future development agreement 55
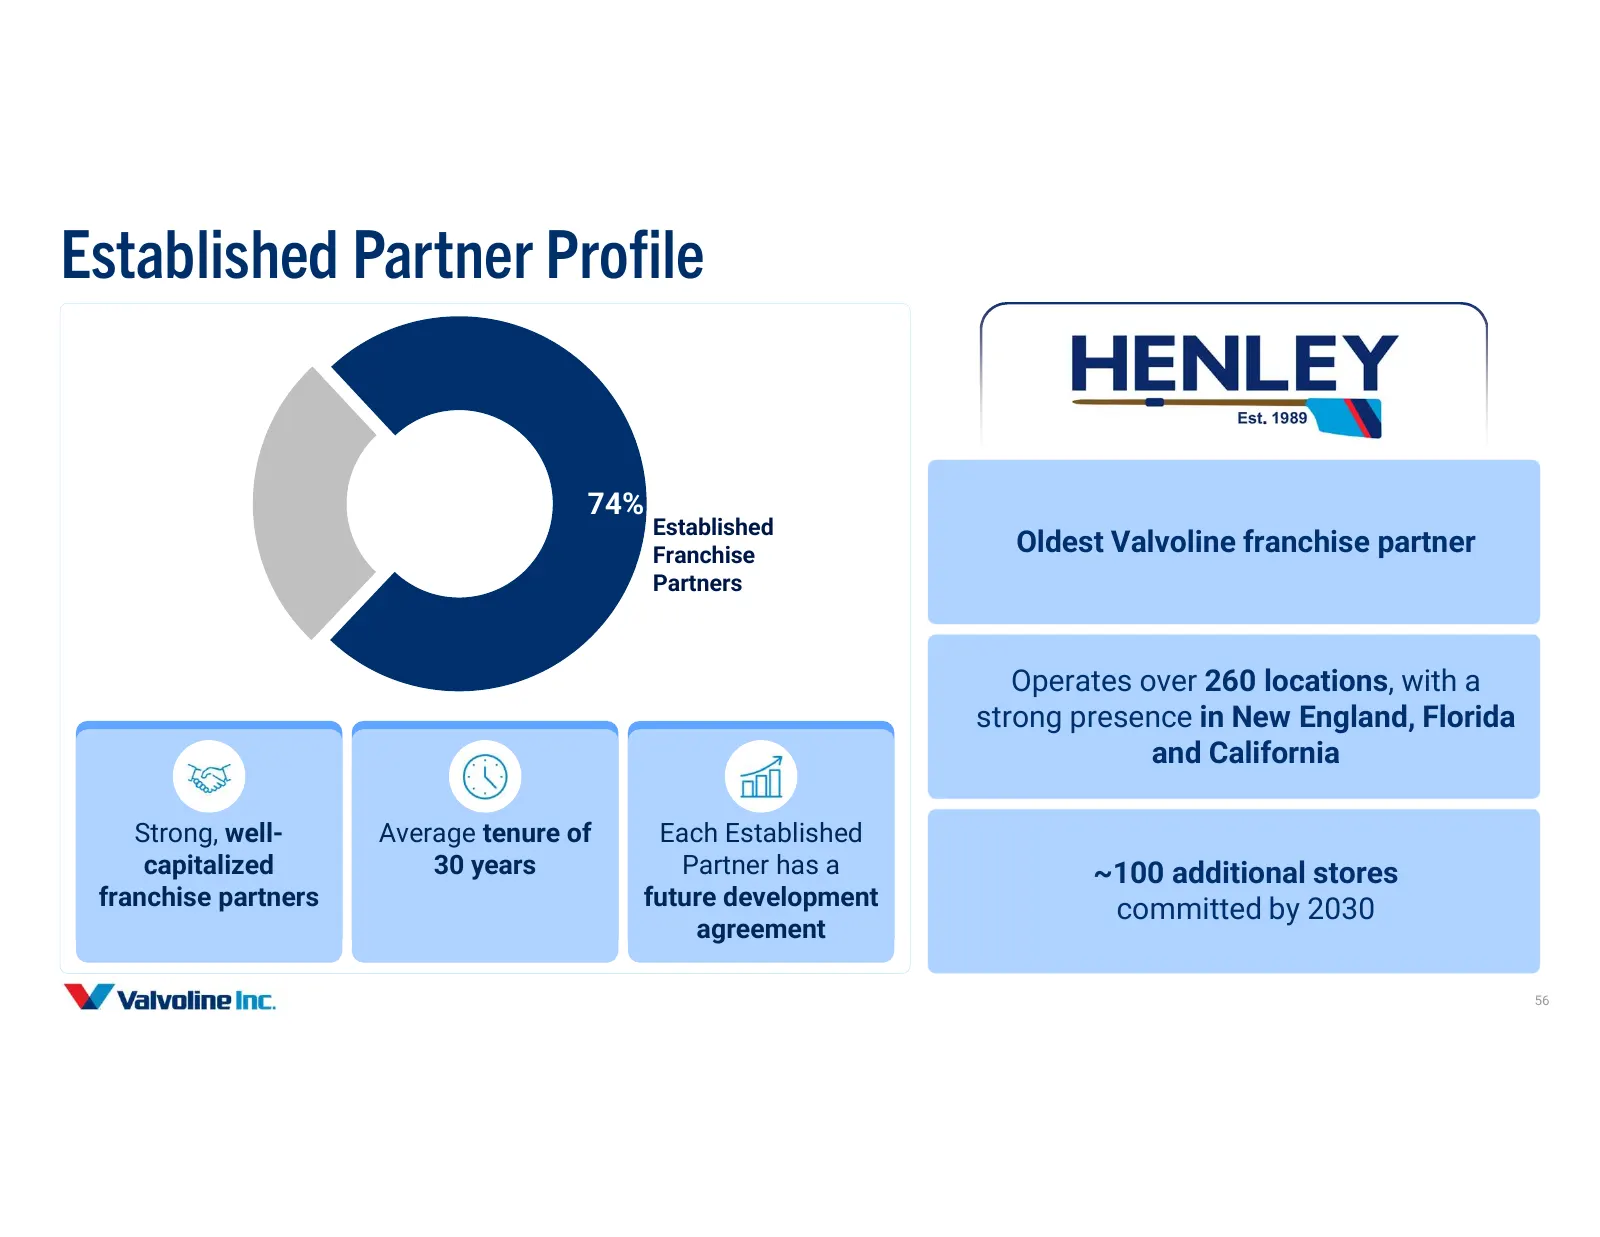
Slide 56: Established Partner Profile
Established Partner Profile Remaining Franchise Partners 74% Established Franchise Oldest Valvoline franchise partner Partners Operates over 260 locations, with a strong presence in New England, Florida and California Strong, well- Average tenure of Each Established capitalized 30 years Partner has
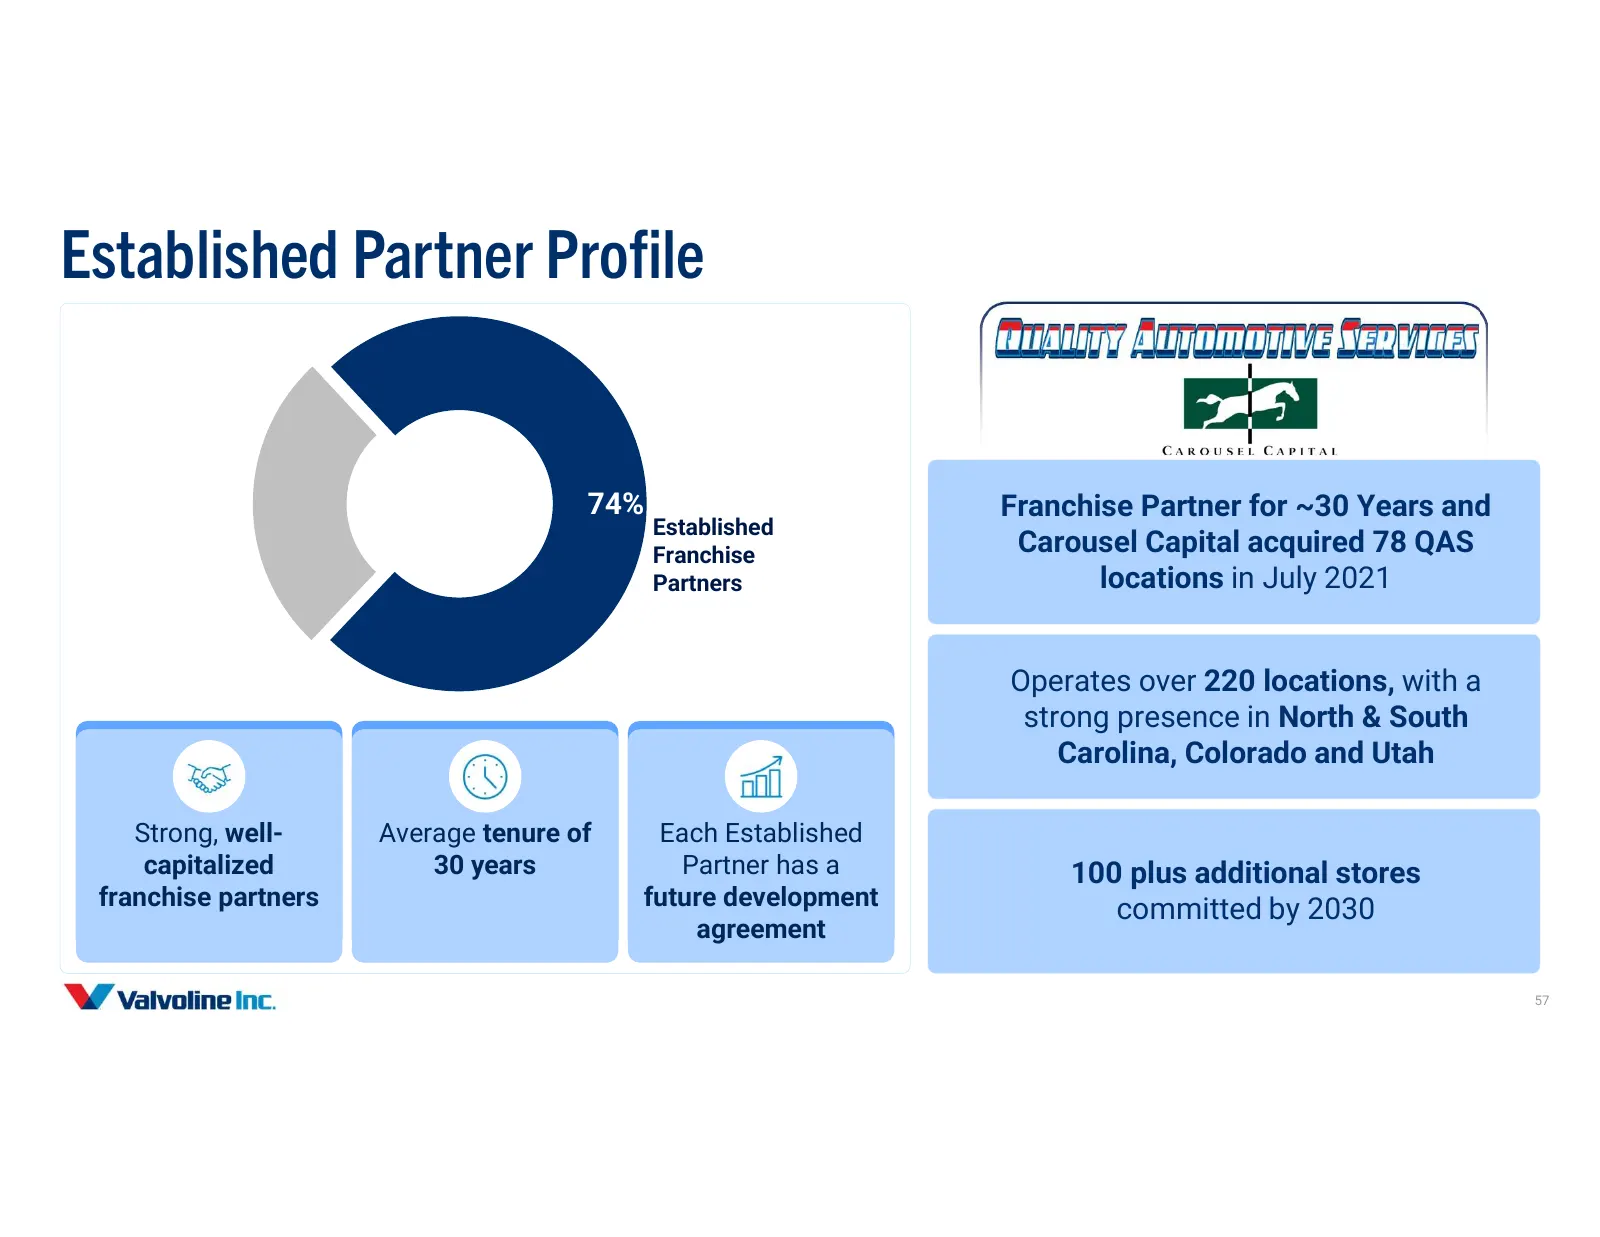
Slide 57: Established Partner Profile
Established Partner Profile Remaining Franchise Partners 74% Franchise Partner for ~30 Years and Established Franchise Carousel Capital acquired 78 QAS Partners locations in July 2021 Operates over 220 locations, with a strong presence in North & South Carolina, Colorado and Utah Strong, well- Avera
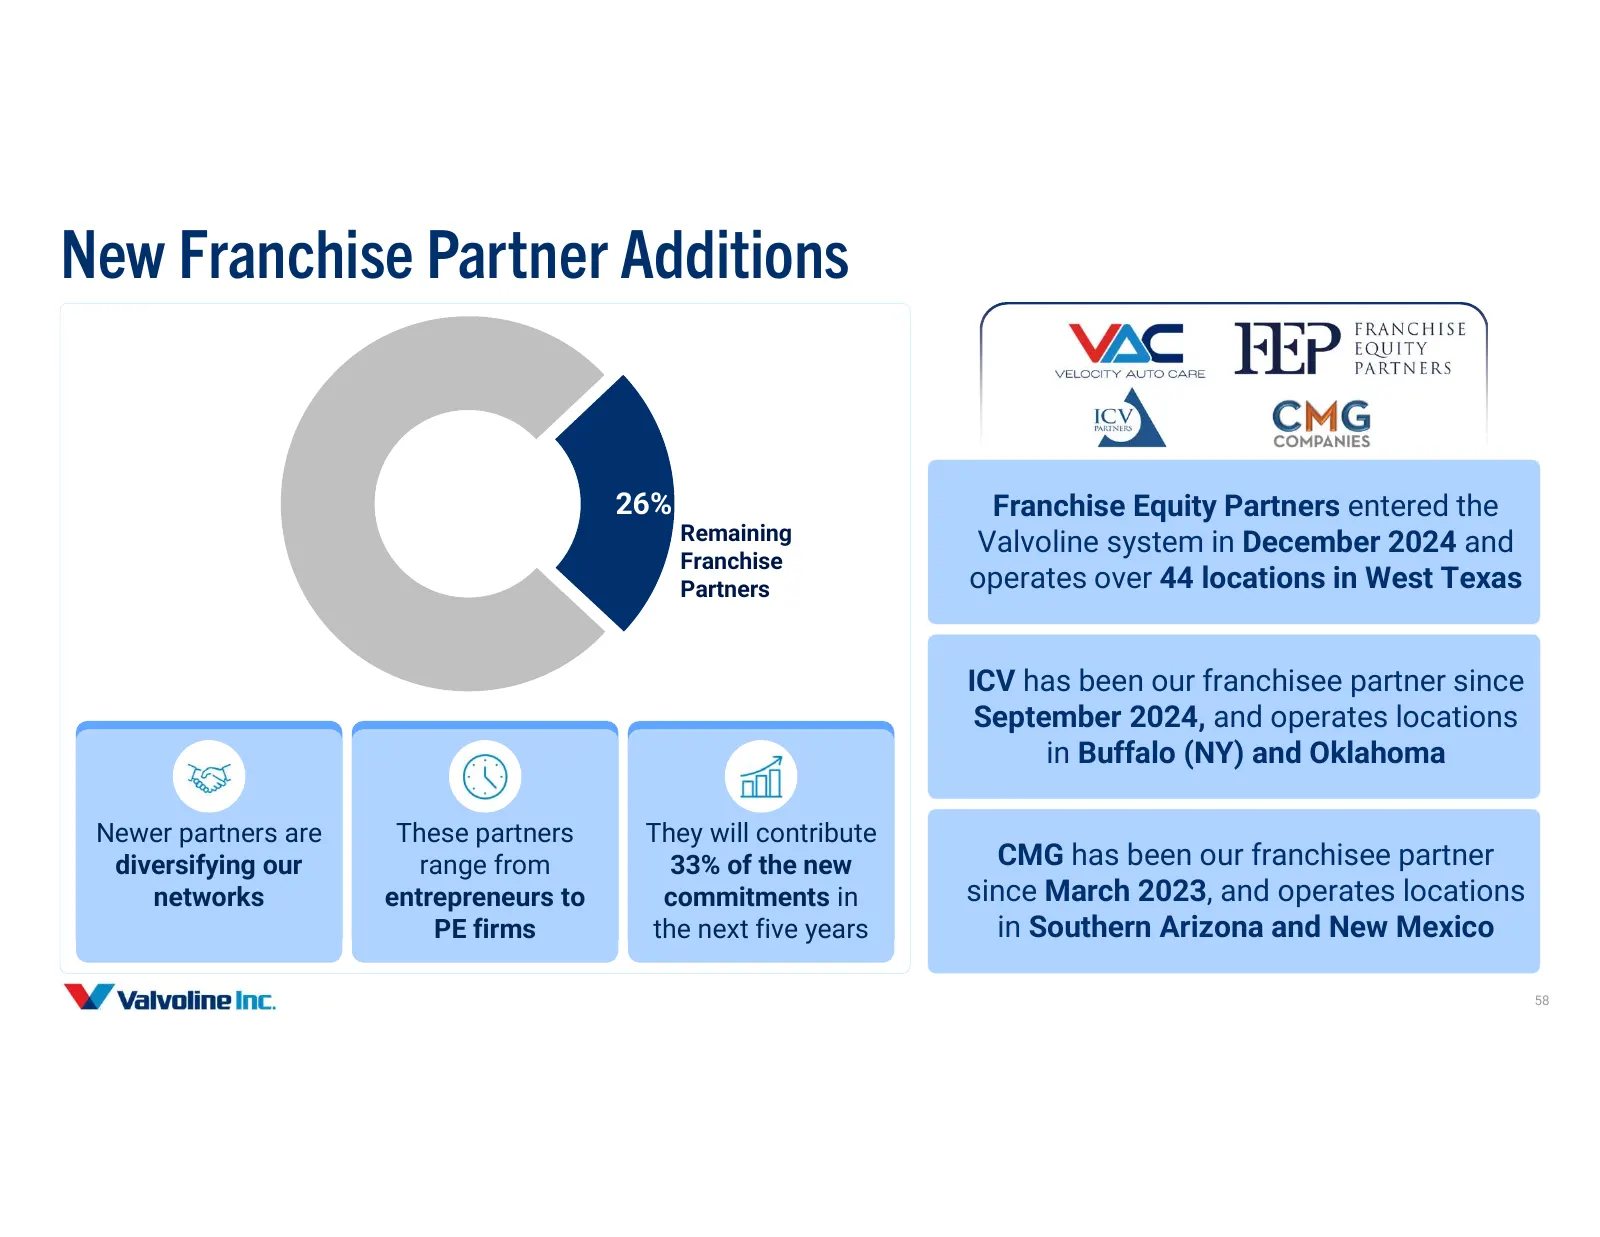
Slide 58: New Franchise Partner Additions
New Franchise Partner Additions Established Franchise Partners 26% Franchise Equity Partners entered the Remaining Valvoline system in December 2024 and Franchise Partners operates over 44 locations in West Texas ICV has been our franchisee partner since September 2024, and operates locations in Buf
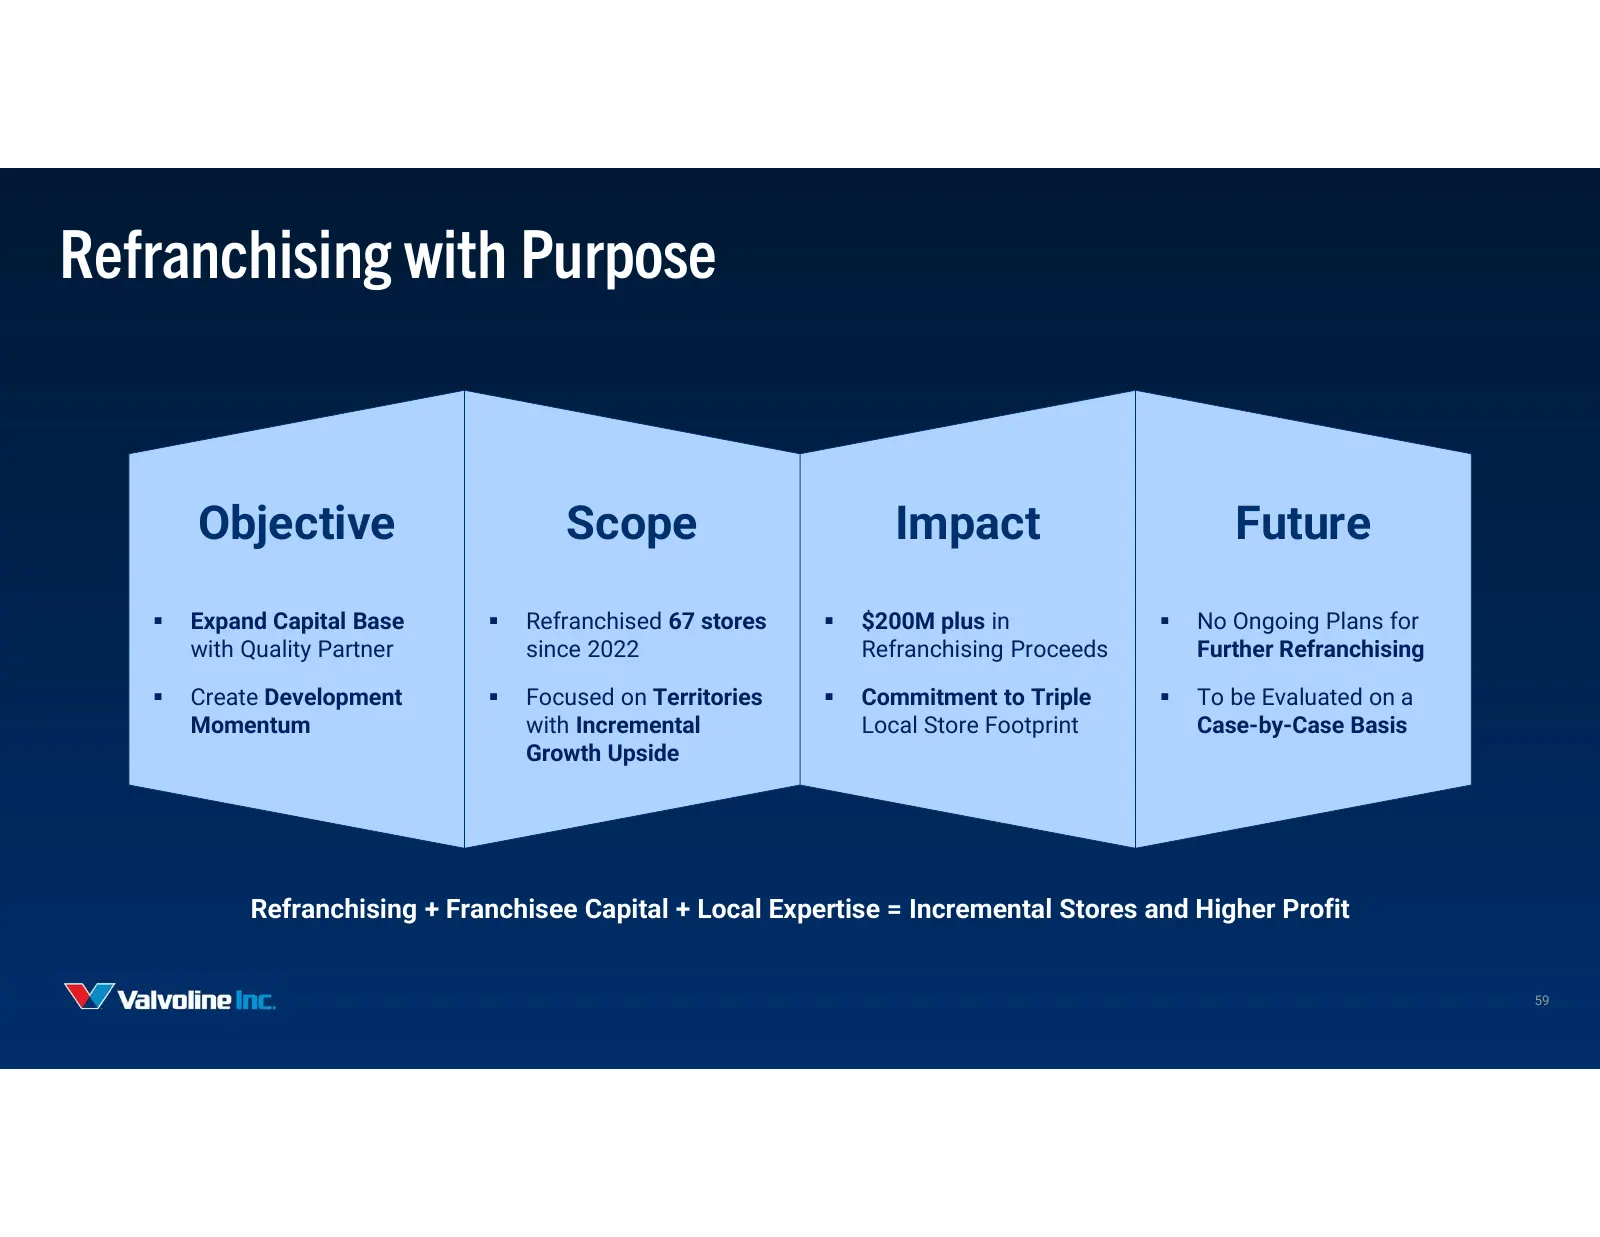
Slide 59: Refranchising with Purpose
Refranchising with Purpose Objective Scope Impact Future Expand Capital Base Refranchised 67 stores $200M plus in No Ongoing Plans for with Quality Partner since 2022 Refranchising Proceeds Further Refranchising Create Development Focused on Territories Commitment to Triple To be Eva
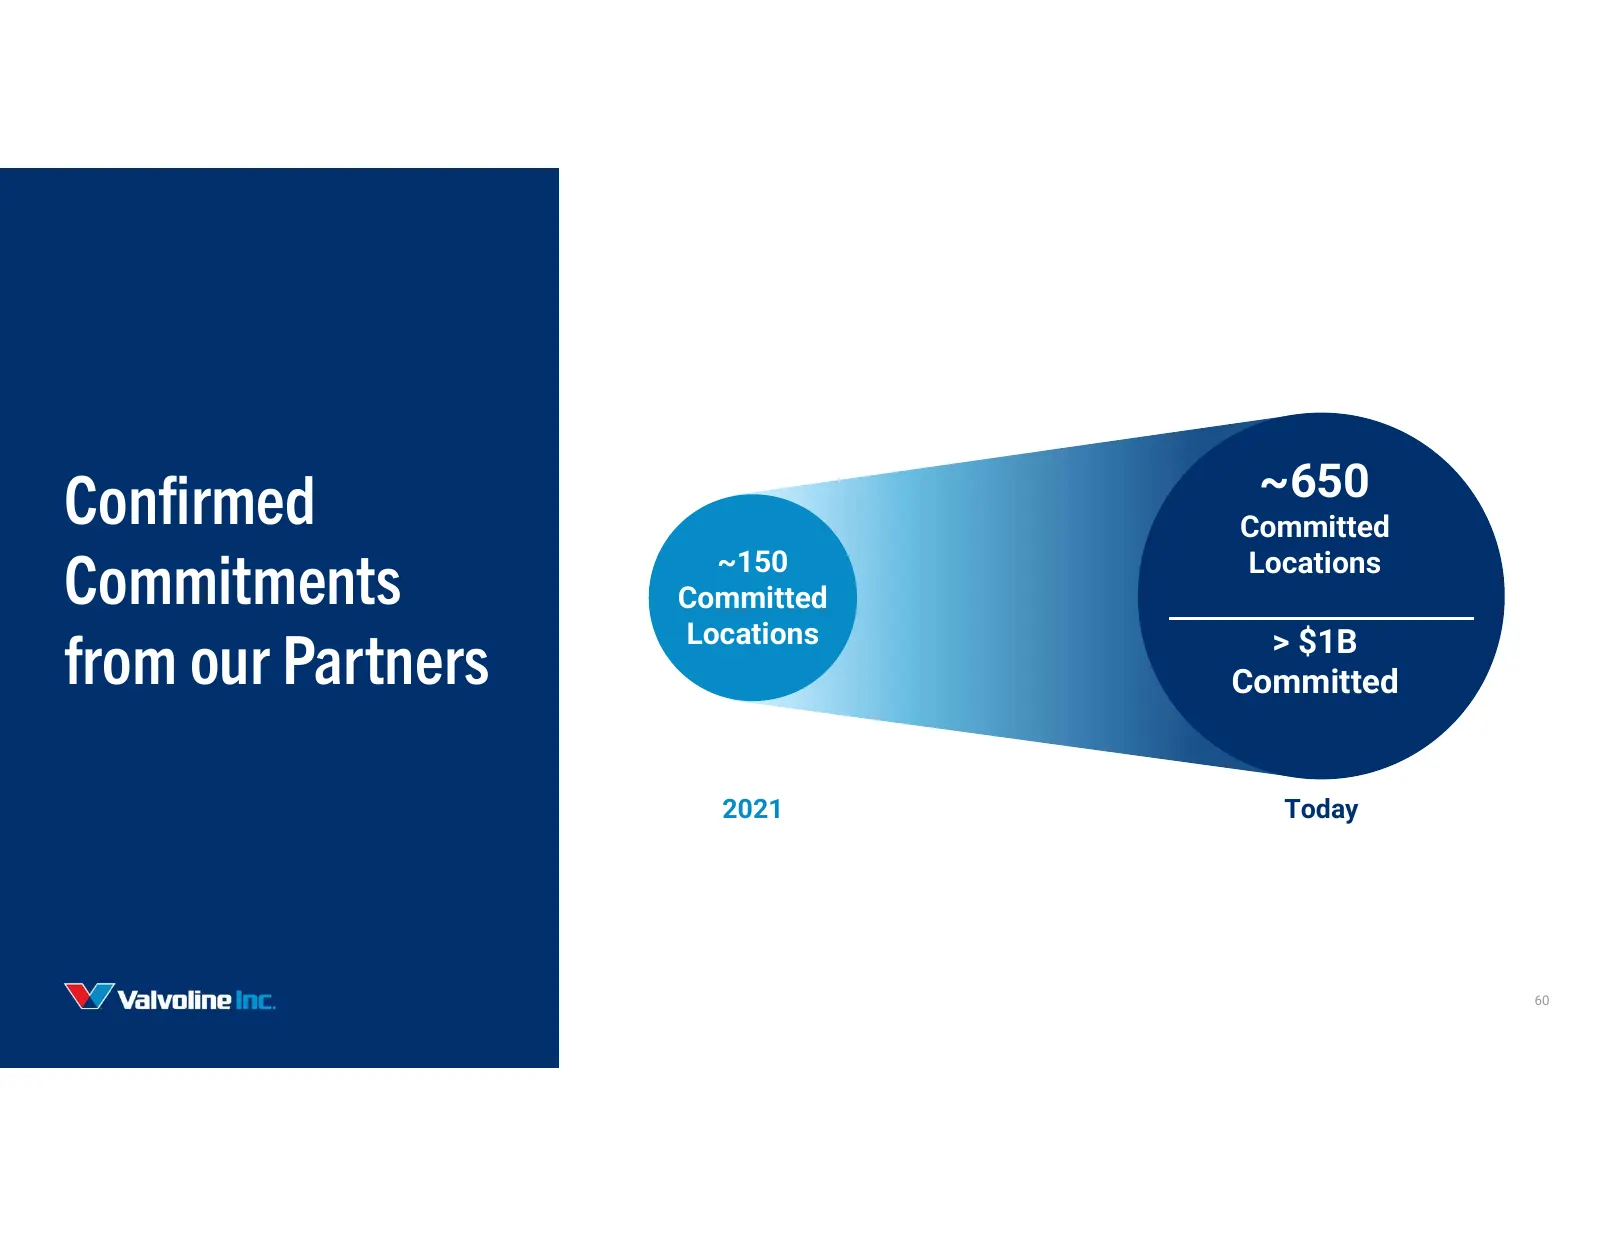
Slide 60: Confirmed Commitments from our Partners
~650 Confirmed Committed Commitments ~150 Committed Locations Locations from our Partners > $1B Committed 2021 Today 60
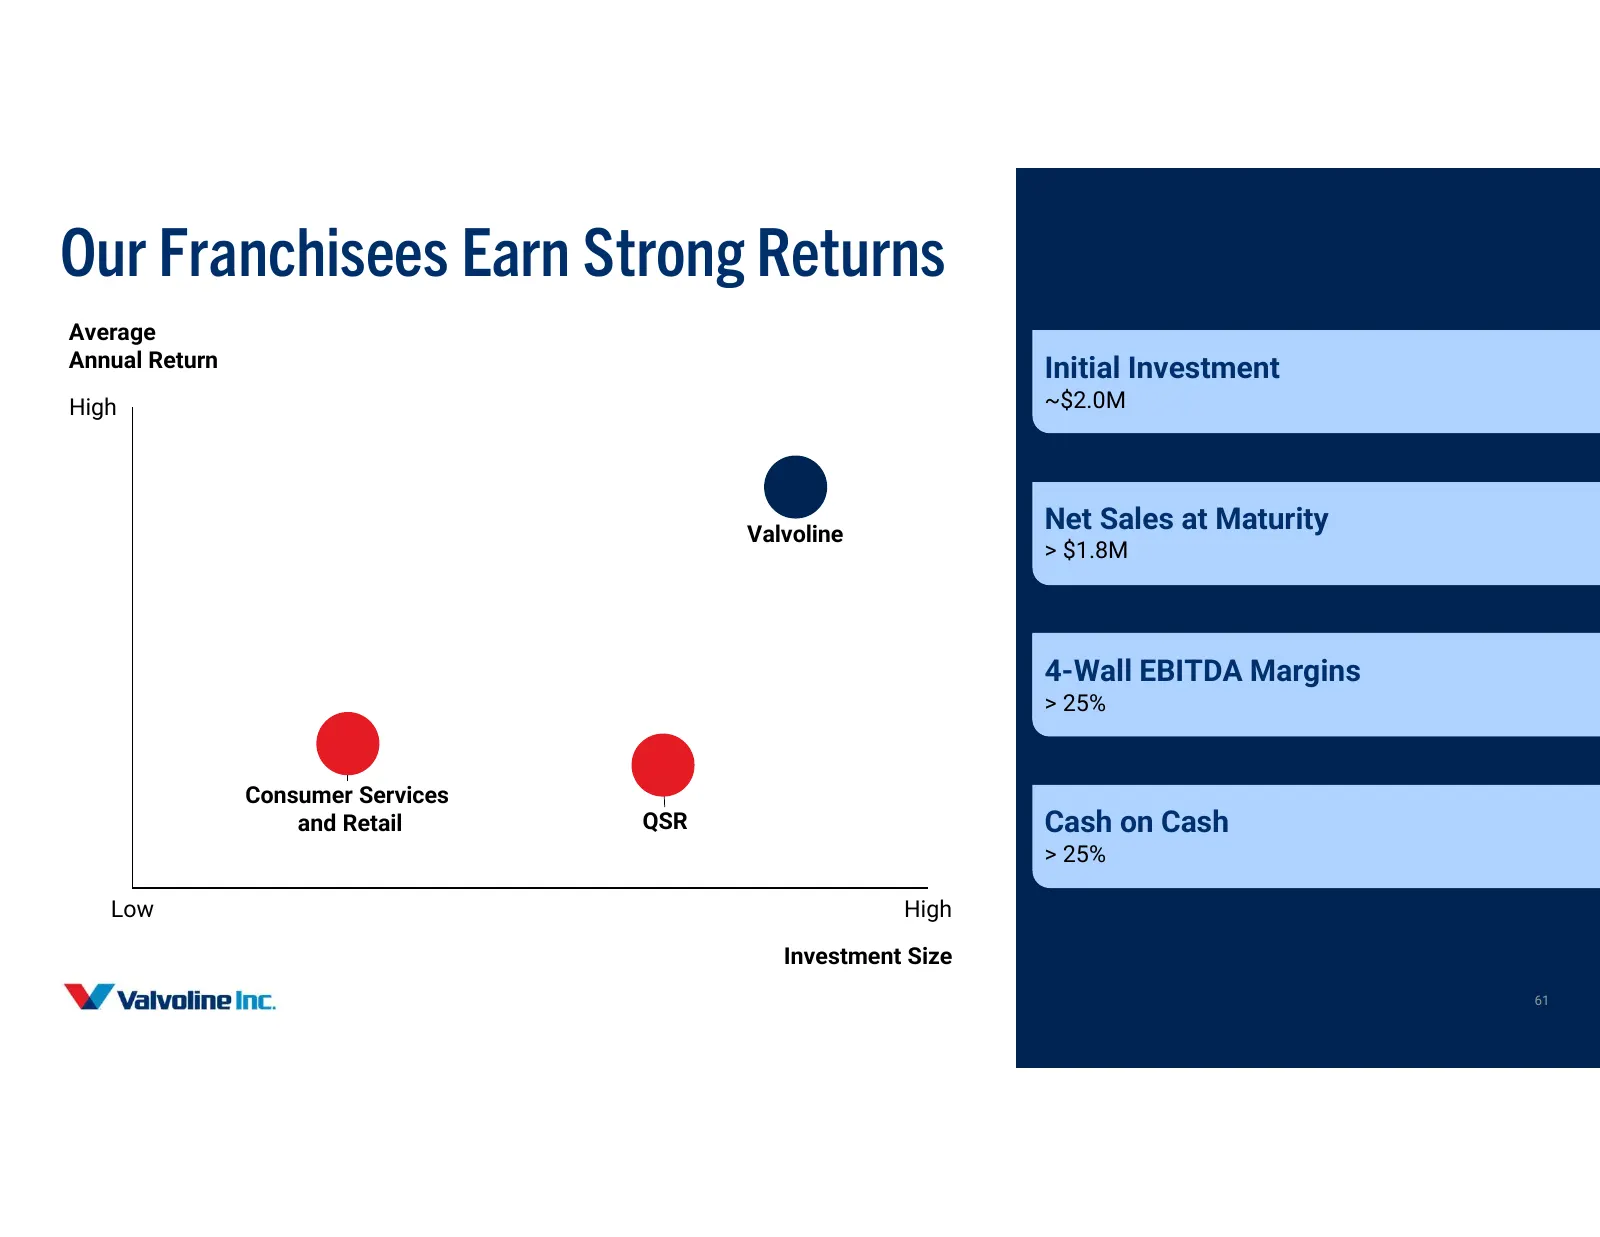
Slide 61: Our Franchisees Earn Strong Returns
Our Franchisees Earn Strong Returns Average Annual Return Initial Investment High ~$2.0M Valvoline Net Sales at Maturity > $1.8M 4-Wall EBITDA Margins > 25% Consumer Services and Retail QSR Cash on Cash > 25% Low High Investment Size 61
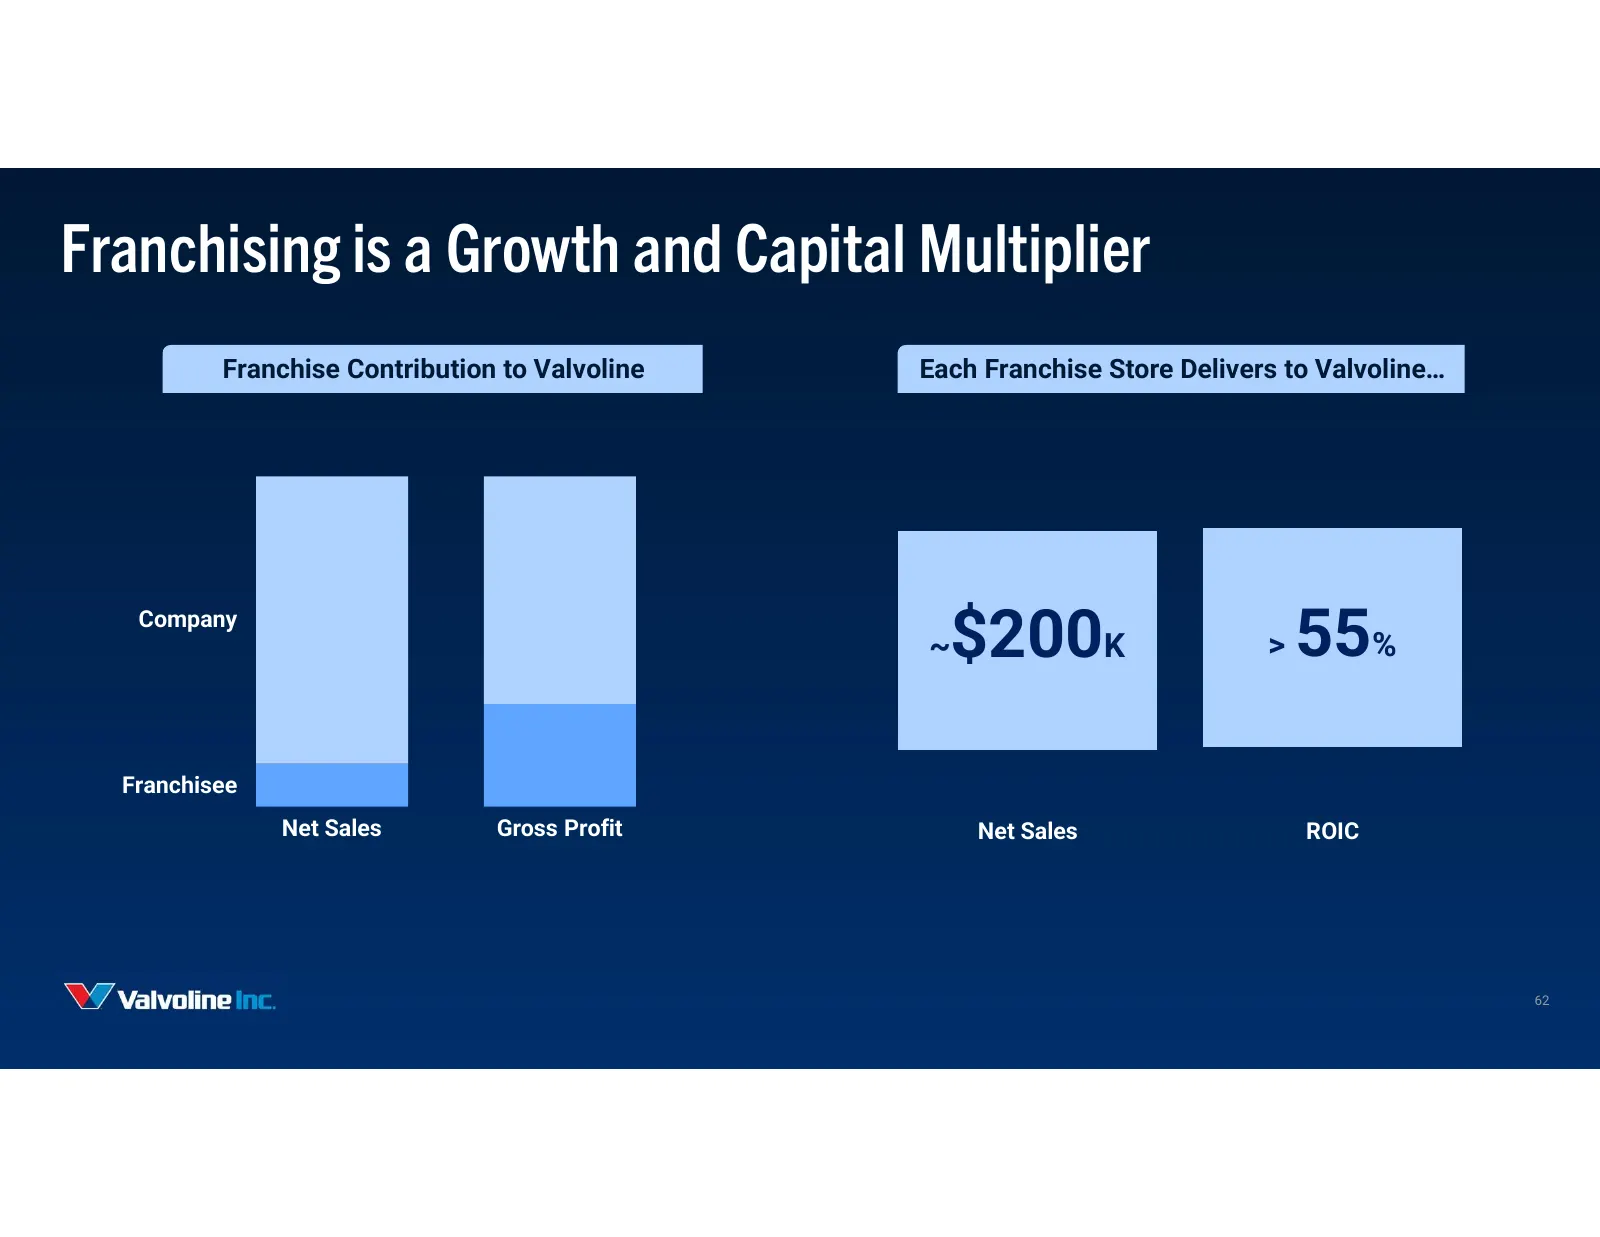
Slide 62: Franchising is a Growth and Capital Multiplier
Franchising is a Growth and Capital Multiplier Franchise Contribution to Valvoline Each Franchise Store Delivers to Valvoline… Company ~ $200K > 55% Franchisee Net Sales Gross Profit Net Sales ROIC 62
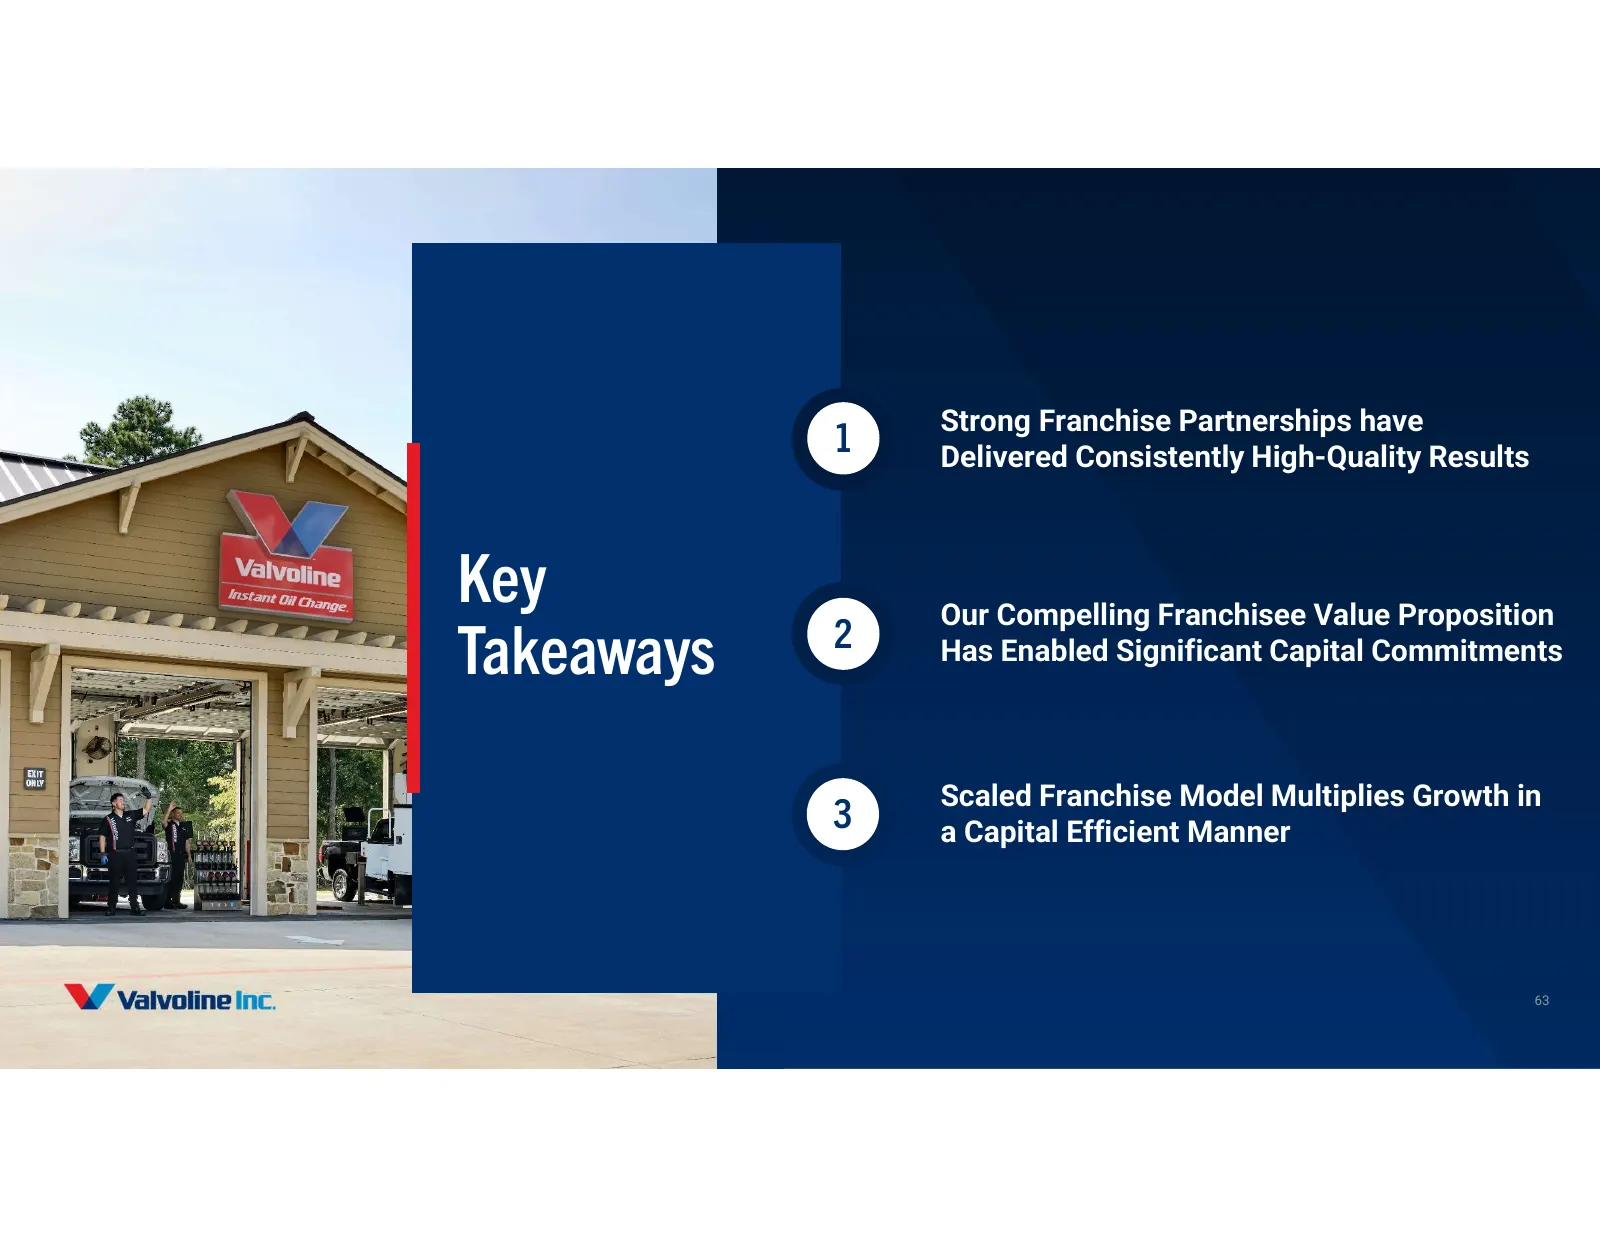
Slide 63: Key Takeaways
Strong Franchise Partnerships have 1 Delivered Consistently High-Quality Results Key Our Compelling Franchisee Value Proposition 2 Takeaways Has Enabled Significant Capital Commitments Scaled Franchise Model Multiplies Growth in 3 a Capital Efficient Manner 63
Slide 64: Clear Roadmap to Accelerating Growth and Driving Performance
Clear Roadmap to Accelerating Growth and Driving Performance Kevin Willis, Chief Financial Officer 64
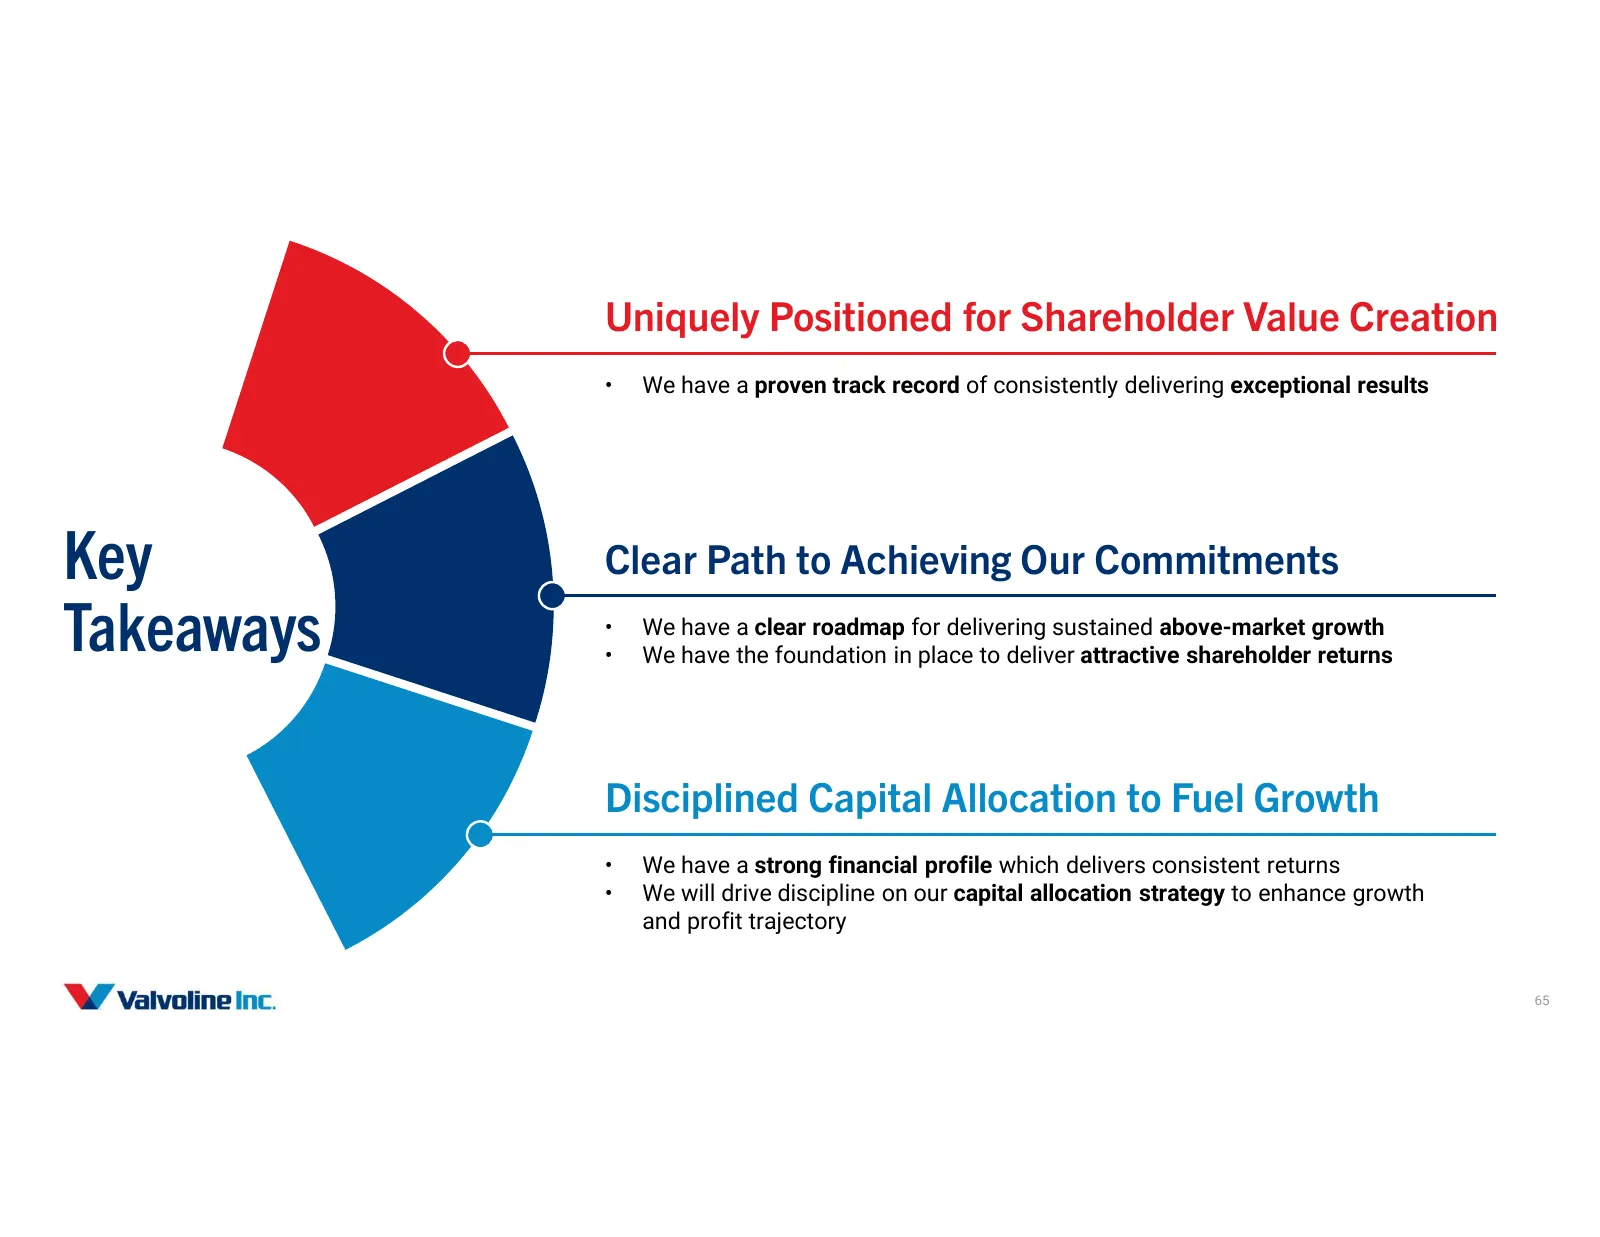
Slide 65: Key Takeaways
Uniquely Positioned for Shareholder Value Creation • We have a proven track record of consistently delivering exceptional results Key Clear Path to Achieving Our Commitments Takeaways • • We have a clear roadmap for delivering sustained above-market growth We have the foundation in place to deliver
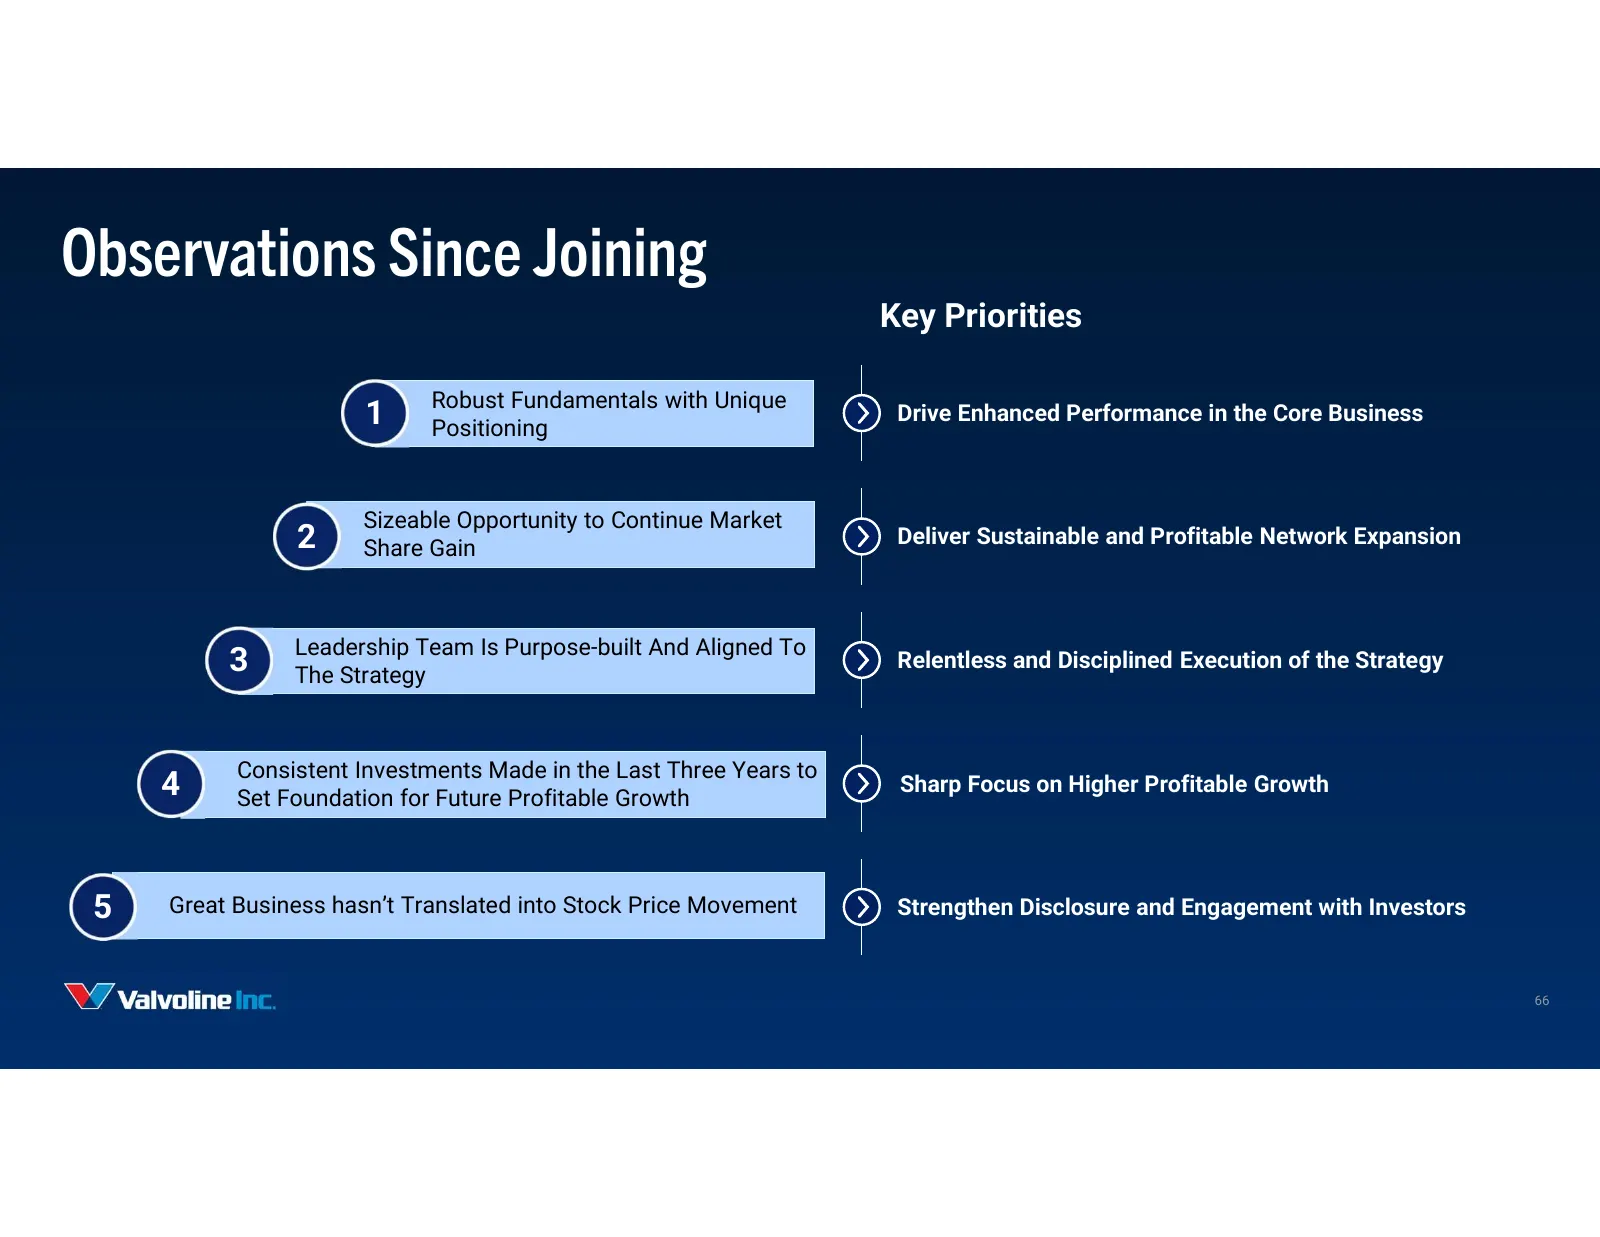
Slide 66: Observations Since Joining
Observations Since Joining Key Priorities Robust Fundamentals with Unique 1 Positioning Drive Enhanced Performance in the Core Business Sizeable Opportunity to Continue Market 2 Share Gain Deliver Sustainable and Profitable Network Expansion Leadership Team Is Purpose-built And Aligned To 3 The Stra
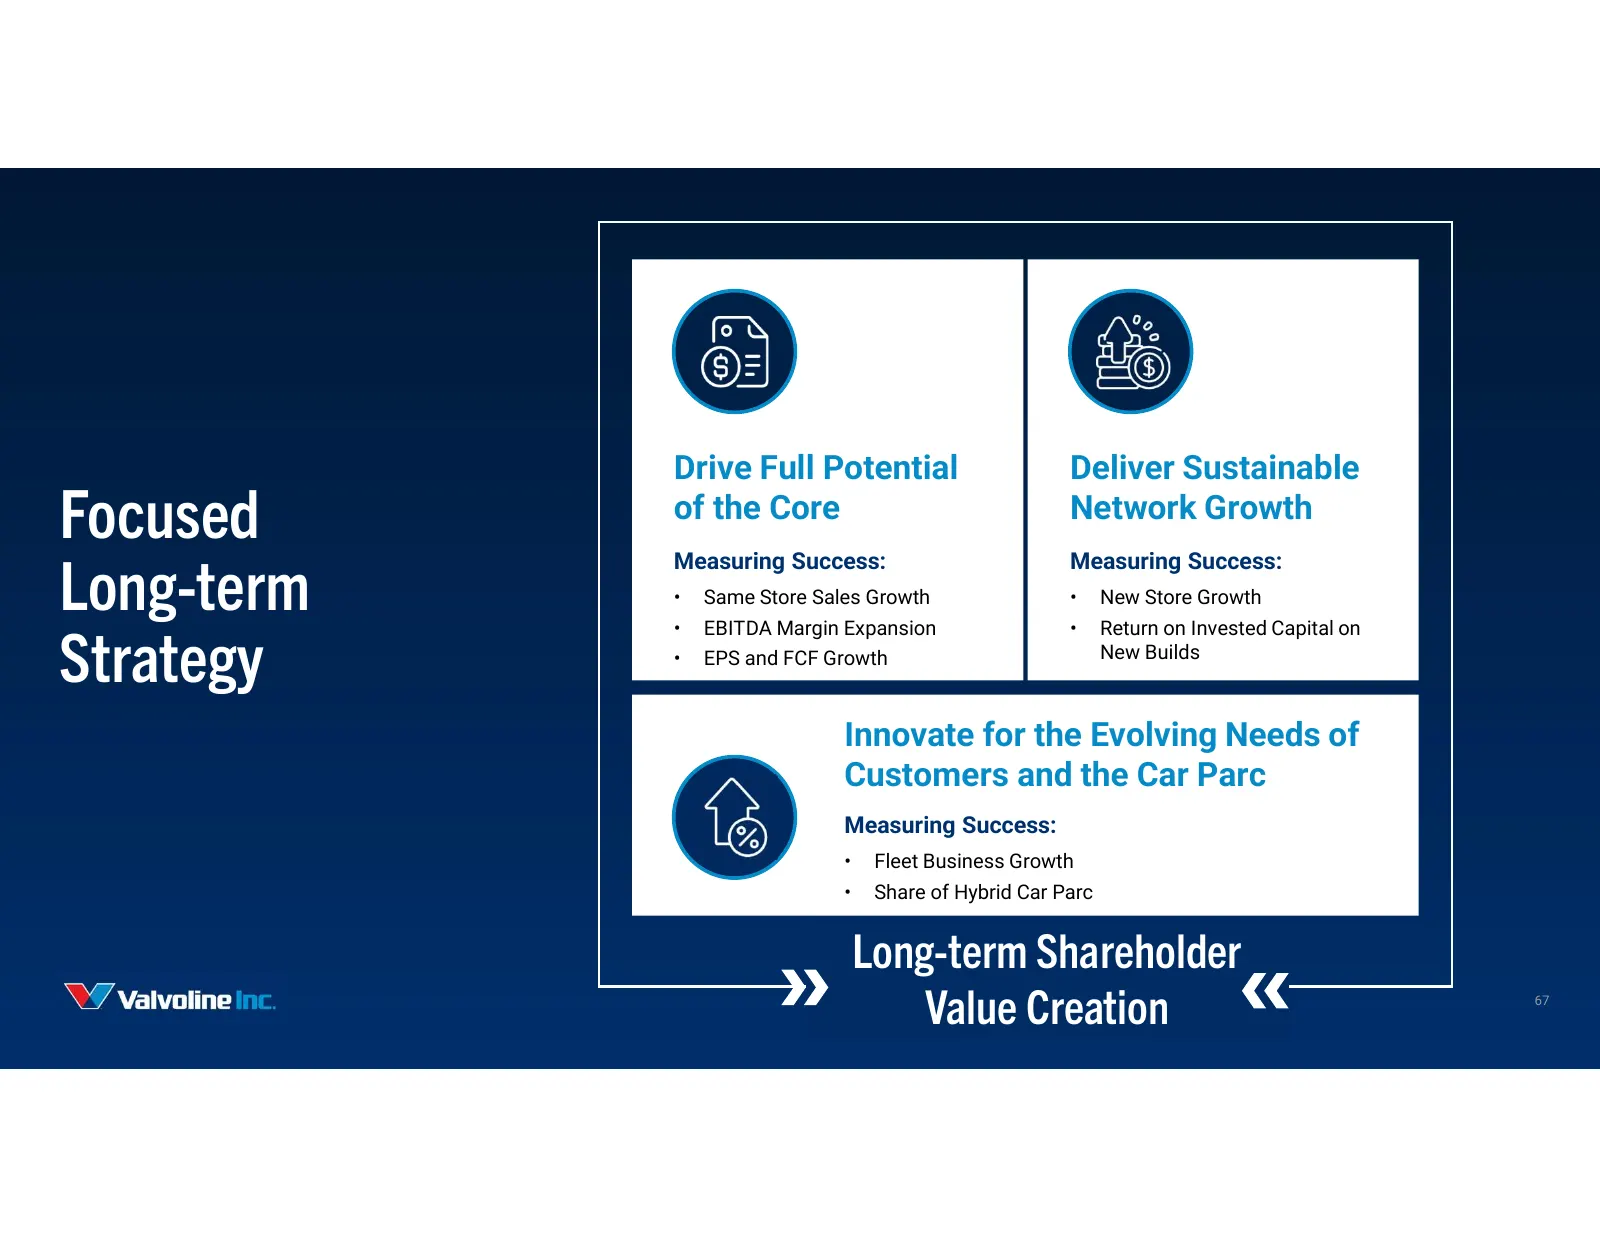
Slide 67: Focused Long-term Strategy
Drive Full Potential Deliver Sustainable Focused of the Core Network Growth Long-term Measuring Success: Measuring Success: • Same Store Sales Growth • New Store Growth • EBITDA Margin Expansion • Return on Invested Capital on Strategy • EPS and FCF Growth New Builds Innovate for the Evolving Needs
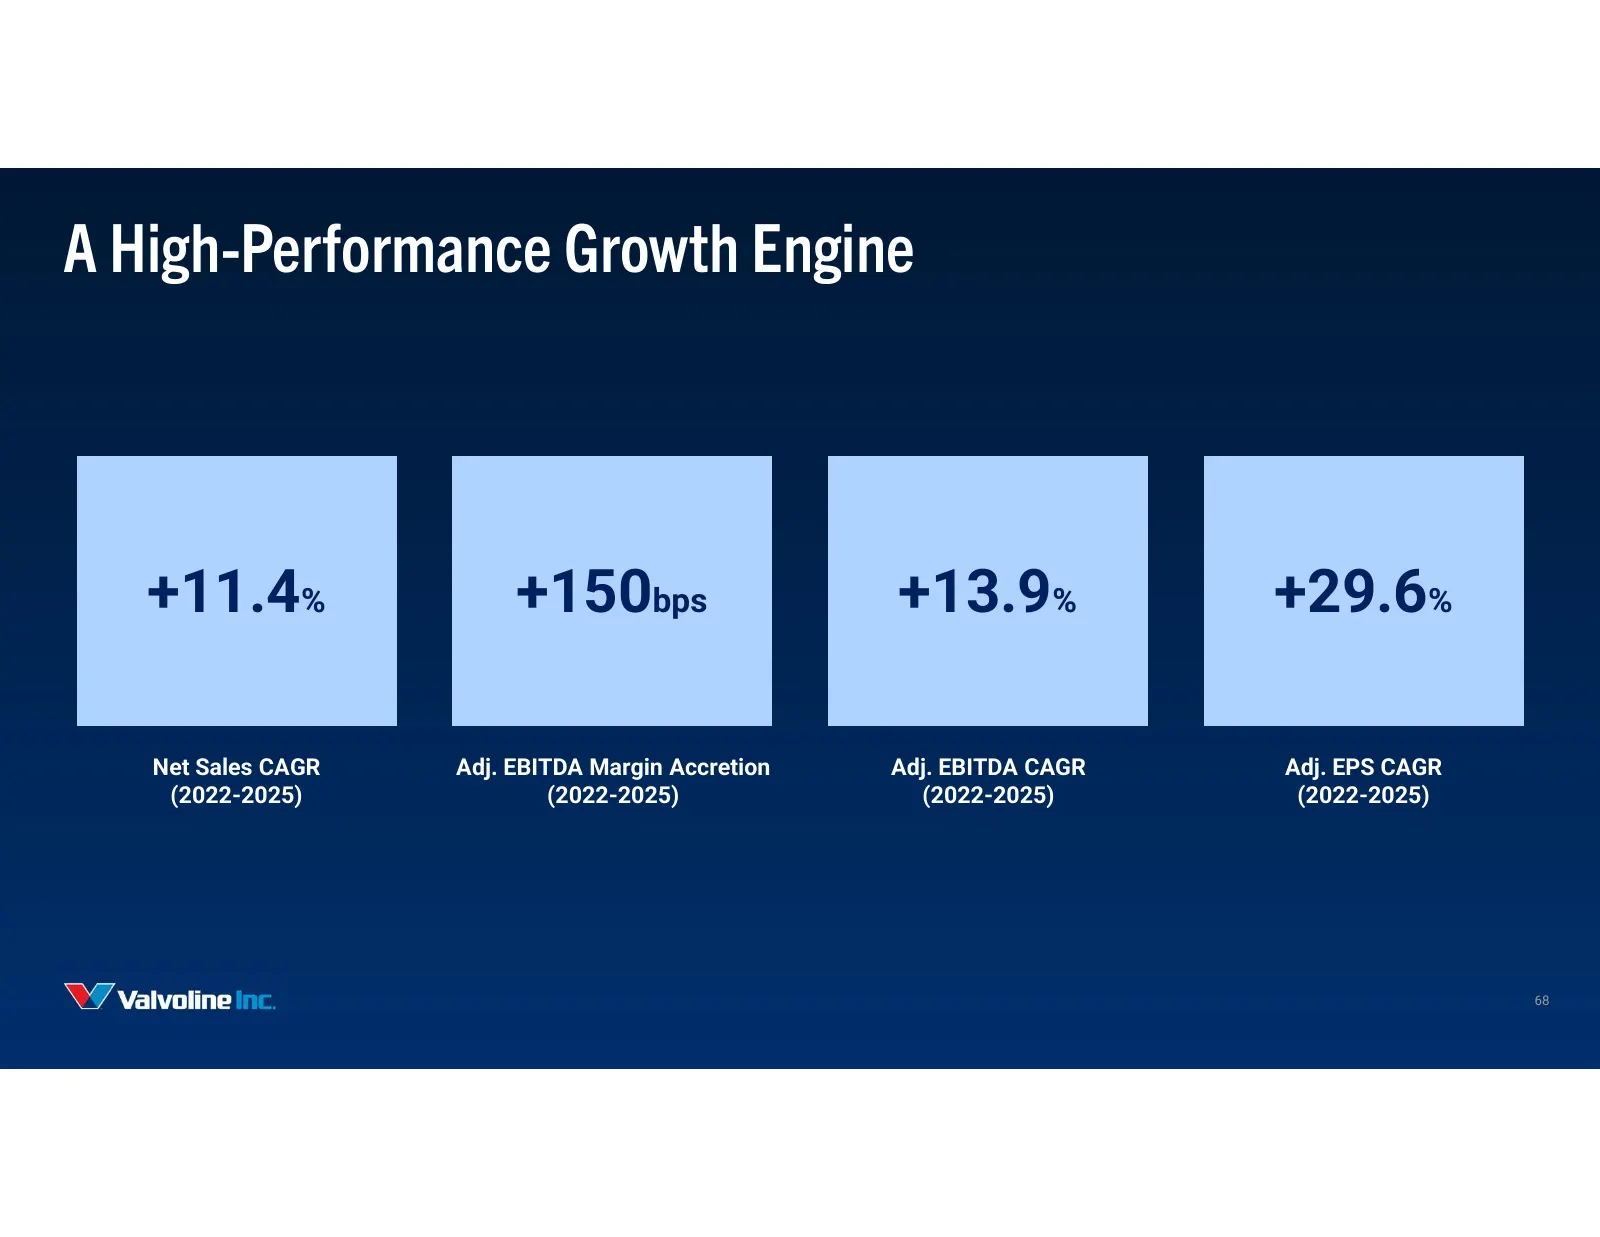
Slide 68: A High-Performance Growth Engine
A High-Performance Growth Engine +11.4% +150bps +13.9% +29.6% Net Sales CAGR Adj. EBITDA Margin Accretion Adj. EBITDA CAGR Adj. EPS CAGR (2022-2025) (2022-2025) (2022-2025) (2022-2025) 68
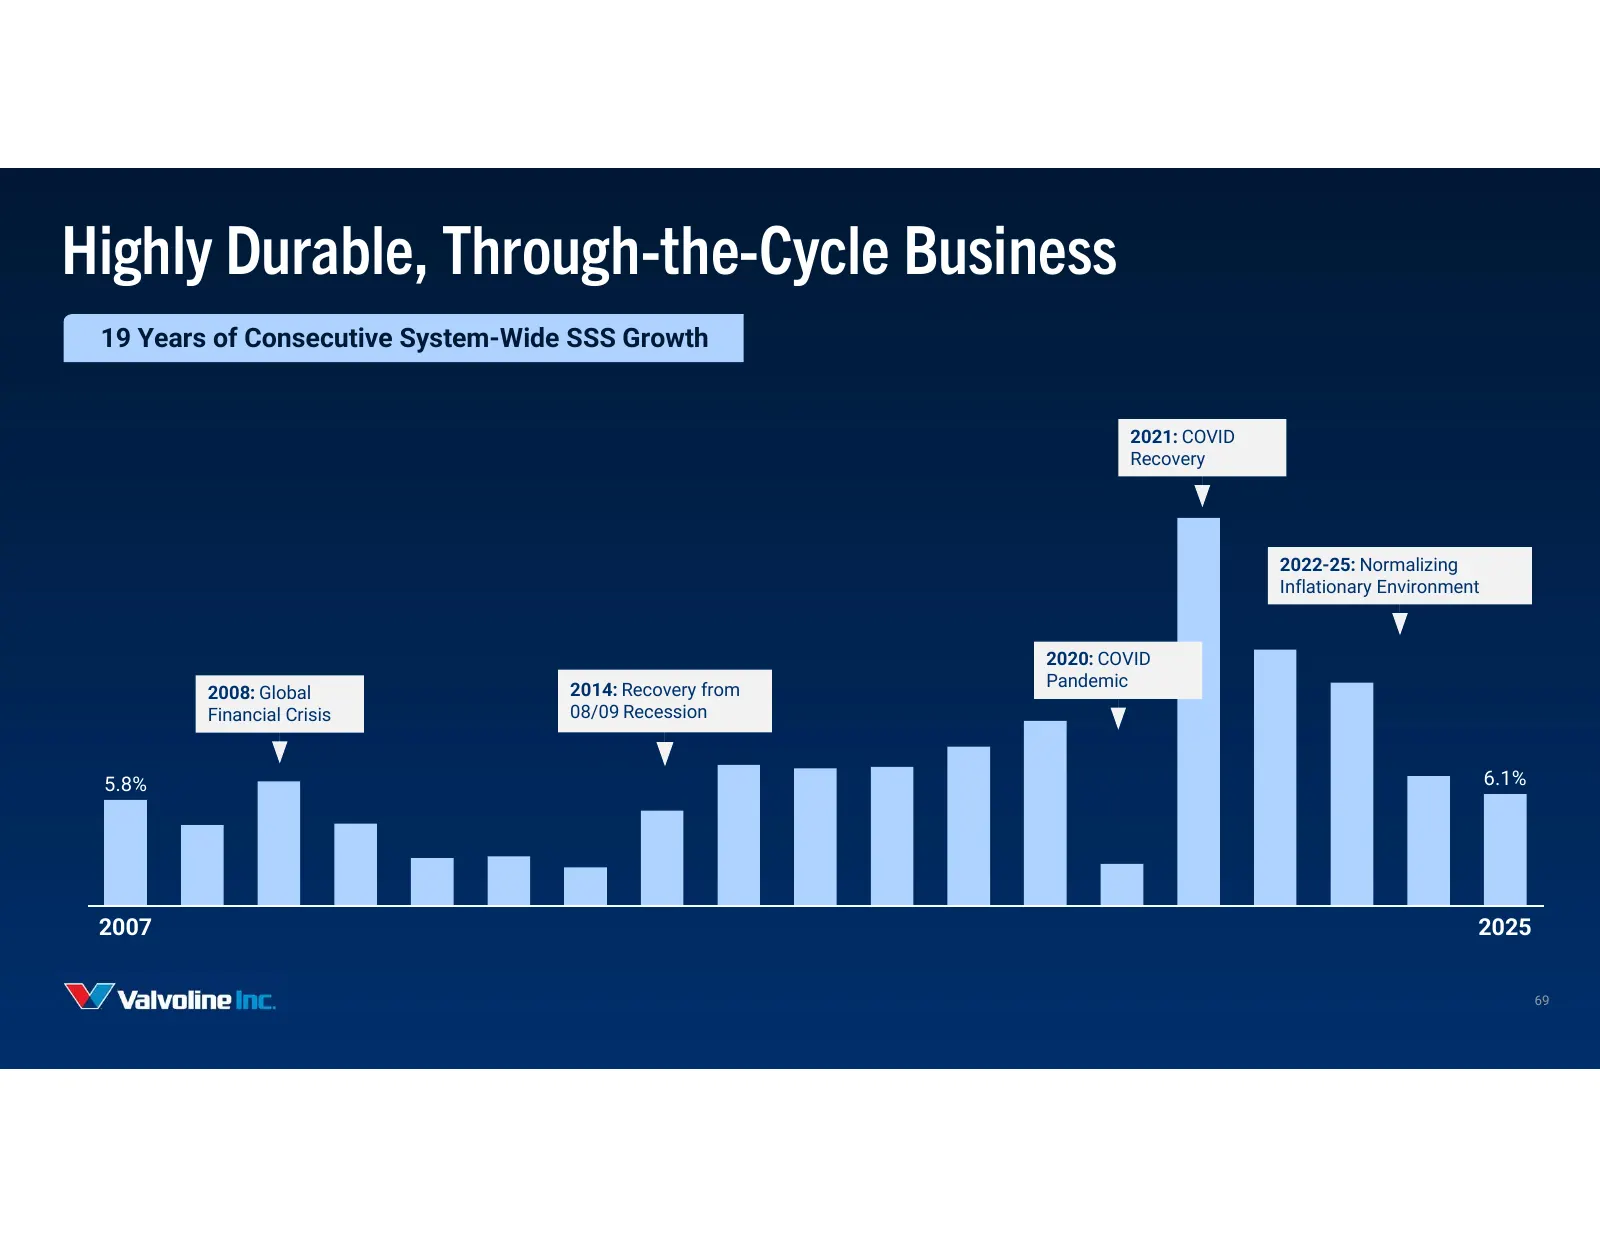
Slide 69: Highly Durable, Through-the-Cycle Business
Highly Durable, Through-the-Cycle Business 19 Years of Consecutive System-Wide SSS Growth 2021: COVID Recovery 2022-25: Normalizing Inflationary Environment 2020: COVID 2014: Recovery from Pandemic 2008: Global Financial Crisis 08/09 Recession 5.8% 6.1% 2007 2025 69
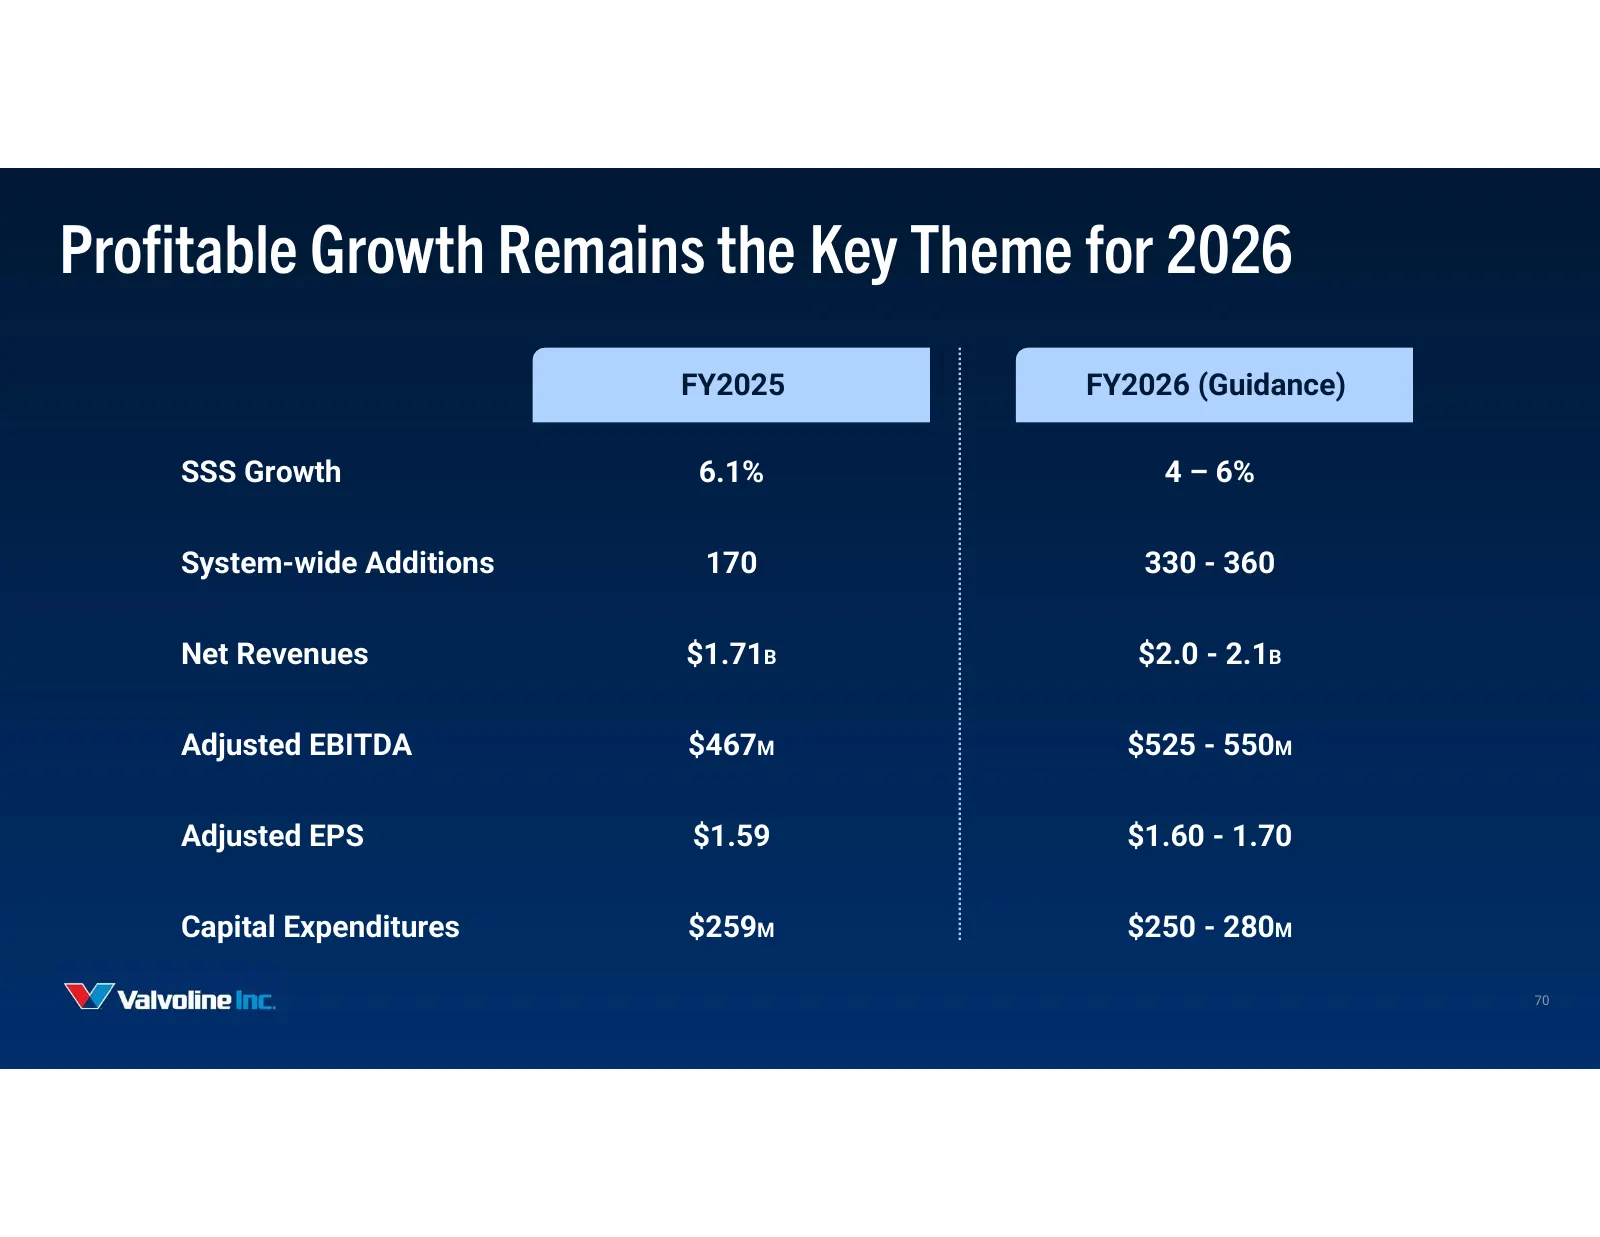
Slide 70: Profitable Growth Remains the Key Theme for 2026
Profitable Growth Remains the Key Theme for 2026 FY2025 FY2026 (Guidance) SSS Growth 6.1% 4 – 6% System-wide Additions 170 330 - 360 Net Revenues $1.71B $2.0 - 2.1B Adjusted EBITDA $467M $525 - 550M Adjusted EPS $1.59 $1.60 - 1.70 Capital Expenditures $259M $250 - 280M 70
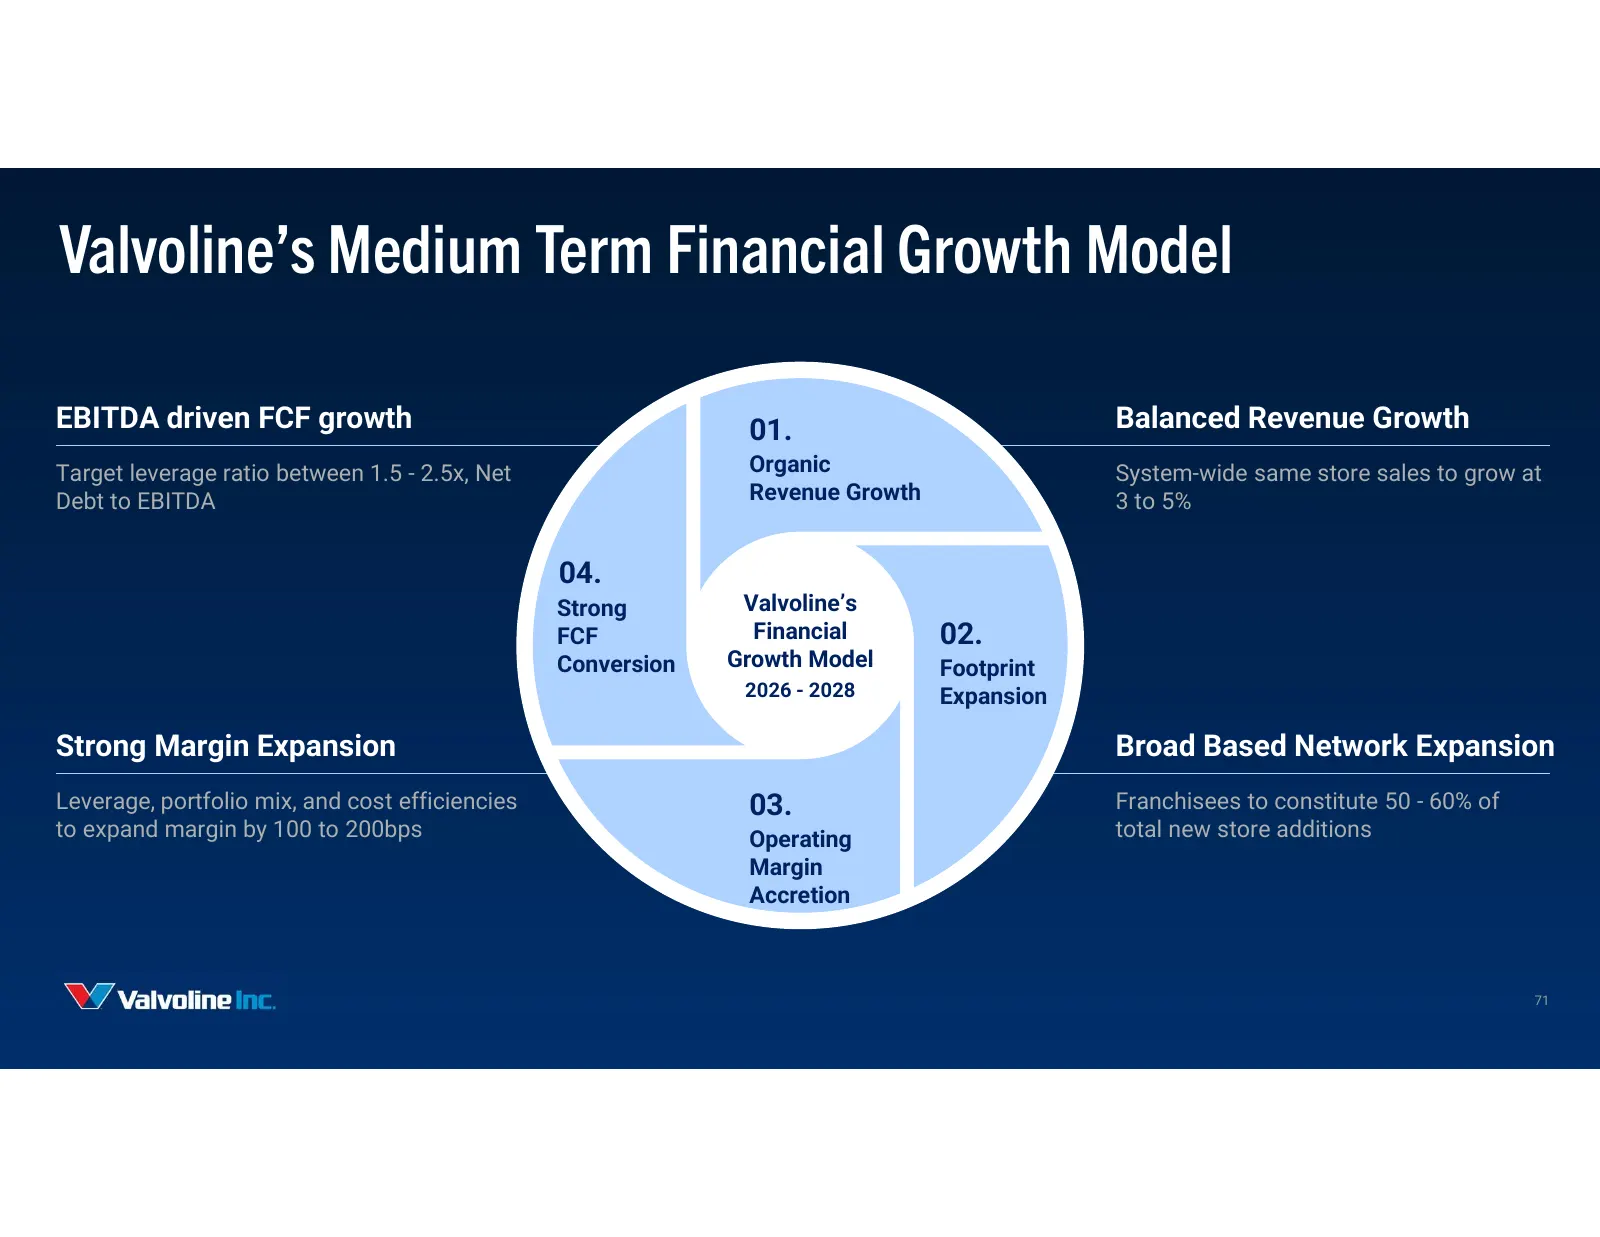
Slide 71: Valvoline's Medium Term Financial Growth Model
Valvoline’s Medium Term Financial Growth Model EBITDA driven FCF growth 01. Balanced Revenue Growth Target leverage ratio between 1.5 - 2.5x, Net Organic System-wide same store sales to grow at Debt to EBITDA Revenue Growth 3 to 5% 04. Strong Valvoline’s FCF Financial 02. Conversion Growth Model Foo
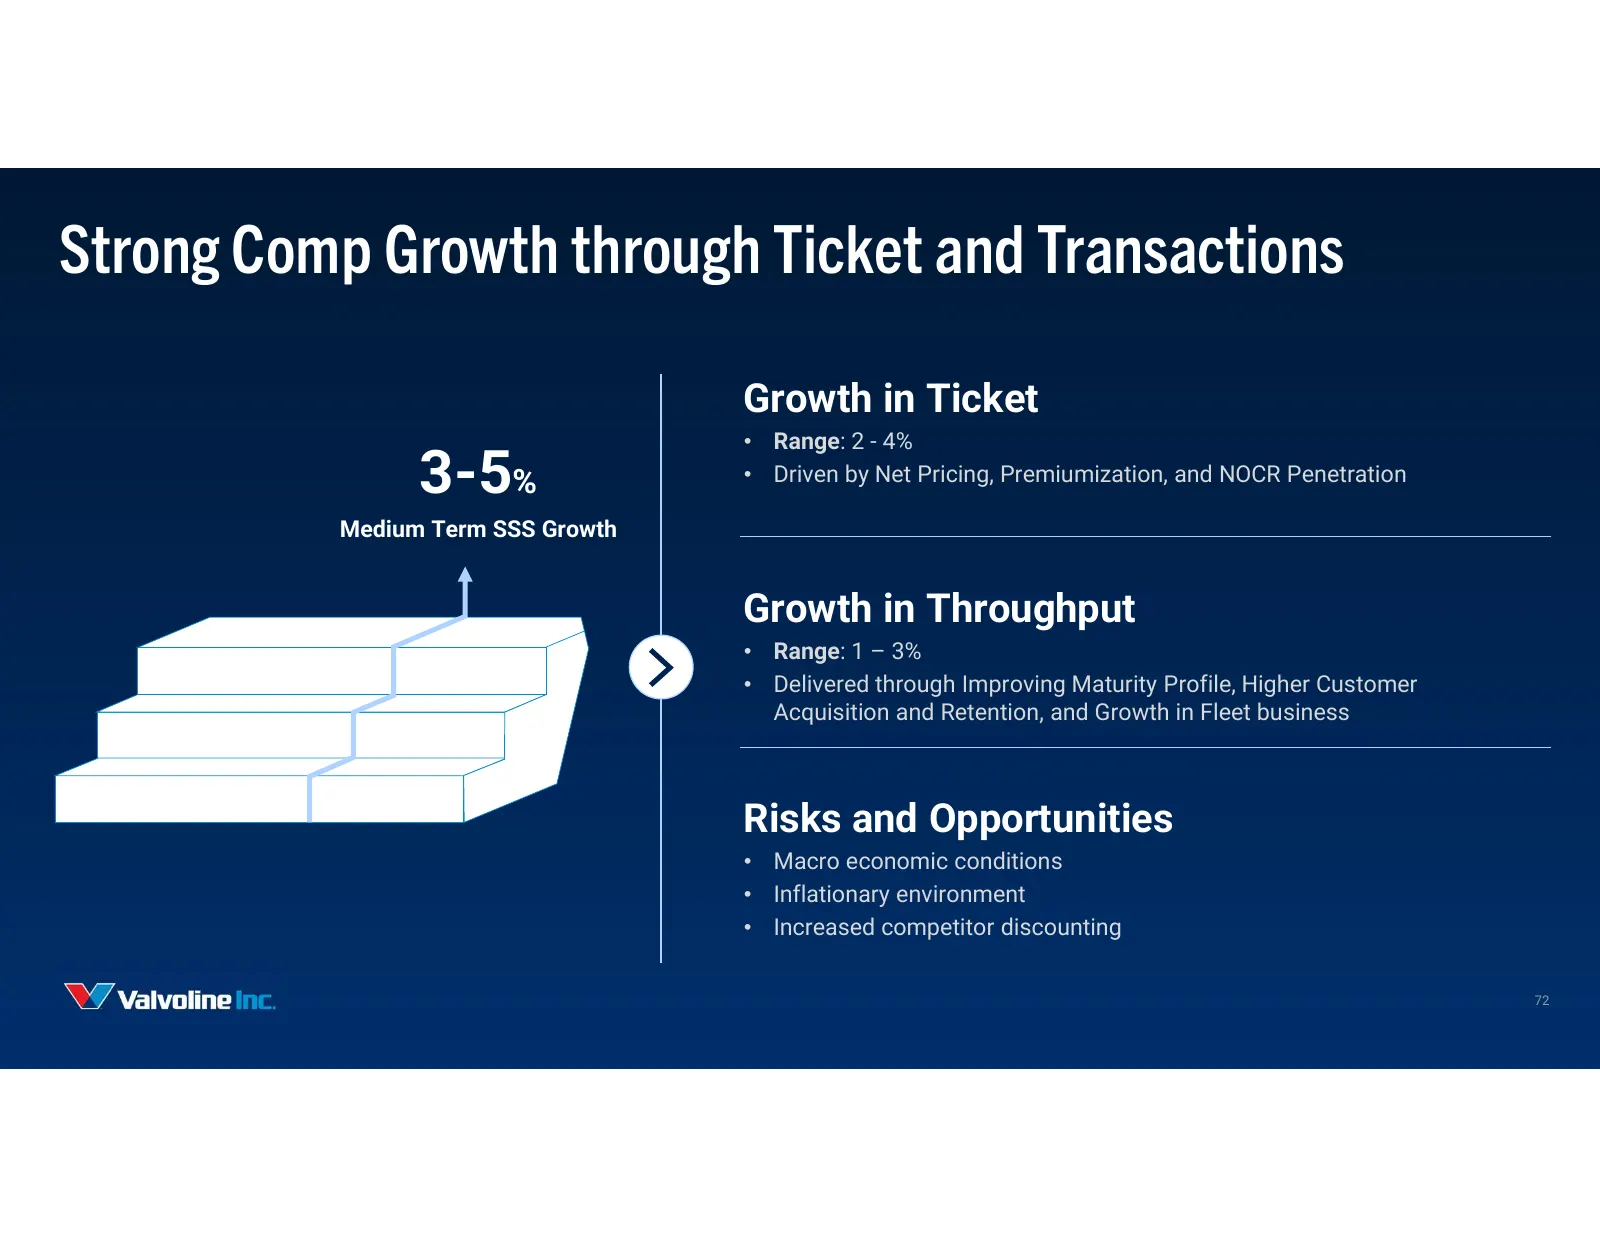
Slide 72: Strong Comp Growth through Ticket and Transactions
Strong Comp Growth through Ticket and Transactions Growth in Ticket • Range: 2 - 4% 3-5% • Driven by Net Pricing, Premiumization, and NOCR Penetration Medium Term SSS Growth Growth in Throughput • Range: 1 – 3% • Delivered through Improving Maturity Profile, Higher Customer Acquisition and Retention
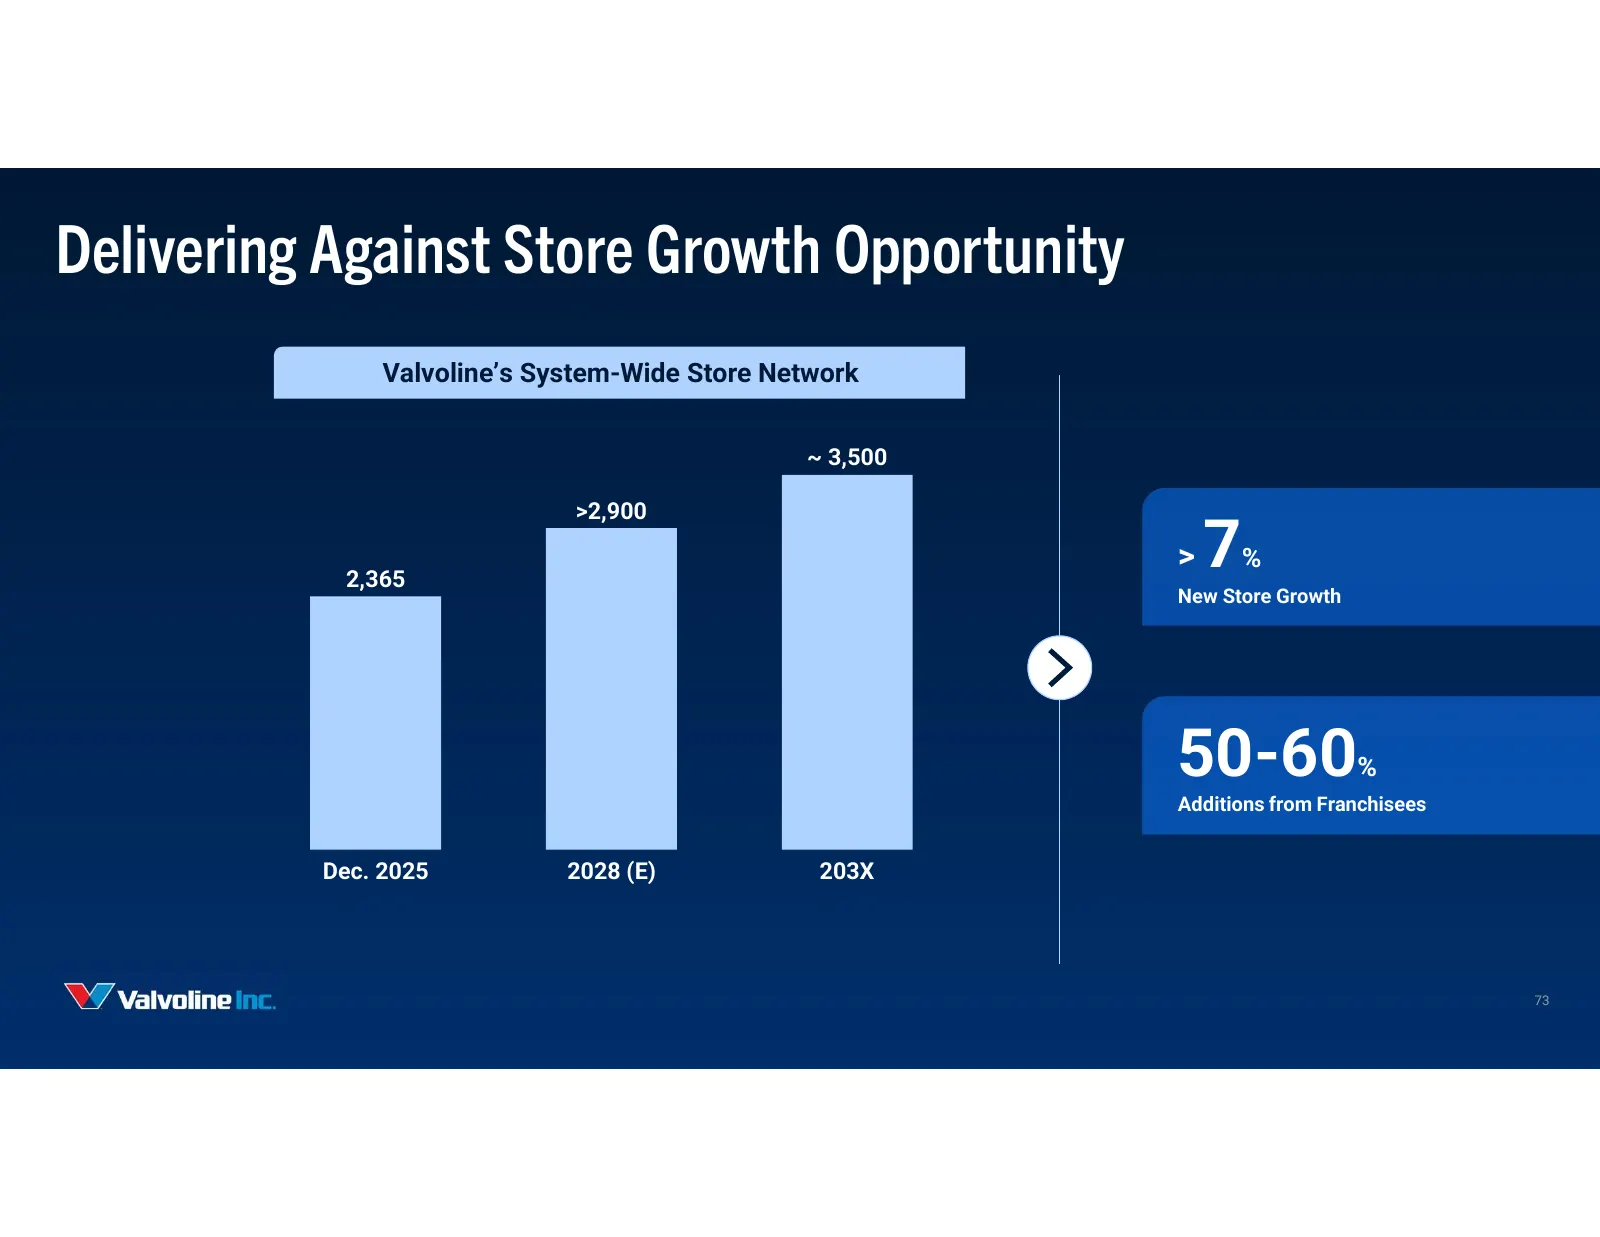
Slide 73: Delivering Against Store Growth Opportunity
Delivering Against Store Growth Opportunity Valvoline’s System-Wide Store Network ~ 3,500 >2,900 2,365 > 7% New Store Growth 50-60% Additions from Franchisees Dec. 2025 2028 (E) 203X 73
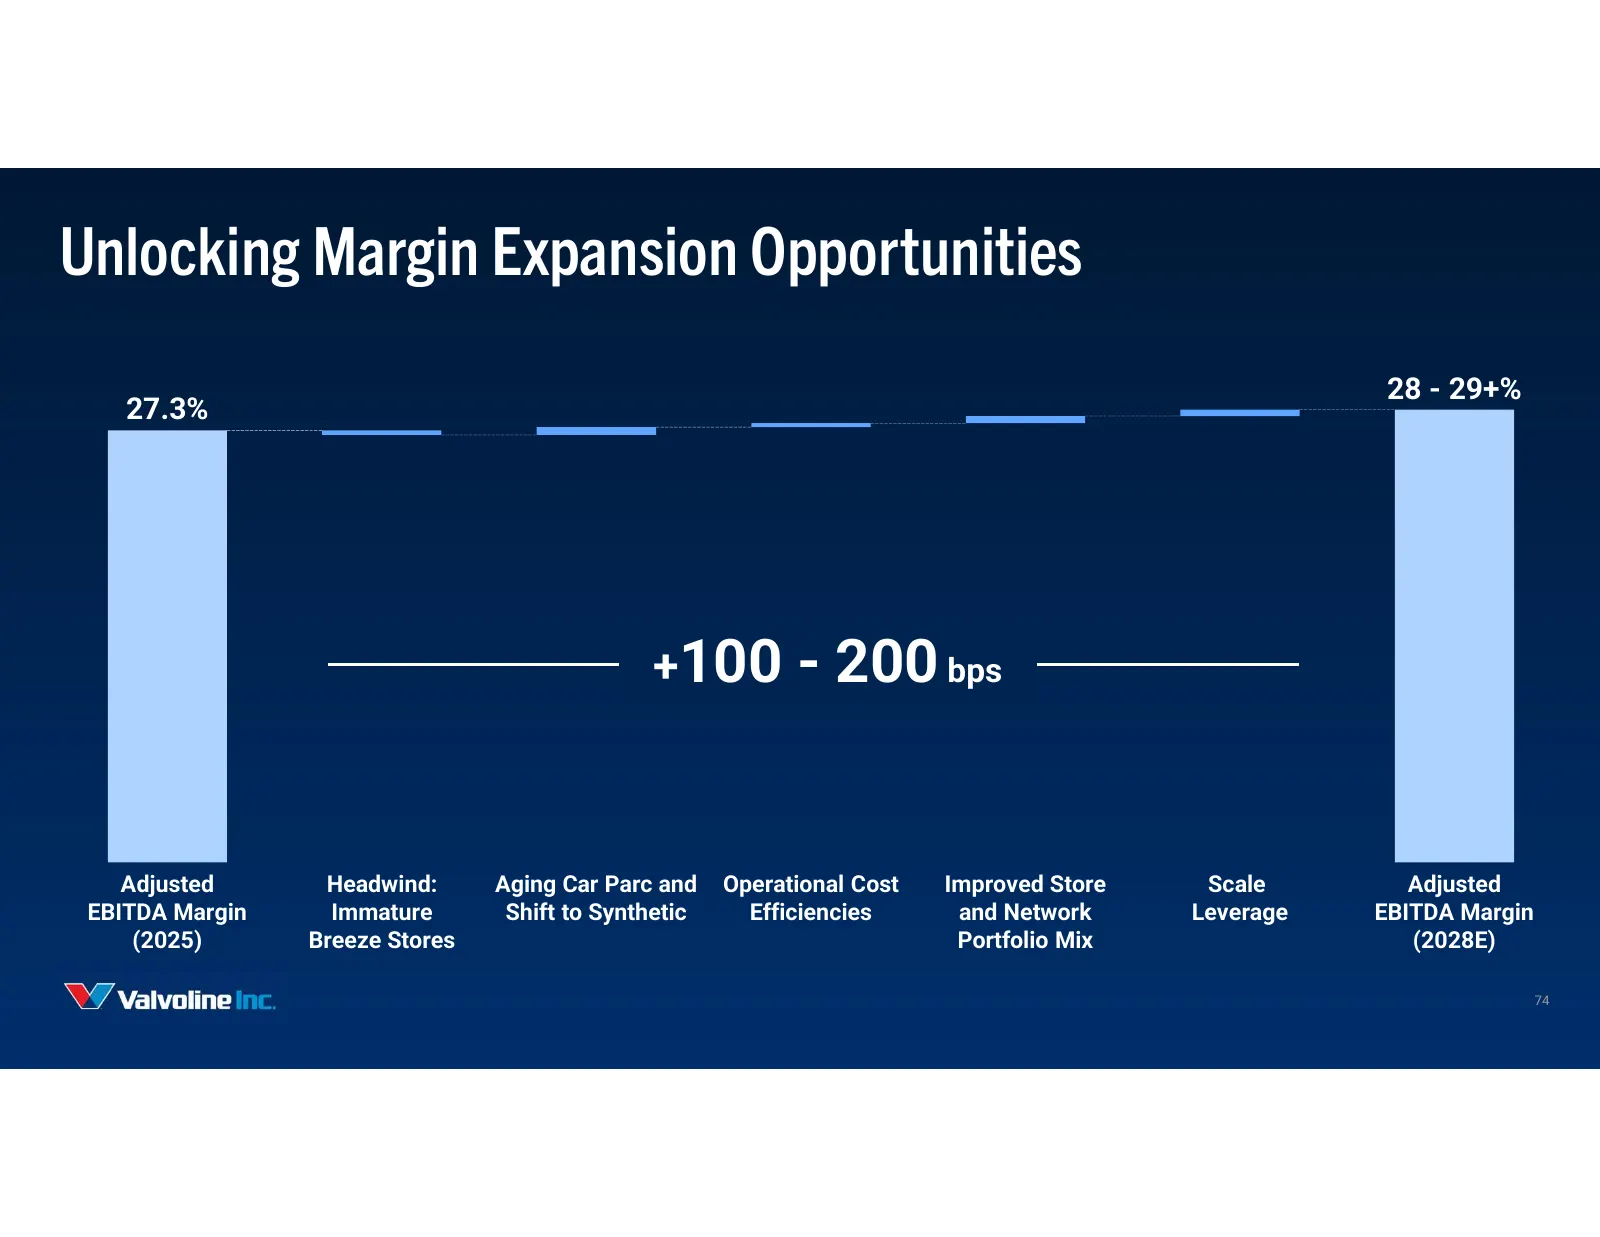
Slide 74: Unlocking Margin Expansion Opportunities
Unlocking Margin Expansion Opportunities 28 - 29+% 27.3% +100 - 200 bps Adjusted Headwind: Aging Car Parc and Operational Cost Improved Store Scale Adjusted EBITDA Margin Immature Shift to Synthetic Efficiencies and Network Leverage EBITDA Margin (2025) Breeze Stores Portfolio Mix (2028E) 74
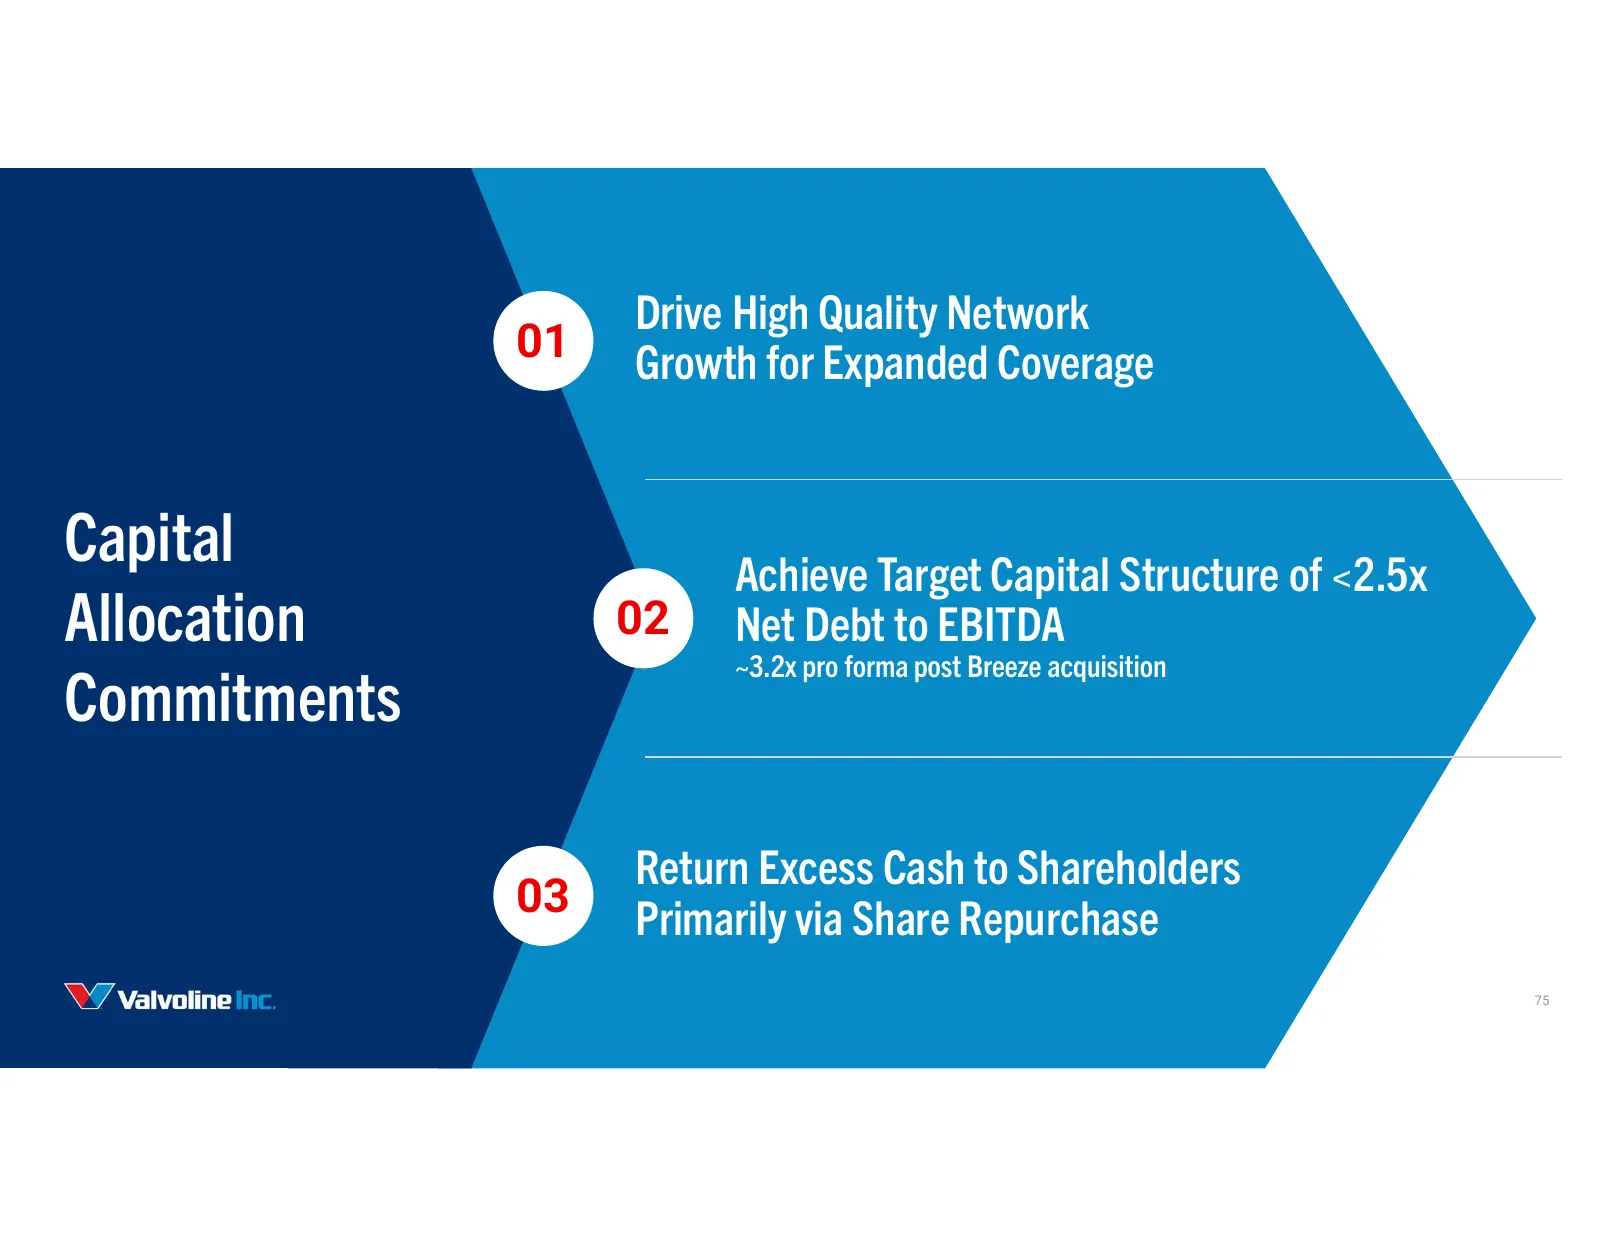
Slide 75: Capital Allocation Commitments
Drive High Quality Network 01 Growth for Expanded Coverage Capital Achieve Target Capital Structure of <2.5x Allocation 02 Net Debt to EBITDA ~3.2x pro forma post Breeze acquisition Commitments Return Excess Cash to Shareholders 03 Primarily via Share Repurchase 75
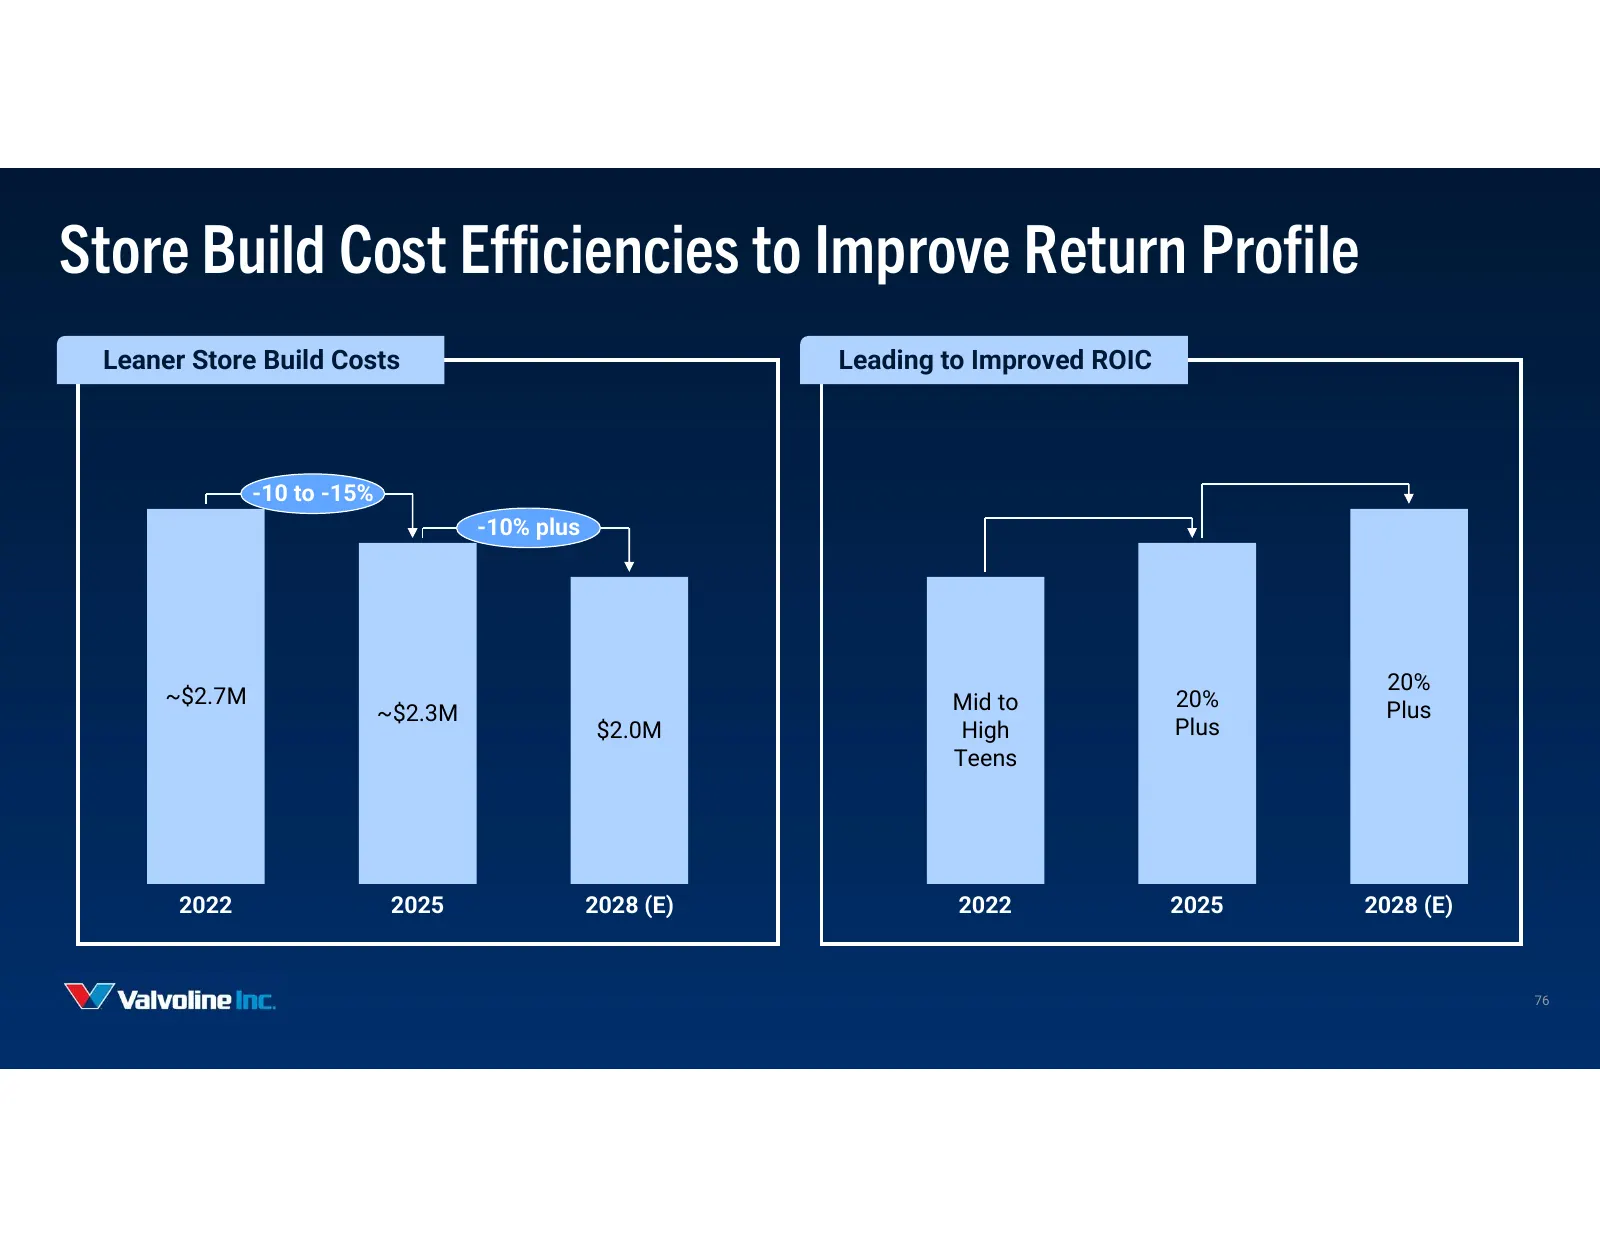
Slide 76: Store Build Cost Efficiencies to Improve Return Profile
Store Build Cost Efficiencies to Improve Return Profile Leaner Store Build Costs Leading to Improved ROIC -10 to -15% -10% plus 20% ~$2.7M Mid to 20% ~$2.3M Plus $2.0M High Plus Teens 2022 2025 2028 (E) 2022 2025 2028 (E) 76
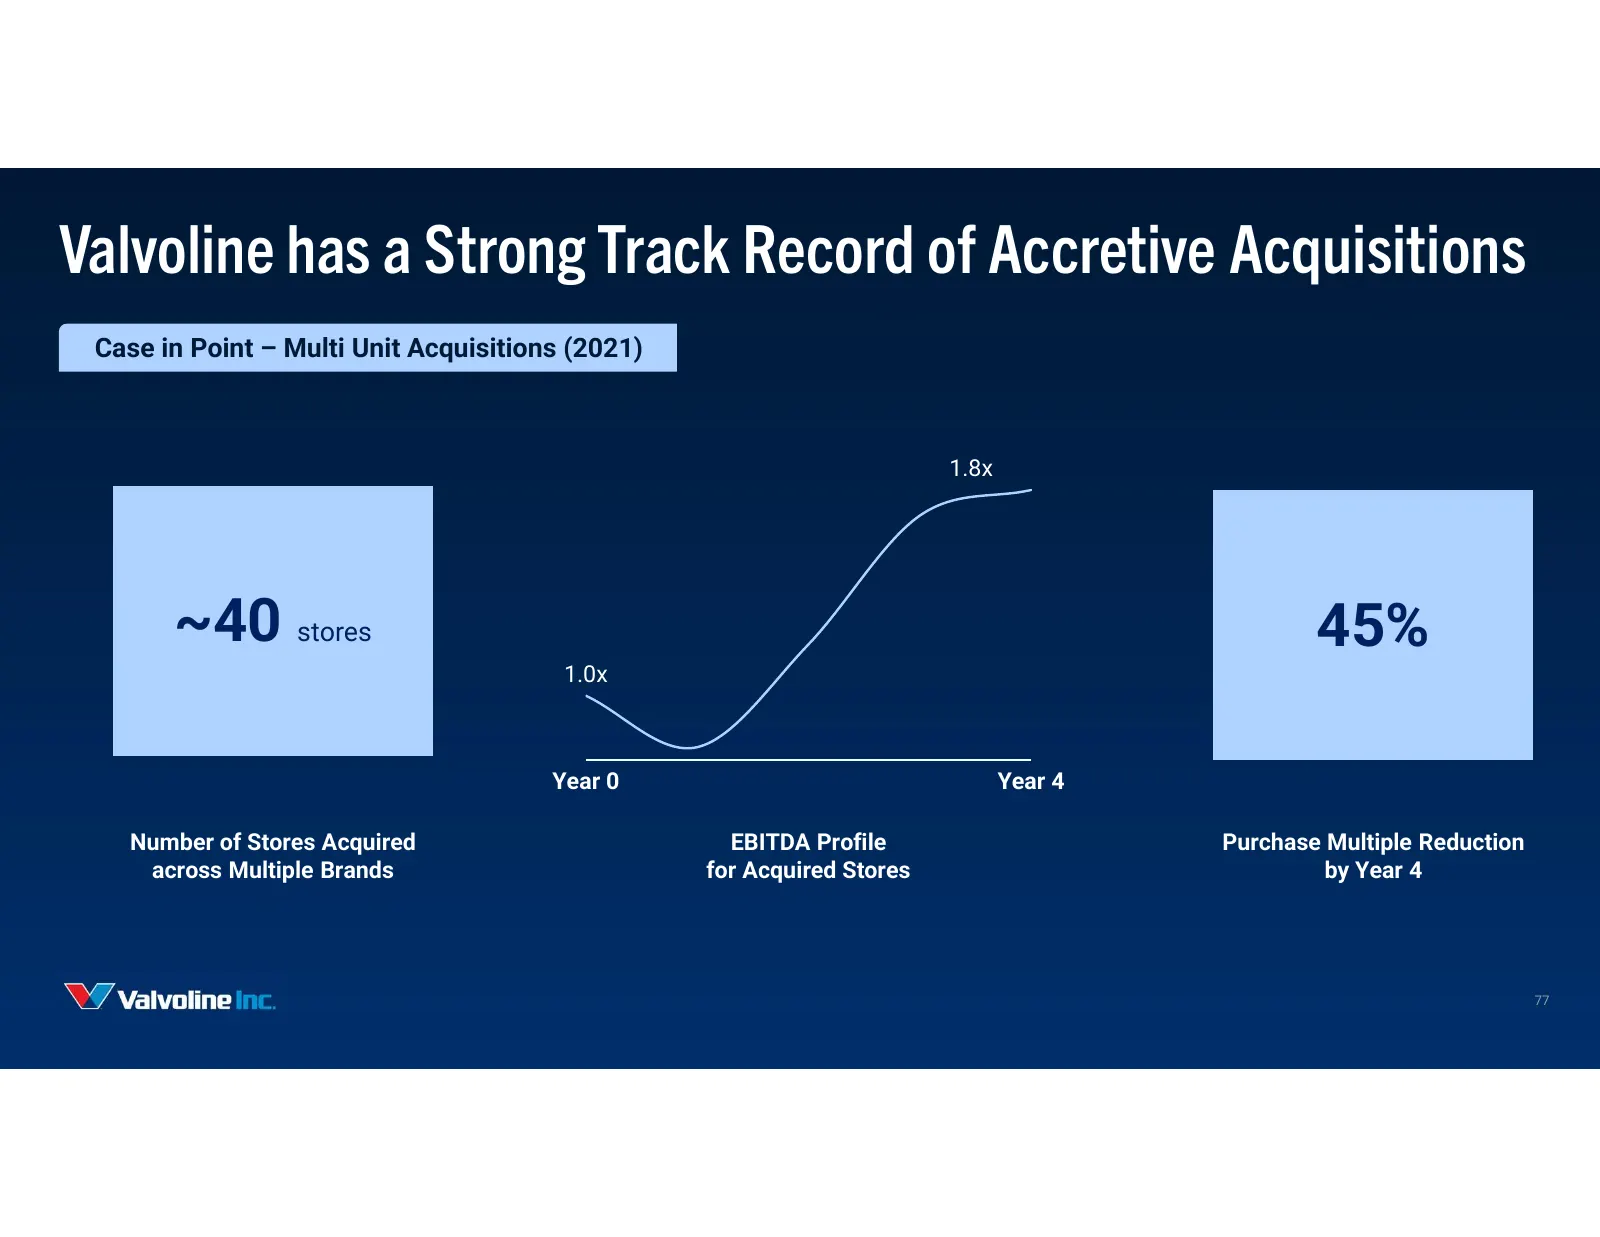
Slide 77: Valvoline has a Strong Track Record of Accretive Acquisitions
Valvoline has a Strong Track Record of Accretive Acquisitions Case in Point – Multi Unit Acquisitions (2021) 1.8x ~40 stores 45% 1.0x Year 0 Year 4 Number of Stores Acquired EBITDA Profile Purchase Multiple Reduction across Multiple Brands for Acquired Stores by Year 4 77
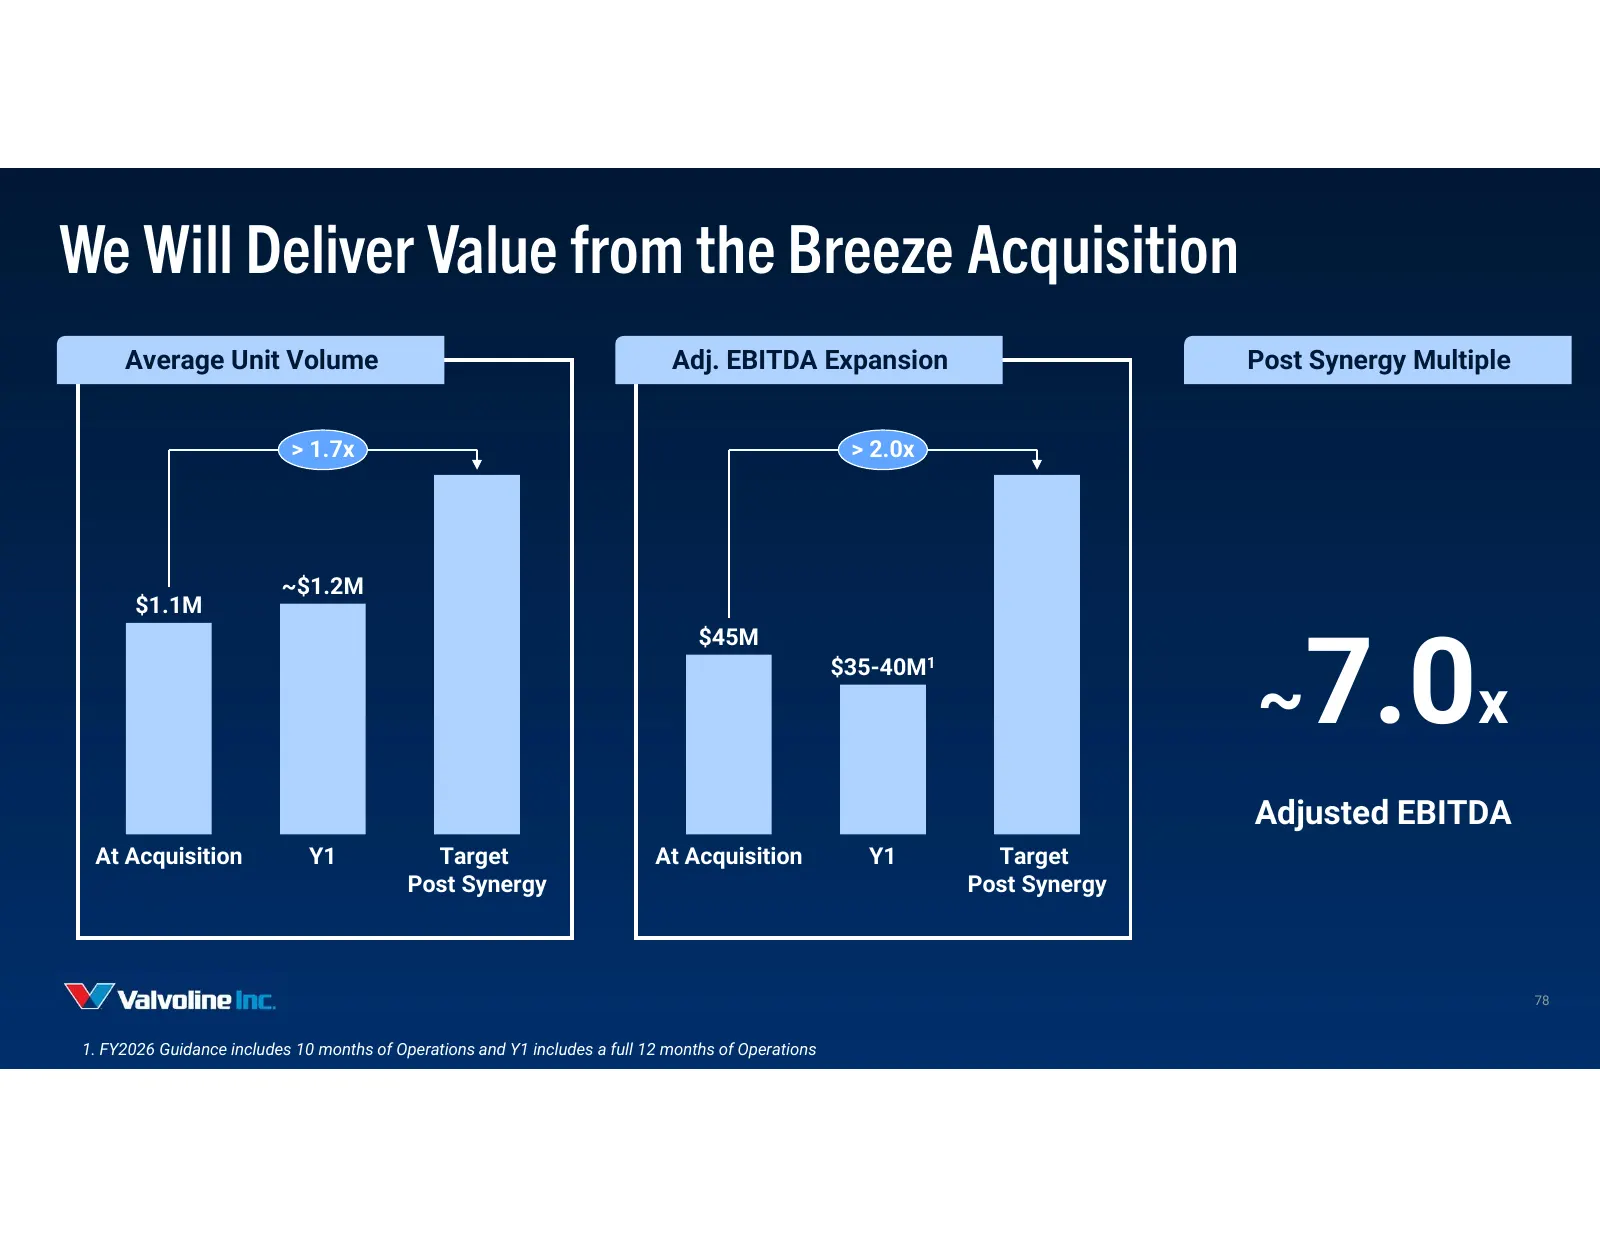
Slide 78: We Will Deliver Value from the Breeze Acquisition
We Will Deliver Value from the Breeze Acquisition Average Unit Volume Adj. EBITDA Expansion Post Synergy Multiple > 1.7x > 2.0x ~$1.2M $1.1M 7.0x $45M $35-40M1 ~ Adjusted EBITDA At Acquisition Y1 Target At Acquisition Y1 Target Post Synergy Post Synergy 78 1. FY2026 Guidance includes 10 months of Op
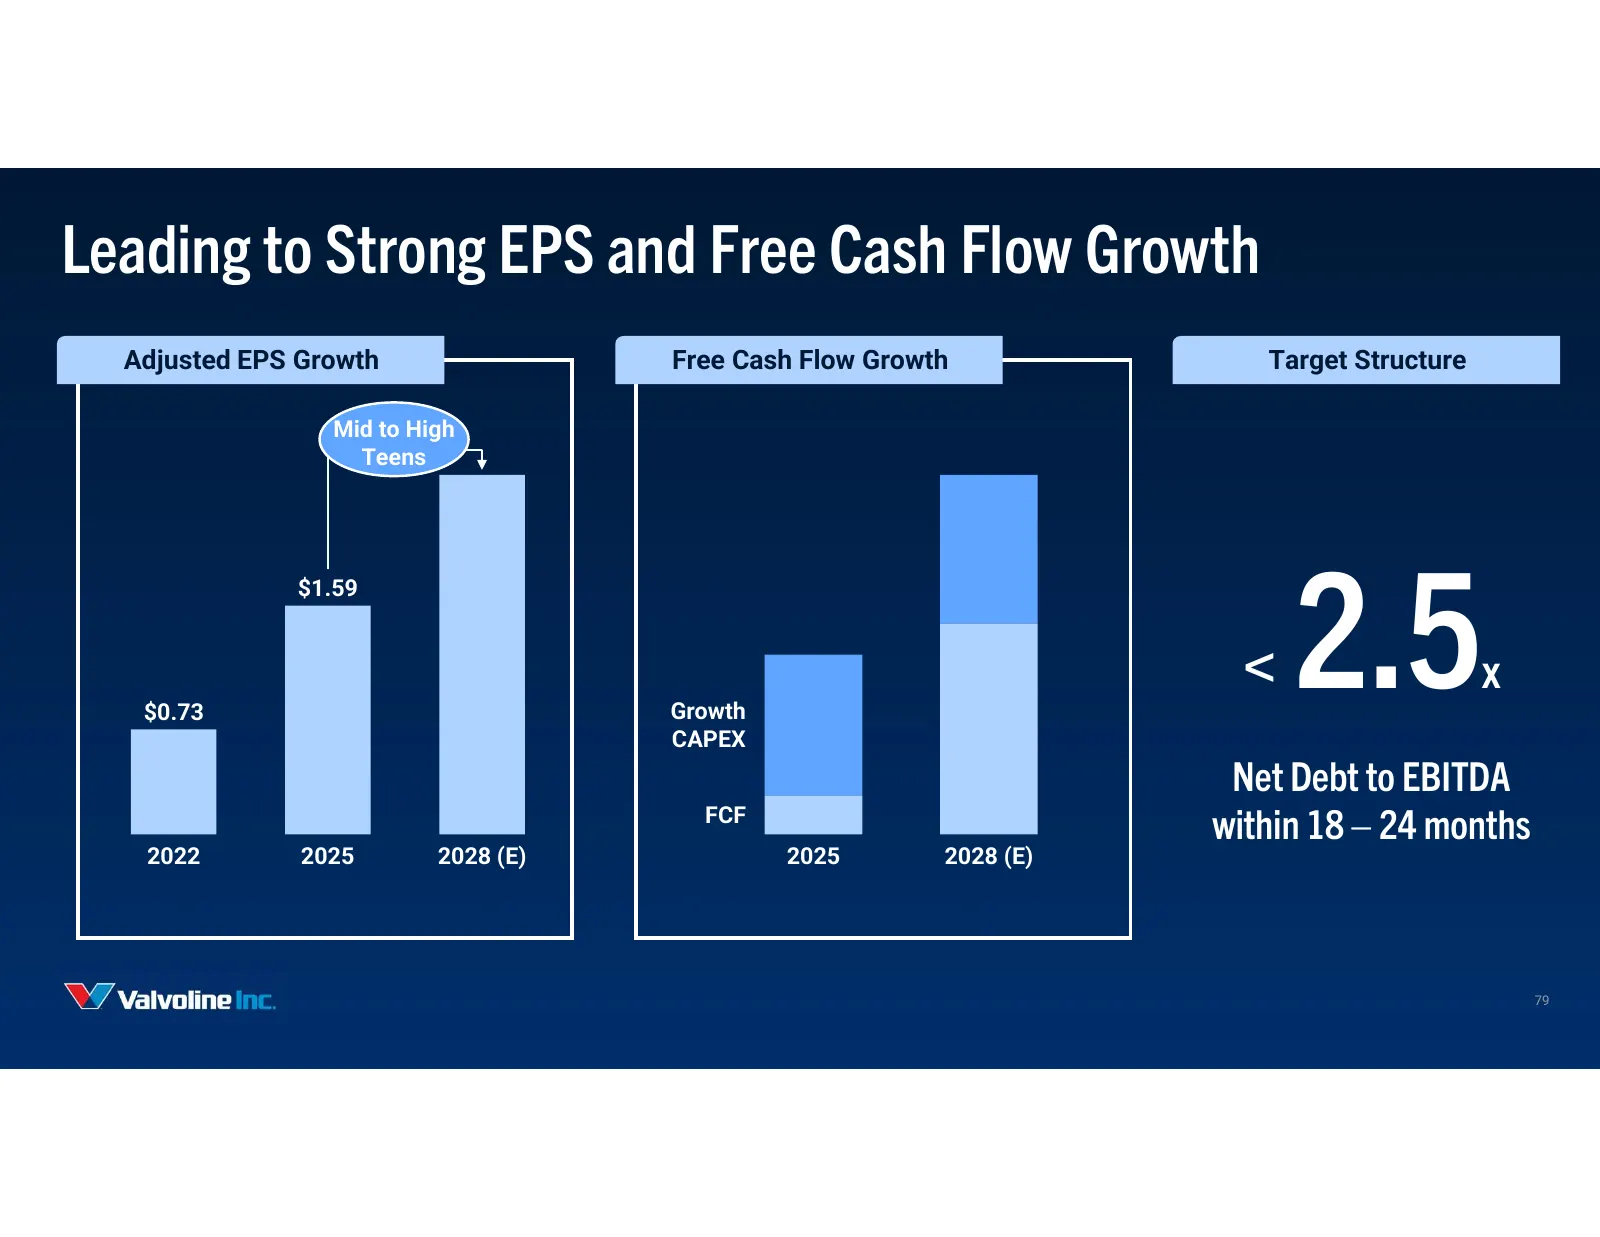
Slide 79: Leading to Strong EPS and Free Cash Flow Growth
Leading to Strong EPS and Free Cash Flow Growth Adjusted EPS Growth Free Cash Flow Growth Target Structure Mid to High Teens 2.5 $1.59 $0.73 Growth < x CAPEX Net Debt to EBITDA FCF within 18 – 24 months 2022 2025 2028 (E) 2025 2028 (E) 79
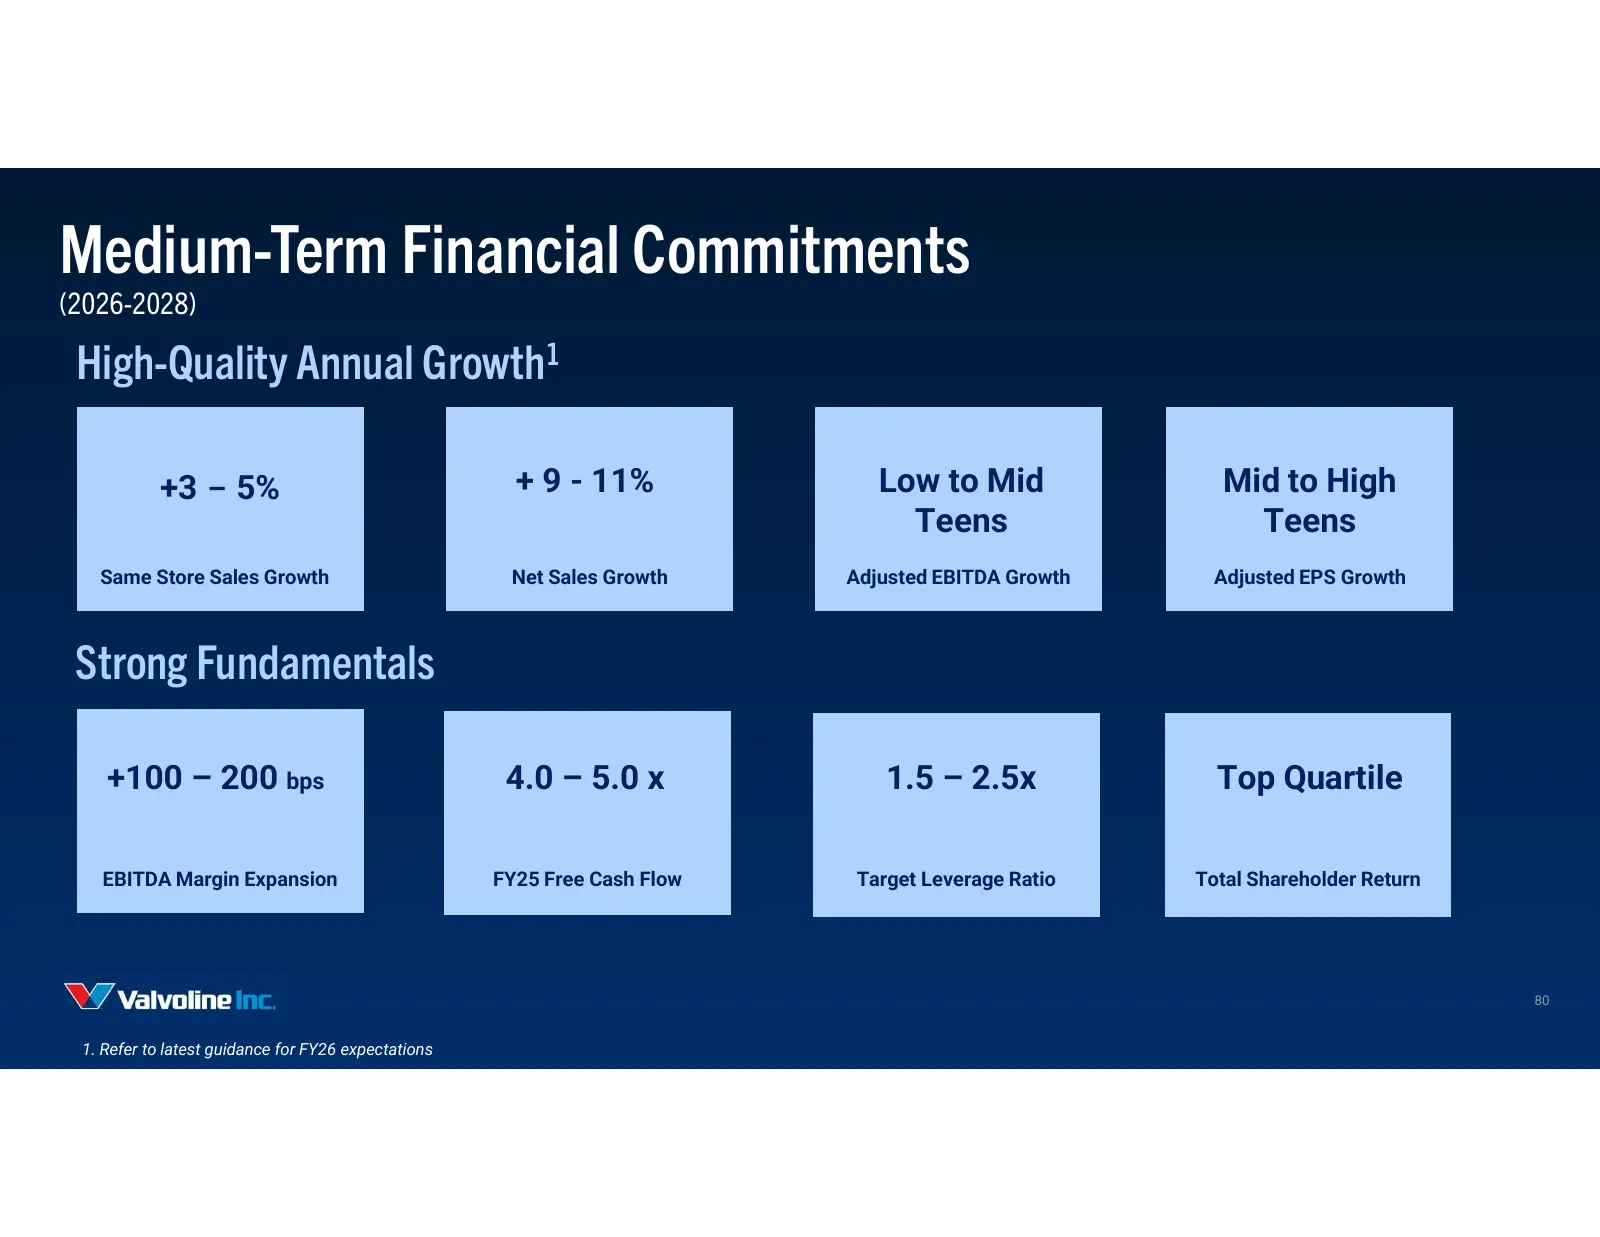
Slide 80: Medium-Term Financial Commitments
Medium-Term Financial Commitments (2026-2028) High-Quality Annual Growth1 +3 – 5% + 9 - 11% Low to Mid Mid to High Teens Teens Same Store Sales Growth Net Sales Growth Adjusted EBITDA Growth Adjusted EPS Growth Strong Fundamentals +100 – 200 bps 4.0 – 5.0 x 1.5 – 2.5x Top Quartile EBITDA Margin Expa
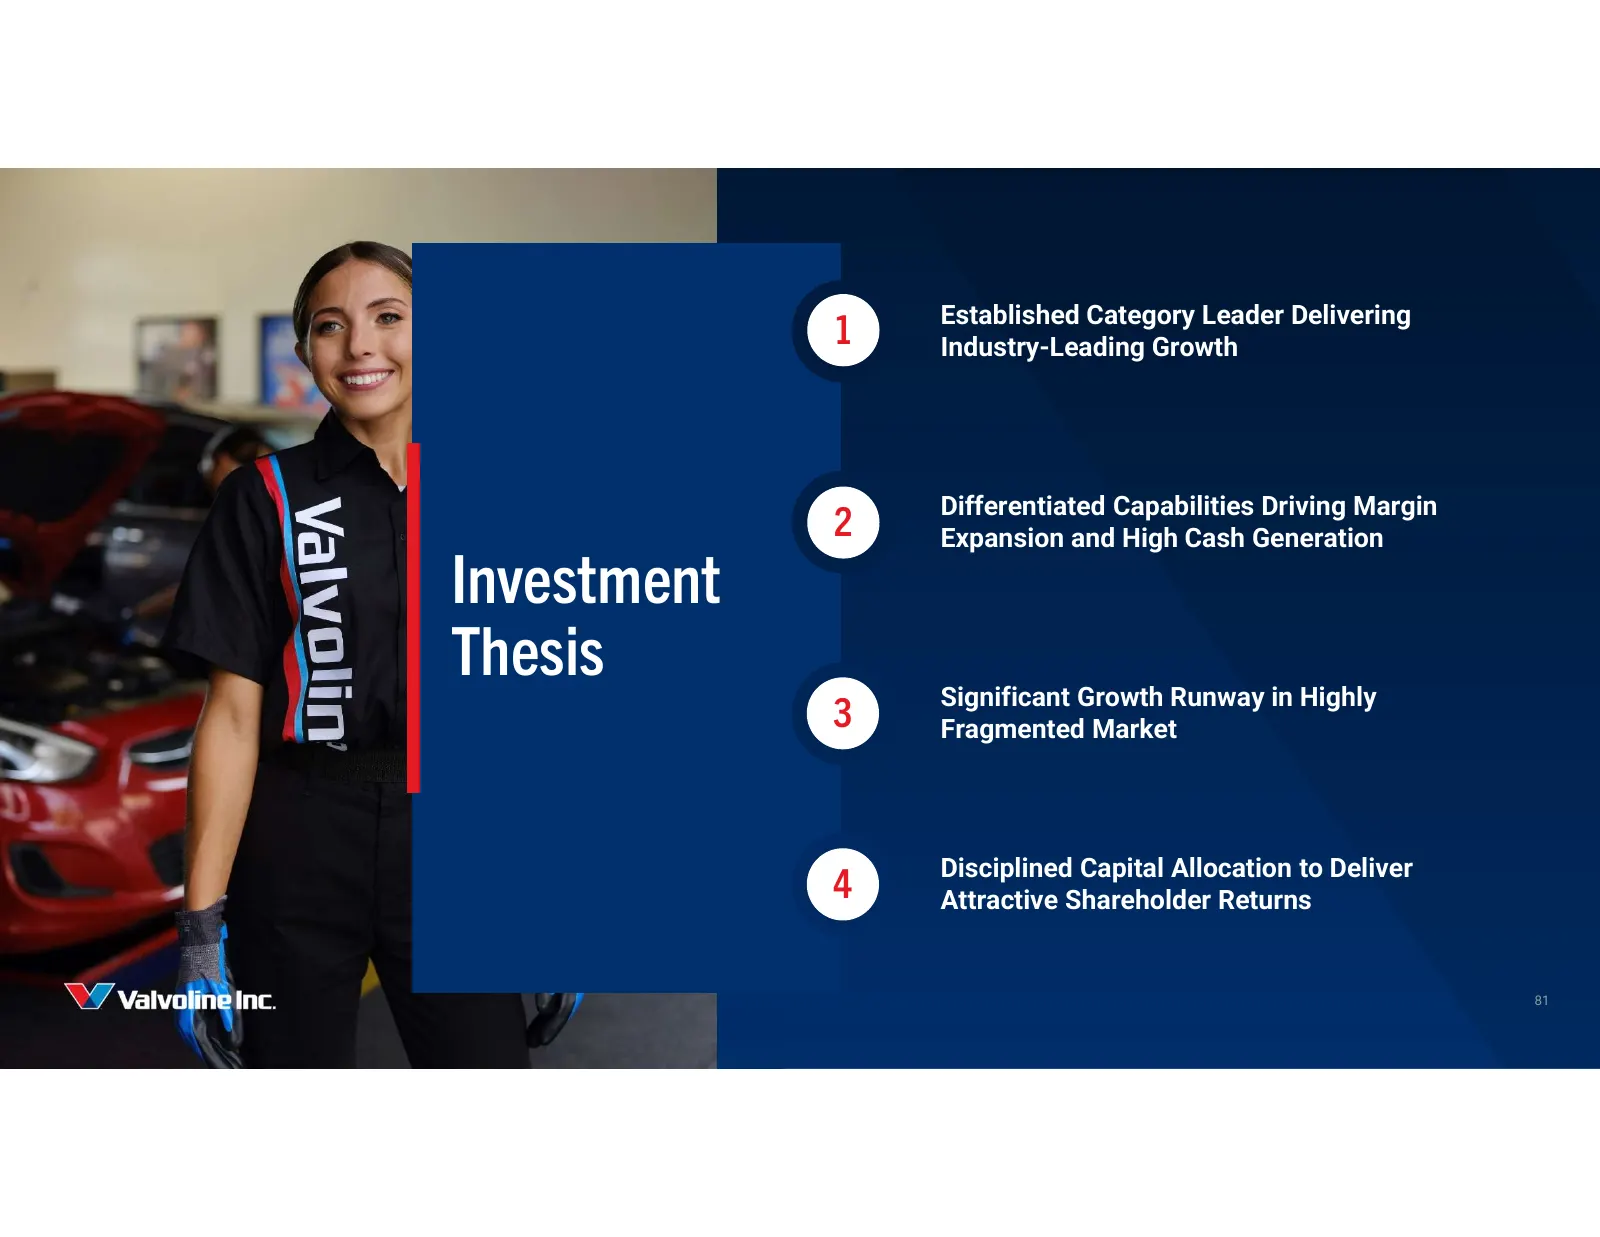
Slide 81: Investment Thesis
Established Category Leader Delivering 1 Industry-Leading Growth Differentiated Capabilities Driving Margin 2 Expansion and High Cash Generation Investment Investment Thesis Thesis Significant Growth Runway in Highly 3 Fragmented Market Disciplined Capital Allocation to Deliver 4 Attractive Sharehol

Slide 82: YYZ Valvoline inc.
YYZ Valvoline inc. 2

Slide 83: Q&A
Q&A 83
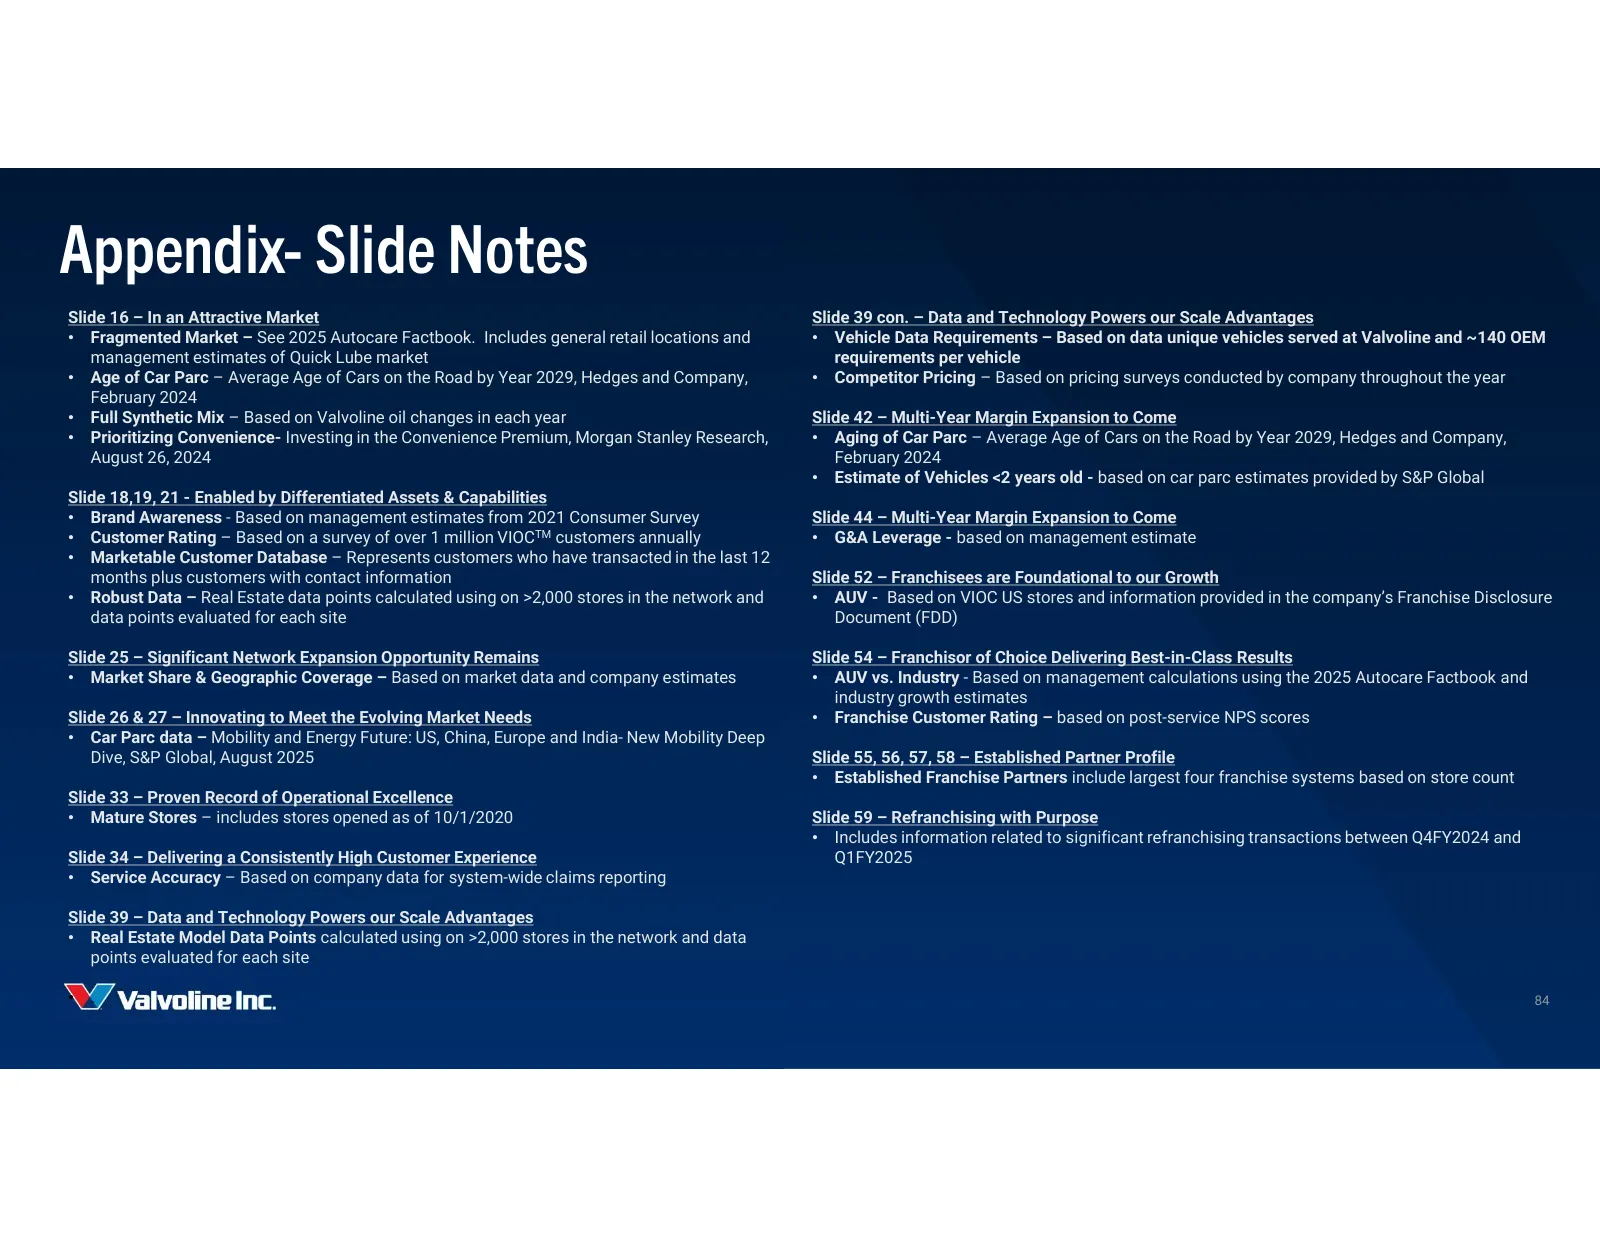
Slide 84: Appendix - Slide Notes
Appendix- Slide Notes Slide 16 – In an Attractive Market Slide 39 con. – Data and Technology Powers our Scale Advantages • Fragmented Market – See 2025 Autocare Factbook. Includes general retail locations and • Vehicle Data Requirements – Based on data unique vehicles served at Valvoline and ~140 OE
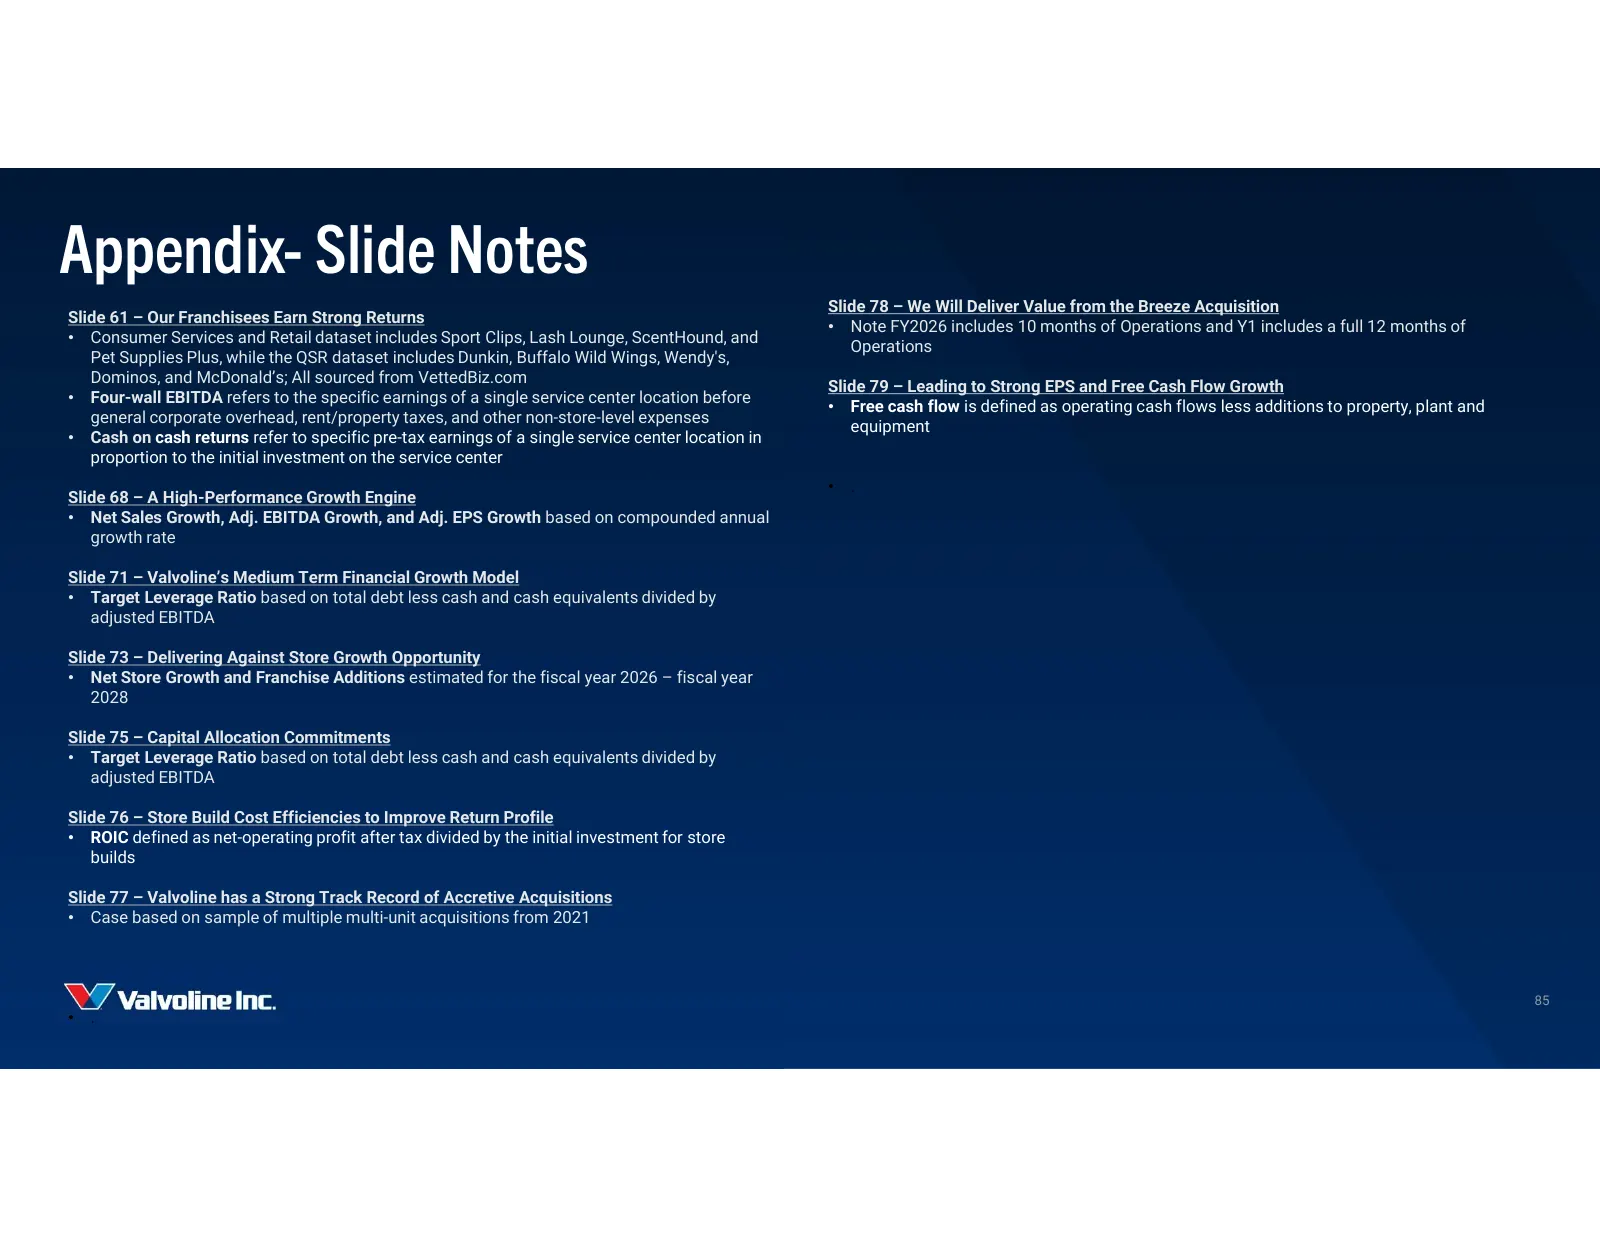
Slide 85: Appendix - Slide Notes
Appendix- Slide Notes Slide 78 – We Will Deliver Value from the Breeze Acquisition Slide 61 – Our Franchisees Earn Strong Returns • Note FY2026 includes 10 months of Operations and Y1 includes a full 12 months of • Consumer Services and Retail dataset includes Sport Clips, Lash Lounge, ScentHound, a
Source: company website
More decks from Valvoline Inc.
 Q3 2026 Earnings Presentation21 slides · Aug 5, 2026
 Q2 2026 Earnings Presentation21 slides · May 7, 2026
 Q1 2026 Earnings Presentation21 slides · Feb 4, 2026
 Q4 2025 Earnings Presentation28 slides · Nov 19, 2025
 Q3 2025 Earnings Presentation21 slides · Aug 6, 2025
 Q2 2025 Earnings Presentation25 slides · May 8, 2025