Pacific Mercantile Bancorp — Investor Presentation (January 2018)
16 slides from Pacific Mercantile Bancorp's investor presentation, Jan 31, 2018
Slide 1: Investor Presentation February 2018
INVESTOR PRESENTAT ION F e b r u a r y 2 0 1 8
Slide 2: Forward-looking statements
This presentation contains statements regarding our expectations, beliefs and views about our future financial performance and our business, trends and expectations regarding the markets in which we operate, and our future plans. Those statements constitute “forward-looking statements” within the me
Slide 3: Corporate Overview
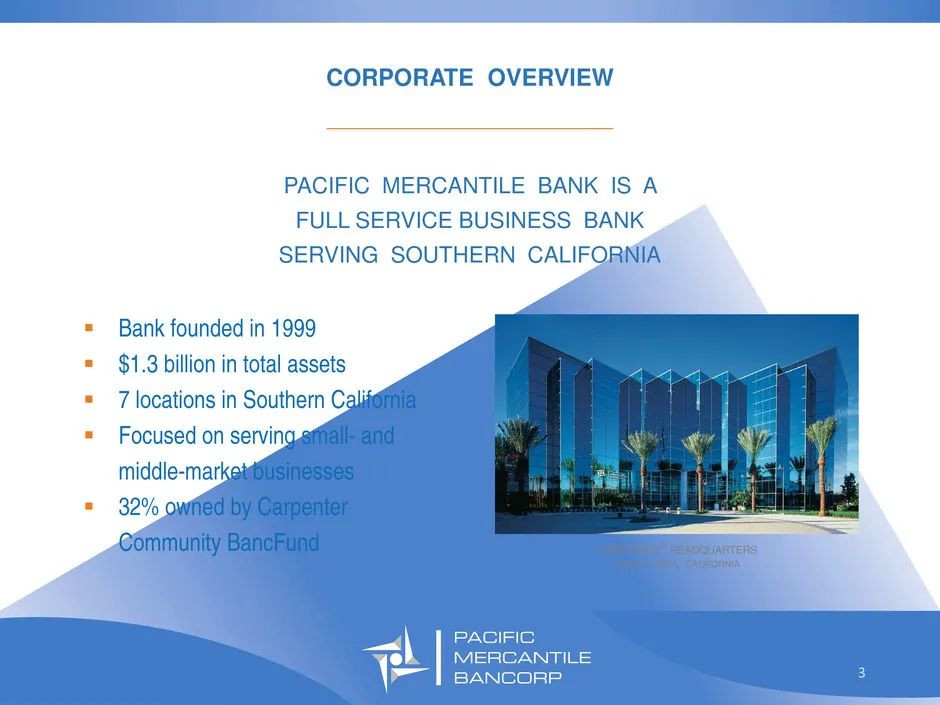
CORPORATE OVERVIEW _________________________________ PACIFIC MERCANTILE BANK IS A FULL SERVICE BUSINESS BANK SERVING SOUTHERN CALIFORNIA Bank founded in 1999 $1.3 billion in total assets 7 locations in Southern California Focused on serving small- and middle-market businesses 32% owned by
Slide 4: Office Locations
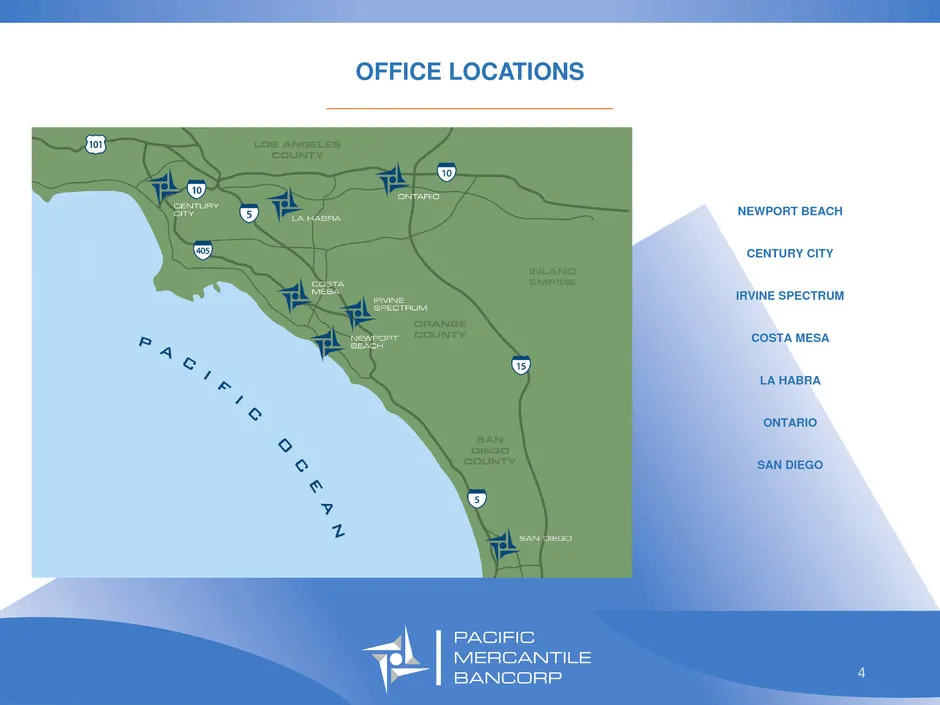
OFFICE LOCATIONS _________________________________ NEWPORT BEACH CENTURY CITY IRVINE SPECTRUM COSTA MESA LA HABRA ONTARIO SAN DIEGO 4
Slide 5: Market Positioning
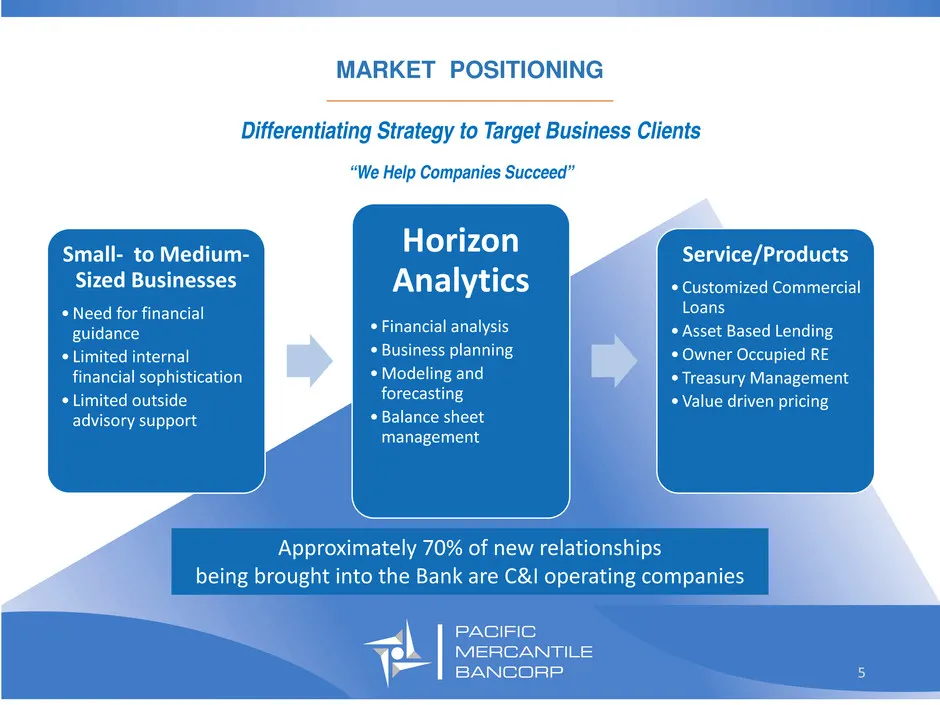
MARKET POSITIONING _________________________________ “We Help Companies Succeed” Differentiating Strategy to Target Business Clients 5 Small- to Medium- Sized Businesses • Need for financial guidance • Limited internal financial sophistication • Limited outside advisory support Horizon Analytics • F
Slide 6: Improving Profitability
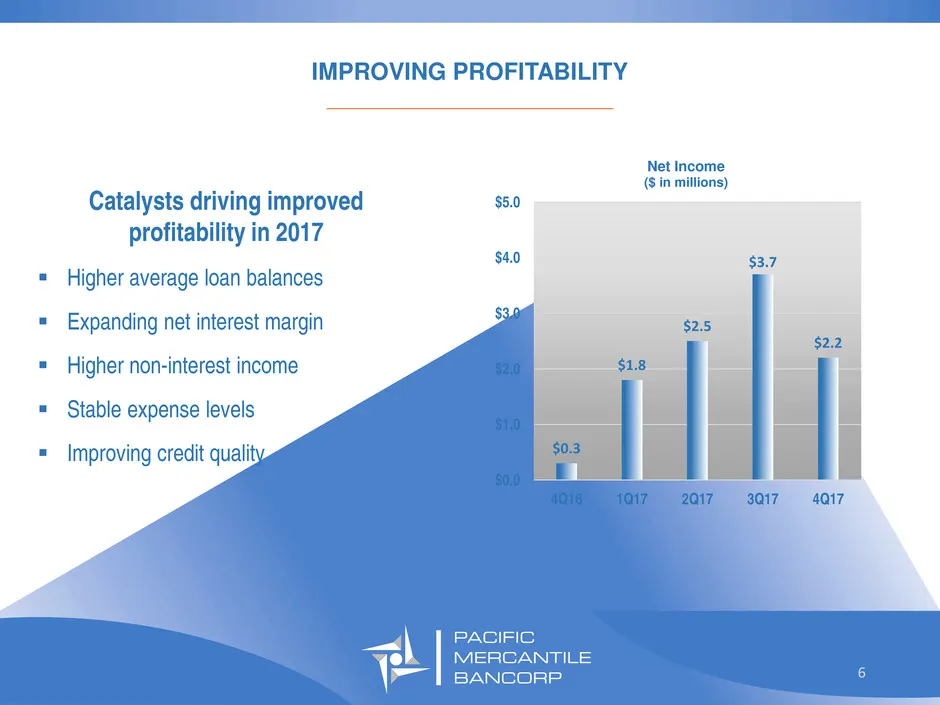
IMPROVING PROFITABILITY _________________________________ 6 $0.3 $1.8 $2.5 $3.7 $2.2 $0.0 $1.0 $2.0 $3.0 $4.0 $5.0 4Q16 1Q17 2Q17 3Q17 4Q17 Net Income ($ in millions) Catalysts driving improved profitability in 2017 Higher average loan balances Expanding net interest margin Higher non-interest
Slide 7: Loan Portfolio Focus on Relationship Lending
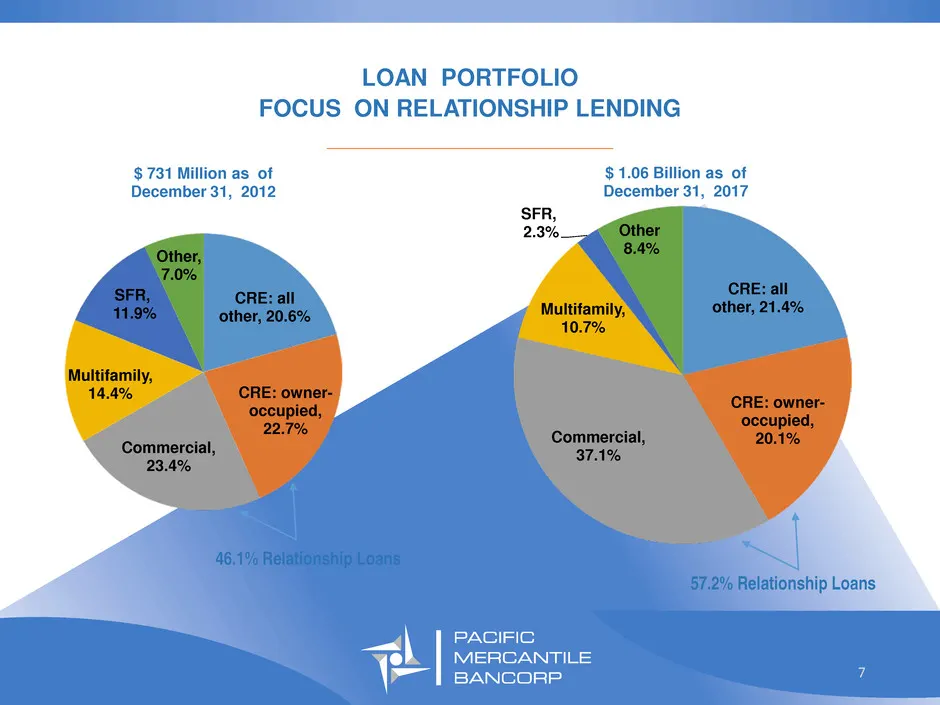
LOAN PORTFOLIO FOCUS ON RELATIONSHIP LENDING _________________________________ CRE: all other, 21.4% CRE: owner- occupied, 20.1%Commercial, 37.1% Multifamily, 10.7% SFR, 2.3% Other 8.4% $ 1.06 Billion as of December 31, 2017 7 CRE: all other, 20.6% CRE: owner- occupied, 22.7% Commercial, 23.4% Multi
Slide 8: Loan Production Trends
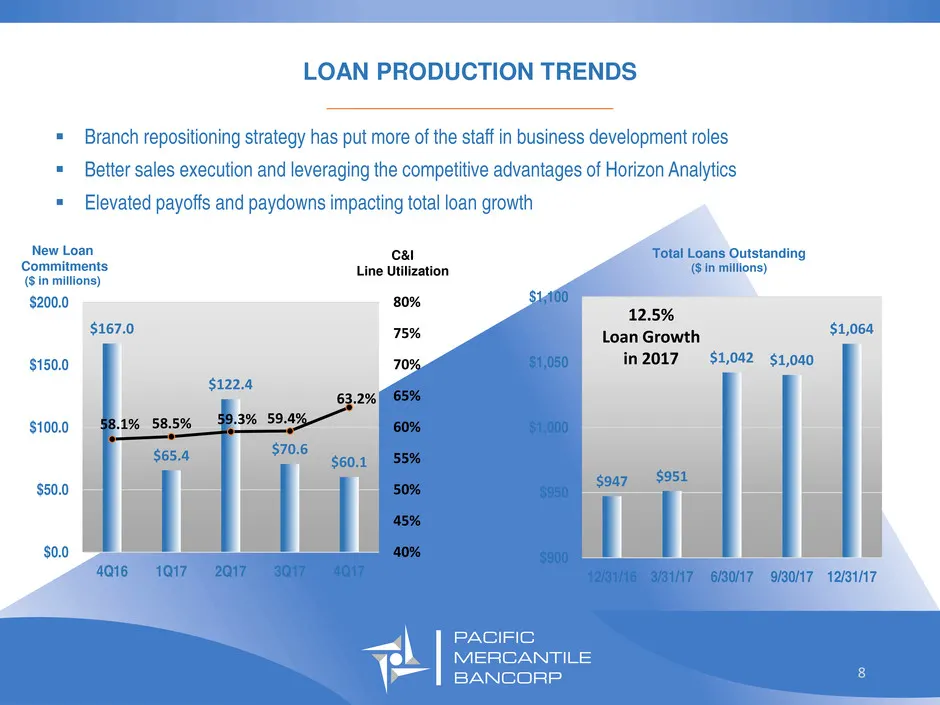
LOAN PRODUCTION TRENDS _________________________________ 8 $167.0 $65.4 $122.4 $70.6 $60.1 58.1% 58.5% 59.3% 59.4% 63.2% 40% 45% 50% 55% 60% 65% 70% 75% 80% $0.0 $50.0 $100.0 $150.0 $200.0 4Q16 1Q17 2Q17 3Q17 4Q17 New Loan Commitments ($ in millions) Branch repositioning strategy has put more of t
Slide 9: Asset Quality
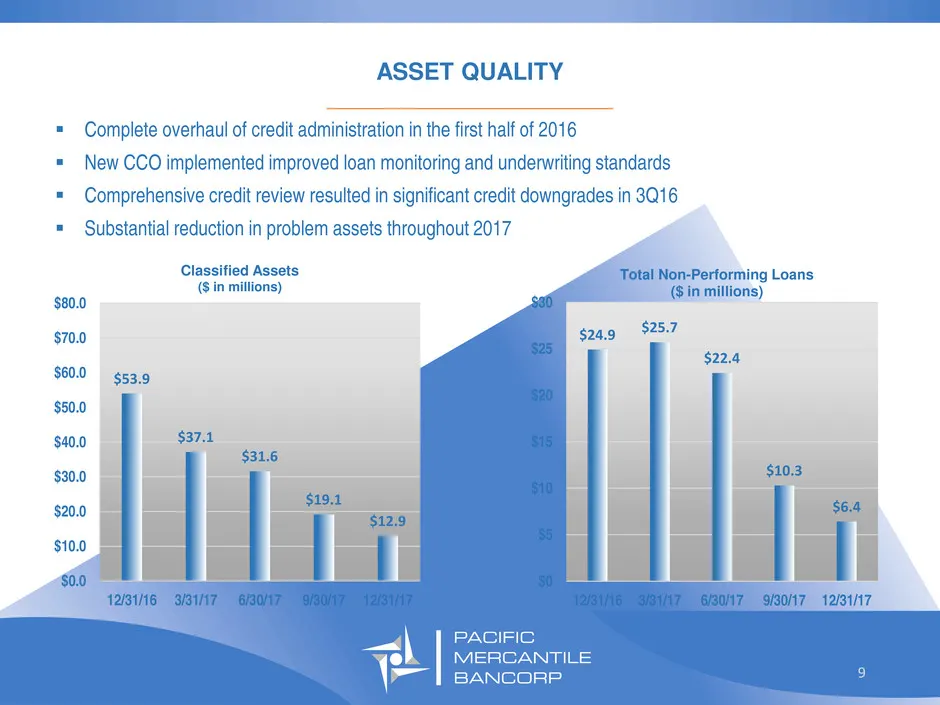
ASSET QUALITY _________________________________ 9 $53.9 $37.1 $31.6 $19.1 $12.9 $0.0 $10.0 $20.0 $30.0 $40.0 $50.0 $60.0 $70.0 $80.0 12/31/16 3/31/17 6/30/17 9/30/17 12/31/17 Classified Assets ($ in millions) Complete overhaul of credit administration in the first half of 2016 New CCO implemente
Slide 10: Deposit Composition Focused on Core Deposits
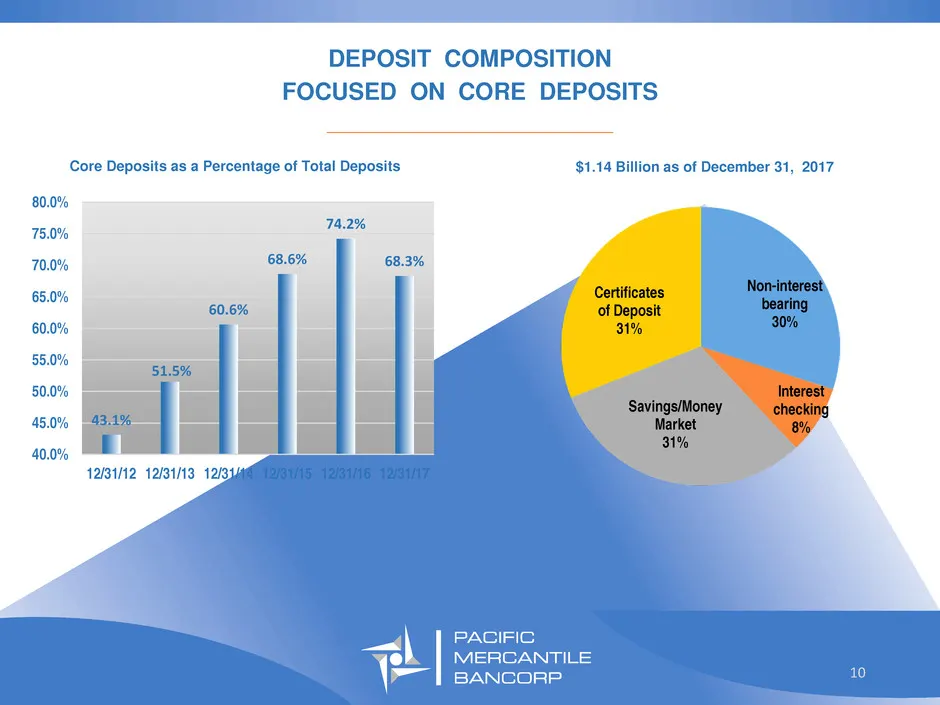
DEPOSIT COMPOSITION FOCUSED ON CORE DEPOSITS _________________________________ $1.14 Billion as of December 31, 2017 Non-interest bearing 30% Interest checking 8% Savings/Money Market 31% Certificates of Deposit 31% Core Deposits as a Percentage of Total Deposits 10 43.1% 51.5% 60.6% 68.6% 74.2% 68.
Slide 11: Well Positioned for Higher Interest Rates
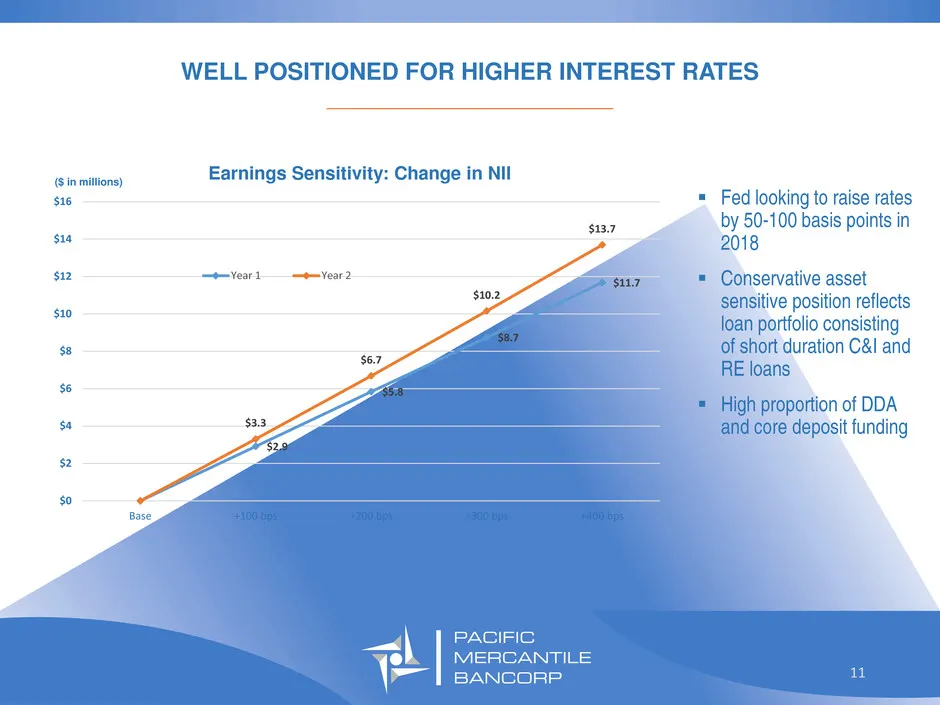
WELL POSITIONED FOR HIGHER INTEREST RATES _________________________________ 11 $2.9 $5.8 $8.7 $11.7 $3.3 $6.7 $10.2 $13.7 $0 $2 $4 $6 $8 $10 $12 $14 $16 Base +100 bps +200 bps +300 bps +400 bps Earnings Sensitivity: Change in NII Year 1 Year 2 ($ in millions) Fed looking to raise rates by 50-100 b
Slide 12: Well Positioned for Higher Interest Rates: Balance Sheet Highlights
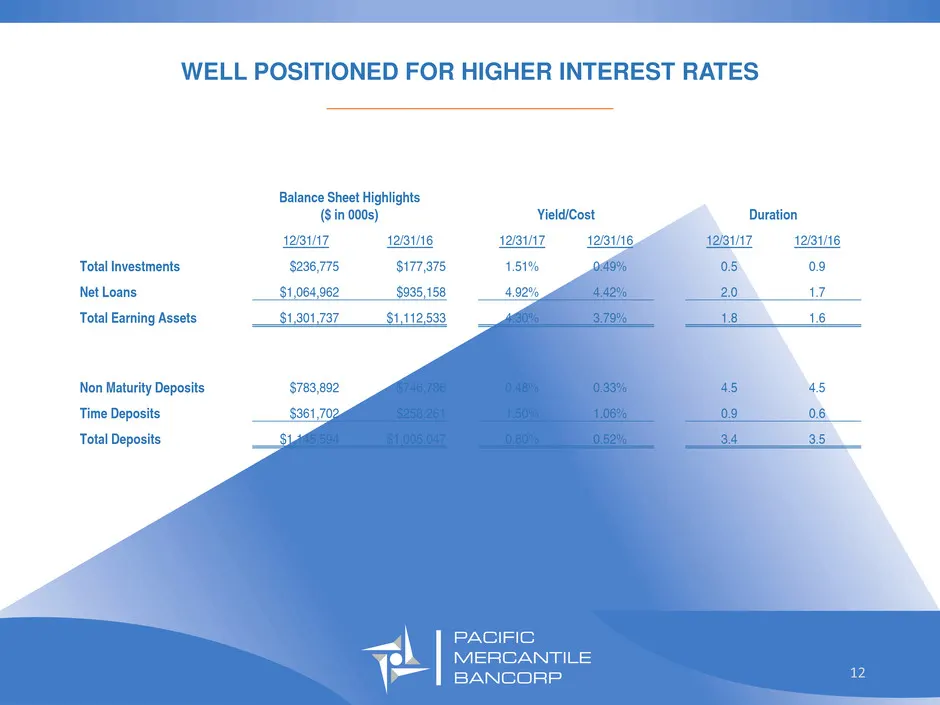
WELL POSITIONED FOR HIGHER INTEREST RATES _________________________________ 12 Balance Sheet Highlights ($ in 000s) Yield/Cost Duration 12/31/17 12/31/16 12/31/17 12/31/16 12/31/17 12/31/16 Total Investments $236,775 $177,375 1.51% 0.49% 0.5 0.9 Net Loans $1,064,962 $935,158 4.92% 4.42% 2.0 1.7 Tota
Slide 13: Improving Operating Leverage
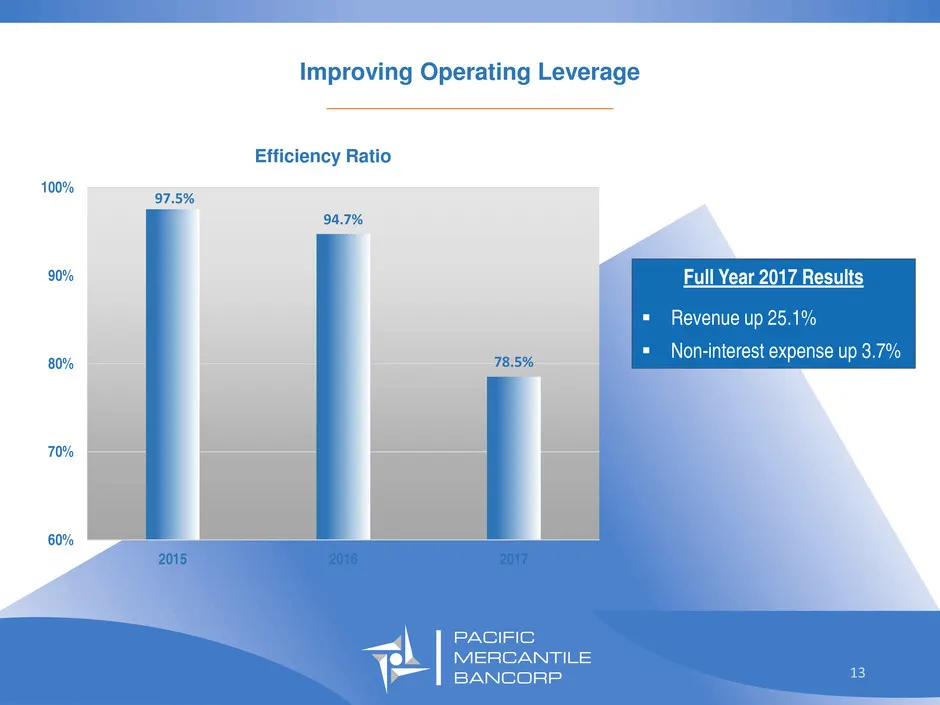
Improving Operating Leverage _________________________________ 13 97.5% 94.7% 78.5% 60% 70% 80% 90% 100% 2015 2016 2017 Efficiency Ratio Full Year 2017 Results Revenue up 25.1% Non-interest expense up 3.7%
Slide 14: Strong Capital Position
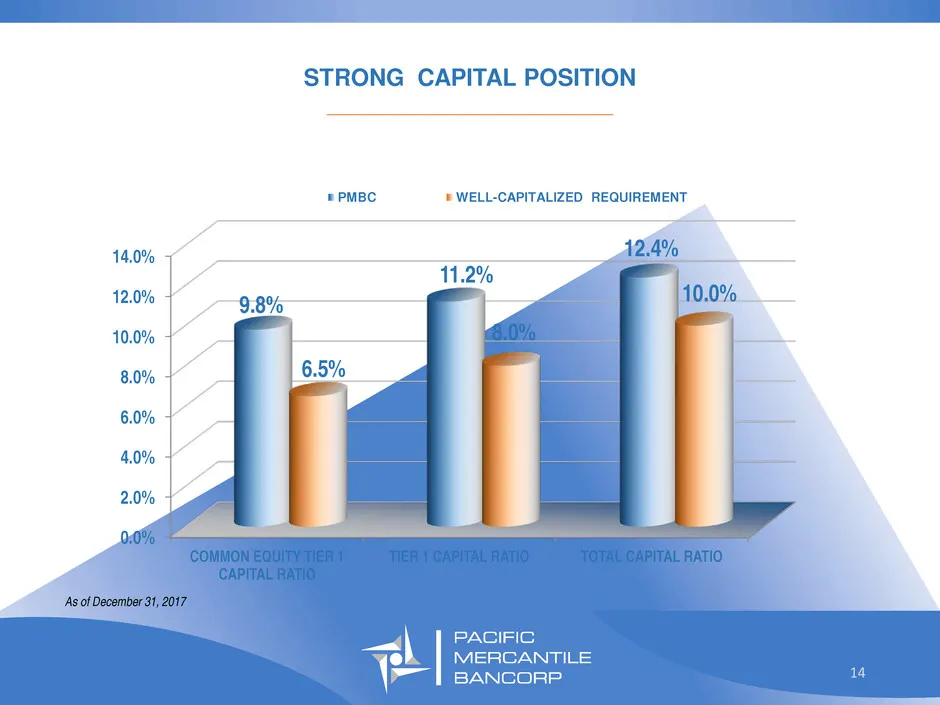
STRONG CAPITAL POSITION _________________________________ 0.0% 2.0% 4.0% 6.0% 8.0% 10.0% 12.0% 14.0% COMMON EQUITY TIER 1 CAPITAL RATIO TIER 1 CAPITAL RATIO TOTAL CAPITAL RATIO 9.8% 11.2% 12.4% 6.5% 8.0% 10.0% PMBC WELL-CAPITALIZED REQUIREMENT 14 As of December 31, 2017
Slide 15: Outlook
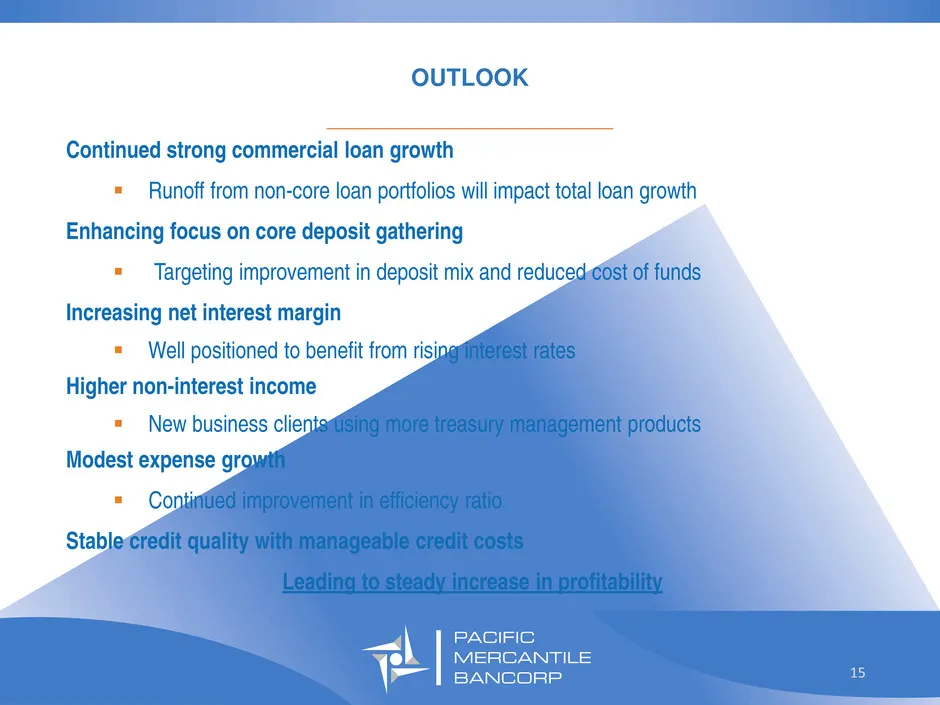
OUTLOOK _________________________________ Continued strong commercial loan growth Runoff from non-core loan portfolios will impact total loan growth Enhancing focus on core deposit gathering Targeting improvement in deposit mix and reduced cost of funds Increasing net interest margin Well posi
Slide 16: Investor Relations
I n v e s t o r R e l a t i o n s : C u r t C h r i s t i a n s s e n ( 7 1 4 ) 4 3 8 - 2 5 3 1 C u r t . c h r i s t i a n s s e n @ p m b a n k . c o m 16
Source: SEC EDGAR · 8-K filed Jan 31, 2018
More decks from Pacific Mercantile Bancorp
 Q1 2021 Earnings Presentation18 slides · Apr 26, 2021
 Merger or Acquisition (March 2021)9 slides · Mar 23, 2021
 Q4 2020 Earnings Presentation22 slides · Jan 25, 2021
 Q3 2020 Earnings Presentation23 slides · Nov 2, 2020
 Corporate Update (September 2020)25 slides · Sep 8, 2020
 Corporate Update (August 2020)25 slides · Aug 5, 2020