South Jersey Industries — American Gas Association Financial Forum 2016
23 slides from South Jersey Industries's conference presentation, May 10, 2016

Slide 1: American Gas Association Financial Forum May 15-17, 2016
American Gas Association Financial Forum May 15 - 17, 2016
Slide 2: Forward Looking Statements
Forward Looking Statements 2 Certain statements contained in this presentation may qualify as “forward - looking statements” within the meaning of Section 27A of the Securities Act of 1933 and Section 21E of the Securities Exchange Act of 1934. All statements other than statements of historical fact
Slide 3: South Jersey Industries: Overview
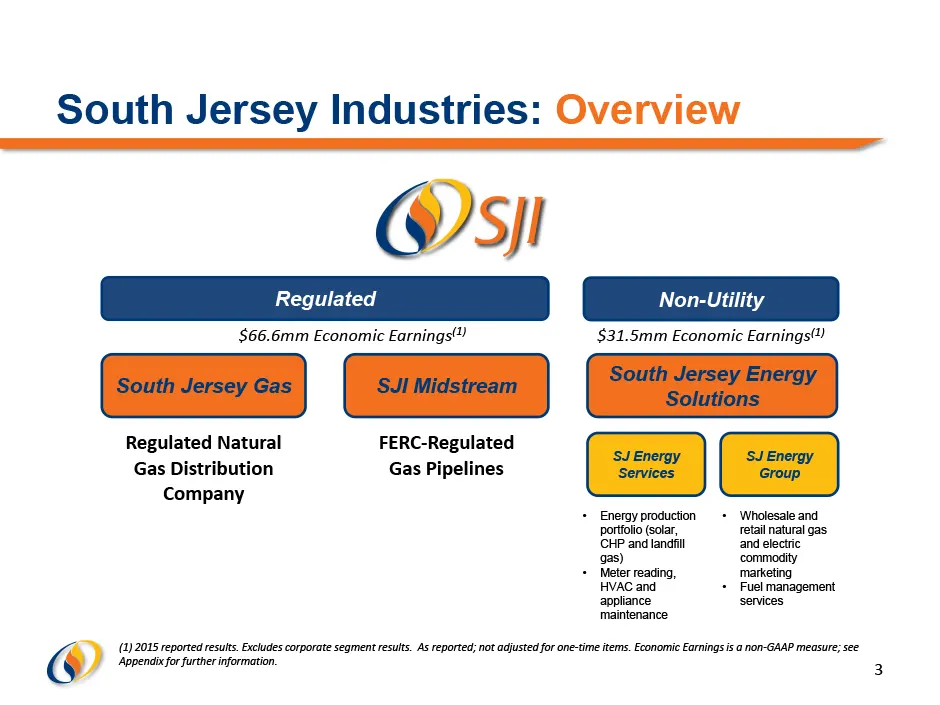
South Jersey Industries: Overview 3 South Jersey Gas SJI Midstream South Jersey Energy Solutions Regulated N atural Gas Distribution Company FERC - Regulated Gas Pipelines SJ Energy Services SJ Energy Group • Energy production portfolio (solar, CHP and landfill gas) • Meter reading, HVAC and applian
Slide 4: Highlights
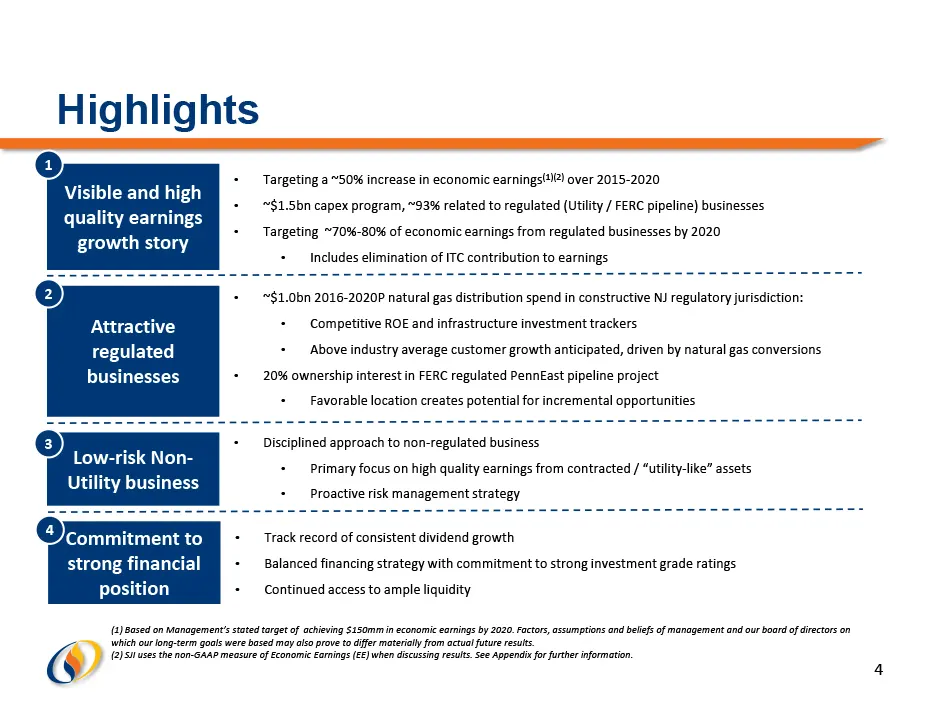
Highlights 4 Visible and high quality earnings growth story Attractive regulated businesses Low - risk Non - Utility business • Targeting a ~50% increase in economic earnings (1)(2) over 2015 - 2020 • ~$1.5bn capex program, ~93% related to regulated (Utility / FERC pipeline) businesses • Targeting ~
Slide 5: South Jersey Industries: Anticipated Capex
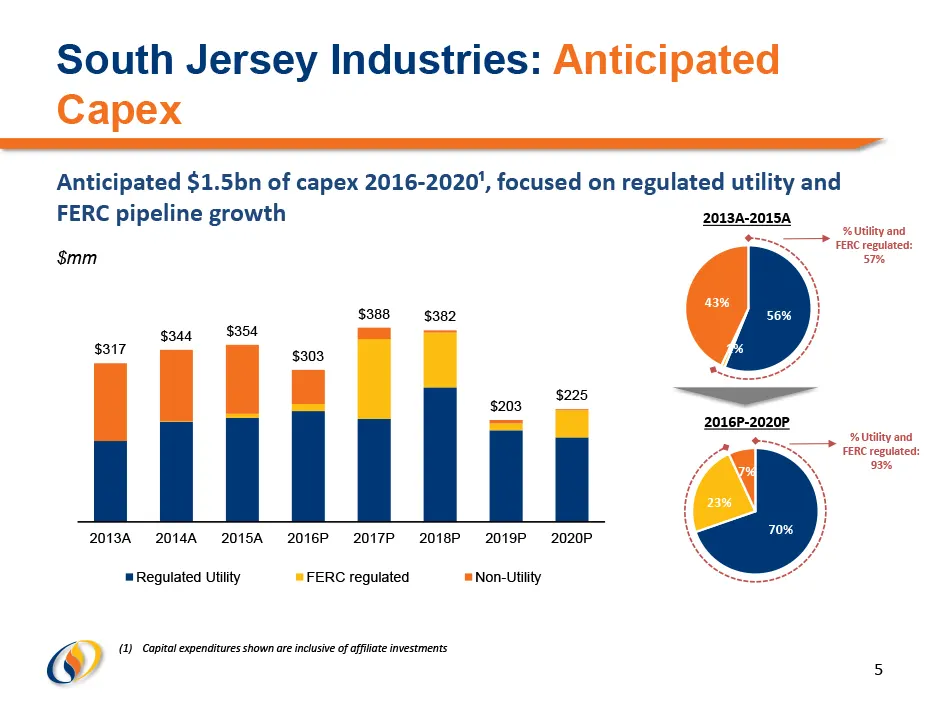
70% 23% 7% 56% 1% 43% South Jersey Industries: Anticipated Capex 5 $mm Anticipated $1.5bn of capex 2016 - 2020¹, focused on regulated utility and FERC pipeline growth (1) Capital expenditures shown are inclusive of affiliate investments 2013A - 2015A 2016P - 2020P % Utility and FERC regulated: 57% %
Slide 6: Economic Earnings Profile
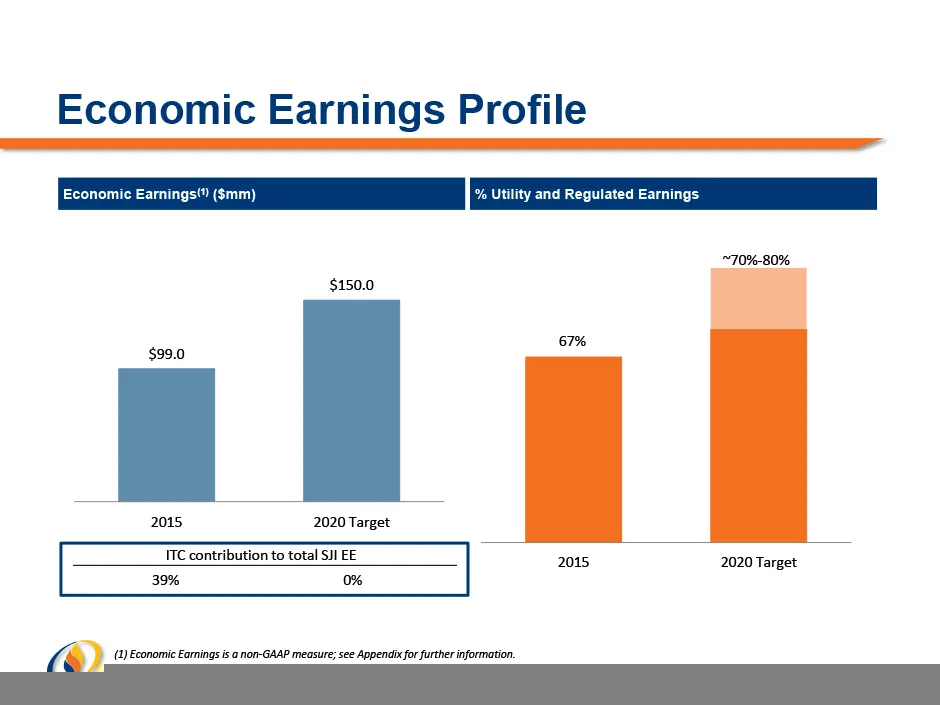
Economic Earnings Profile 6 (1) Economic Earnings is a non - GAAP measure; see Appendix for further information. $99.0 $150.0 2015 2020 Target Economic Earnings (1) ($mm) % Utility and Regulated Earnings 67% ~70% - 80% 2015 2020 Target ITC contribution to total SJI EE 39% 0%
Slide 7: Regulated Businesses
Regulated Businesses WsyI
Slide 8: South Jersey Gas: Regulated Utility Profile
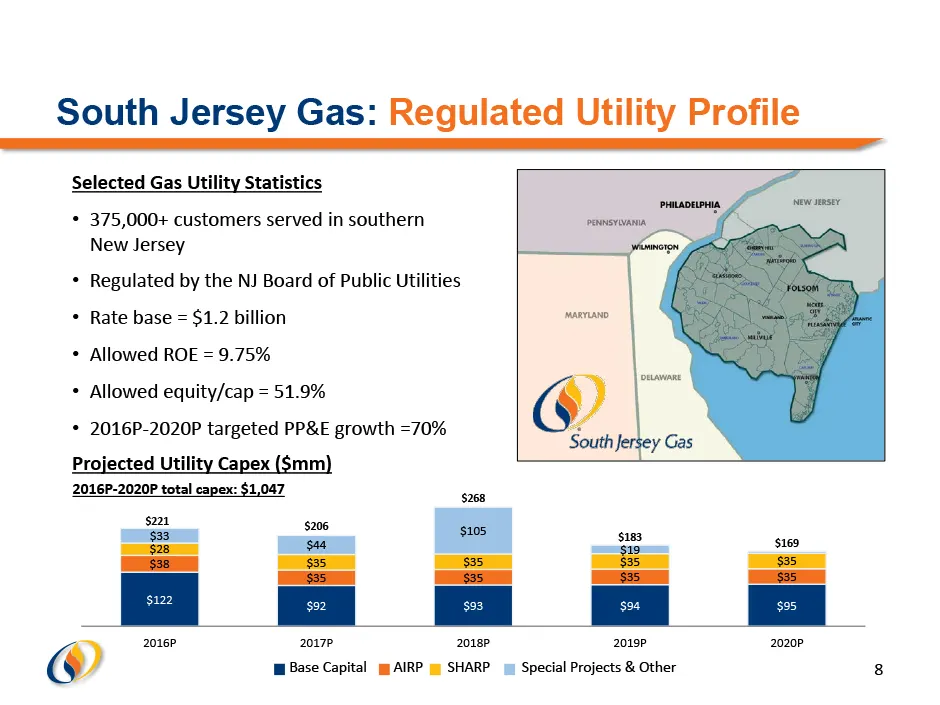
South Jersey Gas: Regulated Utility Profile 8 Base Capital AIRP SHARP Special Projects & Other Projected Utility Capex ($mm) Selected Gas Utility Statistics • 375,000+ customers served in southern New Jersey • Regulated by the NJ Board of Public Utilities • Rate base = $1.2 billion • Allowed ROE = 9
Slide 9: Utility Growth Drivers
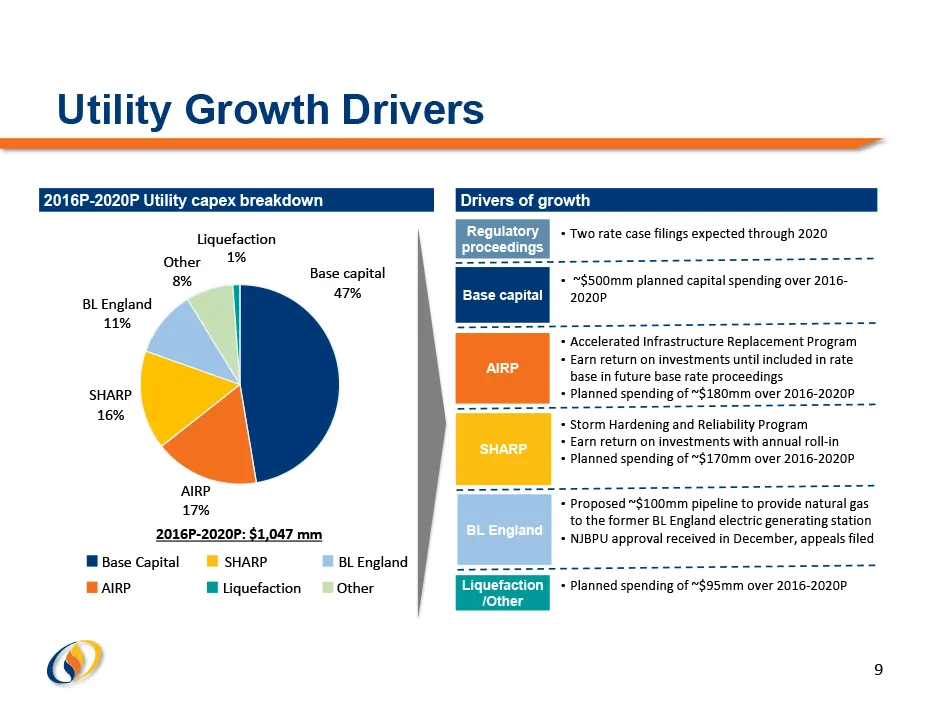
Utility Growth Drivers 9 • Accelerated Infrastructure Replacement Program • Earn return on investments until included in rate base in future base rate proceedings • Planned spending of ~$180mm over 2016 - 2020P 2016P - 2020P Utility capex breakdown • Includes estimates for depreciation, interest, O&
Slide 10: Utility Customer Trends and Drivers
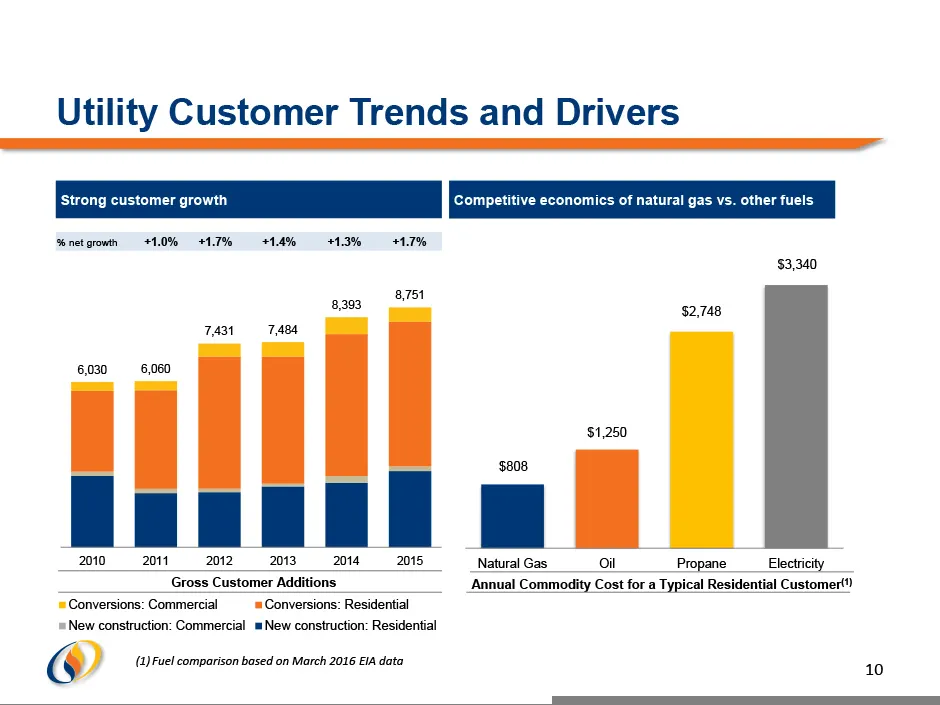
Conversions: Commercial Conversions: Residential New construction: Commercial New construction: Residential Utility Customer Trends and Drivers 10 % net growth + 1.0 % +1.7% +1.4% +1.3% + 1.7 % Strong customer growth $808 $1,250 $2,748 $3,340 Natural Gas Oil Propane Electricity Competitive economics
Slide 11: FERC Pipeline Expansion: Overview
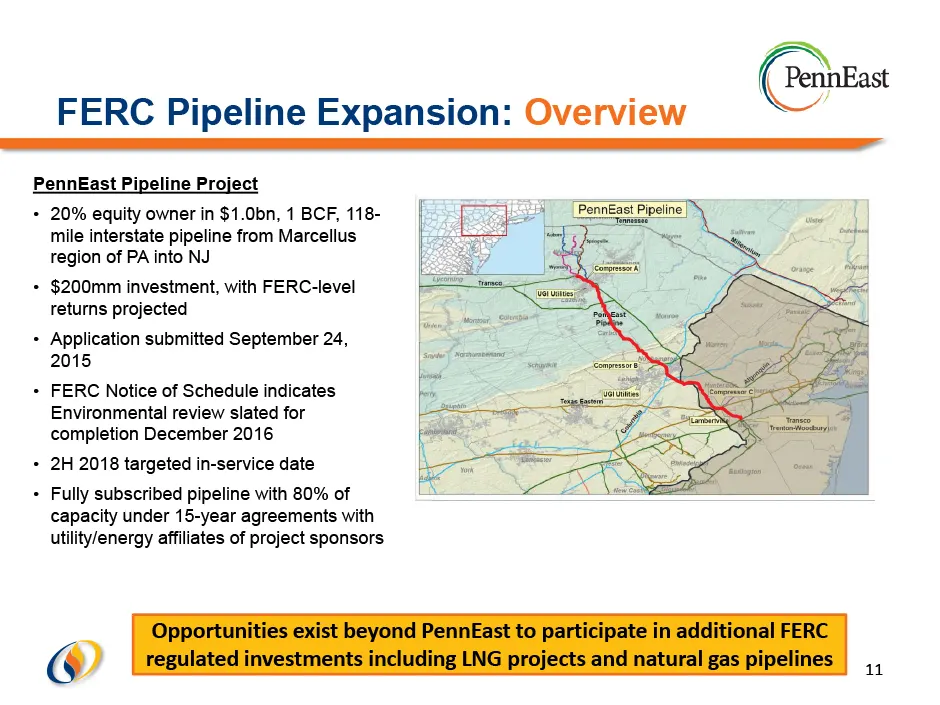
FERC Pipeline Expansion: Overview PennEast Pipeline Project • 20% equity owner in $1.0bn , 1 BCF, 118 - mile interstate pipeline from Marcellus region of PA into NJ • $ 200mm investment, with FERC - level returns projected • Application submitted September 24, 2015 • FERC Notice of Schedule indicate

Slide 12: Non-Utility Business
Non-Utility Business WsyI
Slide 13: Non-Utility Businesses: Overview
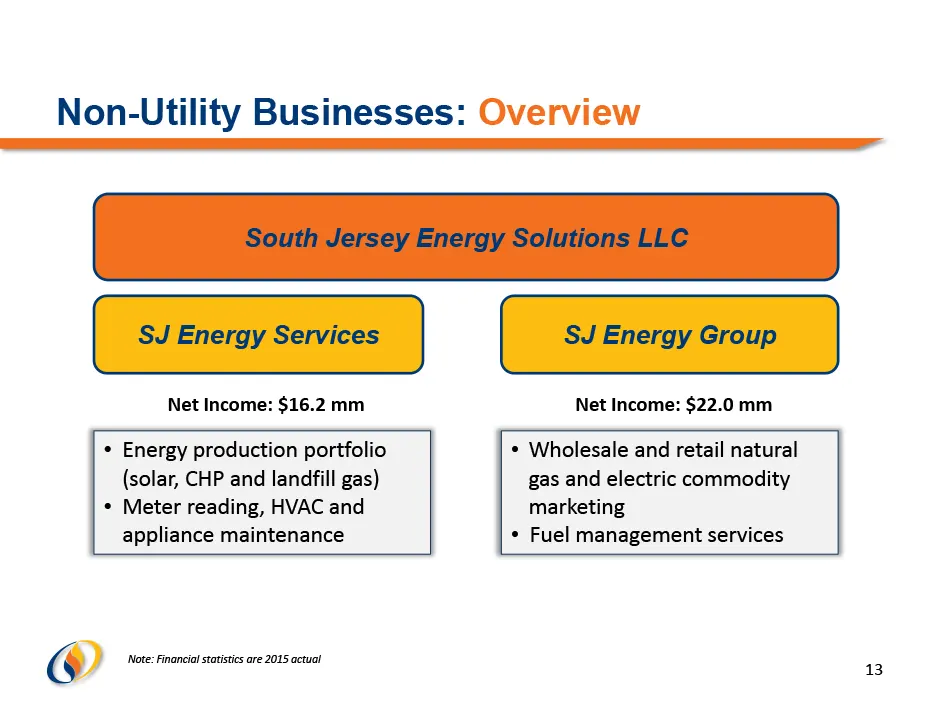
Non - Utility Businesses: Overview 13 South Jersey Energy Solutions LLC SJ Energy Services SJ Energy Group Net Income: $22.0 mm Note: Financial statistics are 2015 actual Net Income: $ 16.2 mm • Wholesale and retail natural gas and electric commodity marketing • Fuel management services • Energy pro
Slide 14: Non-Utility Growth Summary
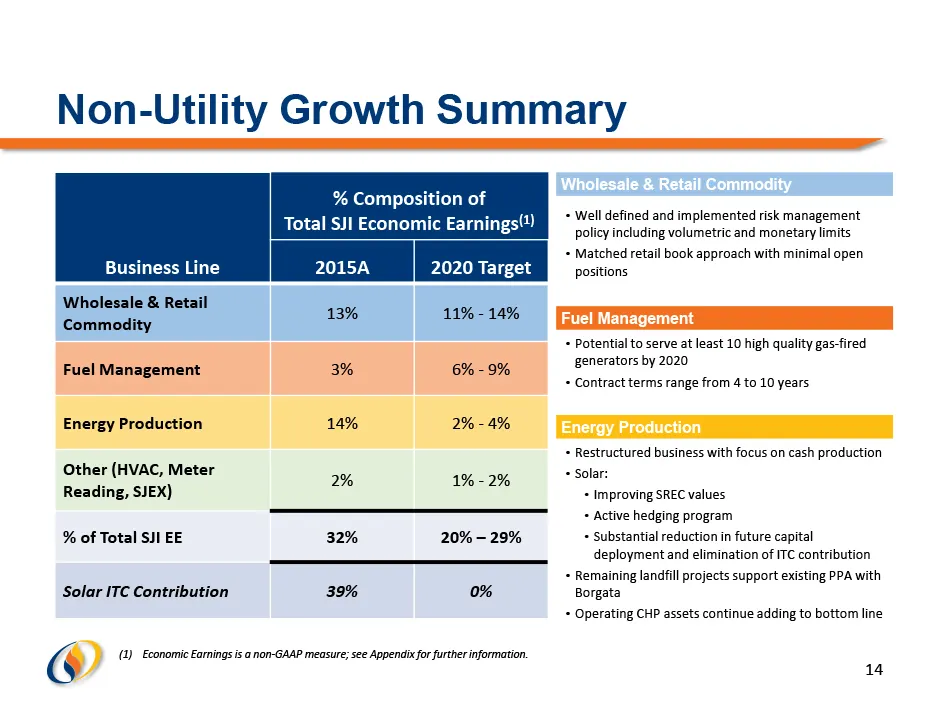
Non - Utility Growth Summary 14 Business Line % Composition of Total SJI Economic Earnings (1) 2015A 2020 Target Wholesale & Retail Commodity 13% 11% - 14% Fuel Management 3% 6% - 9% Energy Production 14% 2% - 4% Other (HVAC, Meter Reading, SJEX) 2% 1% - 2% % of Total SJI EE 32% 20% – 29% Solar ITC
Slide 15: Financial Overview
Financial Overview WsyI
Slide 16: Consistent Earnings and Dividend Growth
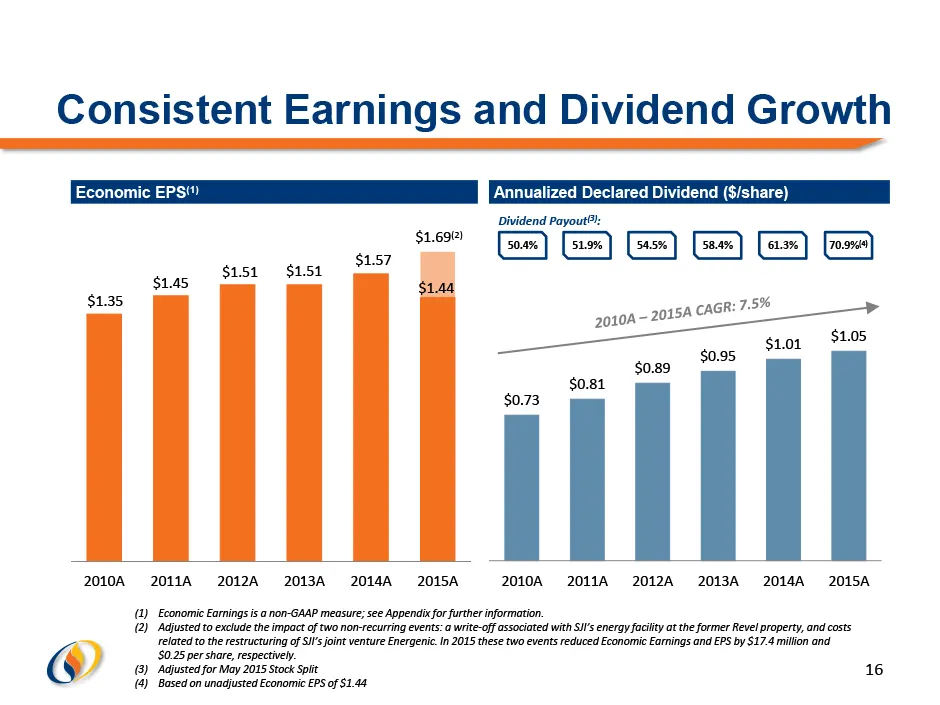
Consistent Earnings and Dividend Growth 16 (1) Economic Earnings is a non - GAAP measure; see Appendix for further information. (2) Adjusted to exclude the impact of two non - recurring events: a write - off associated with SJI’s energy facility at the former Revel property, and costs related to the
Slide 17: Prudent Financial Management
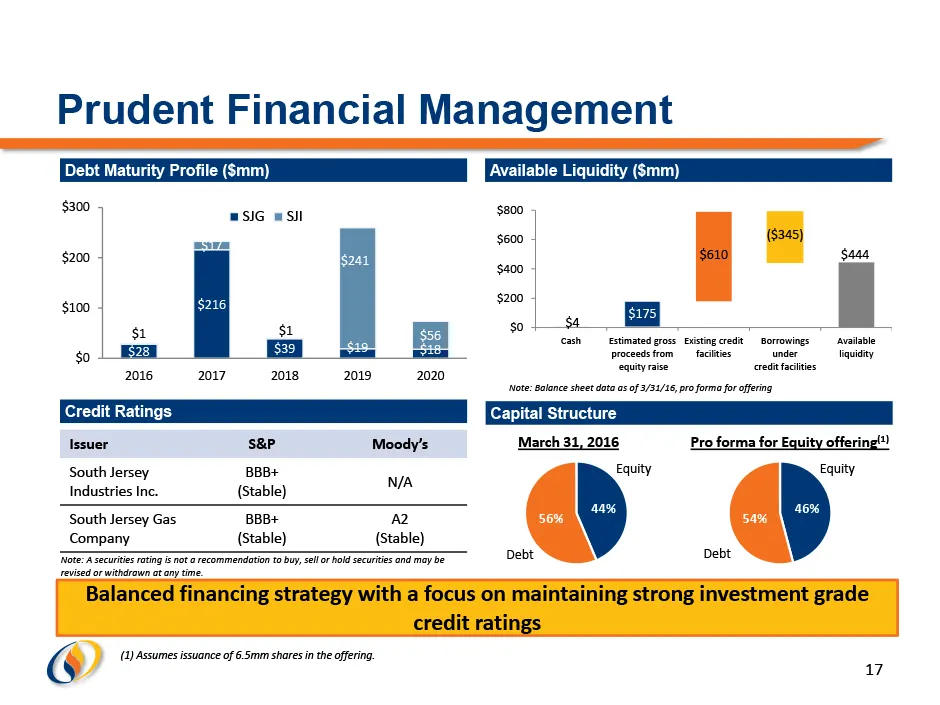
Prudent Financial Management 17 $4 $175 $610 ($345) $444 $0 $200 $400 $600 $800 Cash Estimated gross proceeds from equity raise Existing credit facilities Borrowings under credit facilities Available liquidity $28 $216 $39 $19 $18 $1 $17 $1 $241 $56 $0 $100 $200 $300 2016 2017 2018 2019 2020 SJG SJI
Slide 18: Highlights
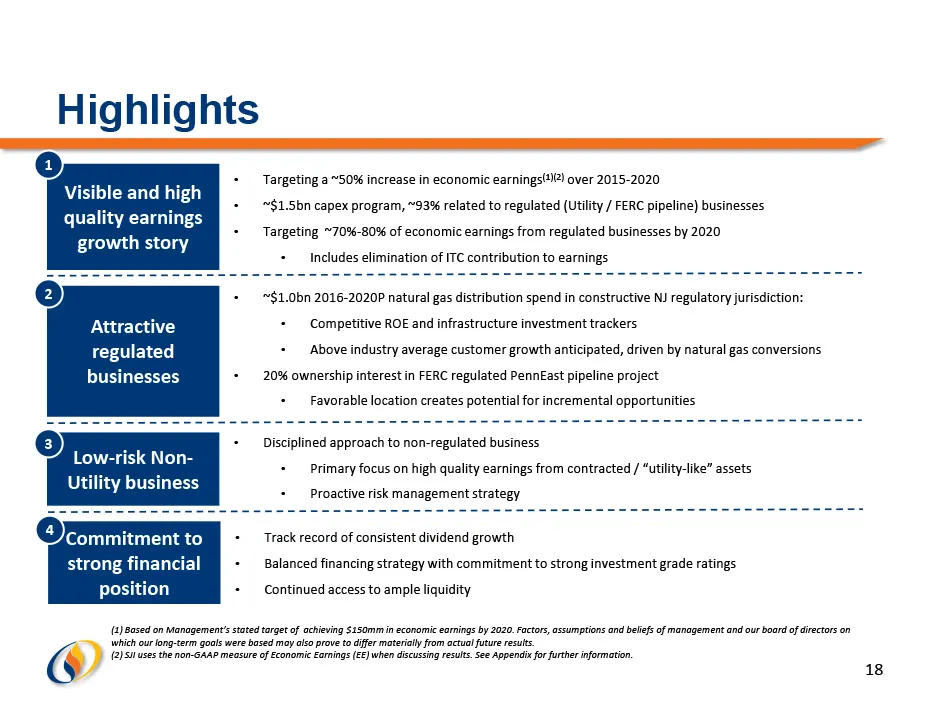
Highlights 18 Visible and high quality earnings growth story Attractive regulated businesses Low - risk Non - Utility business • Targeting a ~50% increase in economic earnings (1)(2) over 2015 - 2020 • ~$1.5bn capex program, ~93% related to regulated (Utility / FERC pipeline) businesses • Targeting
Slide 19: Appendix
Appendix WsyI
Slide 20: Explanation of Non-GAAP Financial Measures
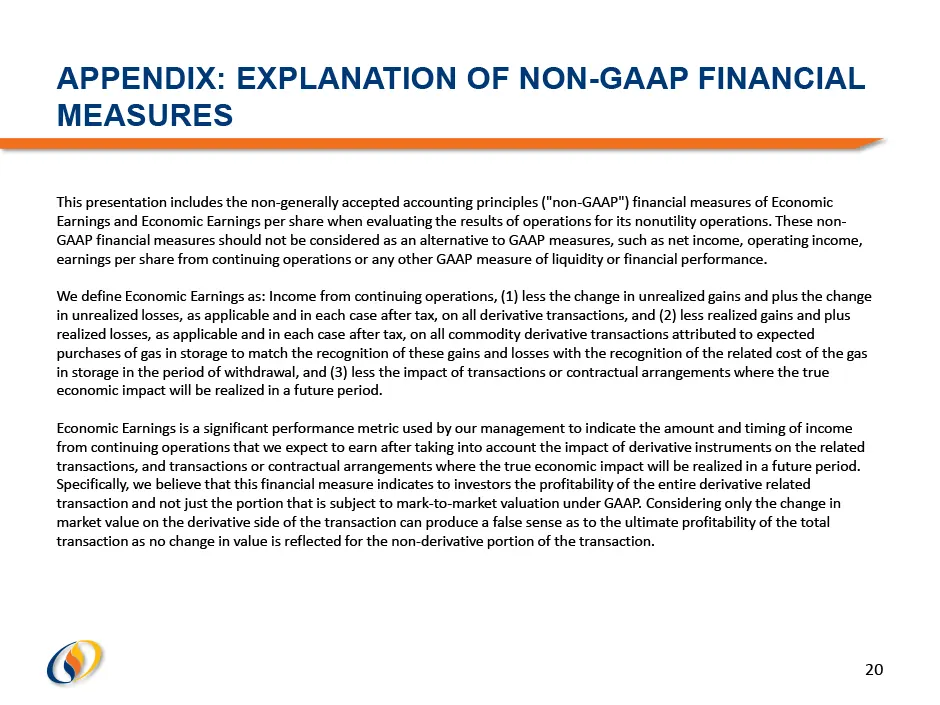
APPENDIX: EXPLANATION OF NON - GAAP FINANCIAL MEASURES 20 This presentation includes the non - generally accepted accounting principles ("non - GAAP") financial measures of Economic Earnings and Economic Earnings per share when evaluating the results of operations for its nonutility operations. Thes
Slide 21: Reconciliation of Non-GAAP Data – Economic Earnings
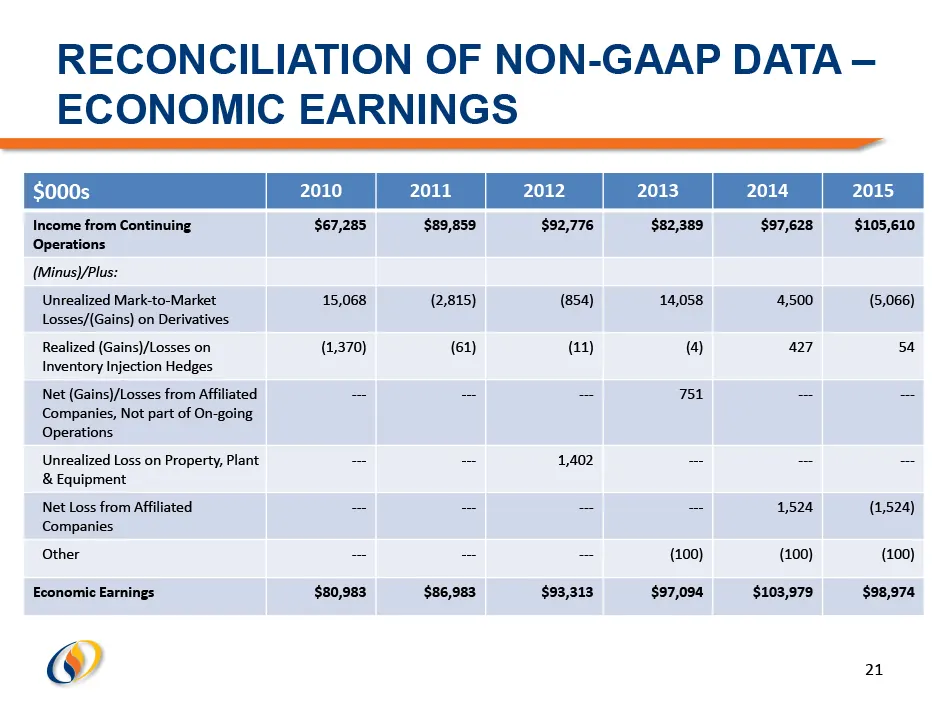
RECONCILIATION OF NON - GAAP DATA – ECONOMIC EARNINGS $000s 2010 2011 2012 2013 2014 2015 Income from Continuing Operations $67,285 $89,859 $92,776 $82,389 $97,628 $105,610 (Minus)/Plus: Unrealized Mark - to - Market Losses/(Gains) on Derivatives 15,068 (2,815) (854) 14,058 4,500 (5,066) Realized (G
Slide 22: Reconciliation of Non-GAAP Data – Economic Earnings Per Share
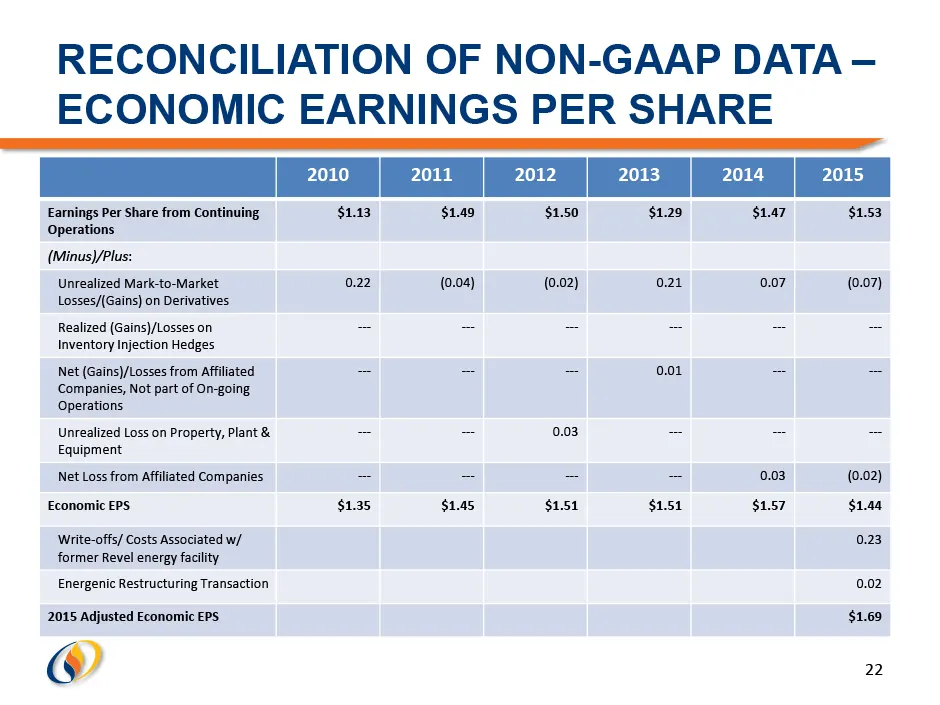
RECONCILIATION OF NON - GAAP DATA – ECONOMIC EARNINGS PER SHARE 2010 2011 2012 2013 2014 2015 Earnings Per Share from Continuing Operations $1.13 $1.49 $1.50 $1.29 $1.47 $1.53 (Minus)/Plus : Unrealized Mark - to - Market Losses/(Gains) on Derivatives 0.22 (0.04) (0.02) 0.21 0.07 (0.07) Realized (Gai
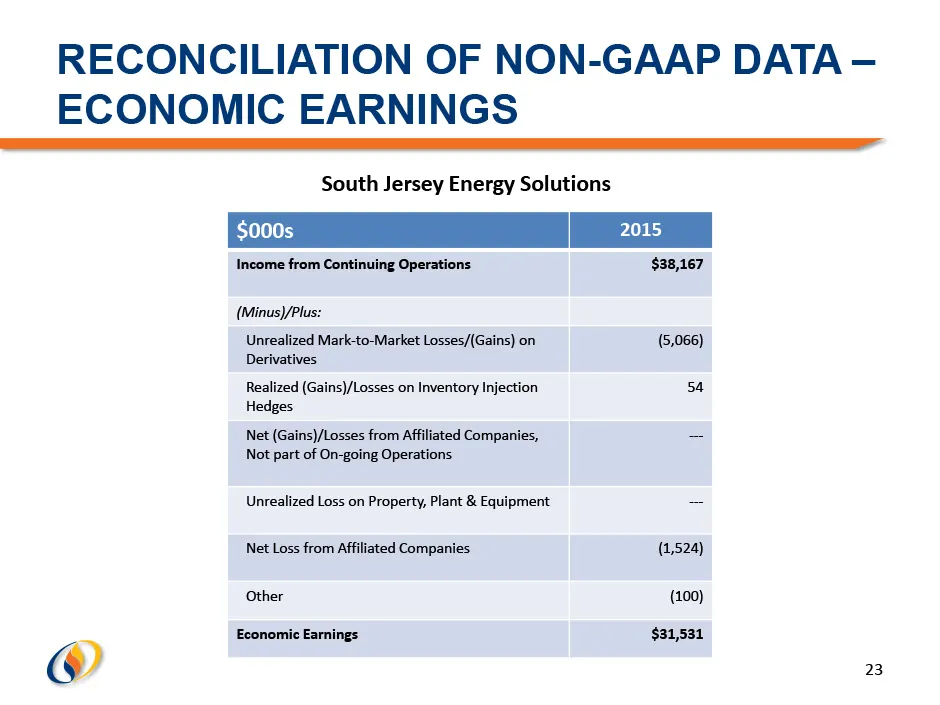
Slide 23: Reconciliation of Non-GAAP Data – Economic Earnings 2015
RECONCILIATION OF NON - GAAP DATA – ECONOMIC EARNINGS $000s 2015 Income from Continuing Operations $38,167 (Minus)/Plus: Unrealized Mark - to - Market Losses/(Gains) on Derivatives (5,066) Realized (Gains)/Losses on Inventory Injection Hedges 54 Net (Gains)/Losses from Affiliated Companies, Not part
Source: SEC EDGAR · 8-K filed May 10, 2016
More decks from South Jersey Industries Inc
 FY2021 Earnings Presentation29 slides · Feb 24, 2022
 Q3 2021 Earnings Presentation31 slides · Nov 3, 2021
 Q2 2021 Earnings Presentation31 slides · Aug 4, 2021
 Investor Day (May 2021)88 slides · May 6, 2021
 FY2020 Earnings Presentation31 slides · Feb 24, 2021
 Q3 2020 Earnings Presentation37 slides · Nov 4, 2020