Scatec ASA · OSL:SCATC
Scatec ASA — Q1 2022 Earnings Presentation
23 slides from Scatec ASA's earnings presentation, May 2022
Slide 1: First quarter 2022: First quarter impacted by Ukraine
First quarter 2022 First quarter impacted by Ukraine
Slide 2: Disclaimer
Disclaimer The following presentation is being made only to, and is only directed at, persons to whom such presentation may lawfully be communicated (’relevant persons’). Any person who is not a relevant person should not rely, act or make assessment on the basis of this presentation or anything inc
Slide 3: Agenda
Agenda • Project update and market outlook Terje Pilskog, CEO • Financial review Mikkel Tørud, CFO 3
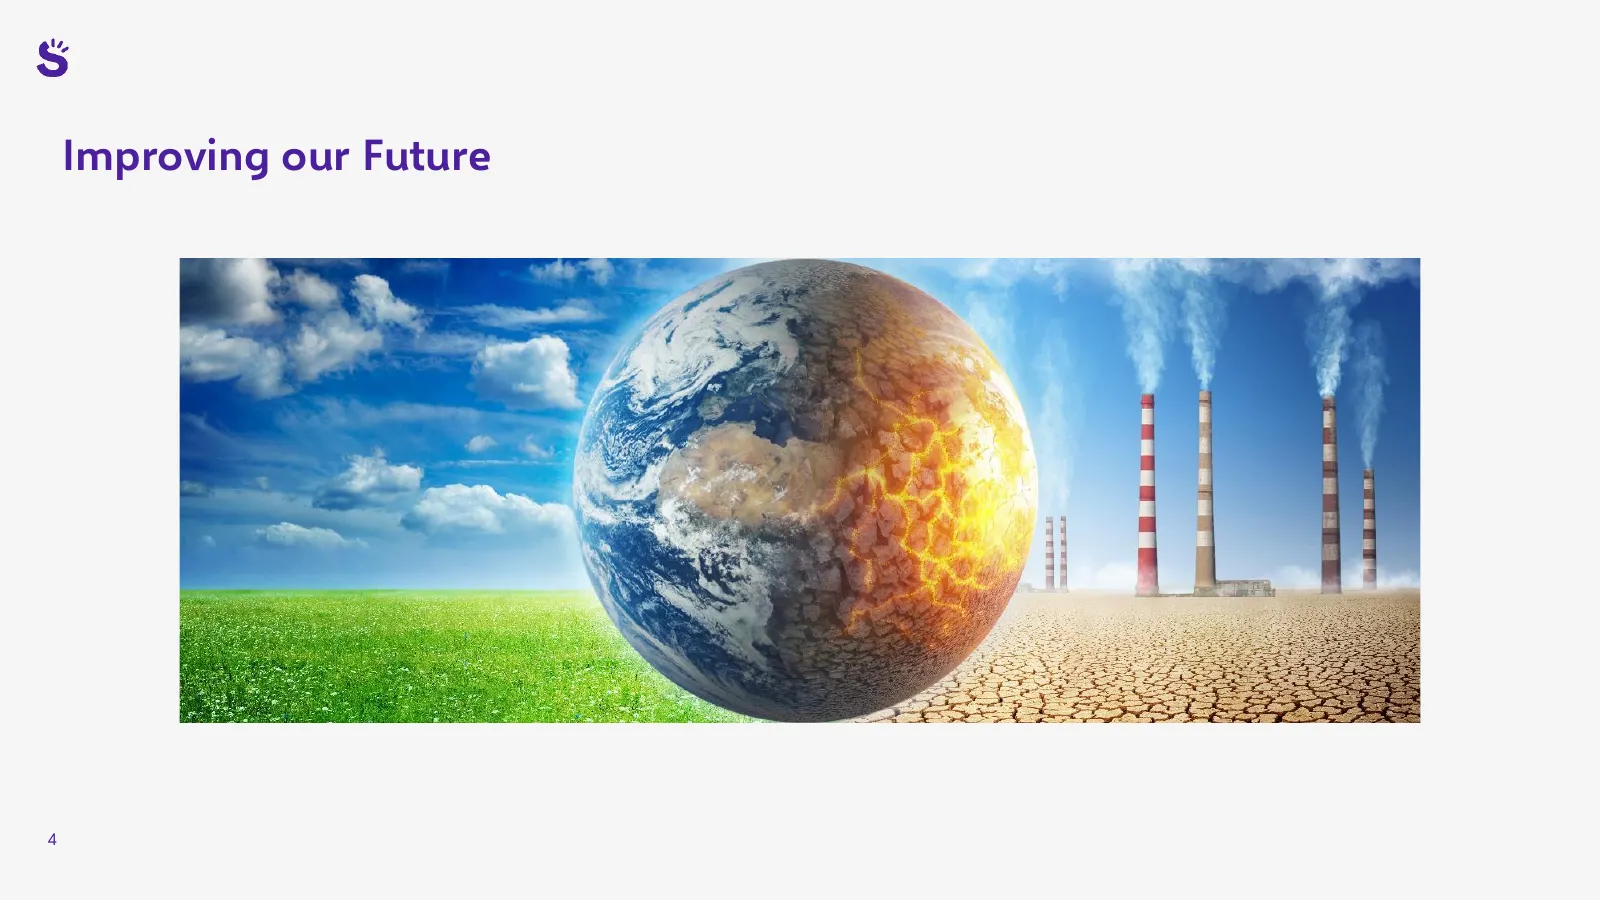
Slide 4: Improving our Future
Improving our Future 4
Slide 5: Renewable energy is becoming increasingly attractive
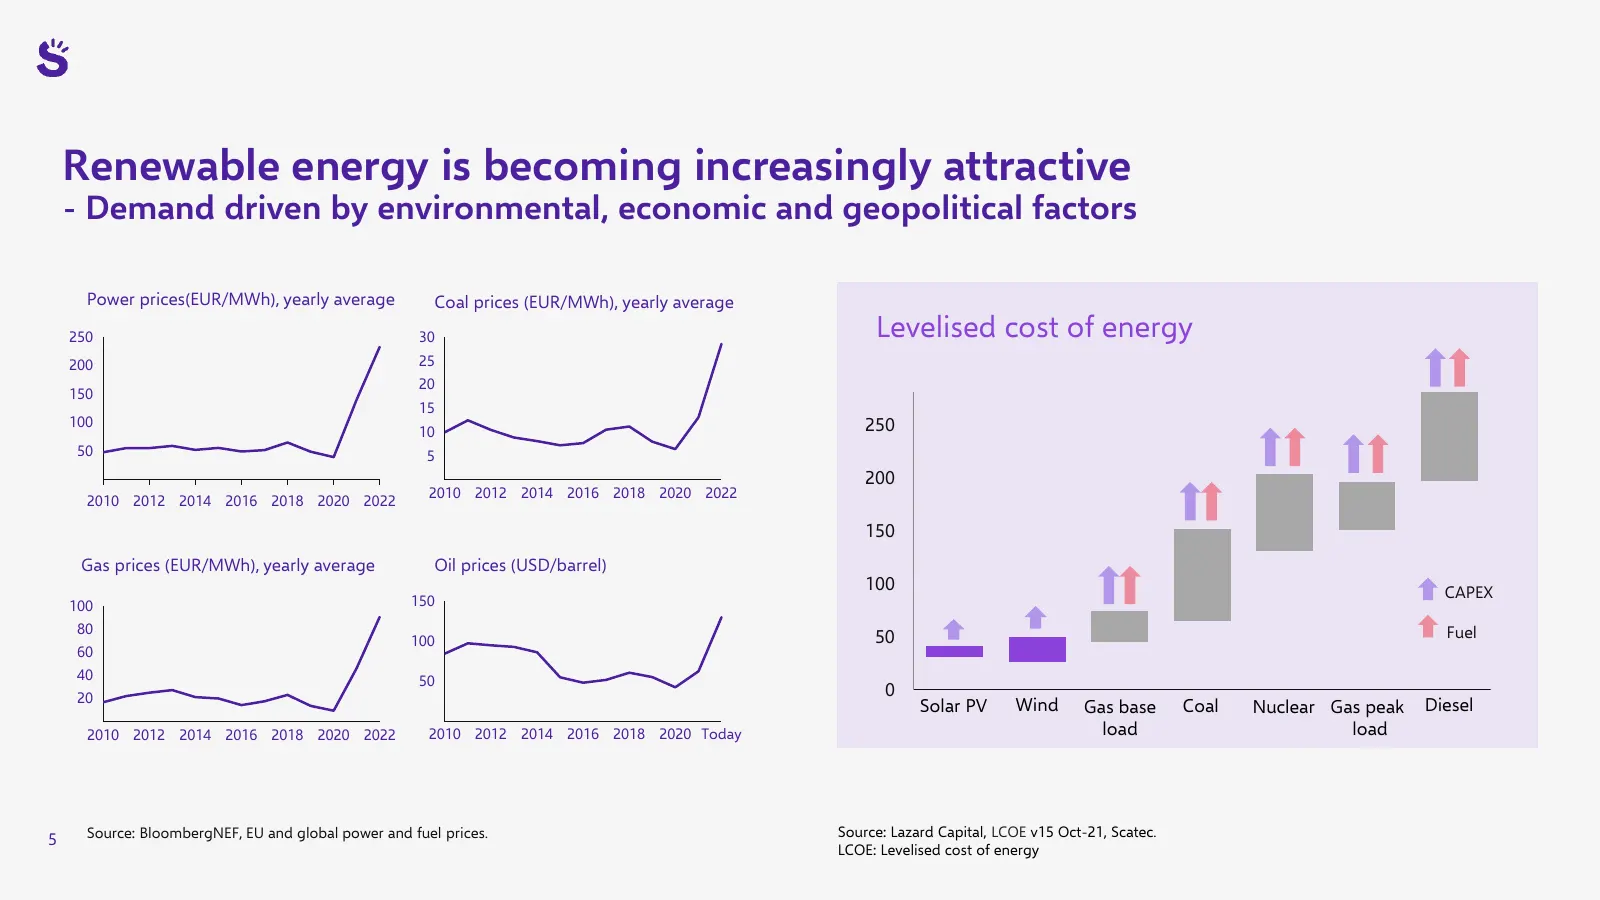
Renewable energy is becoming increasingly attractive - Demand driven by environmental, economic and geopolitical factors Power prices(EUR/MWh), yearly average Coal prices (EUR/MWh), yearly average 250 30 Levelised cost of energy 200 25 20 150 15 100 10 250 50 5 200 2010 2012 2014 2016 2018 2020 2022
Slide 6: First quarter impacted by Ukraine
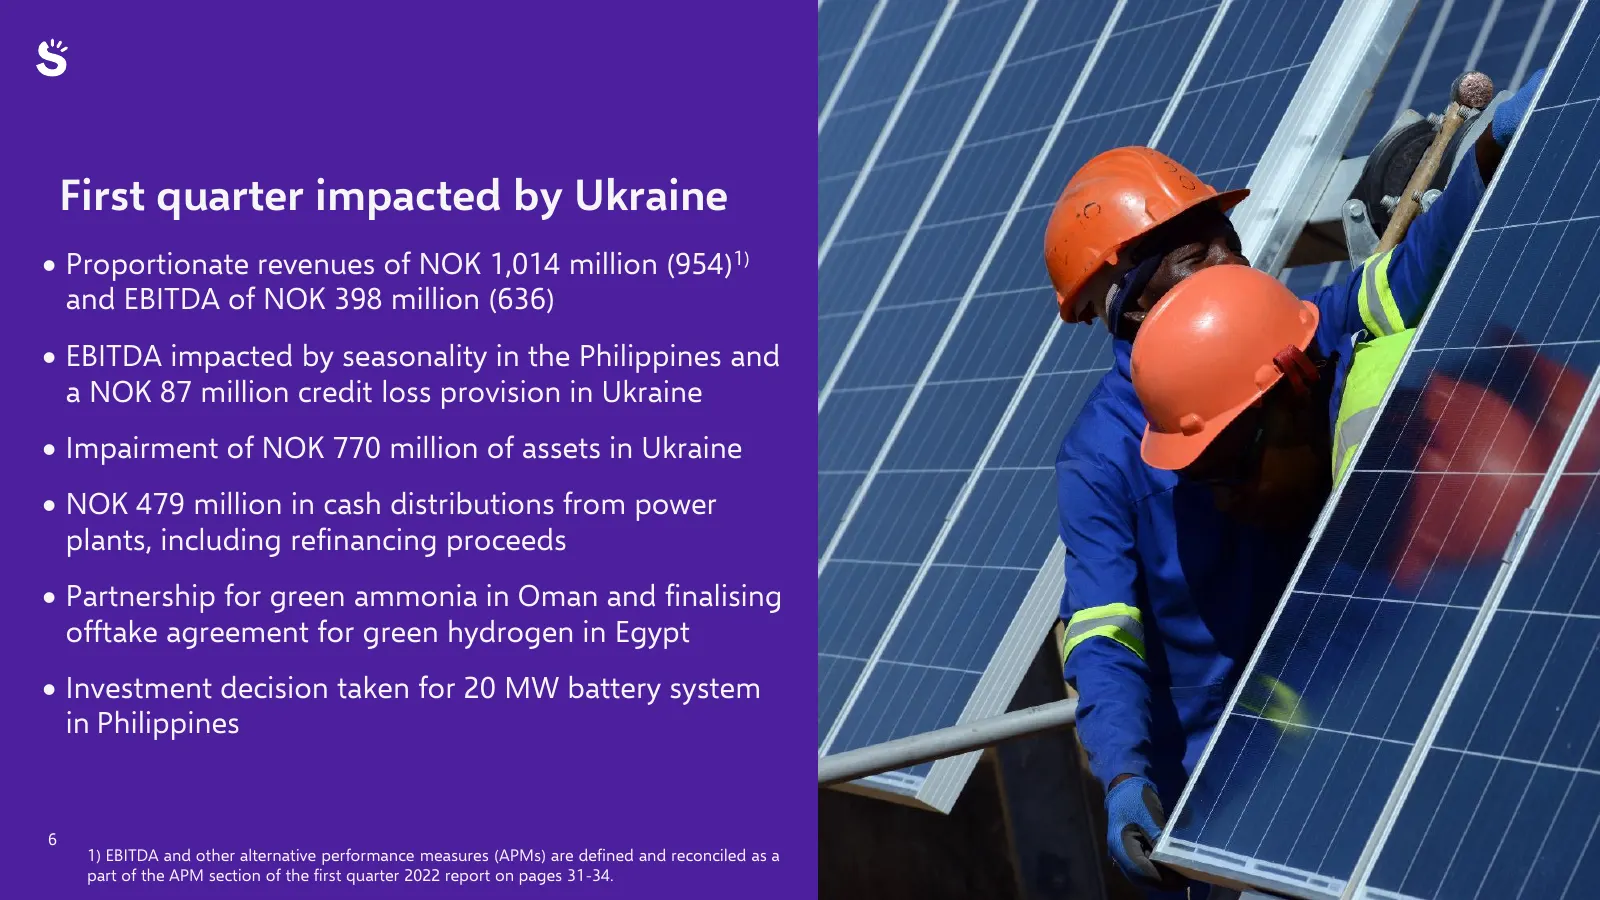
First quarter impacted by Ukraine • Proportionate revenues of NOK 1,014 million (954)1) and EBITDA of NOK 398 million (636) • EBITDA impacted by seasonality in the Philippines and a NOK 87 million credit loss provision in Ukraine • Impairment of NOK 770 million of assets in Ukraine • NOK 479 million
Slide 7: Advancing our position within ancillary services in the Philippines
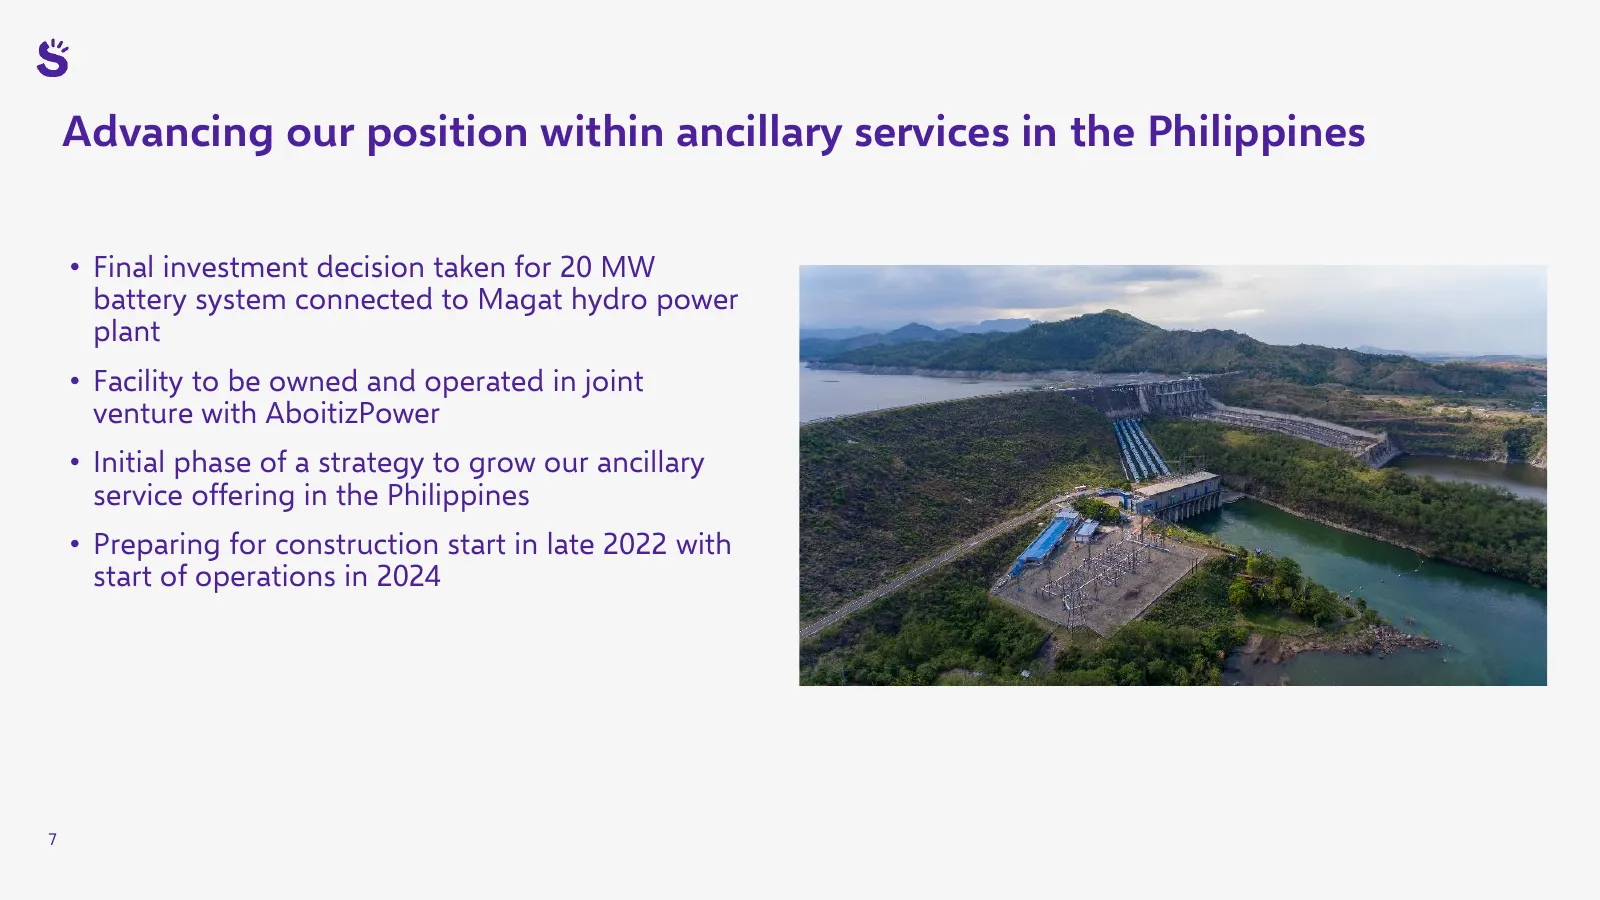
Advancing our position within ancillary services in the Philippines • Final investment decision taken for 20 MW battery system connected to Magat hydro power plant • Facility to be owned and operated in joint venture with AboitizPower • Initial phase of a strategy to grow our ancillary service offer
Slide 8: Project backlog progressing with returns in line with guidance
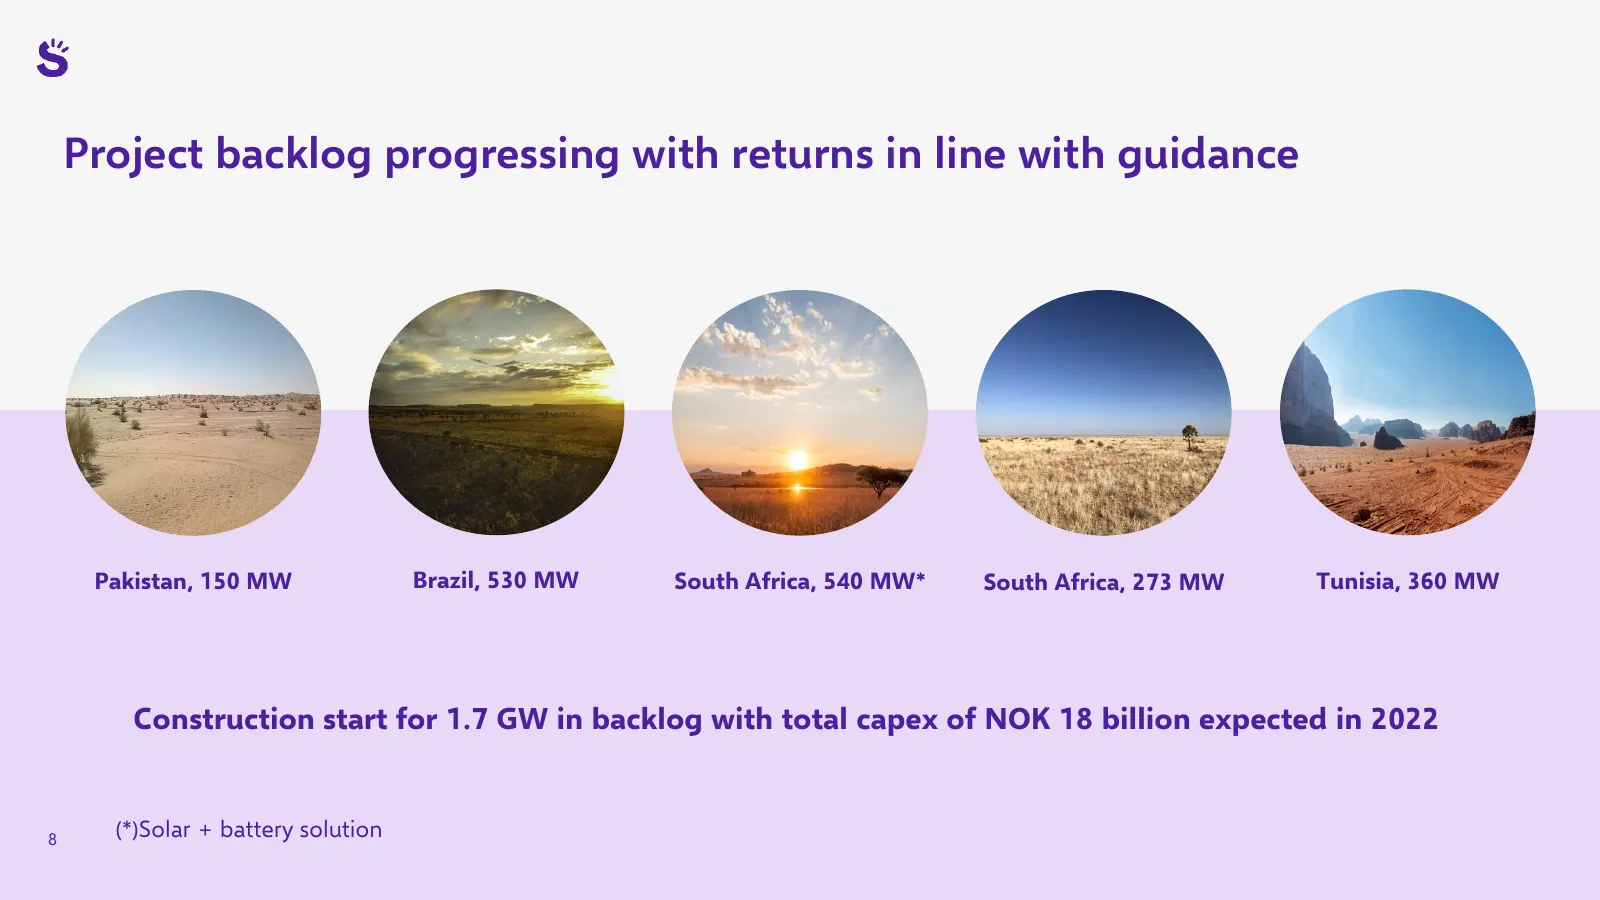
Project backlog progressing with returns in line with guidance Pakistan, 150 MW Brazil, 530 MW South Africa, 540 MW* South Africa, 273 MW Tunisia, 360 MW Construction start for 1.7 GW in backlog with total capex of NOK 18 billion expected in 2022 8 (*)Solar + battery solution
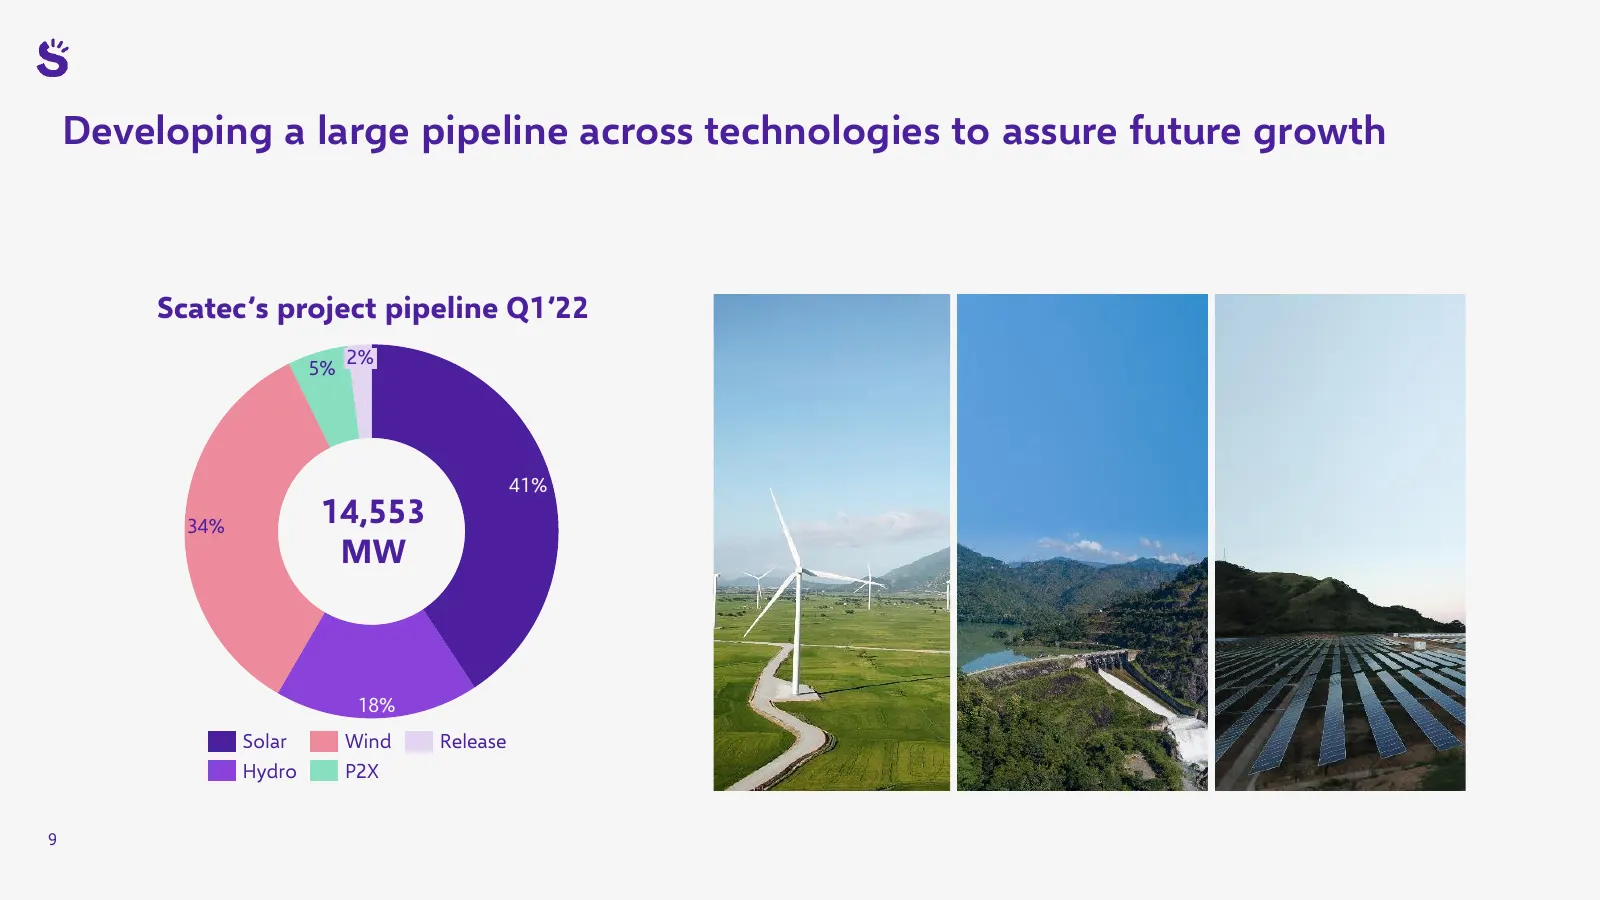
Slide 9: Developing a large pipeline across technologies to assure future growth
Developing a large pipeline across technologies to assure future growth Scatec’s project pipeline Q1’22 2% 5% 41% 34% 14,553 MW 18% Solar Wind Release Hydro P2X 9
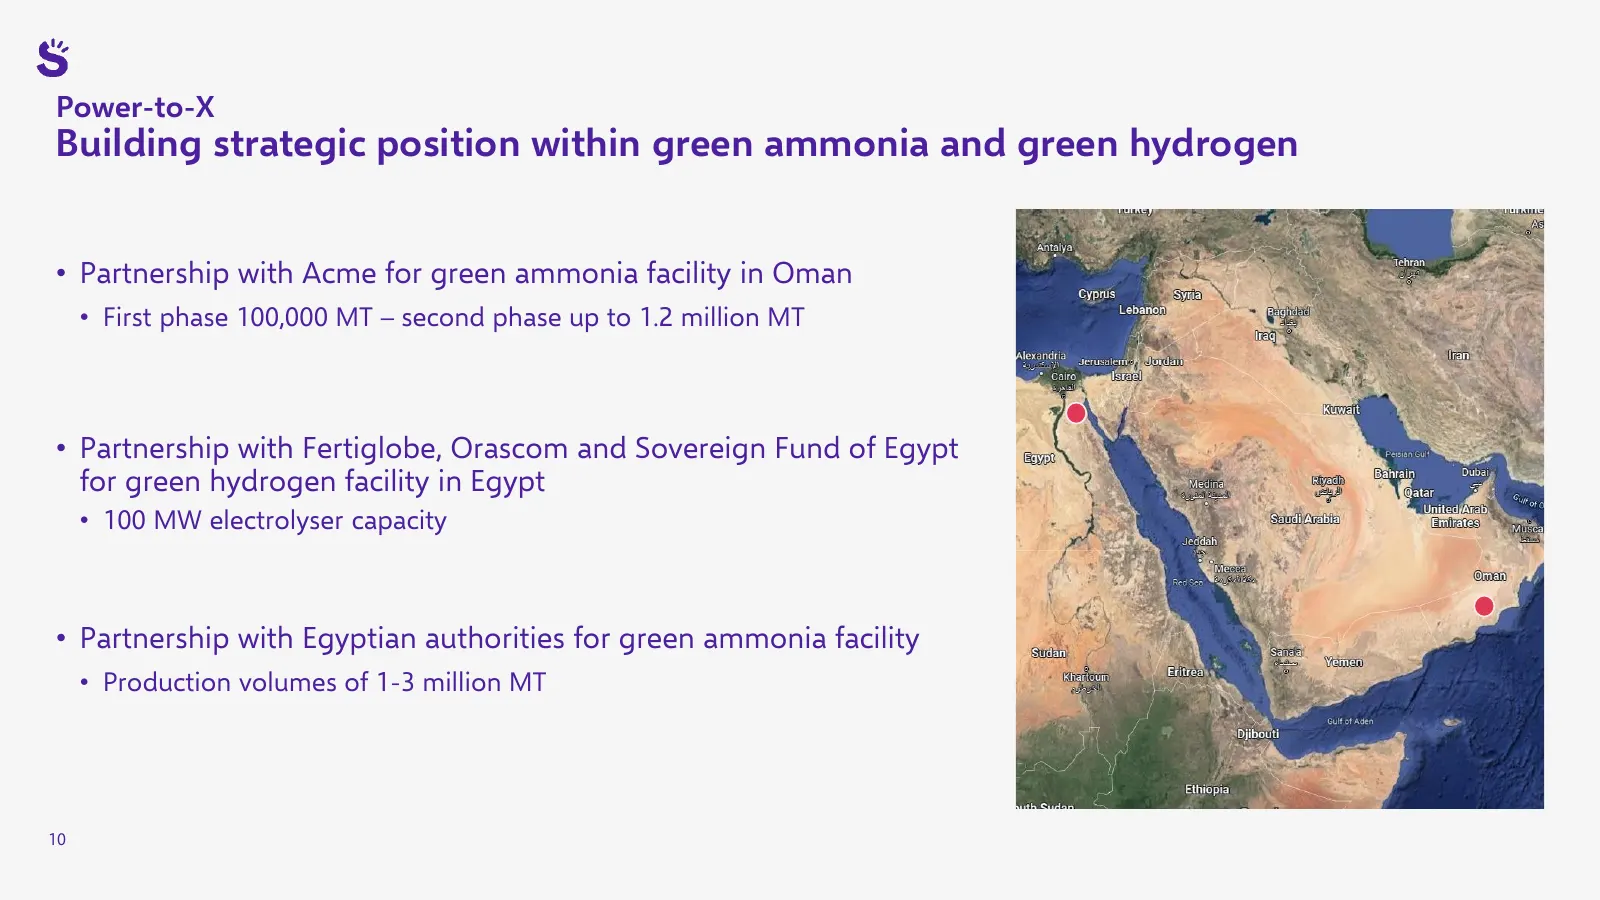
Slide 10: Building strategic position within green ammonia and green hydrogen
Power-to-X Building strategic position within green ammonia and green hydrogen • Partnership with Acme for green ammonia facility in Oman • First phase 100,000 MT – second phase up to 1.2 million MT • Partnership with Fertiglobe, Orascom and Sovereign Fund of Egypt for green hydrogen facility in Egy
Slide 11: Top priorities
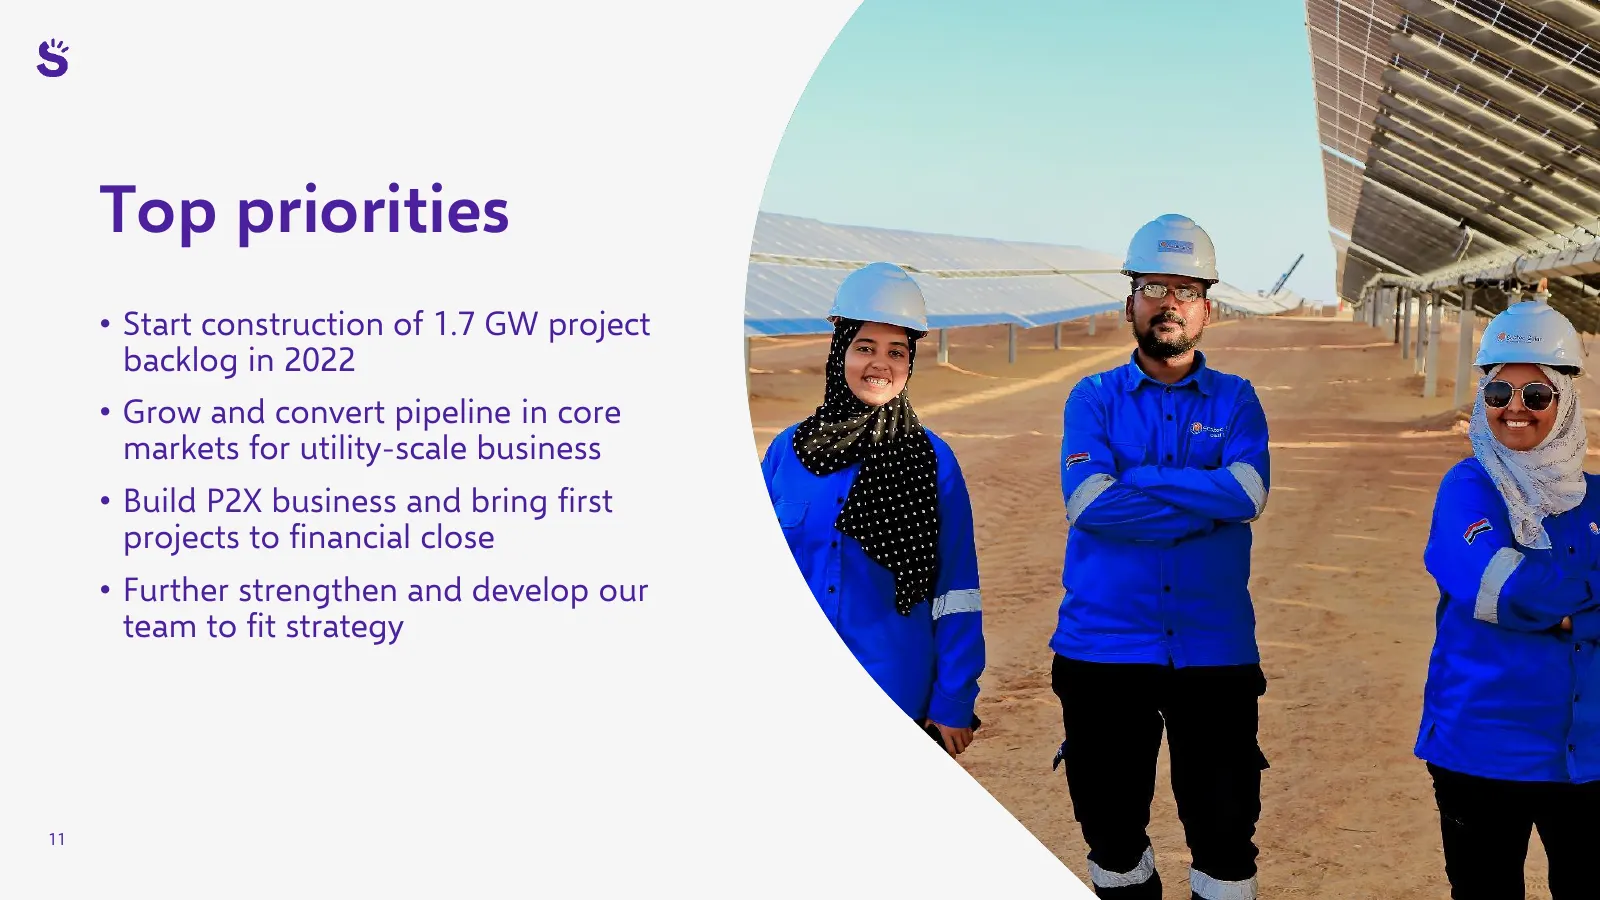
Top priorities • Start construction of 1.7 GW project backlog in 2022 • Grow and convert pipeline in core markets for utility-scale business • Build P2X business and bring first projects to financial close • Further strengthen and develop our team to fit strategy 11
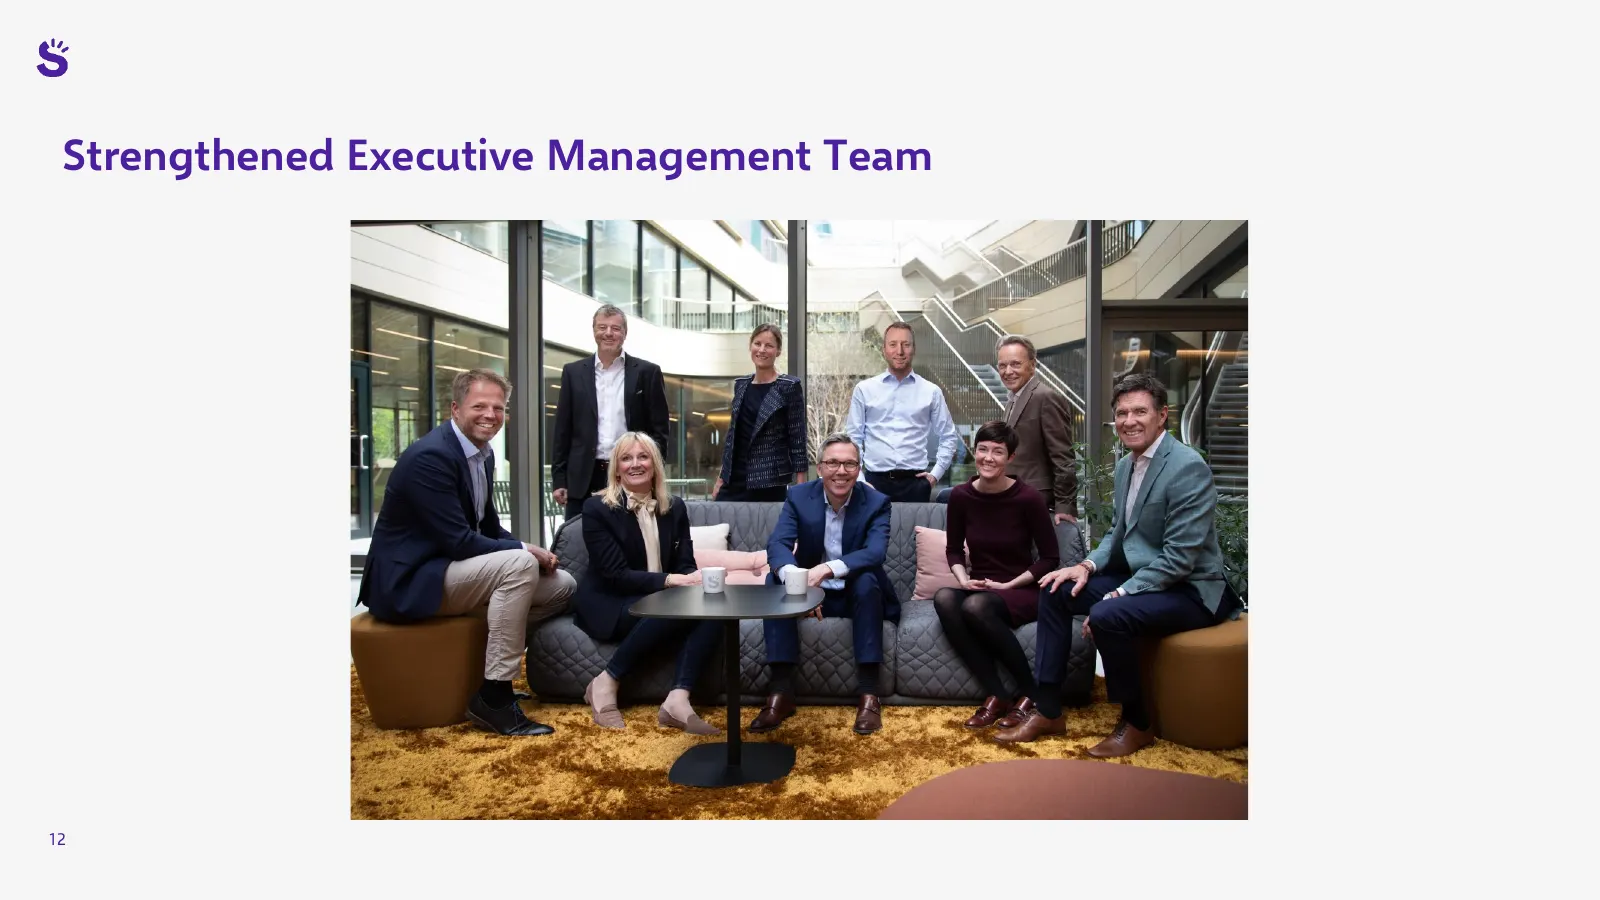
Slide 12: Strengthened Executive Management Team
Strengthened Executive Management Team 12

Slide 13: Financial review
Financial review Mikkel Tørud, CFO 13
Slide 14: Proportionate financials
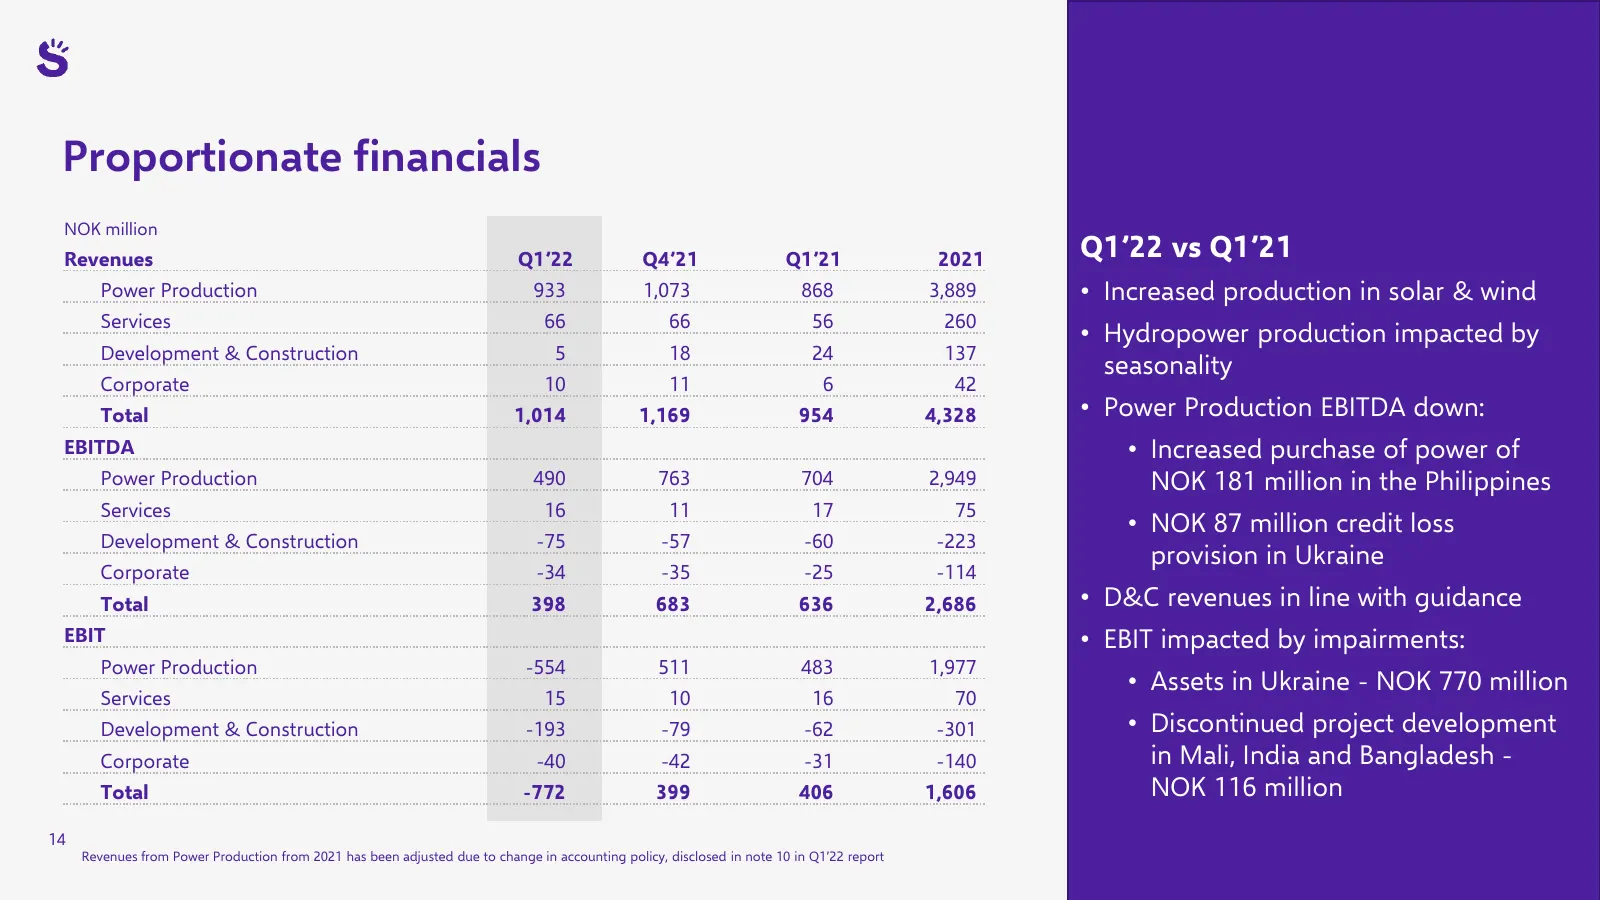
Proportionate financials NOK million Revenues Q1’22 Q4’21 Q1’21 2021 Q1’22 vs Q1’21 Power Production 933 1,073 868 3,889 • Increased production in solar & wind Services 66 66 56 260 • Hydropower production impacted by Development & Construction 5 18 24 137 seasonality Corporate 10 11 6 42 Total 1,01
Slide 15: Short-term impact by seasonality - long-term asset values increasing
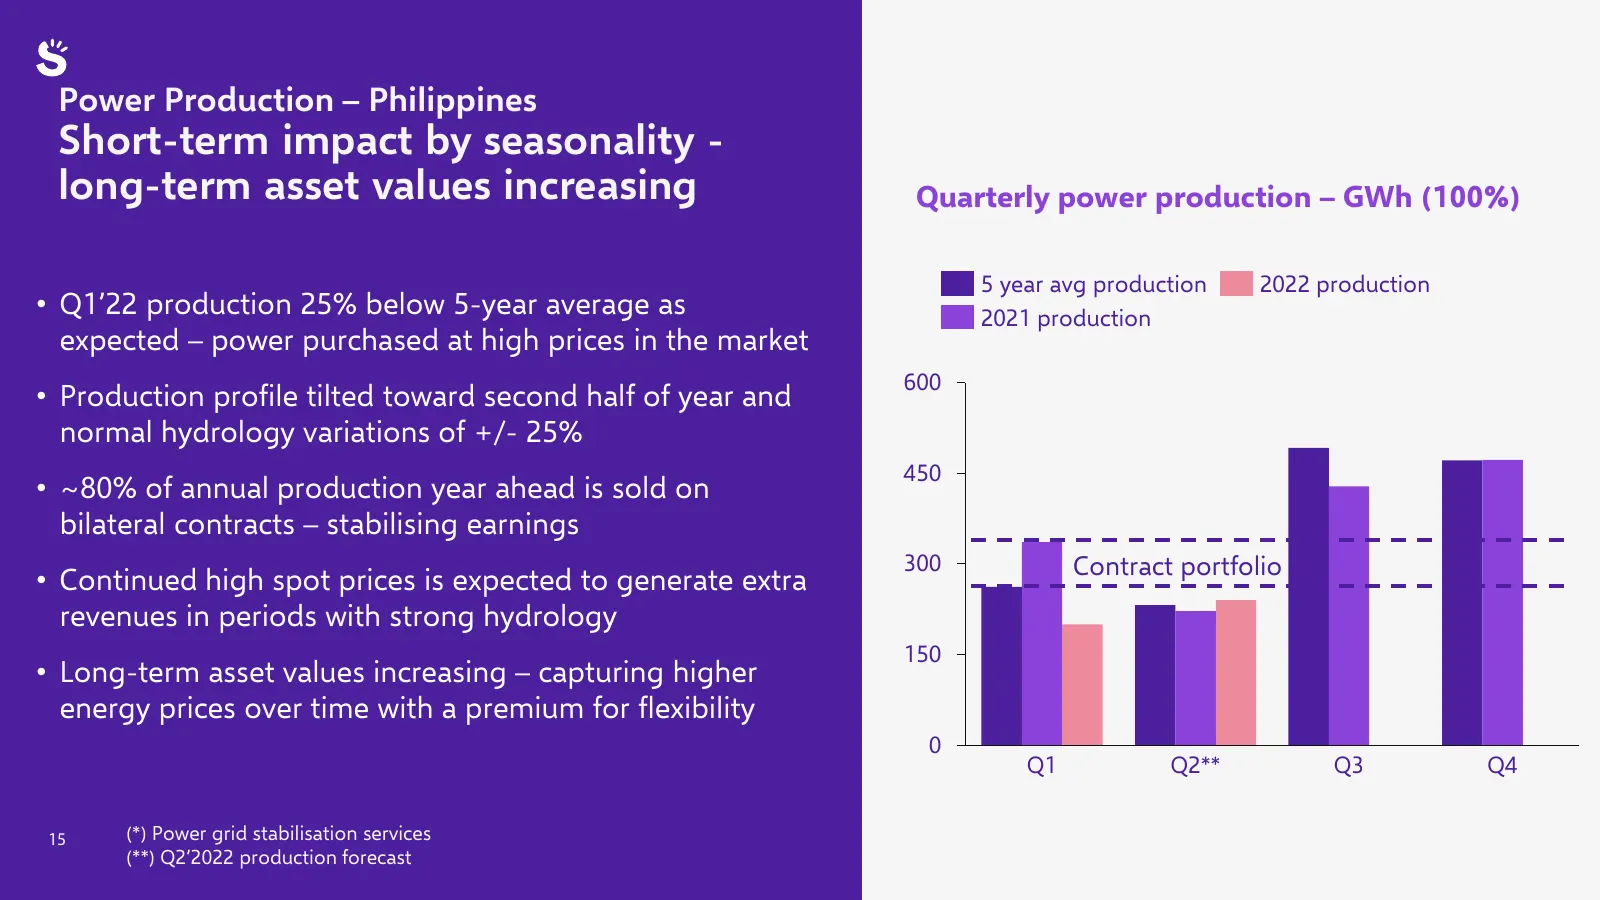
Power Production – Philippines Short-term impact by seasonality - long-term asset values increasing Quarterly power production – GWh (100%) 5 year avg production 2022 production • Q1’22 production 25% below 5-year average as 2021 production expected – power purchased at high prices in the market 600
Slide 16: Impact on Scatec by the Russian war in Ukraine
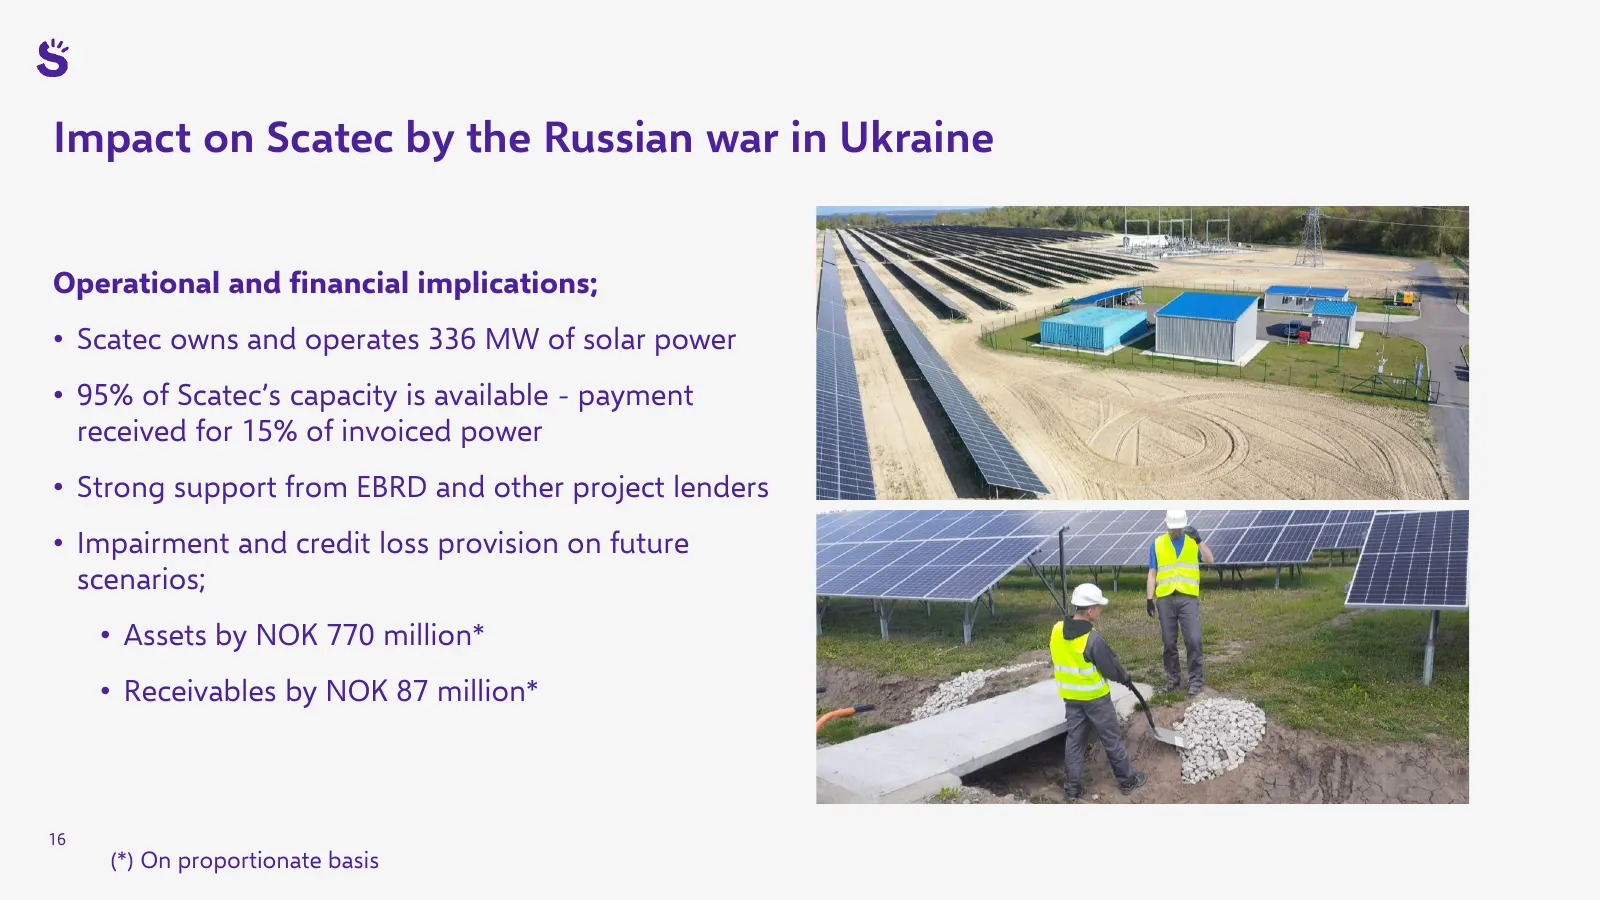
Impact on Scatec by the Russian war in Ukraine Operational and financial implications; • Scatec owns and operates 336 MW of solar power • 95% of Scatec’s capacity is available - payment received for 15% of invoiced power • Strong support from EBRD and other project lenders • Impairment and credit lo
Slide 17: Refinancing and financial innovation releasing NOK 400 million to Scatec
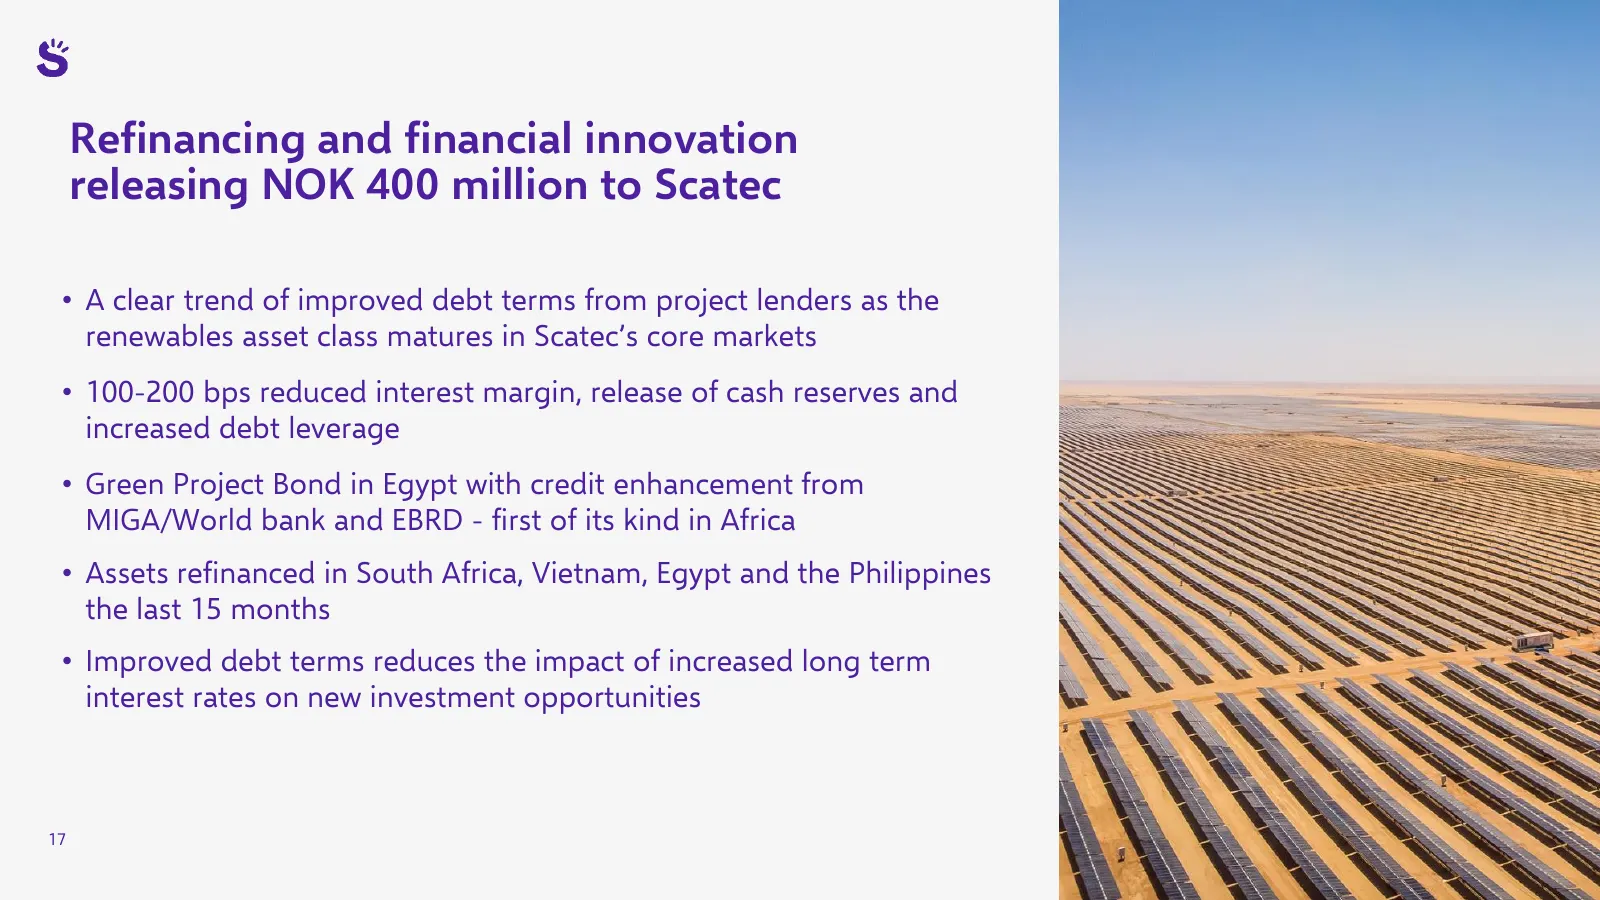
Refinancing and financial innovation releasing NOK 400 million to Scatec • A clear trend of improved debt terms from project lenders as the renewables asset class matures in Scatec’s core markets • 100-200 bps reduced interest margin, release of cash reserves and increased debt leverage • Green Proj
Slide 18: A solid financial position
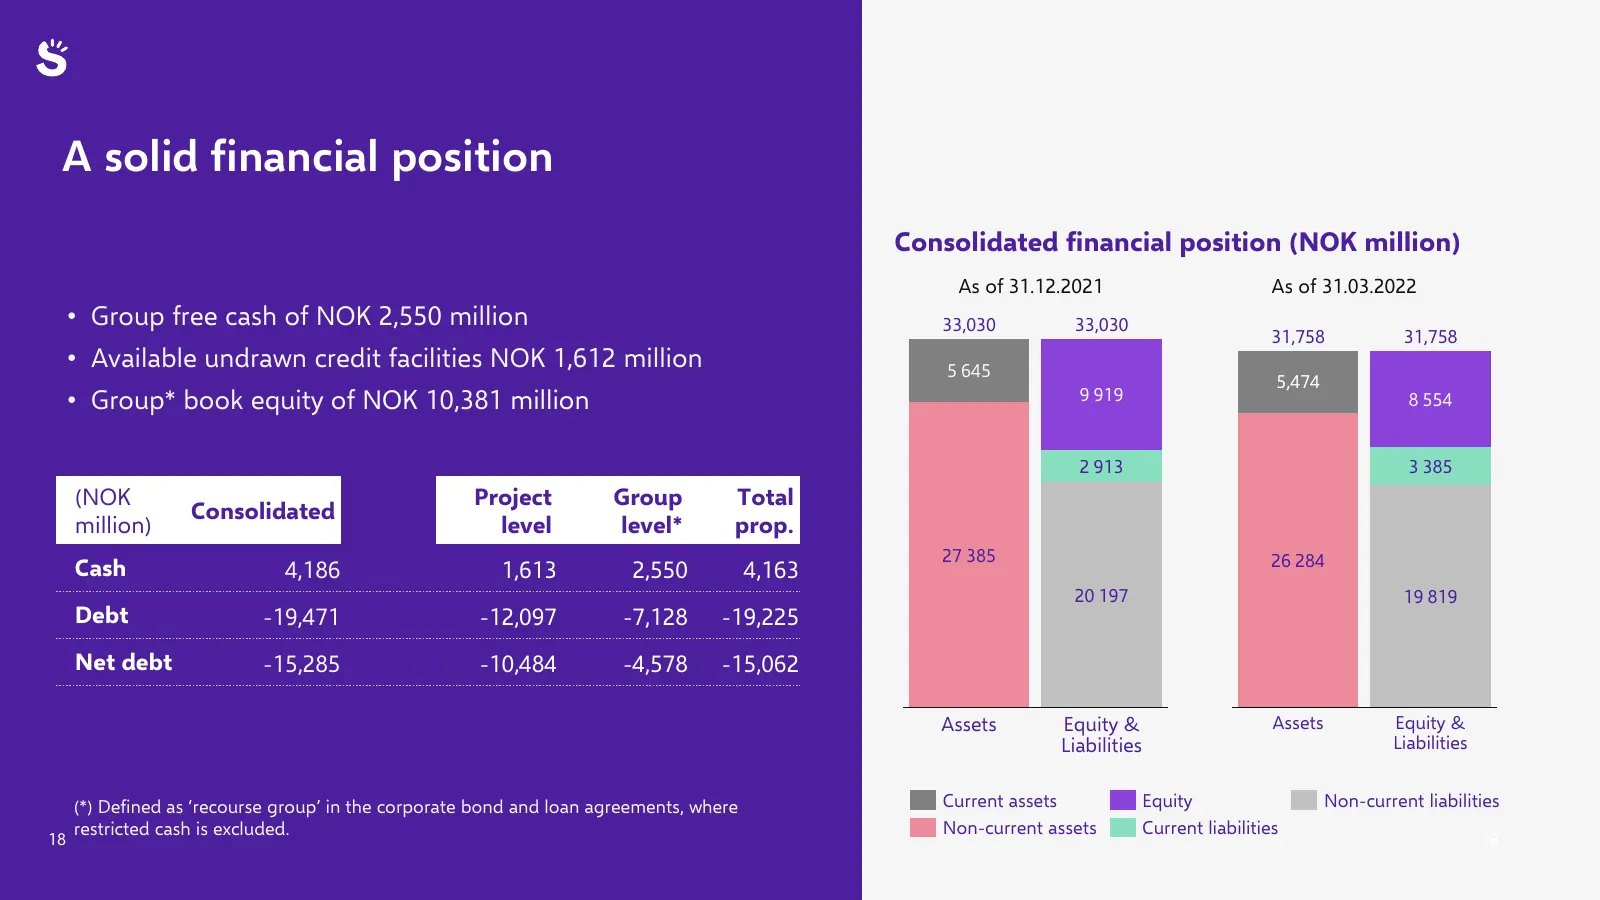
A solid financial position Consolidated financial position (NOK million) As of 31.12.2021 As of 31.03.2022 • Group free cash of NOK 2,550 million 33,030 33,030 31,758 31,758 • Available undrawn credit facilities NOK 1,612 million 5 645 5,474 • Group* book equity of NOK 10,381 million 9 919 8 554 2 9
Slide 19: Q1'22 movement of the Group's free cash
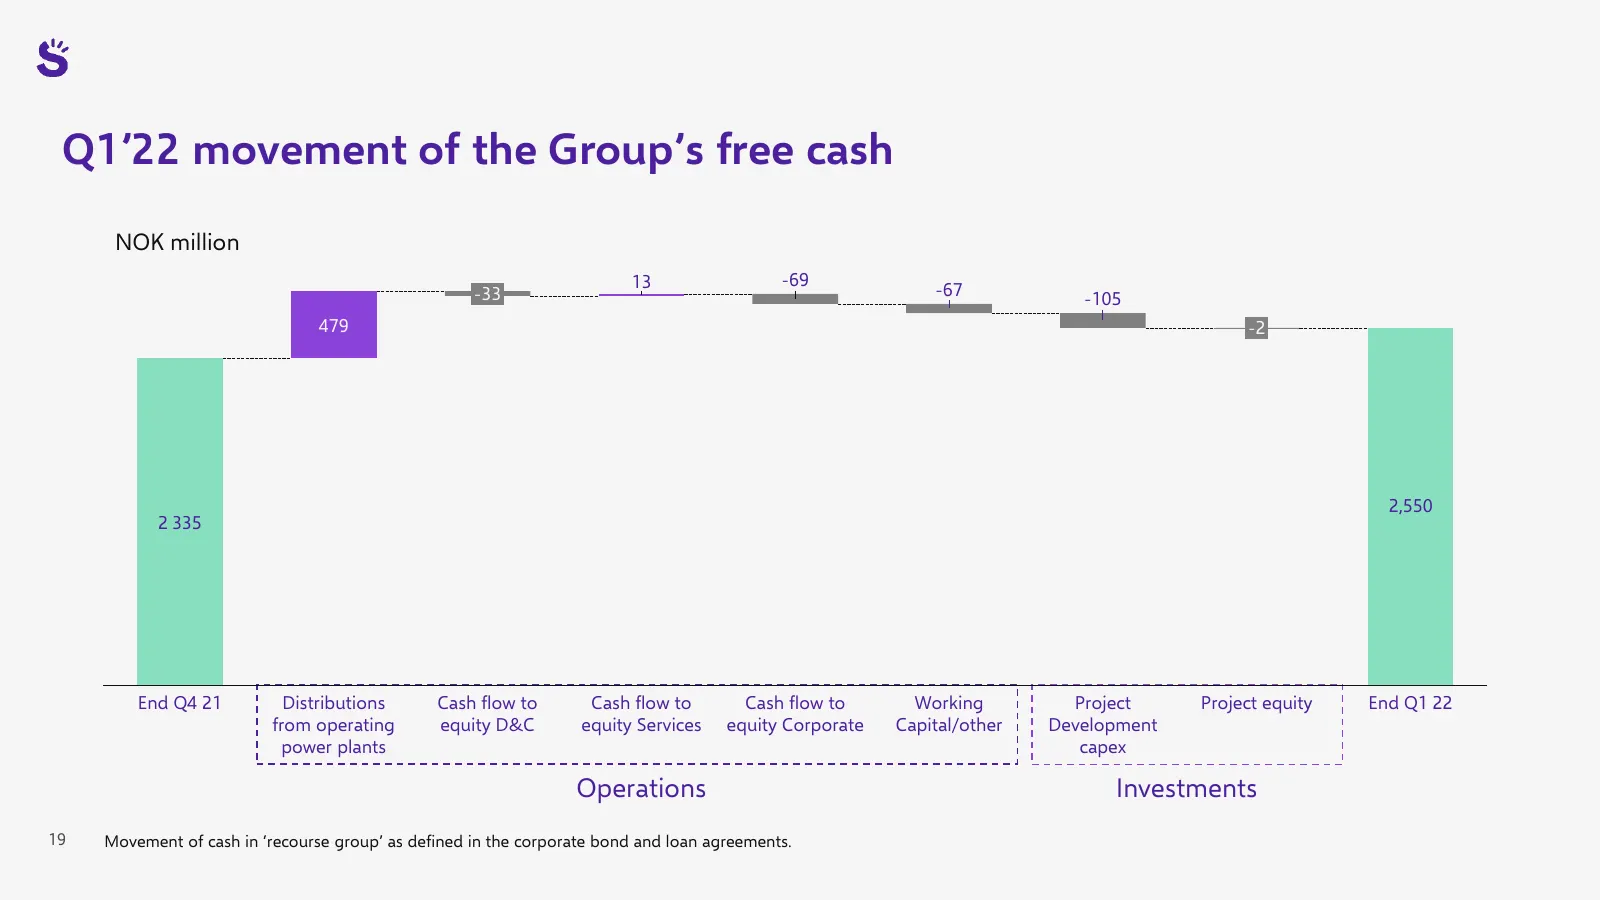
Q1’22 movement of the Group’s free cash NOK million 13 -69 -33 -67 -105 479 -2 2,550 2 335 End Q4 21 Distributions Cash flow to Cash flow to Cash flow to Working Project Project equity End Q1 22 from operating equity D&C equity Services equity Corporate Capital/other Development power plants capex O
Slide 20: 2022 guidance
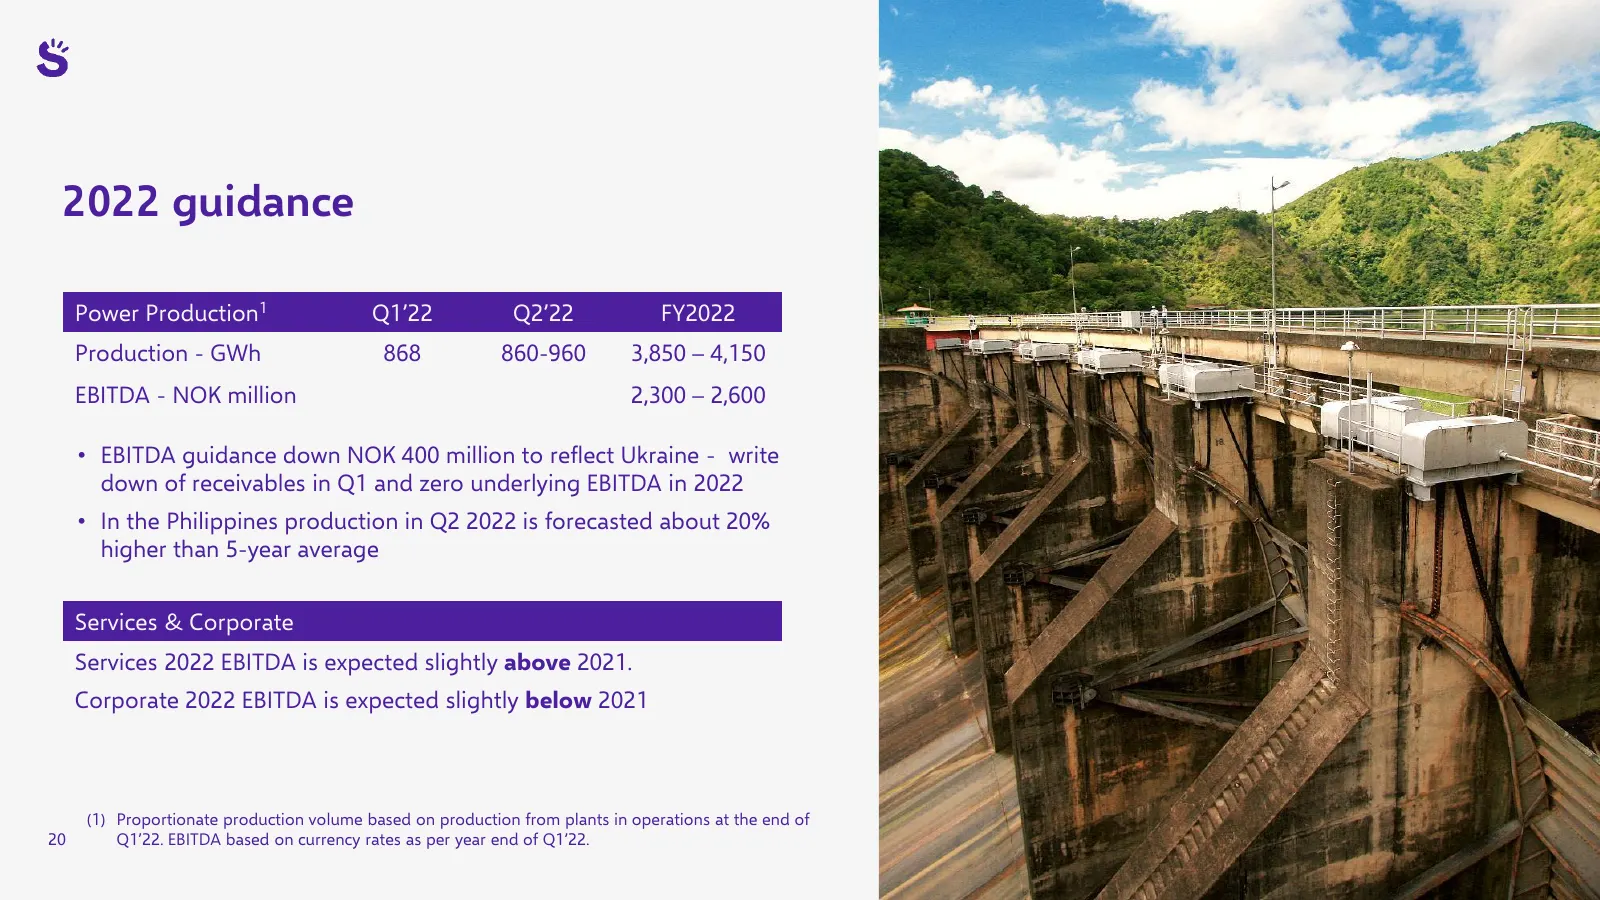
2022 guidance Power Production1 Q1’22 Q2’22 FY2022 Production - GWh 868 860-960 3,850 – 4,150 EBITDA - NOK million 2,300 – 2,600 INSERT • EBITDA guidance down NOK 400 million to reflect Ukraine - write PICTURE down of receivables in Q1 and zero underlying EBITDA in 2022 • In the Philippines producti
Slide 21: Scatec: improving our future
Scate improving our future
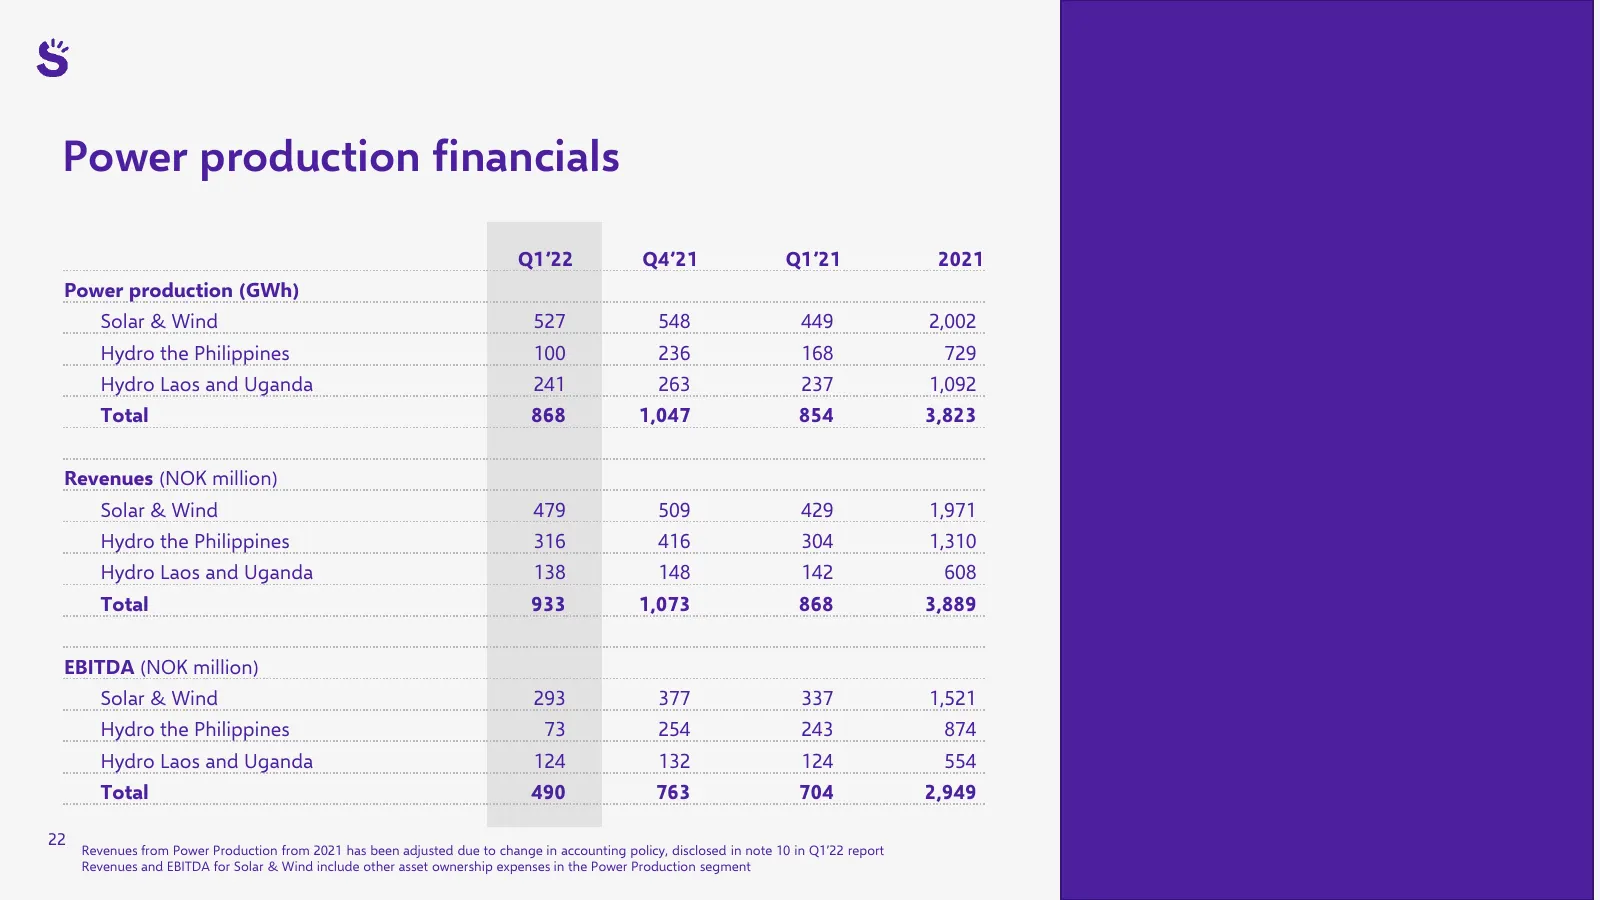
Slide 22: Power production financials
Power production financials Q1’22 Q4’21 Q1’21 2021 Power production (GWh) Solar & Wind 527 548 449 2,002 Hydro the Philippines 100 236 168 729 Hydro Laos and Uganda 241 263 237 1,092 Total 868 1,047 854 3,823 Revenues (NOK million) Solar & Wind 479 509 429 1,971 Hydro the Philippines 316 416 304 1,3
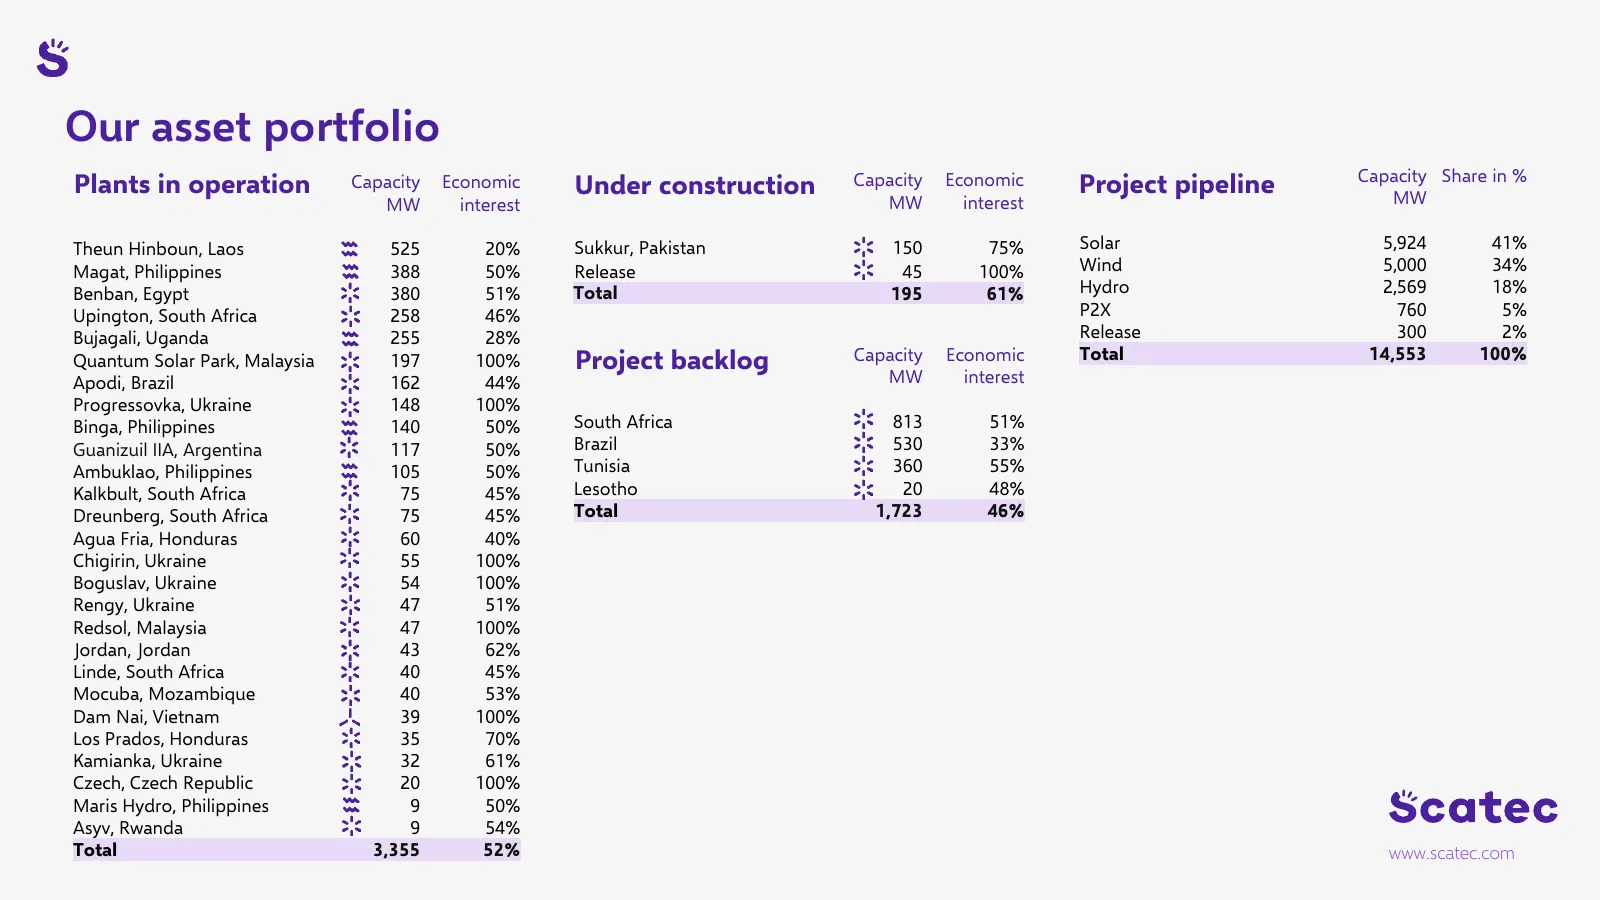
Slide 23: Our asset portfolio
Our asset portfolio Capacity Share in % Plants in operation Capacity Economic Under construction Capacity Economic Project pipeline MW MW interest MW interest Theun Hinboun, Laos 525 20% Sukkur, Pakistan 150 75% Solar 5,924 41% Magat, Philippines 388 50% Release 45 100% Wind 5,000 34% Benban, Egypt
Source: Internet Archive copy of scatec.com
More decks from Scatec ASA
 Q3 2026 Earnings Presentation32 slides · Oct 30, 2026
 Q2 2026 Earnings Presentation23 slides · Aug 21, 2026
 Investor Presentation (August 2026)22 slides · August 2026
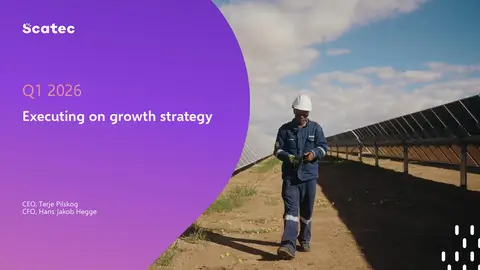 Q1 2026 Earnings Presentation23 slides · May 6, 2026
 Investor Presentation (March 2026)22 slides · March 2026
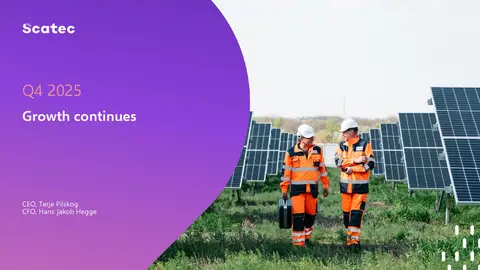 Q4 2025 Earnings Presentation24 slides · Jan 30, 2026