The Dow Chemical — Q2 2011 Earnings Presentation
43 slides from The Dow Chemical's earnings presentation, Jul 27, 2011
Slide 1: Q2 2011 Earnings Conference Call
The Dow Chemical Company Q2 2011 Earnings Conference Call July 27, 2011
Slide 2: SEC Disclosure Rules
SEC Disclosure Rules Some of our comments today may include statements about our expectations for the future. Those expectations involve risks and uncertainties. Dow cannot guarantee the accuracy of any forecasts or estimates, and we do not plan to update any forward-looking statements if our expect
Slide 3: Agenda
Agenda 2Q11 Overview Financial Update Strategy In Action Outlook & Priorities (1) Within this presentation: --All sales, price and volume comparisons are presented excluding divestitures, unless otherwise noted. --All references to earnings per share, EBITDA(2) and EBITDA margin(2) are prese
Slide 4: Dow Delivers Significant Top- and Bottom-Line Growth
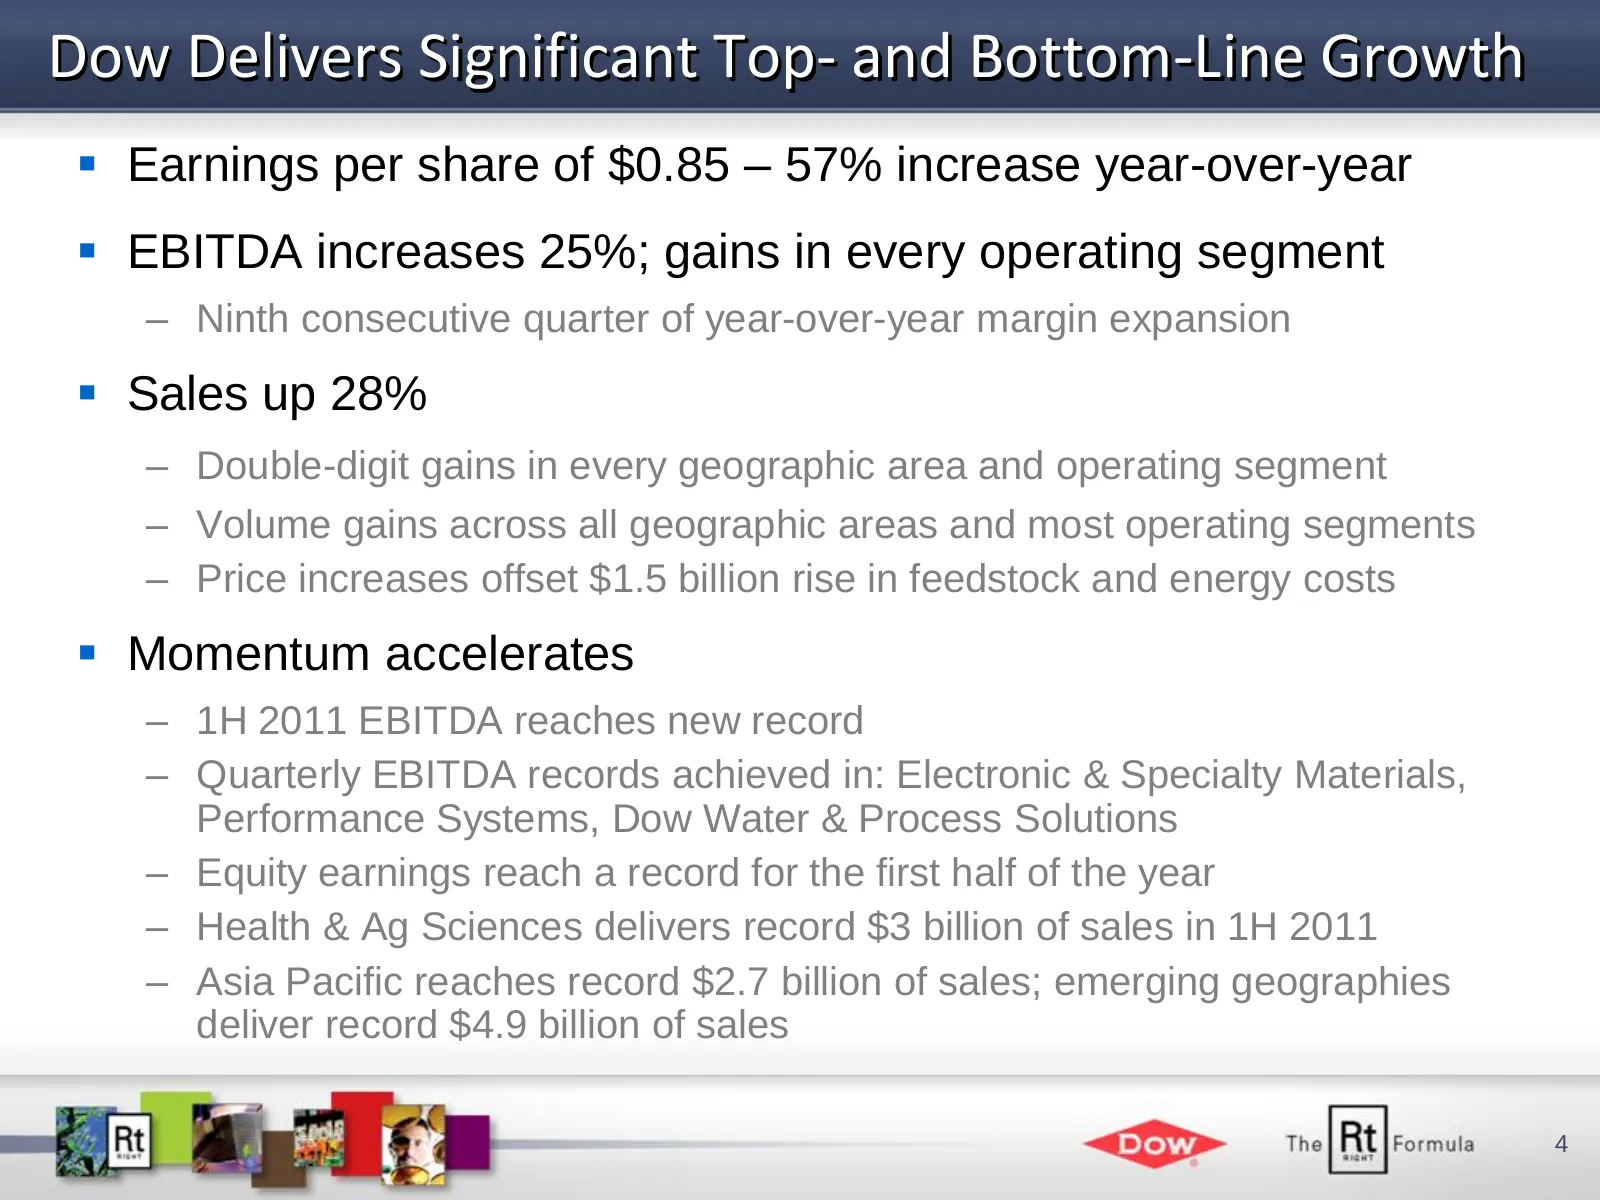
Dow Delivers Significant Top- and Bottom-Line Growth Earnings per share of $0.85 – 57% increase year-over-year EBITDA increases 25%; gains in every operating segment – Ninth consecutive quarter of year-over-year margin expansion Sales up 28% – Double-digit gains in every geographic area and op
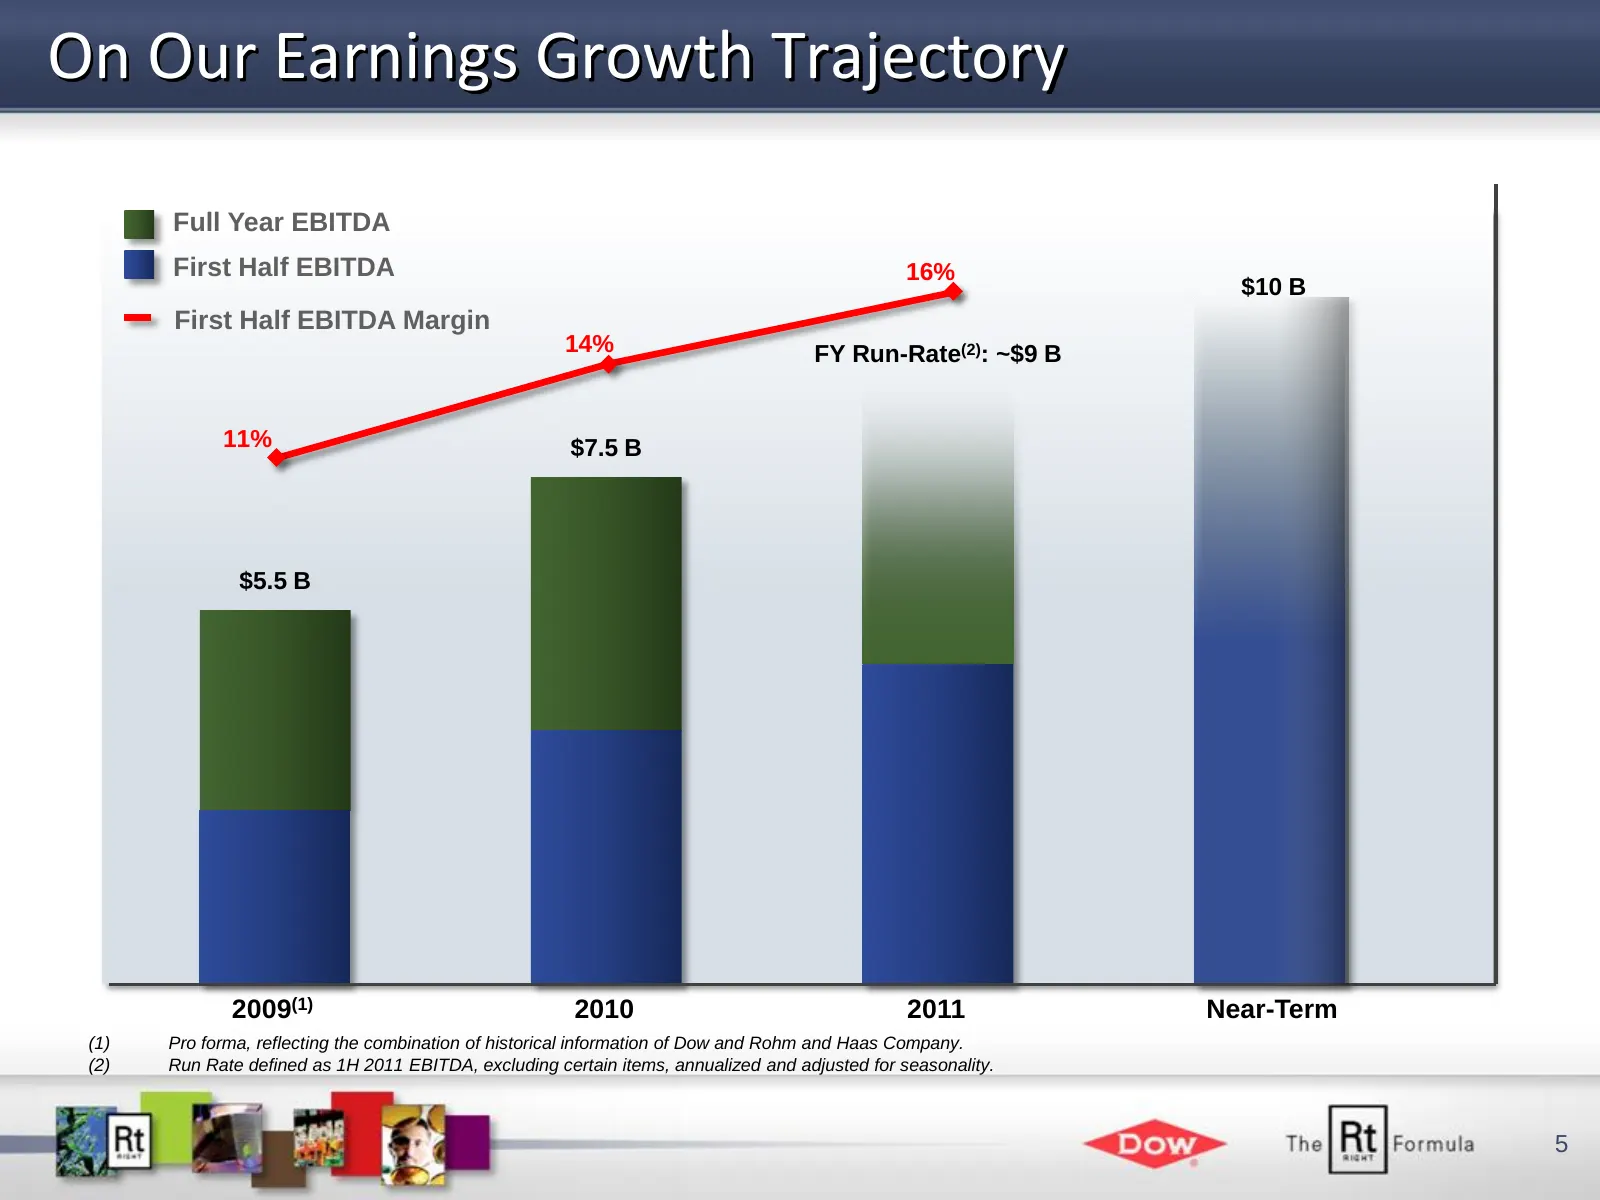
Slide 5: On Our Earnings Growth Trajectory
On Our Earnings Growth Trajectory Full Year EBITDA First Half EBITDA 16% $10 B First Half EBITDA Margin 14% FY Run-Rate(2): ~$9 B 11% $7.5 B $5.5 B 2009(1) 2010 2011 Near-Term (1) Pro forma, reflecting the combination of historical information of Dow and Rohm and Haas Company. (2) Run Rate defined a
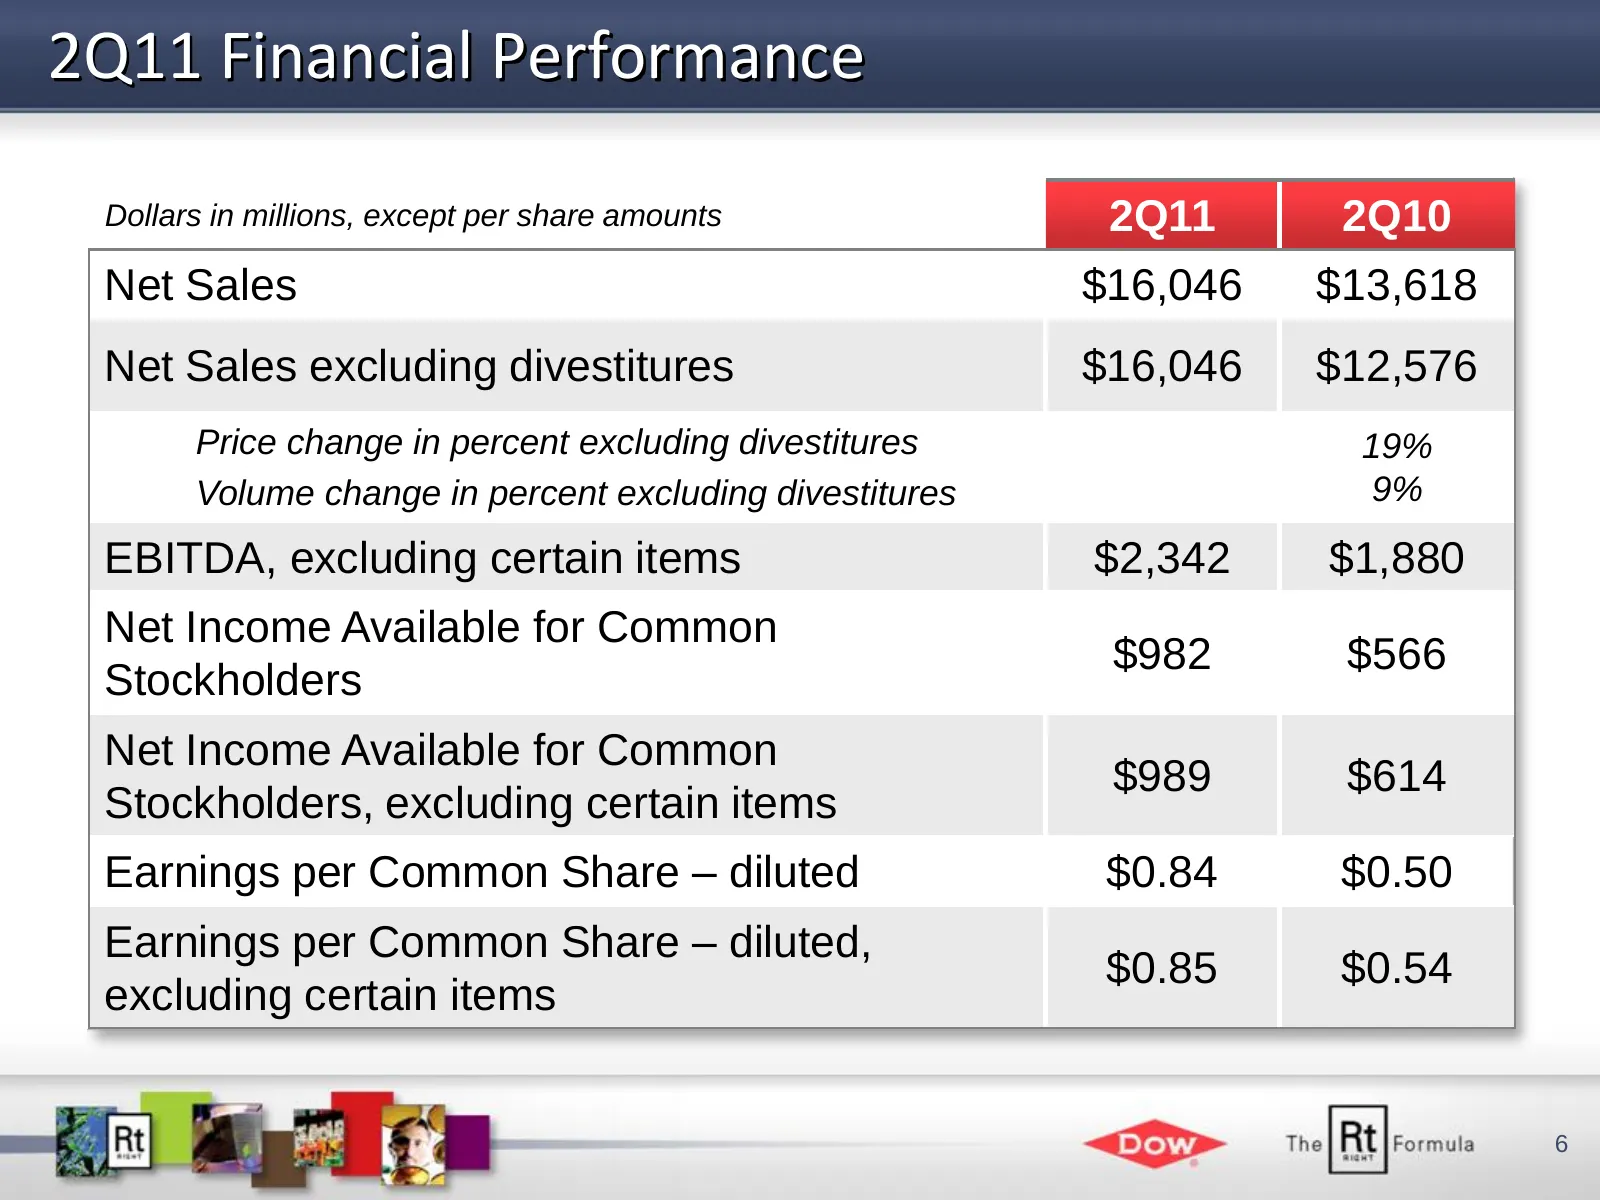
Slide 6: 2Q11 Financial Performance
2Q11 Financial Performance Dollars in millions, except per share amounts 2Q11 2Q10 Net Sales $16,046 $13,618 Net Sales excluding divestitures $16,046 $12,576 Price change in percent excluding divestitures 19% Volume change in percent excluding divestitures 9% EBITDA, excluding certain items $2,342 $
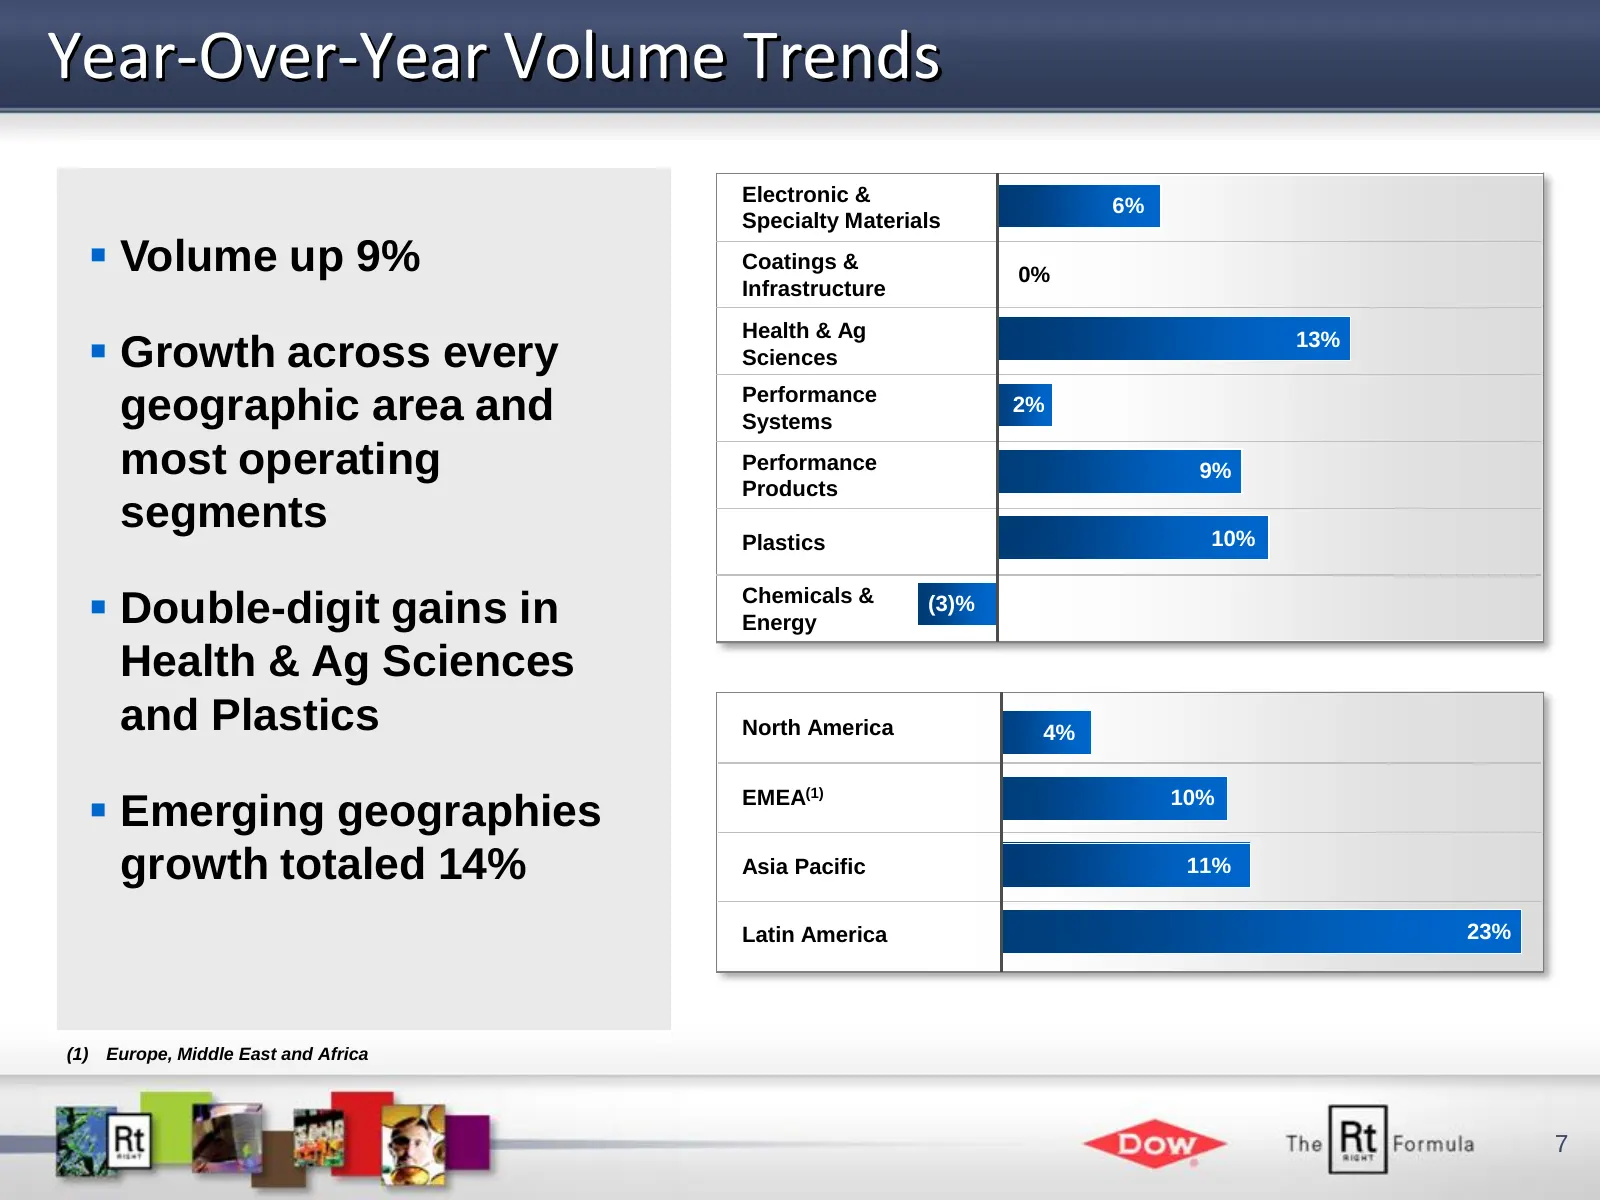
Slide 7: Year-Over-Year Volume Trends
Year-Over-Year Volume Trends Electronic & 6% Specialty Materials Volume up 9% Coatings & 0% Infrastructure Health & Ag Growth across every Sciences 13% Performance geographic area and Systems 2% most operating Performance 9% Products segments 10% Plastics Double-digit gains in Chemicals & Ener
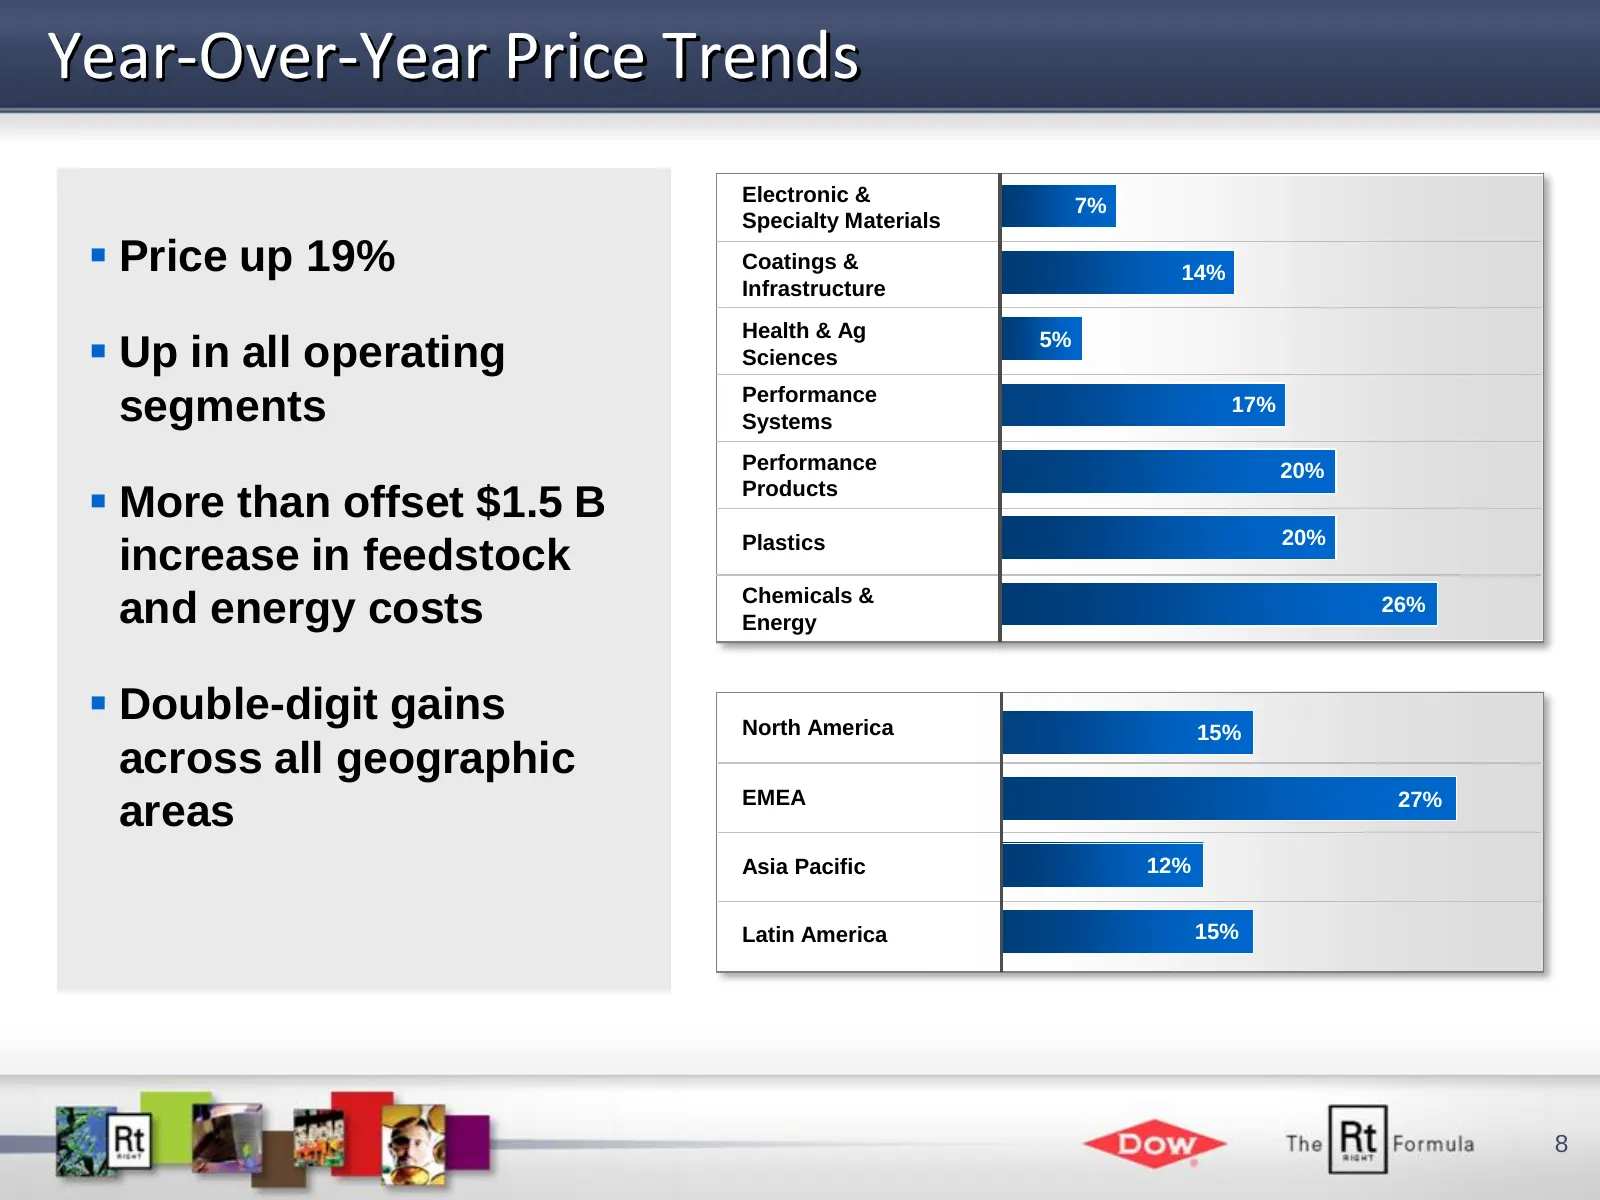
Slide 8: Year-Over-Year Price Trends
Year-Over-Year Price Trends Electronic & 7% Specialty Materials Price up 19% Coatings & 14% Infrastructure Health & Ag Up in all operating Sciences 5% Performance segments Systems 17% Performance 20% More than offset $1.5 B Products Plastics 20% increase in feedstock Chemicals & and energy cos
Slide 9: Operating Segment View
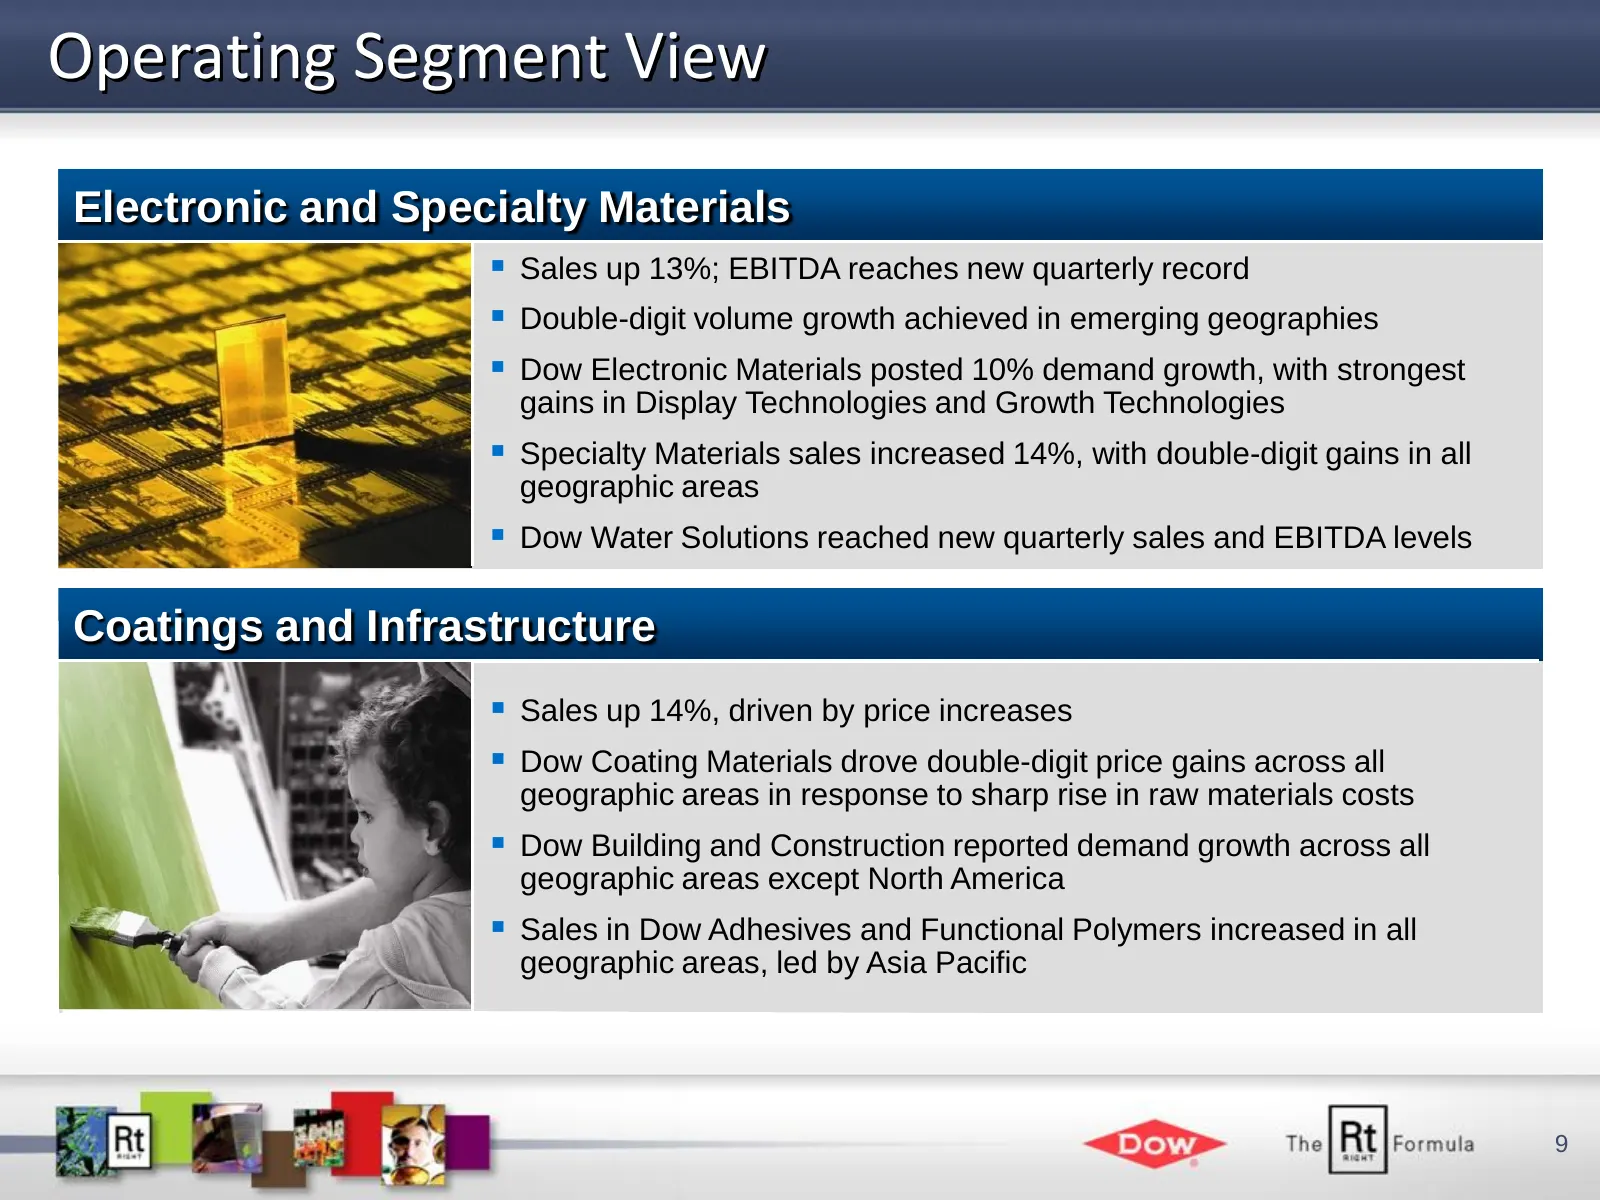
Operating Segment View Electronic and Specialty Materials Sales up 13%; EBITDA reaches new quarterly record Double-digit volume growth achieved in emerging geographies Dow Electronic Materials posted 10% demand growth, with strongest gains in Display Technologies and Growth Technologies Spec
Slide 10: Operating Segment View
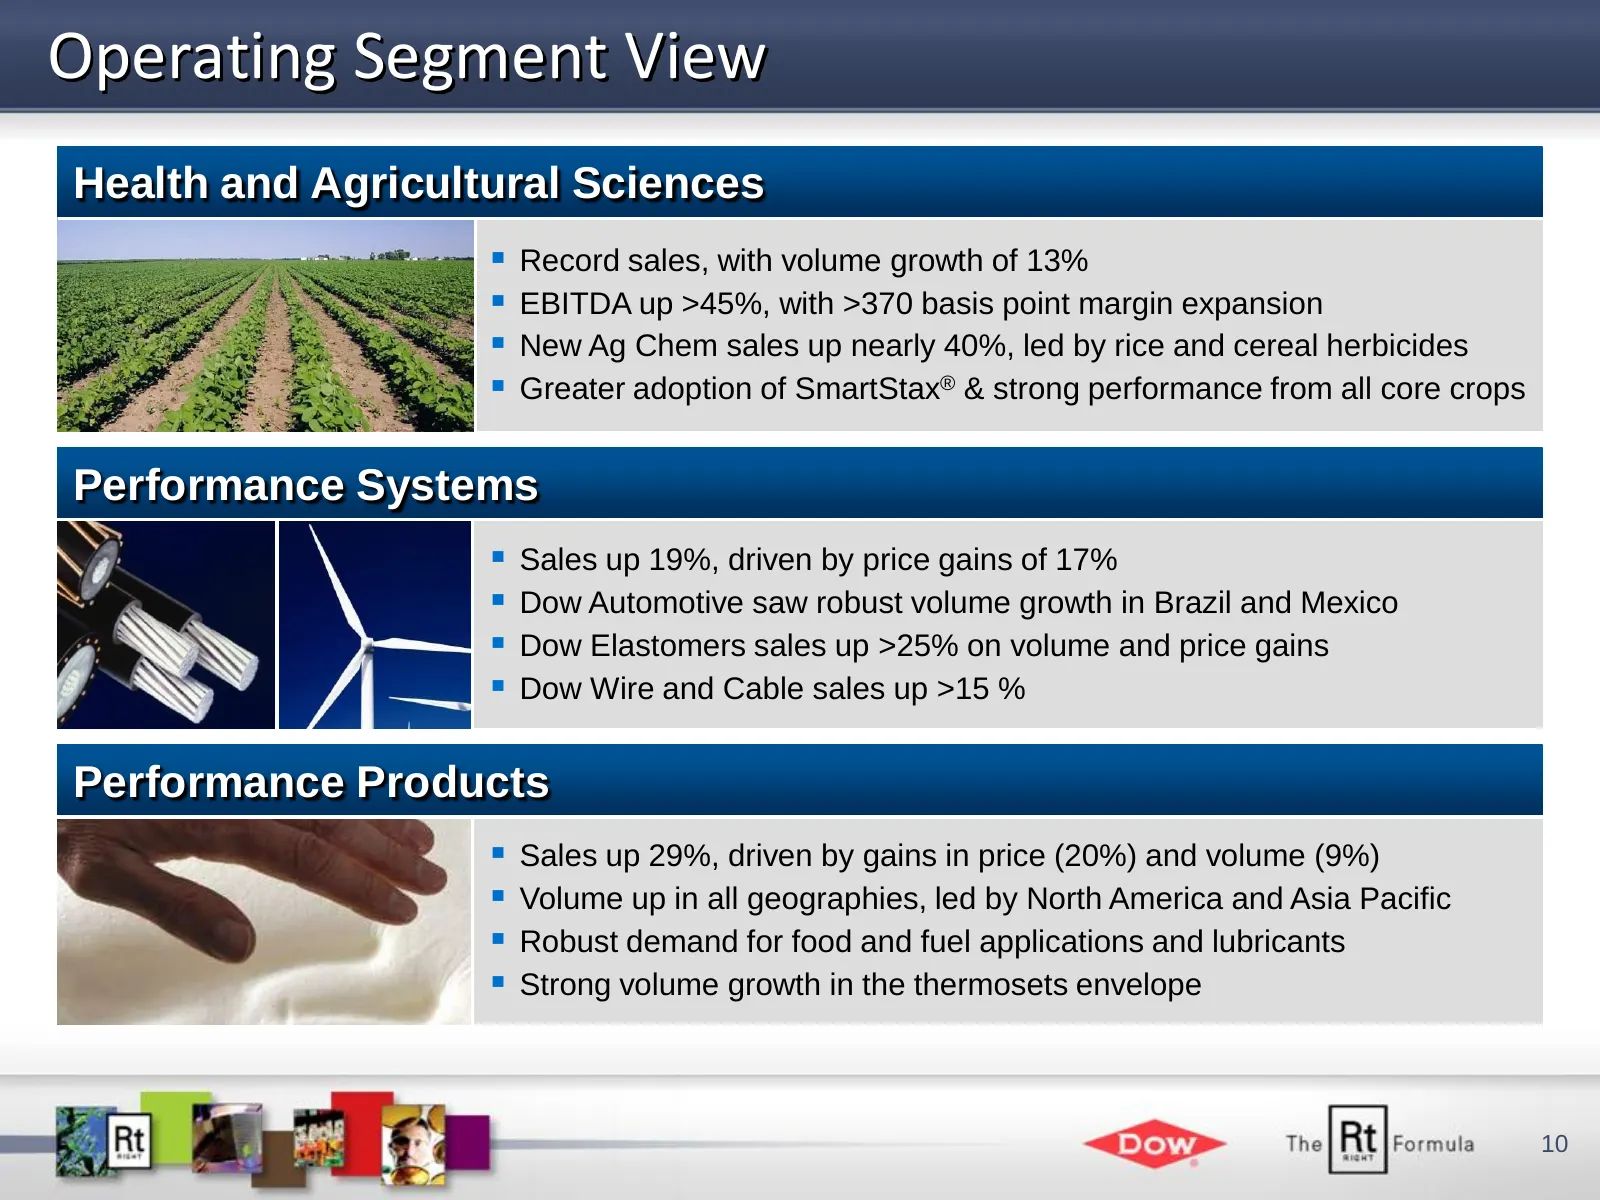
Operating Segment View Health and Agricultural Sciences Record sales, with volume growth of 13% EBITDA up >45%, with >370 basis point margin expansion New Ag Chem sales up nearly 40%, led by rice and cereal herbicides Greater adoption of SmartStax® & strong performance from all core crops Pe
Slide 11: Operating Segment View
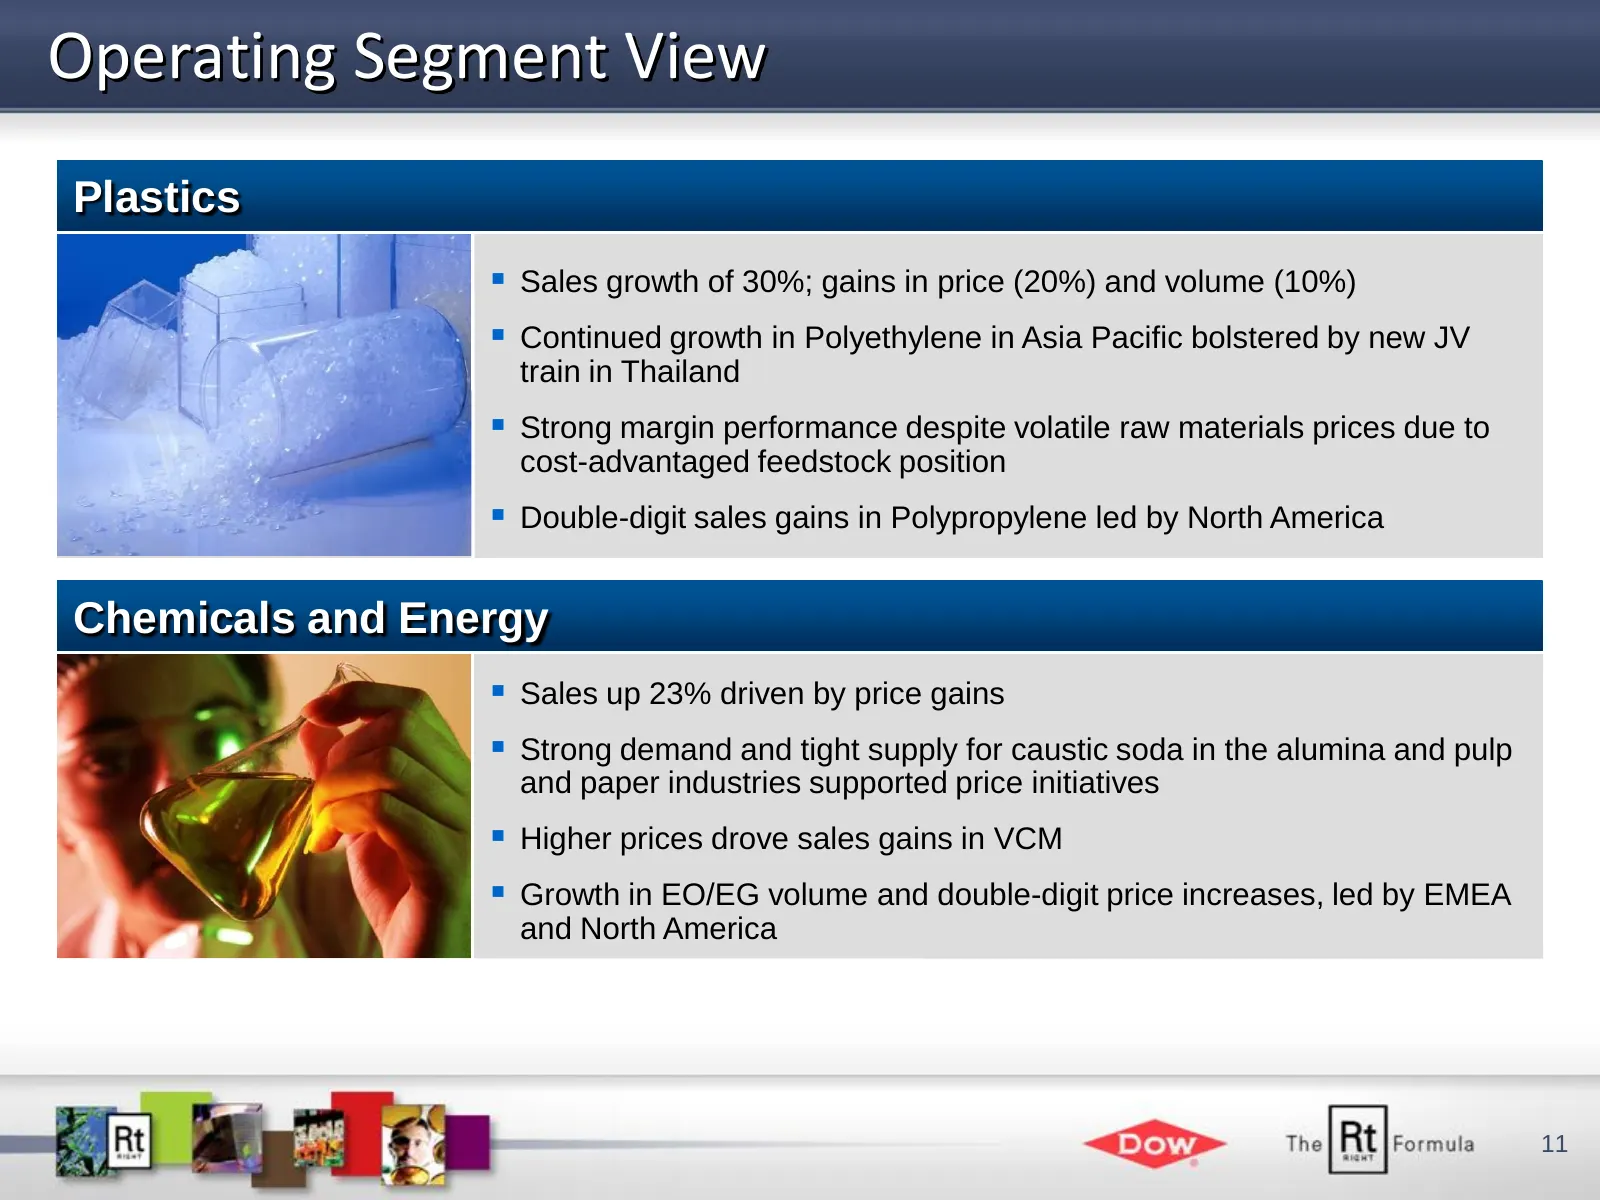
Operating Segment View Plastics Sales growth of 30%; gains in price (20%) and volume (10%) Continued growth in Polyethylene in Asia Pacific bolstered by new JV train in Thailand Strong margin performance despite volatile raw materials prices due to cost-advantaged feedstock position Double-d
Slide 12: Enhanced Financial Flexibility
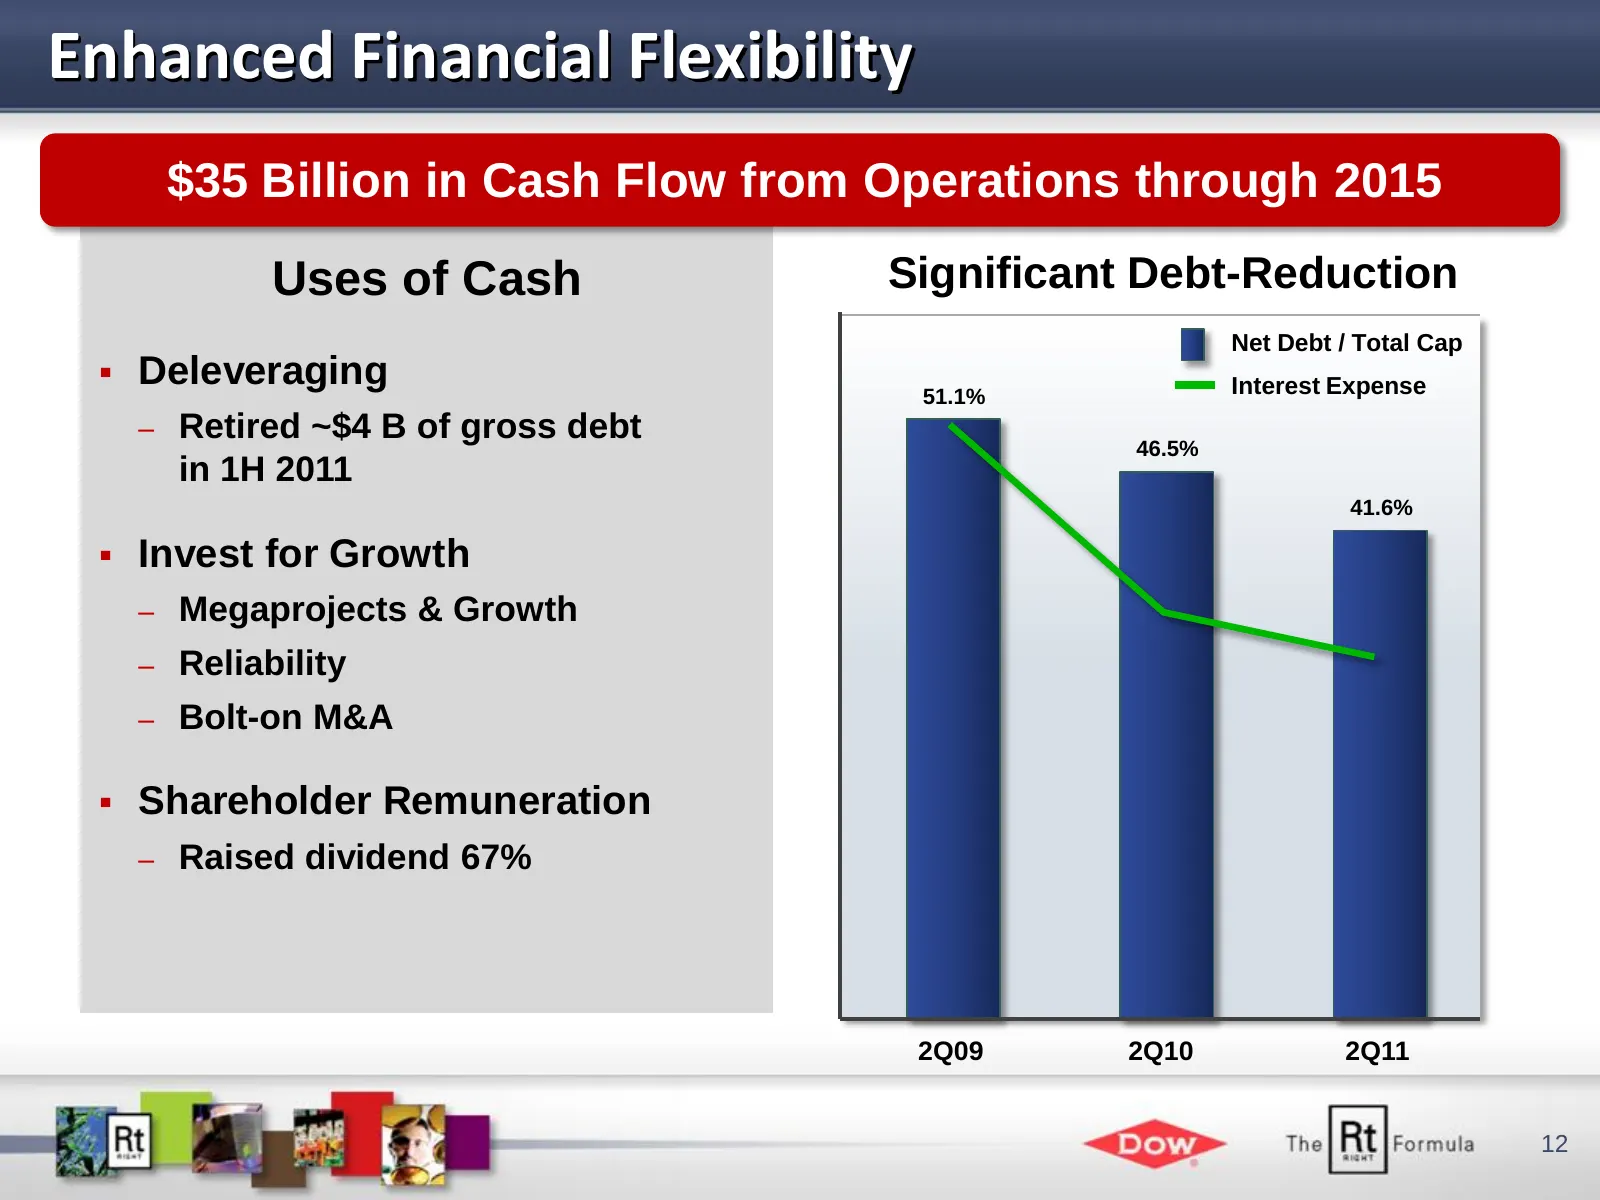
Enhanced Financial Flexibility $35 Billion in Cash Flow from Operations through 2015 Uses of Cash Significant Debt-Reduction Net Debt / Total Cap Deleveraging Interest Expense 51.1% – Retired ~$4 B of gross debt 46.5% in 1H 2011 41.6% Invest for Growth – Megaprojects & Growth – Reliability – Bol
Slide 13: Advancing Our Strategy On All Fronts
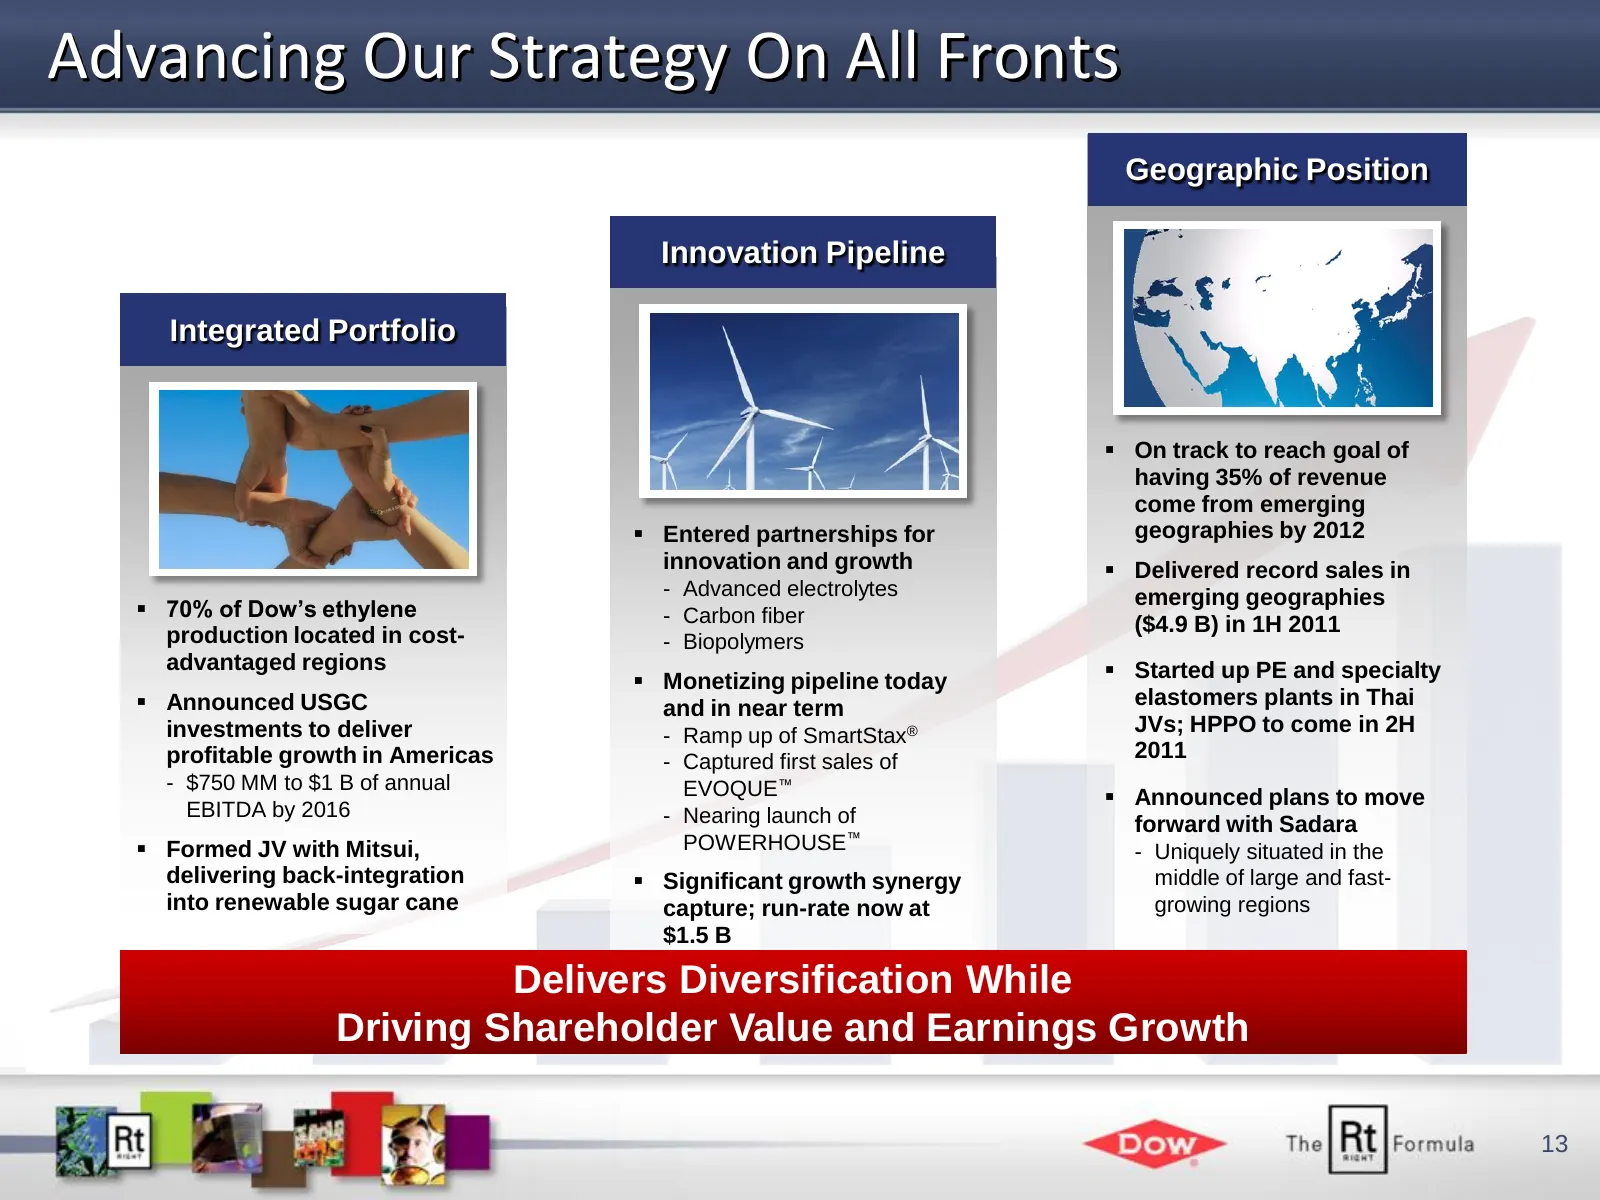
Advancing Our Strategy On All Fronts Geographic Position Innovation Pipeline Integrated Portfolio On track to reach goal of having 35% of revenue come from emerging Entered partnerships for geographies by 2012 innovation and growth Delivered record sales in - Advanced electrolytes emerging geo
Slide 14: An Integrated Portfolio Designed for Growth
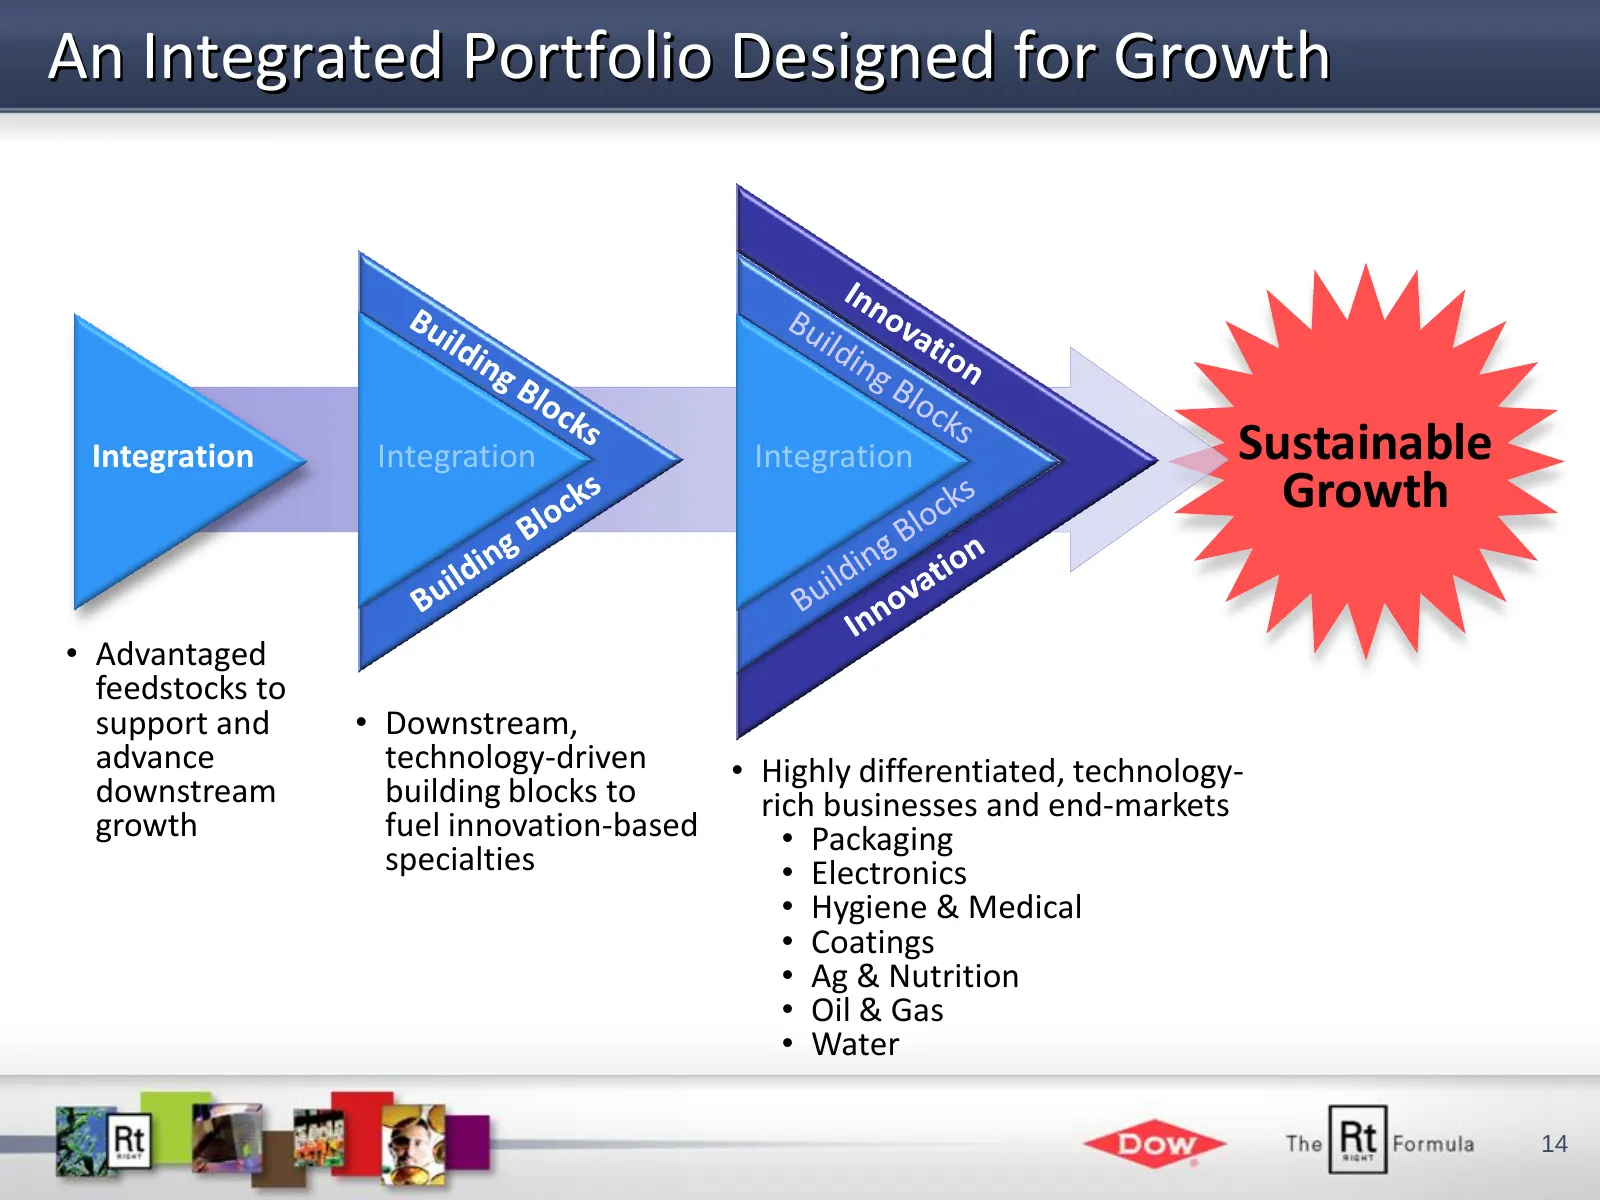
An Integrated Portfolio Designed for Growth Integration Integration Integration Sustainable Growth • Advantaged feedstocks to support and • Downstream, advance technology-driven • Highly differentiated, technology- downstream building blocks to rich businesses and end-markets growth fuel innovation-
Slide 15: Expanding Geographic Reach Accelerates Growth Capture
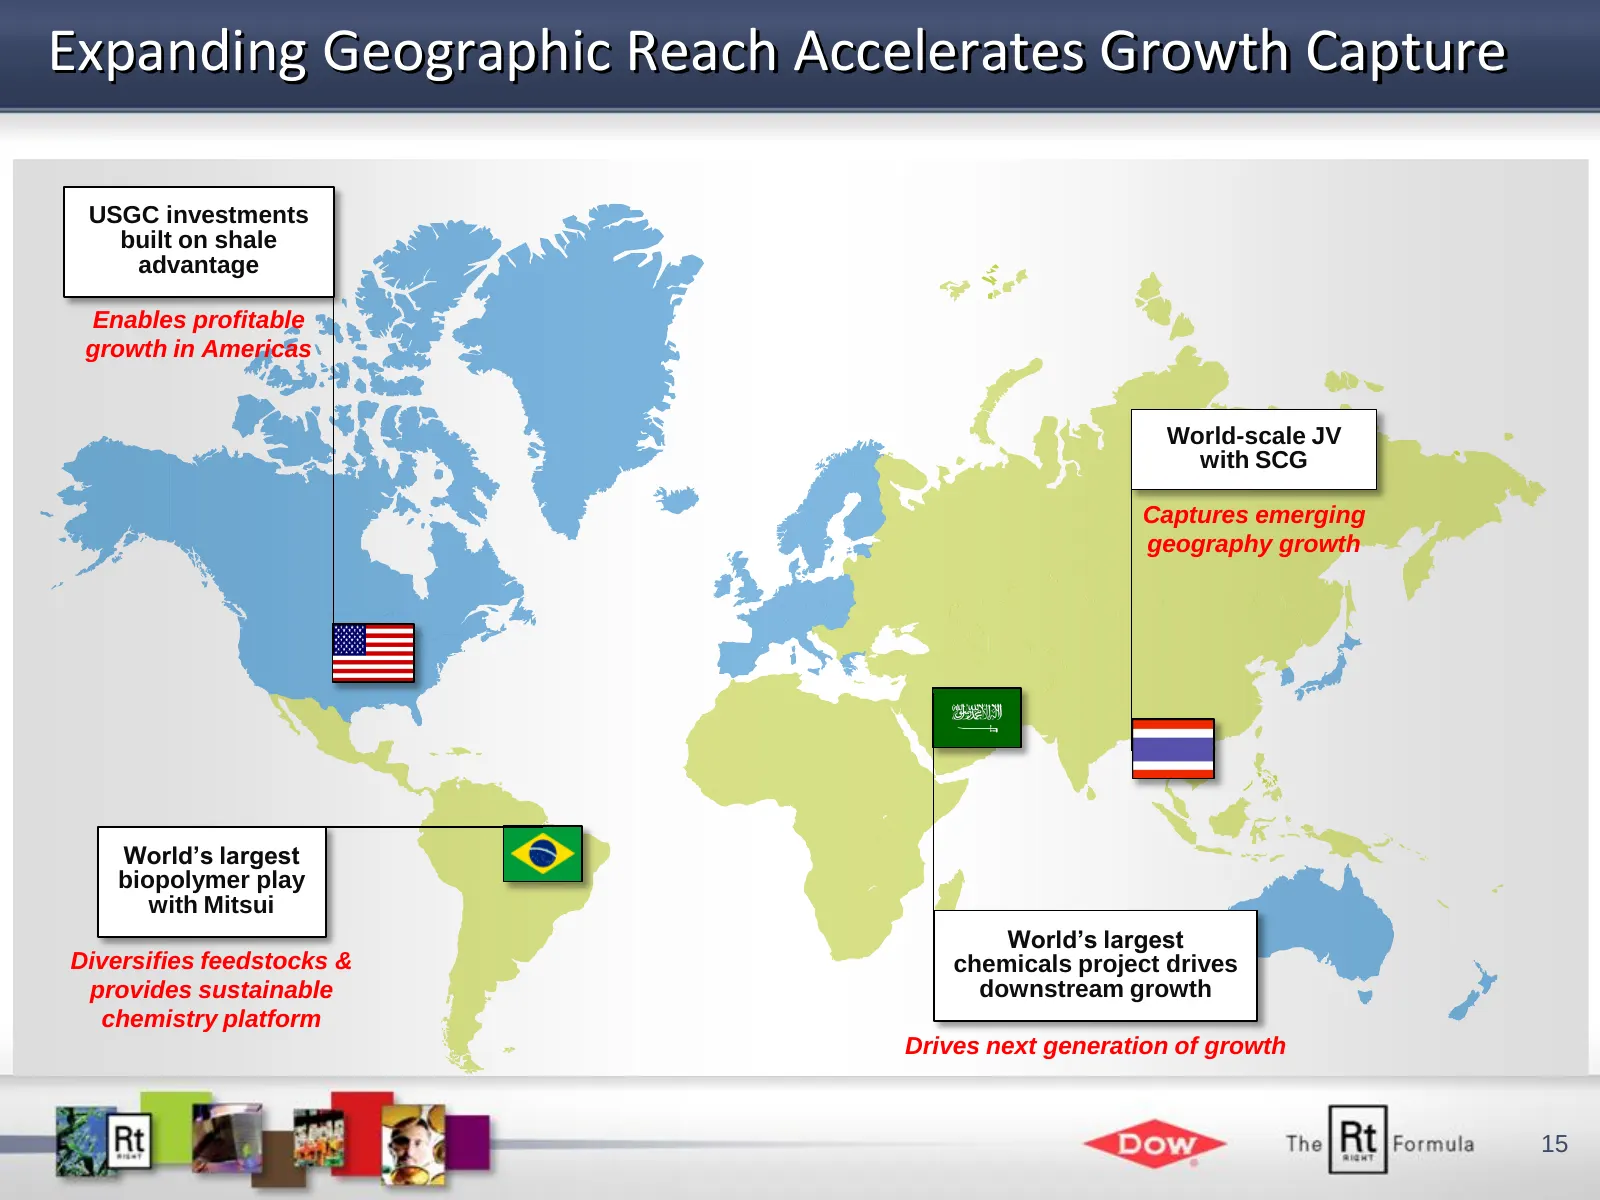
Expanding Geographic Reach Accelerates Growth Capture USGC investments built on shale advantage Enables profitable growth in Americas World-scale JV with SCG Captures emerging geography growth World’s largest biopolymer play with Mitsui World’s largest Diversifies feedstocks & chemicals project driv
Slide 16: Commercializing Our Innovation Pipeline
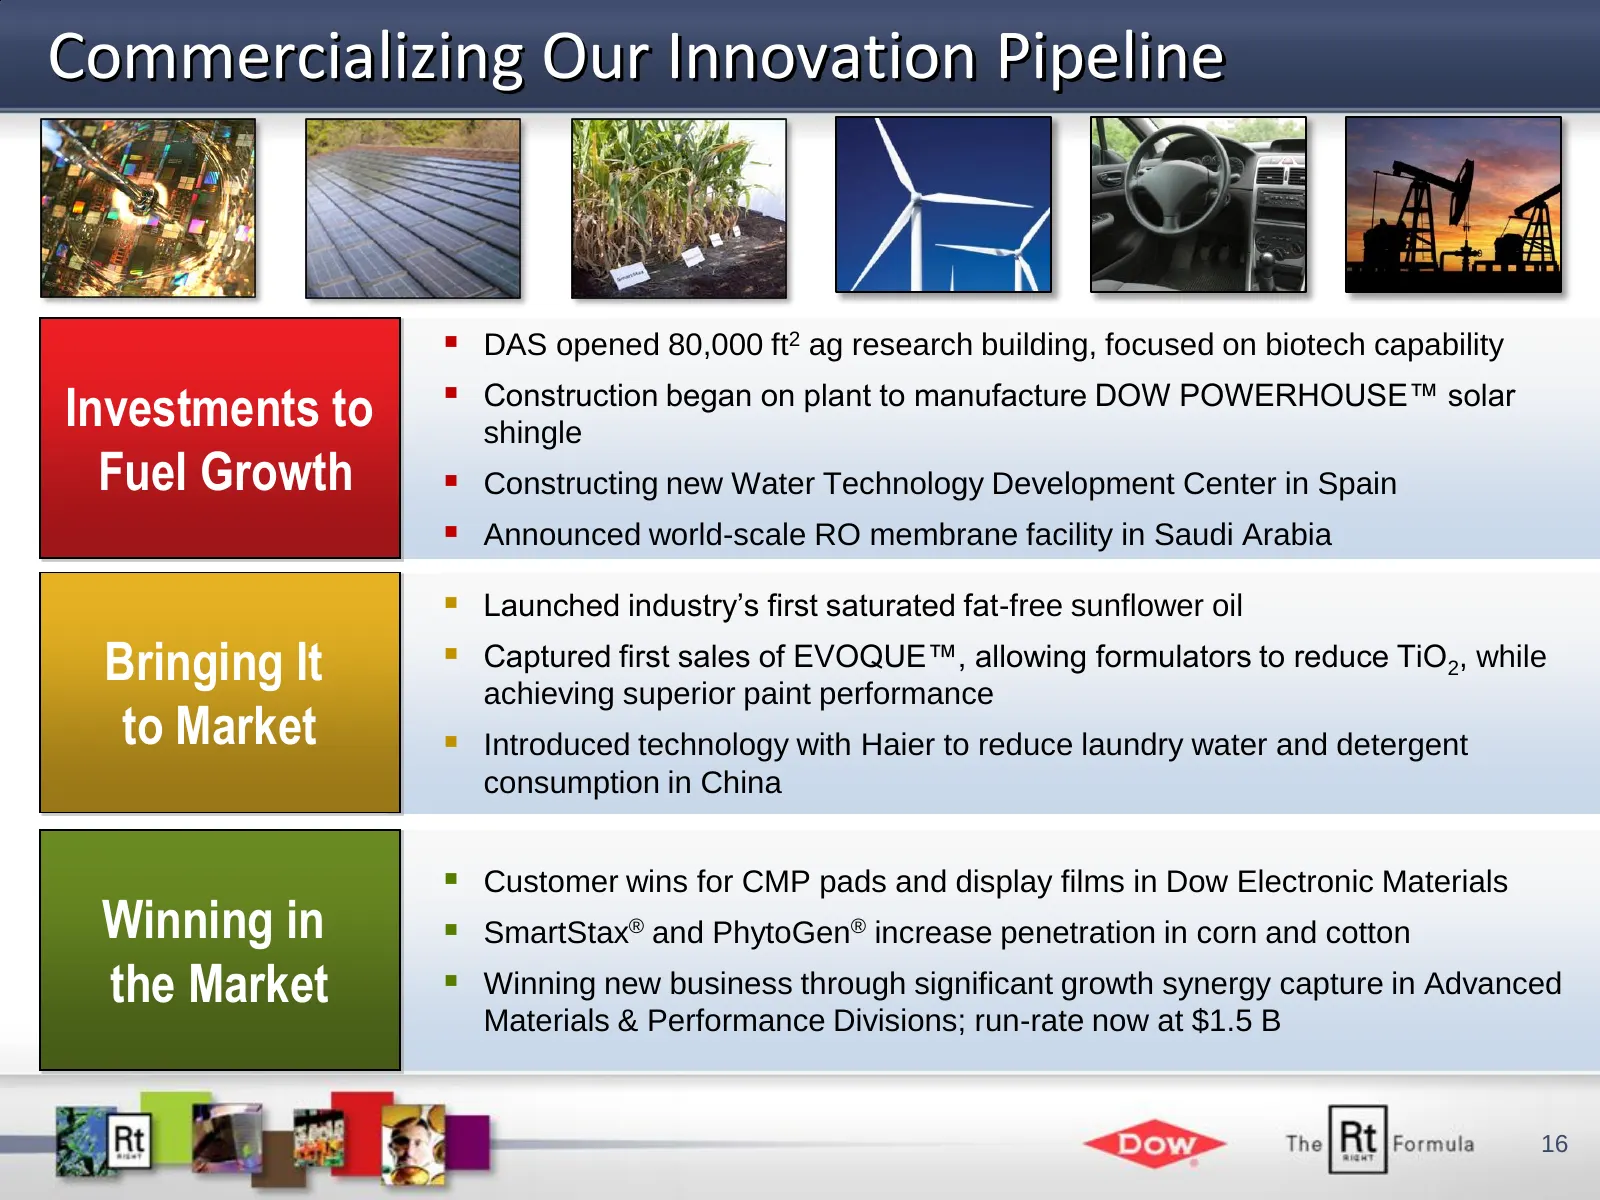
Commercializing Our Innovation Pipeline DAS opened 80,000 ft2 ag research building, focused on biotech capability Construction began on plant to manufacture DOW POWERHOUSE™ solar Investments to shingle Fuel Growth Constructing new Water Technology Development Center in Spain Announced world-
Slide 17: Partnerships Focused on Innovation and Growth
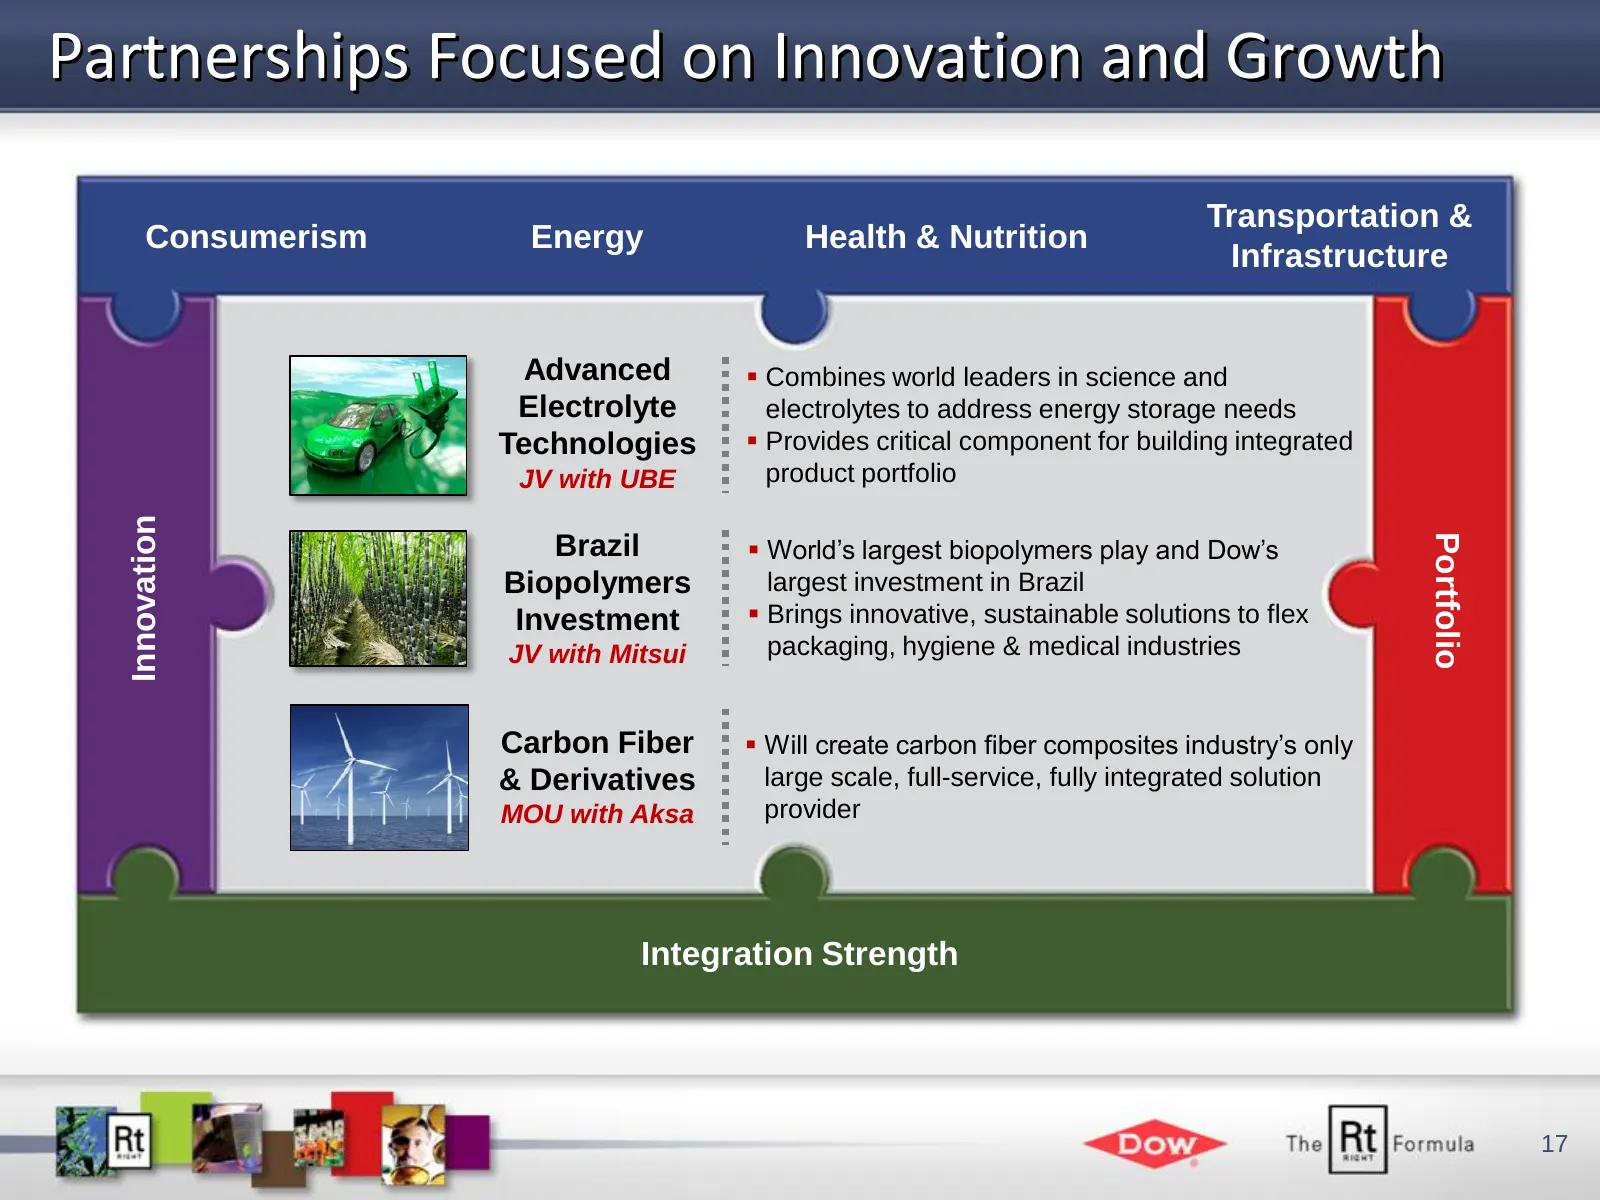
Partnerships Focused on Innovation and Growth Transportation & Consumerism Energy Health & Nutrition Infrastructure Advanced Combines world leaders in science and Electrolyte electrolytes to address energy storage needs Technologies Provides critical component for building integrated JV with UBE
Slide 18: Sadara Commences a New Era of Growth
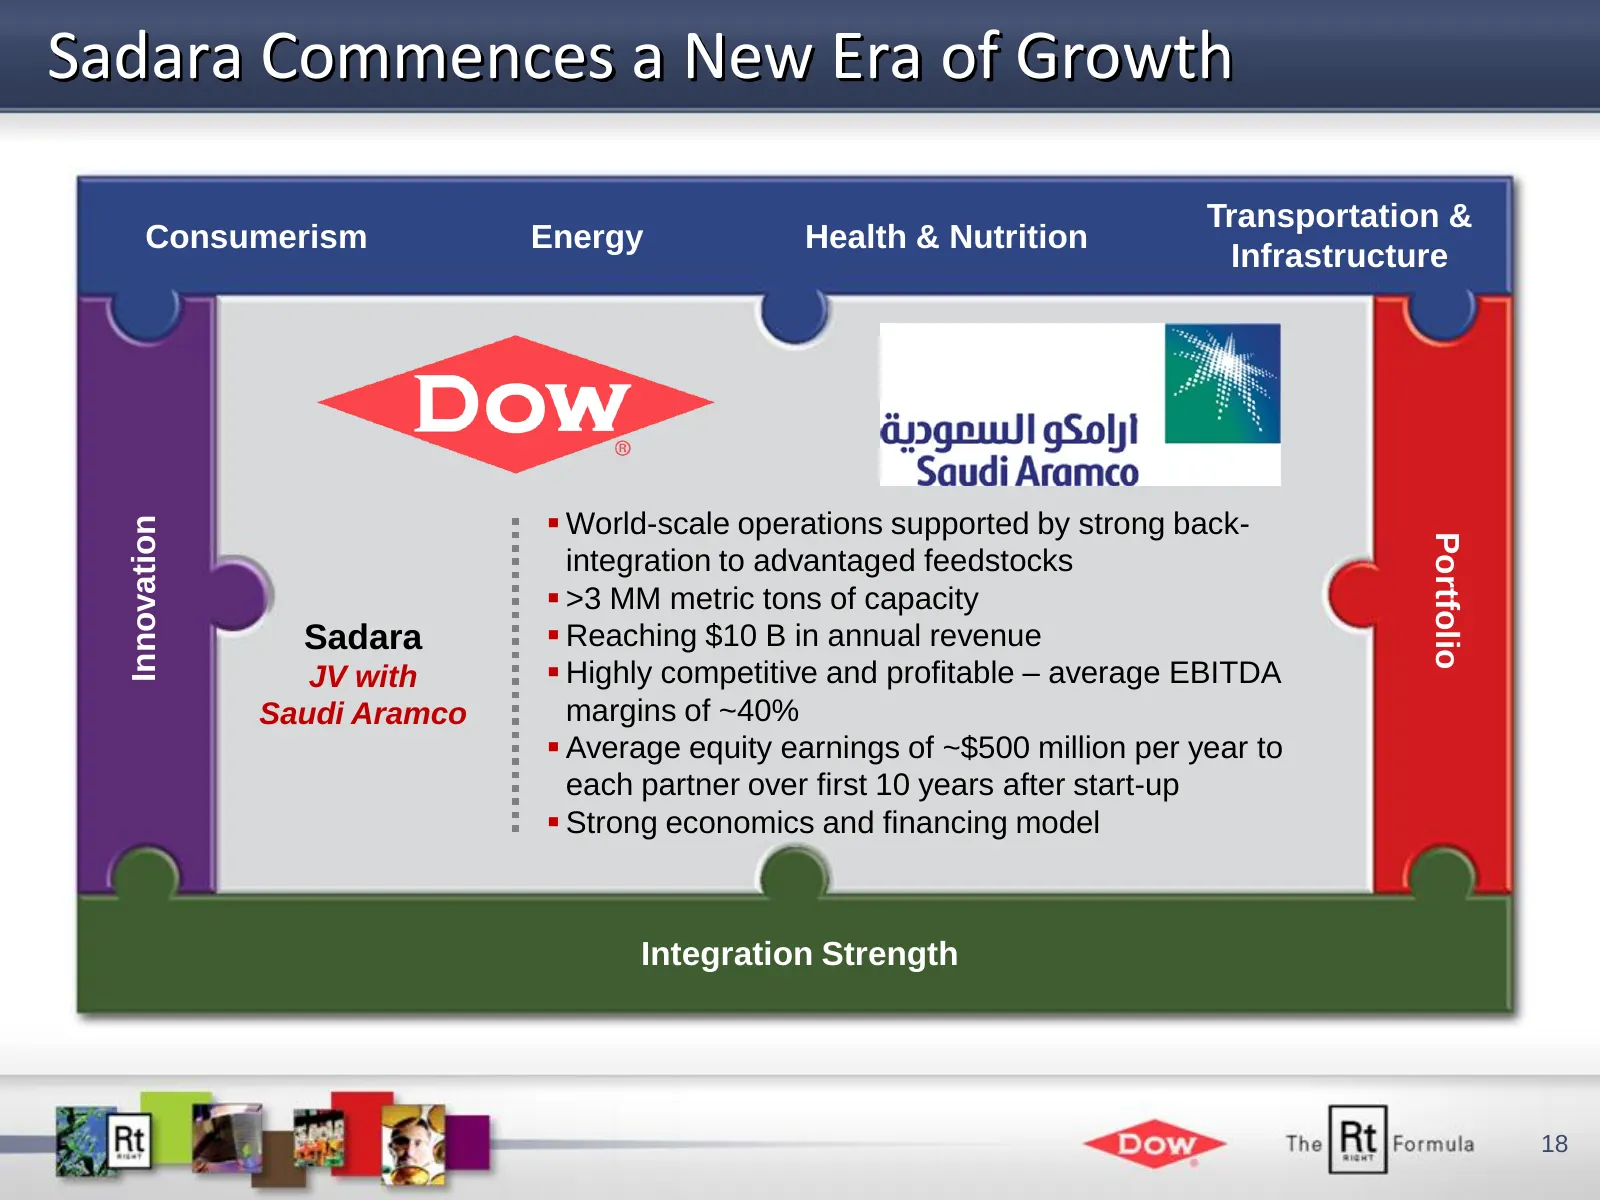
Sadara Commences a New Era of Growth Transportation & Consumerism Energy Health & Nutrition Infrastructure World-scale operations supported by strong back- Innovation Portfolio integration to advantaged feedstocks >3 MM metric tons of capacity Sadara Reaching $10 B in annual revenue JV with
Slide 19: Outlook: Geographic and Sector Insights
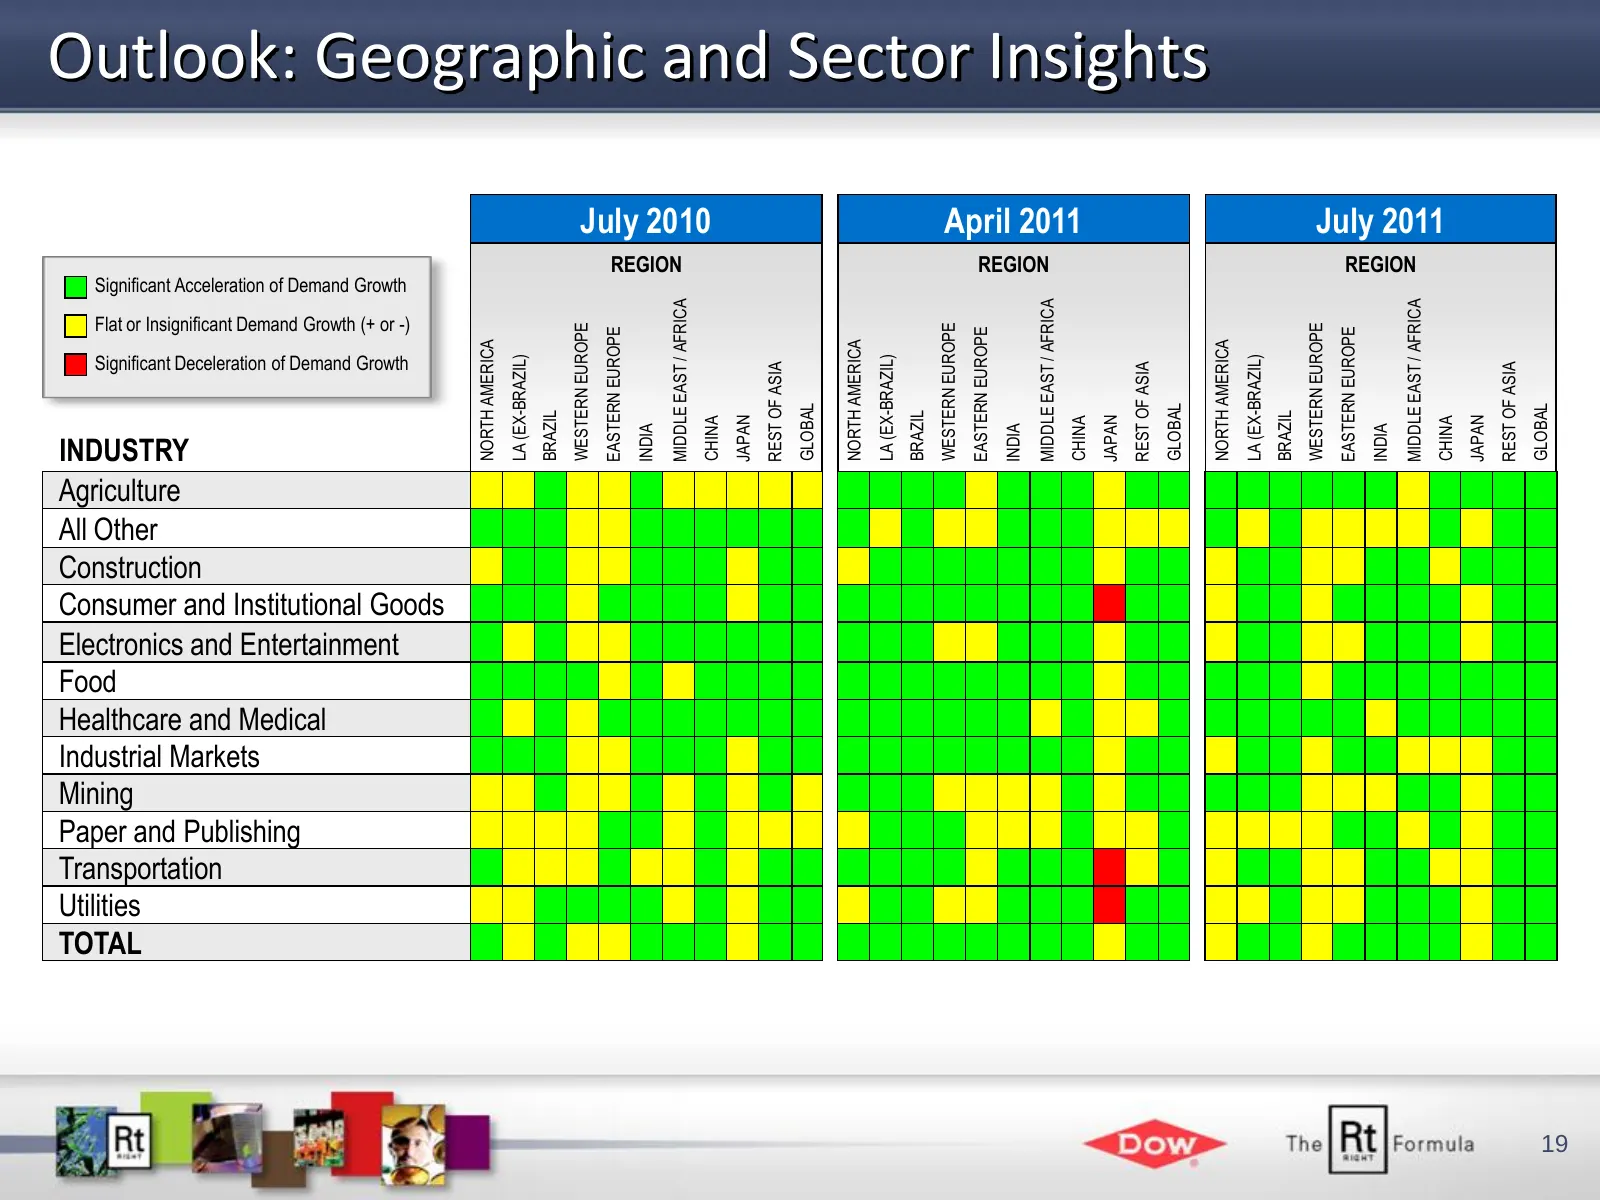
Outlook: Geographic and Sector Insights July 2010 April 2011 July 2011 REGION REGION REGION Significant Acceleration of Demand Growth MIDDLE EAST / AFRICA MIDDLE EAST / AFRICA MIDDLE EAST / AFRICA Flat or Insignificant Demand Growth (+ or -) WESTERN EUROPE WESTERN EUROPE WESTERN EUROPE EASTERN EUROP
Slide 20: On Track to Deliver 2011 Priorities
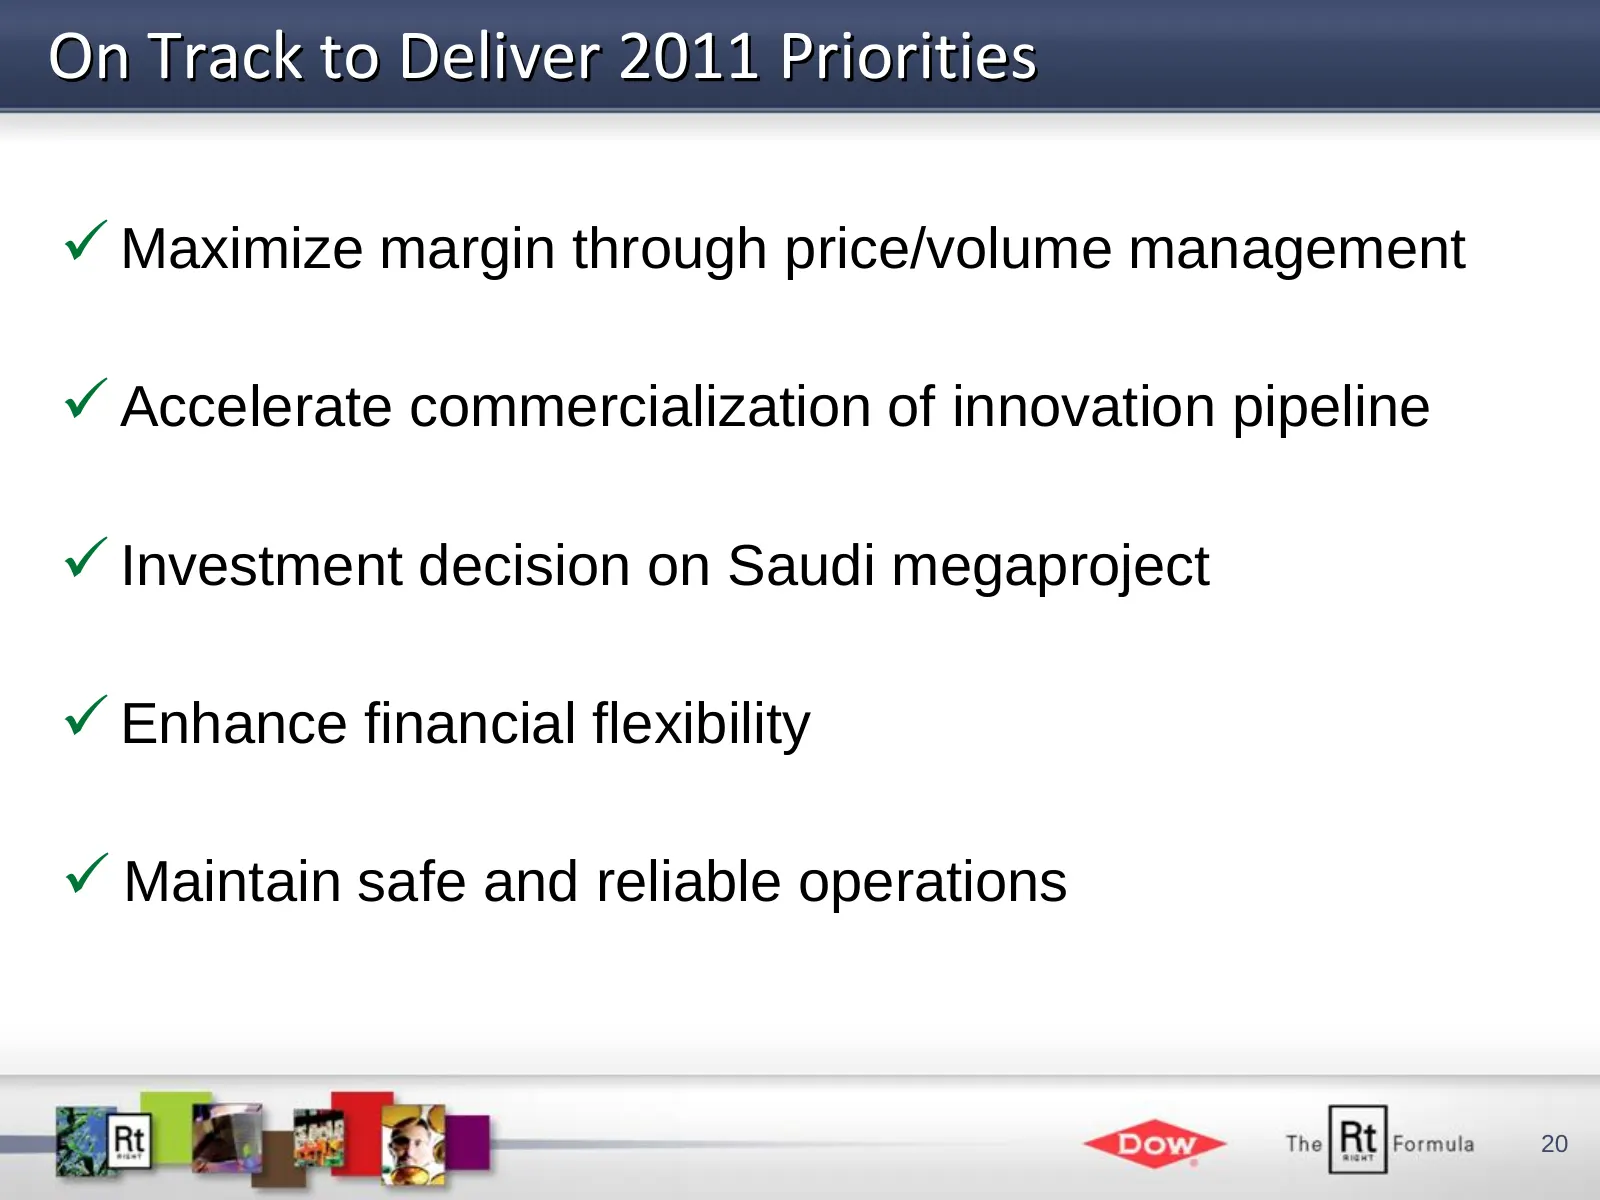
On Track to Deliver 2011 Priorities Maximize margin through price/volume management Accelerate commercialization of innovation pipeline Investment decision on Saudi megaproject Enhance financial flexibility Maintain safe and reliable operations 20
Slide 21: Investor Day 2011
Investor Day 2011 New York, NY • October 4, 2011 • Updates on key near-term milestones • Insights into next level of earnings • Meet business, innovation and commercial leaders • For more information: ir@dow.com 21
Slide 22: The Rt Formula
The Rt Formula 22
Slide 23: Appendix
Appendix <> The Rt Formula 23
Slide 24: Electronic & Specialty Materials
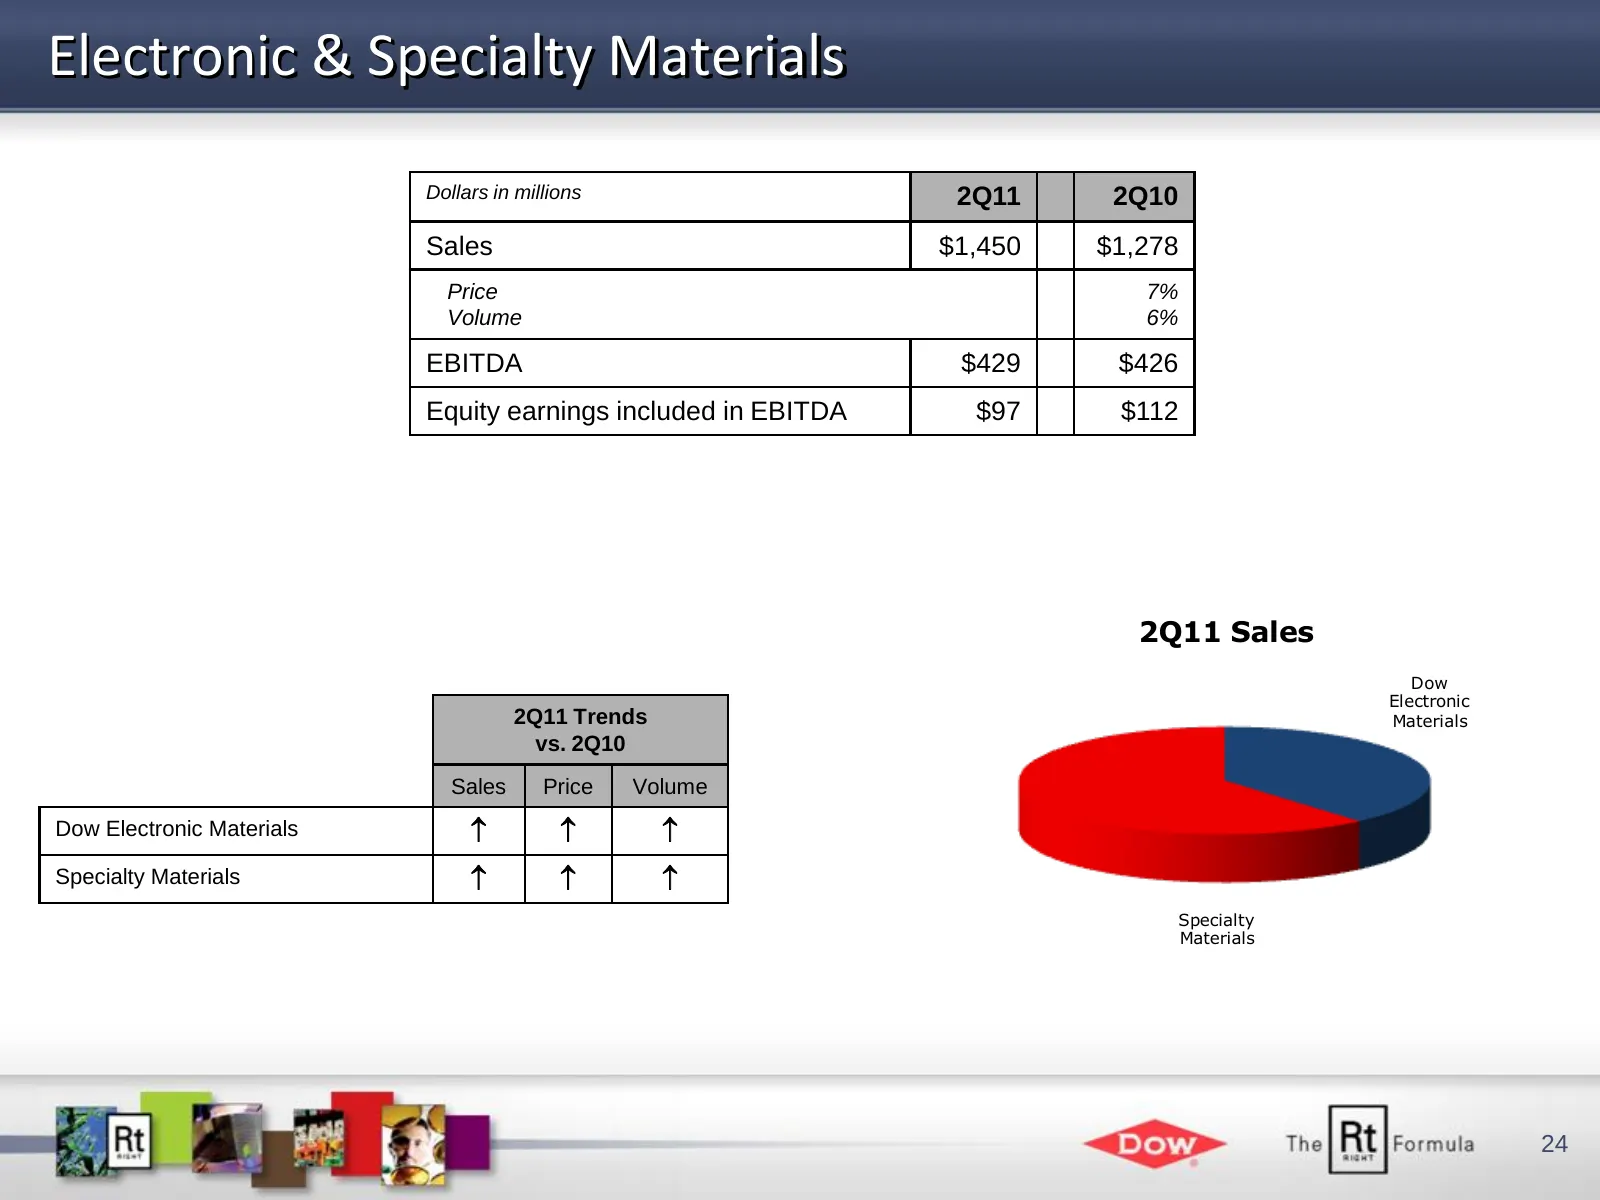
Electronic & Specialty Materials Dollars in millions 2Q11 2Q10 Sales $1,450 $1,278 Price 7% Volume 6% EBITDA $429 $426 Equity earnings included in EBITDA $97 $112 2Q11 Sales Dow Electronic 2Q11 Trends Materials vs. 2Q10 Sales Price Volume Dow Electronic Materials Specialty Materials Spec
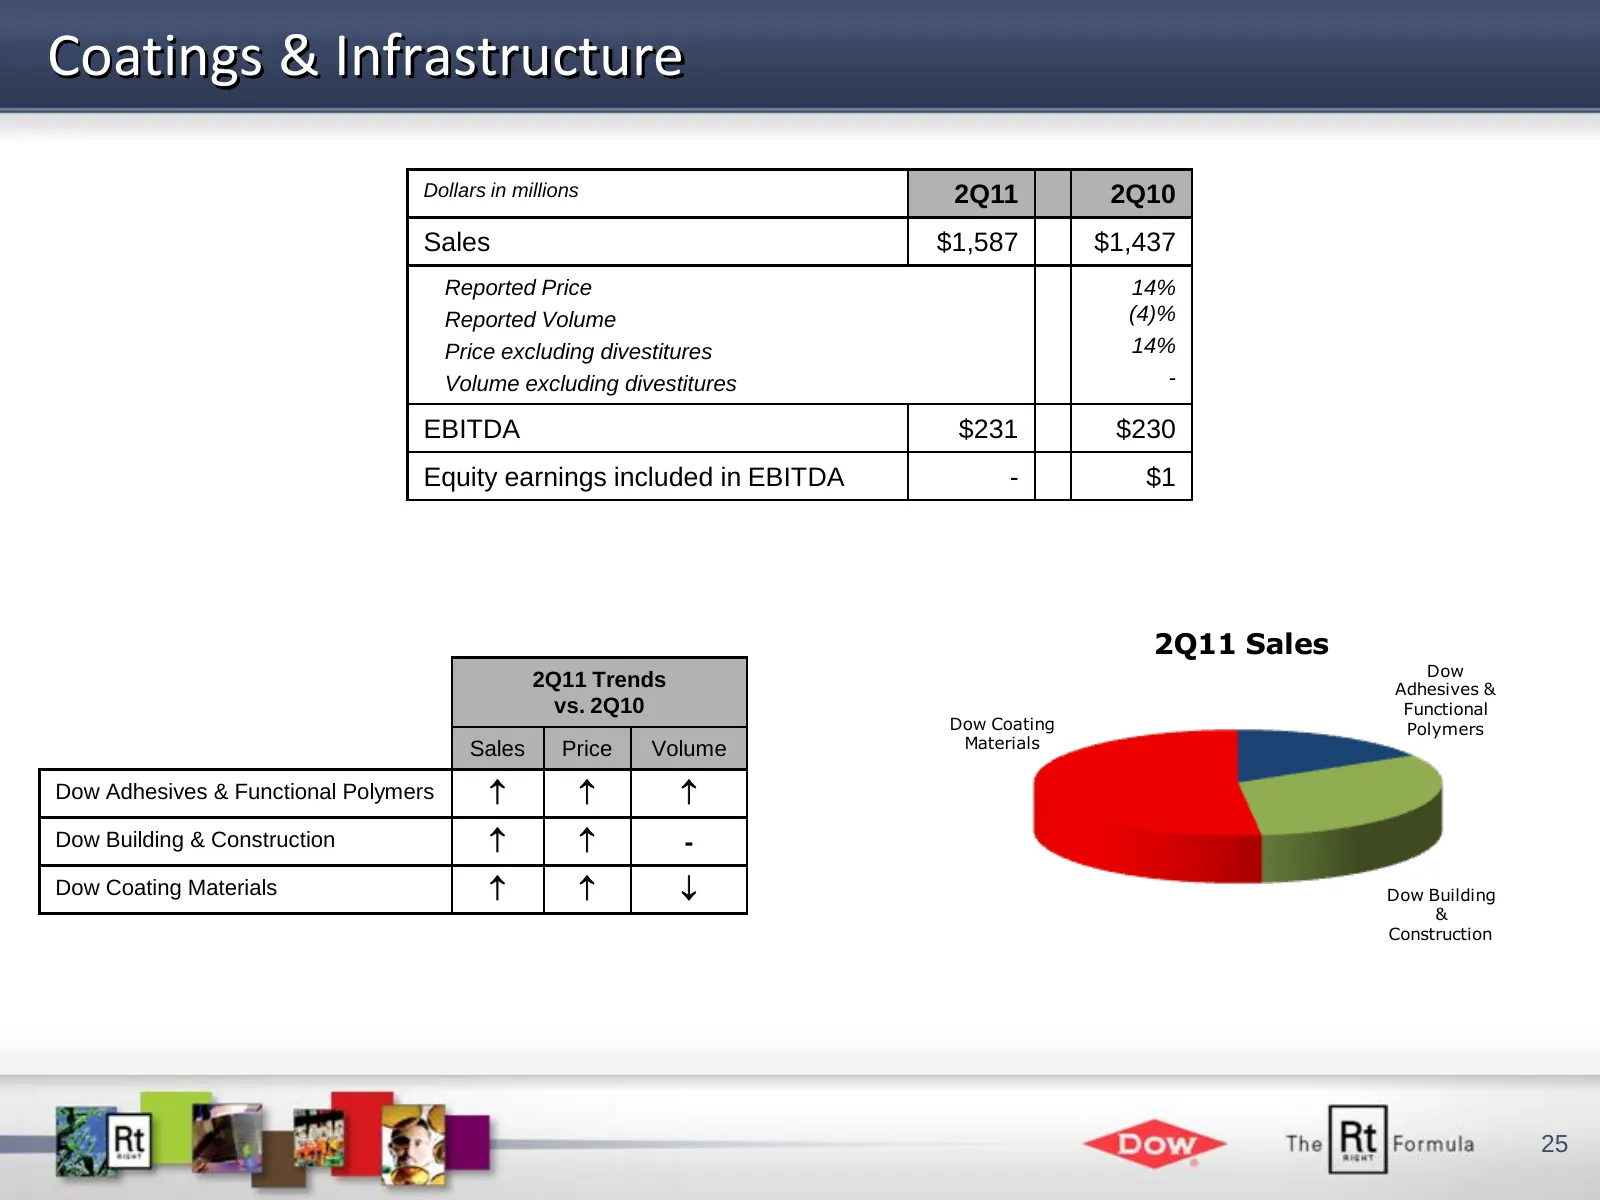
Slide 25: Coatings & Infrastructure
Coatings & Infrastructure Dollars in millions 2Q11 2Q10 Sales $1,587 $1,437 Reported Price 14% Reported Volume (4)% Price excluding divestitures 14% Volume excluding divestitures - EBITDA $231 $230 Equity earnings included in EBITDA - $1 2Q11 Sales Dow 2Q11 Trends Adhesives & vs. 2Q10 Functional Dow
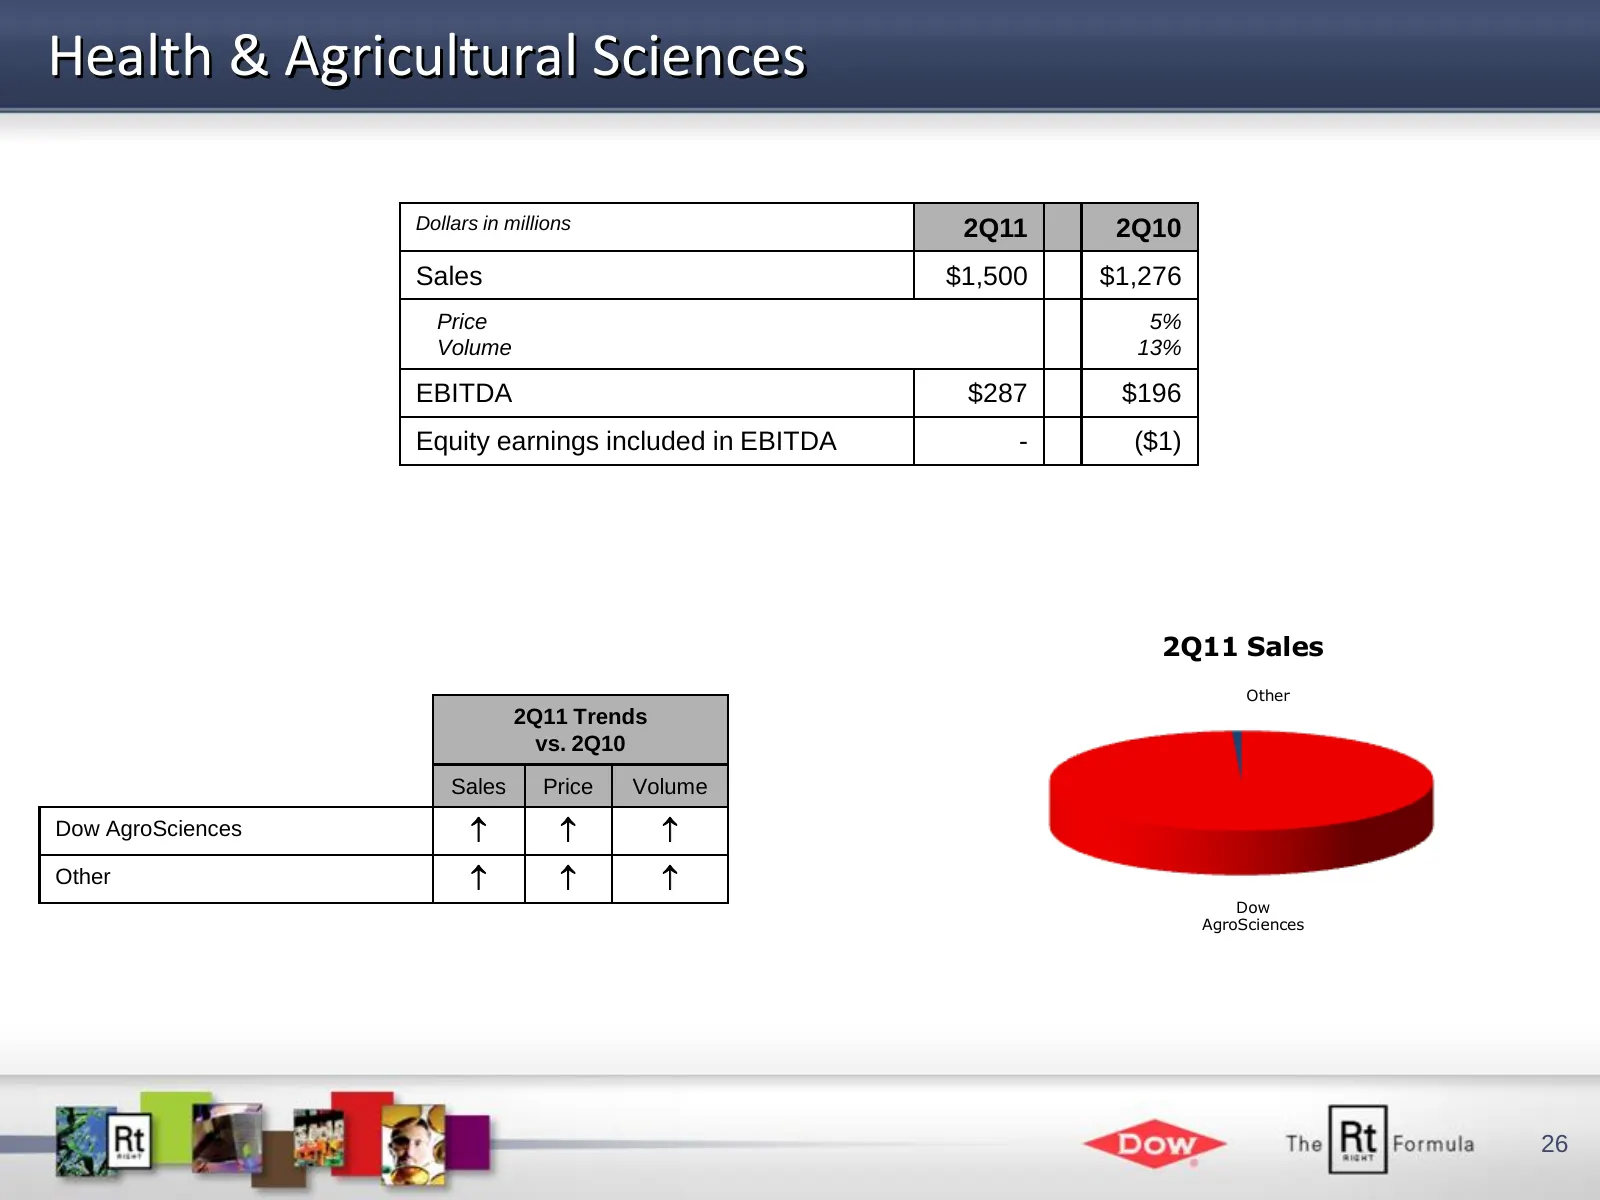
Slide 26: Health & Agricultural Sciences
Health & Agricultural Sciences Dollars in millions 2Q11 2Q10 Sales $1,500 $1,276 Price 5% Volume 13% EBITDA $287 $196 Equity earnings included in EBITDA - ($1) 2Q11 Sales Other 2Q11 Trends vs. 2Q10 Sales Price Volume Dow AgroSciences Other Dow AgroSciences 26
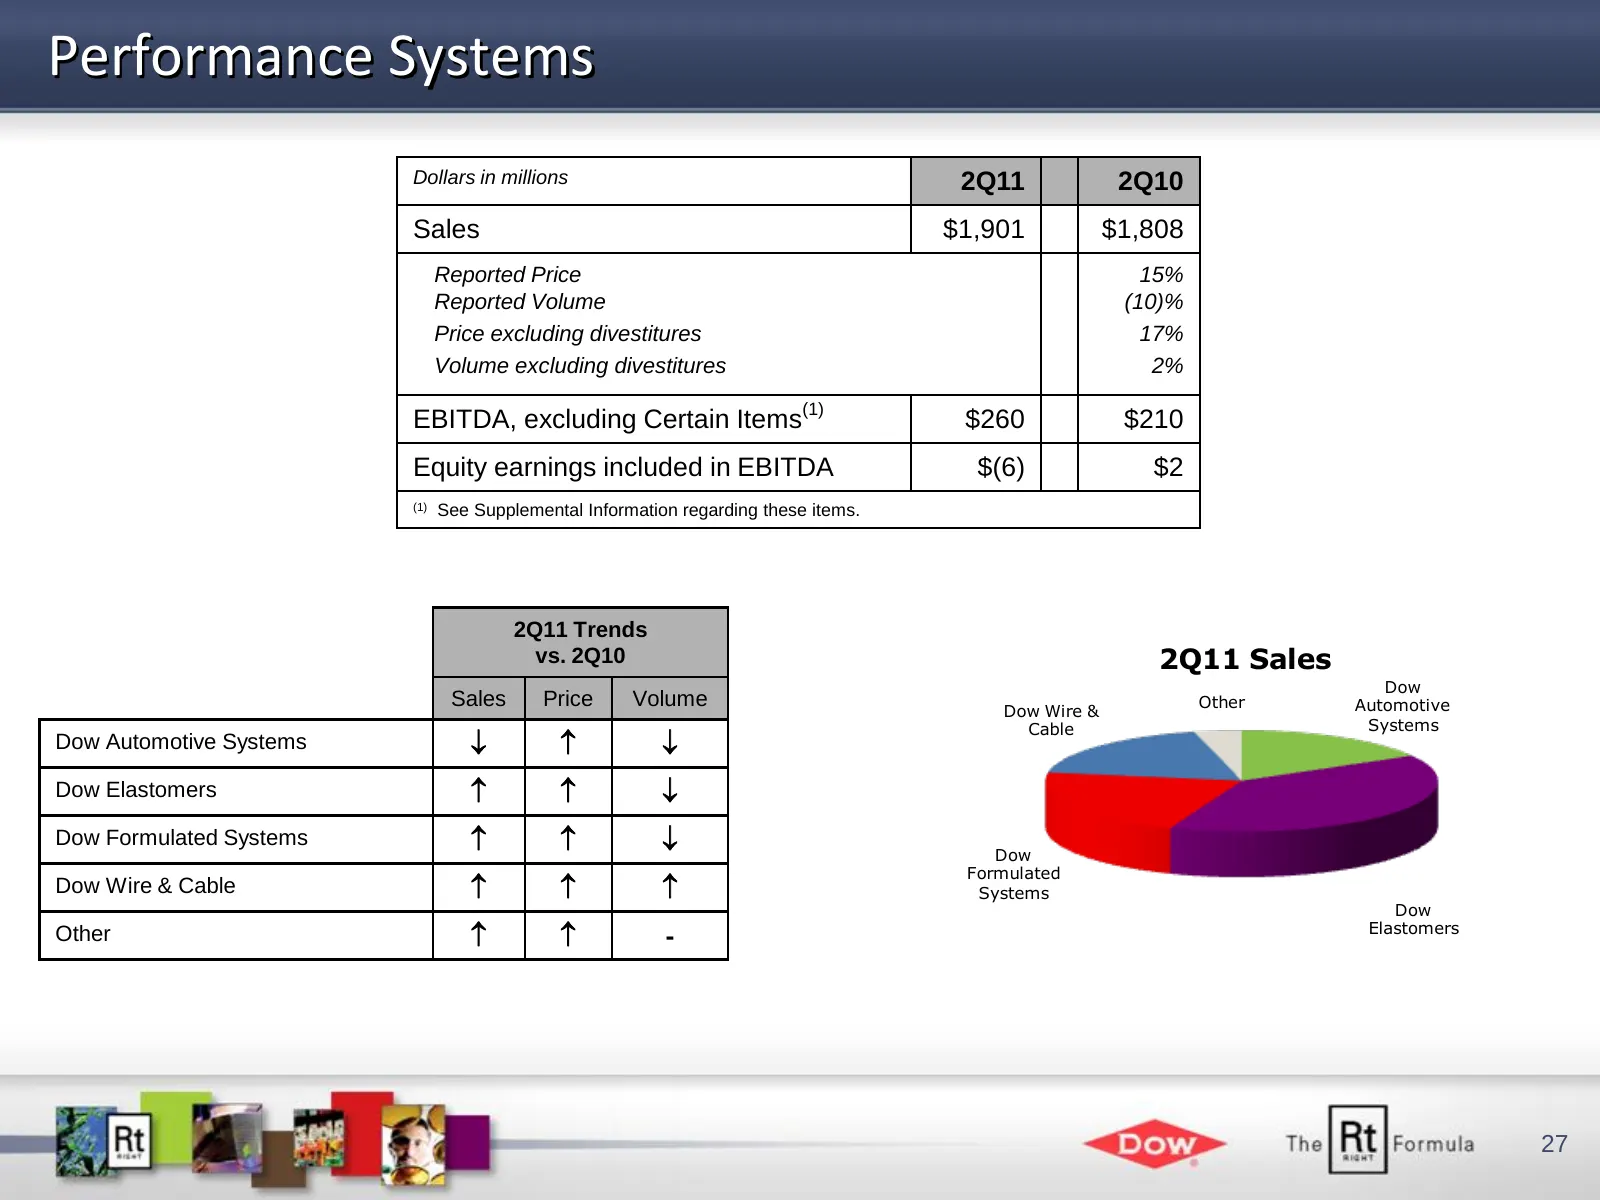
Slide 27: Performance Systems
Performance Systems Dollars in millions 2Q11 2Q10 Sales $1,901 $1,808 Reported Price 15% Reported Volume (10)% Price excluding divestitures 17% Volume excluding divestitures 2% EBITDA, excluding Certain Items(1) $260 $210 Equity earnings included in EBITDA $(6) $2 (1) See Supplemental Information re
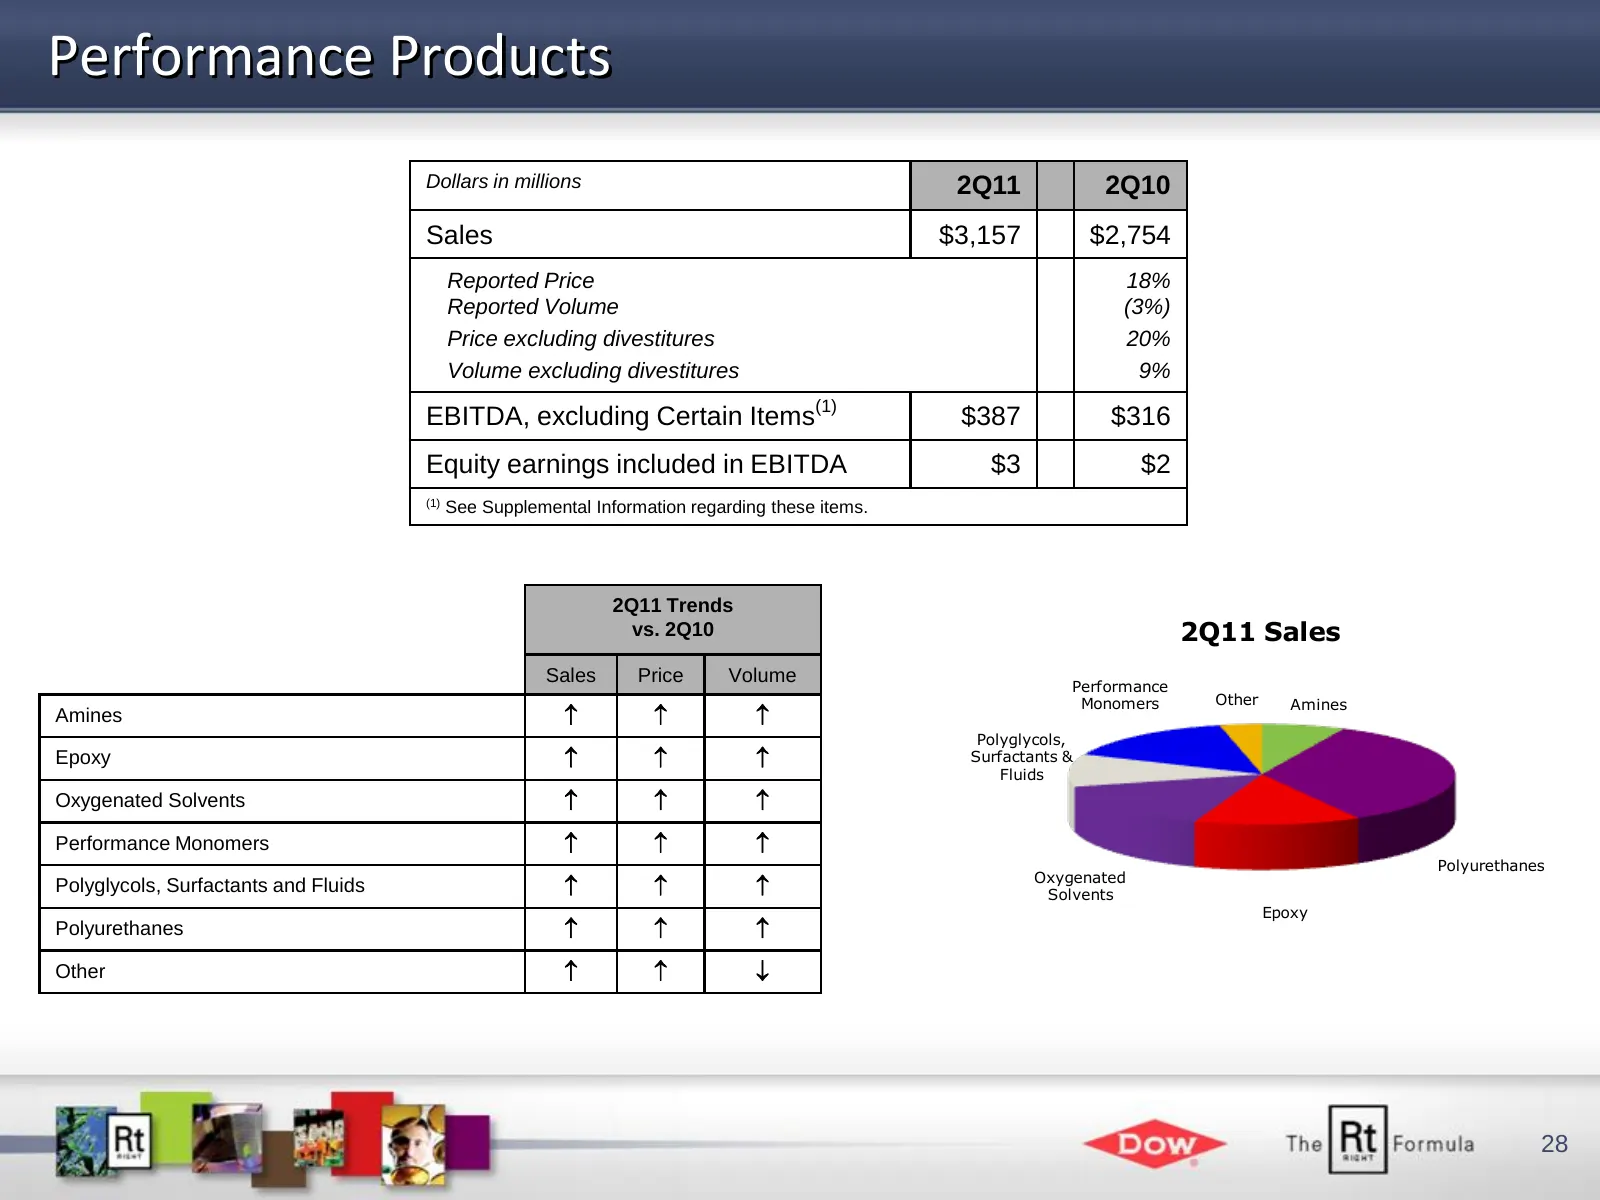
Slide 28: Performance Products
Performance Products Dollars in millions 2Q11 2Q10 Sales $3,157 $2,754 Reported Price 18% Reported Volume (3%) Price excluding divestitures 20% Volume excluding divestitures 9% EBITDA, excluding Certain Items(1) $387 $316 Equity earnings included in EBITDA $3 $2 (1) See Supplemental Information rega
Slide 29: Plastics
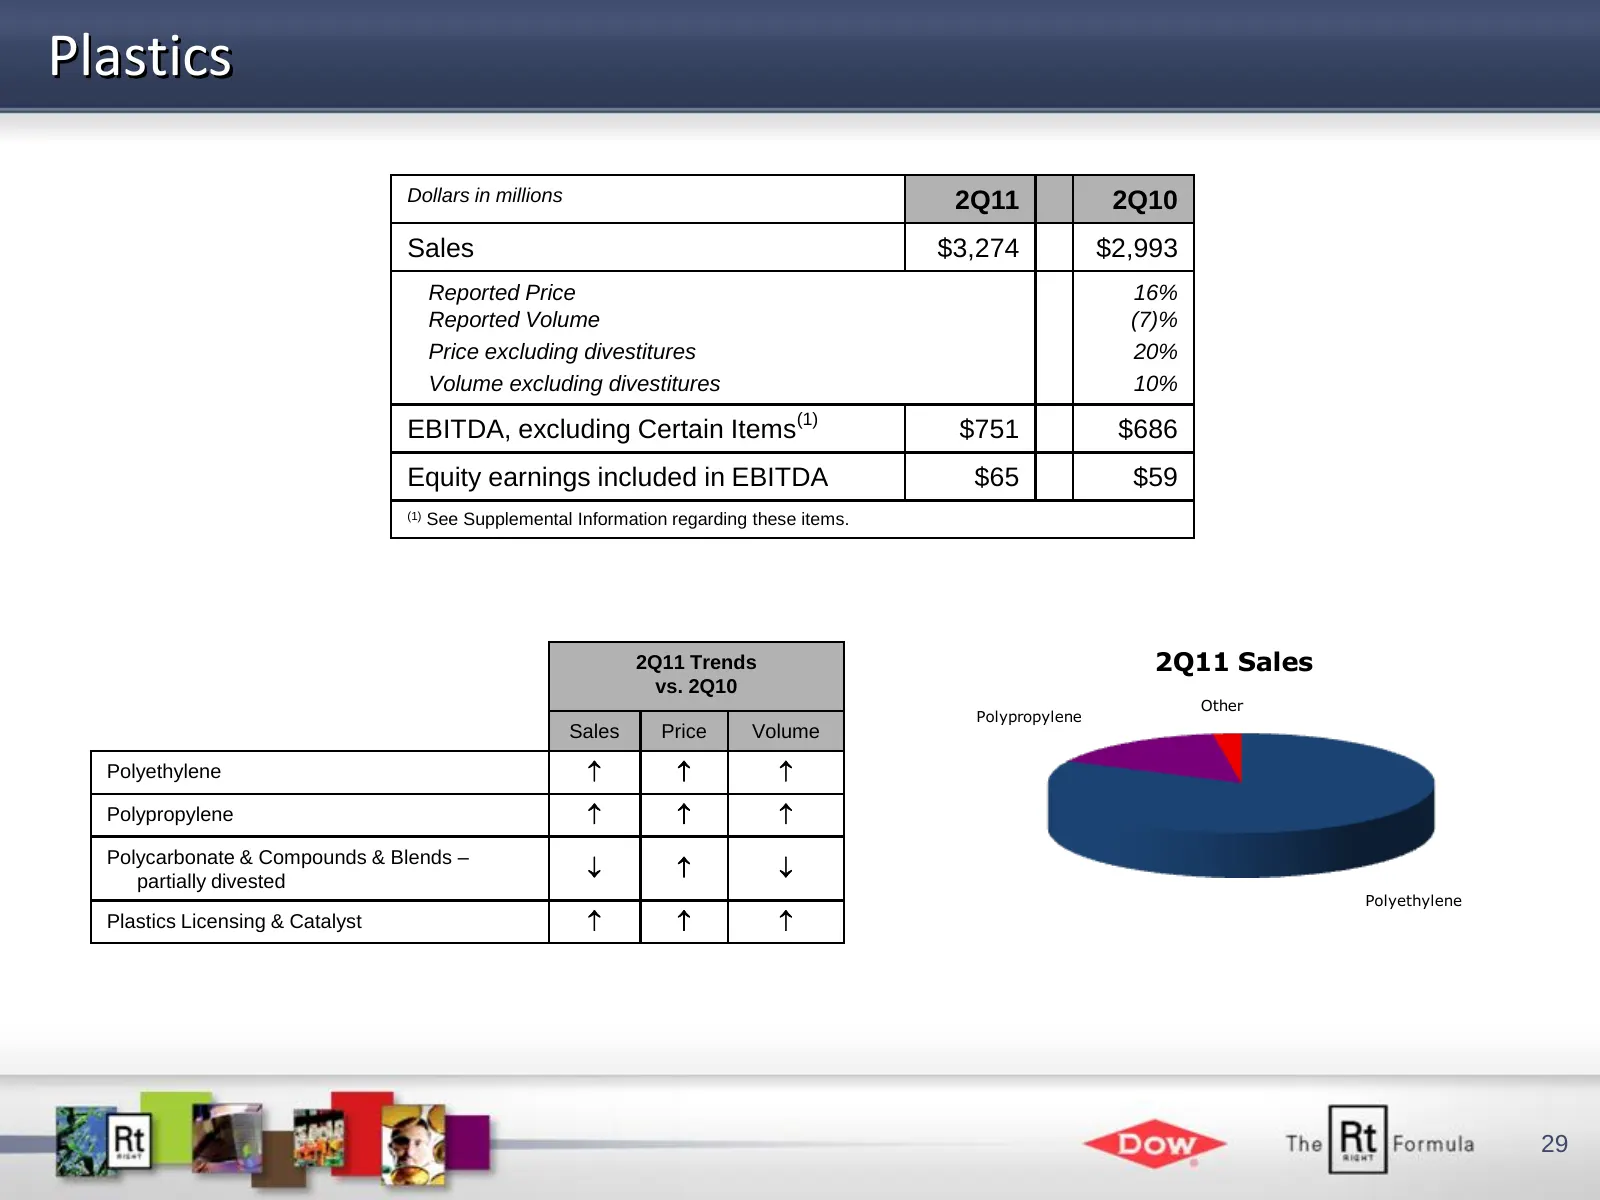
Plastics Dollars in millions 2Q11 2Q10 Sales $3,274 $2,993 Reported Price 16% Reported Volume (7)% Price excluding divestitures 20% Volume excluding divestitures 10% EBITDA, excluding Certain Items(1) $751 $686 Equity earnings included in EBITDA $65 $59 (1) See Supplemental Information regarding the
Slide 30: Chemicals & Energy
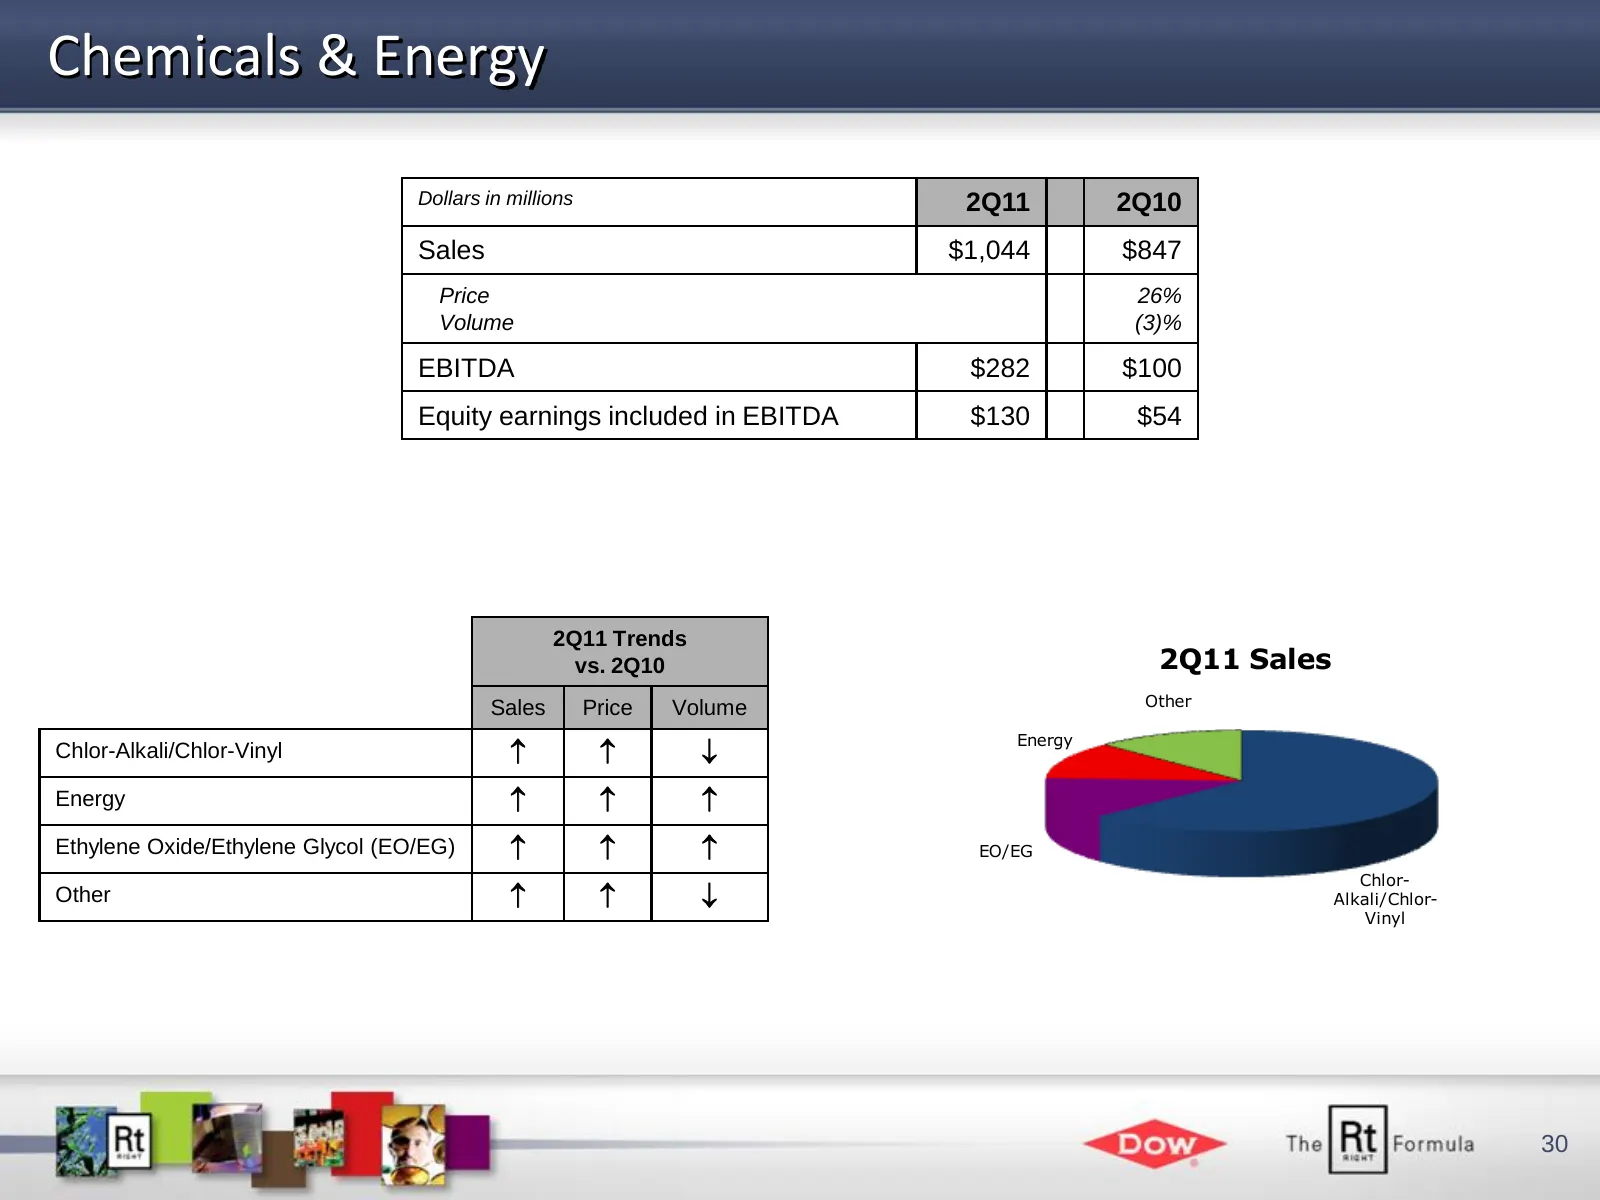
Chemicals & Energy Dollars in millions 2Q11 2Q10 Sales $1,044 $847 Price 26% Volume (3)% EBITDA $282 $100 Equity earnings included in EBITDA $130 $54 2Q11 Trends vs. 2Q10 2Q11 Sales Other Sales Price Volume Energy Chlor-Alkali/Chlor-Vinyl Energy Ethylene Oxide/Ethylene Glycol (EO/EG)
Slide 31: Reconciliation of Non-GAAP Financial Measure
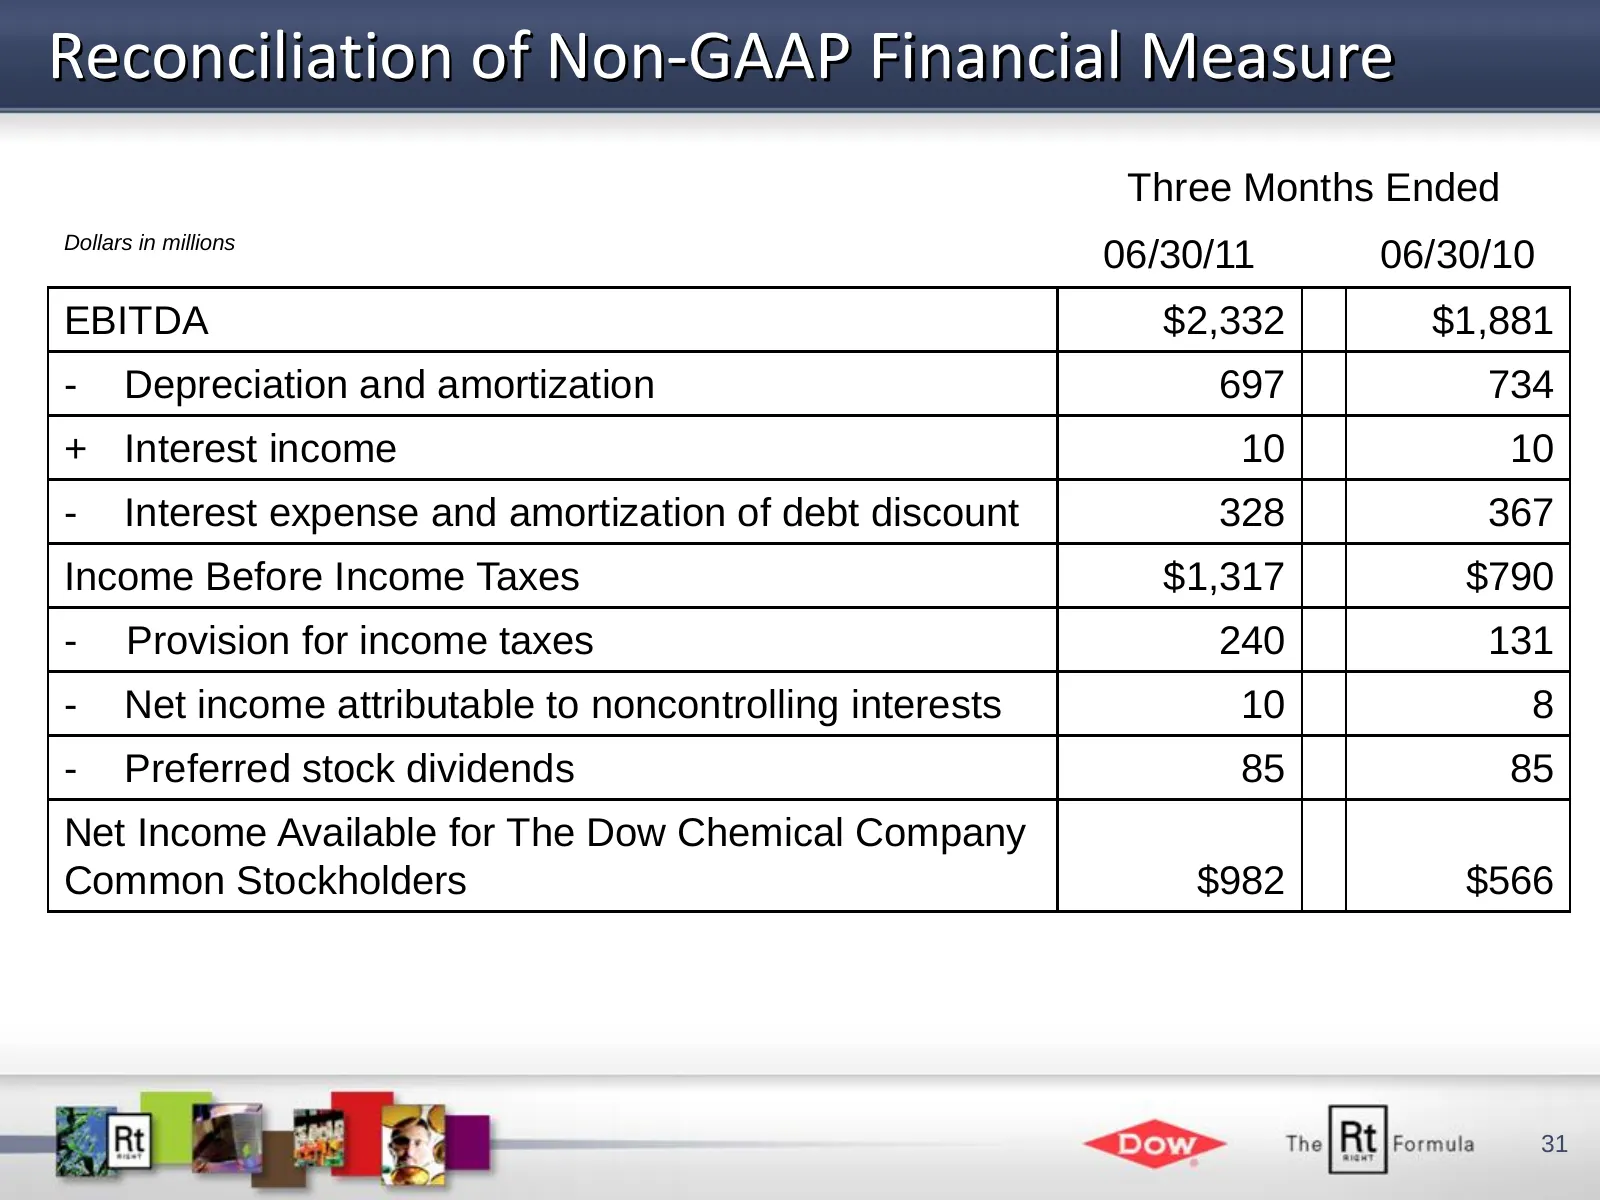
Reconciliation of Non-GAAP Financial Measure Three Months Ended Dollars in millions 06/30/11 06/30/10 EBITDA $2,332 $1,881 - Depreciation and amortization 697 734 + Interest income 10 10 - Interest expense and amortization of debt discount 328 367 Income Before Income Taxes $1,317 $790 - Provision f
Slide 32: Supplemental Information
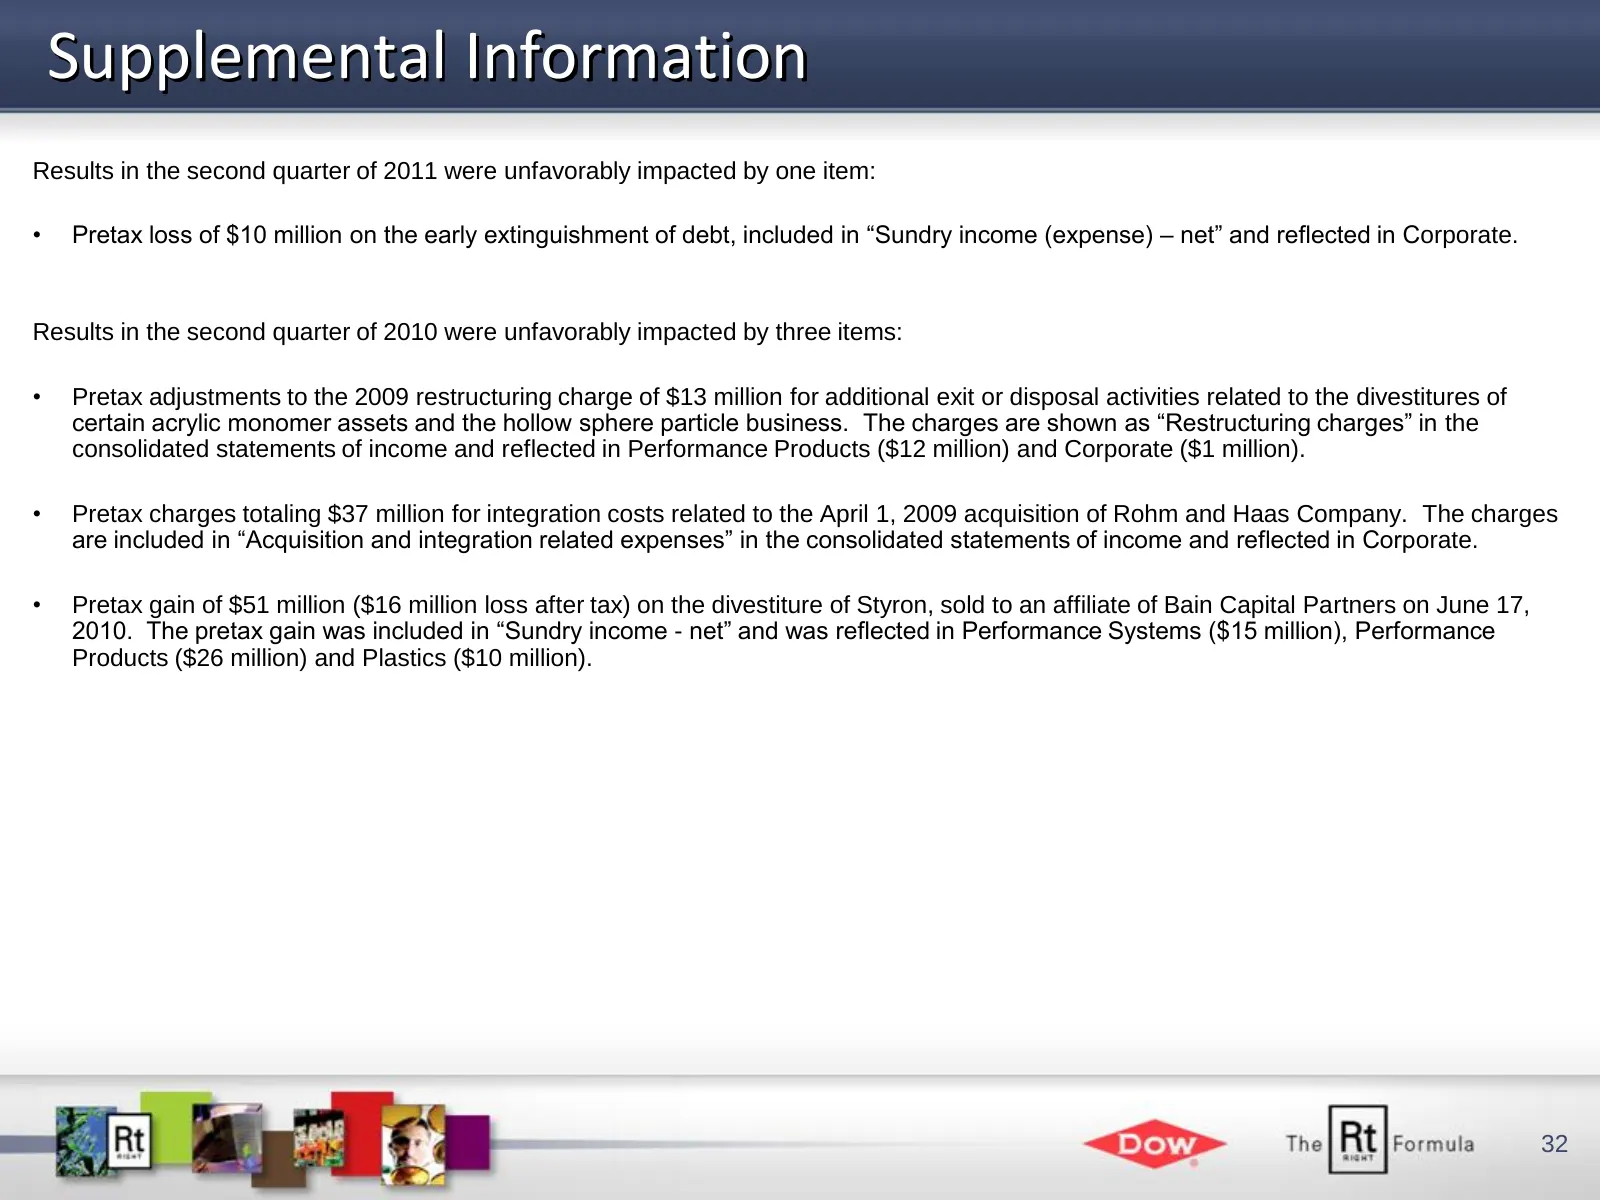
Supplemental Information Results in the second quarter of 2011 were unfavorably impacted by one item: • Pretax loss of $10 million on the early extinguishment of debt, included in “Sundry income (expense) – net” and reflected in Corporate. Results in the second quarter of 2010 were unfavorably impac
Slide 33: Supplemental Information
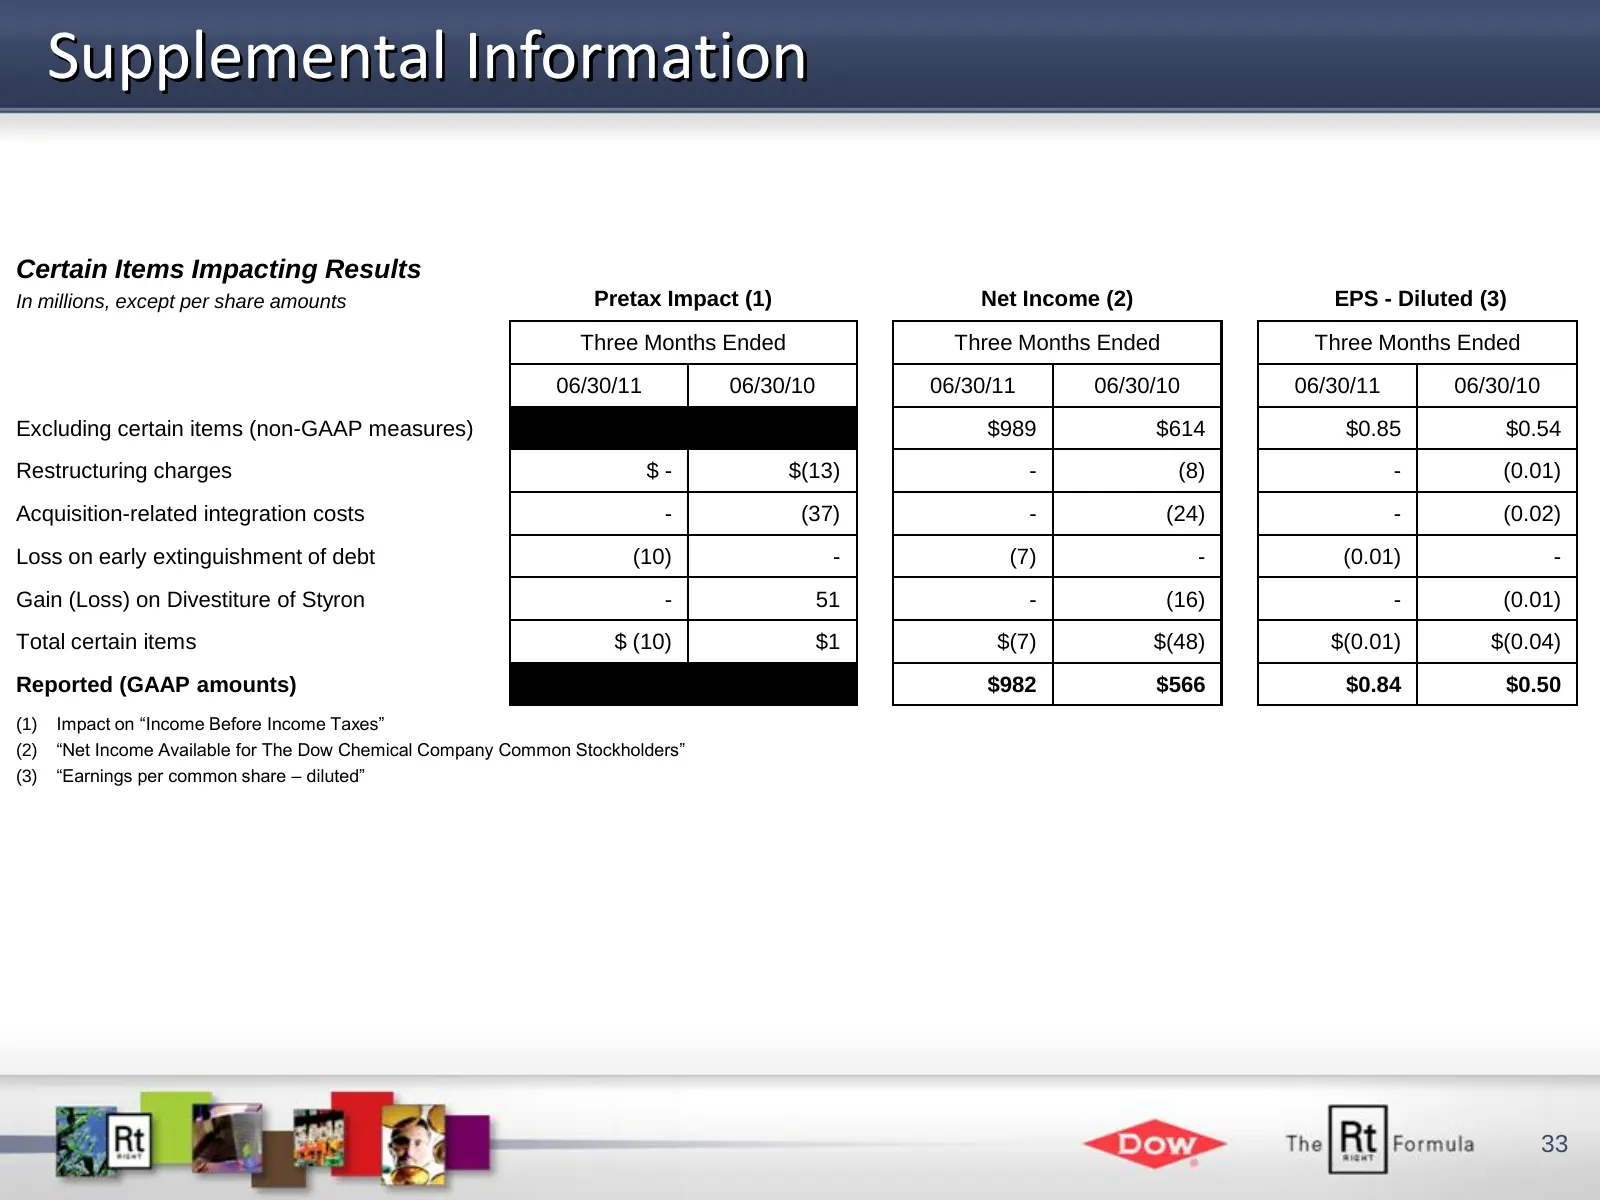
Supplemental Information Certain Items Impacting Results In millions, except per share amounts Pretax Impact (1) Net Income (2) EPS - Diluted (3) Three Months Ended Three Months Ended Three Months Ended 06/30/11 06/30/10 06/30/11 06/30/10 06/30/11 06/30/10 Excluding certain items (non-GAAP measures)
Slide 34: Certain Items Affecting Results
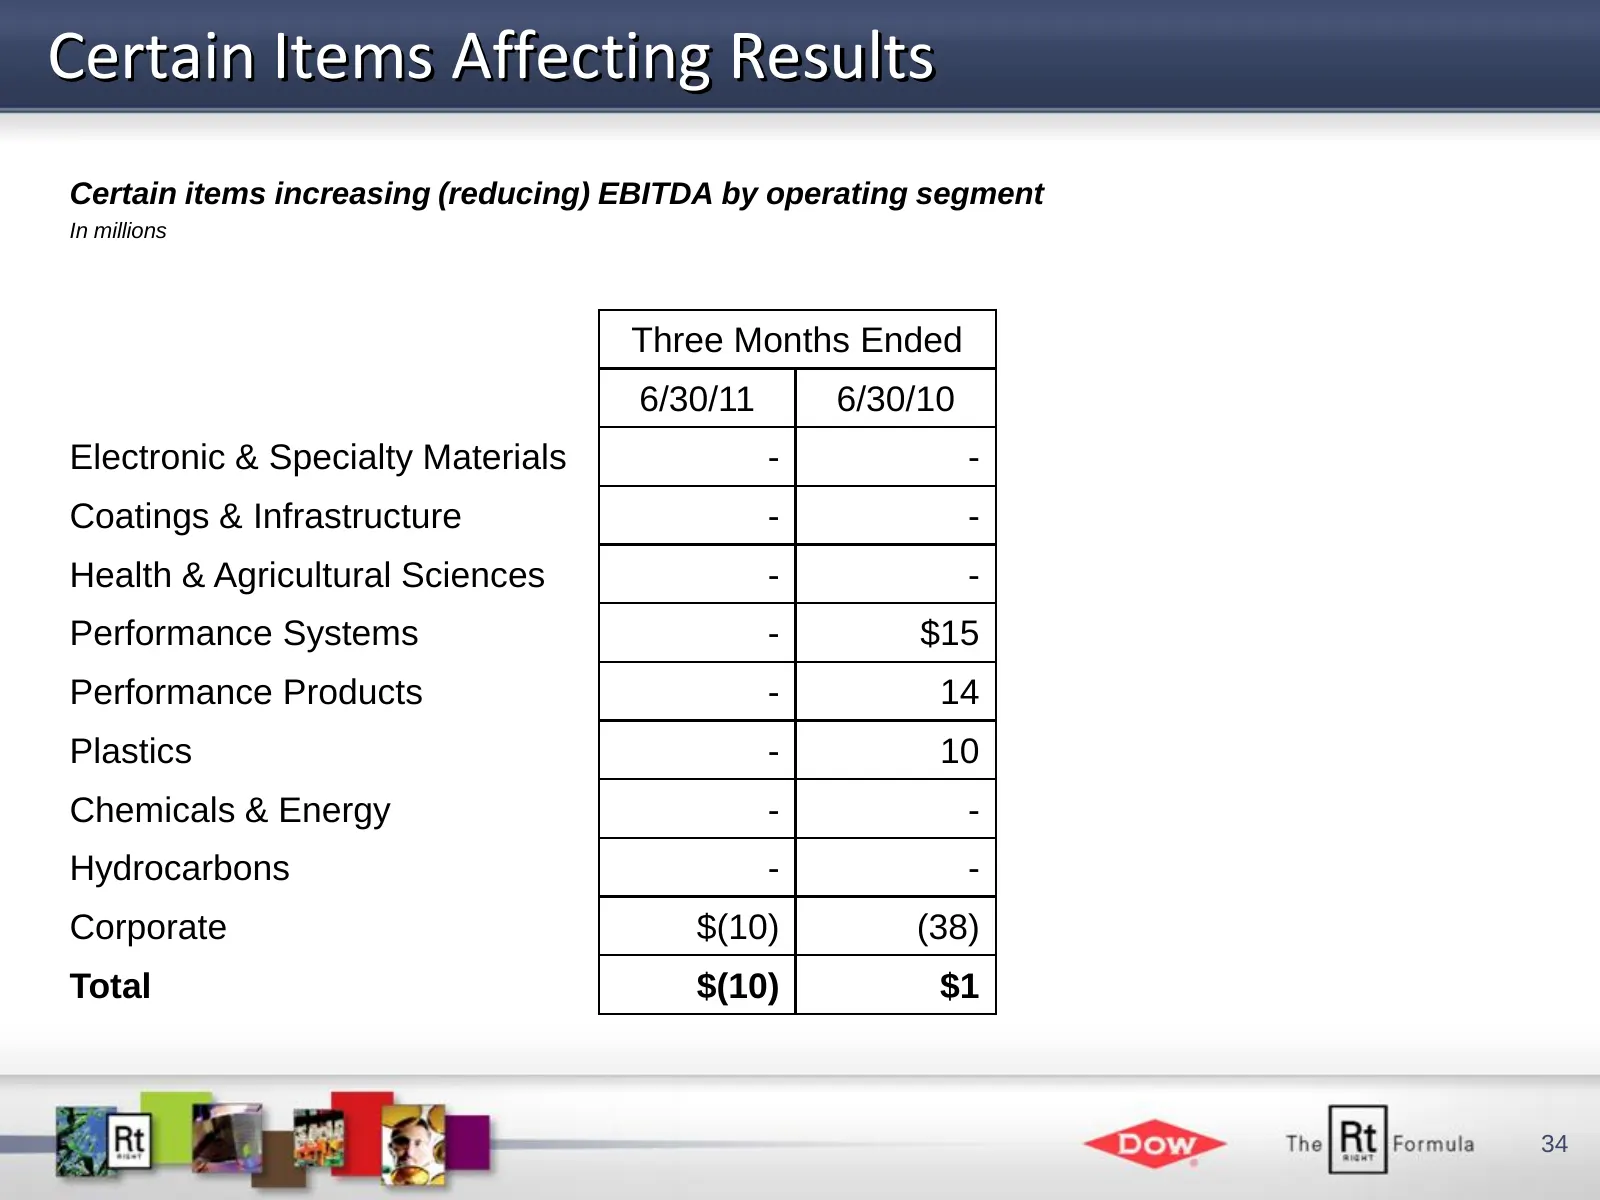
Certain Items Affecting Results Certain items increasing (reducing) EBITDA by operating segment In millions Three Months Ended 6/30/11 6/30/10 Electronic & Specialty Materials - - Coatings & Infrastructure - - Health & Agricultural Sciences - - Performance Systems - $15 Performance Products - 14 Pla
Slide 35: Reconciliation of Non-GAAP Financial Measure
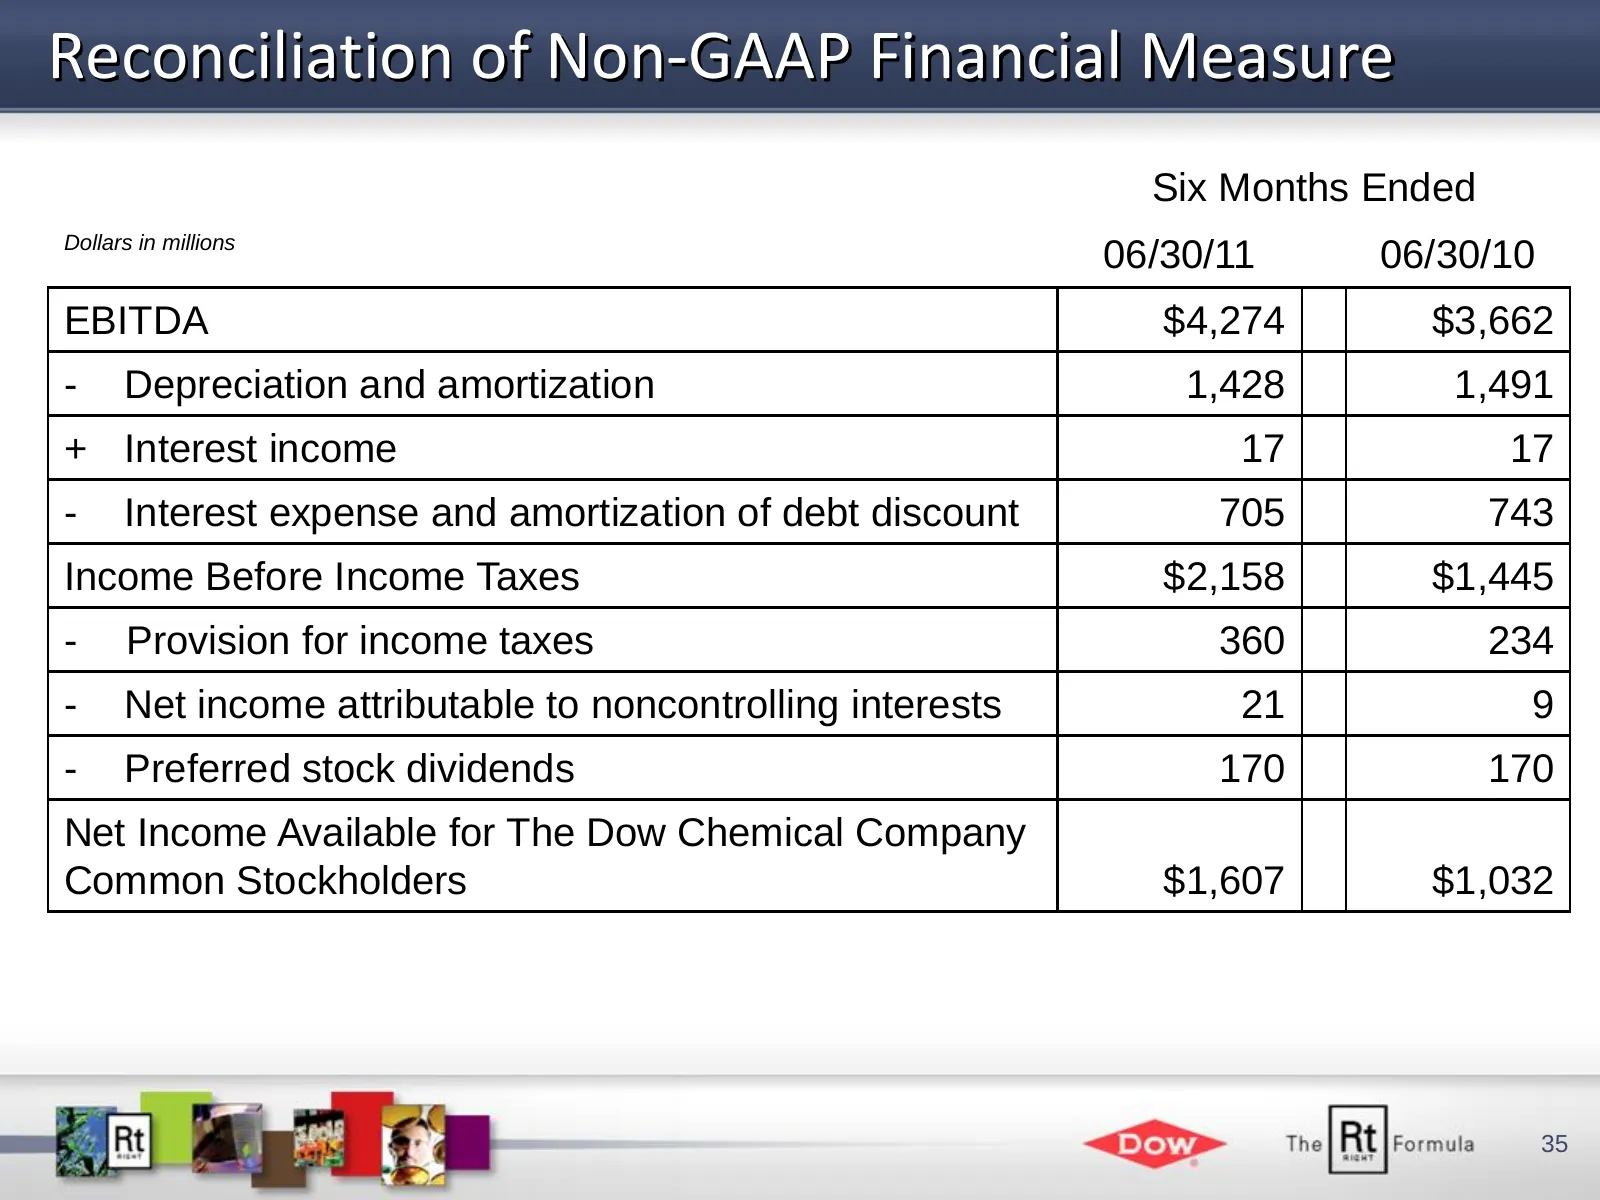
Reconciliation of Non-GAAP Financial Measure Six Months Ended Dollars in millions 06/30/11 06/30/10 EBITDA $4,274 $3,662 - Depreciation and amortization 1,428 1,491 + Interest income 17 17 - Interest expense and amortization of debt discount 705 743 Income Before Income Taxes $2,158 $1,445 - Provisi
Slide 36: Supplemental Information
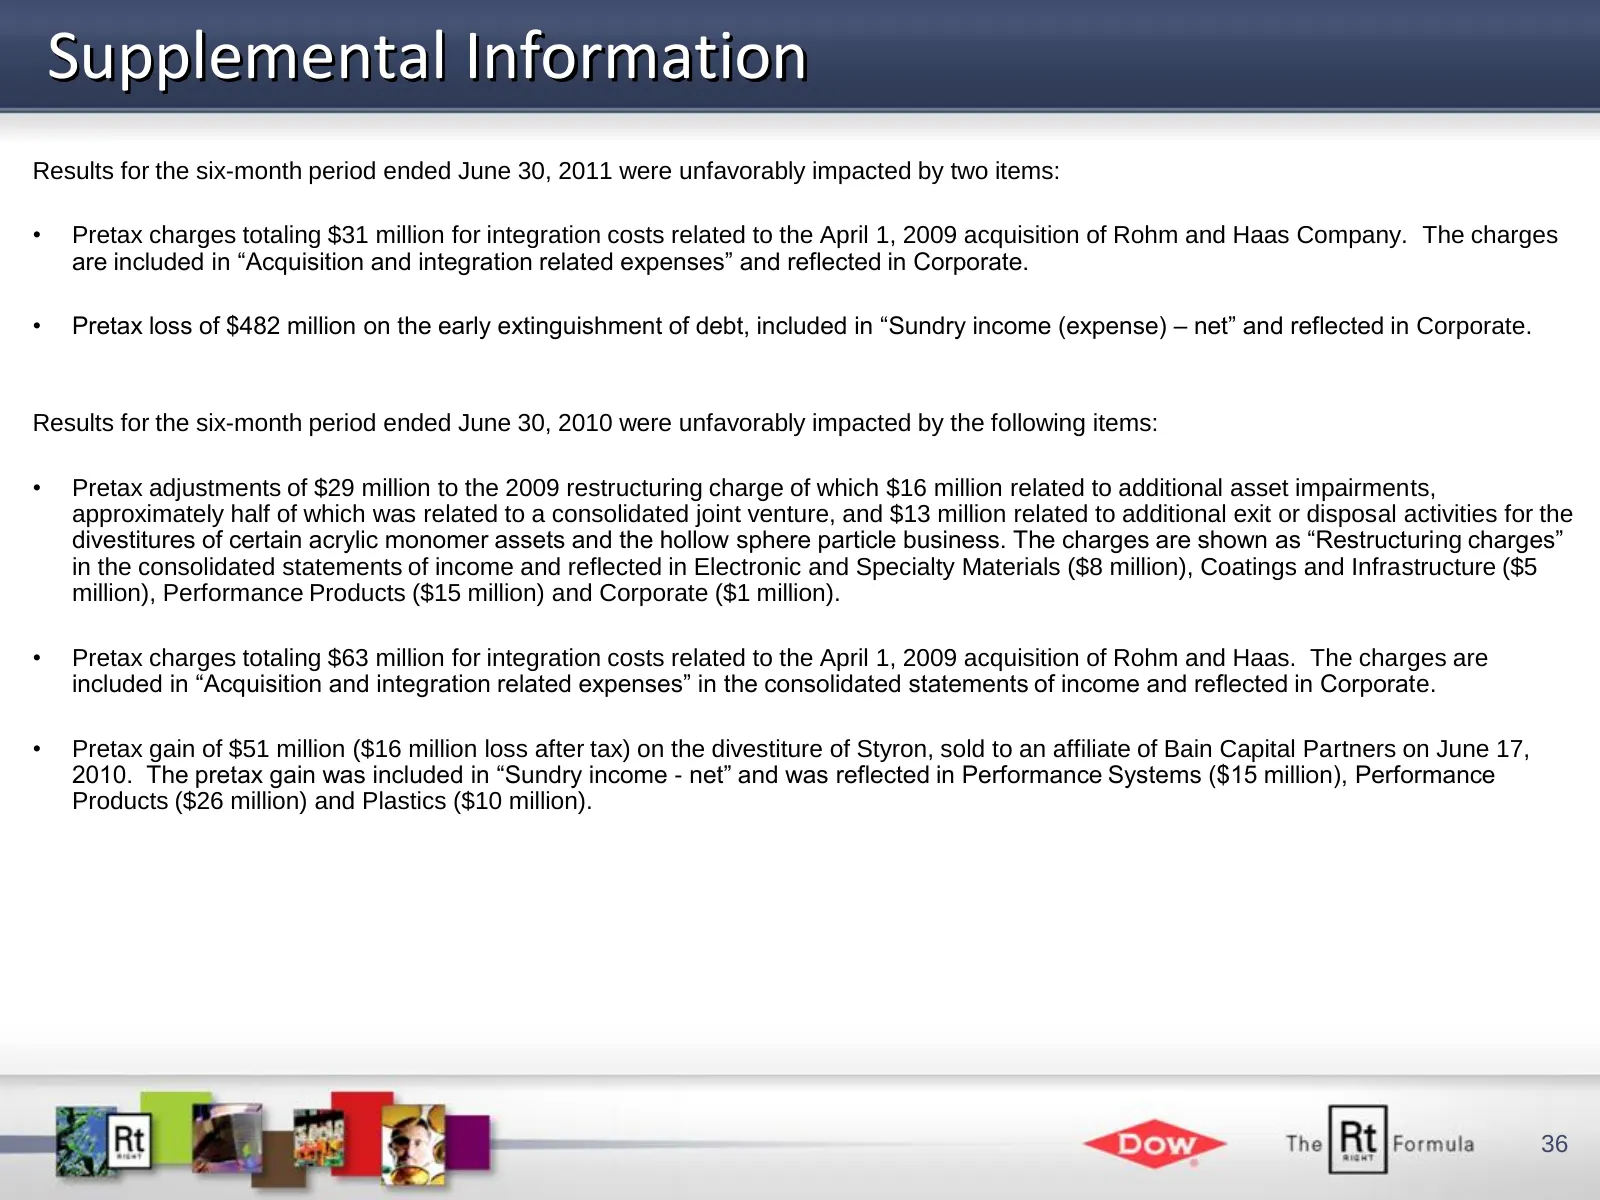
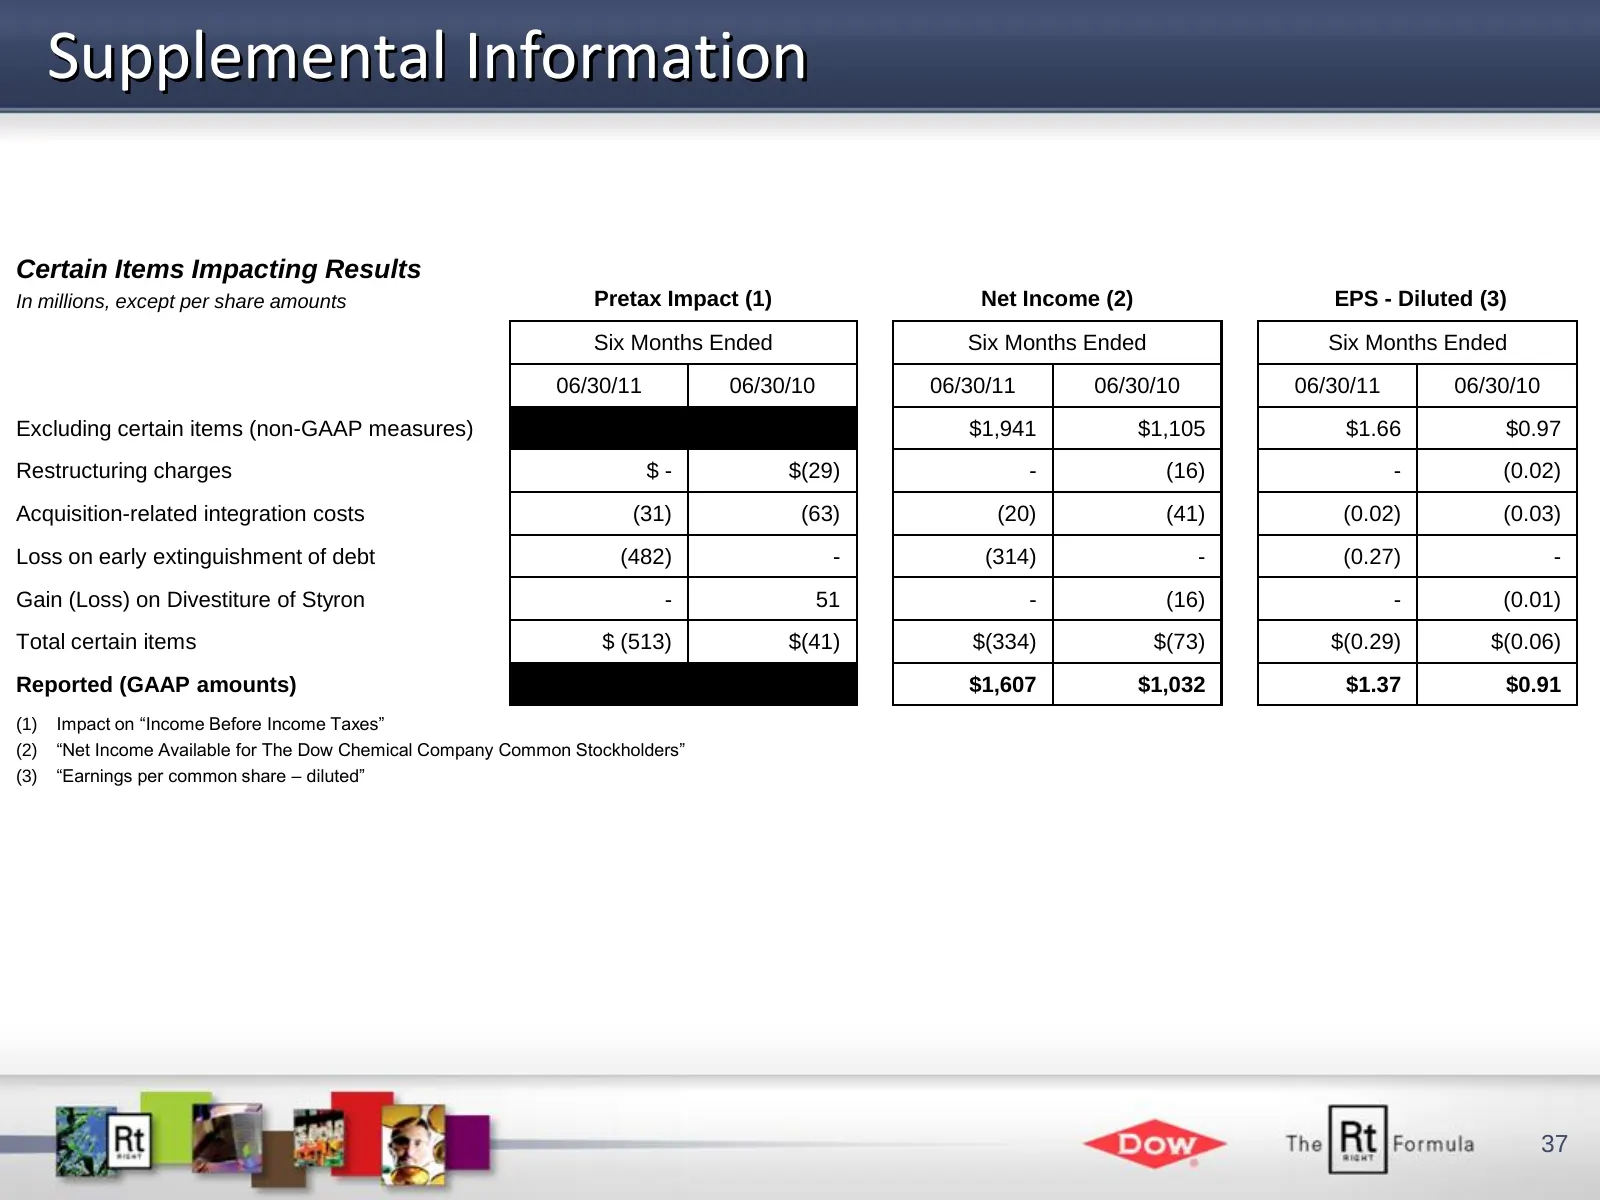
Supplemental Information Results for the six-month period ended June 30, 2011 were unfavorably impacted by two items: • Pretax charges totaling $31 million for integration costs related to the April 1, 2009 acquisition of Rohm and Haas Company. The charges are included in “Acquisition and integratio
Slide 37: Supplemental Information
Supplemental Information Certain Items Impacting Results In millions, except per share amounts Pretax Impact (1) Net Income (2) EPS - Diluted (3) Six Months Ended Six Months Ended Six Months Ended 06/30/11 06/30/10 06/30/11 06/30/10 06/30/11 06/30/10 Excluding certain items (non-GAAP measures) $1,94
Slide 38: Certain Items Affecting Results
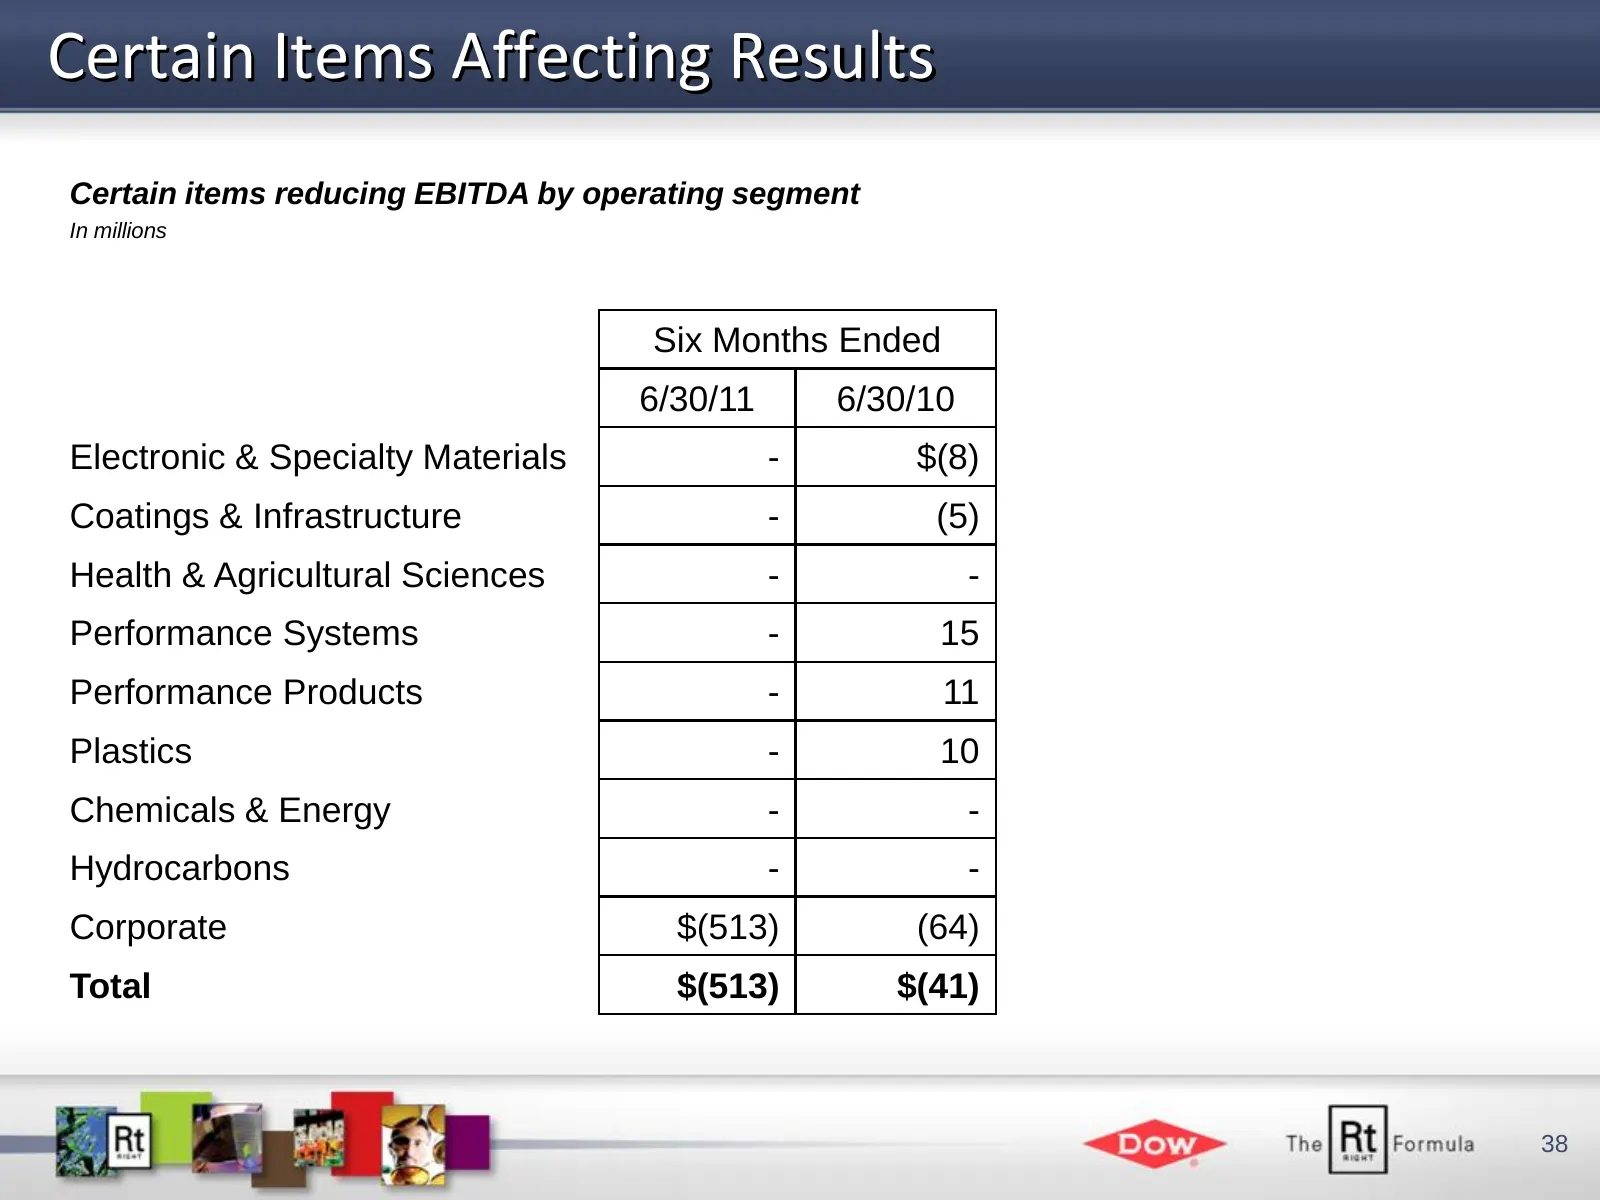
Certain Items Affecting Results Certain items reducing EBITDA by operating segment In millions Six Months Ended 6/30/11 6/30/10 Electronic & Specialty Materials - $(8) Coatings & Infrastructure - (5) Health & Agricultural Sciences - - Performance Systems - 15 Performance Products - 11 Plastics - 10
Slide 39: Principal Joint Ventures
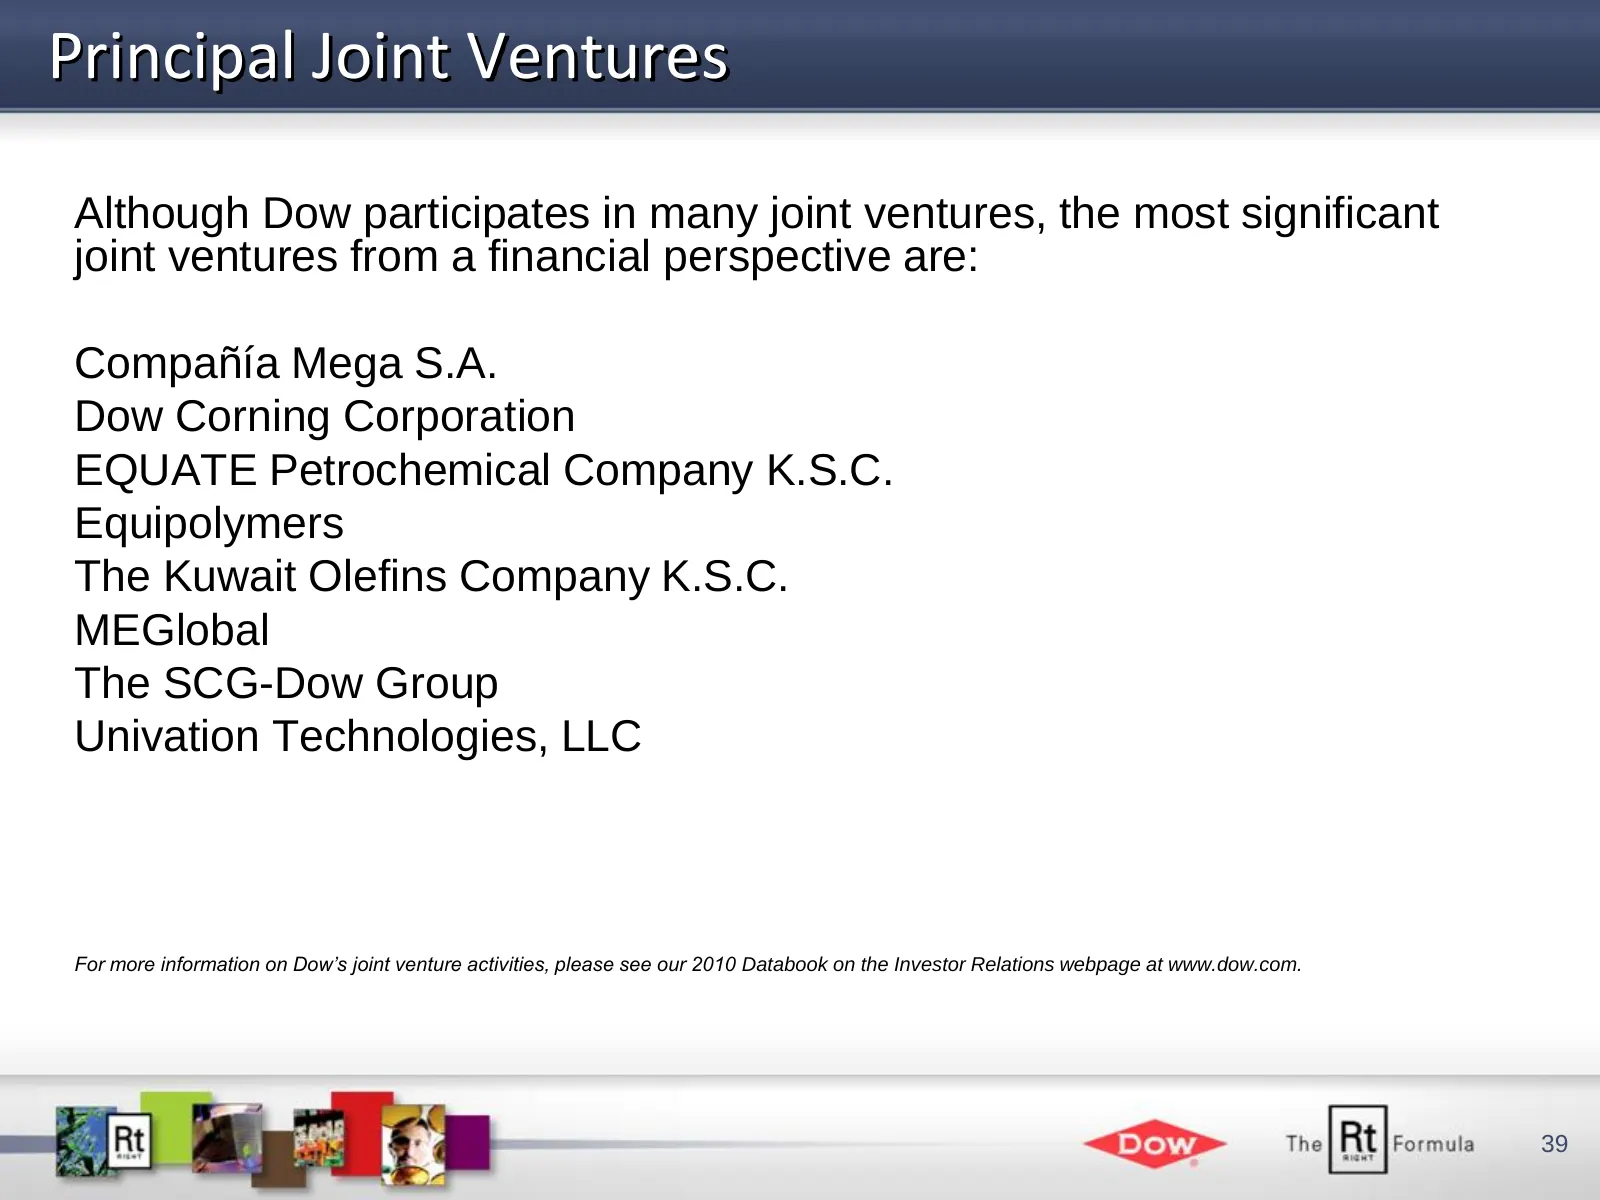
Principal Joint Ventures Although Dow participates in many joint ventures, the most significant joint ventures from a financial perspective are: Compañía Mega S.A. Dow Corning Corporation EQUATE Petrochemical Company K.S.C. Equipolymers The Kuwait Olefins Company K.S.C. MEGlobal The SCG-Dow Group Un
Slide 40: Preliminary Results for Principal Joint Ventures
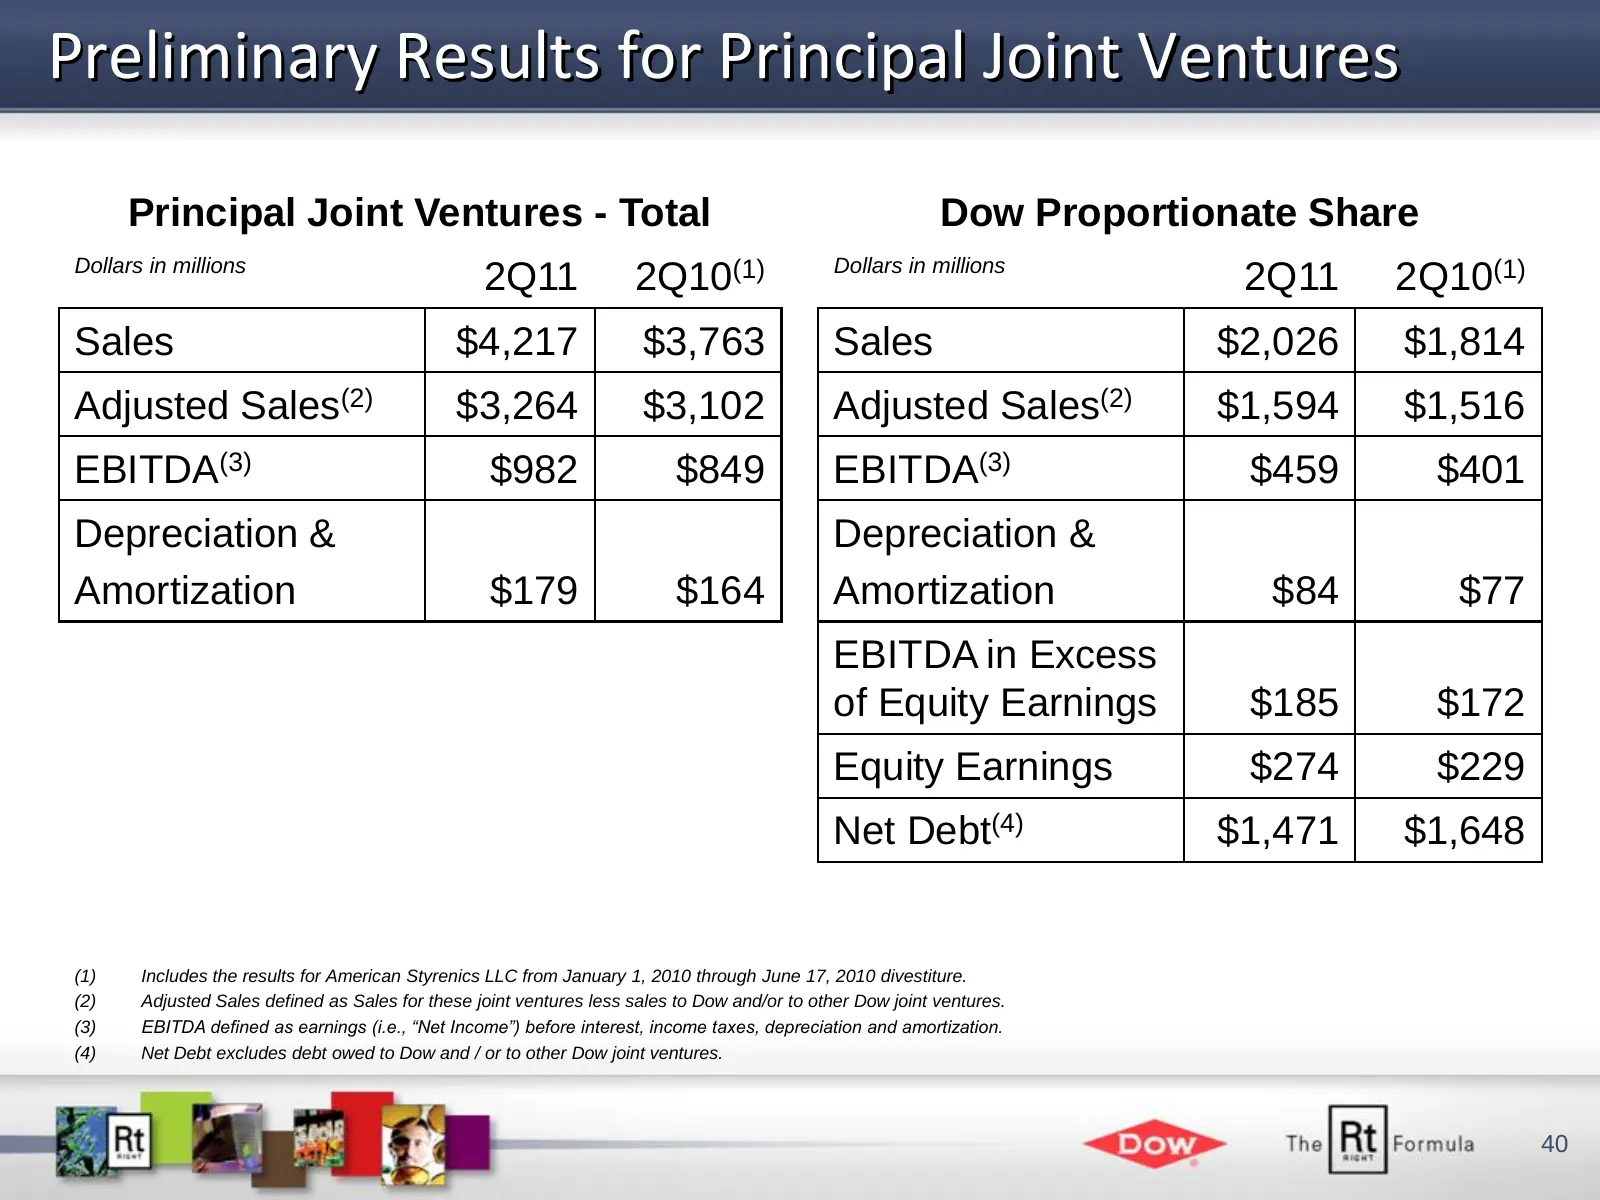
Preliminary Results for Principal Joint Ventures Principal Joint Ventures - Total Dow Proportionate Share Dollars in millions Dollars in millions 2Q11 2Q10(1) 2Q11 2Q10(1) Sales $4,217 $3,763 Sales $2,026 $1,814 Adjusted Sales(2) $3,264 $3,102 Adjusted Sales(2) $1,594 $1,516 EBITDA(3) $982 $849 EBIT
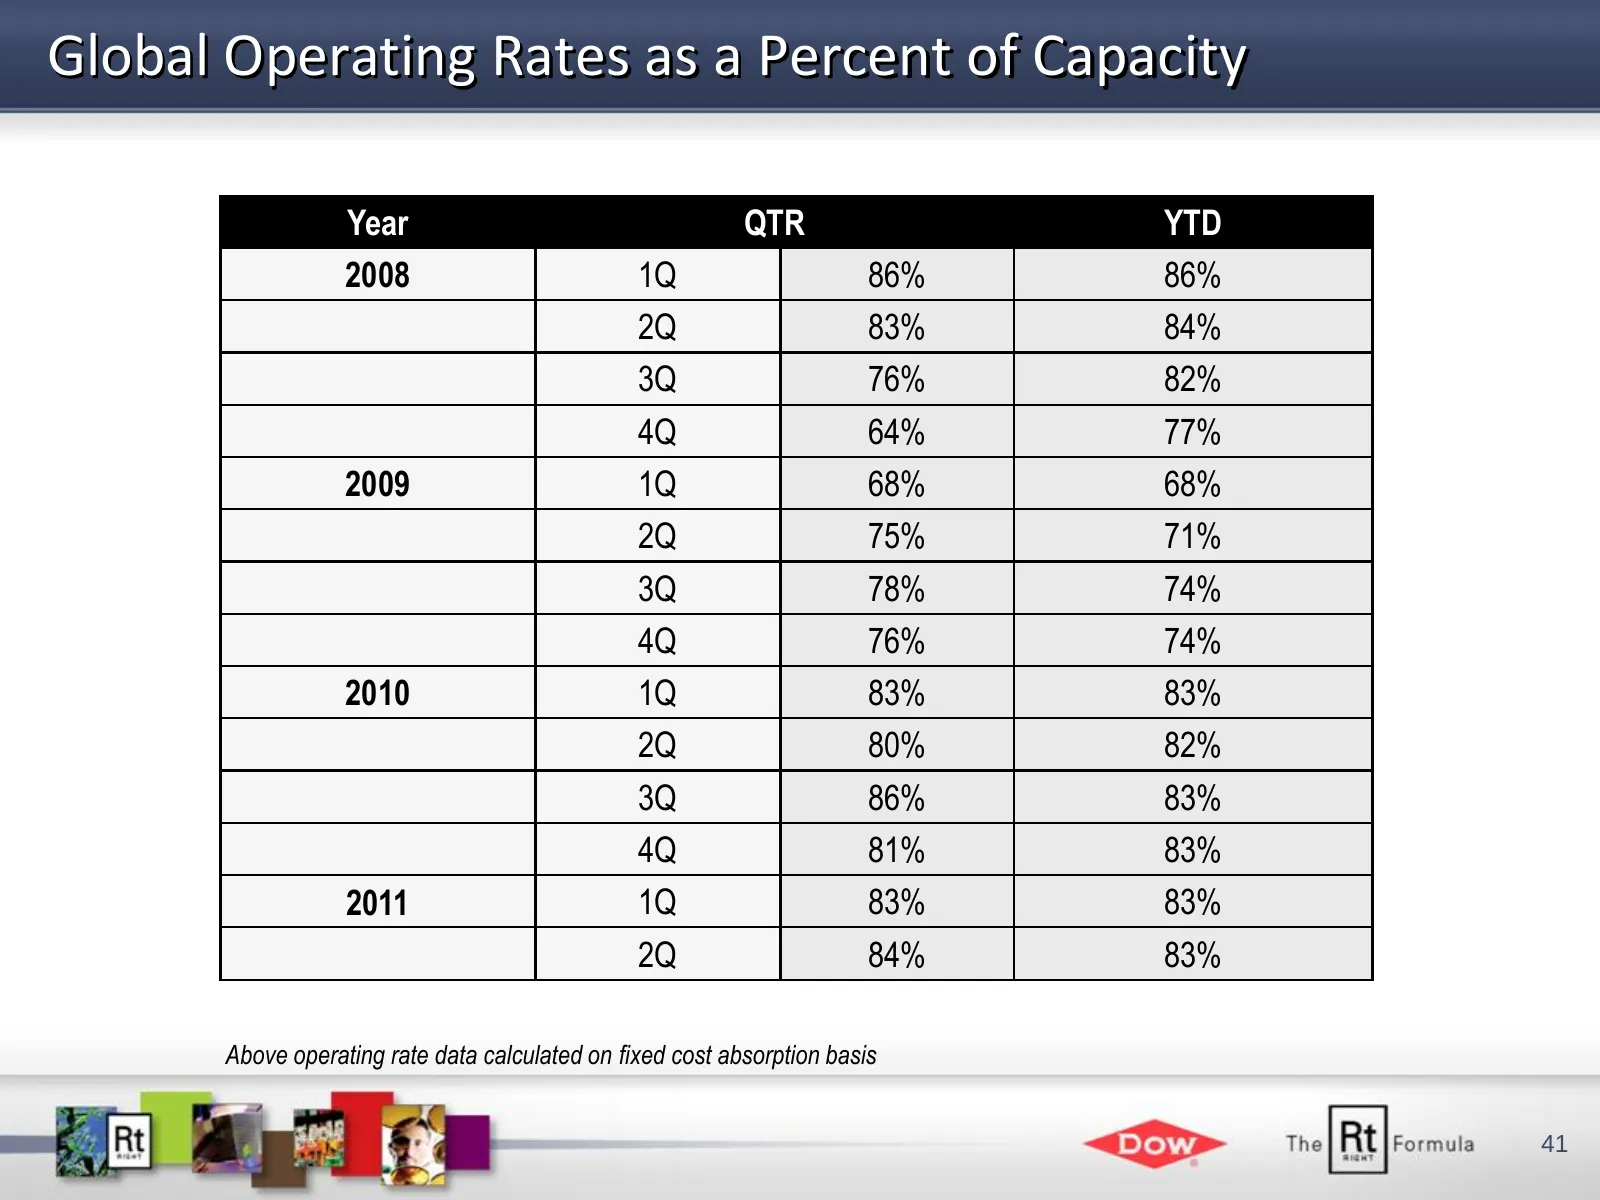
Slide 41: Global Operating Rates as a Percent of Capacity
Global Operating Rates as a Percent of Capacity Year QTR YTD 2008 1Q 86% 86% 2Q 83% 84% 3Q 76% 82% 4Q 64% 77% 2009 1Q 68% 68% 2Q 75% 71% 3Q 78% 74% 4Q 76% 74% 2010 1Q 83% 83% 2Q 80% 82% 3Q 86% 83% 4Q 81% 83% 2011 1Q 83% 83% 2Q 84% 83% Above operating rate data calculated on fixed cost absorption bas
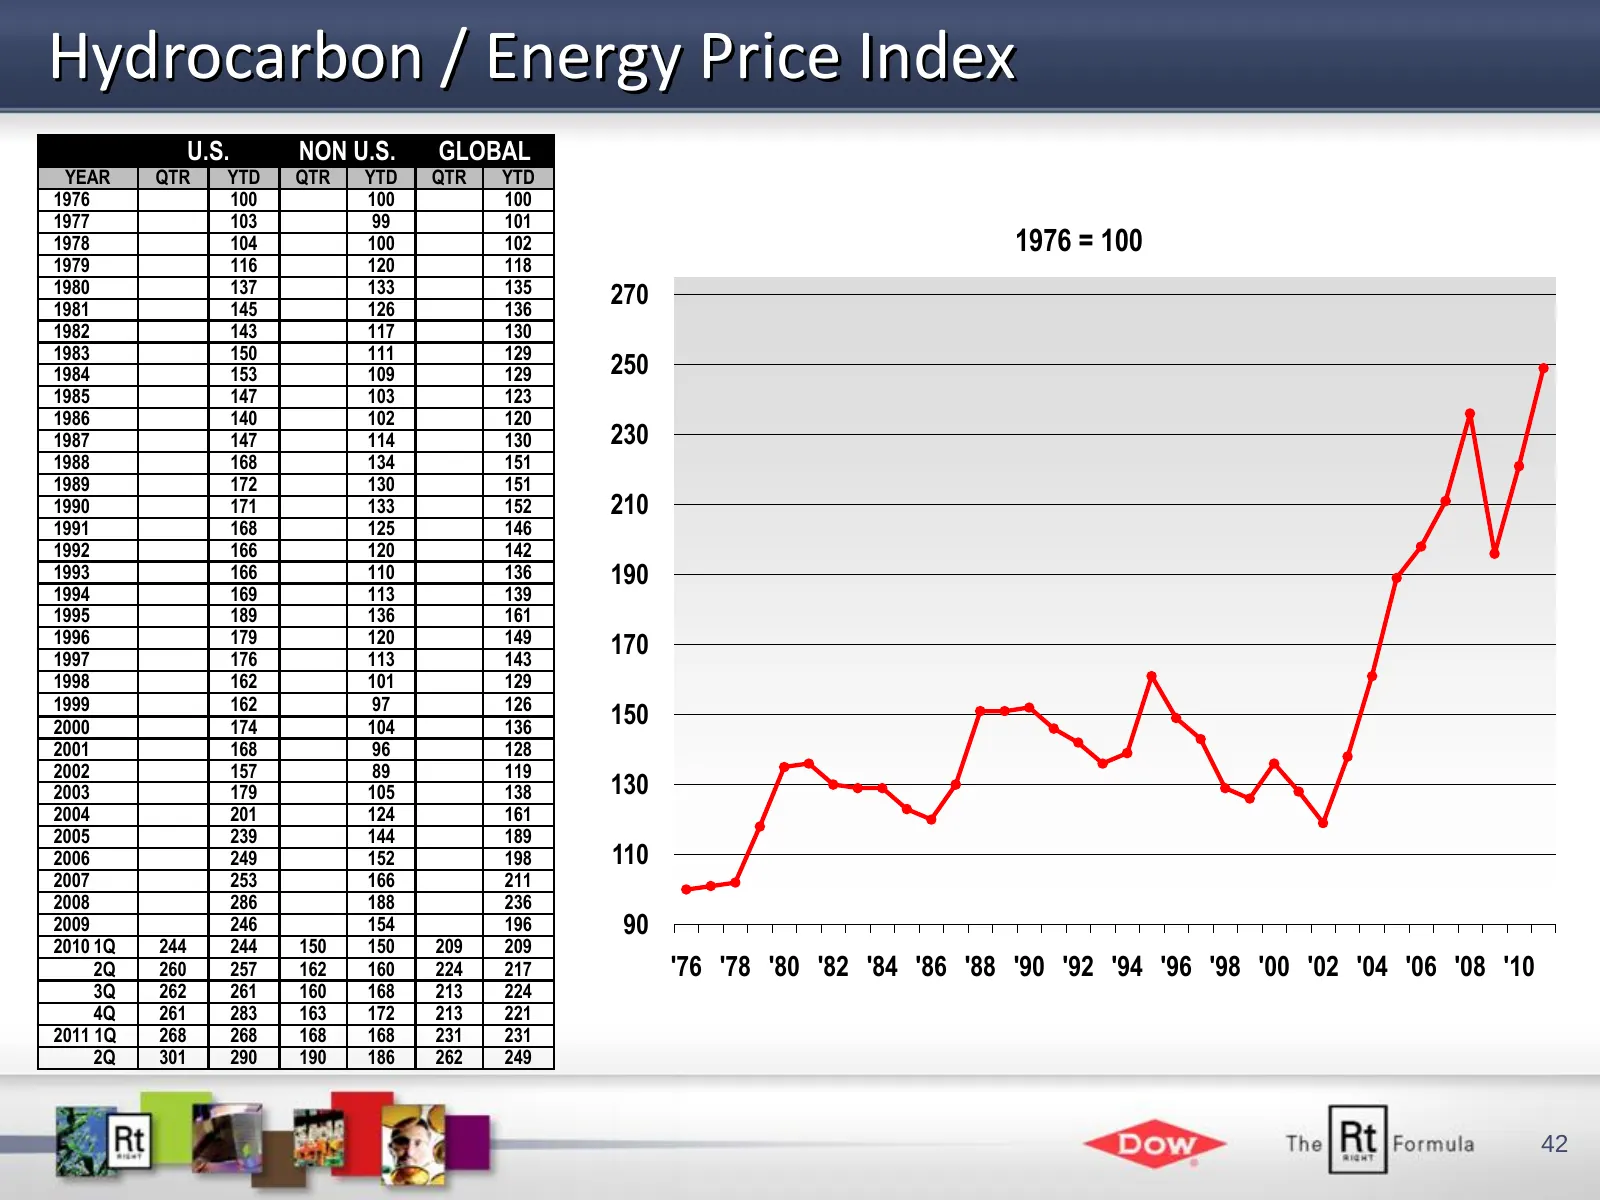
Slide 42: Hydrocarbon / Energy Price Index
Hydrocarbon / Energy Price Index U.S. NON U.S. GLOBAL YEAR QTR YTD QTR YTD QTR YTD 1976 100 100 100 1977 103 99 101 1978 104 100 102 1976 = 100 1979 116 120 118 1980 137 133 135 270 1981 145 126 136 1982 143 117 130 1983 150 111 129 1984 153 109 129 250 1985 147 103 123 1986 140 102 120 1987 147 114
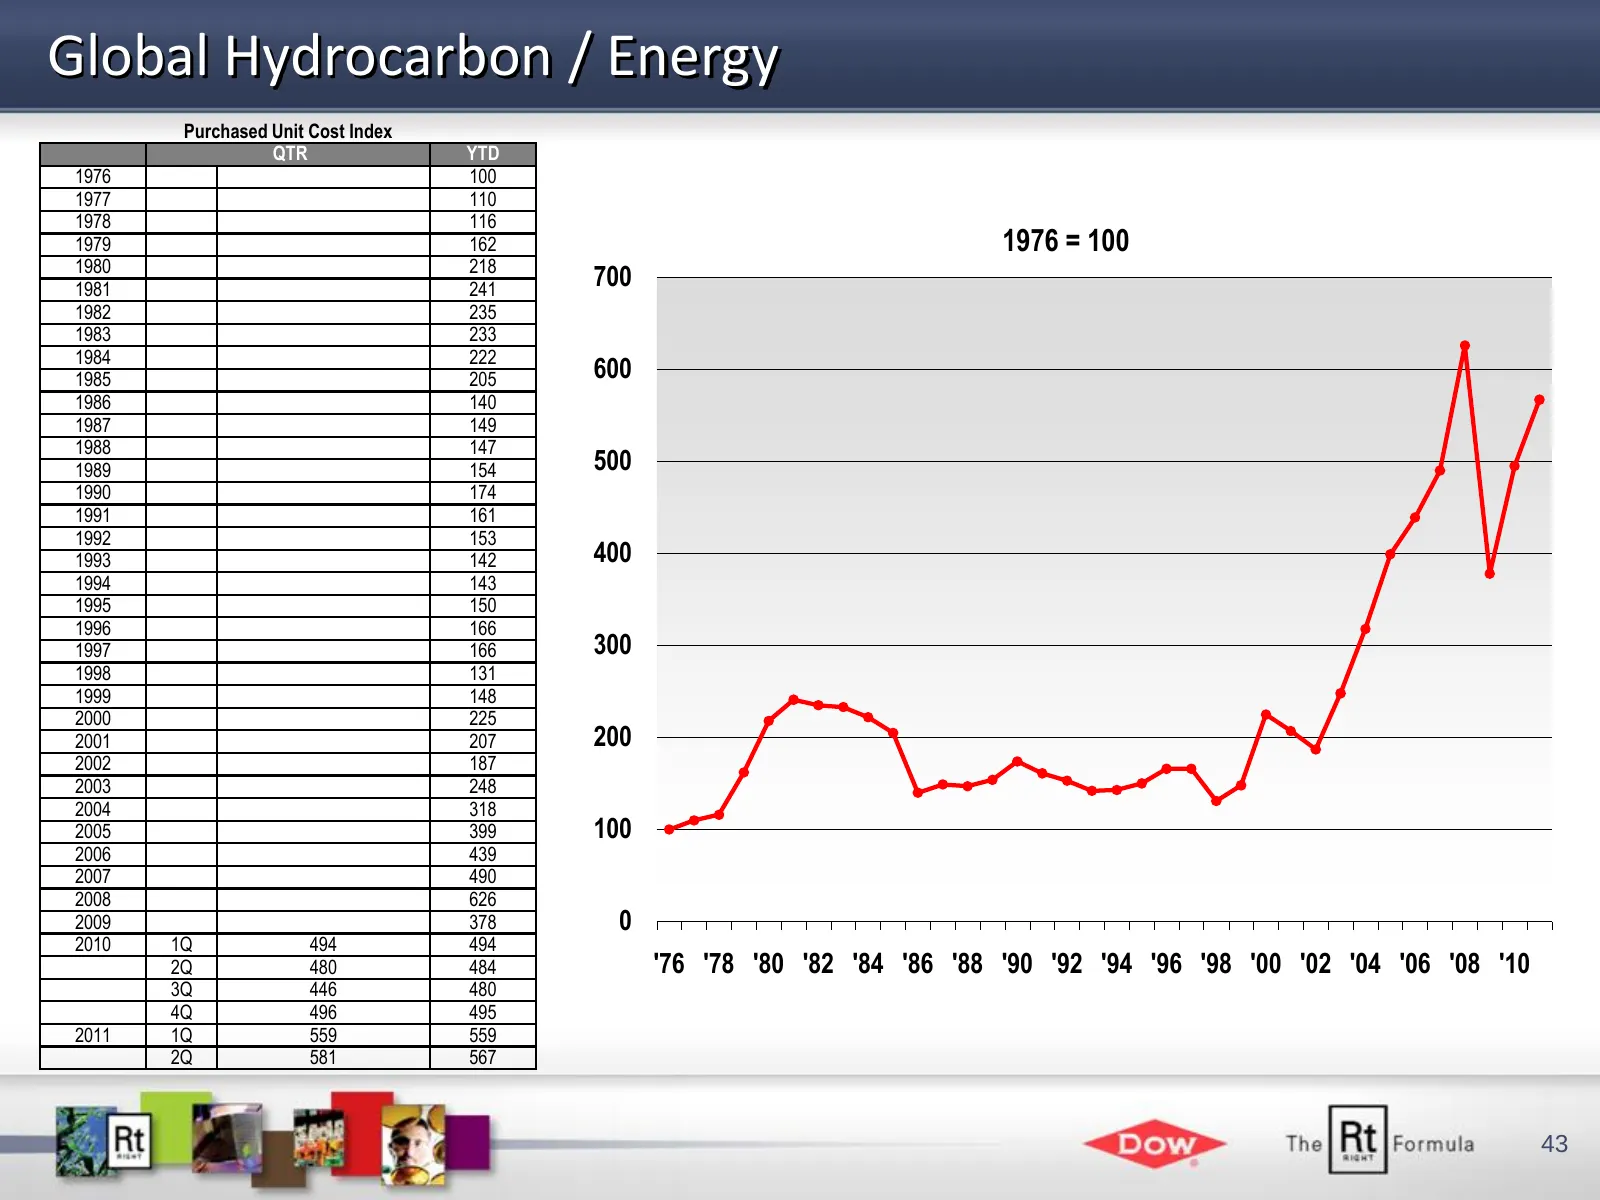
Slide 43: Global Hydrocarbon / Energy Purchased Unit Cost Index
Global Hydrocarbon / Energy Purchased Unit Cost Index QTR YTD 1976 100 1977 110 1978 116 1979 162 1976 = 100 1980 218 1981 241 700 1982 235 1983 233 1984 222 1985 205 600 1986 140 1987 149 1988 147 1989 154 500 1990 174 1991 161 1992 153 1993 142 400 1994 143 1995 150 1996 166 1997 166 300 1998 131
Source: Internet Archive copy of dow.com
More decks from The Dow Chemical Company
 Technical Presentation (September 2021)31 slides · September 2021
 Q2 2017 Earnings Presentation34 slides · Jul 27, 2017
 Q2 2016 Earnings Presentation30 slides · Jul 28, 2016
 Merger or Acquisition (March 2016)27 slides · Mar 2, 2016
 Merger or Acquisition (March 2016)27 slides · Mar 1, 2016
 Q4 2015 Earnings Presentation6 slides · Feb 3, 2016