Doximity, Inc. · NYSE:DOCS
Doximity — Investor Presentation (2023)
18 slides from Doximity's investor presentation, Jul 5, 2023

Slide 1: Investor Presentation Spring/Summer 2023
INVESTOR PRESENTATION Spring/Summer 2023
Slide 2: Legal Disclaimer
LEGAL DISCLAIMER This presentation and associated commentary may contain forward-looking statements, including statements regarding expectations of future results of operations or financial performance of Doximity, market size and growth opportunities, the calculation of certain of our key financial
Slide 3: The Digital Platform for Doctors
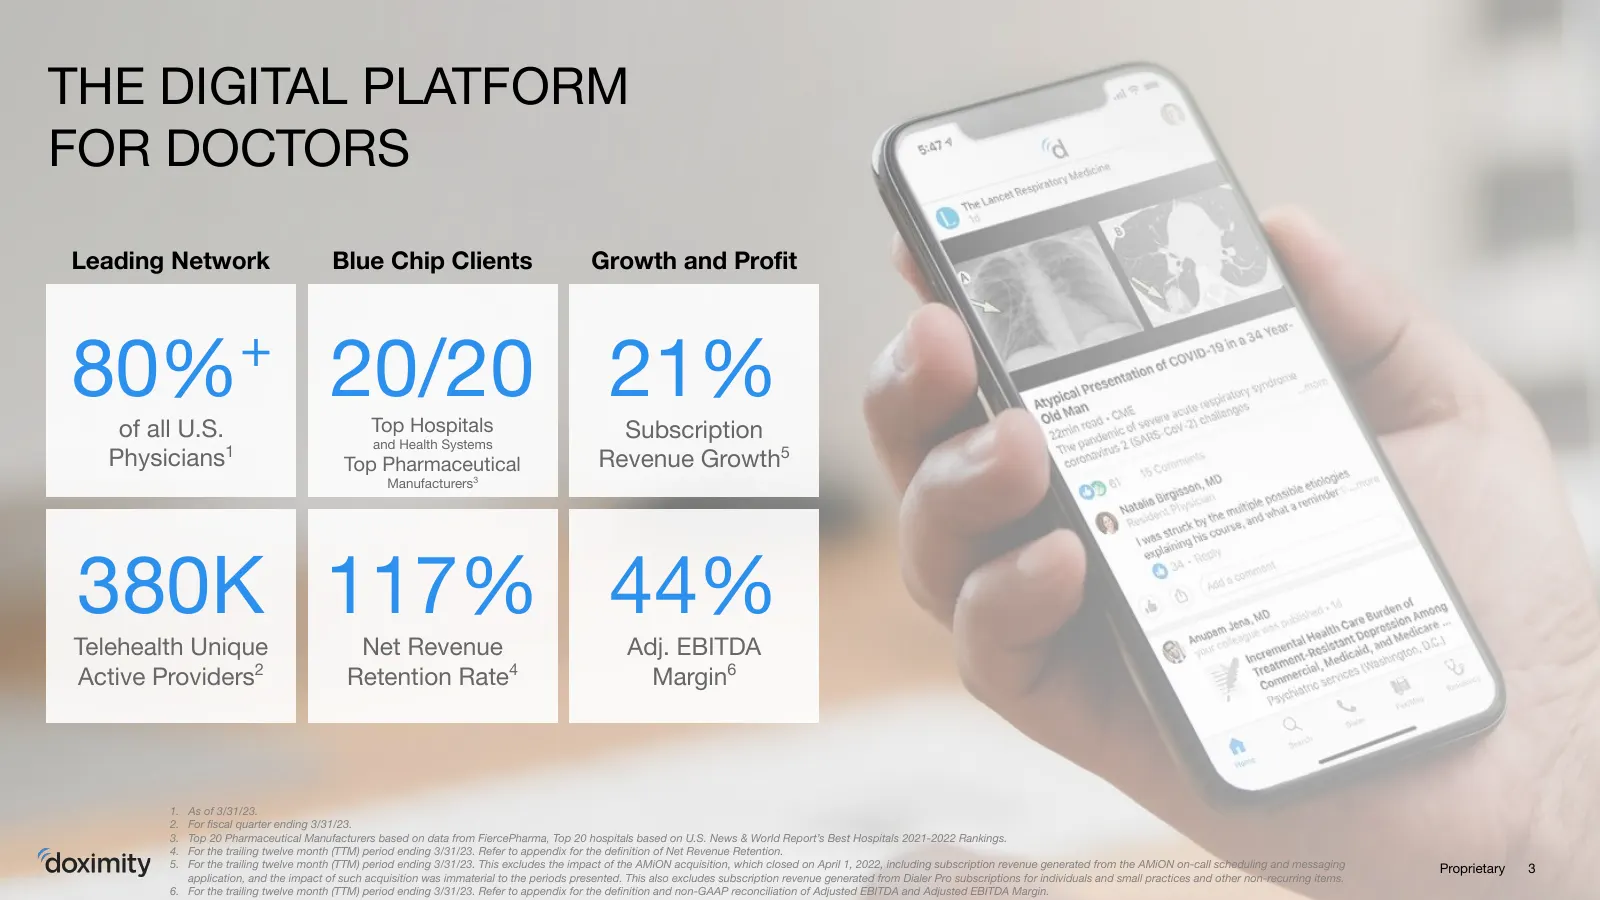
THE DIGITAL PLATFORM FOR DOCTORS Leading Network Blue Chip Clients Growth and Profit 80%+ 20/20 21% Top Hospitals of all U.S. and Health Systems Subscription Physicians1 Top Pharmaceutical Revenue Growth5 Manufacturers3 380K 117% 44% Telehealth Unique Net Revenue Adj. EBITDA Active Providers2 Retenti

Slide 4: Glaring Day-to-Day Inefficiencies
GLARING DAY-TO-DAY INEFFICIENCIES 80% of US HC documents sent via snail mail and fax1 78% of physicians report burnout, with health IT as one of least satisfying factors2 1. Keeping it Together Issue Brief on Exchanging Medical Documentation CAQH Nov 2020. Does not include email. 2. 2018 Survey of A
Slide 5: Bringing Tech to Medicine
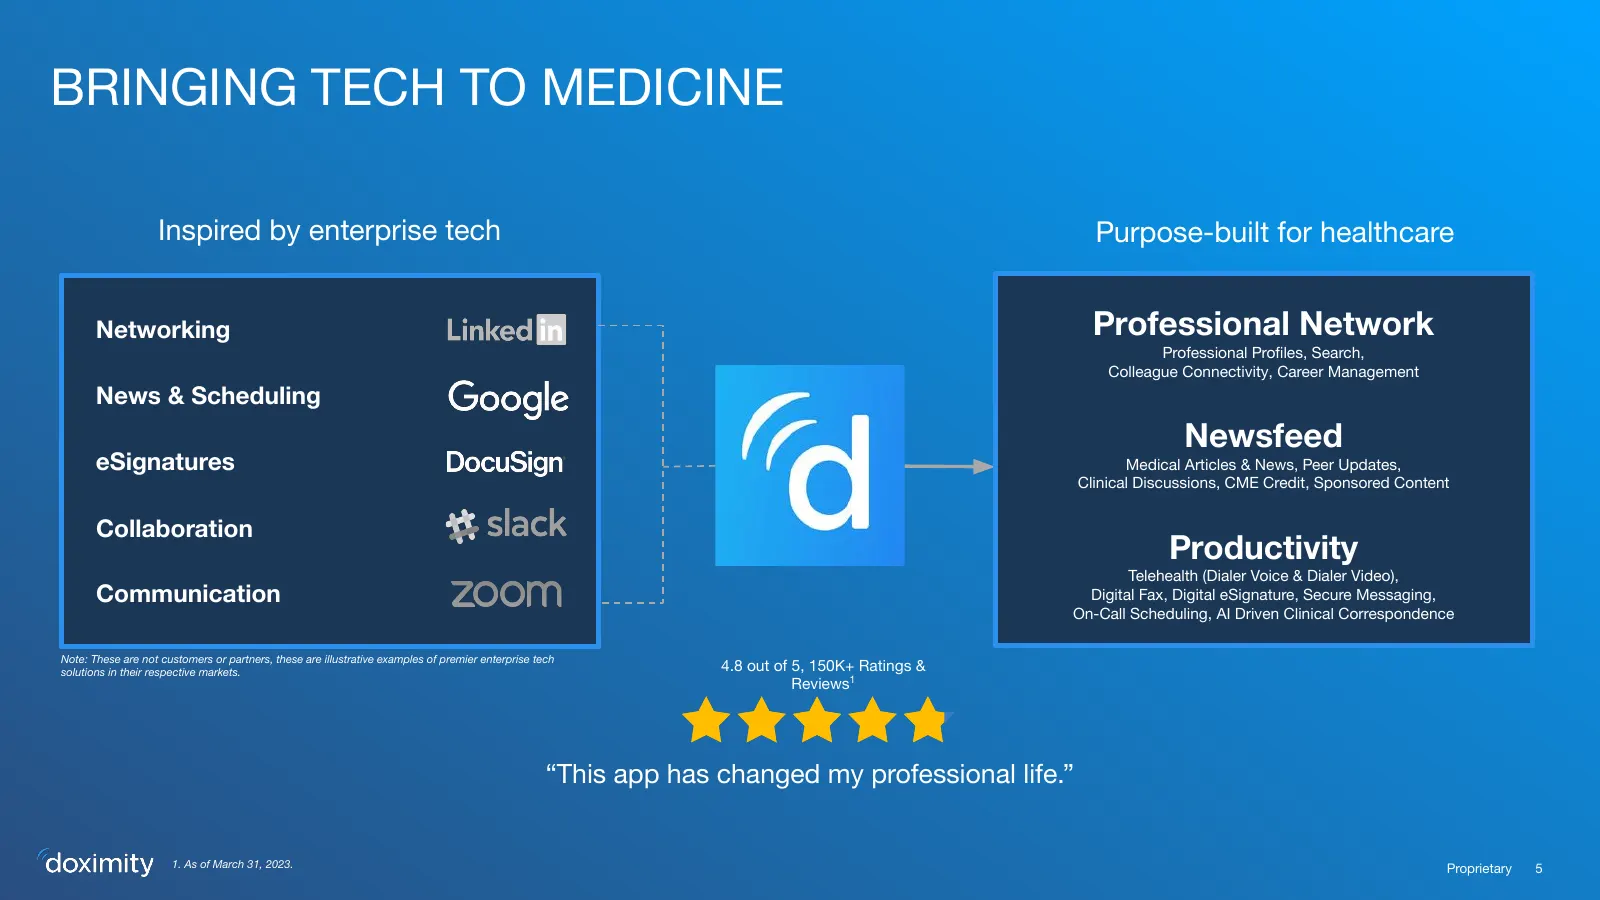
BRINGING TECH TO MEDICINE Inspired by enterprise tech Purpose-built for healthcare Networking Professional Network Professional Profiles, Search, Colleague Connectivity, Career Management News & Scheduling Newsfeed eSignatures Medical Articles & News, Peer Updates, Clinical Discussions, CME Credit, S
Slide 6: Purpose Built for Healthcare
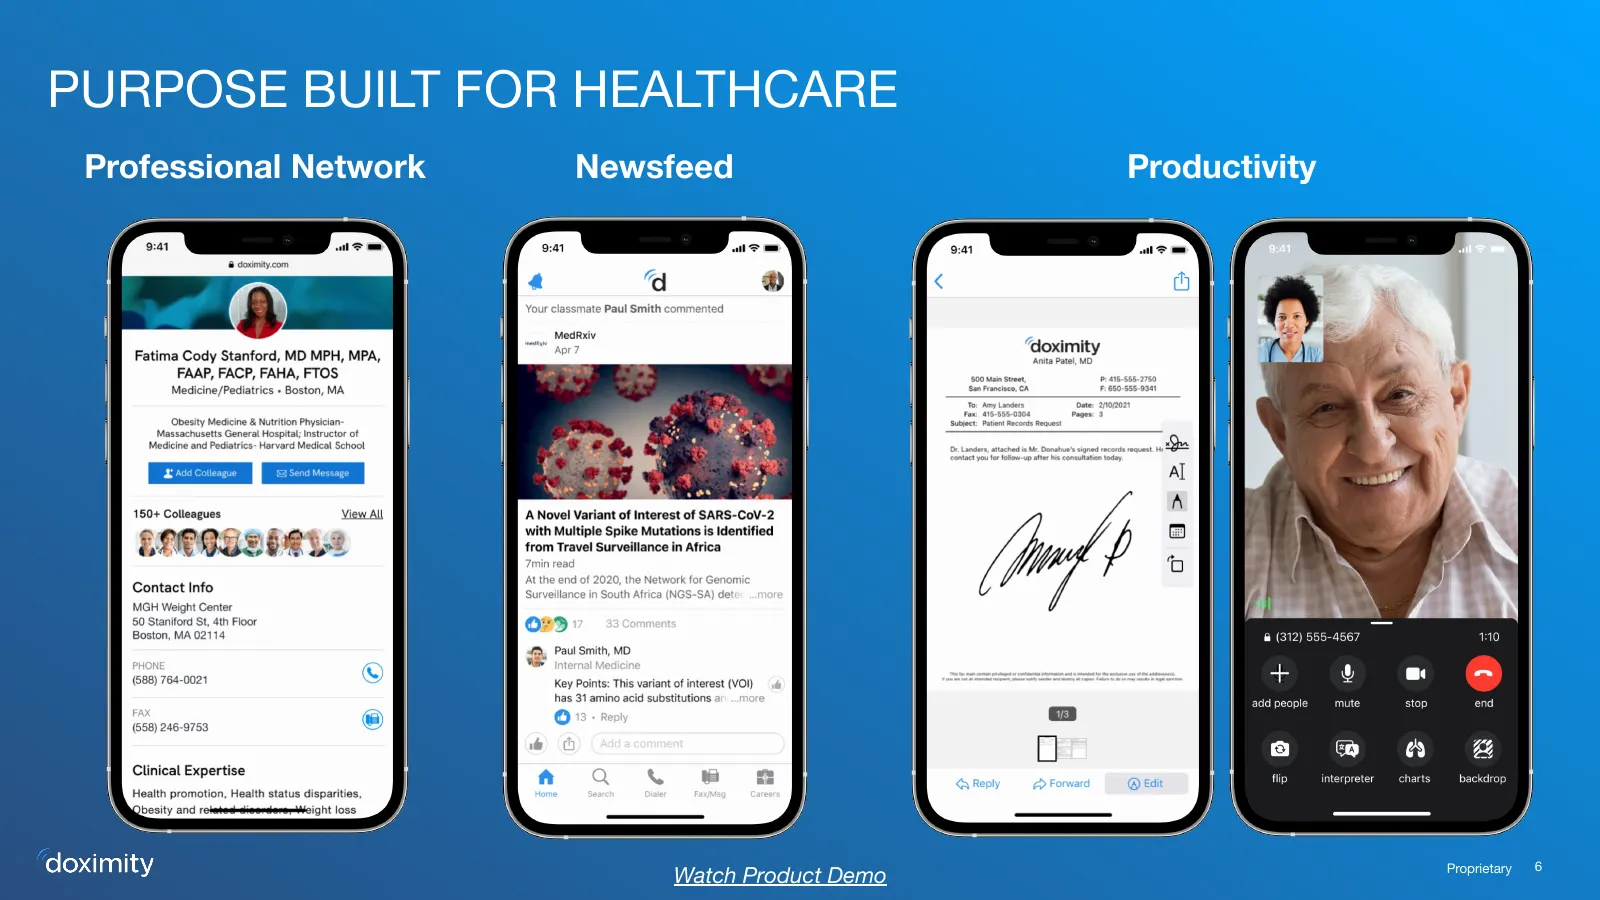
PURPOSE BUILT FOR HEALTHCARE Professional Network Newsfeed Productivity Proprietary 6 Watch Product Demo
Slide 7: Our Commercial Solutions
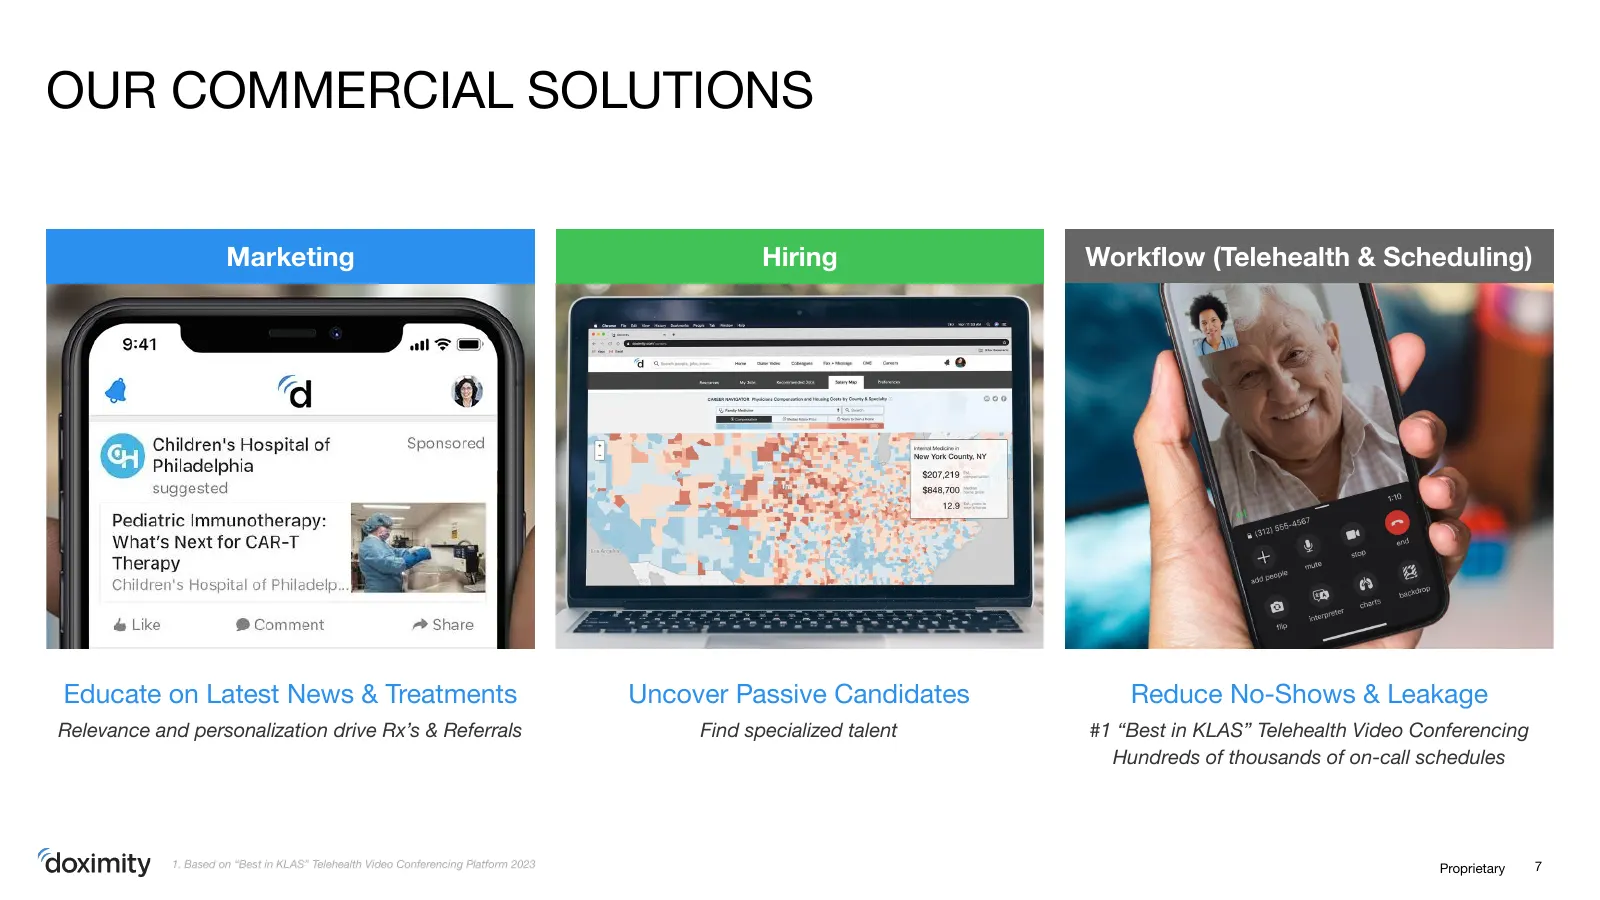
OUR COMMERCIAL SOLUTIONS Marketing Hiring Workflow (Telehealth & Scheduling) Educate on Latest News & Treatments Uncover Passive Candidates Reduce No-Shows & Leakage Relevance and personalization drive Rx’s & Referrals Find specialized talent #1 “Best in KLAS” Telehealth Video Conferencing Hundreds o
Slide 8: Marketing Solutions
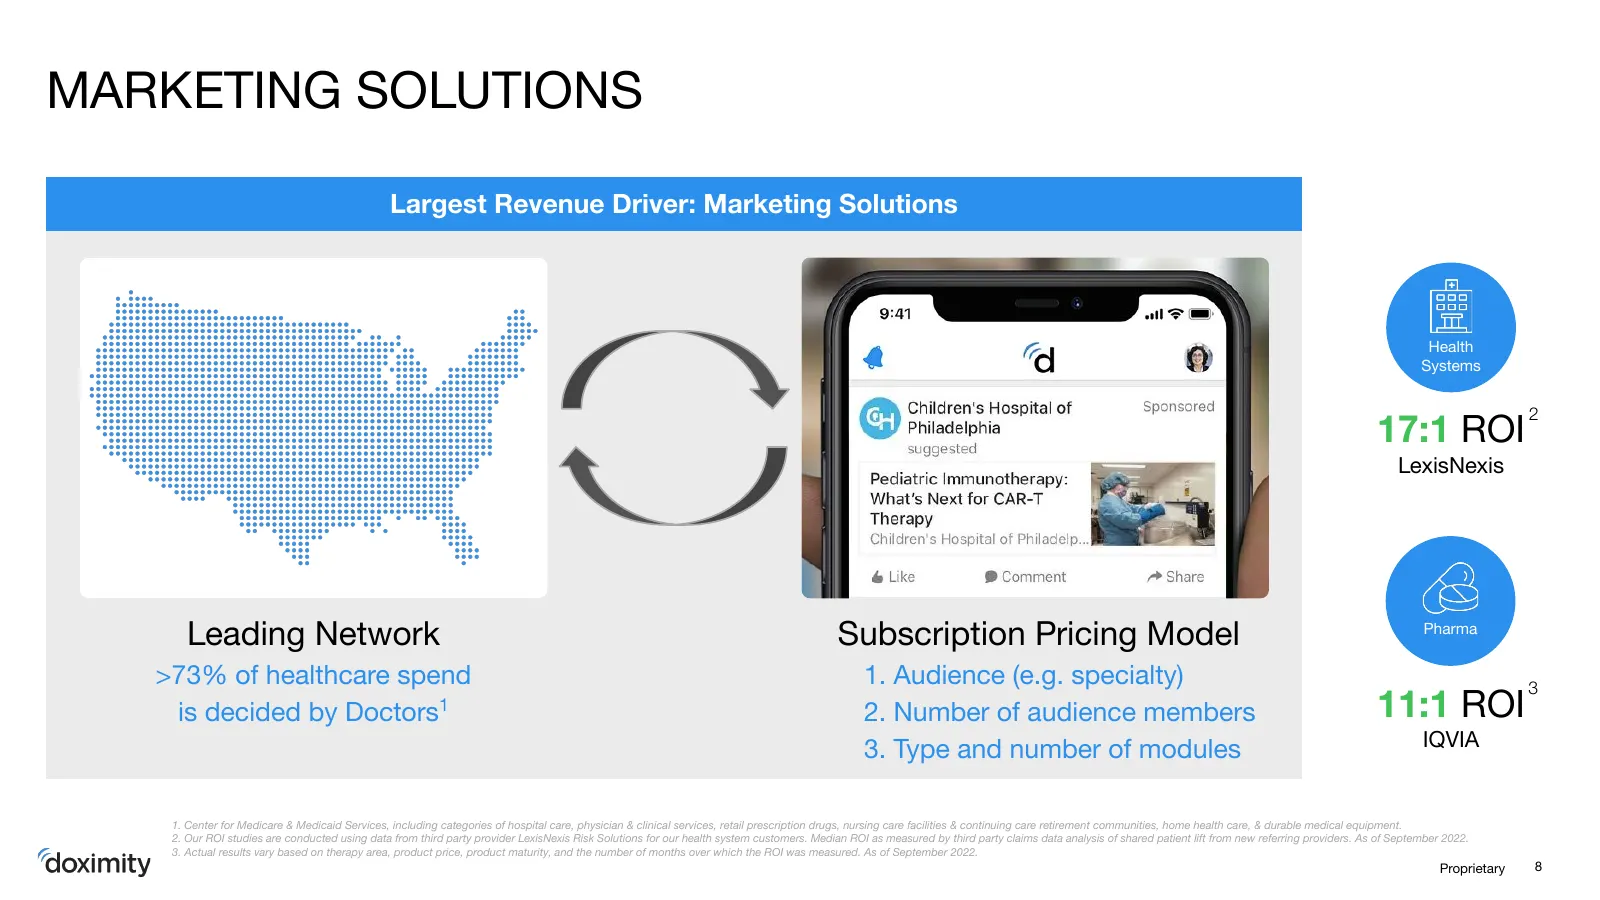
MARKETING SOLUTIONS Largest Revenue Driver: Marketing Solutions Health Systems 2 17:1 ROI LexisNexis Leading Network Subscription Pricing Model Pharma >73% of healthcare spend 1. Audience (e.g. specialty) 3 is decided by Doctors1 2. Number of audience members 11:1 ROI 3. Type and number of modules I
Slide 9: Land and Expand Sales Motion
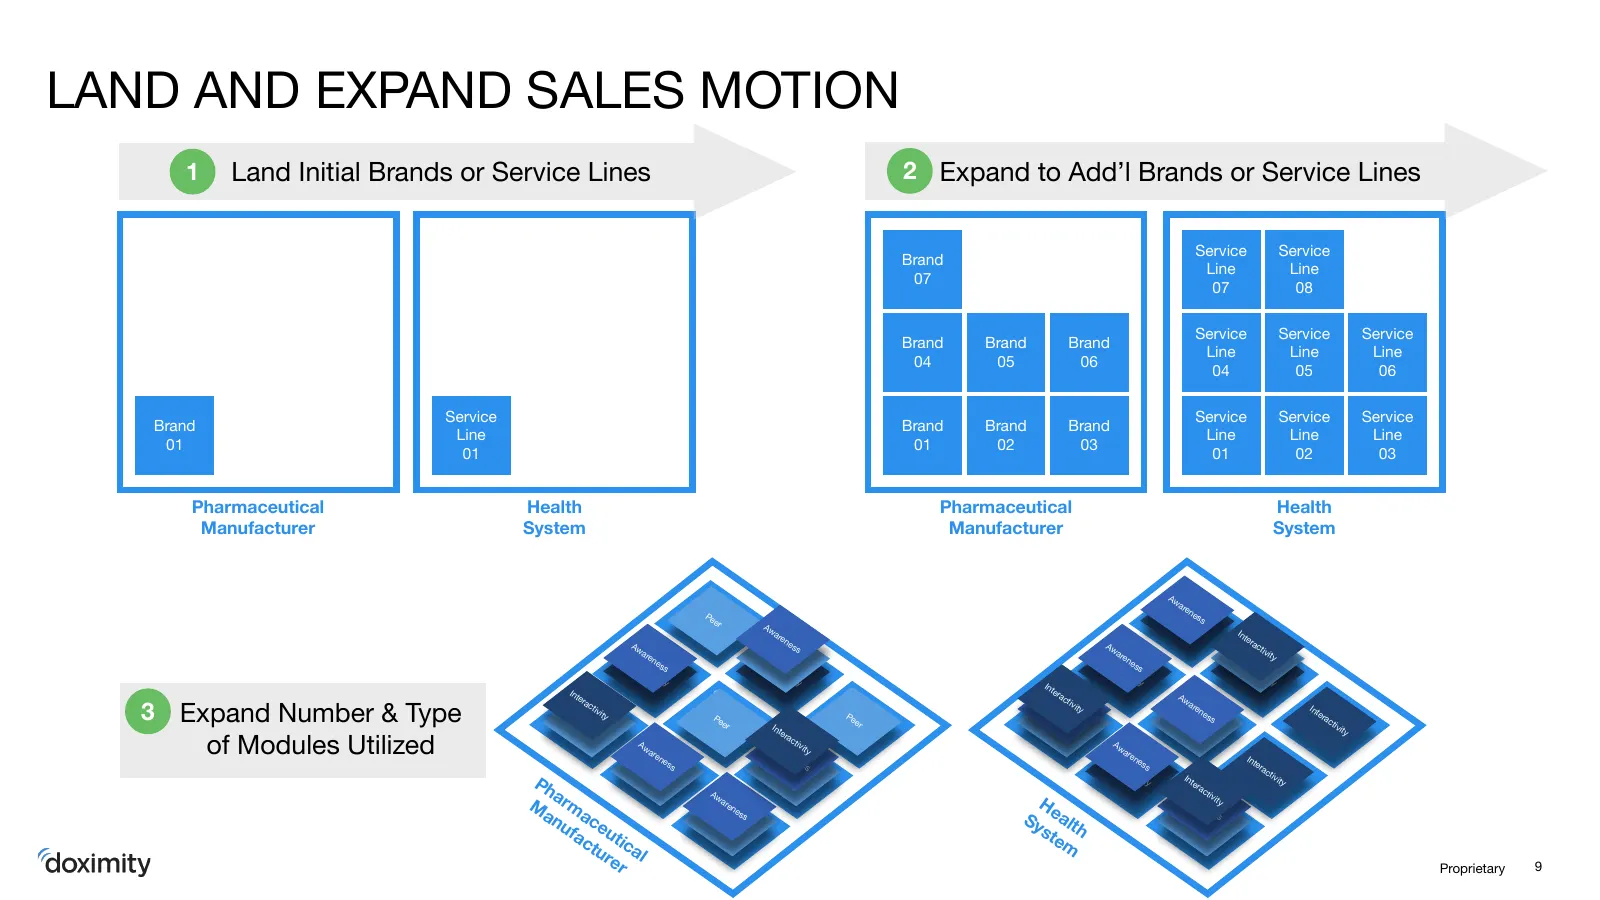
LAND AND EXPAND SALES MOTION 1 Land Initial Brands or Service Lines 2 Expand to Add’l Brands or Service Lines Service Service Brand Line Line 07 07 08 Service Service Service Brand Brand Brand Line Line Line 04 05 06 04 05 06 Service Service Service Service Brand Brand Brand Brand Line Line Line Lin
Slide 10: Categories of Modules
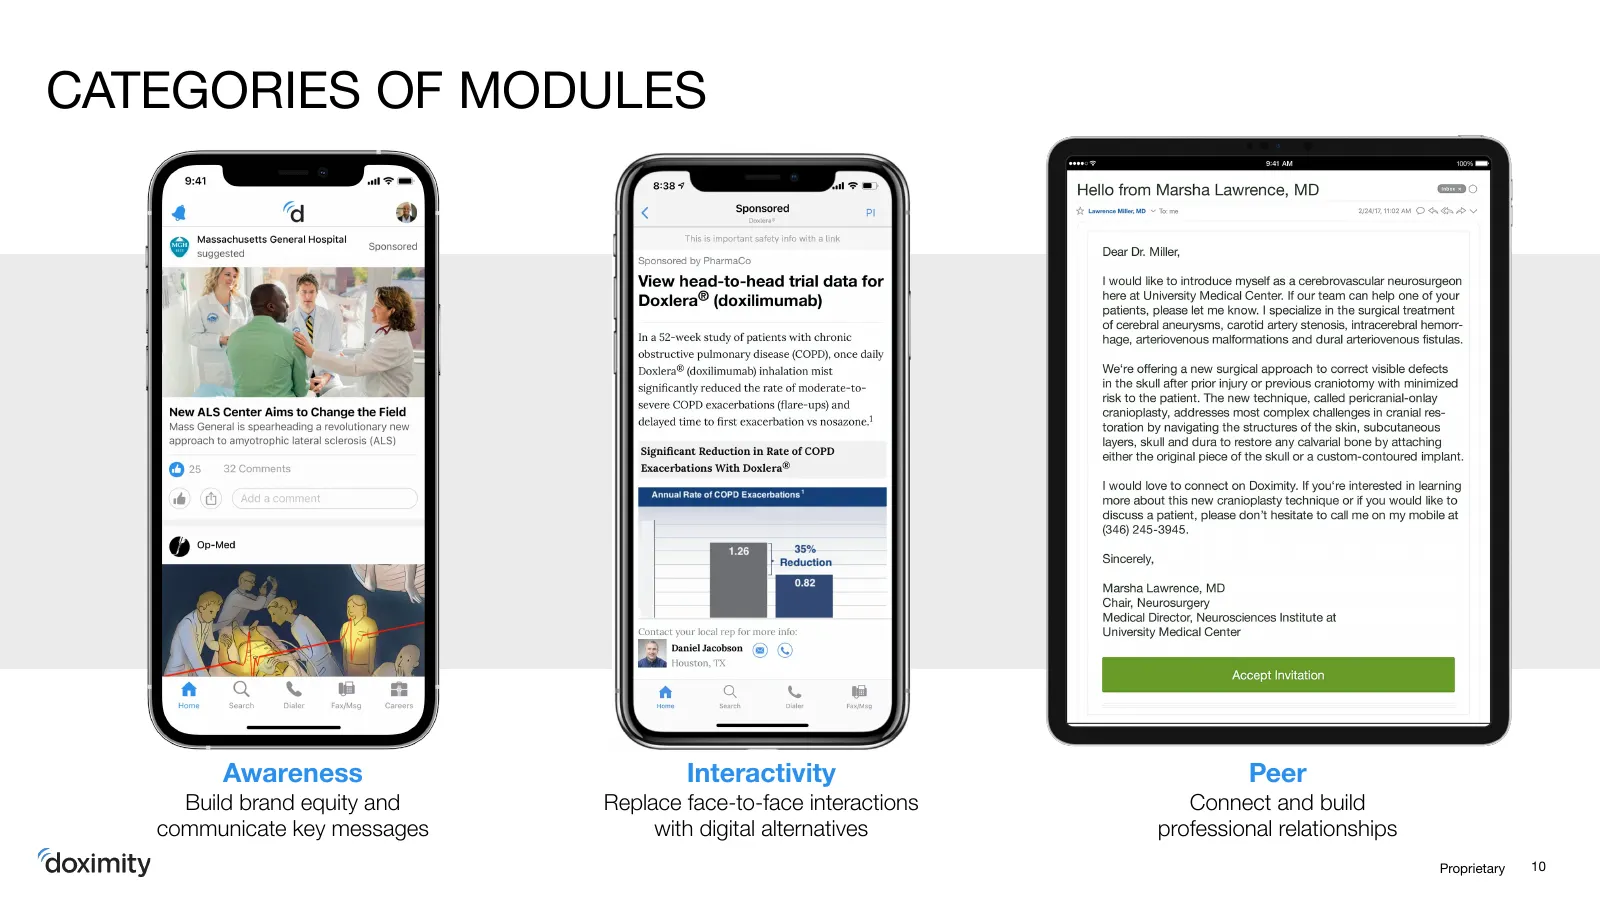
CATEGORIES OF MODULES Awareness Interactivity Peer Build brand equity and Replace face-to-face interactions Connect and build communicate key messages with digital alternatives professional relationships Proprietary 10
Slide 11: Large & Growing Total Addressable Market
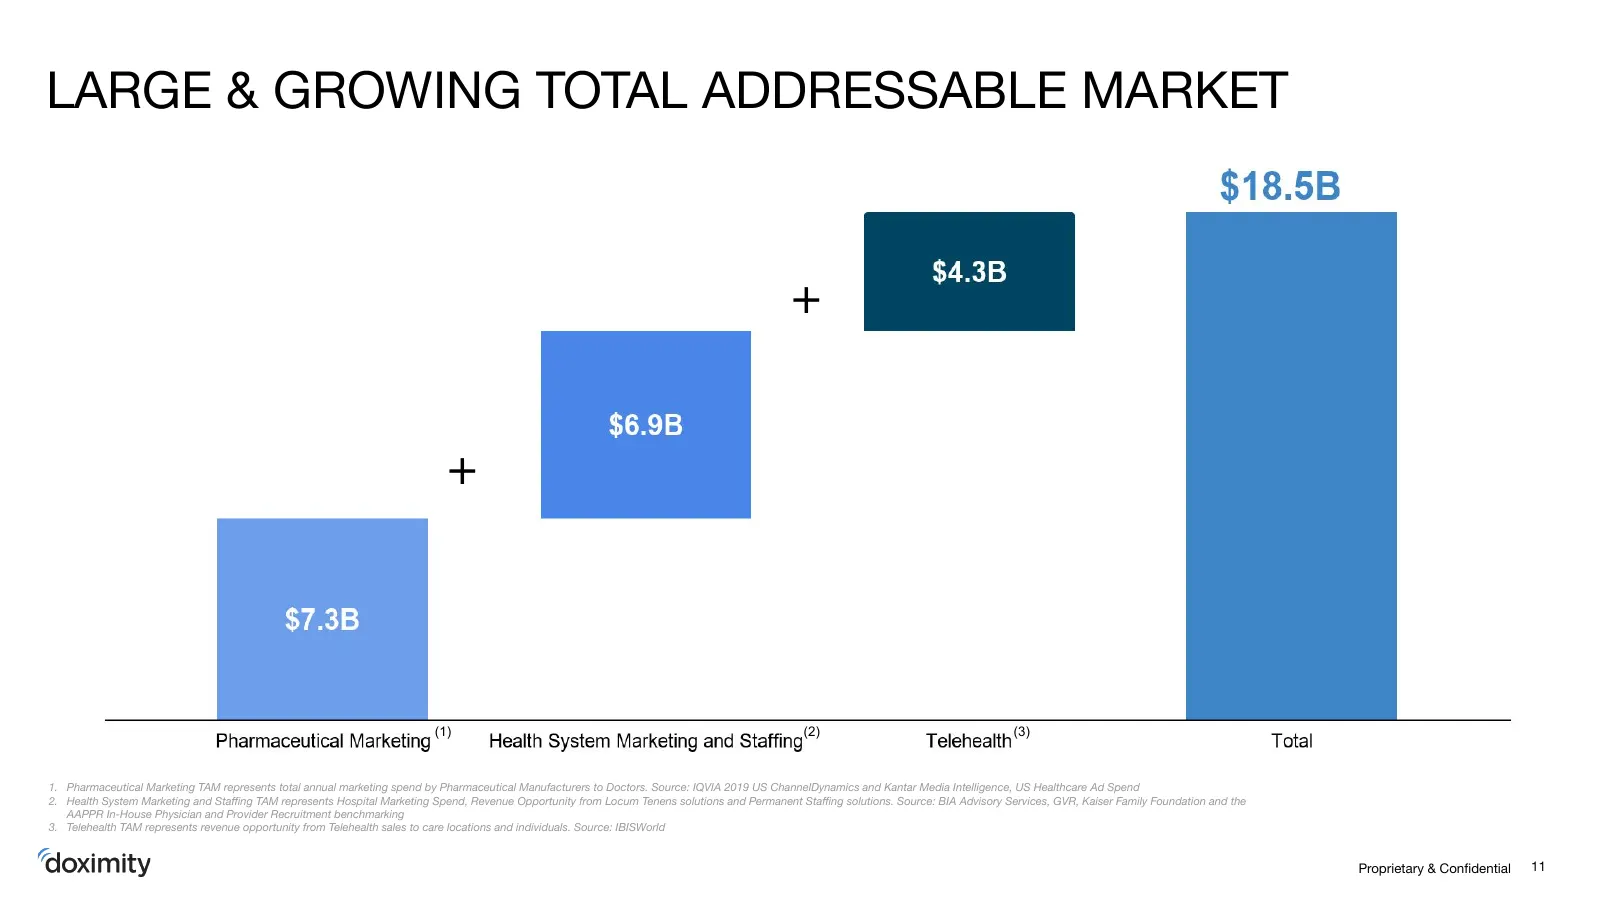
LARGE & GROWING TOTAL ADDRESSABLE MARKET + + (1) (2) (3) 1. Pharmaceutical Marketing TAM represents total annual marketing spend by Pharmaceutical Manufacturers to Doctors. Source: IQVIA 2019 US ChannelDynamics and Kantar Media Intelligence, US Healthcare Ad Spend 2. Health System Marketing and Staffi
Slide 12: ~430 Rx Brands with $100M+ in U.S. Sales
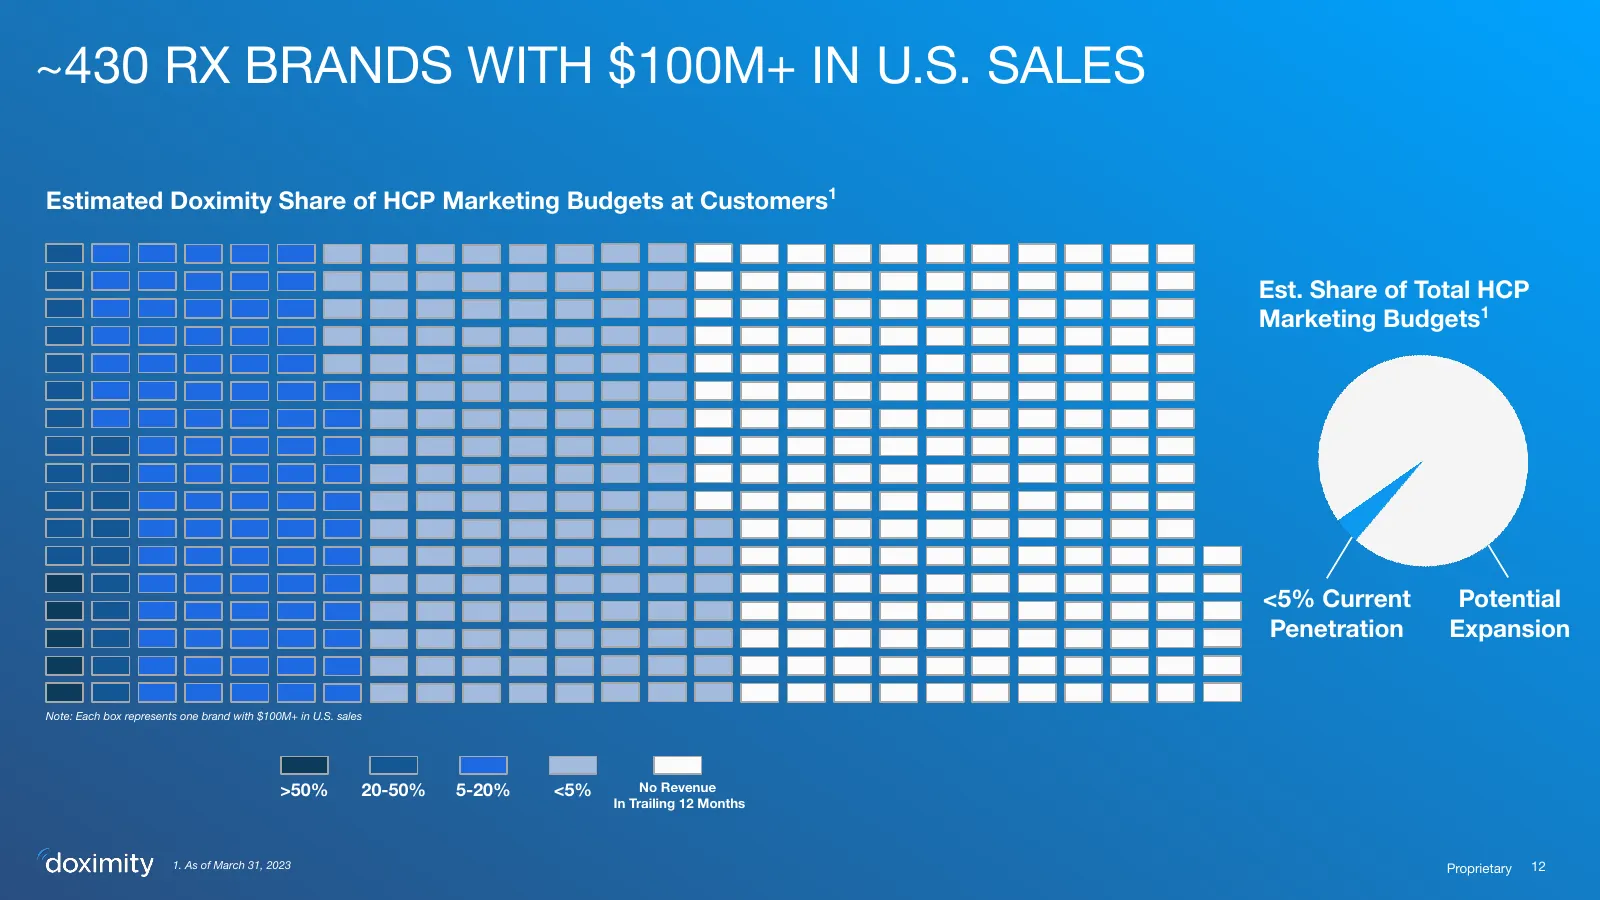
~430 RX BRANDS WITH $100M+ IN U.S. SALES Estimated Doximity Share of HCP Marketing Budgets at Customers1 Est. Share of Total HCP Marketing Budgets1 <5% Current Potential Penetration Expansion Note: Each box represents one brand with $100M+ in U.S. sales >50% 20-50% 5-20% <5% No Revenue In Trailing 1
Slide 13: Q4 Key Metrics
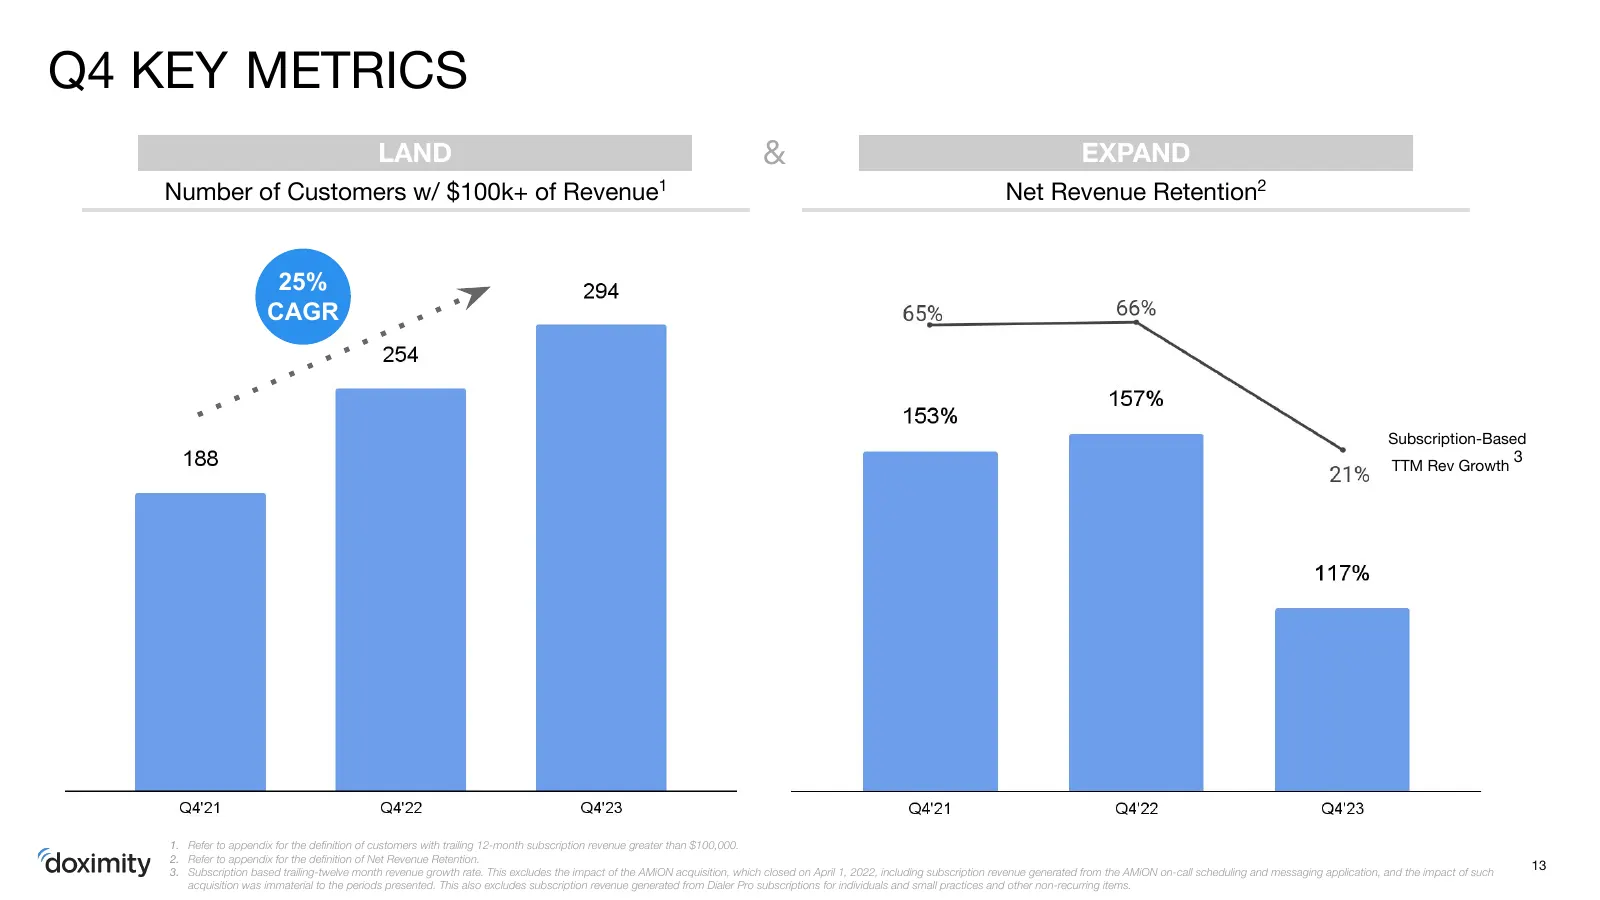
Q4 KEY METRICS LAND & EXPAND 1 Number of Customers w/ $100k+ of Revenue Net Revenue Retention2 25% CAGR Subscription-Based 3 TTM Rev Growth 1. Refer to appendix for the definition of customers with trailing 12-month subscription revenue greater than $100,000. 2. Refer to appendix for the definition of
Slide 14: High Growth Revenue & Attractive Margin Profile
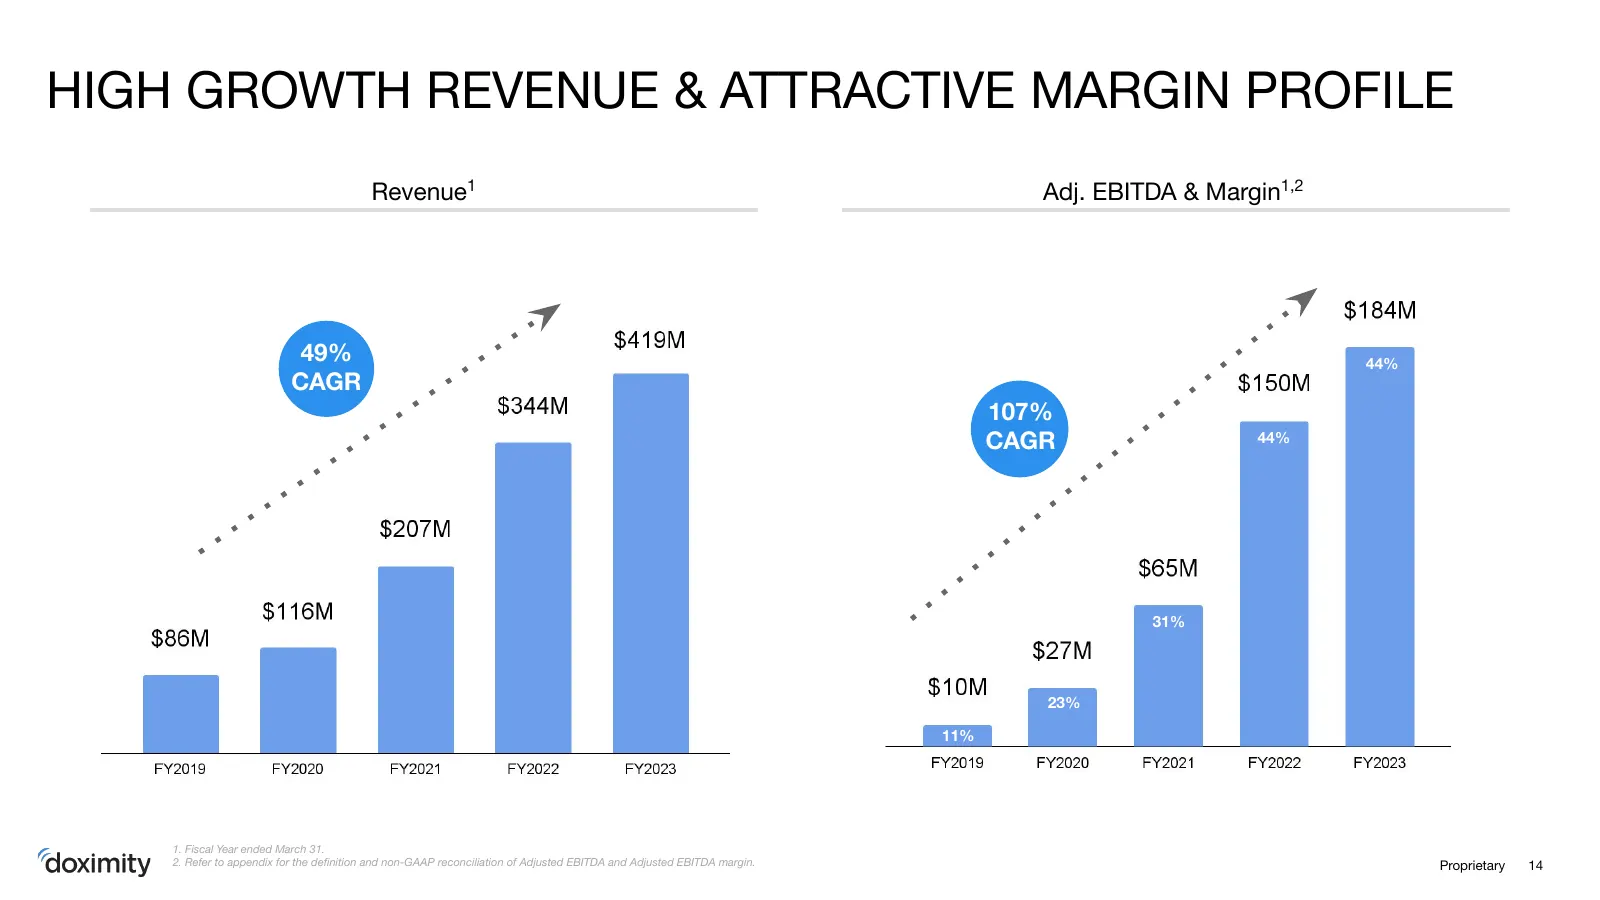
HIGH GROWTH REVENUE & ATTRACTIVE MARGIN PROFILE Revenue1 Adj. EBITDA & Margin1,2 49% 44% CAGR 107% CAGR 44% 31% 23% 11% 1. Fiscal Year ended March 31. 2. Refer to appendix for the definition and non-GAAP reconciliation of Adjusted EBITDA and Adjusted EBITDA margin. Proprietary 14
Slide 15: Founder-Led, Mission Driven
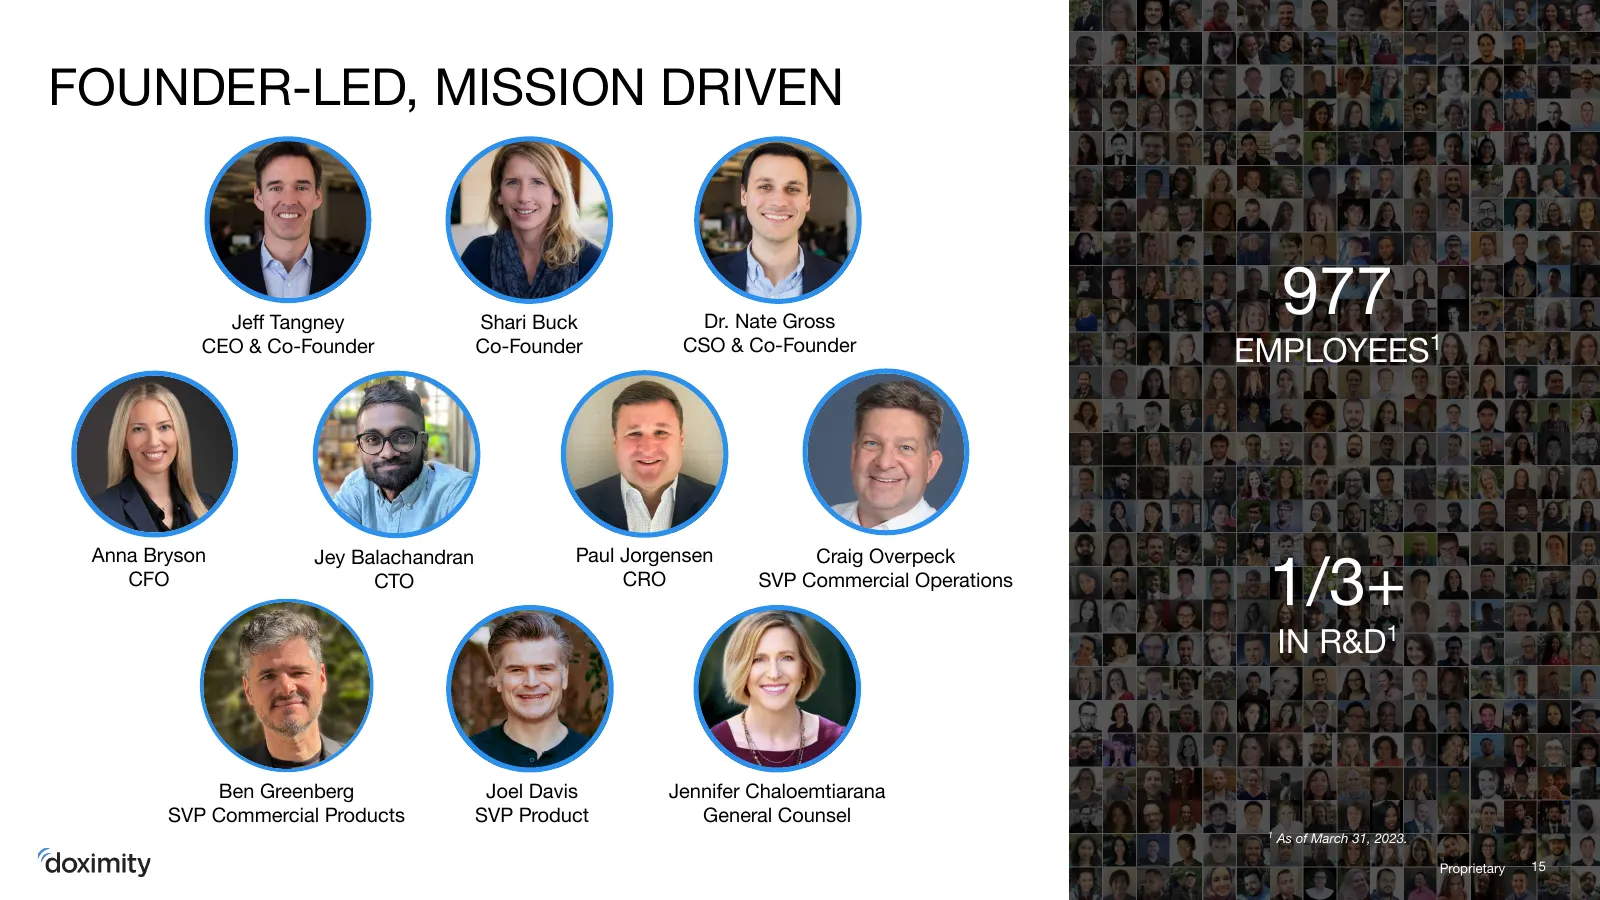
FOUNDER-LED, MISSION DRIVEN Jeff Tangney Shari Buck Dr. Nate Gross 977 CEO & Co-Founder Co-Founder CSO & Co-Founder EMPLOYEES1 Anna Bryson Jey Balachandran Paul Jorgensen Craig Overpeck CFO CTO CRO SVP Commercial Operations 1/3+ IN R&D1 Ben Greenberg Joel Davis Jennifer Chaloemtiarana SVP Commercial
Slide 16: Company Highlights
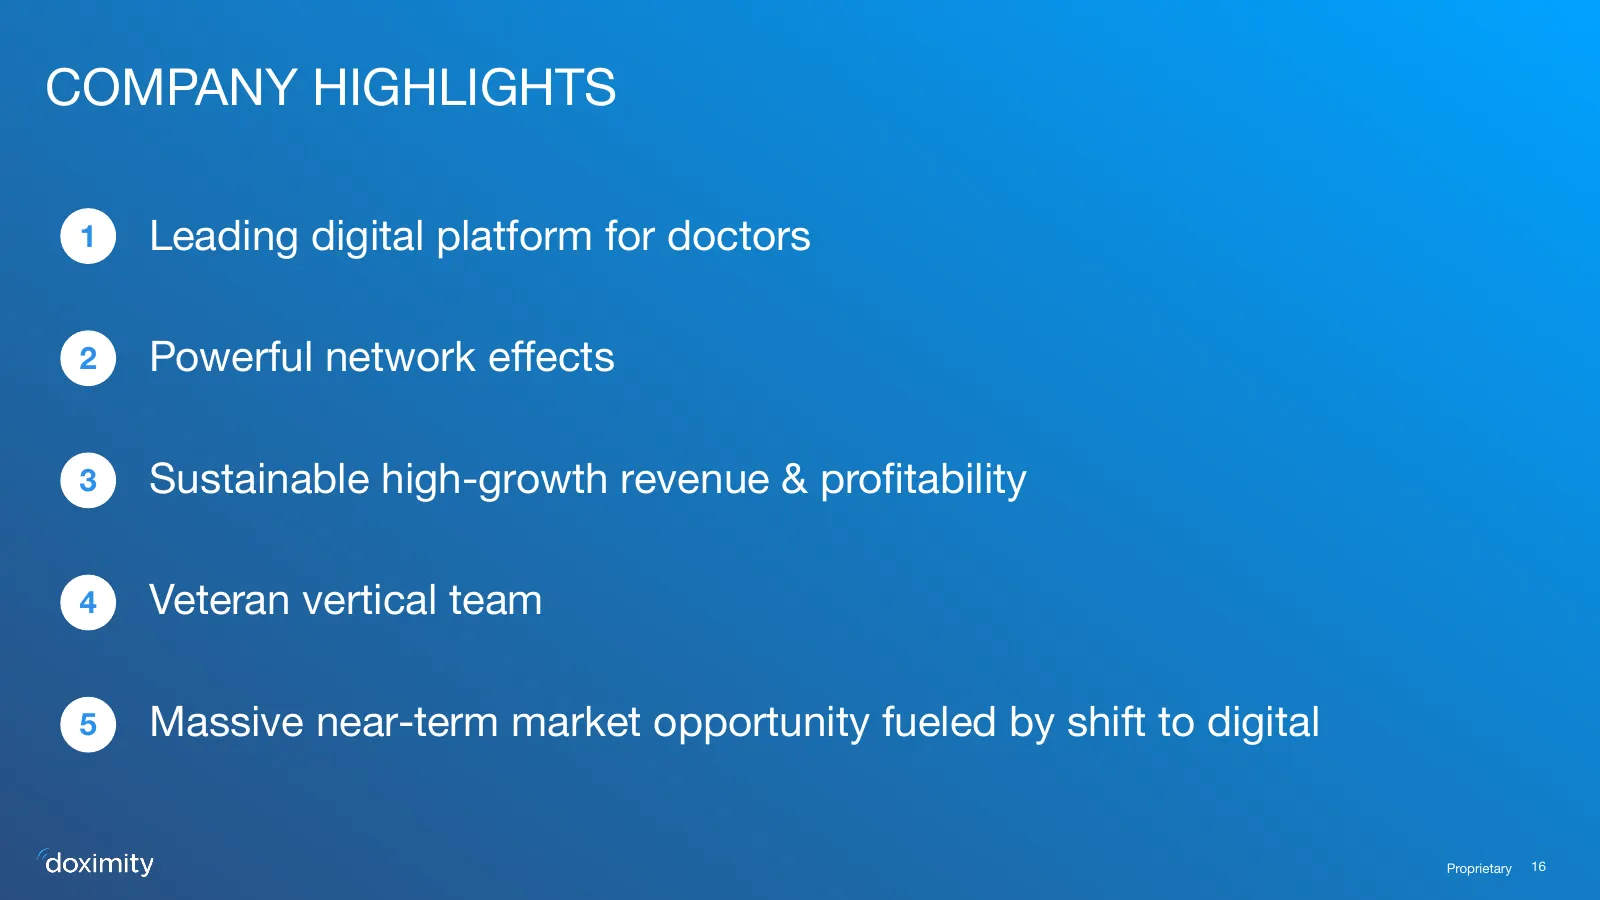
COMPANY HIGHLIGHTS 1 Leading digital platform for doctors 2 Powerful network effects 3 Sustainable high-growth revenue & profitability 4 Veteran vertical team 5 Massive near-term market opportunity fueled by shift to digital Proprietary 16
Slide 17: Appendix: Non-GAAP Financial Measures
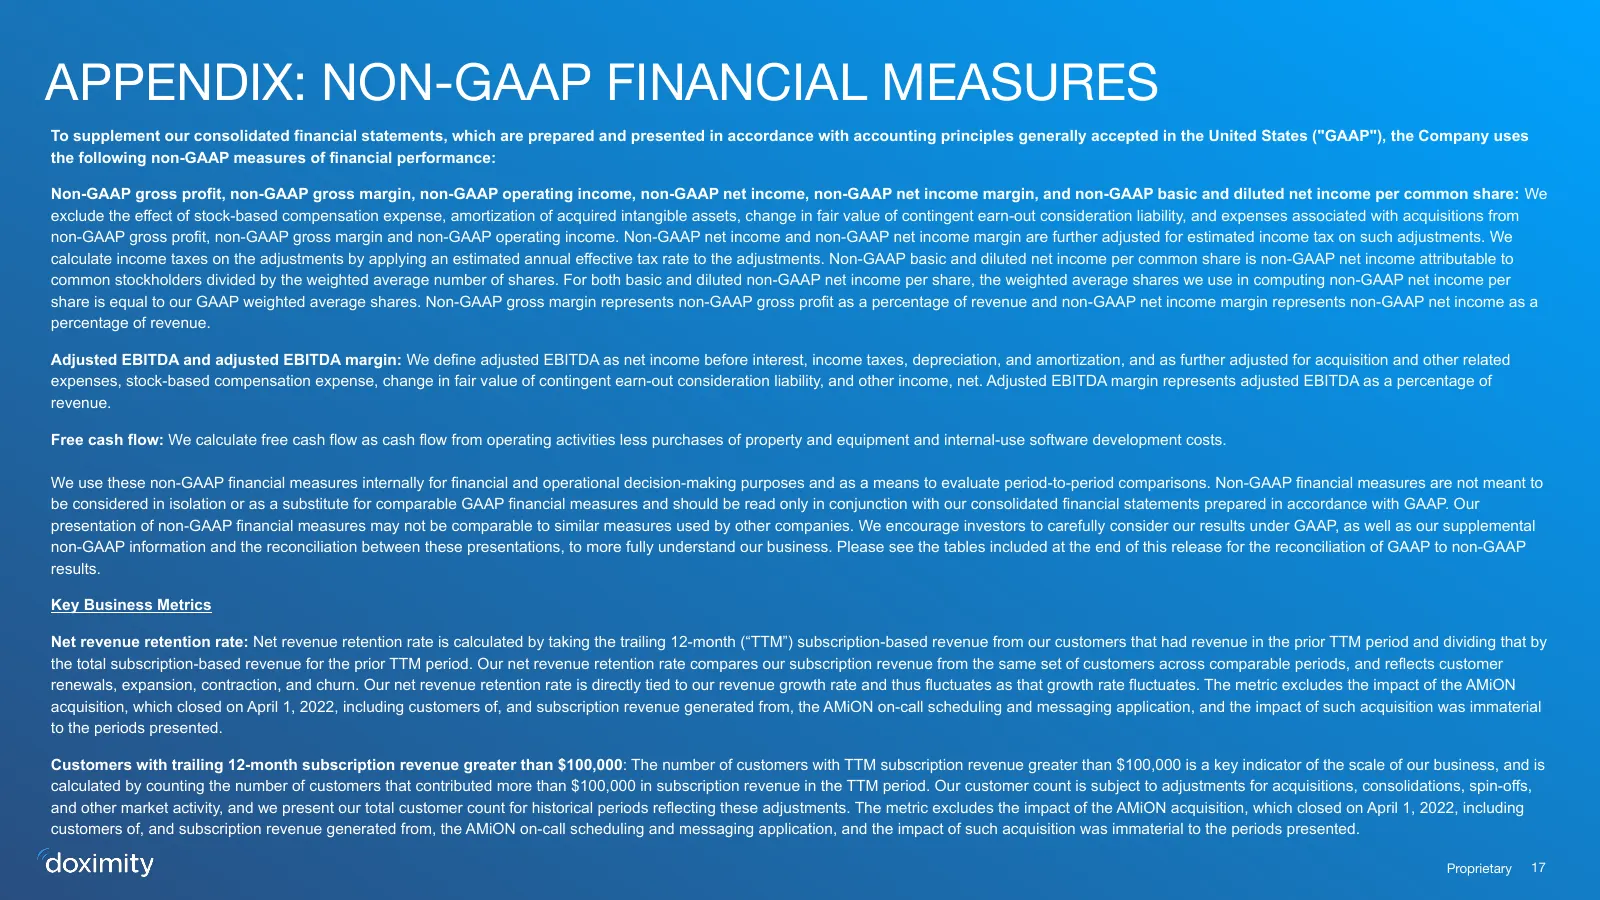
APPENDIX: NON-GAAP FINANCIAL MEASURES To supplement our consolidated financial statements, which are prepared and presented in accordance with accounting principles generally accepted in the United States ("GAAP"), the Company uses the following non-GAAP measures of financial performance: Non-GAAP g
Slide 18: Appendix: Adjusted EBITDA & Margin Non-GAAP Reconciliation
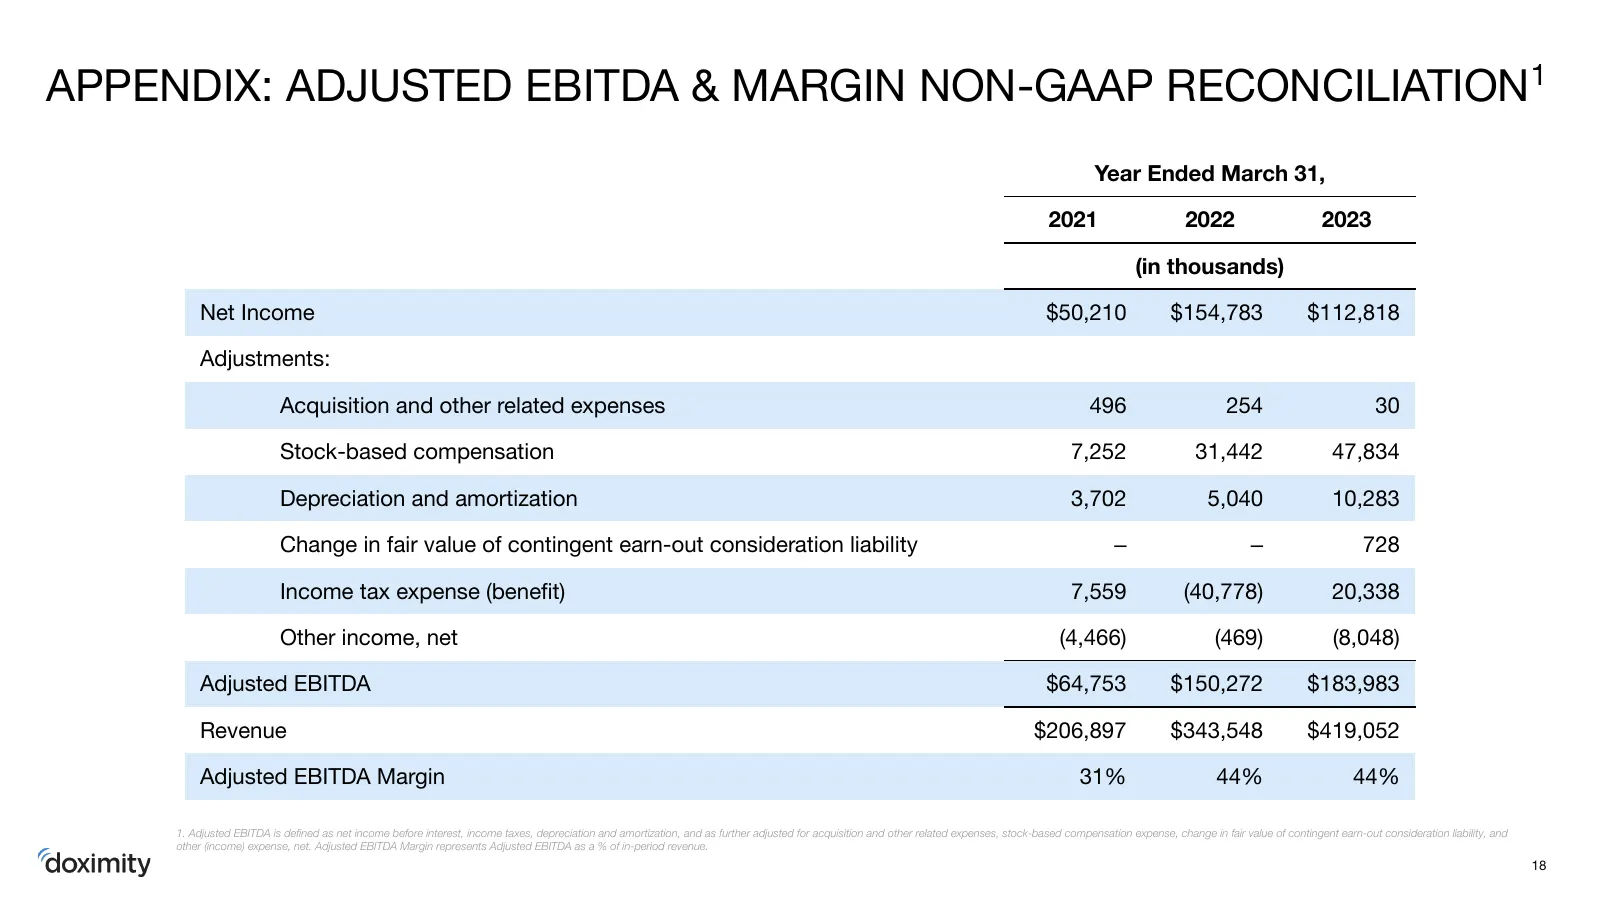
APPENDIX: ADJUSTED EBITDA & MARGIN NON-GAAP RECONCILIATION1 Year Ended March 31, 2021 2022 2023 (in thousands) Net Income $50,210 $154,783 $112,818 Adjustments: Acquisition and other related expenses 496 254 30 Stock-based compensation 7,252 31,442 47,834 Depreciation and amortization 3,702 5,040 10
Source: Internet Archive copy of s201.q4cdn.com
More decks from Doximity, Inc.
 Q2 2027 Earnings Presentation24 slides · Nov 5, 2026
 Investor Presentation (August 2026)25 slides · August 2026
 Q4 2026 Earnings Presentation25 slides · May 13, 2026
 Investor Presentation (February 2026)24 slides · February 2026
 Q2 FY2026 Earnings Presentation22 slides · November 2025
 Q1 2026 Earnings Presentation22 slides · Aug 7, 2025