Medco Health Solutions — Investor Day (November 2008)
147 slides from Medco Health Solutions's investor day presentation, Nov 21, 2008

Slide 1: Analyst Day 2008
Analyst Day 2008 November 21, 2008
Slide 2: Forward-looking Statements
Forward-looking Statements This presentation contains "forward-looking statements" as that term is defined in the Private Securities Litigation Reform Act of 1995. These statements involve risks and uncertainties that may cause results to differ materially from those set forth in the statements. No
Slide 3: Transforming Pharmacy & Reforming Healthcare
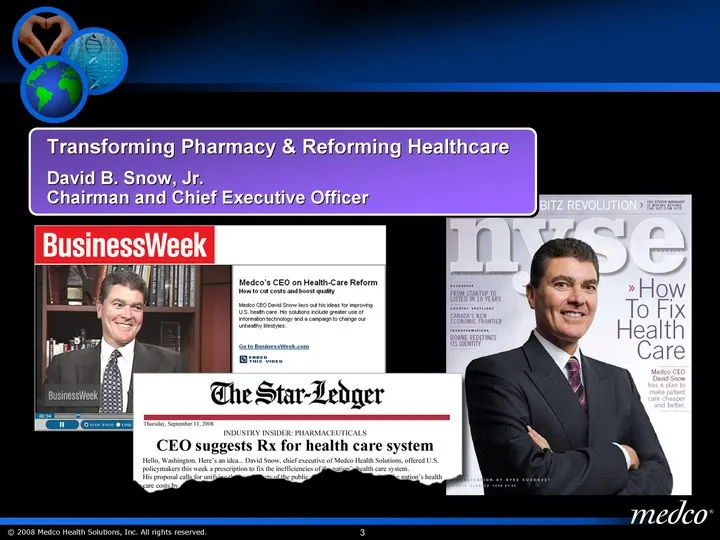
Transforming Pharmacy & Reforming Healthcare David B. Snow, Jr. Chairman and Chief Executive Officer
Slide 4: Transforming Pharmacy & Reforming Healthcare
Transforming Pharmacy & Reforming Healthcare David B. Snow, Jr. Chairman and CEO
Slide 5: U.S. Healthcare Costs are Highest
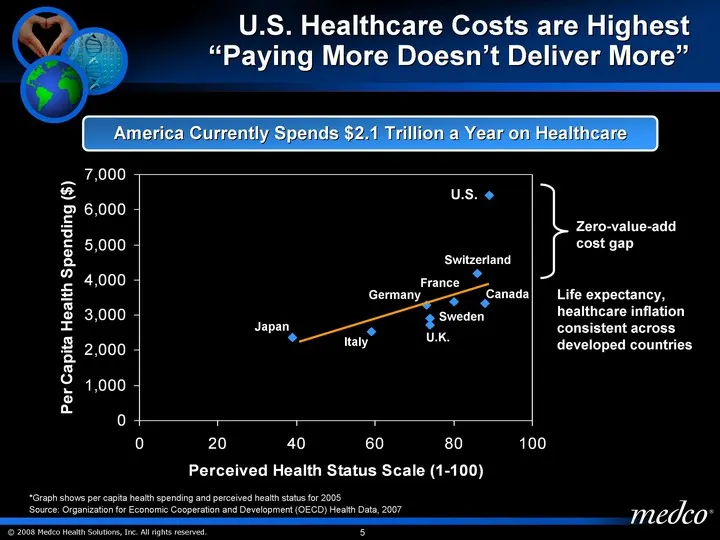
U.S. Healthcare Costs are Highest "Paying More Doesn't Deliver More" 86 73 39 80 74 59 88 74 89 East 4177 3287 2358 3374 2918 2532 3326 2724 6401 U.S. Japan Italy Canada Switzerland France Sweden U.K. Germany *Graph shows per capita health spending and perceived health status for 2005 Source: Organi
Slide 6: Reforming Healthcare: Five Urgent Imperatives
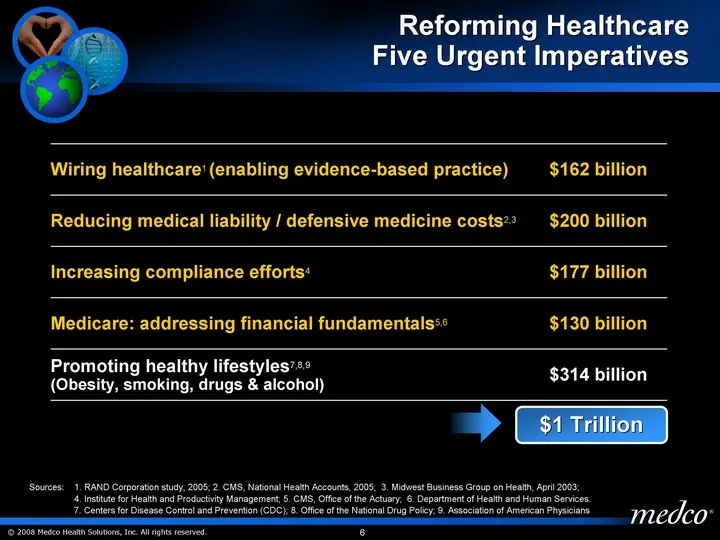
Reforming Healthcare Five Urgent Imperatives Sources: 1. RAND Corporation study, 2005; 2. CMS, National Health Accounts, 2005; 3. Midwest Business Group on Health, April 2003; 4. Institute for Health and Productivity Management; 5. CMS, Office of the Actuary; 6. Department of Health and Human Servic
Slide 7: Medco's Opportunity
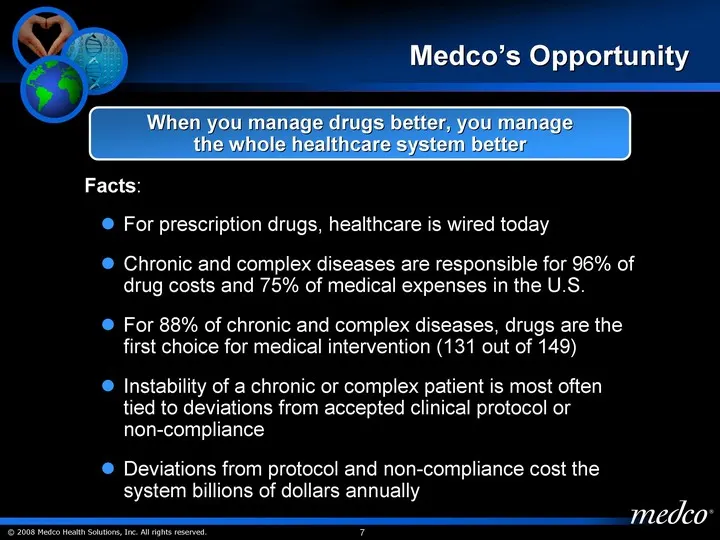
Medco's Opportunity Facts: When you manage drugs better, you manage the whole healthcare system better For prescription drugs, healthcare is wired today Chronic and complex diseases are responsible for 96% of drug costs and 75% of medical expenses in the U.S. For 88% of chronic and complex diseases,
Slide 8: Medco's Strategic Imperative
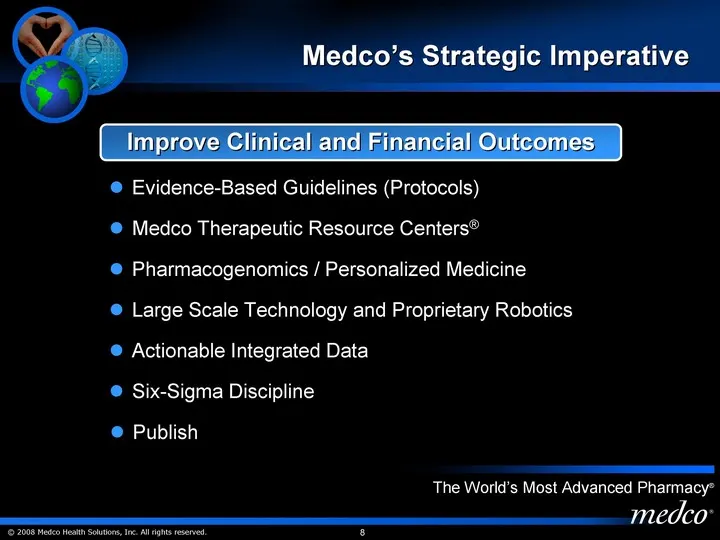
Medco's Strategic Imperative Publish Pharmacogenomics / Personalized Medicine Large Scale Technology and Proprietary Robotics Actionable Integrated Data Six-Sigma Discipline Evidence-Based Guidelines (Protocols) Medco Therapeutic Resource Centers(r) The World's Most Advanced Pharmacy(r) Improve Clin
Slide 9: Medco's Strategic Imperative
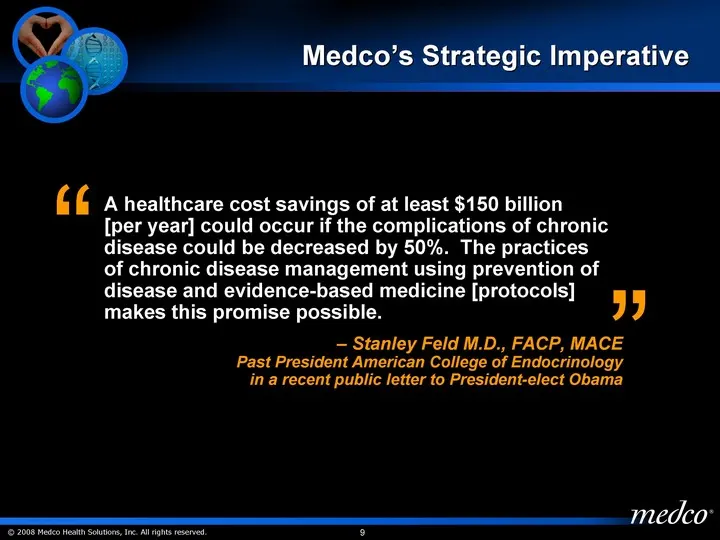
Medco's Strategic Imperative A healthcare cost savings of at least $150 billion [per year] could occur if the complications of chronic disease could be decreased by 50%. The practices of chronic disease management using prevention of disease and evidence-based medicine [protocols] makes this promise
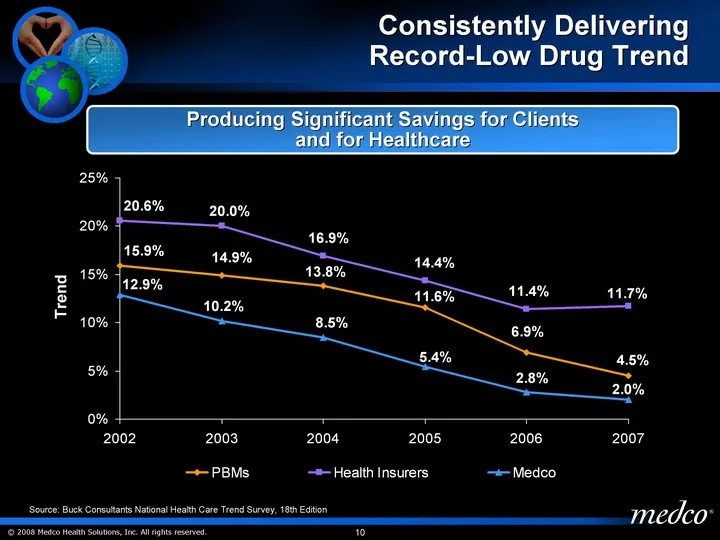
Slide 10: Consistently Delivering Record-Low Drug Trend
Consistently Delivering Record-Low Drug Trend 2002 2003 2004 2005 2006 2007 PBMs 0.159 0.149 0.138 0.116 0.069 0.045 Health Insurers 0.206 0.2 0.169 0.144 0.114 0.117 Medco 0.129 0.102 0.085 0.054 0.028 0.02 Source: Buck Consultants National Health Care Trend Survey, 18th Edition Trend Producing Sig
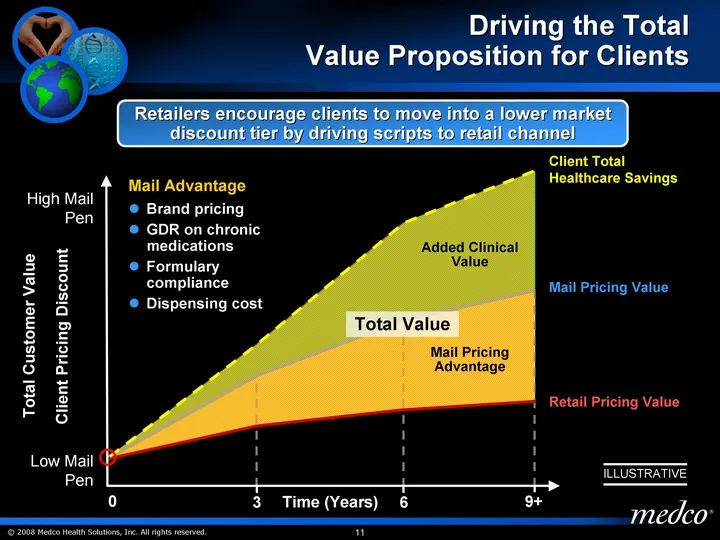
Slide 11: Driving the Total Value Proposition for Clients
Driving the Total Value Proposition for Clients Retailers encourage clients to move into a lower market discount tier by driving scripts to retail channel Time (Years) Mail Pricing Value Total Value Retail Pricing Value Client Total Healthcare Savings Client Pricing Discount High Mail Pen Low Mail P
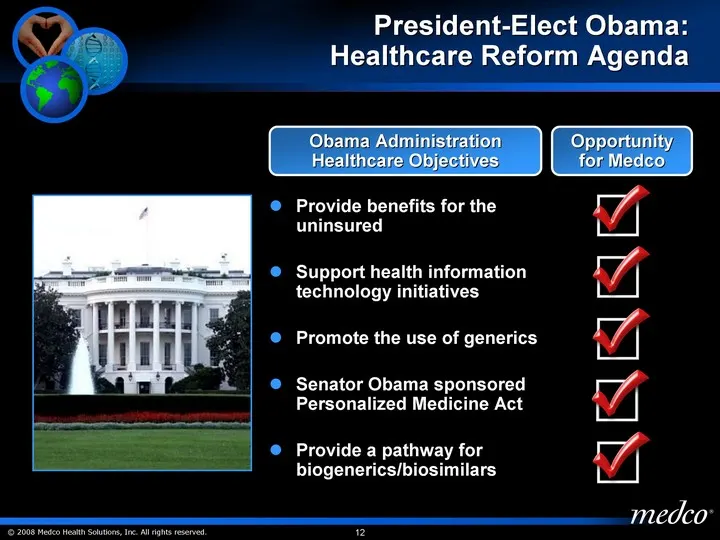
Slide 12: President-Elect Obama: Healthcare Reform Agenda
President-Elect Obama: Healthcare Reform Agenda Provide benefits for the uninsured Support health information technology initiatives Promote the use of generics Senator Obama sponsored Personalized Medicine Act Provide a pathway for biogenerics/biosimilars Opportunity for Medco Obama Administration
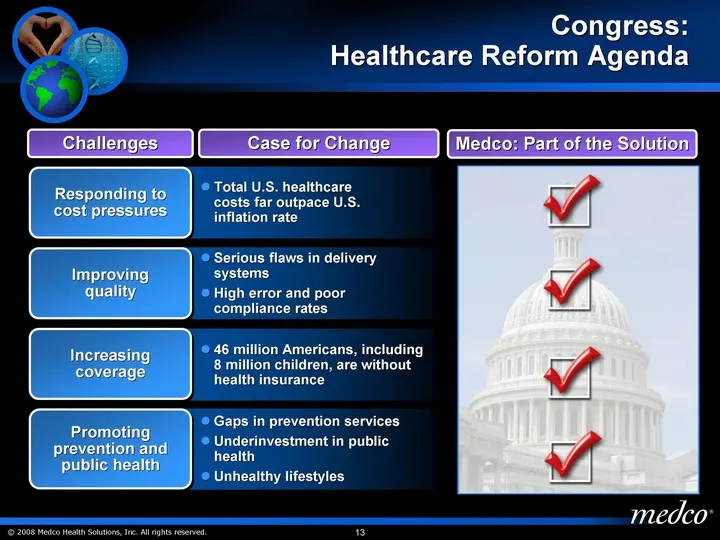
Slide 13: Congress: Healthcare Reform Agenda
Congress: Healthcare Reform Agenda Responding to cost pressures Increasing coverage Promoting prevention and public health Total U.S. healthcare costs far outpace U.S. inflation rate 46 million Americans, including 8 million children, are without health insurance Case for Change Gaps in prevention s
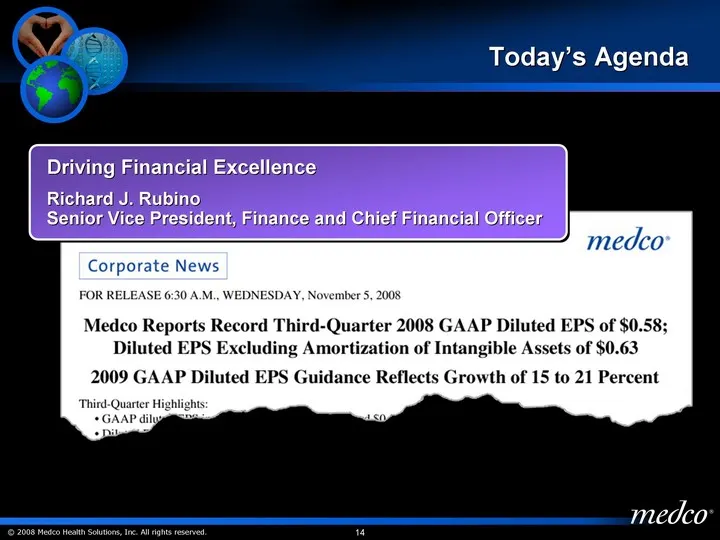
Slide 14: Today's Agenda: Driving Financial Excellence
Today's Agenda Driving Financial Excellence Richard J. Rubino Senior Vice President, Finance and Chief Financial Officer
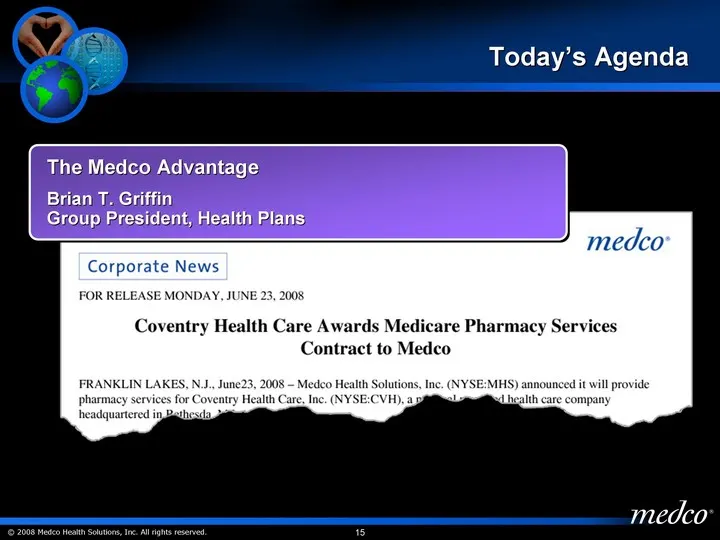
Slide 15: Today's Agenda: The Medco Advantage
Today's Agenda The Medco Advantage Brian T. Griffin Group President, Health Plans
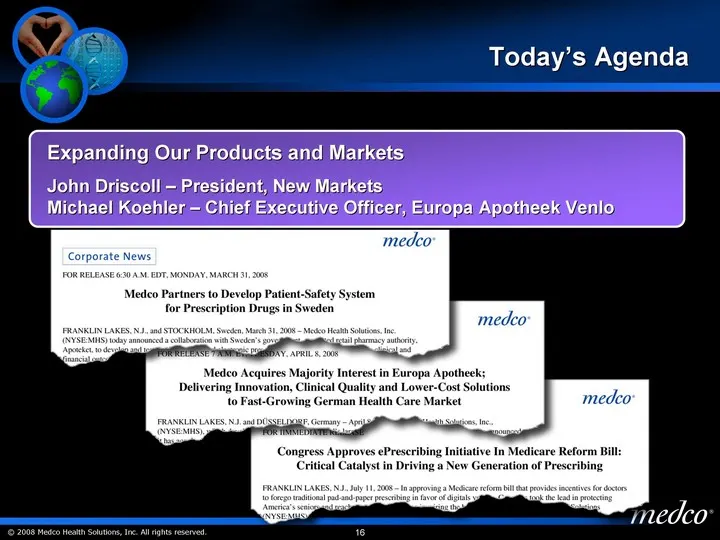
Slide 16: Today's Agenda: Expanding Our Products and Markets
Today's Agenda Expanding Our Products and Markets John Driscoll - President, New Markets Michael Koehler - Chief Executive Officer, Europa Apotheek Venlo
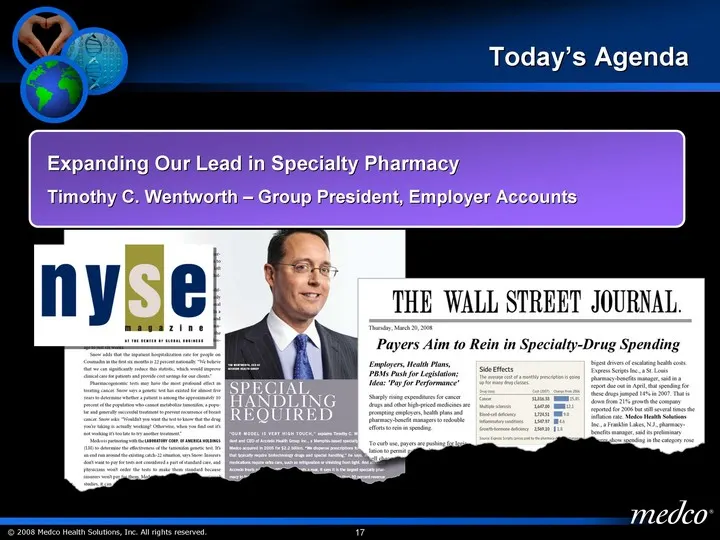
Slide 17: Today's Agenda: Expanding Our Lead in Specialty Pharmacy
Today's Agenda Expanding Our Lead in Specialty Pharmacy Timothy C. Wentworth - Group President, Employer Accounts
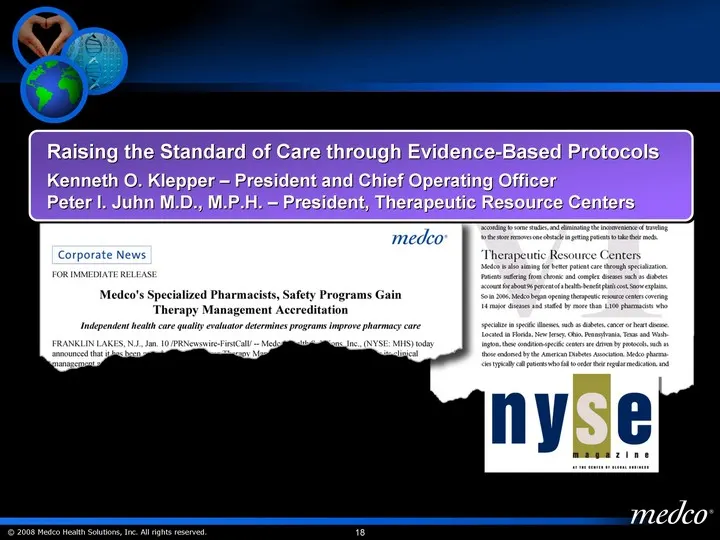
Slide 18: Raising the Standard of Care through Evidence-Based Protocols
Raising the Standard of Care through Evidence-Based Protocols Kenneth O. Klepper - President and Chief Operating Officer Peter I. Juhn M.D., M.P.H. - President, Therapeutic Resource Centers
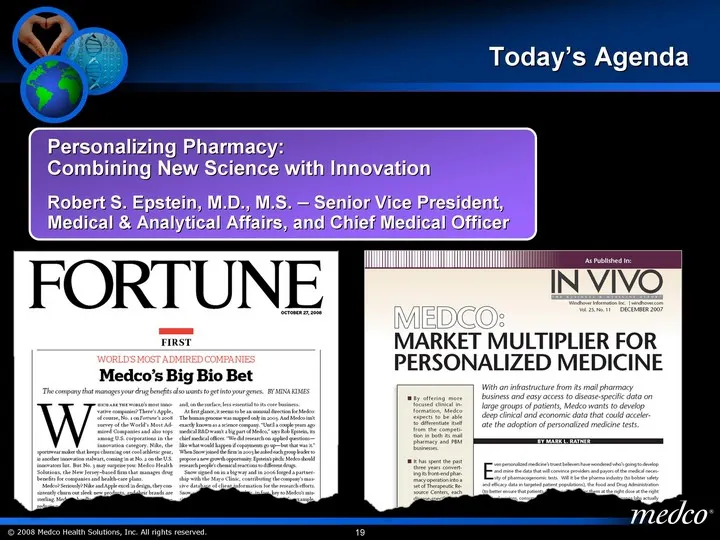
Slide 19: Today's Agenda: Personalizing Pharmacy
Today's Agenda Personalizing Pharmacy: Combining New Science with Innovation Robert S. Epstein, M.D., M.S. - Senior Vice President, Medical & Analytical Affairs, and Chief Medical Officer
Slide 20: Driving Financial Excellence
Driving Financial Excellence Richard J. Rubino Senior Vice President, Finance and Chief Financial Officer
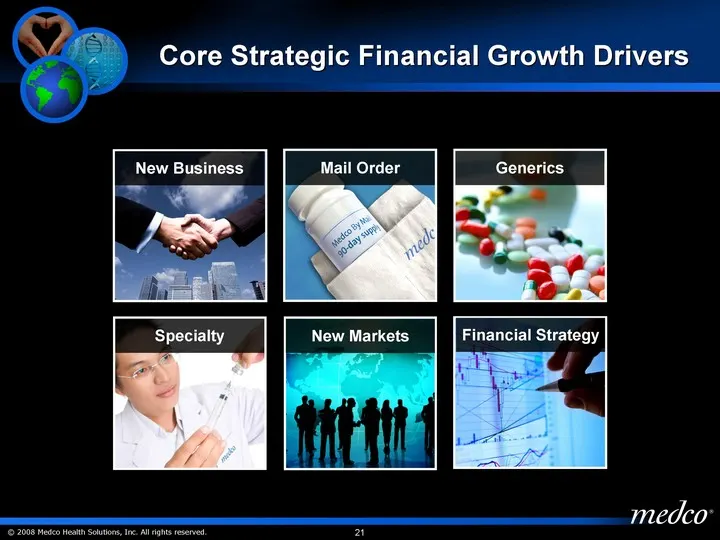
Slide 21: Core Strategic Financial Growth Drivers
Core Strategic Financial Growth Drivers New Business Mail Order Generics New Markets Specialty Financial Strategy
Slide 22: 2008 Sales and Retention Success
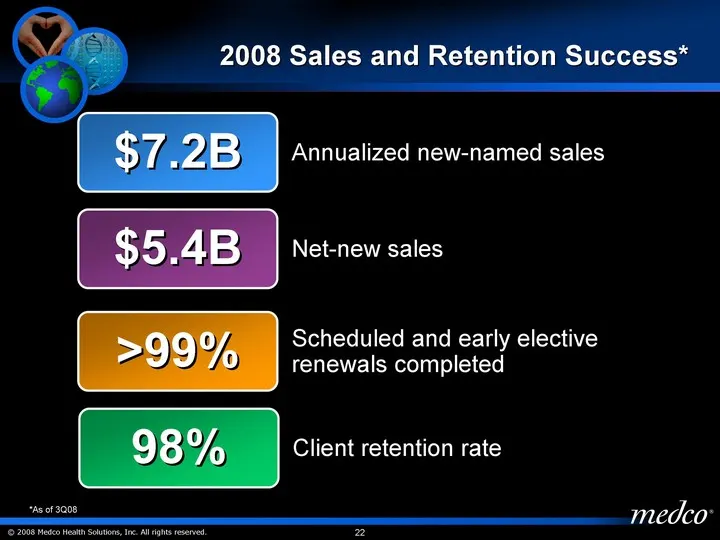
2008 Sales and Retention Success* $7.2B Annualized new-named sales $5.4B Net-new sales >99% Scheduled and early elective renewals completed 98% Client retention rate *As of 3Q08
Slide 23: 2009 Sales and Retention Success
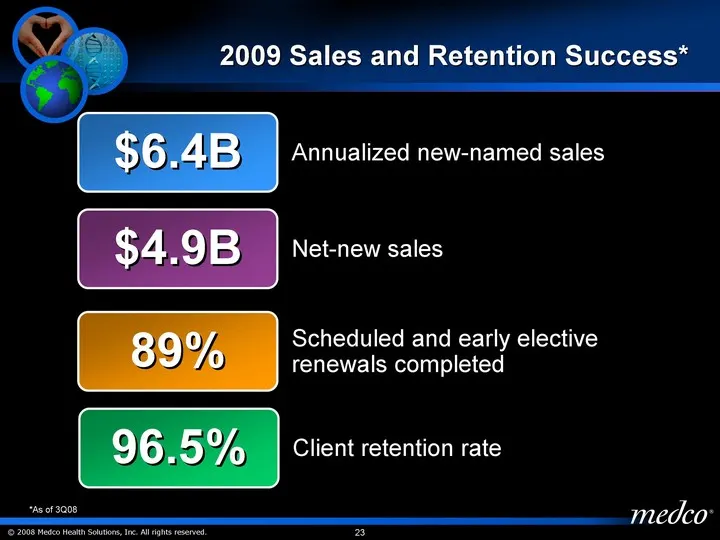
2009 Sales and Retention Success* $6.4B Annualized new-named sales $4.9B Net-new sales 89% Scheduled and early elective renewals completed 96.5% Client retention rate *As of 3Q08
Slide 24: Annualized New-Named Sales and Adjusted Mail-Order Penetration
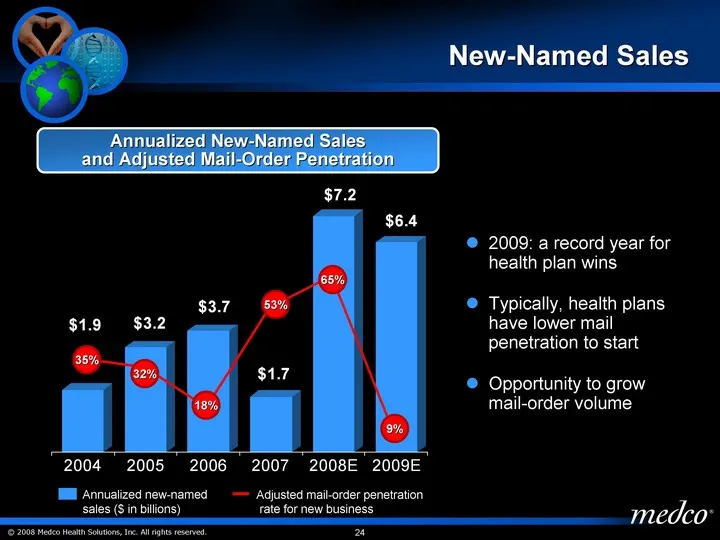
2004 2005 2006 2007 2008E 2009E New Business 1.9 3.2 3.7 1.7 7.2 6.4 2004 A 2005 A 2006 2007E 2008E 2009E East % Penetration Rate 0.35 0.32 0.1789 0.532 0.6451 0.089 New-Named Sales Adjusted mail-order penetration rate for new business Annualized new-named sales ($ in billions) Annualized New-Named
Slide 25: Mail-Order Trend
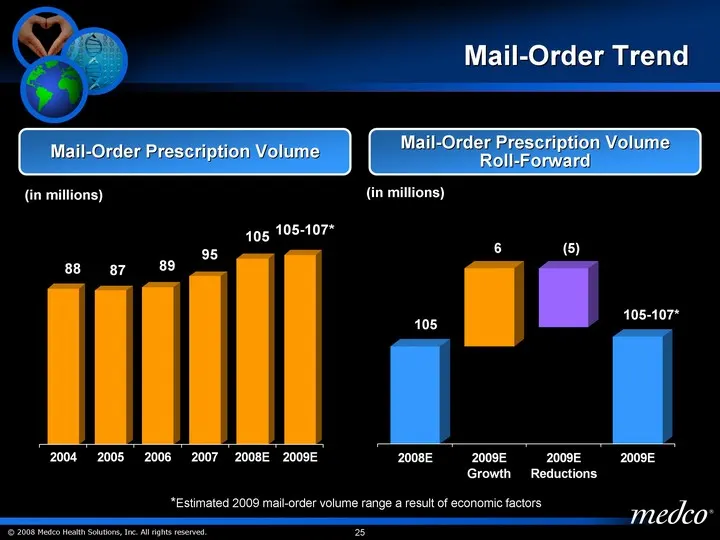
Mail-Order Trend 2004 2005 2006 2007 2008E 2009E New Business 2.9 4 4.7 2.9 Mail-Order Volume 88 87 89 95 105 107 Mail-Order Prescription Volume 2008E 2009E Growth 2009E Reductions 2009E East 105 105 105 106 8 0.9 1.1 6 Mail-Order Prescription Volume Roll-Forward 105 6 (5) 105-107* *Estimated 2009 m
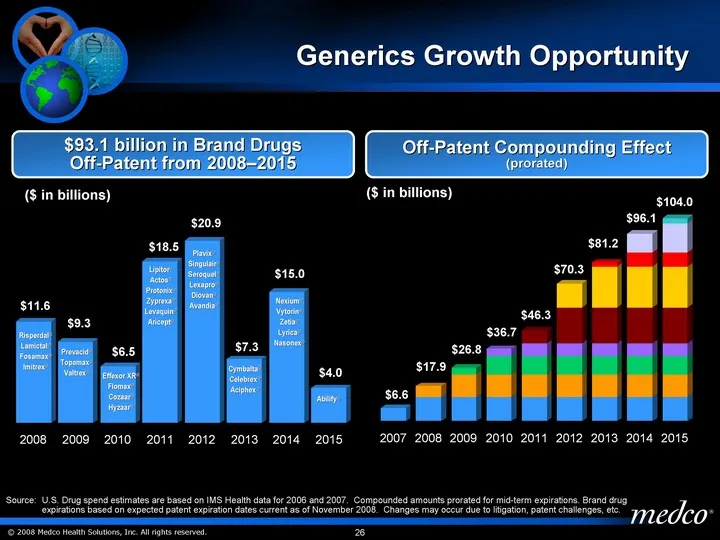
Slide 26: Generics Growth Opportunity
2008 2009 2010 2011 2012 2013 2014 2015 Acute Chronic/Complex 11.6 9.3 6.5 18.5 20.9 7.3 15 4 Generics Growth Opportunity Risperdal(r) Lamictal(r) Fosamax(r) Imitrex(r) Prevacid(r) Topamax(r) Valtrex(r) Effexor XR(r) Flomax(r) Cozaar(r) Hyzaar(r) Lipitor(r) Actos(r) Protonix(r) Zyprexa(r) Levaquin(r
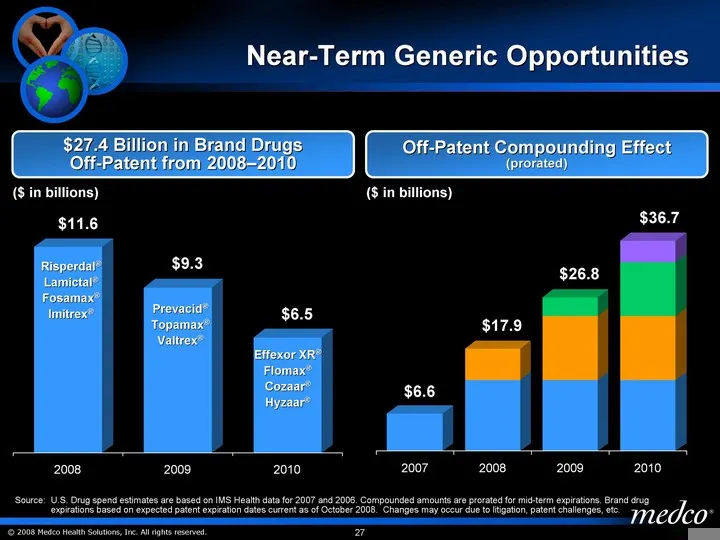
Slide 27: Near-Term Generic Opportunities
2008 2009 2010 Acute Chronic/Complex 11.6 9.3 6.5 Near-Term Generic Opportunities Risperdal(r) Lamictal(r) Fosamax(r) Imitrex(r) Prevacid(r) Topamax(r) Valtrex(r) Effexor XR(r) Flomax(r) Cozaar(r) Hyzaar(r) Source: U.S. Drug spend estimates are based on IMS Health data for 2007 and 2006. Compounded
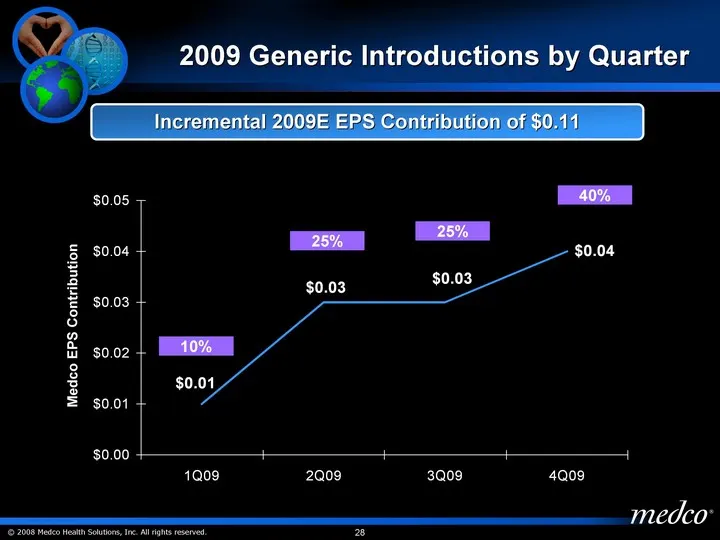
Slide 28: 2009 Generic Introductions by Quarter
2009 Generic Introductions by Quarter 1Q09 2Q09 3Q09 4Q09 Medco Incremental EPS Impact 0.01 0.03 0.03 0.04 Medco EPS Contribution 10% 25% 25% 40% Incremental 2009E EPS Contribution of $0.11
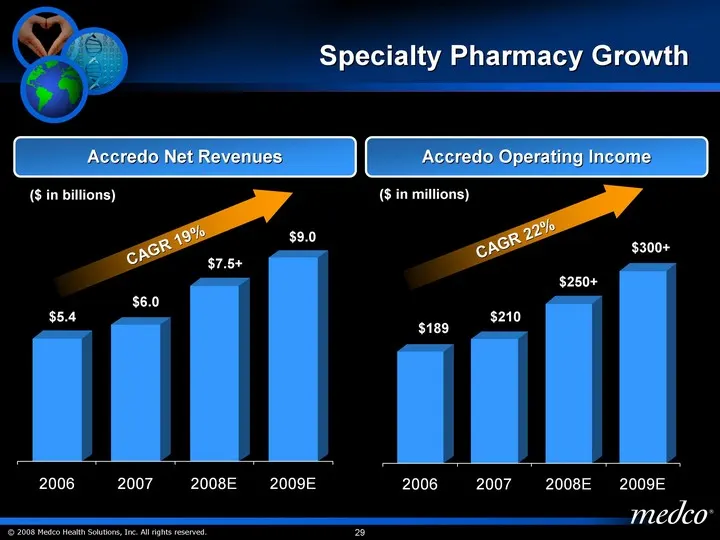
Slide 29: Specialty Pharmacy Growth
2006 2007 2008E 2009E Acute Chronic/Complex 5437 6043 7760 9000 Specialty Pharmacy Growth Accredo Net Revenues $5.4 $9.0 $7.5+ $6.0 Accredo Operating Income 2006 2007 2008E 2009E 189 210 270 325 $189 $250+ $300+ $210 CAGR 19% CAGR 22% ($ in billions) ($ in millions)
Slide 30: Biosimilars Opportunity
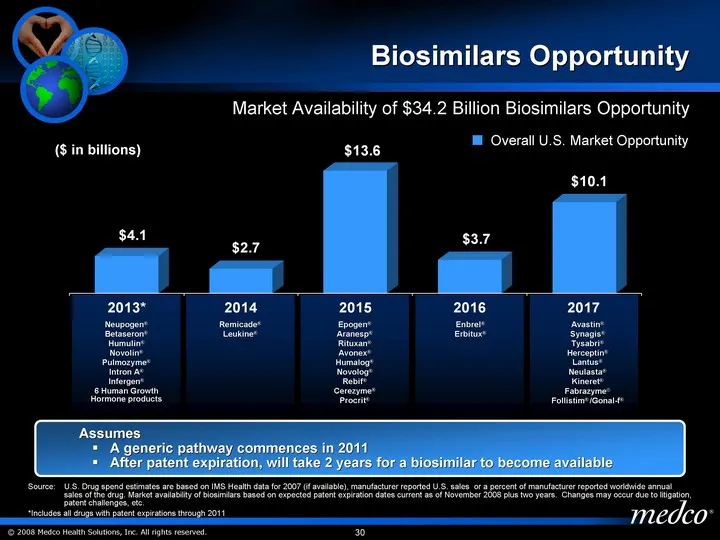
2013* 2014 2015 2016 2017 Overall U.S. Market Opportunity 4.1 2.7 13.6 3.7 10.1 Medco Opportunity 3 0.5 6.4 2.1 0 Biosimilars Opportunity Market Availability of $34.2 Billion Biosimilars Opportunity Source: U.S. Drug spend estimates are based on IMS Health data for 2007 (if available), manufacturer
Slide 31: Biosimilars Expand Generic Opportunity
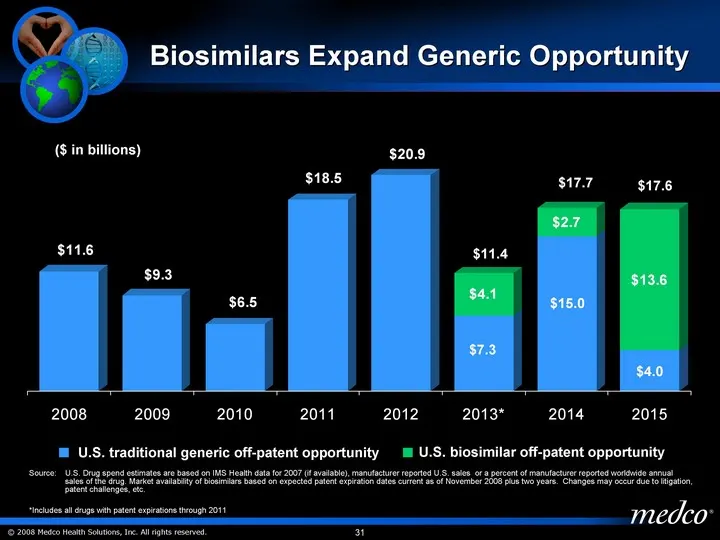
$7.3 $15.0 $4.0 2008 2009 2010 2011 2012 2013* 2014 2015 Acute Chronic/Complex 11.6 9.3 6.5 18.5 20.9 7.3 15 4 4.1 2.7 13.6 Biosimilars Expand Generic Opportunity ($ in billions) U.S. traditional generic off-patent opportunity $11.4 $17.7 $17.6 U.S. biosimilar off-patent opportunity $7.3 $15.0 $4.0
Slide 32: Mail-Order Opportunity in Germany
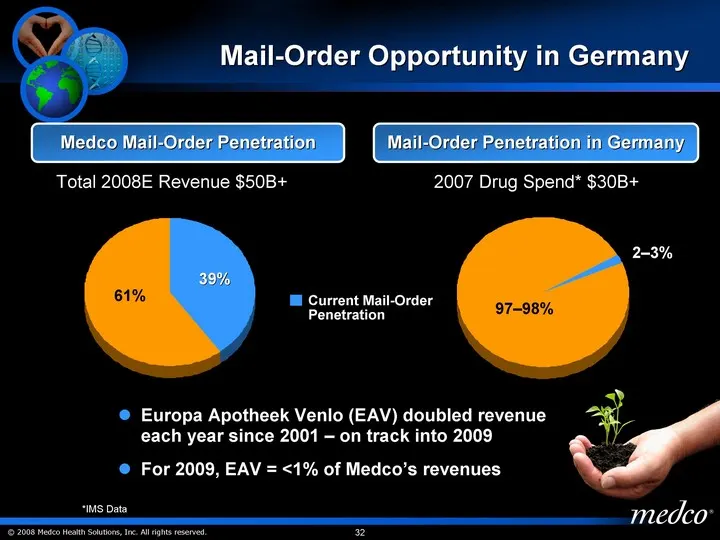
Mail-Order Opportunity in Germany Current Penetration 0.4 Remaining Penetration 0.6 Medco Mail-Order Penetration Mail-Order Penetration in Germany Current Penetration 0.02 Remaining Penetration 0.98 39% 2-3% 61% 97-98% Europa Apotheek Venlo (EAV) doubled revenue each year since 2001 - on track into
Slide 33: Financial Strategy
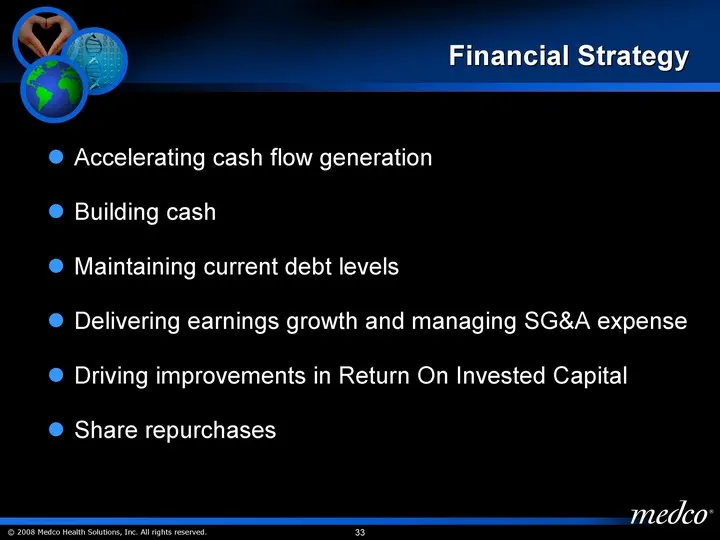
Financial Strategy Accelerating cash flow generation Building cash Maintaining current debt levels Delivering earnings growth and managing SG&A expense Driving improvements in Return On Invested Capital Share repurchases
Slide 34: Accelerating Cash Flow Generation and Building Cash
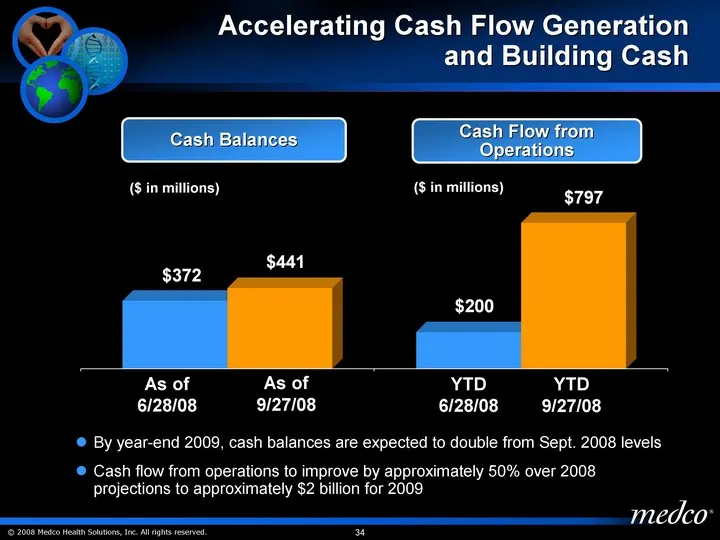
Accelerating Cash Flow Generation and Building Cash Six Months Ended June 2008 Nine Months Ended Sept. 2008 Cash Balance 372 440.8 Cash Flow from Operations 200.2 797.2 By year-end 2009, cash balances are expected to double from Sept. 2008 levels Cash flow from operations to improve by approximately
Slide 35: Holding Debt Levels
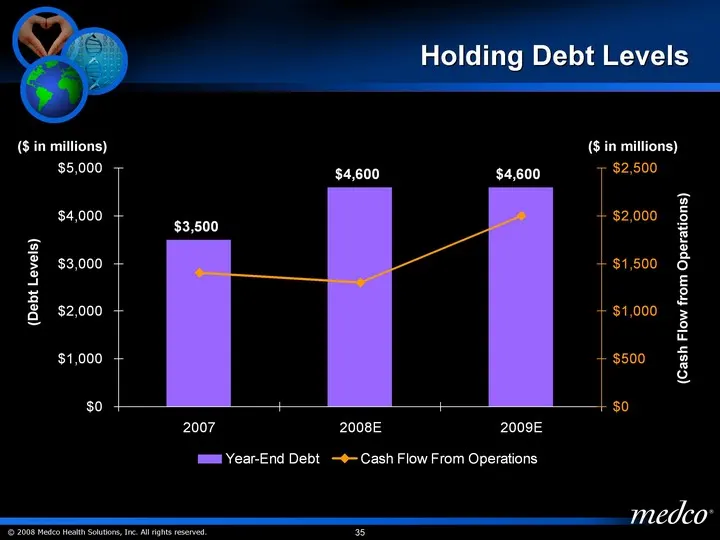
Holding Debt Levels 2007 2008E 2009E Year-End Debt 3500 4600 4600 Cash Flow From Operations 1400 1300 2000 ($ in millions) (Debt Levels) (Cash Flow from Operations) ($ in millions)
Slide 36: GAAP EPS and SG&A Growth
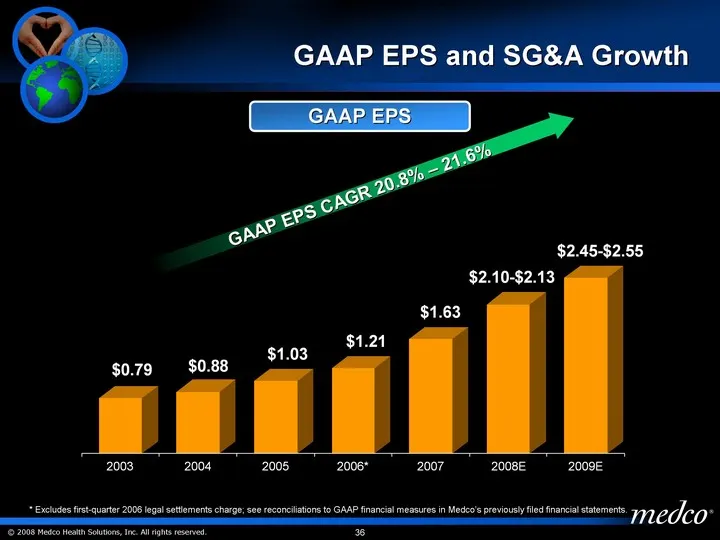
GAAP EPS and SG&A Growth GAAP EPS GAAP EPS CAGR 20.8% - 21.6% * Excludes first-quarter 2006 legal settlements charge; see reconciliations to GAAP financial measures in Medco's previously filed financial statements. 2009E 2008E 2007 2006* 2005 2004 2003 SG&A Espense 2.5 2.12 1.63 1.21 1.03 0.88 0.79
Slide 37: GAAP EPS and SG&A Growth
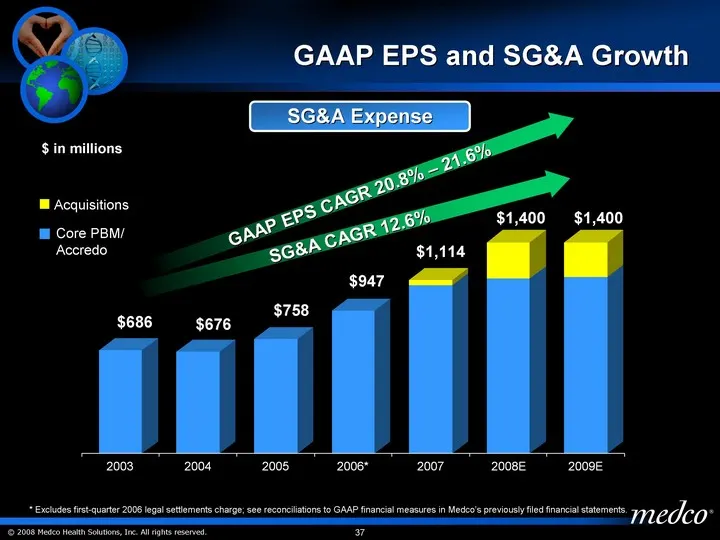
GAAP EPS CAGR 20.8% - 21.6% GAAP EPS and SG&A Growth 2009E 2008E 2007 2006* 2005 2004 2003 1170 1160 1114 947 758 676 686 230 240 35 SG&A Expense $ in millions * Excludes first-quarter 2006 legal settlements charge; see reconciliations to GAAP financial measures in Medco's previously filed financial
Slide 38: Improving Return On Invested Capital
Improving Return On Invested Capital Full evaluation of all invested capital Company-wide focus on ROIC Examples include SG&A focus, inventory levels and accounts receivable management Target ROIC for 2009 estimated to increase by 2 full percentage points over 2008
Slide 39: Share Repurchases
Share Repurchases Previous $5.5 Billion authorization was completed in October 2008 153.8 million shares repurchased Average price of $35.75 Board approved new $3 Billion program in November 2008 Authorization through November 2010 All purchases to be funded from free cash flow No additional debt ex
Slide 40: Strong EBITDA Per Adjusted Script Growth
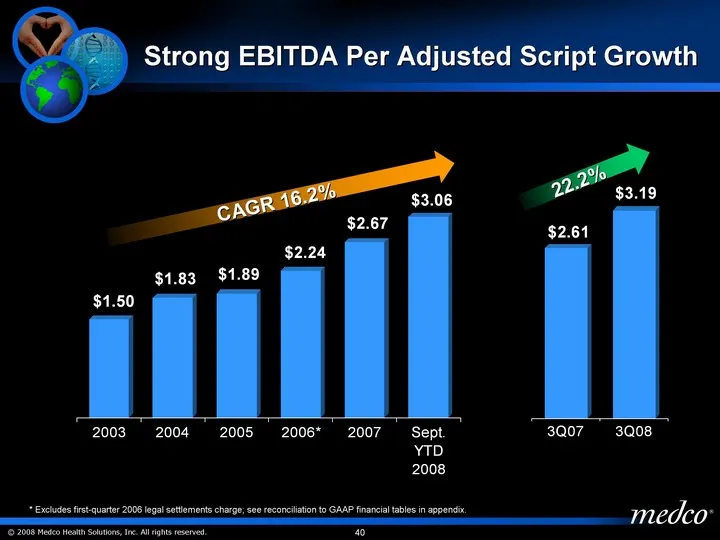
2003 1.5 2004 1.83 2005 1.89 2006* 2.24 2007 2.67 Sept. YTD 2008 3.06 * Excludes first-quarter 2006 legal settlements charge; see reconciliation to GAAP financial tables in appendix. Strong EBITDA Per Adjusted Script Growth CAGR 16.2% 3Q07 2.61 3Q08 3.19 22.2%
Slide 41: Strong GAAP Earnings Per Share Growth
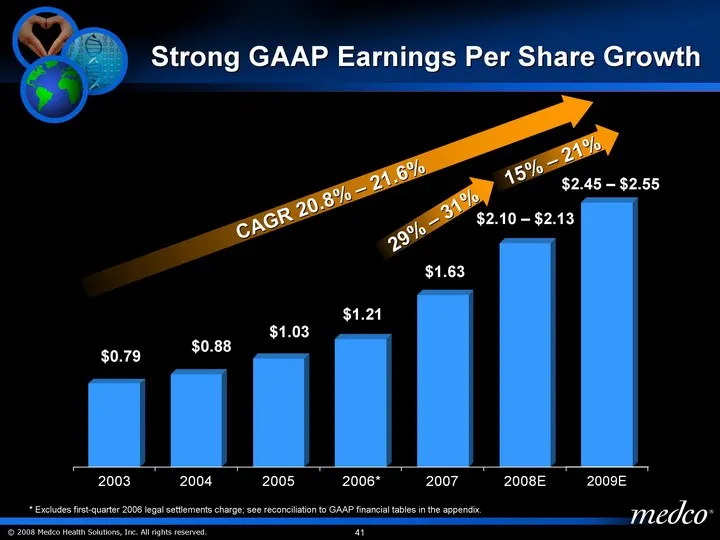
2003 2004 2005 2006* 2007 2008E GAAP EPS 0.79 0.88 1.03 1.21 1.63 2.12 CAGR 20.8% - 21.6% Strong GAAP Earnings Per Share Growth $0.79 $0.88 $1.03 $1.63 $1.21 * Excludes first-quarter 2006 legal settlements charge; see reconciliation to GAAP financial tables in the appendix. $2.10 - $2.13 15% - 21% 2
Slide 42: Guidance Assumptions
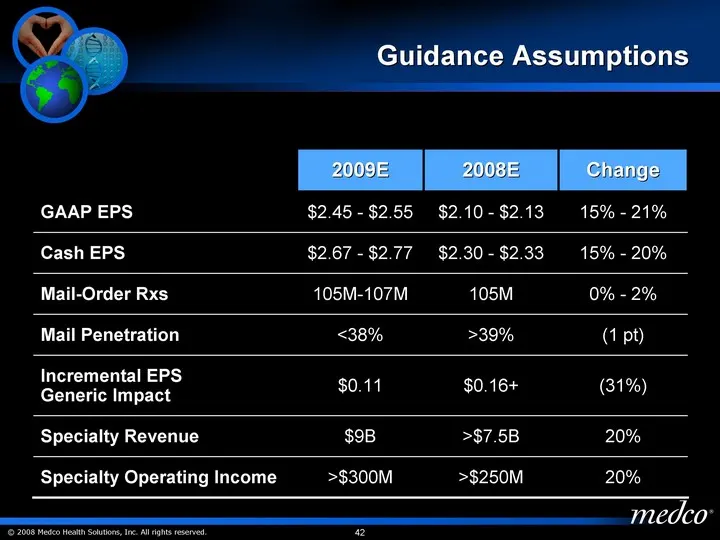
Guidance Assumptions 2009E 2008E Change GAAP EPS $2.45 - $2.55 $2.10 - $2.13 15% - 21% Cash EPS $2.67 - $2.77 $2.30 - $2.33 15% - 20% Mail-Order Rxs 105M-107M 105M 0% - 2% Mail Penetration <38% >39% (1 pt) Incremental EPS Generic Impact $0.11 $0.16+ (31%) Specialty Revenue $9B >$7.5B 20% Specialty O
Slide 43: Guidance Assumptions
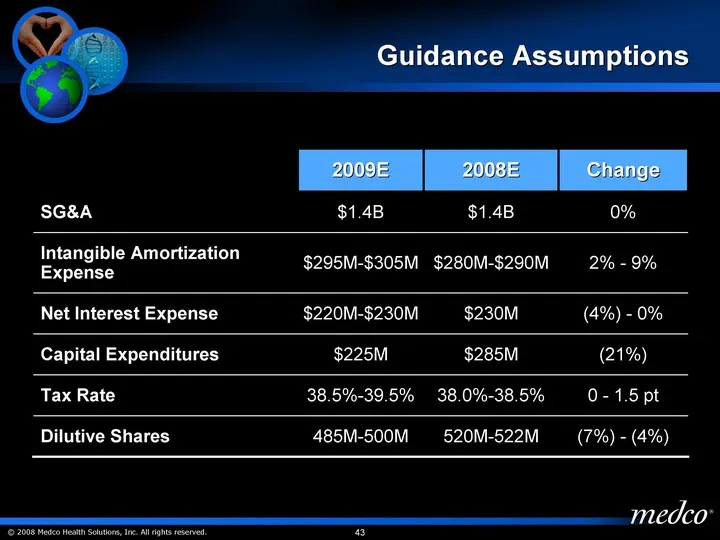
Guidance Assumptions 2009E 2008E Change SG&A $1.4B $1.4B 0% Intangible Amortization Expense $295M-$305M $280M-$290M 2% - 9% Net Interest Expense $220M-$230M $230M (4%) - 0% Capital Expenditures $225M $285M (21%) Tax Rate 38.5%-39.5% 38.0%-38.5% 0 - 1.5 pt Dilutive Shares 485M-500M 520M-522M (7%) - (
Slide 44: Additional 2009 Guidance Assumptions
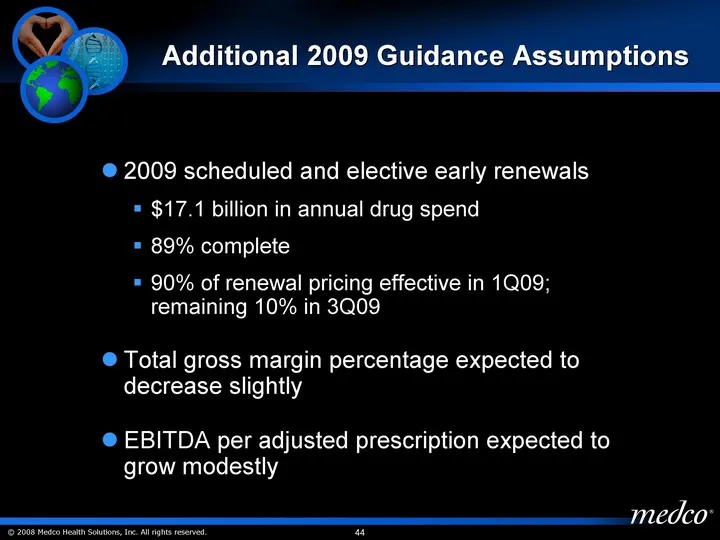
Additional 2009 Guidance Assumptions 2009 scheduled and elective early renewals $17.1 billion in annual drug spend 89% complete 90% of renewal pricing effective in 1Q09; remaining 10% in 3Q09 Total gross margin percentage expected to decrease slightly EBITDA per adjusted prescription expected to gro
Slide 45: Long-term Growth Observations
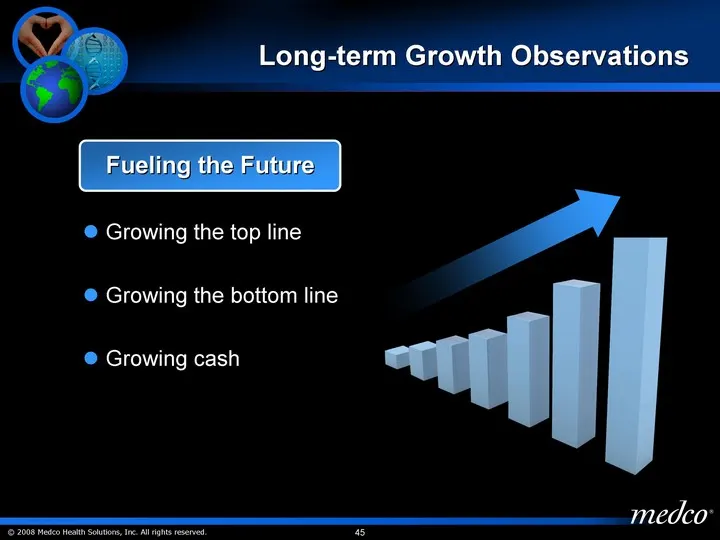
Long-term Growth Observations Growing the top line Growing the bottom line Growing cash Fueling the Future
Slide 46: The Medco Advantage
The Medco Advantage Brian T. Griffin Group President Health Plans
Slide 47: 2008 and 2009 Selling Seasons
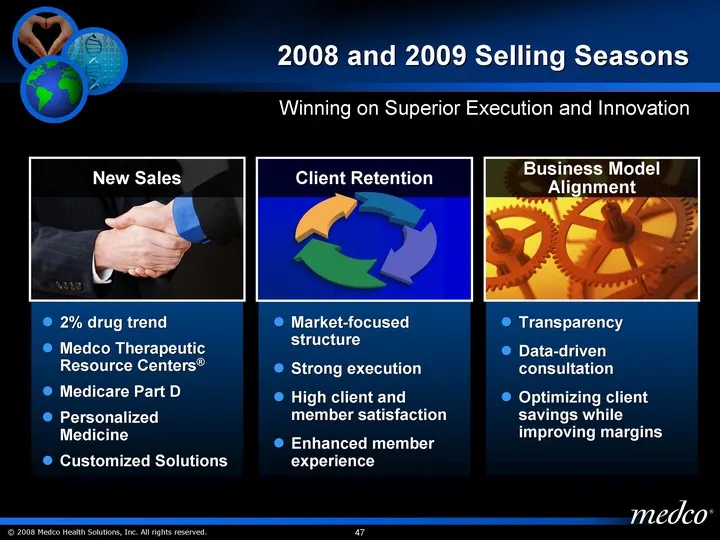
2008 and 2009 Selling Seasons 2% drug trend Medco Therapeutic Resource Centers(r) Medicare Part D Personalized Medicine Customized Solutions New Sales Market-focused structure Strong execution High client and member satisfaction Enhanced member experience Client Retention Transparency Data-driven co
Slide 48: Medco's Competitive Advantage
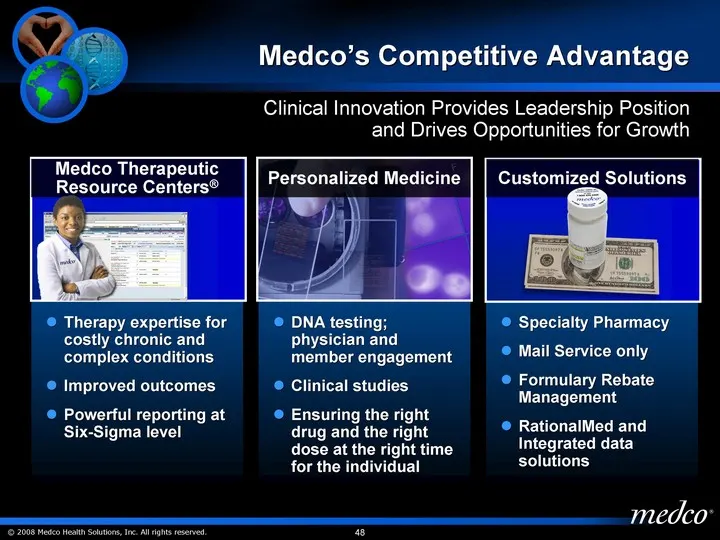
Medco's Competitive Advantage Clinical Innovation Provides Leadership Position and Drives Opportunities for Growth DNA testing; physician and member engagement Clinical studies Ensuring the right drug and the right dose at the right time for the individual Personalized Medicine Therapy expertise for
Slide 49: Most Admired in Health Care: Pharmacy and Other Services
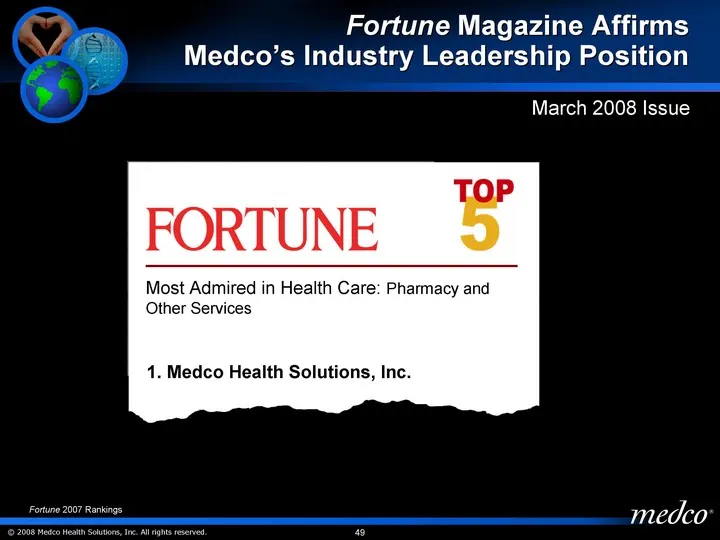
Most Admired in Health Care: Pharmacy and Other Services 1. Medco Health Solutions, Inc. Fortune Magazine Affirms Medco's Industry Leadership Position March 2008 Issue Fortune 2007 Rankings
Slide 50: Fortune Leadership Across All Industries
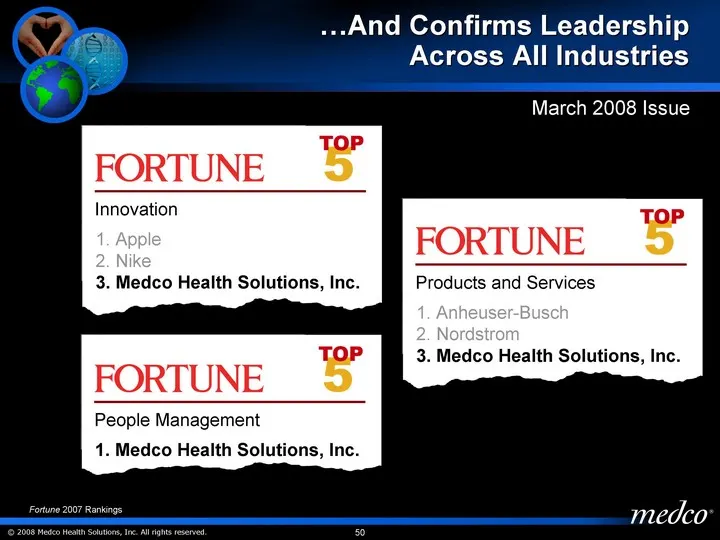
People Management 1. Medco Health Solutions, Inc. ....And Confirms Leadership Across All Industries Innovation 1. Apple 2. Nike 3. Medco Health Solutions, Inc. March 2008 Issue Products and Services 1. Anheuser-Busch 2. Nordstrom 3. Medco Health Solutions, Inc. Fortune 2007 Rankings
Slide 51: Medco's 2008 New Business Wins
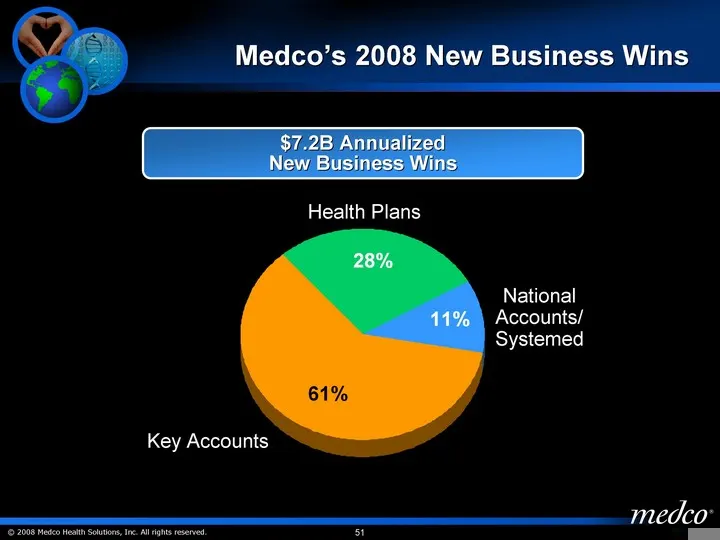
Medco's 2008 New Business Wins $7.2B Annualized New Business Wins National Accounts 0.11 Key Accounts 0.61 Health Plans 0.28 National Accounts/ Systemed Key Accounts Health Plans
Slide 52: Medco's 2009 New Business Wins
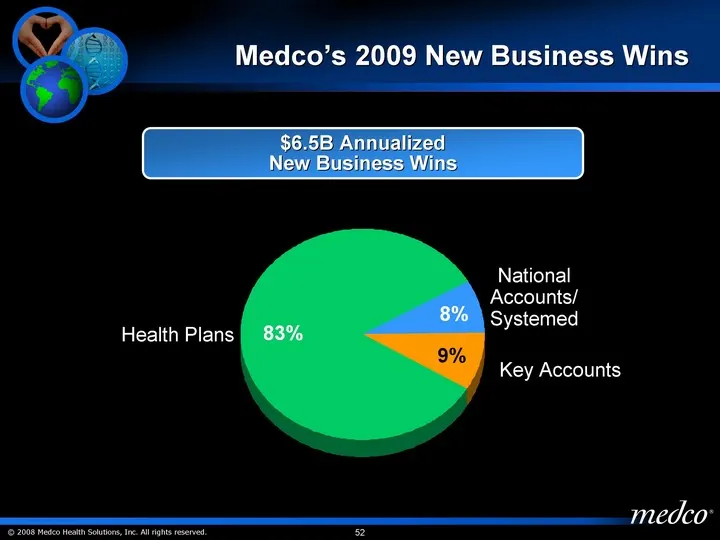
Medco's 2009 New Business Wins $6.5B Annualized New Business Wins National Accounts 0.08 Key Accounts 0.09 Health Plans 0.83 National Accounts/ Systemed Key Accounts Health Plans
Slide 53: Medicare Advantage Prescription Drug Plan Addressable Market
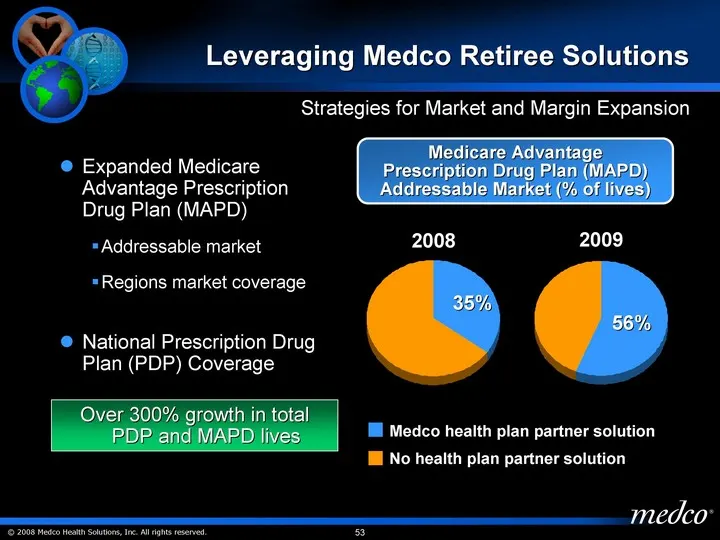
Medicare Advantage Prescription Drug Plan (MAPD) Addressable Market (% of lives) Leveraging Medco Retiree Solutions Expanded Medicare Advantage Prescription Drug Plan (MAPD) Addressable market Regions market coverage Strategies for Market and Margin Expansion Coverage 2nd Qtr East 0.35 0.65 2008 200
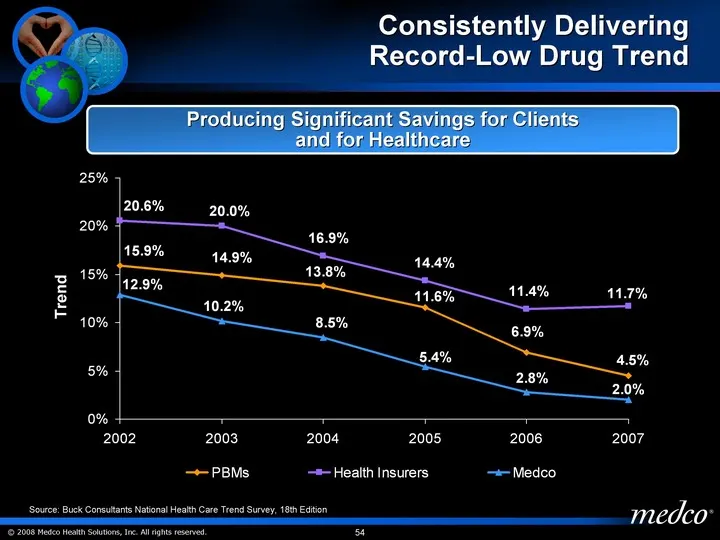
Slide 54: Consistently Delivering Record-Low Drug Trend
Consistently Delivering Record-Low Drug Trend 2002 2003 2004 2005 2006 2007 PBMs 0.159 0.149 0.138 0.116 0.069 0.045 Health Insurers 0.206 0.2 0.169 0.144 0.114 0.117 Medco 0.129 0.102 0.085 0.054 0.028 0.02 Source: Buck Consultants National Health Care Trend Survey, 18th Edition Trend Producing Sig
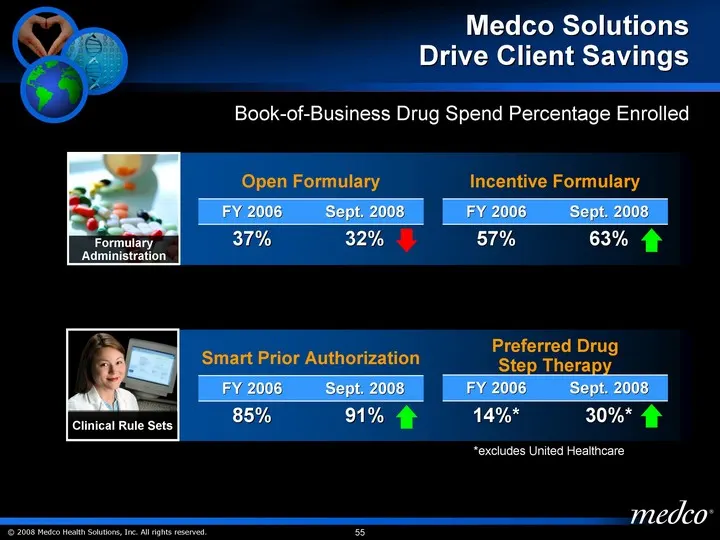
Slide 55: Medco Solutions Drive Client Savings
Medco Solutions Drive Client Savings Formulary Administration Clinical Rule Sets Preferred Drug Step Therapy Preferred Drug Step Therapy FY 2006 Sept. 2008 14%* 30%* Smart Prior Authorization Smart Prior Authorization FY 2006 Sept. 2008 85% 91% Incentive Formulary Incentive Formulary FY 2006 Sept. 2
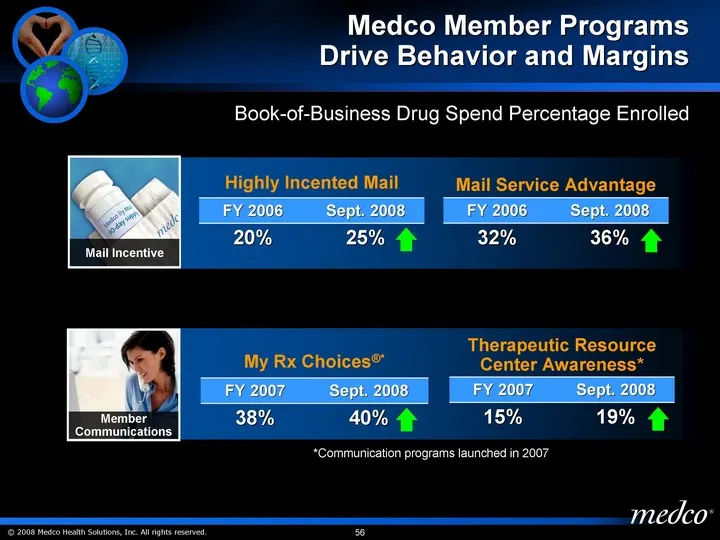
Slide 56: Medco Member Programs Drive Behavior and Margins
Medco Member Programs Drive Behavior and Margins Therapeutic Resource Center Awareness* Therapeutic Resource Center Awareness* FY 2007 Sept. 2008 15% 19% My Rx Choices(r)* My Rx Choices(r)* FY 2007 Sept. 2008 38% 40% Book-of-Business Drug Spend Percentage Enrolled Mail Service Advantage Mail Service
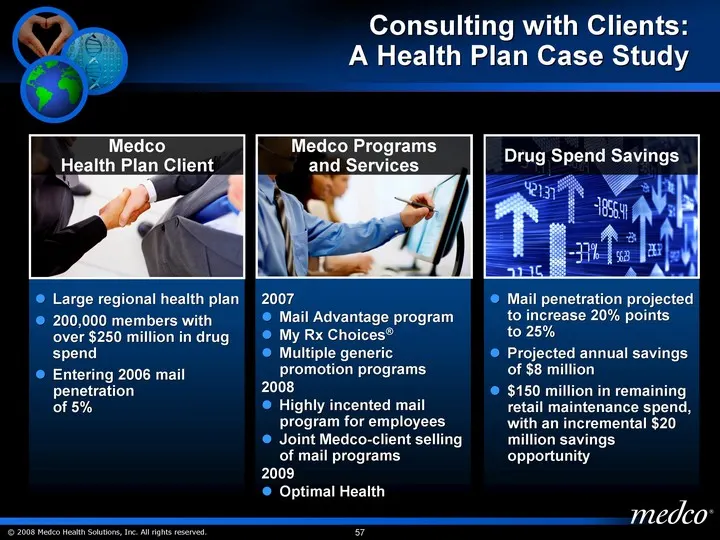
Slide 57: Consulting with Clients: A Health Plan Case Study
Large regional health plan 200,000 members with over $250 million in drug spend Entering 2006 mail penetration of 5% Medco Health Plan Client 2007 Mail Advantage program My Rx Choices(r) Multiple generic promotion programs 2008 Highly incented mail program for employees Joint Medco-client selling of
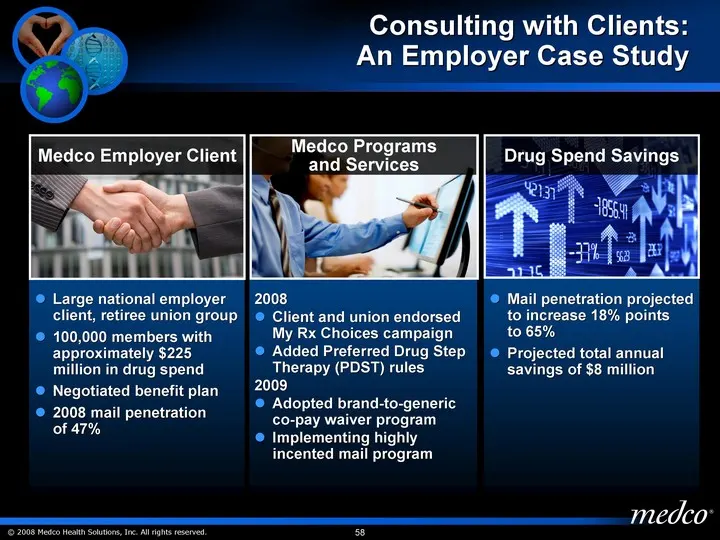
Slide 58: Consulting with Clients: An Employer Case Study
2008 Client and union endorsed My Rx Choices campaign Added Preferred Drug Step Therapy (PDST) rules 2009 Adopted brand-to-generic co-pay waiver program Implementing highly incented mail program Medco Programs and Services Mail penetration projected to increase 18% points to 65% Projected total annu
Slide 59: Medco's Brandable Difference
Medco's Brandable Difference Client-centric consultative solutions Medco Therapeutic Resource Centers(r) Operational excellence and reliability Industry-leading trend management Medicare expertise Delivering Superior Clinical and Financial Outcomes
Slide 60: Expanding Our Products and Markets
Expanding Our Products and Markets John Driscoll President, New Markets
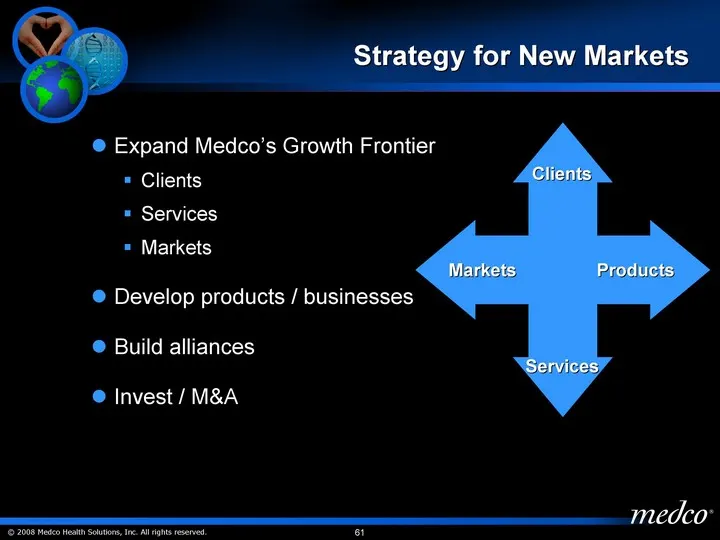
Slide 61: Strategy for New Markets
Strategy for New Markets Expand Medco's Growth Frontier Clients Services Markets Develop products / businesses Build alliances Invest / M&A Clients Markets Products Services
Slide 62: Approach / Initiatives
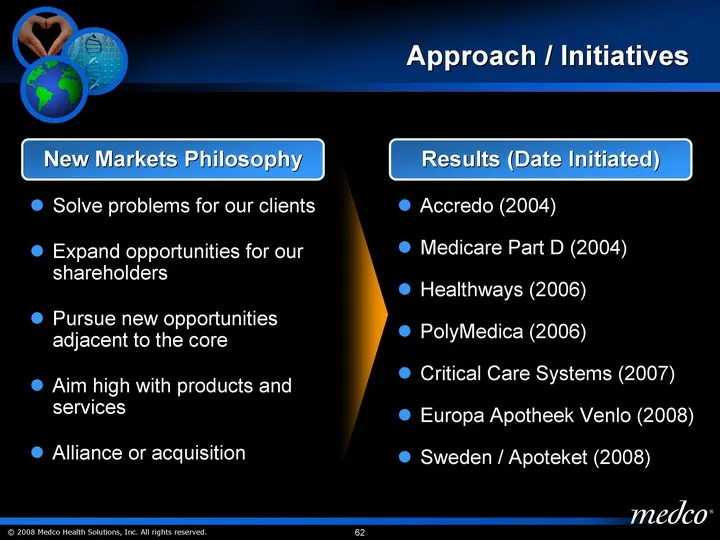
Approach / Initiatives Solve problems for our clients Expand opportunities for our shareholders Pursue new opportunities adjacent to the core Aim high with products and services Alliance or acquisition New Markets Philosophy Accredo (2004) Medicare Part D (2004) Healthways (2006) PolyMedica (2006) C
Slide 63: The "Buy" Strategy - Accredo
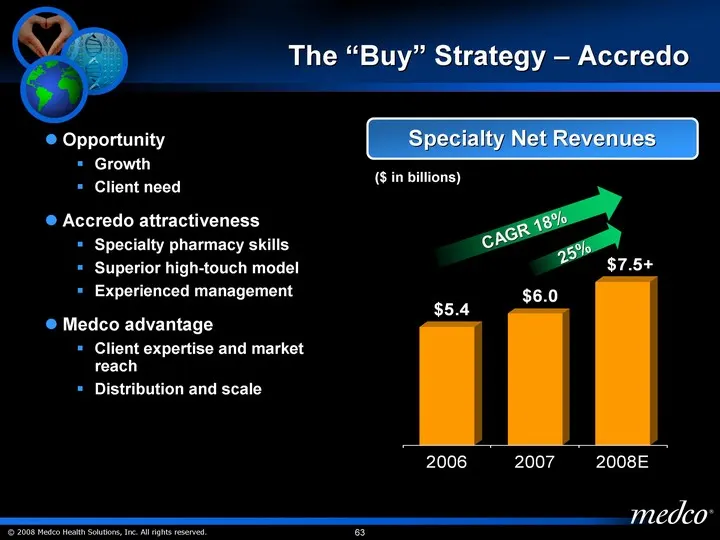
The "Buy" Strategy - Accredo 2006 2007 2008E Drug Spend 5436.5 6042.7 7500 West North CAGR 18% Specialty Net Revenues 25% ($ in billions) Opportunity Growth Client need Accredo attractiveness Specialty pharmacy skills Superior high-touch model Experienced management Medco advantage Client expertise
Slide 64: The "Build" Strategy - Medicare Opportunity
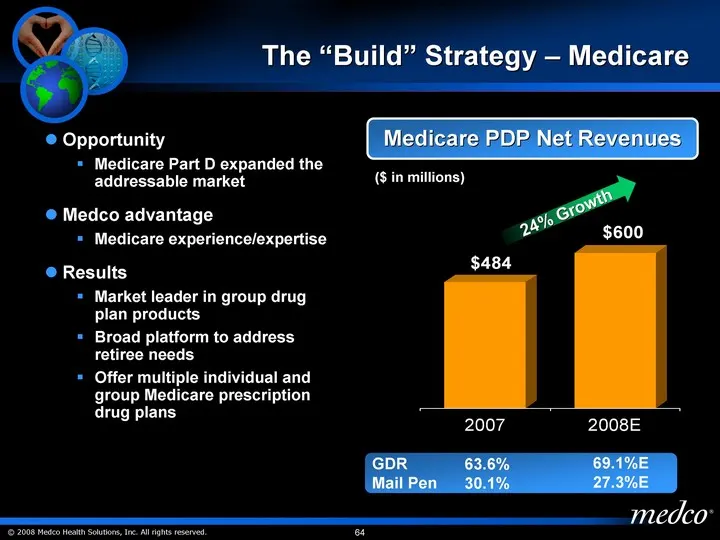
The "Build" Strategy - Medicare Opportunity Medicare Part D expanded the addressable market Medco advantage Medicare experience/expertise Results Market leader in group drug plan products Broad platform to address retiree needs Offer multiple individual and group Medicare prescription drug plans 200
Slide 65: Opportunity Frontier
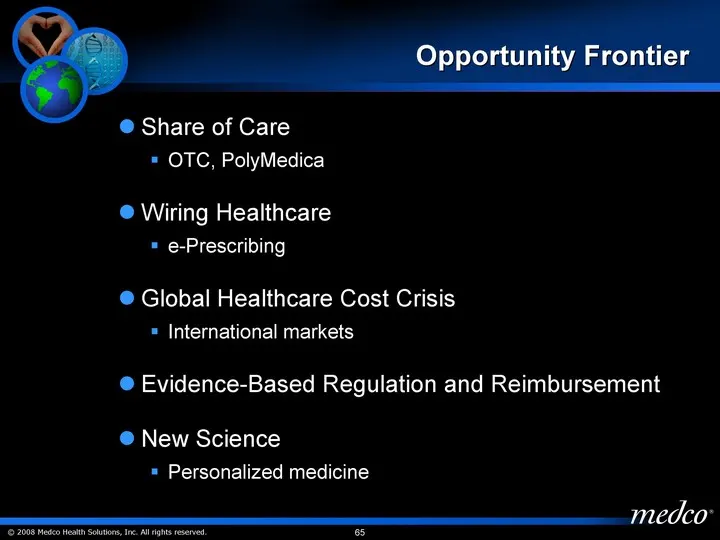
Opportunity Frontier Share of Care OTC, PolyMedica Wiring Healthcare e-Prescribing Global Healthcare Cost Crisis International markets Evidence-Based Regulation and Reimbursement New Science Personalized medicine
Slide 66: Share of Care OTCs: A New Frontier
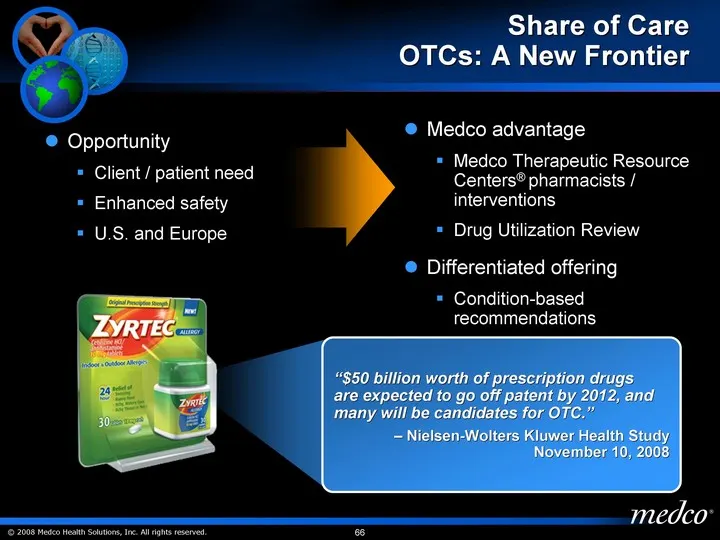
Share of Care OTCs: A New Frontier Opportunity Client / patient need Enhanced safety U.S. and Europe Medco advantage Medco Therapeutic Resource Centers(r) pharmacists / interventions Drug Utilization Review Differentiated offering Condition-based recommendations "$50 billion worth of prescription dr
Slide 67: e-Prescribing
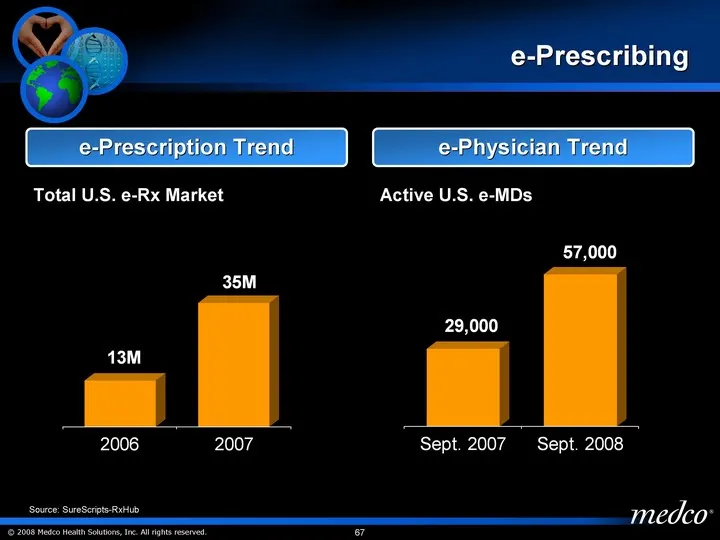
e-Prescribing e-Prescription Trend Total U.S. e-Rx Market e-Physician Trend Active U.S. e-MDs 12/31/2006 12/31/2007 Drug Spend 13 35 West North Source: SureScripts-RxHub Sept. 2007 Sept. 2008 Drug Spend 29000 57000 West North
Slide 68: e-Prescribing: Sources of Value to Medco
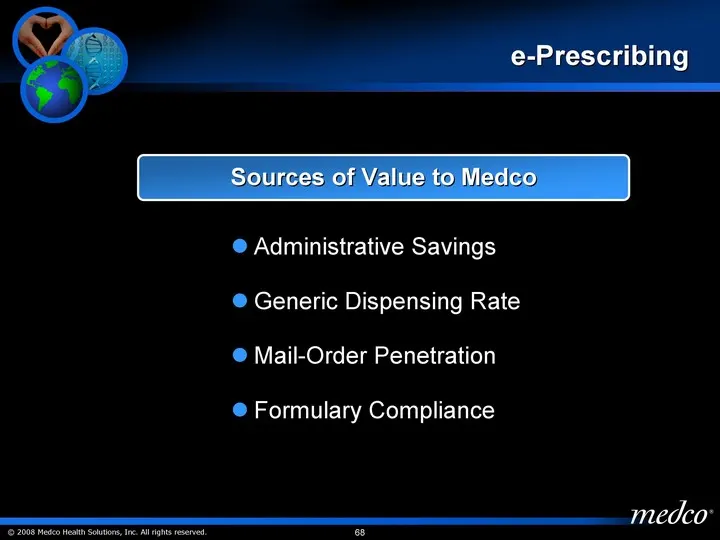
e-Prescribing Administrative Savings Generic Dispensing Rate Mail-Order Penetration Formulary Compliance Sources of Value to Medco
Slide 69: Medicare e-Prescribing Provision
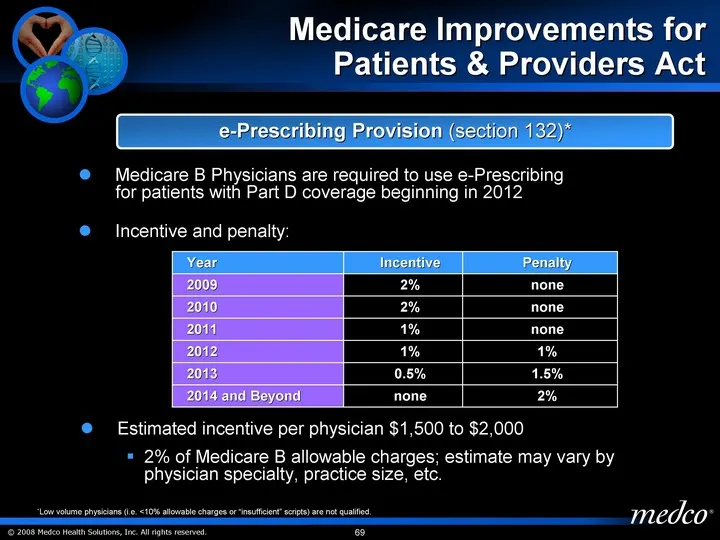
Medicare B Physicians are required to use e-Prescribing for patients with Part D coverage beginning in 2012 Incentive and penalty: Medicare Improvements for Patients & Providers Act *Low volume physicians (i.e. <10% allowable charges or "insufficient" scripts) are not qualified. Year Incentive Penal
Slide 70: Medco's International Strategy
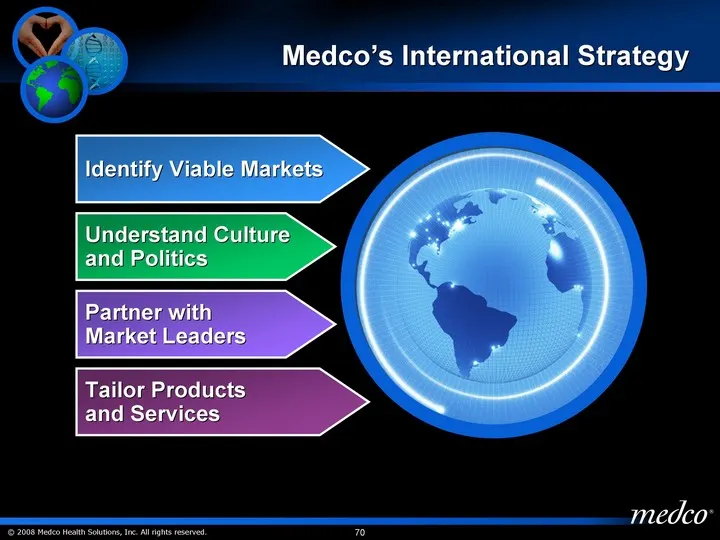
Medco's International Strategy Identify Viable Markets Tailor Products and Services Understand Culture and Politics Partner with Market Leaders
Slide 71: International Opportunity
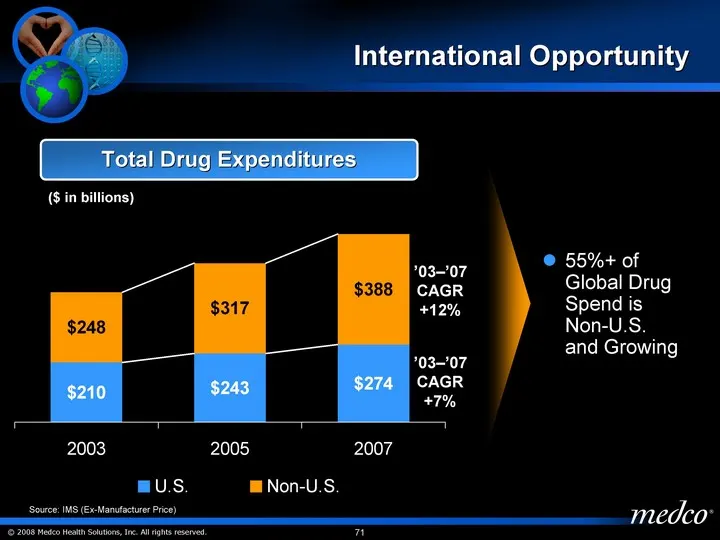
International Opportunity U.S. Non-U.S. 2003 210 248 2005 243 317 2007 274 388 Total Drug Expenditures 55%+ of Global Drug Spend is Non-U.S. and Growing '03-'07 CAGR +12% '03-'07 CAGR +7% Source: IMS (Ex-Manufacturer Price) ($ in billions)
Slide 72: International Opportunity
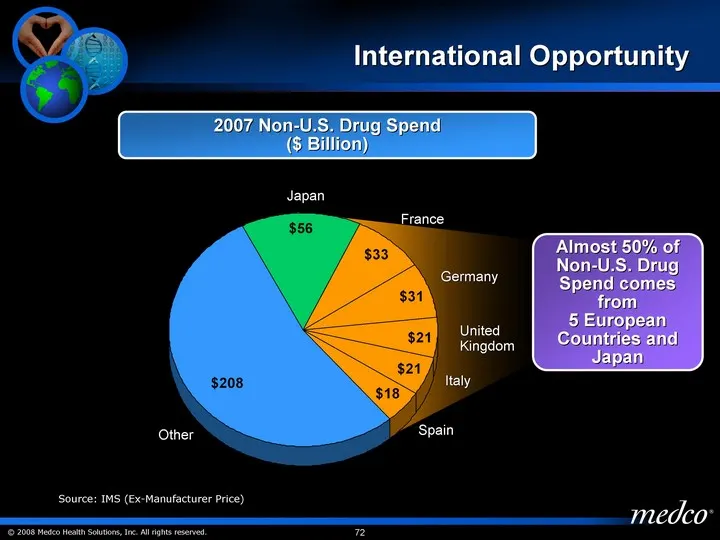
International Opportunity Other 208 Japan 56 France 33 Germany 31 Italy 21 UK 21 Spain 18 Other France Japan 2007 Non-U.S. Drug Spend ($ Billion) Germany United Kingdom Italy Spain Almost 50% of Non-U.S. Drug Spend comes from 5 European Countries and Japan Source: IMS (Ex-Manufacturer Price)
Slide 73: U.S. Healthcare Case for Change Resonates with EU Priorities
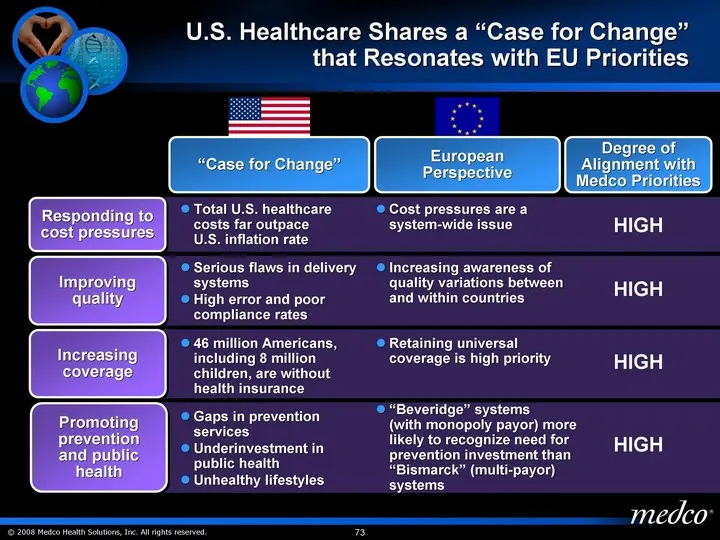
U.S. Healthcare Shares a "Case for Change" that Resonates with EU Priorities Responding to cost pressures Improving quality Increasing coverage Promoting prevention and public health Total U.S. healthcare costs far outpace U.S. inflation rate Serious flaws in delivery systems High error and poor com
Slide 74: Sweden: Apoteket Collaboration
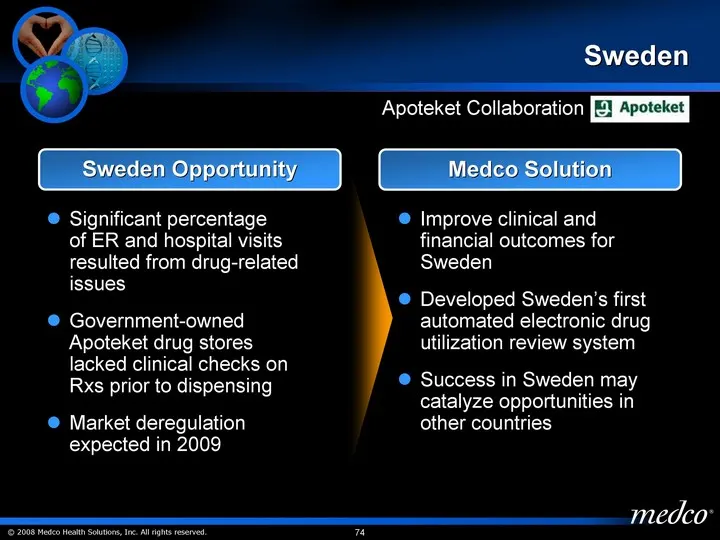
Sweden Significant percentage of ER and hospital visits resulted from drug-related issues Government-owned Apoteket drug stores lacked clinical checks on Rxs prior to dispensing Market deregulation expected in 2009 Improve clinical and financial outcomes for Sweden Developed Sweden's first automated
Slide 75: A Leader in European Mail-Order Pharmacy
A Leader in European Mail- Order Pharmacy Michael Koehler Chief Executive Officer, Europa Apotheek Venlo
Slide 76: History and Profile
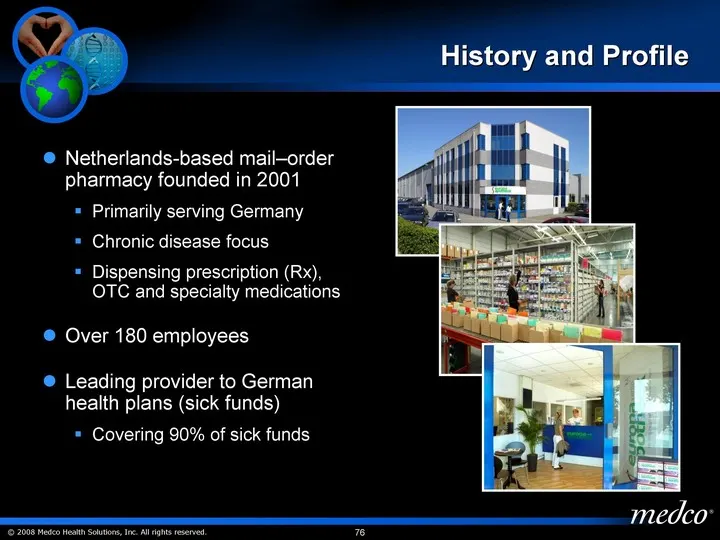
History and Profile Netherlands-based mail-order pharmacy founded in 2001 Primarily serving Germany Chronic disease focus Dispensing prescription (Rx), OTC and specialty medications Over 180 employees Leading provider to German health plans (sick funds) Covering 90% of sick funds
Slide 77: Patients Covered in Contracted German Sick Funds
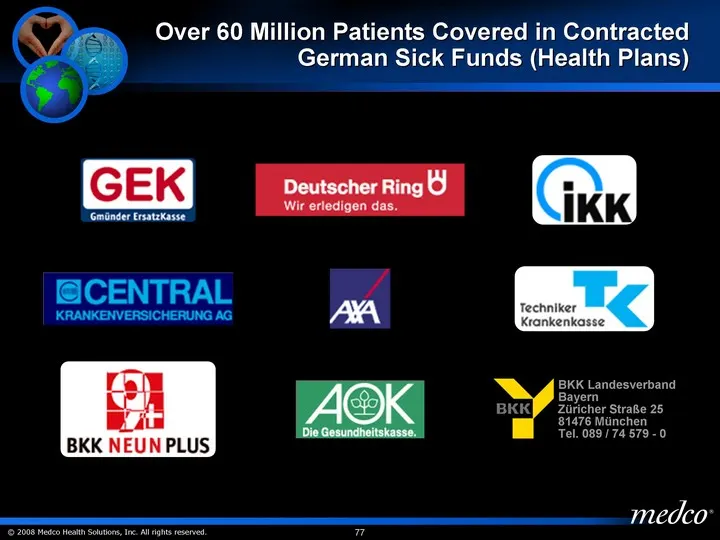
Over 60 Million Patients Covered in Contracted German Sick Funds (Health Plans) BKK Landesverband Bayern Zuricher Straße 25 81476 Munchen Tel. 089 / 74 579 - 0
Slide 78: German Market Overview
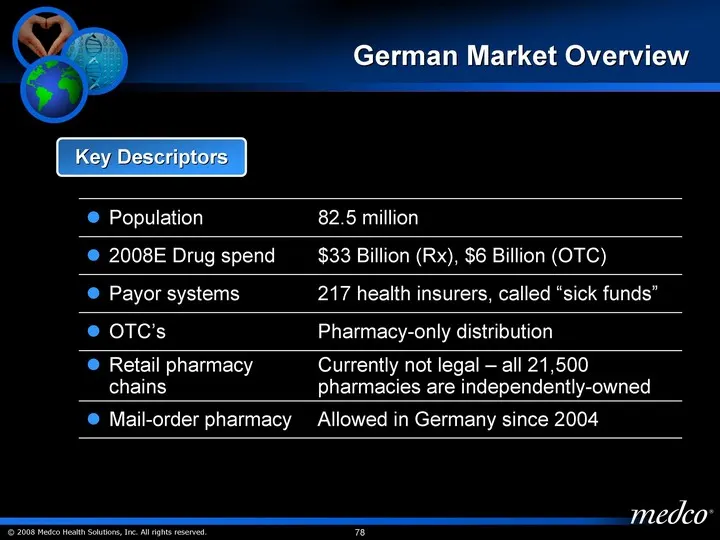
German Market Overview Key Descriptors Population 82.5 million 2008E Drug spend $33 Billion (Rx), $6 Billion (OTC) Payor systems 217 health insurers, called "sick funds" OTC's Pharmacy-only distribution Retail pharmacy chains Currently not legal - all 21,500 pharmacies are independently-owned Mail-o
Slide 79: Strong Growth Opportunity
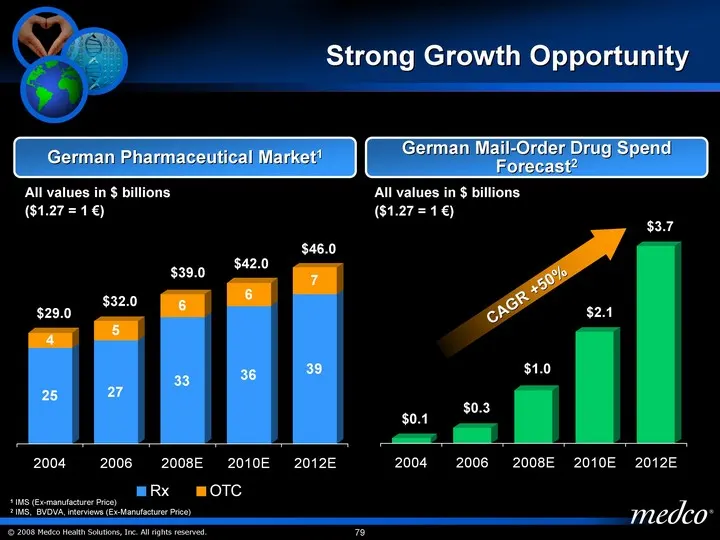
Strong Growth Opportunity 2004 2006 2008E 2010E 2012E Rx 25 27 33 36 39 OTC 4 5 6 6 7 German Pharmaceutical Market1 $29.0 $39.0 $32.0 German Mail-Order Drug Spend Forecast2 2004 2006 2008E 2010E 2012E 0.1 0.3 1 2.1 3.7 $0.1 $1.0 $2.1 $0.3 CAGR +50% $42.0 $46.0 $3.7 All values in $ billions ($1.27 =
Slide 80: Payor (Sick Fund) Developments
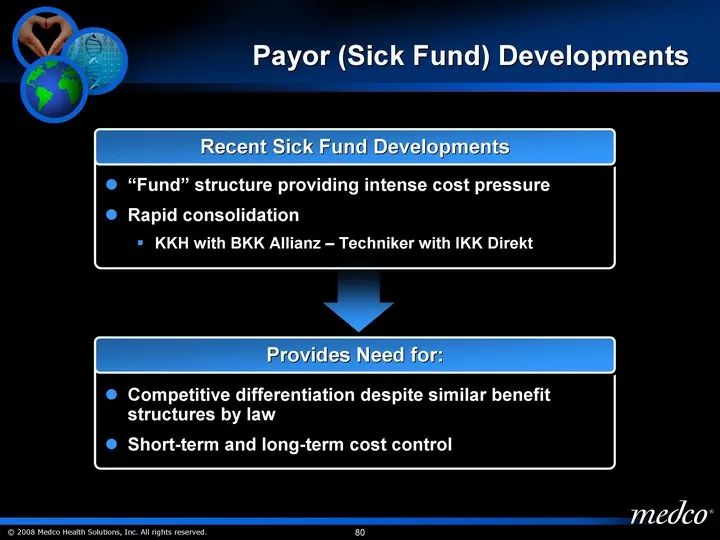
Payor (Sick Fund) Developments "Fund" structure providing intense cost pressure Rapid consolidation KKH with BKK Allianz - Techniker with IKK Direkt Recent Sick Fund Developments Competitive differentiation despite similar benefit structures by law Short-term and long-term cost control Provides Need
Slide 81: Central Fill: Pharma Punkt Mail Order
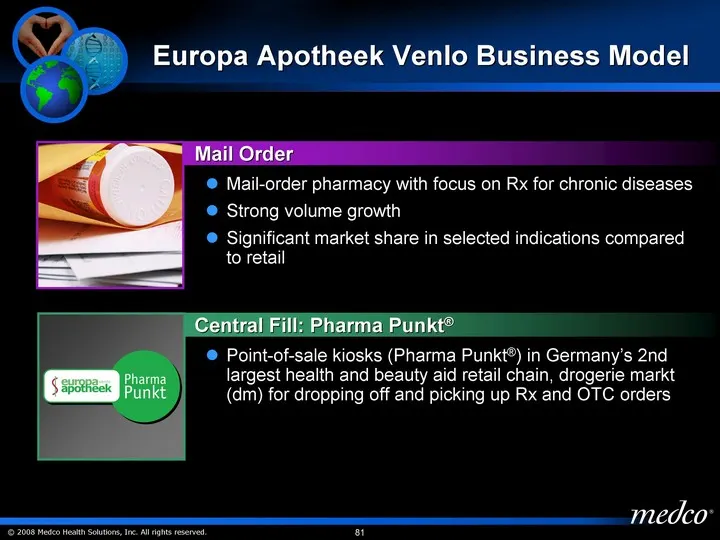
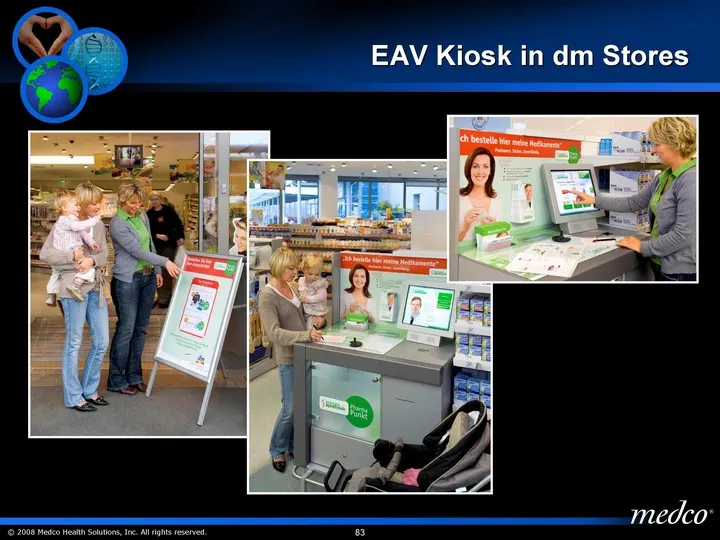
Central Fill: Pharma Punkt(r) Mail Order Europa Apotheek Venlo Business Model Mail-order pharmacy with focus on Rx for chronic diseases Strong volume growth Significant market share in selected indications compared to retail Point-of-sale kiosks (Pharma Punkt(r)) in Germany's 2nd largest health and
Slide 82: Pharma Punkt Concept at drogerie markt
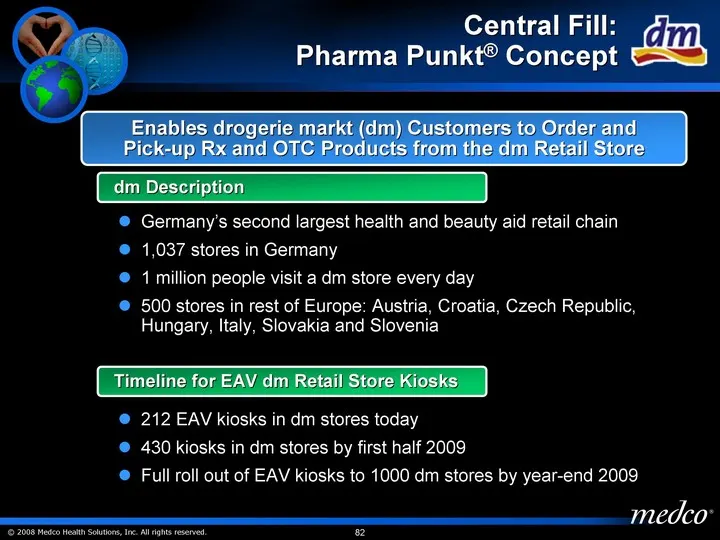
Central Fill: Pharma Punkt(r) Concept Enables drogerie markt (dm) Customers to Order and Pick-up Rx and OTC Products from the dm Retail Store dm Description Timeline for EAV dm Retail Store Kiosks Germany's second largest health and beauty aid retail chain 1,037 stores in Germany 1 million people vi
Slide 83: EAV Kiosk in dm Stores
Osi EAV Kiosk in dm Stores medco:
Slide 84: Synergies with Medco and Opportunities for Growth
Synergies with Medco and Opportunities for Growth Mail expertise Scale through automation Specialty and medication compliance services Servicing Medco's book-of-business overseas OTC distribution e-Prescribing
Slide 85: A Plus for the Healthcare System and Patients
ein Plus fur Gesundheitswesen und Patienten (A Plus for the Healthcare System and Patients)
Slide 86: Expanding Our Lead in Specialty Pharmacy
Expanding Our Lead in Specialty Pharmacy Timothy C. Wentworth Group President, Employer Accounts
Slide 87: Strong Year-To-Date Growth
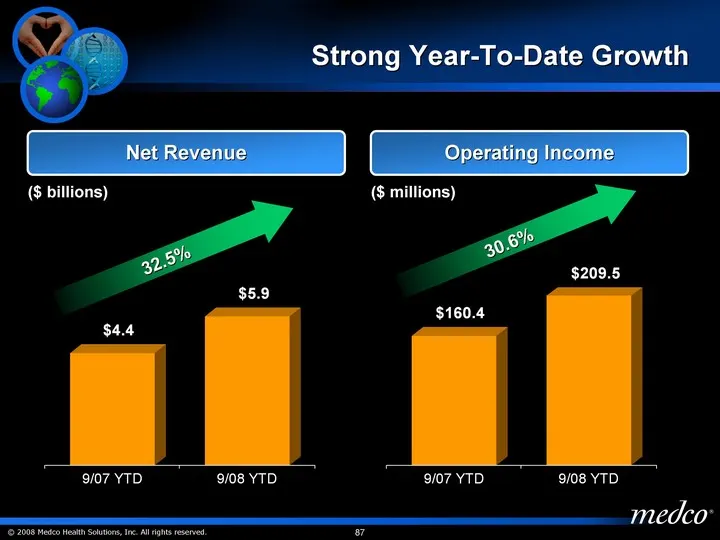
9/07 YTD 9/08 YTD Series 1 160.4 209.5 Strong Year-To-Date Growth 9/07 YTD 9/08 YTD Series 1 4.44 5.9 Net Revenue Operating Income ($ billions) ($ millions) 32.5% 30.6%
Slide 88: Strong Year-Over-Year Growth
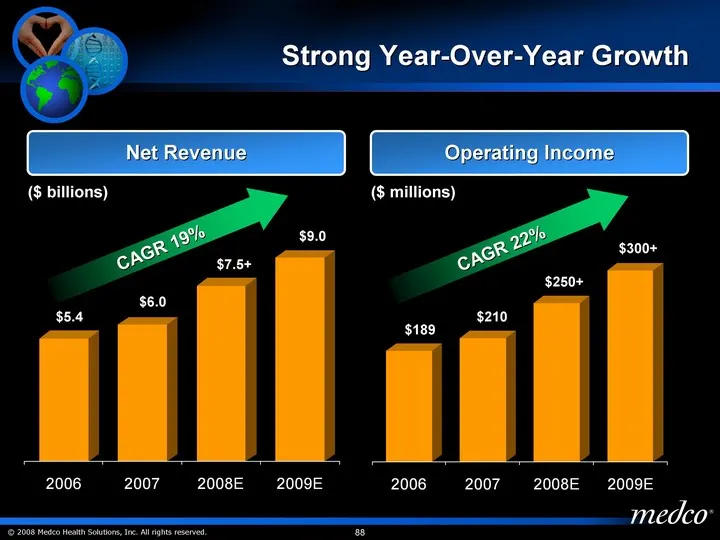
Strong Year-Over-Year Growth Net Revenue Operating Income ($ billions) ($ millions) 2006 2007 2008E 2009E Acute Chronic/Complex 5437 6043 7760 9000 $5.4 $9.0 $7.5+ $6.0 2006 2007 2008E 2009E 189 210 270 325 $189 $250+ $300+ $210 CAGR 19% CAGR 22%
Slide 89: Sources of Revenue Growth
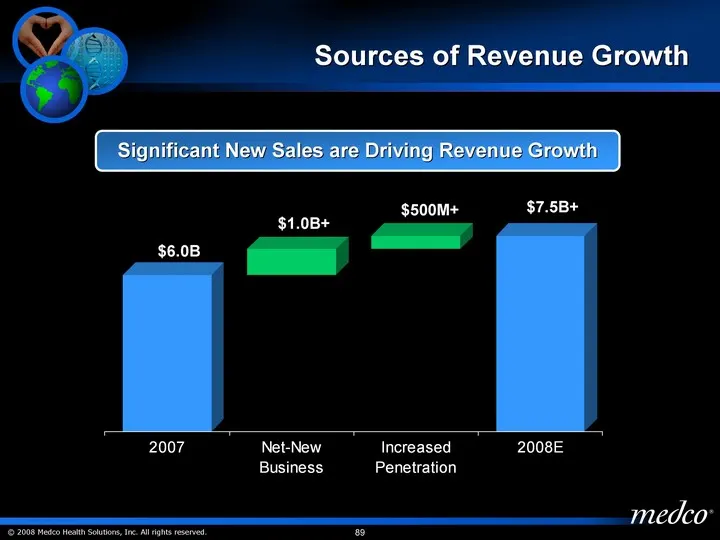
Sources of Revenue Growth 2007 Critical Care Systems Net-New Business Increased Penetration Lost Sales 2008E blank 6 6 7 7.094 base 6 7.5 up 0.301 1 0.5 down 0.089 $7.5B+ $6.0B $1.0B+ $500M+ Significant New Sales are Driving Revenue Growth
Slide 90: Specialty Market Significance
Specialty Market Significance Specialty drugs accounted for 11.4% of pharmacy plan spending for Medco clients in 2007, up from 8.5% in 2004 Specialty spending for 2007 increased 12.3% over the prior year Clients want to proactively address ahead of pipeline and biosimilars Accredo is uniquely positi
Slide 91: Driving Better Financial and Clinical Outcomes: A Case Study
Driving Better Financial and Clinical Outcomes for Clients... A Case Study National self-insured unionized employer 500,000+ lives 2,300 specialty pharmacy patients $45M annualized specialty pharmacy spend Progressively enrolled in key programs Annualized savings of $9.5 million through: Therapy man
Slide 92: The Medco Advantage
The Medco Advantage Client Member Visibility of specialty spend Value-based reporting Consistent application of therapy management protocols Therapy management, utilization management, and medical cost savings High member satisfaction Consistency of member experience Consistent application of plan d
Slide 93: Reporting to Identify and Demonstrate Value
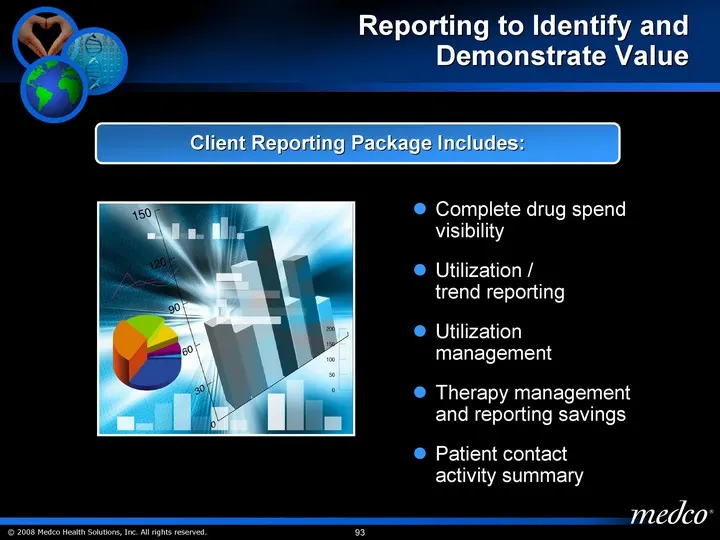
Reporting to Identify and Demonstrate Value Complete drug spend visibility Utilization / trend reporting Utilization management Therapy management and reporting savings Patient contact activity summary Client Reporting Package Includes:
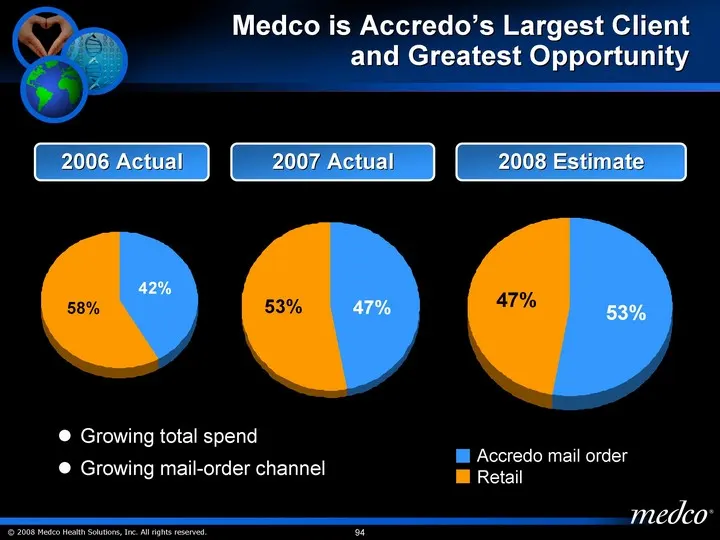
Slide 94: Medco is Accredo's Largest Client and Greatest Opportunity
Mail 1.5 Retail 2.1 Medco is Accredo's Largest Client and Greatest Opportunity Mail 2.9 Retail 2.6 2008 Estimate Mail 0.47 Retail 0.53 Accredo mail order Retail 2007 Actual 2006 Actual Growing total spend Growing mail-order channel
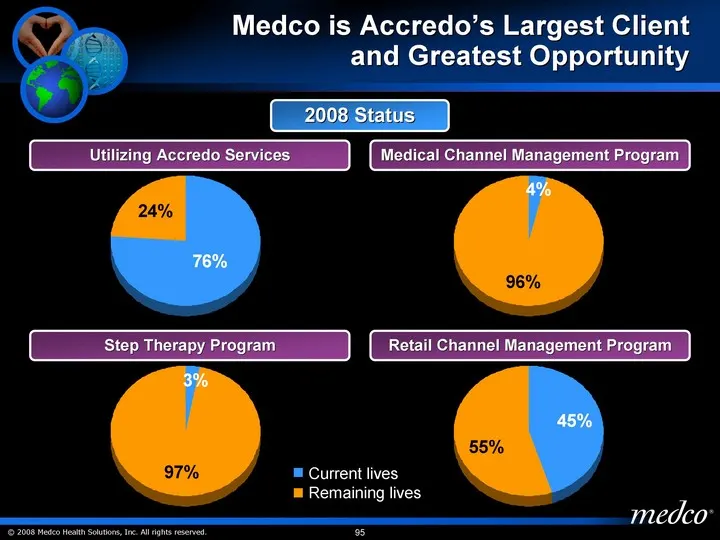
Slide 95: Medco is Accredo's Largest Client and Greatest Opportunity
Medco is Accredo's Largest Client and Greatest Opportunity Current Penetration 76 Remaining Penetration 24 2008 Status Utilizing Accredo Services Medical Channel Management Program Current Penetration 0.04 Remaining Penetration 0.96 Current Penetration 0.03 Remaining Penetration 0.97 Step Therapy Pr
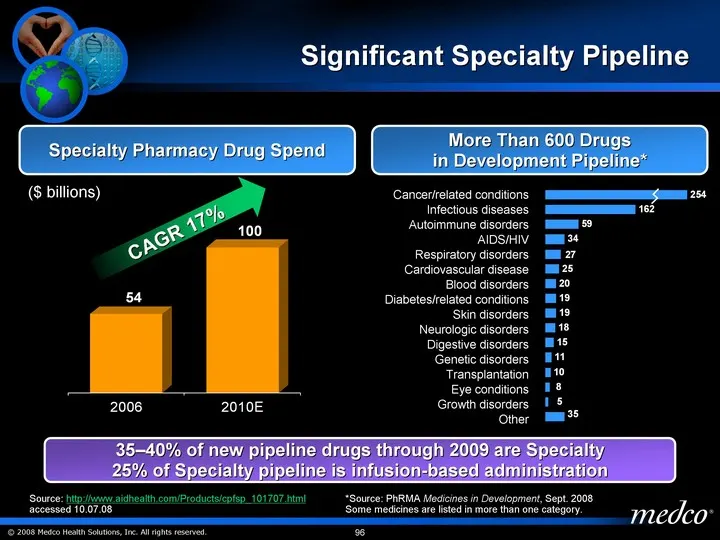
Slide 96: Significant Specialty Pipeline
Significant Specialty Pipeline Source: http://www.aidhealth.com/Products/cpfsp_101707.html accessed 10.07.08 *Source: PhRMA Medicines in Development, Sept. 2008 Some medicines are listed in more than one category. Specialty Pharmacy Drug Spend More Than 600 Drugs in Development Pipeline* 35-40% of n
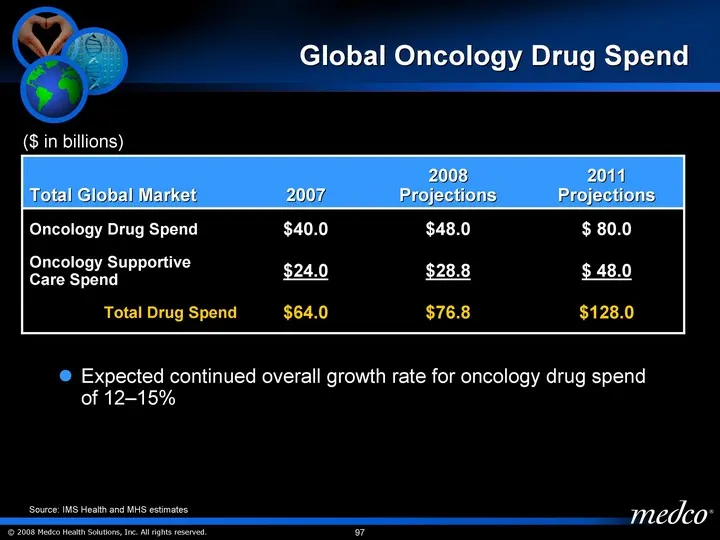
Slide 97: Global Oncology Drug Spend
Global Oncology Drug Spend Expected continued overall growth rate for oncology drug spend of 12-15% Total Global Market 2007 2008 Projections 2011 Projections Oncology Drug Spend $40.0 $48.0 $ 80.0 Oncology Supportive Care Spend $24.0 $28.8 $ 48.0 Total Drug Spend $64.0 $76.8 $128.0 Source: IMS Heal
Slide 98: Oncology Opportunity
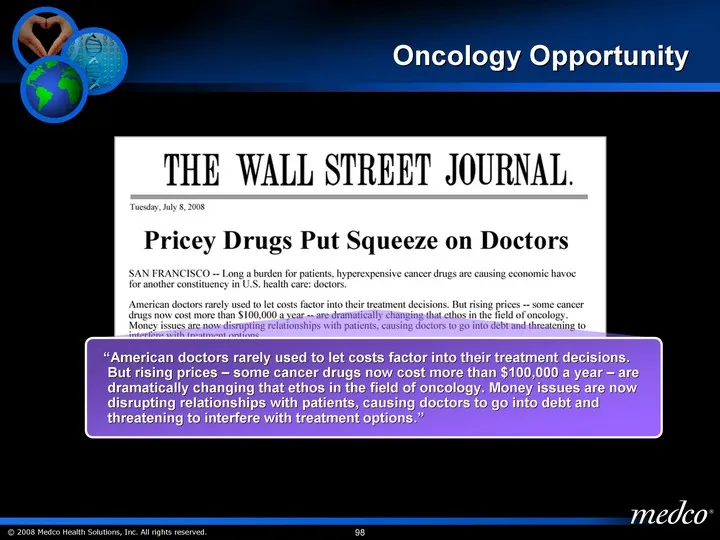
Oncology Opportunity "American doctors rarely used to let costs factor into their treatment decisions. But rising prices - some cancer drugs now cost more than $100,000 a year - are dramatically changing that ethos in the field of oncology. Money issues are now disrupting relationships with patients
Slide 99: Oncology Opportunity
Oncology Opportunity Physicians increasingly recognize that "buy and bill" is a challenge to manage - opening minds to change Opportunity to provide comprehensive solution to: Coordinate benefit coverage & approval at the patient level Integrate protocols into care plans Complement the physician car
Slide 100: Accredo Long-Term Advantages & Opportunities
Accredo Long-Term Advantages & Opportunities Strength in the most complex, hard to replicate therapeutic service model Strength in areas where clients need help Best of both worlds - one-stop shop (depth of expertise at the therapy level and breadth of product offerings) Broadest spectrum of service
Slide 101: Raising the Standard of Care Through Evidence-Based Protocols
Raising the Standard of Care Through Evidence- Based Protocols Kenneth O. Klepper President and Chief Operating Officer Peter I. Juhn, M.D., M.P.H. President, Therapeutic Resource Centers
Slide 102: Raising the Standard of Healthcare
Raising the Standard of Healthcare A new level of transparency A new standard of accountability to our patients and our customers Delivering both outcomes and value for our members, clients and shareholders
Slide 103: Milliman Independent Data Validation
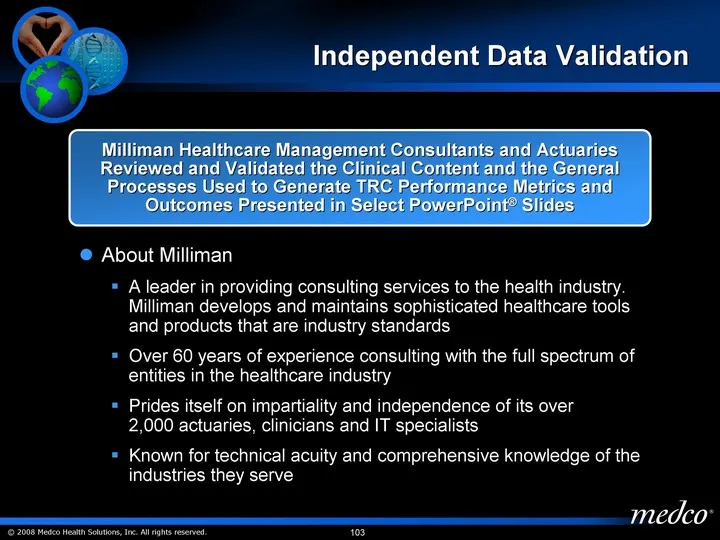
Milliman Healthcare Management Consultants and Actuaries Reviewed and Validated the Clinical Content and the General Processes Used to Generate TRC Performance Metrics and Outcomes Presented in Select PowerPoint(r) Slides Independent Data Validation About Milliman A leader in providing consulting se
Slide 104: A Teachable Moment When Our Members Call
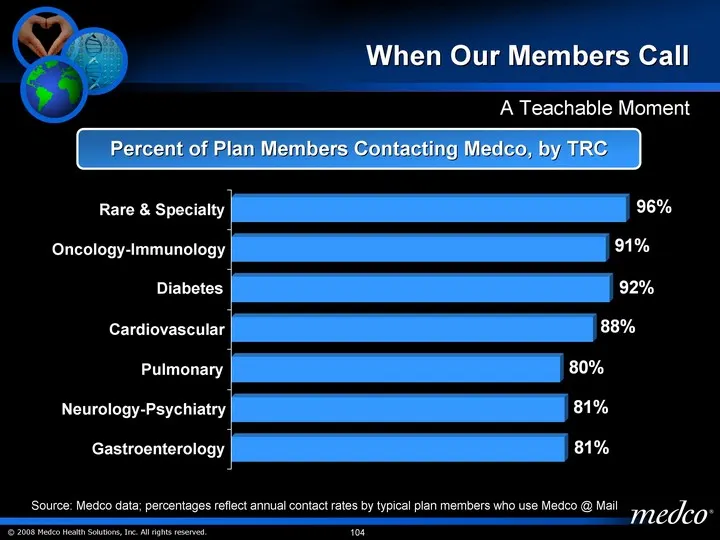
Source: Medco data; percentages reflect annual contact rates by typical plan members who use Medco @ Mail Rare & Specialty Oncology-Immunology Diabetes Cardiovascular Pulmonary Neurology-Psychiatry Gastroenterology Gastroenterology Neurology-Psychiatry Pulmonary Cardiovascular Diabetes Oncology-Immu
Slide 105: Key Diabetes Metrics: Medco Book-of-Business vs Retail Chains
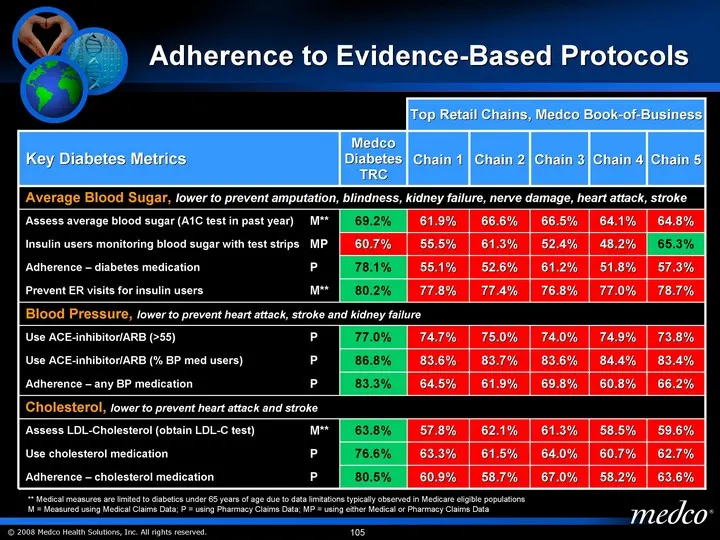
Top Retail Chains, Medco Book-of-Business Top Retail Chains, Medco Book-of-Business Top Retail Chains, Medco Book-of-Business Top Retail Chains, Medco Book-of-Business Top Retail Chains, Medco Book-of-Business Key Diabetes Metrics Key Diabetes Metrics Key Diabetes Metrics Medco Diabetes TRC Chain 1
Slide 106: Key Diabetes Metrics
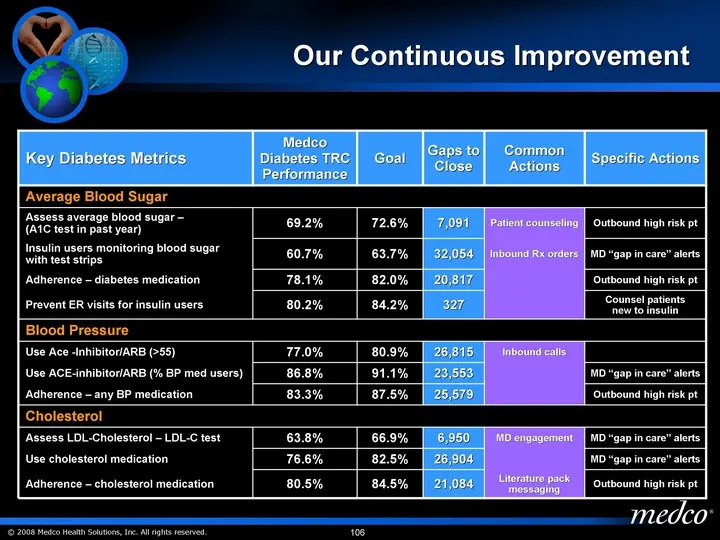
Key Diabetes Metrics Medco Diabetes TRC Performance Goal Gaps to Close Common Actions Specific Actions Average Blood Sugar Average Blood Sugar Average Blood Sugar Average Blood Sugar Average Blood Sugar Average Blood Sugar Assess average blood sugar - (A1C test in past year) 69.2% 72.6% 7,091 Patien
Slide 107: Our Market Opportunity
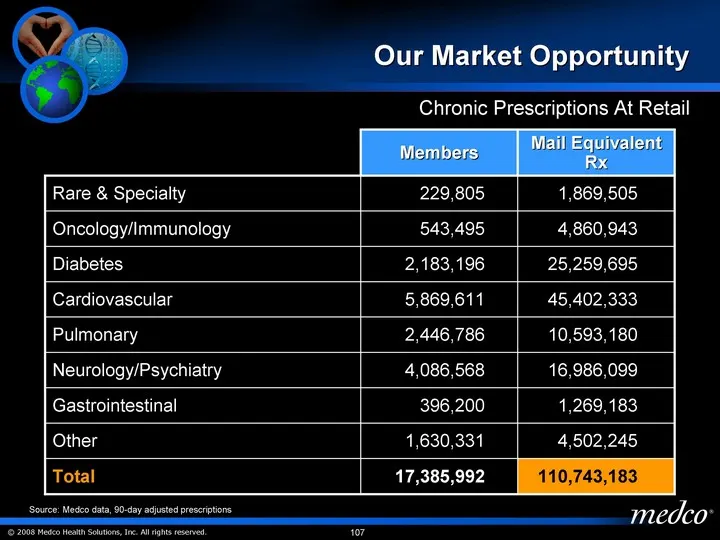
Our Market Opportunity Members Mail Equivalent Rx Rare & Specialty 229,805 1,869,505 Oncology/Immunology 543,495 4,860,943 Diabetes 2,183,196 25,259,695 Cardiovascular 5,869,611 45,402,333 Pulmonary 2,446,786 10,593,180 Neurology/Psychiatry 4,086,568 16,986,099 Gastrointestinal 396,200 1,269,183 Oth
Slide 108: Medco Therapeutic Resource Centers
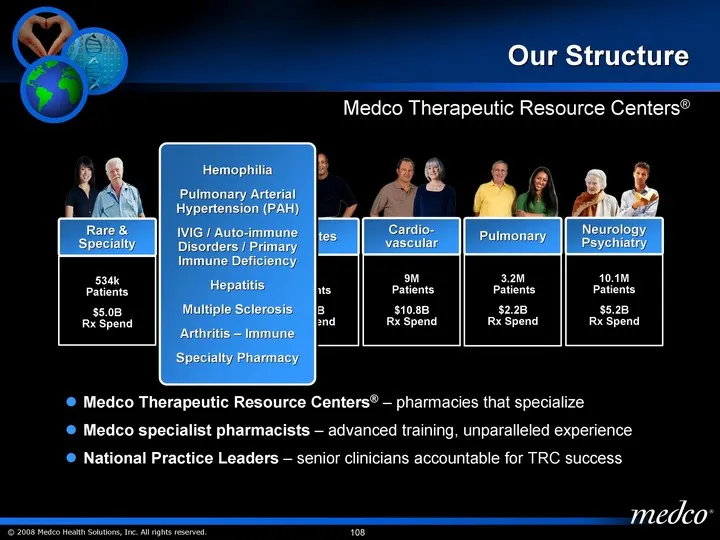
Medco Therapeutic Resource Centers(r) - pharmacies that specialize Medco specialist pharmacists - advanced training, unparalleled experience National Practice Leaders - senior clinicians accountable for TRC success Rare & Specialty 534k Patients $5.0B Rx Spend Oncology Immunology 717k Patients $2.5B
Slide 109: Our Formula for Success
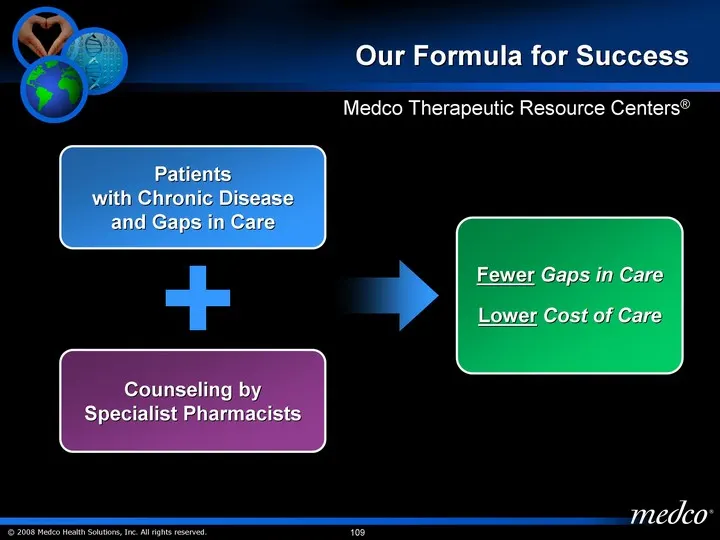
Patients with Chronic Disease and Gaps in Care Counseling by Specialist Pharmacists Fewer Gaps in Care Lower Cost of Care + Medco Therapeutic Resource Centers(r) Our Formula for Success
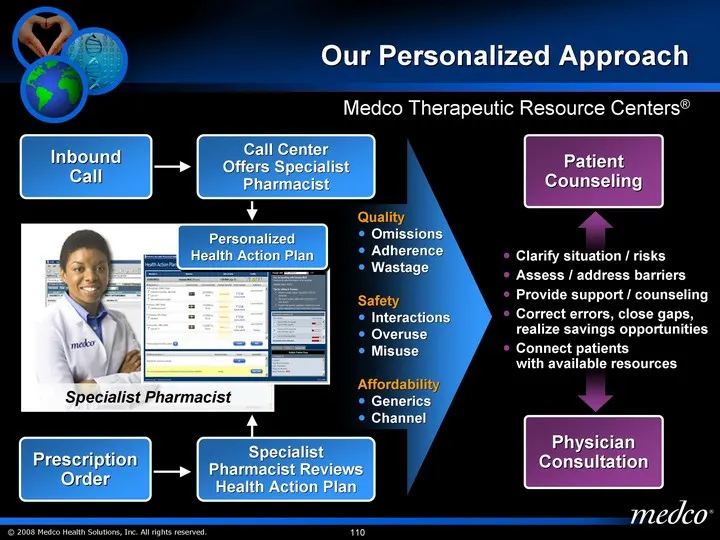
Slide 110: Our Personalized Approach
Quality Omissions Adherence Wastage Safety Interactions Overuse Misuse Affordability Generics Channel Specialist Pharmacist Inbound Call Personalized Health Action Plan Prescription Order Specialist Pharmacist Reviews Health Action Plan Call Center Offers Specialist Pharmacist Patient Counseling Phy
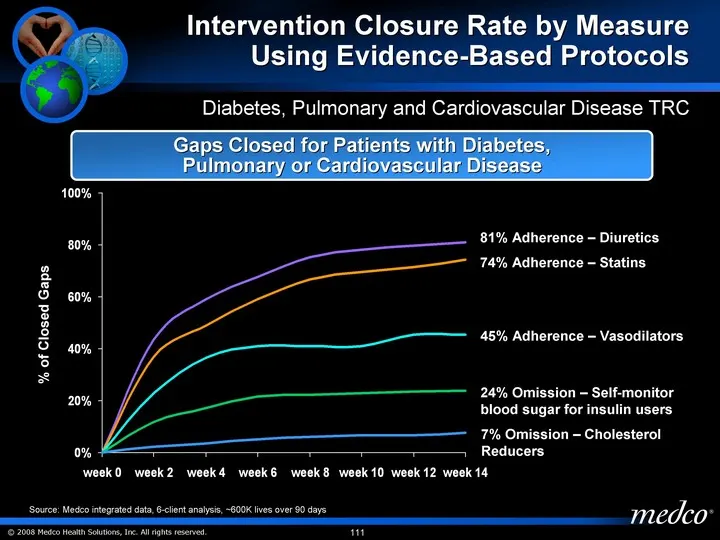
Slide 111: Gaps Closed for Patients with Chronic Disease
week 0 week 2 week 4 week 6 week 8 week 10 week 12 week 14 Diuretics 0 0.43454039 0.58913649 0.675487465 0.752089136 0.781337047 0.798050139 0.810584958 Statins 0 0.369266055 0.489296636 0.590978593 0.665902141 0.694189602 0.71559633 0.743119266 Hypotensive Vasodilators 0 0.227272727 0.363636364 0.4
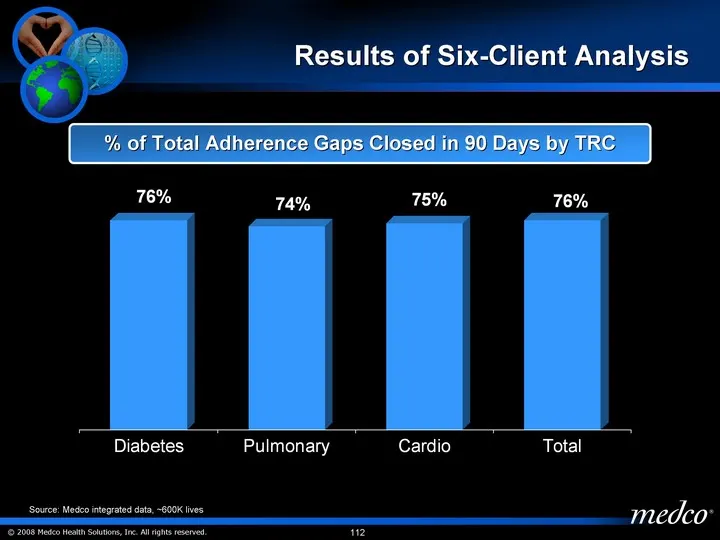
Slide 112: Adherence Gaps Closed in 90 Days by TRC
% of Total Adherence Gaps Closed in 90 Days by TRC Results of Six-Client Analysis Diabetes Pulmonary Cardio Total % Closed Adherence Gaps 0.76 0.74 0.75 0.76 Source: Medco integrated data, ~600K lives
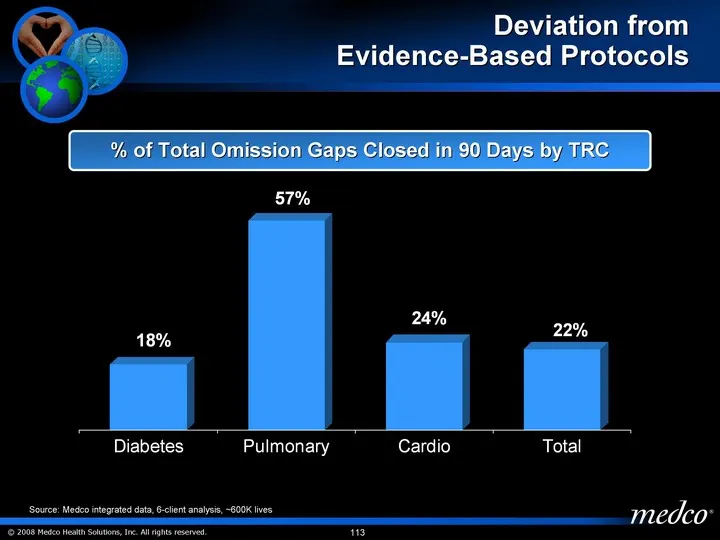
Slide 113: Omission Gaps Closed in 90 Days by TRC
Diabetes Pulmonary Cardio Total % Closed Adherence Gaps 0.18 0.57 0.24 0.22 Deviation from Evidence-Based Protocols % of Total Omission Gaps Closed in 90 Days by TRC Source: Medco integrated data, 6-client analysis, ~600K lives
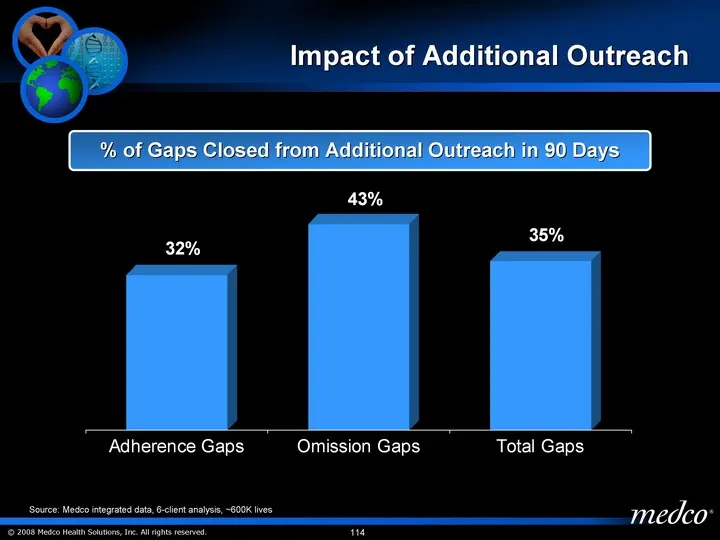
Slide 114: Impact of Additional Outreach
Adherence Gaps Omission Gaps Total Gaps % Closed Adherence Gaps 0.321 0.426 0.349 Impact of Additional Outreach % of Gaps Closed from Additional Outreach in 90 Days Source: Medco integrated data, 6-client analysis, ~600K lives
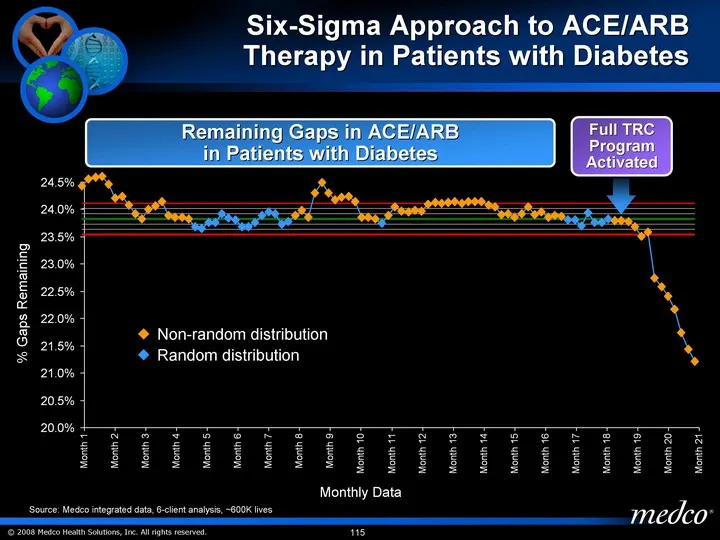
Slide 115: Six-Sigma Approach to ACE/ARB Therapy in Diabetes
Month 1 Month 2 Month 3 Month 4 Month 5 Month 6 Month 7 Month 8 Month 9 Month 10 Month 11 Month 12 Month 13 Month 14 Month 15 Month 16 Month 17 Month 18 Month 19 Month 20 Month 21 Medical Cost Drug Cost Six-Sigma Approach to ACE/ARB Therapy in Patients with Diabetes % Gaps Remaining Full TRC Program
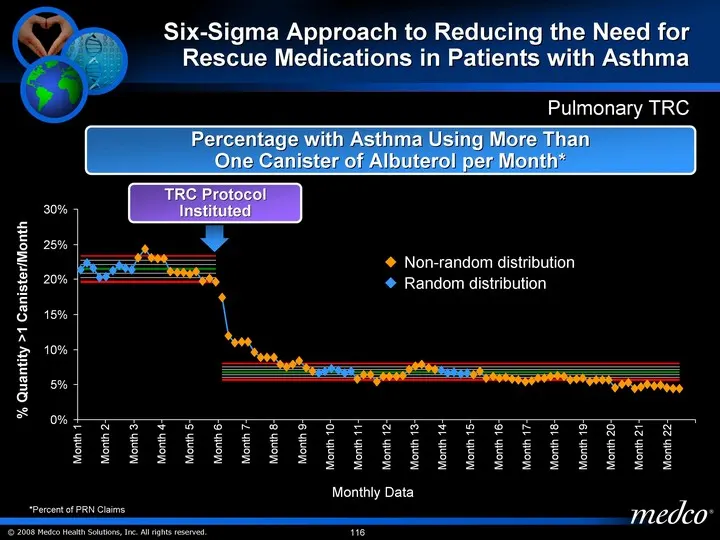
Slide 116: Six-Sigma Approach to Reducing Rescue Medications in Asthma
Month 1 Month 2 Month 3 Month 4 Month 5 Month 6 Month 7 Month 8 Month 9 Month 10 Month 11 Month 12 Month 13 Month 14 Month 15 Month 16 Month 17 Month 18 Month 19 Month 20 Month 21 Month 22 Medical Cost 11.2 Drug Cost % Quantity >1 Canister/Month Percentage with Asthma Using More Than One Canister of
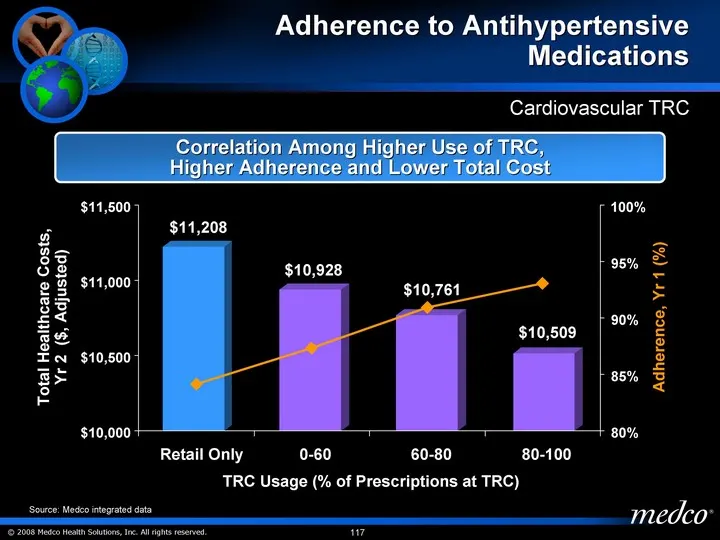
Slide 117: Higher TRC Use, Higher Adherence and Lower Total Cost
Retail Only 0-60 60-80 80-100 Series 1 11208 10928 10761 10509 0.83 0.83 0.83 0.83 Correlation Among Higher Use of TRC, Higher Adherence and Lower Total Cost TRC Usage (% of Prescriptions at TRC) Cardiovascular TRC Adherence to Antihypertensive Medications $11,208 $10,928 $10,761 $10,509 Total Healt
Slide 118: Value to Clients
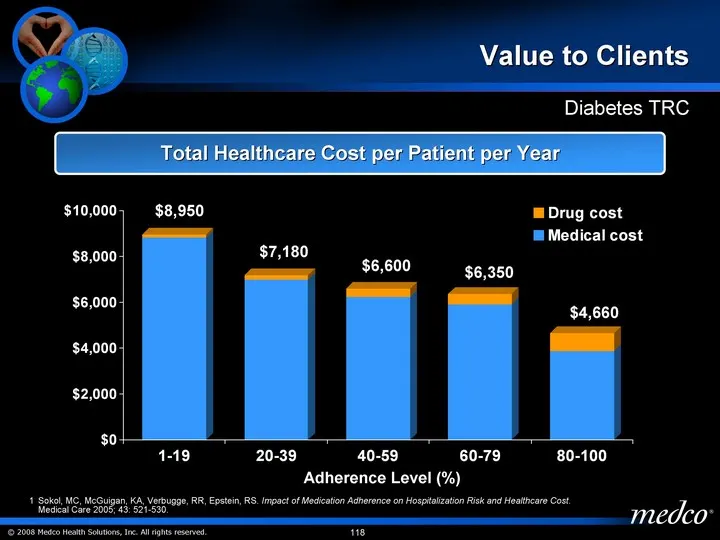
Value to Clients 1 Sokol, MC, McGuigan, KA, Verbugge, RR, Epstein, RS. Impact of Medication Adherence on Hospitalization Risk and Healthcare Cost. Medical Care 2005; 43: 521-530. 1-19 20-39 40-59 60-79 80-100 Category F Medical cost 8820 6980 6250 5920 3870 11.2 Drug cost 130 200 350 430 790 Adheren
Slide 119: Medco Therapeutic Resource Centers
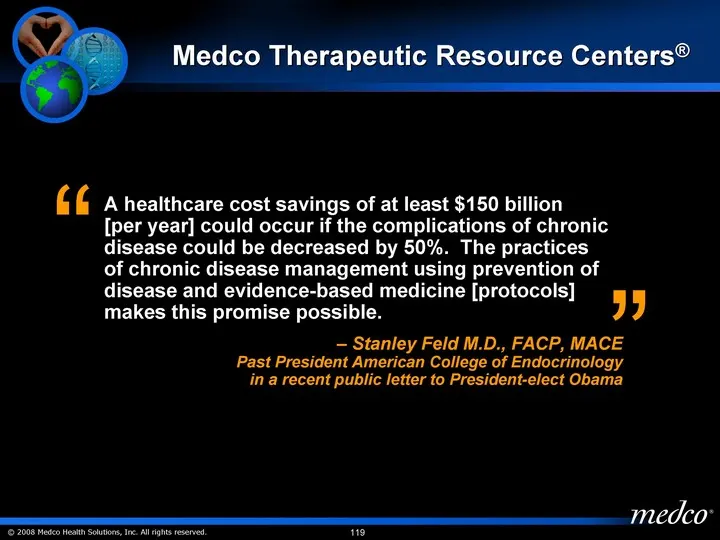
Medco Therapeutic Resource Centers(r) A healthcare cost savings of at least $150 billion [per year] could occur if the complications of chronic disease could be decreased by 50%. The practices of chronic disease management using prevention of disease and evidence-based medicine [protocols] makes thi
Slide 120: Personalizing Pharmacy: Combining New Science with Innovation
Personalizing Pharmacy: Combining New Science with Innovation Robert S. Epstein, M.D., M.S. Senior Vice President, Medical & Analytical Affairs, and Chief Medical Officer
Slide 121: Pharmacogenomics: What is it?
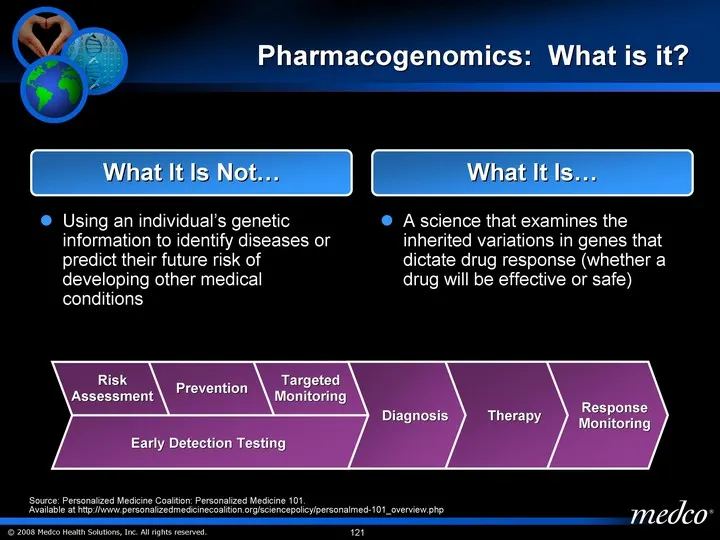
What It Is Not... What It Is... Using an individual's genetic information to identify diseases or predict their future risk of developing other medical conditions A science that examines the inherited variations in genes that dictate drug response (whether a drug will be effective or safe) Pharmacog
Slide 122: Why Should We Care About Pharmacogenomics?
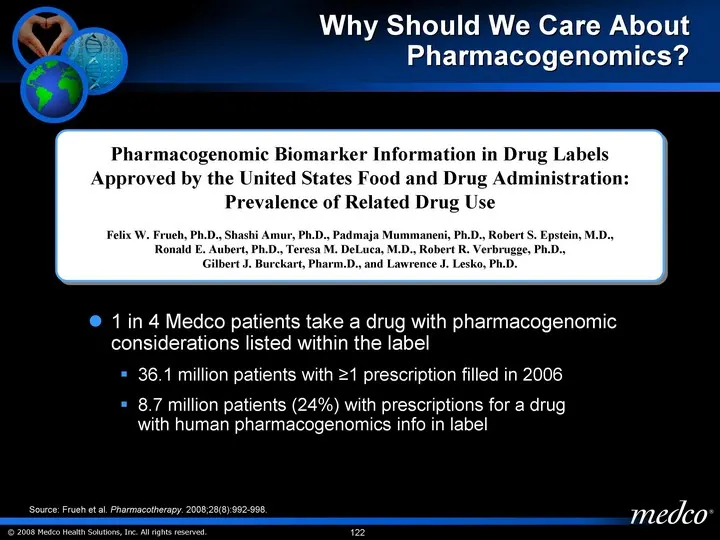
Pharmacogenomic Biomarker Information in Drug Labels Approved by the United States Food and Drug Administration: Prevalence of Related Drug Use Felix W. Frueh, Ph.D., Shashi Amur, Ph.D., Padmaja Mummaneni, Ph.D., Robert S. Epstein, M.D., Ronald E. Aubert, Ph.D., Teresa M. DeLuca, M.D., Robert R. Ver
Slide 123: Genetic Variation in Enzymes That Metabolize Drugs
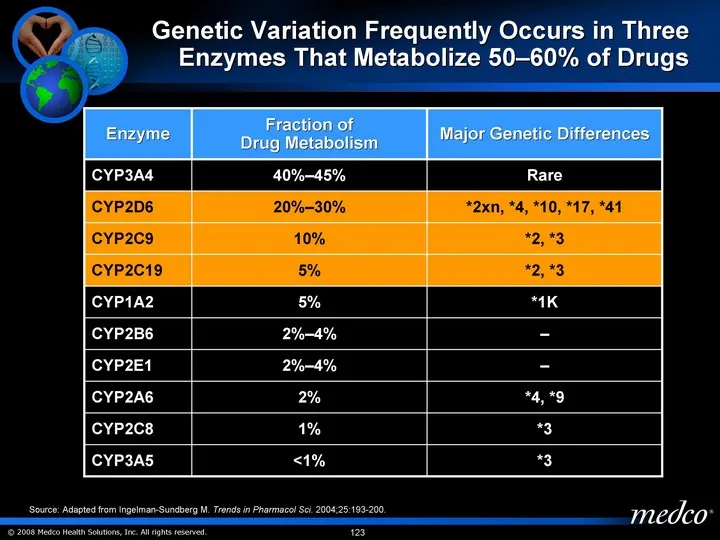
Genetic Variation Frequently Occurs in Three Enzymes That Metabolize 50-60% of Drugs Enzyme Fraction of Drug Metabolism Major Genetic Differences CYP3A4 40%-45% Rare CYP2D6 20%-30% *2xn, *4, *10, *17, *41 CYP2C9 10% *2, *3 CYP2C19 5% *2, *3 CYP1A2 5% *1K CYP2B6 2%-4% - CYP2E1 2%-4% - CYP2A6 2% *4, *
Slide 124: Medco Clients Vote on Their Interests
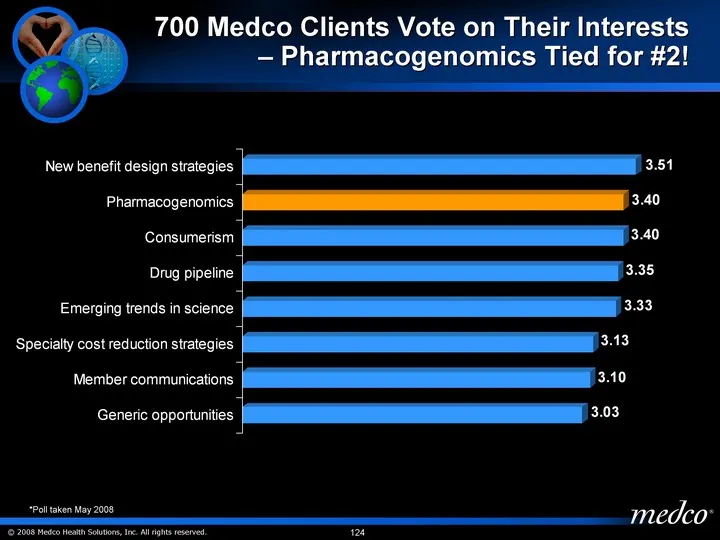
700 Medco Clients Vote on Their Interests - - Pharmacogenomics Tied for #2! New benefit design strategies Pharmacogenomics Consumerism Drug pipeline Emerging trends in science Specialty cost reduction strategies Member communications Generic opportunities 3.51 3.4 3.4 3.35 3.33 3.13 3.1 3.03 *Poll t
Slide 125: Medco's 2008 Nationwide Physician Survey
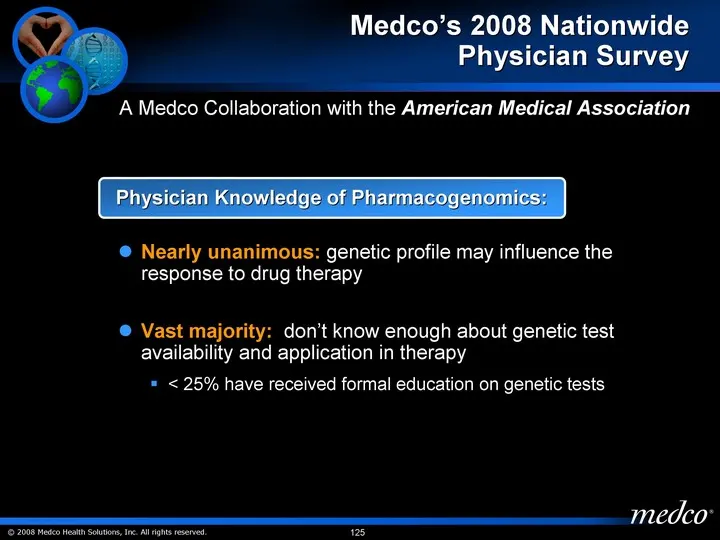
Medco's 2008 Nationwide Physician Survey Nearly unanimous: genetic profile may influence the response to drug therapy Vast majority: don't know enough about genetic test availability and application in therapy < 25% have received formal education on genetic tests A Medco Collaboration with the Ameri
Slide 126: Current and Future Use of Pharmacogenomic Tests
Medco's 2008 Nationwide Physician Survey >10% reported ordering a test for a patient within the past six months More than double this number anticipate ordering a test within the next six months Current and Future Use of Pharmacogenomic Tests A Medco Collaboration with the American Medical Associati
Slide 127: Personalized Medicine at Medco
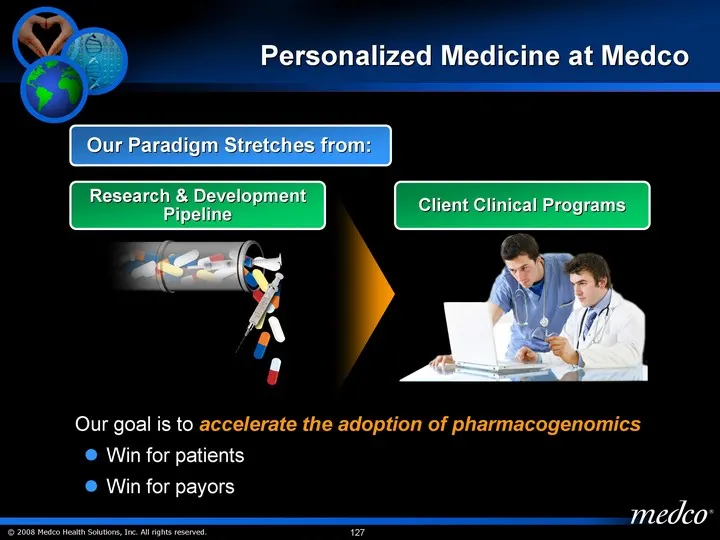
Personalized Medicine at Medco Our goal is to accelerate the adoption of pharmacogenomics Win for patients Win for payors Our Paradigm Stretches from: Research & Development Pipeline Client Clinical Programs
Slide 128: Our Research Studies are Our Pipeline
Our Research Studies are Our Pipeline Medco/Mayo warfarin outcomes study Medco/LabCorp tamoxifen study American Medical Association national physician survey Potential studies on Asthma, diabetes, statins, TNF blockers Prospective Studies Retrospective Studies Plavix - PPI study at American Heart As
Slide 129: Warfarin (Coumadin) - Blood Thinner
Warfarin (Coumadin(r)) - Blood Thinner Available for over 50 years Used to prevent or treat blood clots #1 drug-related cause of death in U.S.1 #2 drug-related reason for ER visits in U.S.1 Drug starting dose is 5 mg - adjustments frequent over long period of time 22% of patients on therapy were hos
Slide 130: Update on Medco-Warfarin Study with Mayo Clinic
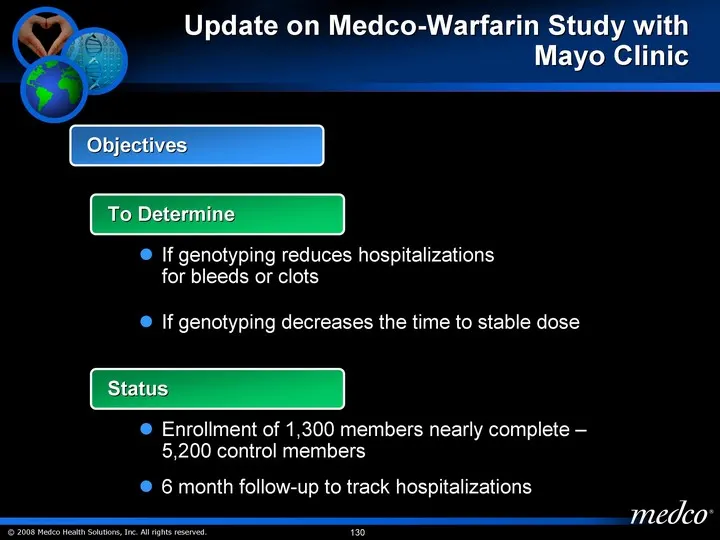
Update on Medco-Warfarin Study with Mayo Clinic Objectives To Determine Status Enrollment of 1,300 members nearly complete - 5,200 control members 6 month follow-up to track hospitalizations If genotyping reduces hospitalizations for bleeds or clots If genotyping decreases the time to stable dose
Slide 131: Warfarin: Genes Predict Drug Dose Changes
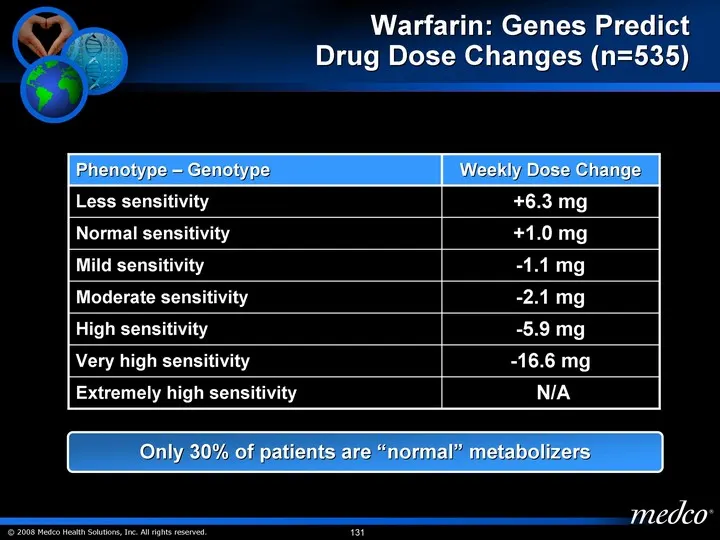
Warfarin: Genes Predict Drug Dose Changes (n=535) Phenotype - Genotype Weekly Dose Change Less sensitivity +6.3 mg Normal sensitivity +1.0 mg Mild sensitivity -1.1 mg Moderate sensitivity -2.1 mg High sensitivity -5.9 mg Very high sensitivity -16.6 mg Extremely high sensitivity N/A Only 30% of patie
Slide 132: Besides Warfarin, What Else Uses the 2C9 Enzyme?
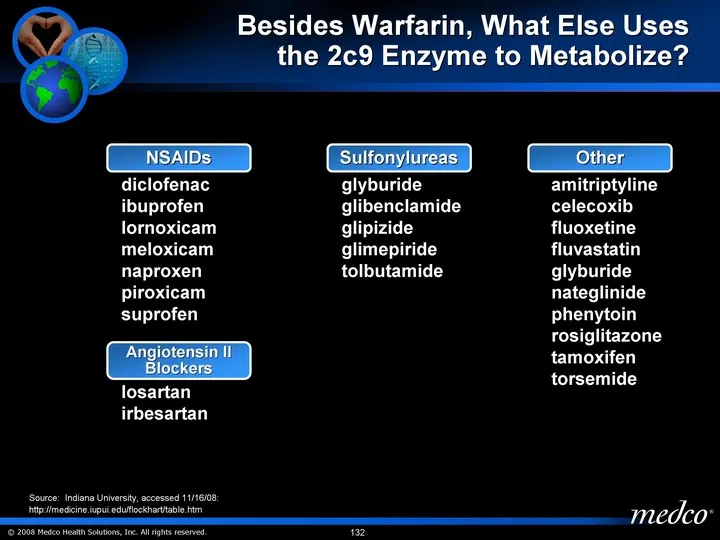
Besides Warfarin, What Else Uses the 2c9 Enzyme to Metabolize? Source: Indiana University, accessed 11/16/08: http://medicine.iupui.edu/flockhart/table.htm NSAIDs diclofenac ibuprofen lornoxicam meloxicam naproxen piroxicam suprofen amitriptyline celecoxib fluoxetine fluvastatin glyburide nateglinid
Slide 133: New Tamoxifen Study with LabCorp and Indiana University
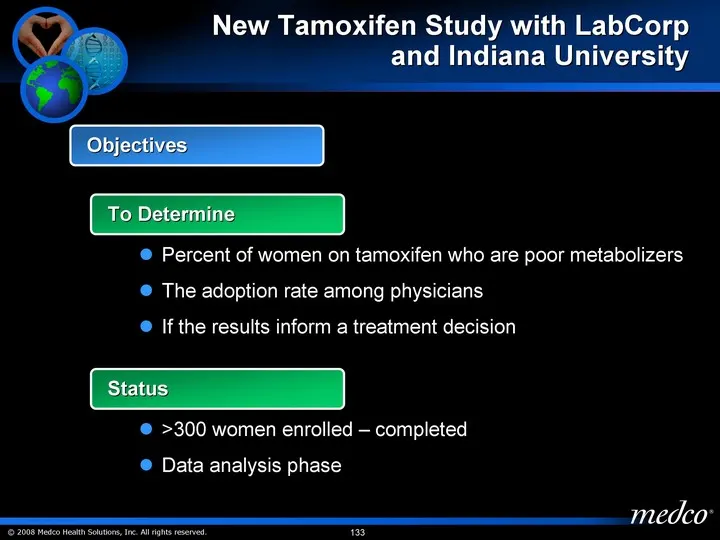
New Tamoxifen Study with LabCorp and Indiana University Percent of women on tamoxifen who are poor metabolizers The adoption rate among physicians If the results inform a treatment decision Objectives To Determine >300 women enrolled - completed Data analysis phase Status
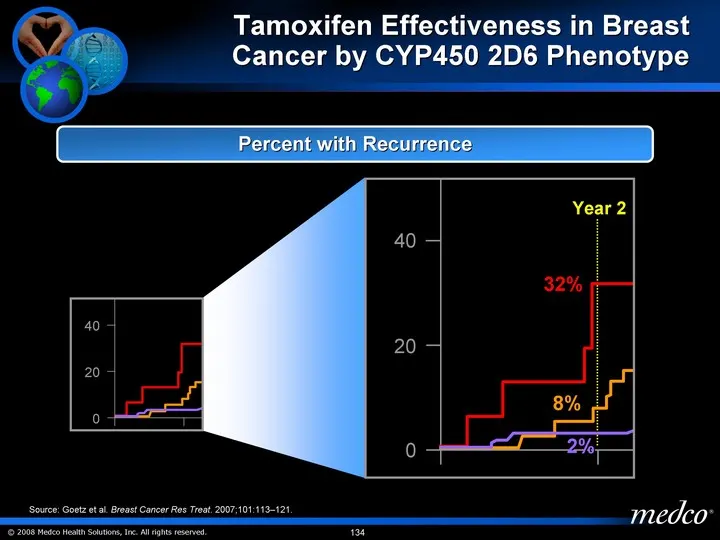
Slide 134: Tamoxifen Effectiveness in Breast Cancer by CYP450 2D6 Phenotype
Tamoxifen Effectiveness in Breast Cancer by CYP450 2D6 Phenotype 100 80 60 40 20 0 0 2 4 6 8 10 12 P=0.013 Year after randomization % Poor metabolizers Intermediate metabolizers Extensive metabolizers Percent with Recurrence 40 20 0 Year 2 2% 8% 32% Source: Goetz et al. Breast Cancer Res Treat. 2007
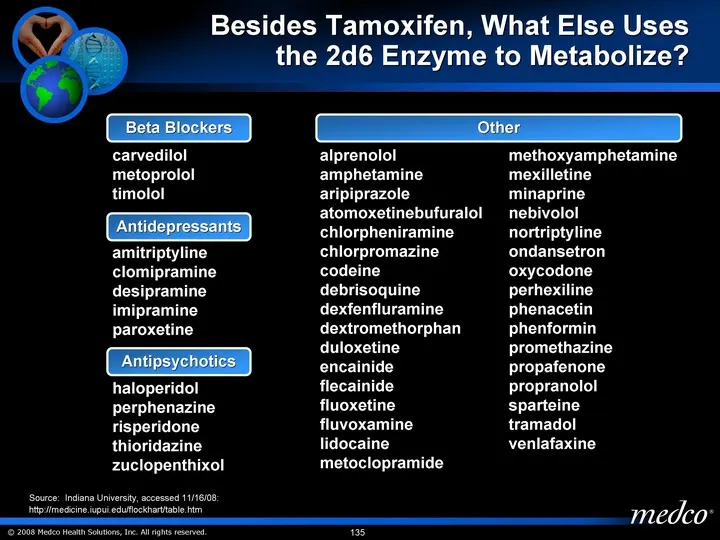
Slide 135: Besides Tamoxifen, What Else Uses the 2D6 Enzyme?
Besides Tamoxifen, What Else Uses the 2d6 Enzyme to Metabolize? Beta Blockers Antidepressants Antipsychotics Other carvedilol metoprolol timolol amitriptyline clomipramine desipramine imipramine paroxetine haloperidol perphenazine risperidone thioridazine zuclopenthixol alprenolol amphetamine aripip
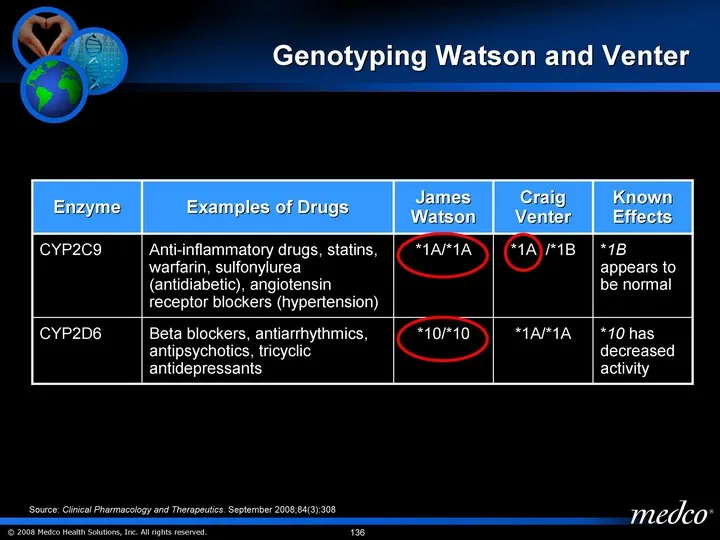
Slide 136: Genotyping Watson and Venter
Genotyping Watson and Venter Enzyme Examples of Drugs James Watson Craig Venter Known Effects CYP2C9 Anti-inflammatory drugs, statins, warfarin, sulfonylurea (antidiabetic), angiotensin receptor blockers (hypertension) *1A/*1A *1A /*1B *1B appears to be normal CYP2D6 Beta blockers, antiarrhythmics,
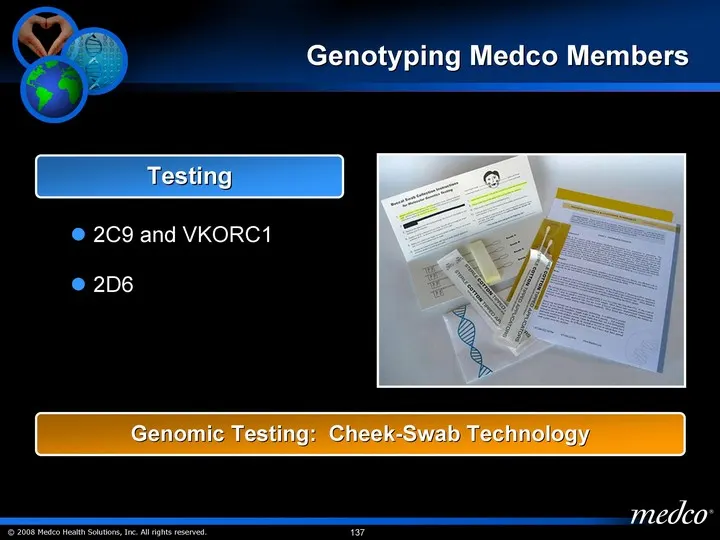
Slide 137: Genomic Testing: Cheek-Swab Technology
2C9 and VKORC1 2D6 Genotyping Medco Members Testing Genomic Testing: Cheek-Swab Technology
Slide 138: The Role of Genetics in Drug Interactions
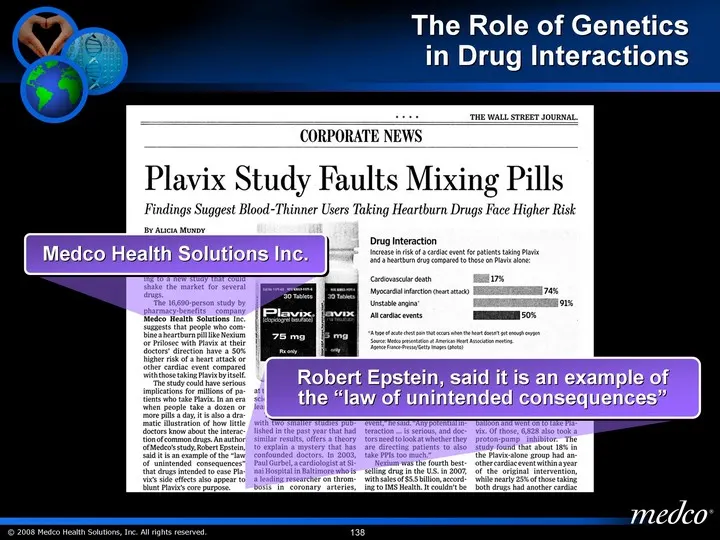
The Role of Genetics in Drug Interactions Medco Health Solutions Inc. Robert Epstein, said it is an example of the "law of unintended consequences"
Slide 139: Clopidogrel (Plavix) Medco Outcomes Study
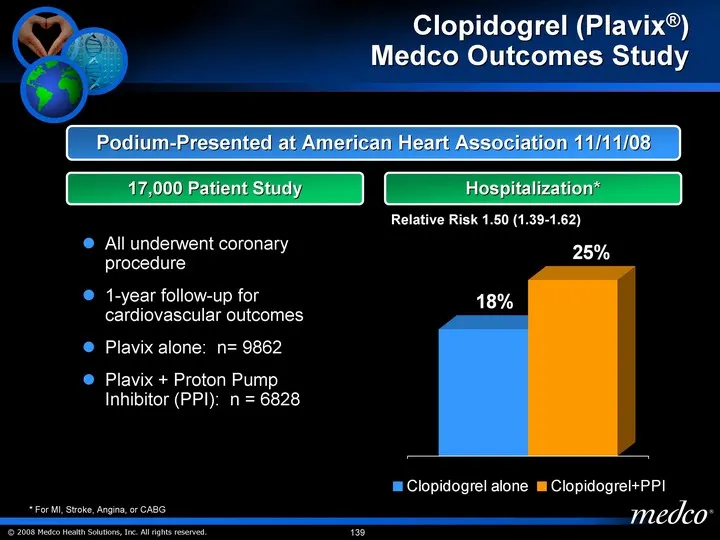
Clopidogrel (Plavix(r)) Medco Outcomes Study Clopidogrel alone 0.18 Clopidogrel+PPI 0.25 Relative Risk 1.50 (1.39-1.62) Podium-Presented at American Heart Association 11/11/08 * For MI, Stroke, Angina, or CABG 17,000 Patient Study All underwent coronary procedure 1-year follow-up for cardiovascular
Slide 140: Medco Collaborates with the FDA
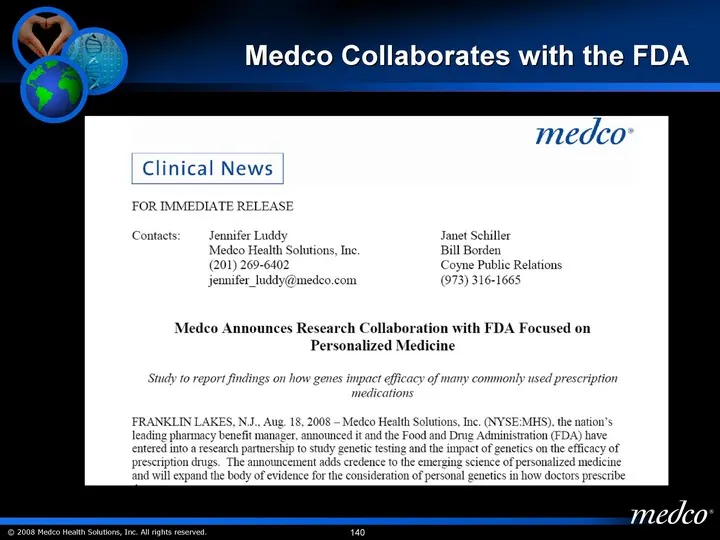
Medco Collaborates with the FDA
Slide 141: Client Clinical Programs
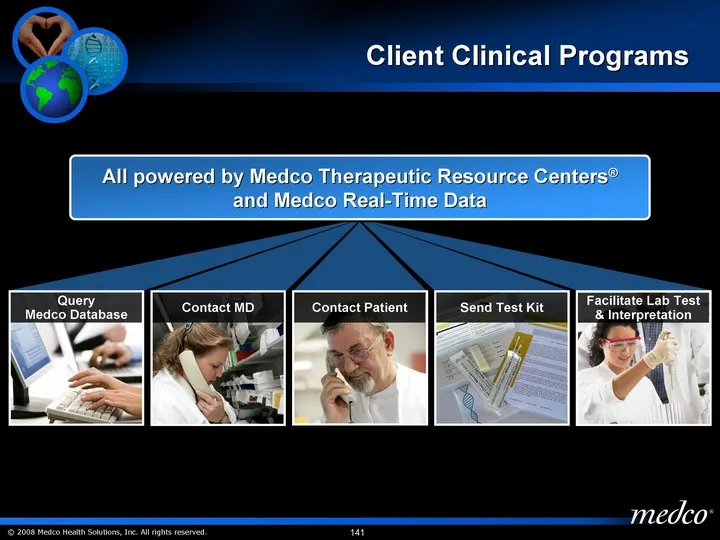
Client Clinical Programs Query Medco Database Facilitate Lab Test & Interpretation Send Test Kit All powered by Medco Therapeutic Resource Centers(r) and Medco Real-Time Data Contact MD Contact Patient
Slide 142: Program Enrollment Update
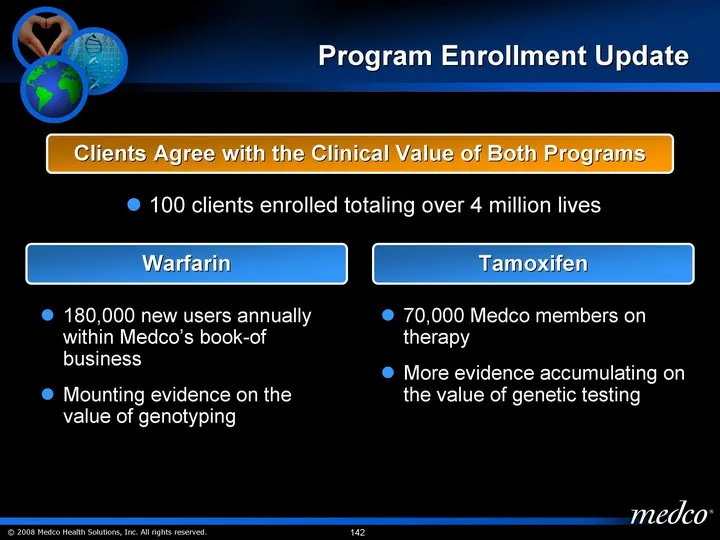
Program Enrollment Update 180,000 new users annually within Medco's book-of business Mounting evidence on the value of genotyping 70,000 Medco members on therapy More evidence accumulating on the value of genetic testing Warfarin Tamoxifen Clients Agree with the Clinical Value of Both Programs 100 c
Slide 143: Additional Program Areas Under Consideration by Medco
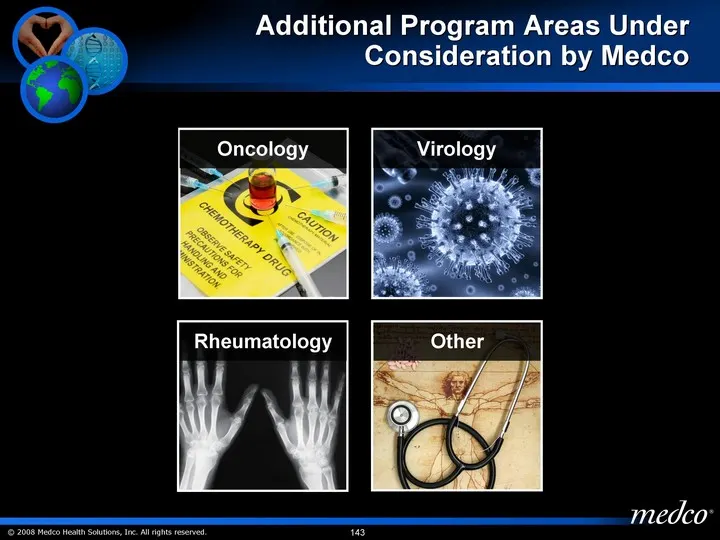
Additional Program Areas Under Consideration by Medco Oncology Virology Rheumatology Other
Slide 144: Medco's Competitive Advantage
Medco's Competitive Advantage Pharmacogenomics provides differentiation in the marketplace Continuous innovation Acceleration of improvement in care Establishing Significant Partnerships to Catalyze the New 21st Century Care Paradigm

Slide 145: Analyst Day 2008
Analyst Day 2008 November 21, 2008

Slide 146: Inventing World-Class Solutions in Healthcare
Inventing World-Class Solutions in Healthcare medco:

Slide 147: the best way to predict the future is to invent it. " " -
the best way to predict the future is to invent it. " " - - Alan C. Kay, fellow at Apple Computer Inc., a visionary computer scientist
Source: SEC EDGAR · 8-K filed Nov 21, 2008
More decks from Medco Health Solutions Inc
 Merger or Acquisition (July 2011)20 slides · Jul 22, 2011
 Sanford C. Bernstein 27th Annual Strategic Decisions Conference 201125 slides · Jun 1, 2011
 Deutsche Bank 36th Annual Health Care Conference 201130 slides · May 3, 2011
 Investor Presentation (March 2011)36 slides · Mar 24, 2011
 Barclays Capital 2011 Global Health Care Conference36 slides · Mar 17, 2011
 Citi 2011 Global Health Care Conference37 slides · Mar 1, 2011