Tower Financial — Midwest 2009 Super Community Bank Conference
33 slides from Tower Financial's conference presentation, Feb 24, 2009

Slide 1: Midwest 2009 Super Community Bank Conference
Midwest 2009 Super Community Bank Conference February 24-25, 2009

Slide 2: Presenter contact details
Michael D. Cahill President & CEO Michael.Cahill@towerbank.net 260-427-7013 Richard Sawyer EVP & Chief Financial Officer Rick.Sawyer@towerbank.net 260-427-7150 Tower Financial Corporation 116 East Berry Street Fort Wayne, IN 46802

Slide 3: Forward-Looking Statements
Forward-Looking Statements This presentation contains some predictive statements about future events, including statements related to conditions in the financial services industry, the economy, and about Tower Financial Corporation and its banking and trust company subsidiaries. These statements are

Slide 4: About Tower Financial
About Tower Financial • Ticker symbol: TOFC (Nasdaq Global Market) • Headquartered in Fort Wayne, Indiana and opened in 1999 • Two subsidiaries: − Tower Bank & Trust Company − Tower Trust Company • Six branches in Fort Wayne and one in Warsaw • As of December 31, 2008: − Bank assets: $696.5 million

Slide 5: Tower's Value Proposition
Tower’s Value Proposition • Deposit market share/efficiency • Unvalued Trust subsidiary • Price to book versus peers • Unvalued HSA business platform
Slide 6: Fort Wayne Deposit Market Shares: 1998 to 2008
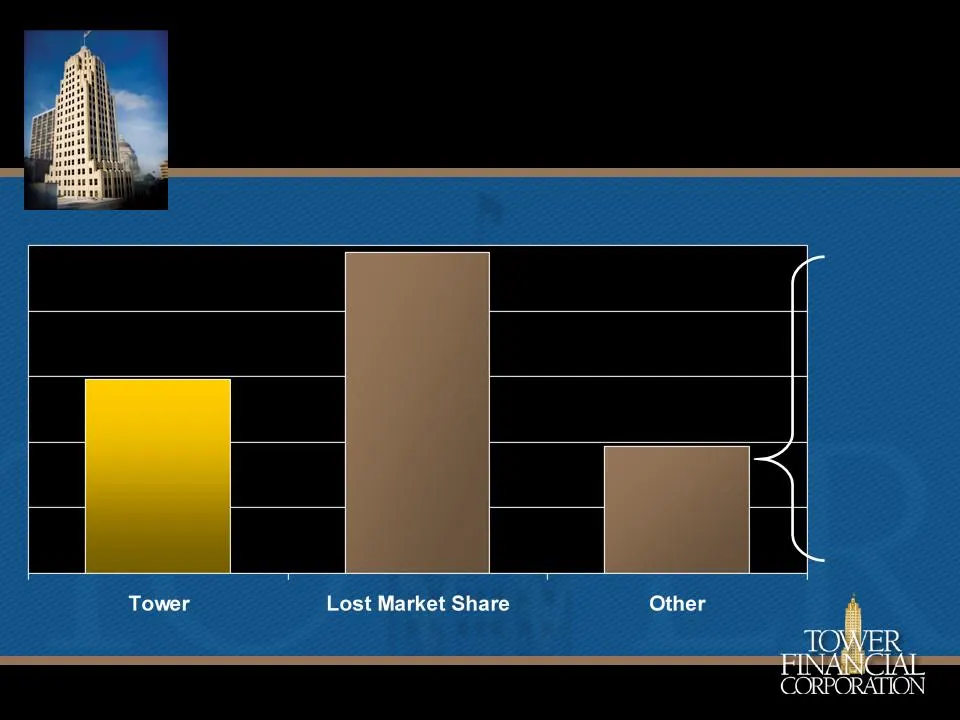
(millions) As of June 30, 1998 As of June 30, 2008 Deposits % of Total Deposits % of Total PNC $1,197.5 33.3 $621.4 17.1 JPM Chase 1,107.5 30.8 756.2 20.9 Wells Fargo 639.0 17.8 591.9 16.3 “Big 3” Deposits 2,944.0 81.9 1,969.5 54.3 Total Market Deposits $3,595.0 100.0 $3,626.3 100.0 Source: SNL Fort
Slide 7: Fort Wayne Deposit Market Shift: Tower Share 2008
Deposits in Millions 60.8% Note: Big 3 lost 27% market share or $974.5 million in deposits. 39.2% Star Financial Grabill Bank Markle Bank Fifth Third First Source Salin Campbell & Fetter Charter One ONB First Fed of Midwest Flagstar Garrett State State Bank Lake City Huntington $974.5 Fort Wayne Dep
Slide 8: Deposit Market Share: Efficiency Top 5
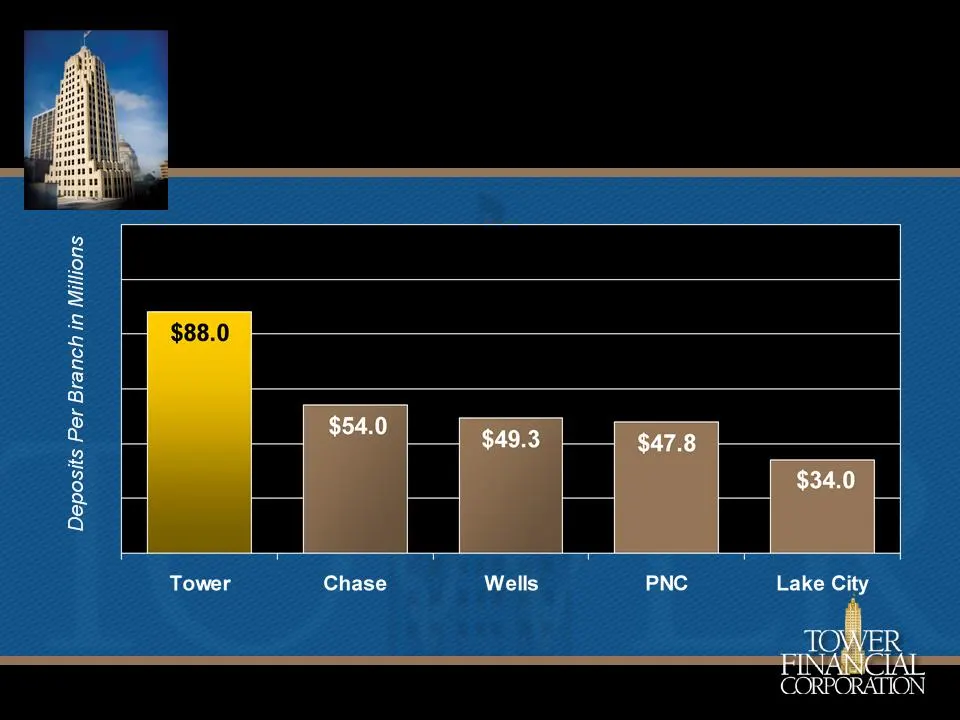
Note: Star Financial, IAB, First Source, 5/3, and Salin rounds out top ten. Source: SNL Deposit Market Share: Efficiency Top 5 as of June 30, 2008
Slide 9: Deposit Premium Estimates
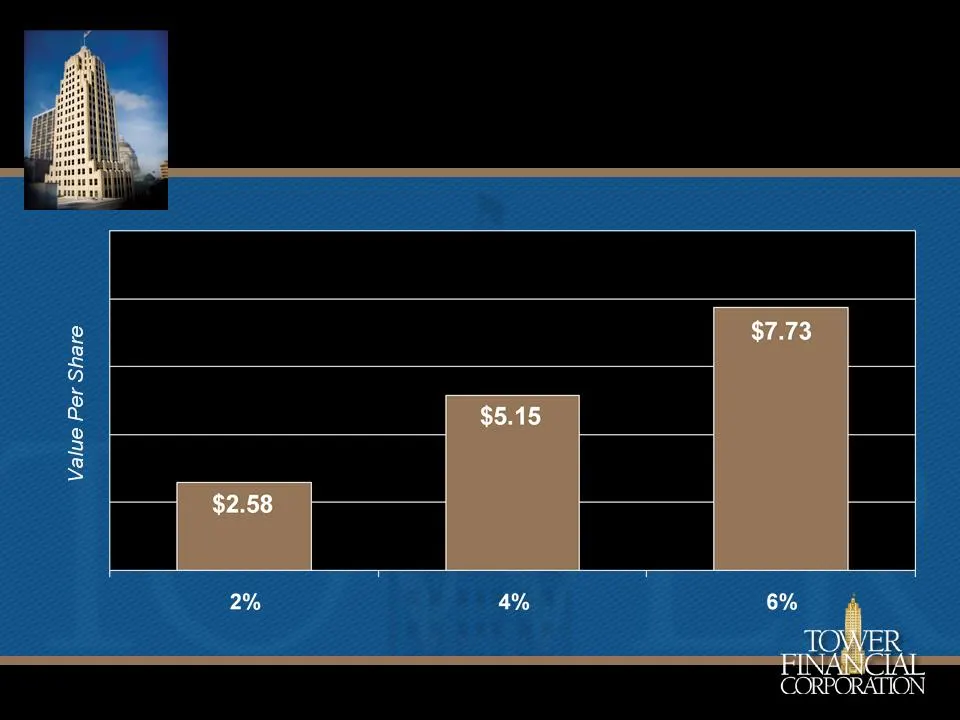
Note: Based on 4.1 million shares outstanding and 6/30/08 deposits (Fort Wayne only) of $592.3 million (less brokered deposits of $64.4 miillion). Deposit Premium Estimates
Slide 10: Unvalued Trust Subsidiary Assets Under Management
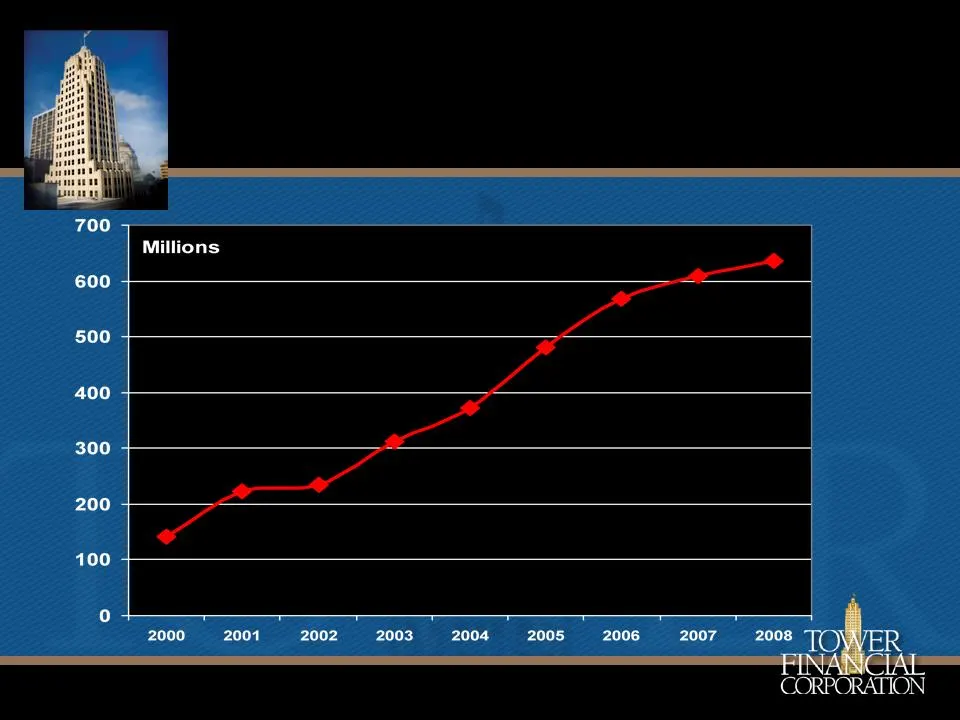
Note: 5 year CAGR of 15.3%. Unvalued Trust Subsidiary Assets Under Management
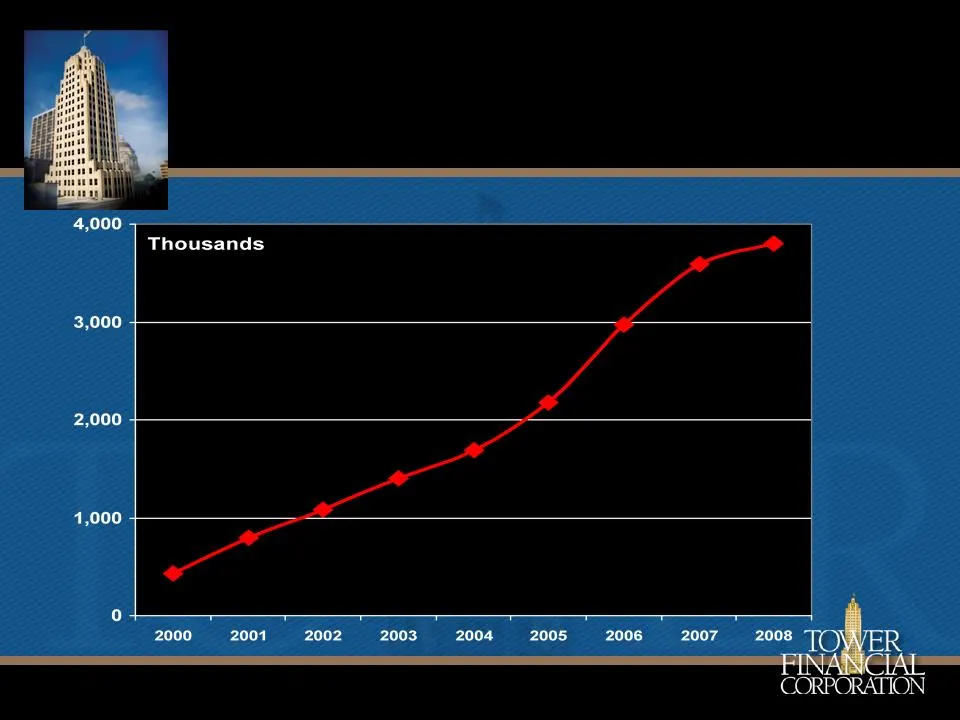
Slide 11: Unvalued Trust Subsidiary Gross Revenues
Note: 5 year CAGR of 22.05%. Unvalued Trust Subsidiary Gross Revenues
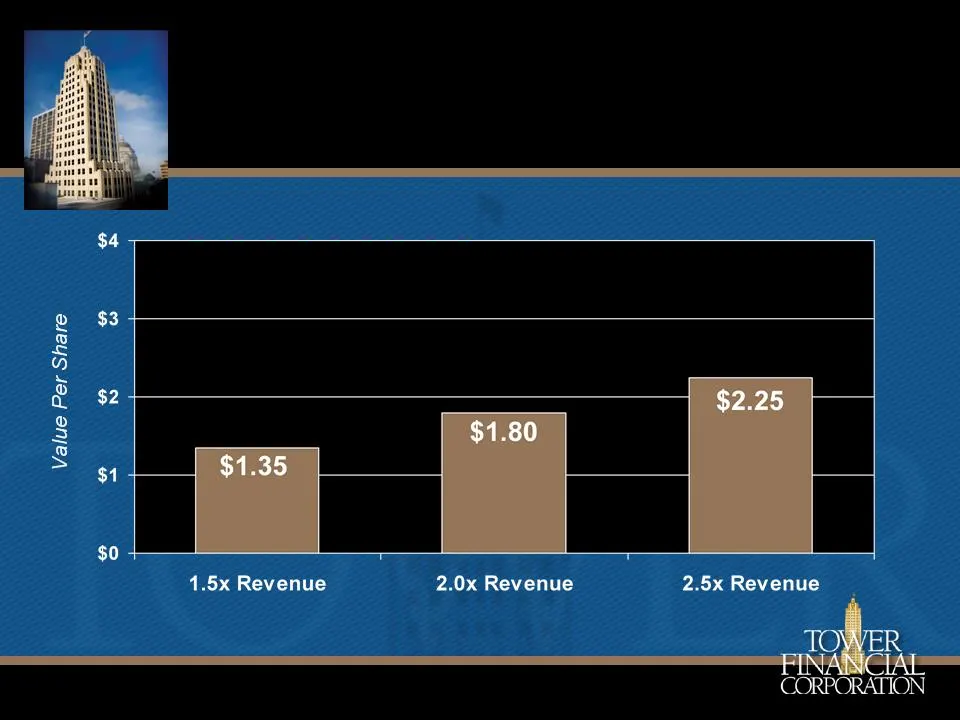
Slide 12: Unvalued Trust Subsidiary Value Estimate
Note: Based on 4.1 million shares outstanding and average revenues for 2007 and 2008. Unvalued Trust Subsidiary Value Estimate
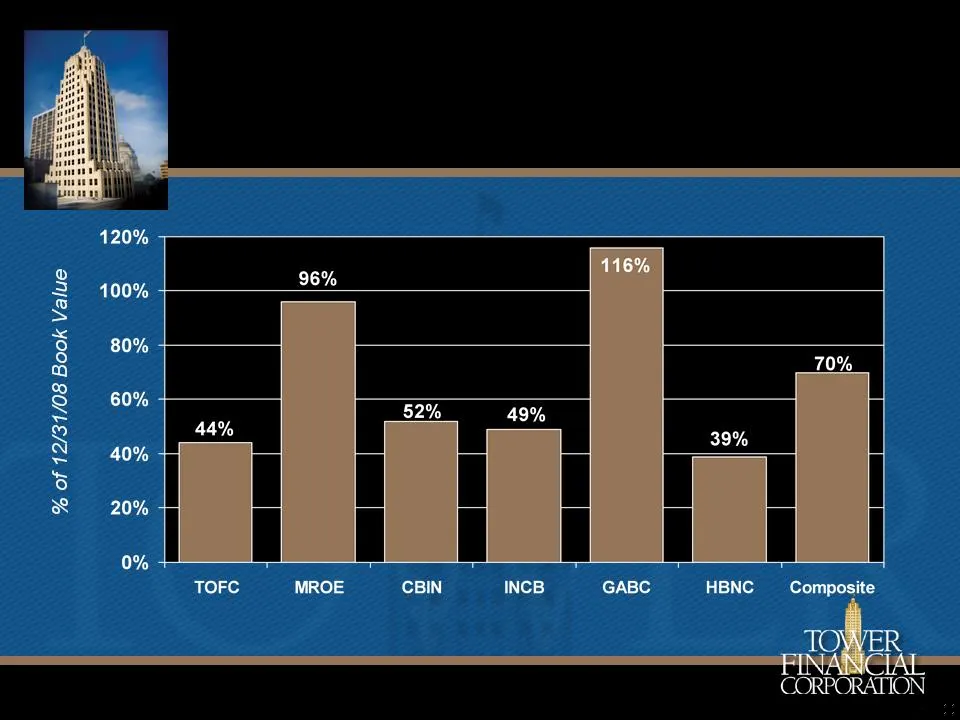
Slide 13: Price to Book (1/30/09) - Peer
Note: Price at % of book is based on 1/30/09 stock price and 12/31/08 book values. Price to Book (1/30/09) - Peer $5.30 $8.60 $9.75 $13.40 $11.11 $12.30 $11.03
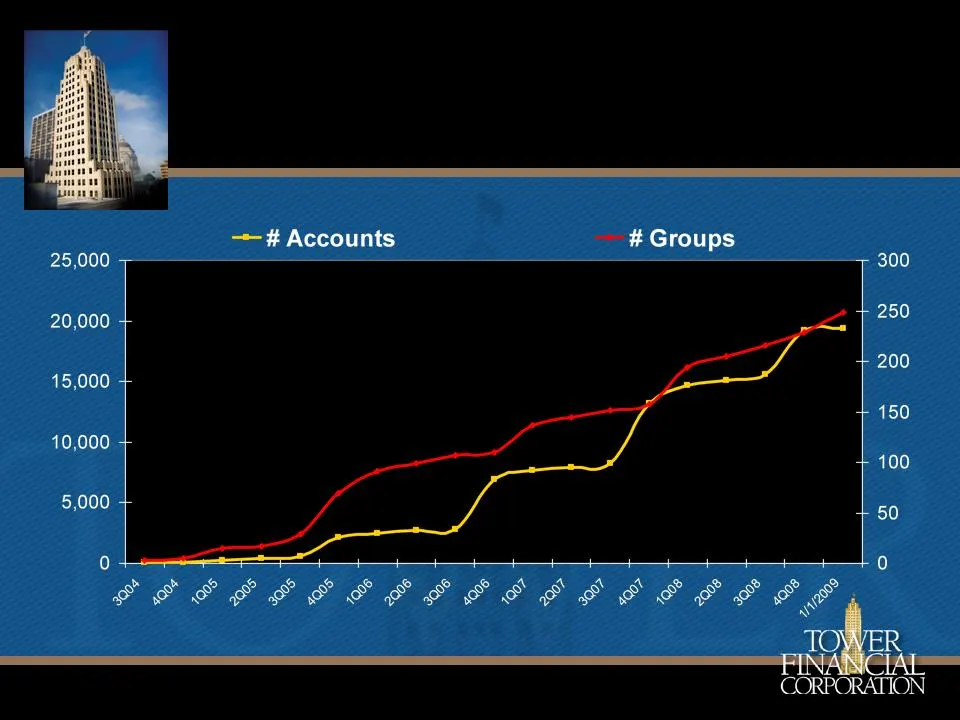
Slide 14: Health Savings Account Business Platform
Health Savings Account Business Platform
Slide 15: Health Savings Account Deposits
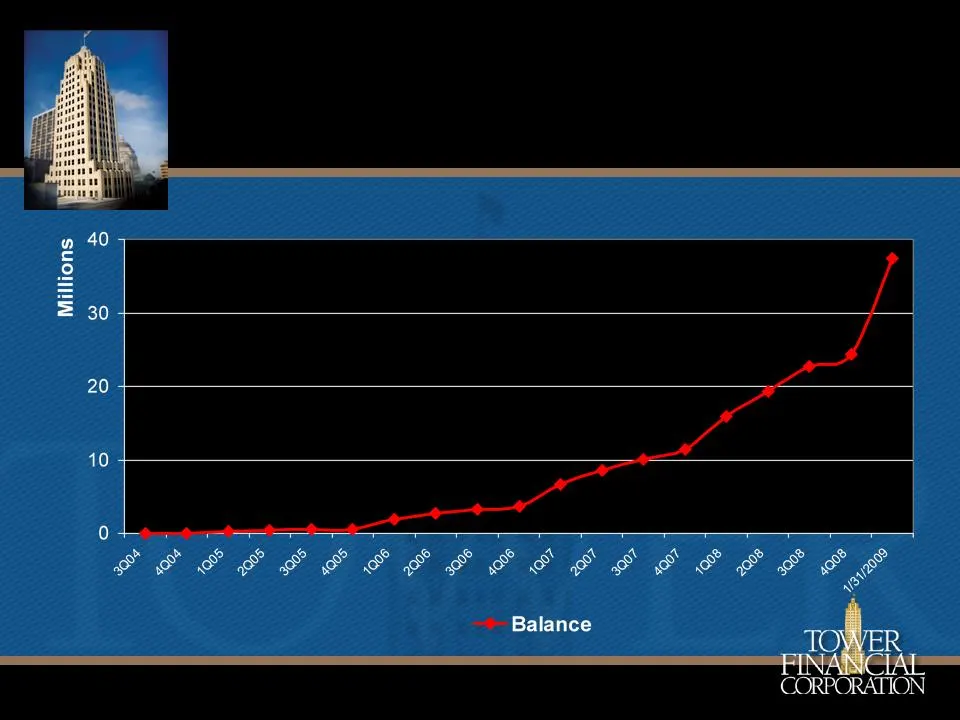
Note: The average rate paid for January 2009 is 1.38%. Health Savings Account Deposits

Slide 16: Midwest 2009 Super Community Bank Conference - Richard Sawyer, CFO
Midwest 2009 Super Community Bank Conference Richard Sawyer EVP & Chief Financial Officer
Slide 17: Allowance for Loan Losses to Total Loans
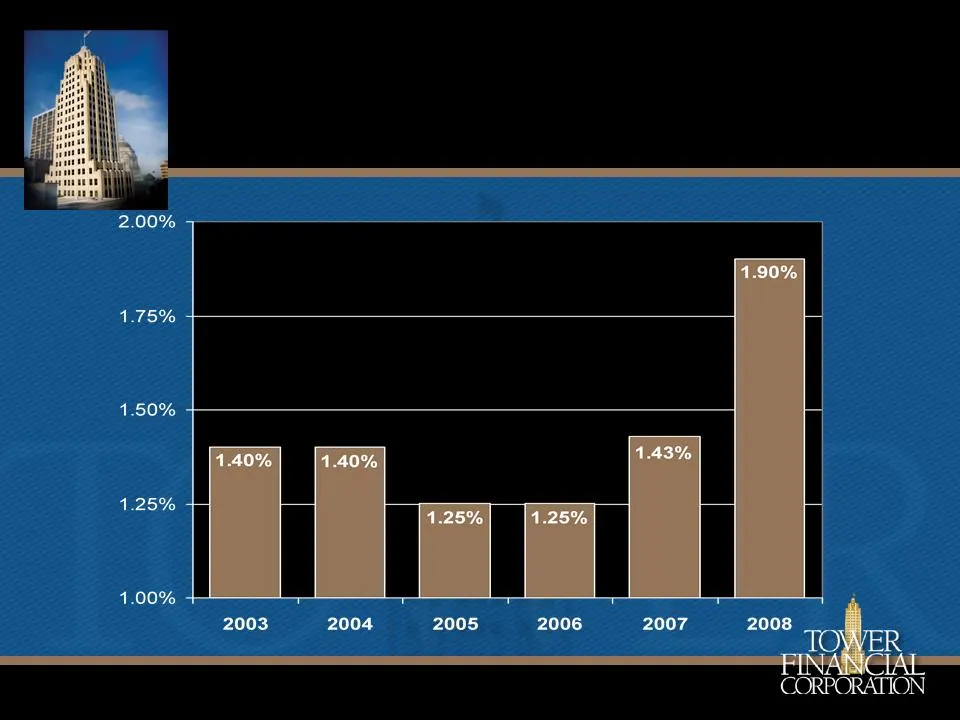
Allowance for loan losses (ALLL) to Total Loans
Slide 18: NPA's to Assets
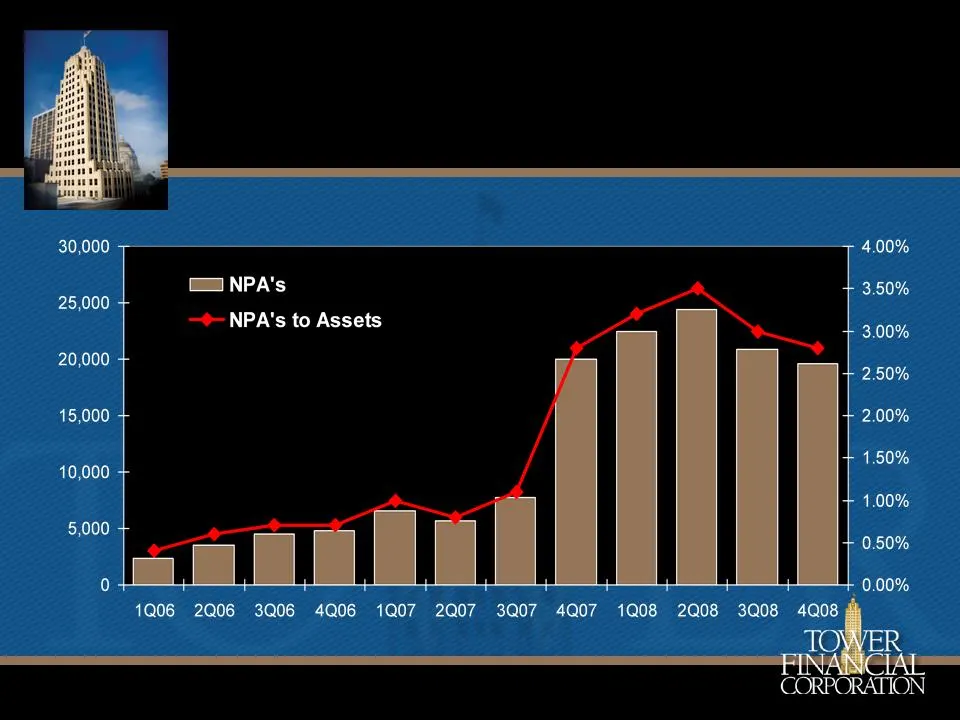
30,000 4.00% = NPA's _ —* NPA's to Assets 3.00% 2.50% 2.00% 1.50% 1.00% 0.50% 0.00% 1Q06 2Q06 3Q06 4Q06 1207 2Q07 3Q07 4Q07 1Q08 2Q08 3Q08 4Q08 CORPORATION
Slide 19: Non-Performing Assets by Category
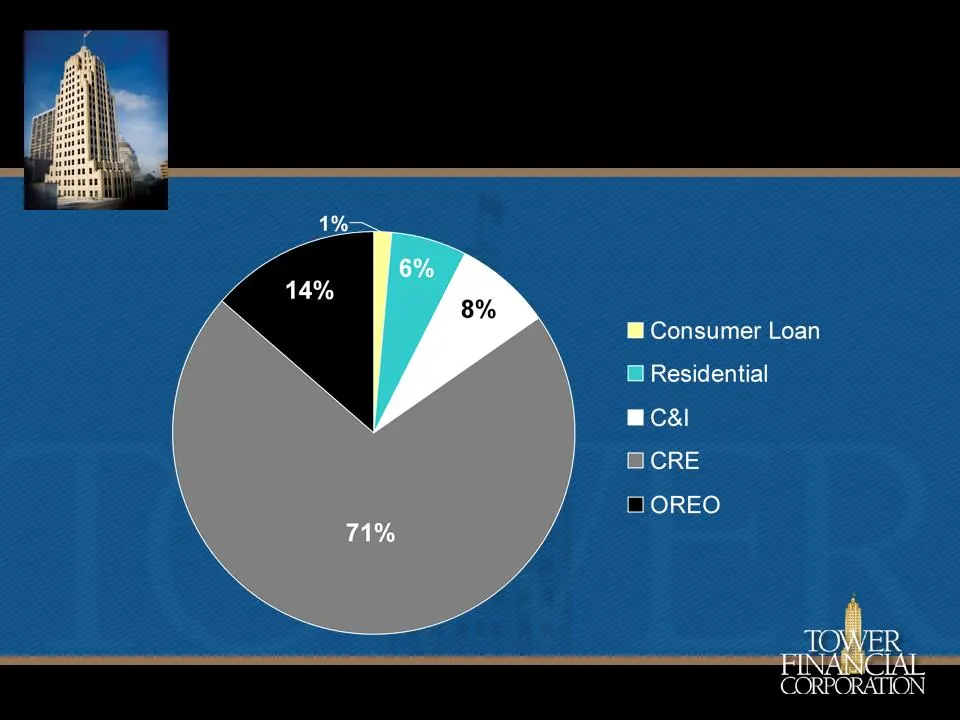
= $274 = $1,199 = $1,502 = $13,919 = $2,660 Non-Performing Assets by category
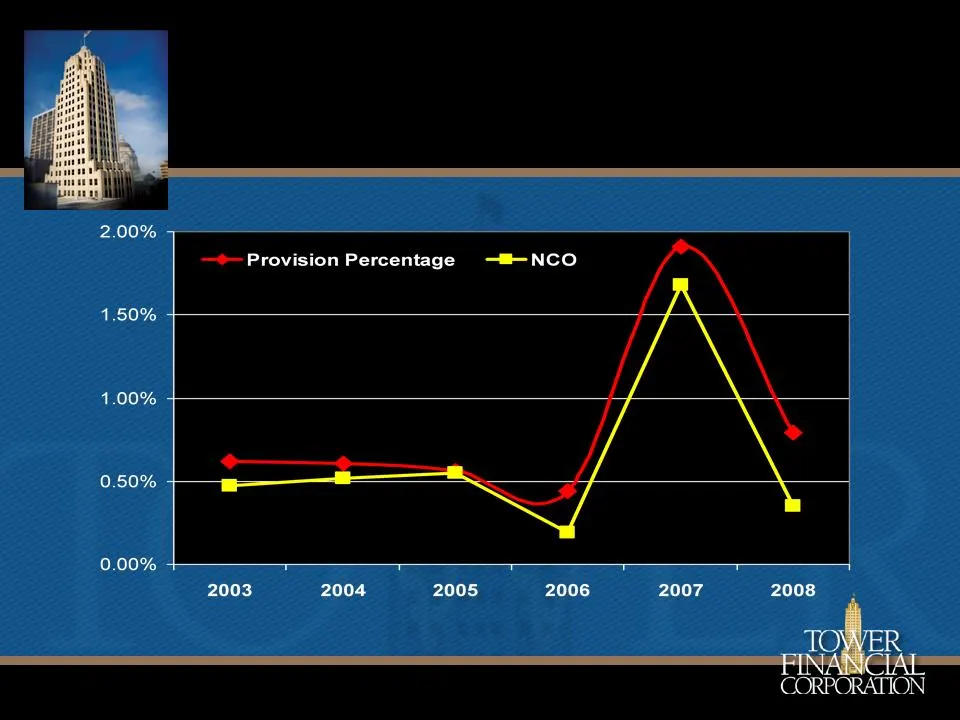
Slide 20: Provision and Net Charge-offs as a Percentage of Average Loans
Provision and Net Charge-off’s as a Percentage of Average Loans
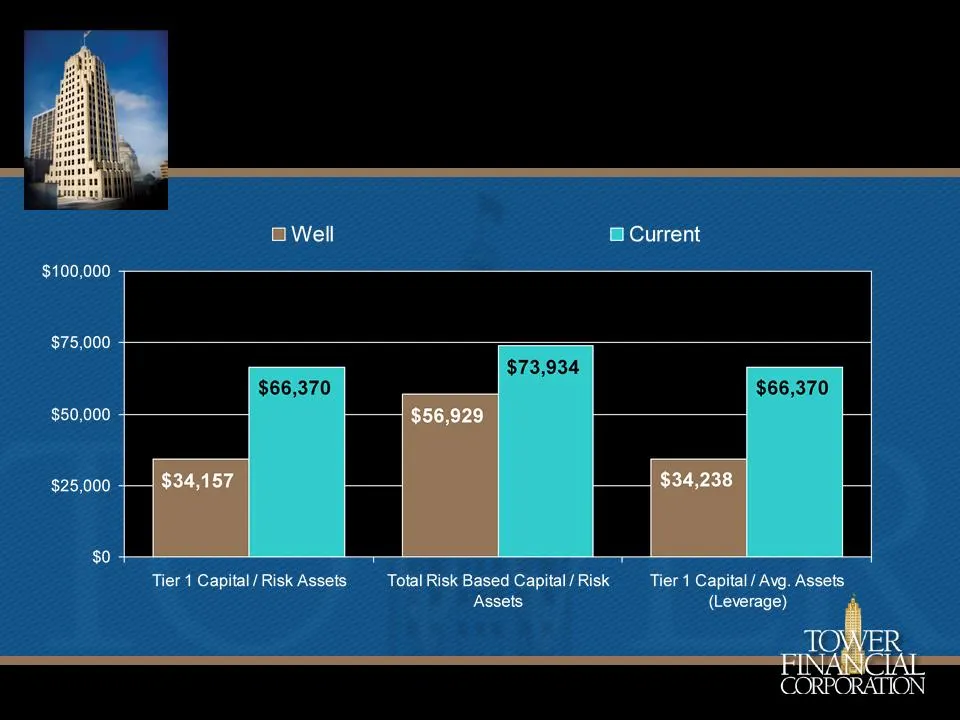
Slide 21: Capital Analysis (December 31, 2008)
Capital Analysis (December 31, 2008)

Slide 22: Capital Analysis (December 31, 2008)
Adequate Well Current 4%-4.99% 5% or more 9.69% Tier 1 Capital / Average Assets 8%-9.99% 10% or more 12.99% Total Risk Based Capital / Risk Assets 4%-5.99% 6% or more 11.66% Tier 1 Capital / Risk Assets Minimum Percentage Requirements 29,390 34,238 66,370 32,132 Tier 1 Capital / Avg. Assets (Leverag
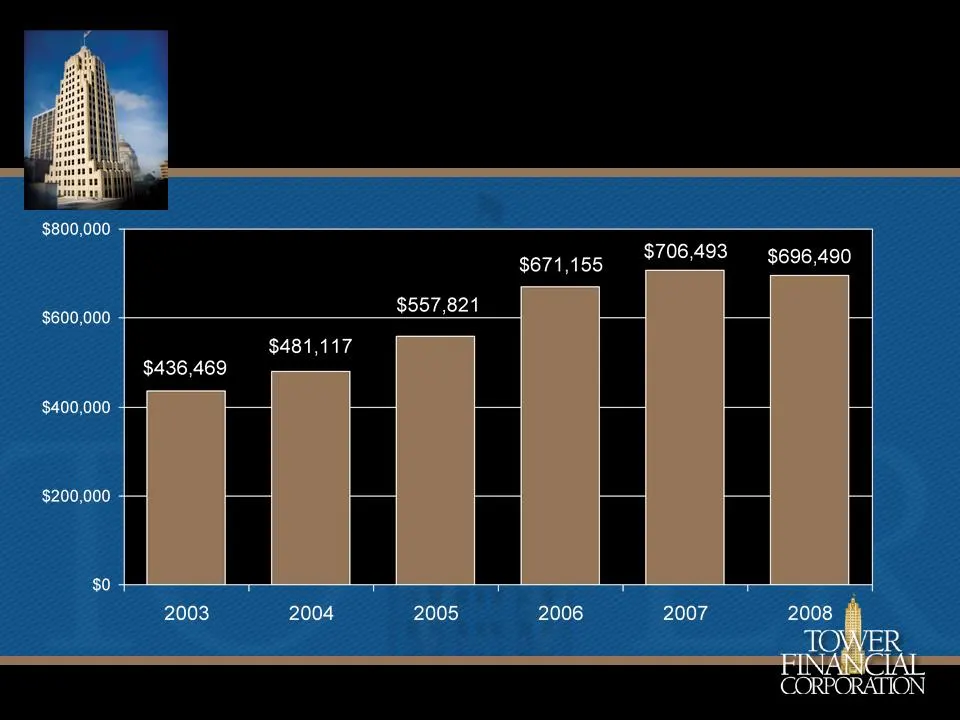
Slide 23: Total Assets
$800,000 $671,155 $706,493 $696,490 $600,000 $557,821 $481,117 $436,469 $400,000 + $200,000 $0 4 2003 2004 2005 2006 2007 2008 CORPORATION
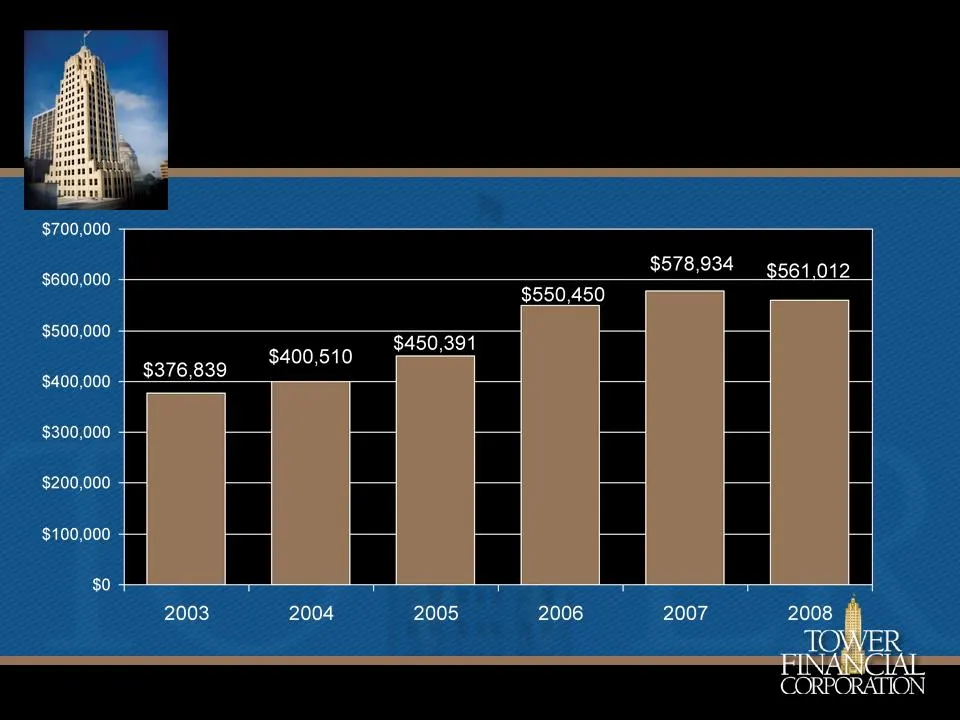
Slide 24: Loans
$700,000 $578,934 $561,012 $600,000 $500,000 $550,450 $400,000 $376,839 $400,510 $450,391 $300,000 + $200,000 $100,000 + $0 4 2003 2004 2005 2006 2007 2008 CORPORATION
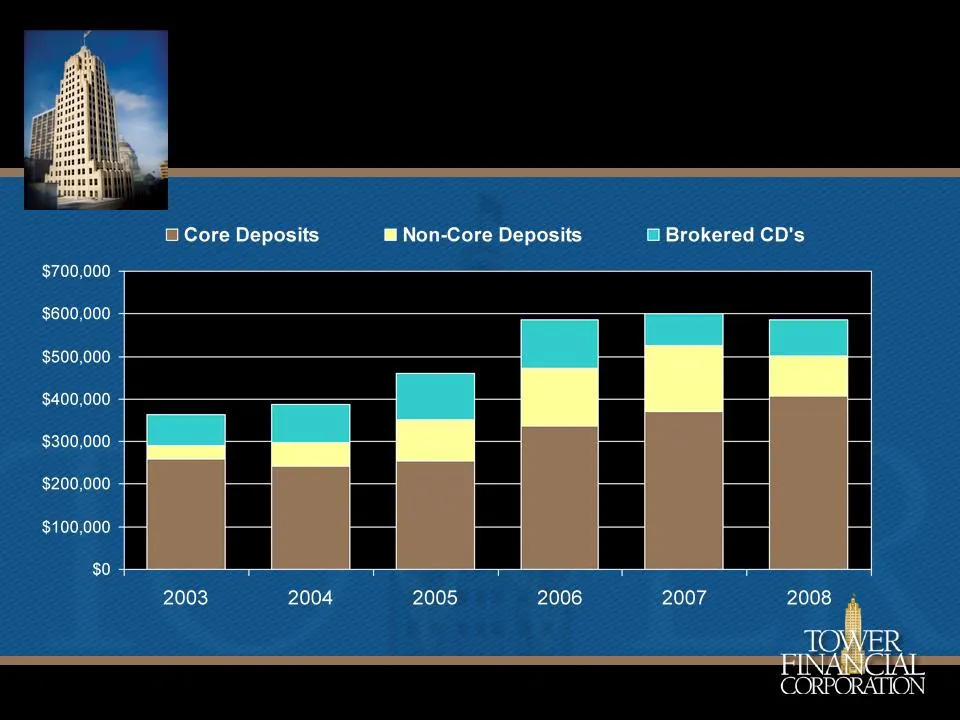
Slide 25: Deposits
$362,877 $386,380 $460,951 $586,770 $600,689 $586,237 Deposits
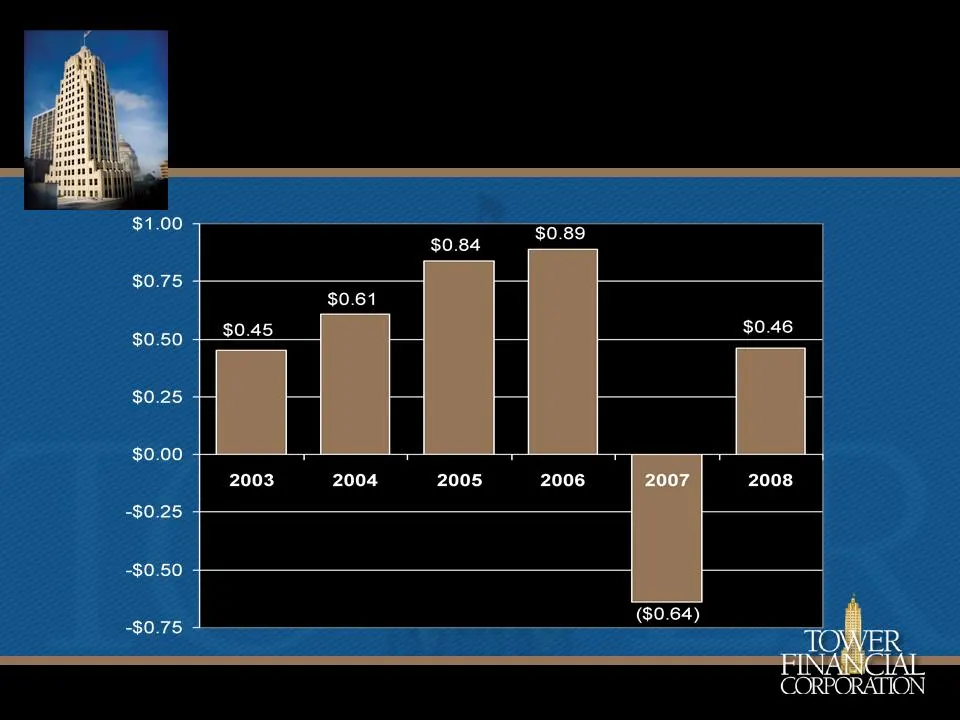
Slide 26: Earnings per Share
$1.00 $0.84 $059 $0.75 $0.61 $0.50 + 30.45 $0.46 $0.25 + $0.00 + 2003 2004 2005 2006 2008 -$0.25 -$0.50 -$0.75 4 50.88) CORPORATION
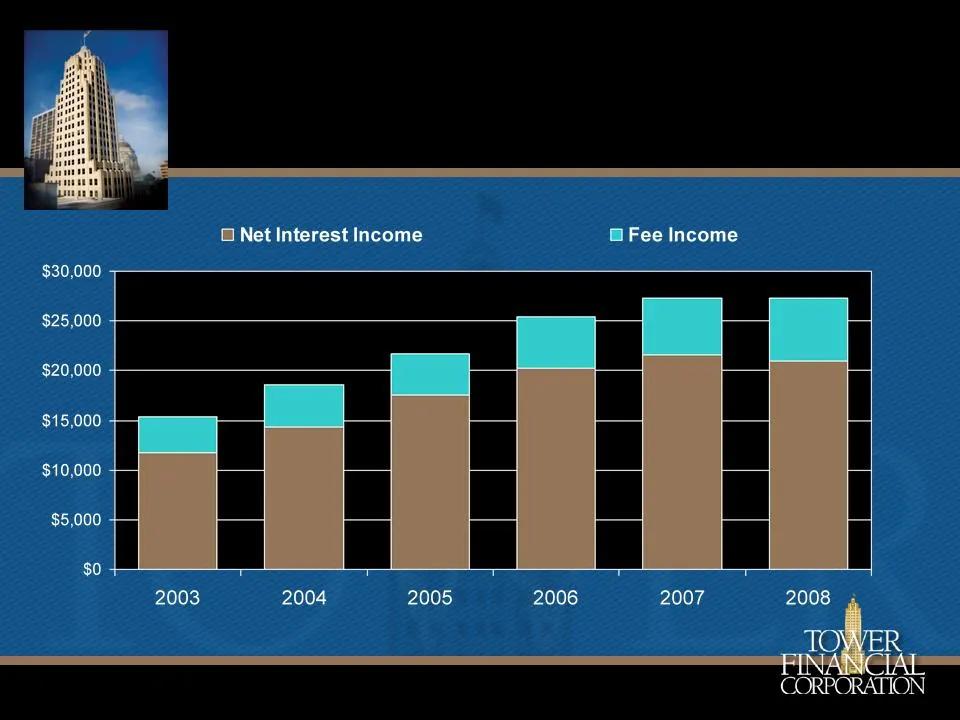
Slide 27: Total Revenue
$15,407 $18,590 $21,747 $25,396 $27,351 $27,276 76.4% 77.0% 80.8% 79.8% 78.8% 76.9% Total Revenue
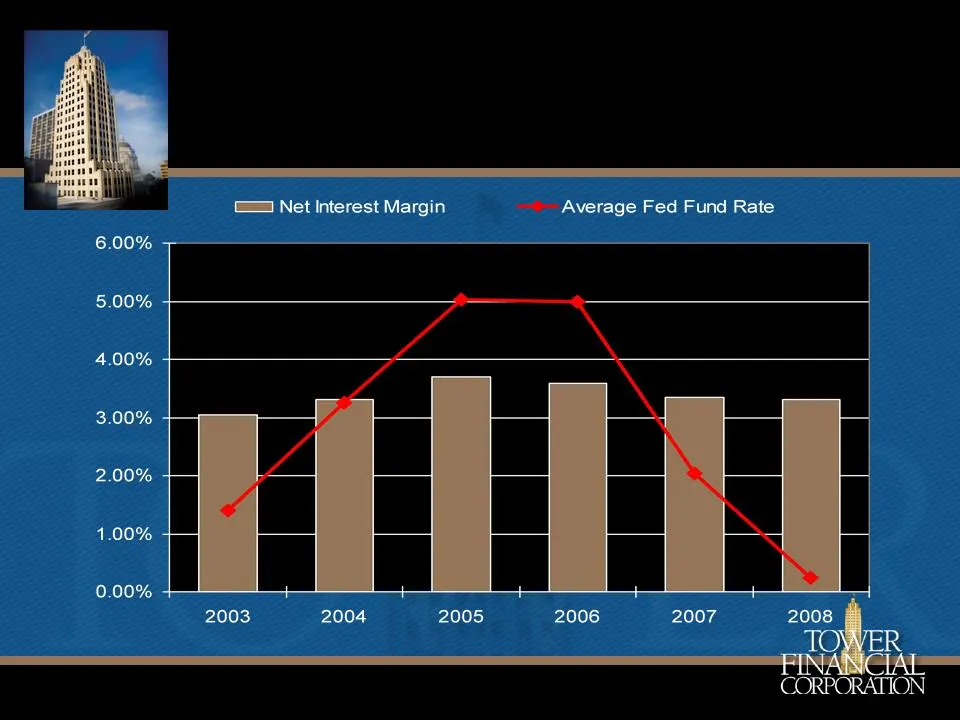
Slide 28: Net Interest Margin vs Average Fed Funds Rate
(} Net Interest Margin Average Fed Fund Rate 5.00% 4.00% 3.00% 2.00% 1.00% 0.00% 2003 2004 2005, 2006 2007 2008 CORPORATION
Slide 29: Non-Interest Income
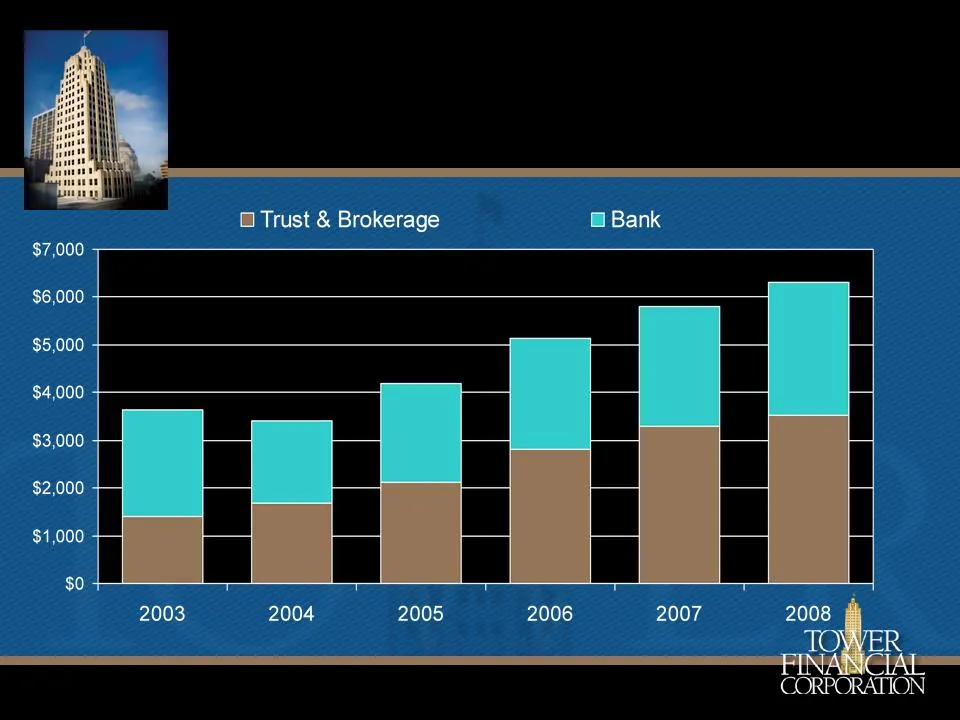
$3,642 $4,274 $4,184 $5,126 $5,805 $6,303 Note: 2004 does not include insurance proceeds. 38% 49% 51% 55% 57% 56% Non-Interest Income
Slide 30: Operating Expenses
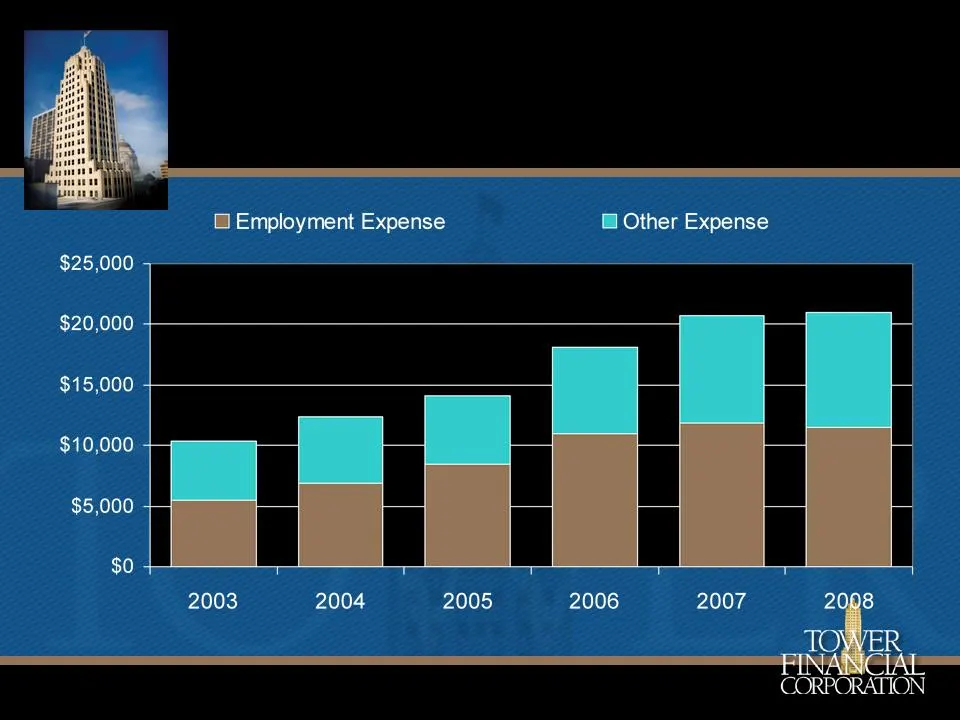
$10,353 $12,400 $14,082 $18,089 $20,731 $20,988 53% 55% 60% 60% 57% 55% Operating Expenses

Slide 31: CORPORATION
CORPORATION

Slide 32: Tower's Value Proposition
Tower’s Value Proposition • Deposit market share/efficiency $2.58 - $7.73/share • Unvalued Trust subsidiary $1.35 - $2.25/share • Price to book versus peers $10.30 - $12.13/share • Unvalued HSA business platform $??/share TOFC Market Price = $5.54 as of 2/16/09

Slide 33: Thank You
Midwest 2009 Super Community Bank Conference Thank You
Source: SEC EDGAR · 8-K filed Feb 24, 2009