Sembcorp Industries Ltd. · SGX:U96
Sembcorp Industries — 9M2012 Earnings Presentation
17 slides from Sembcorp Industries's earnings presentation, Nov 9, 2012
Slide 1: 9M2012 Results Announcement
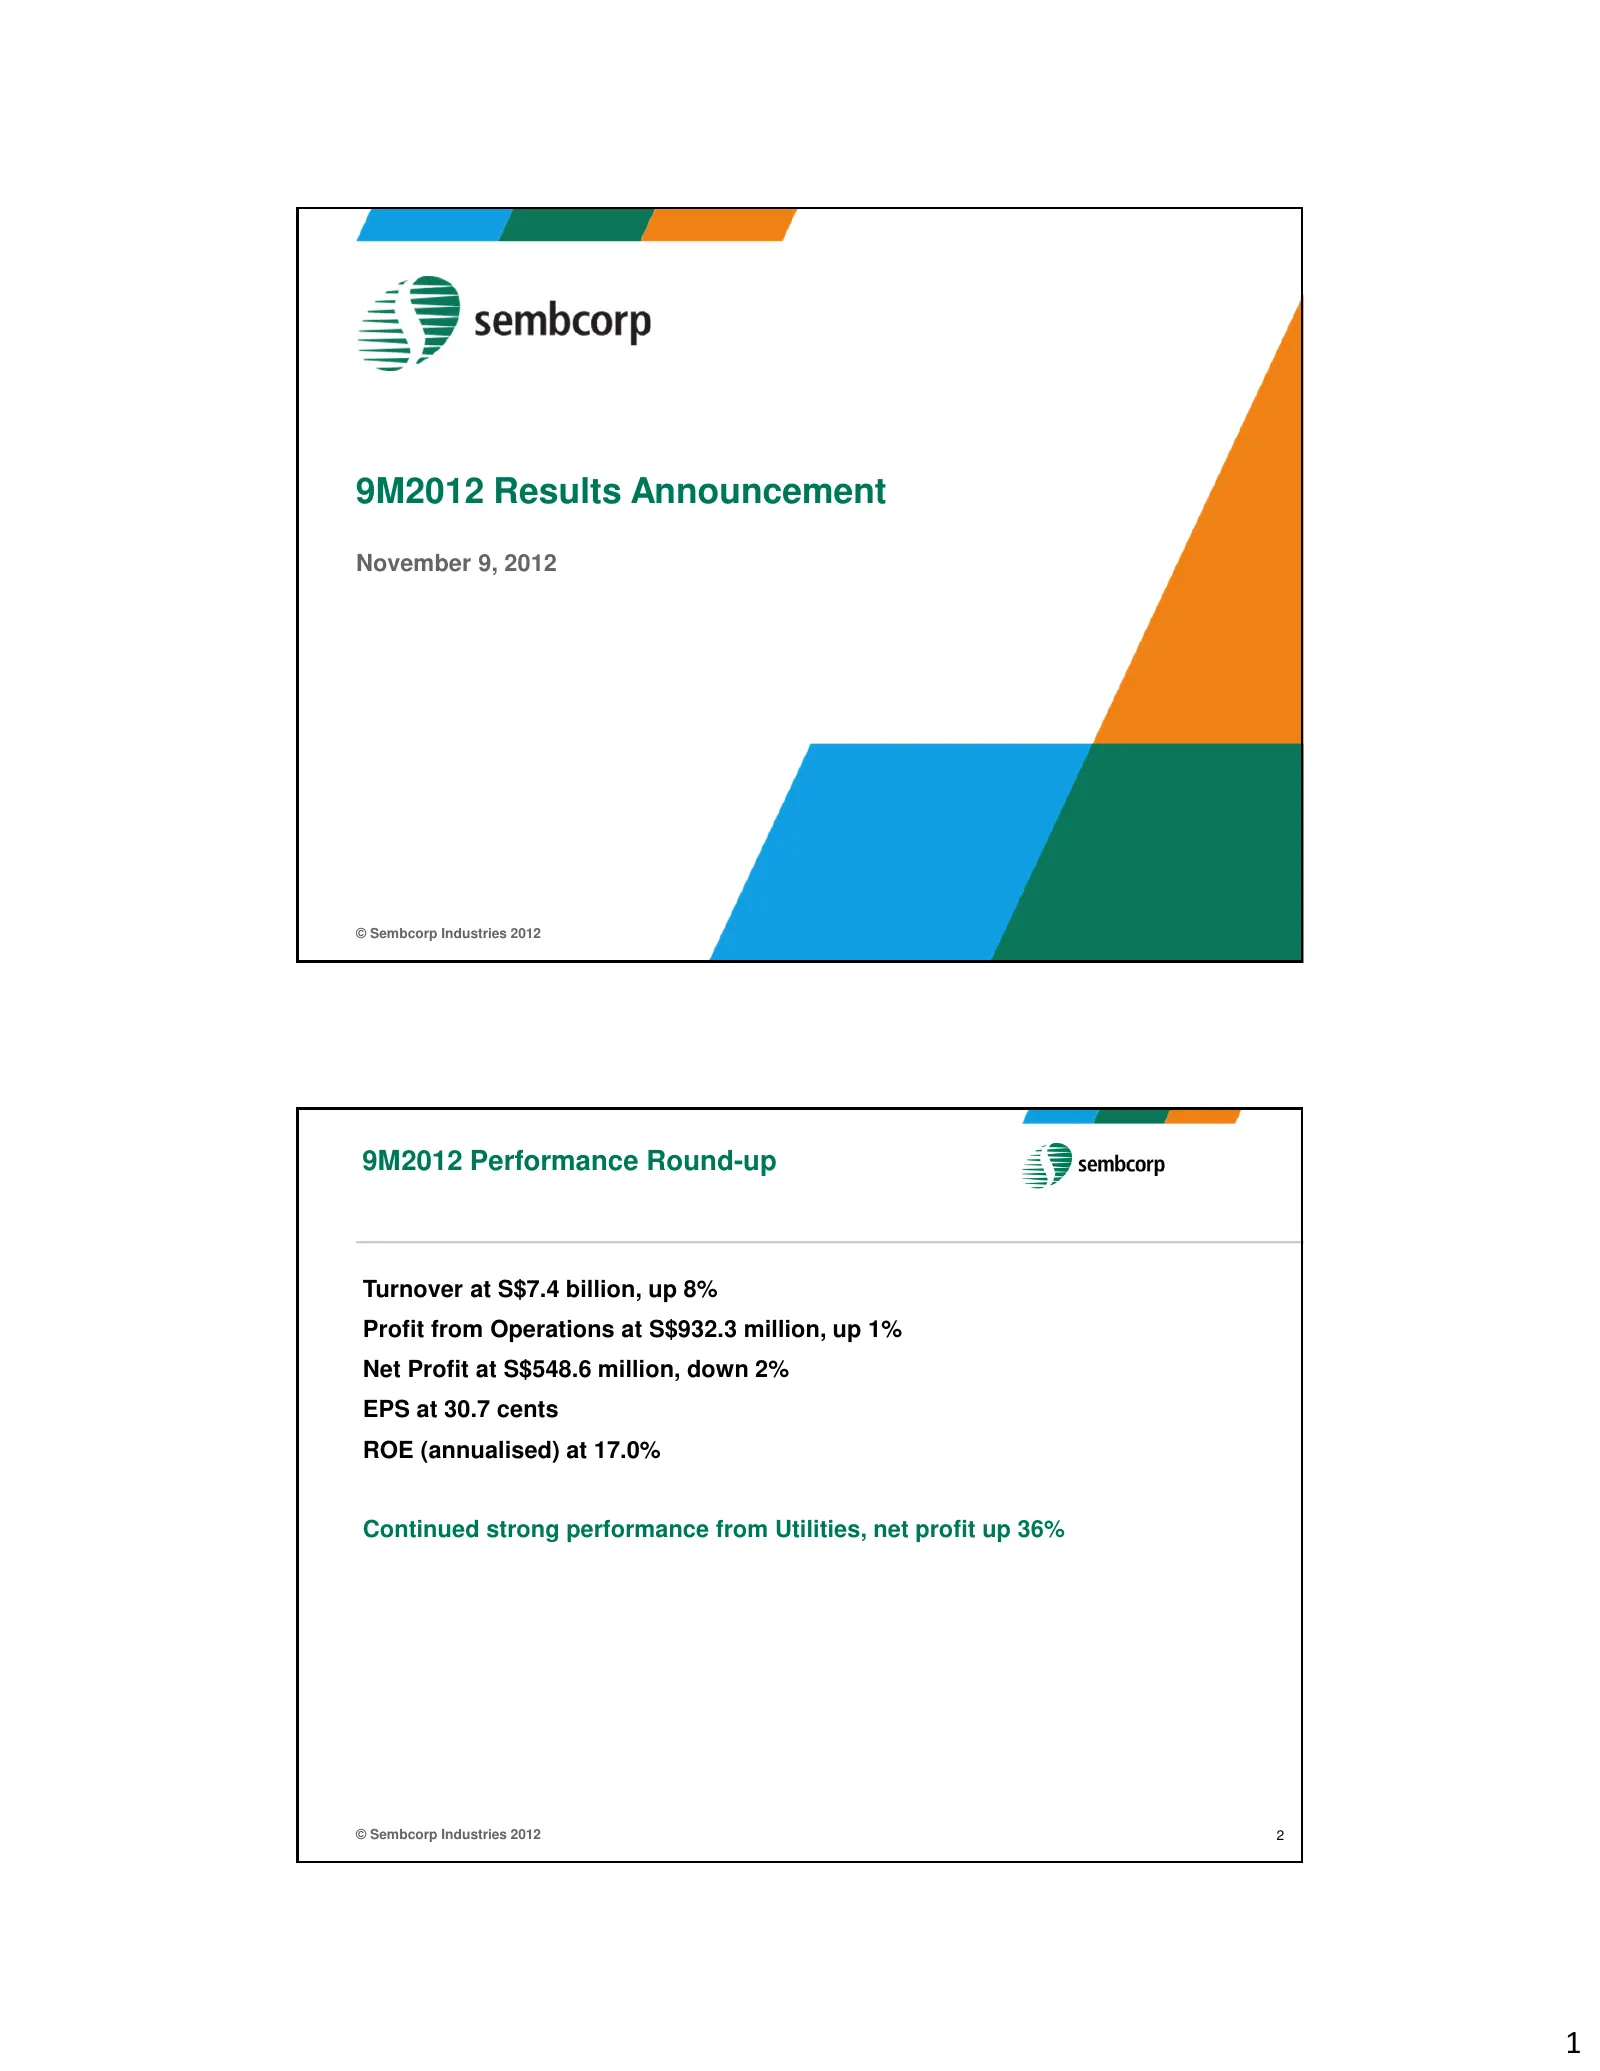
9M2012 Results Announcement November 9, 2012 © Sembcorp Industries 2012 9M2012 Performance Round-up Turnover at S$7.4 billion, up 8% Profit from Operations at S$932.3 million, up 1% Net Profit at S$548.6 million, down 2% EPS at 30.7 cents ROE (annualised) at 17.0% Continued strong performance from U
Slide 2: Group Net Profit Mix; Utilities
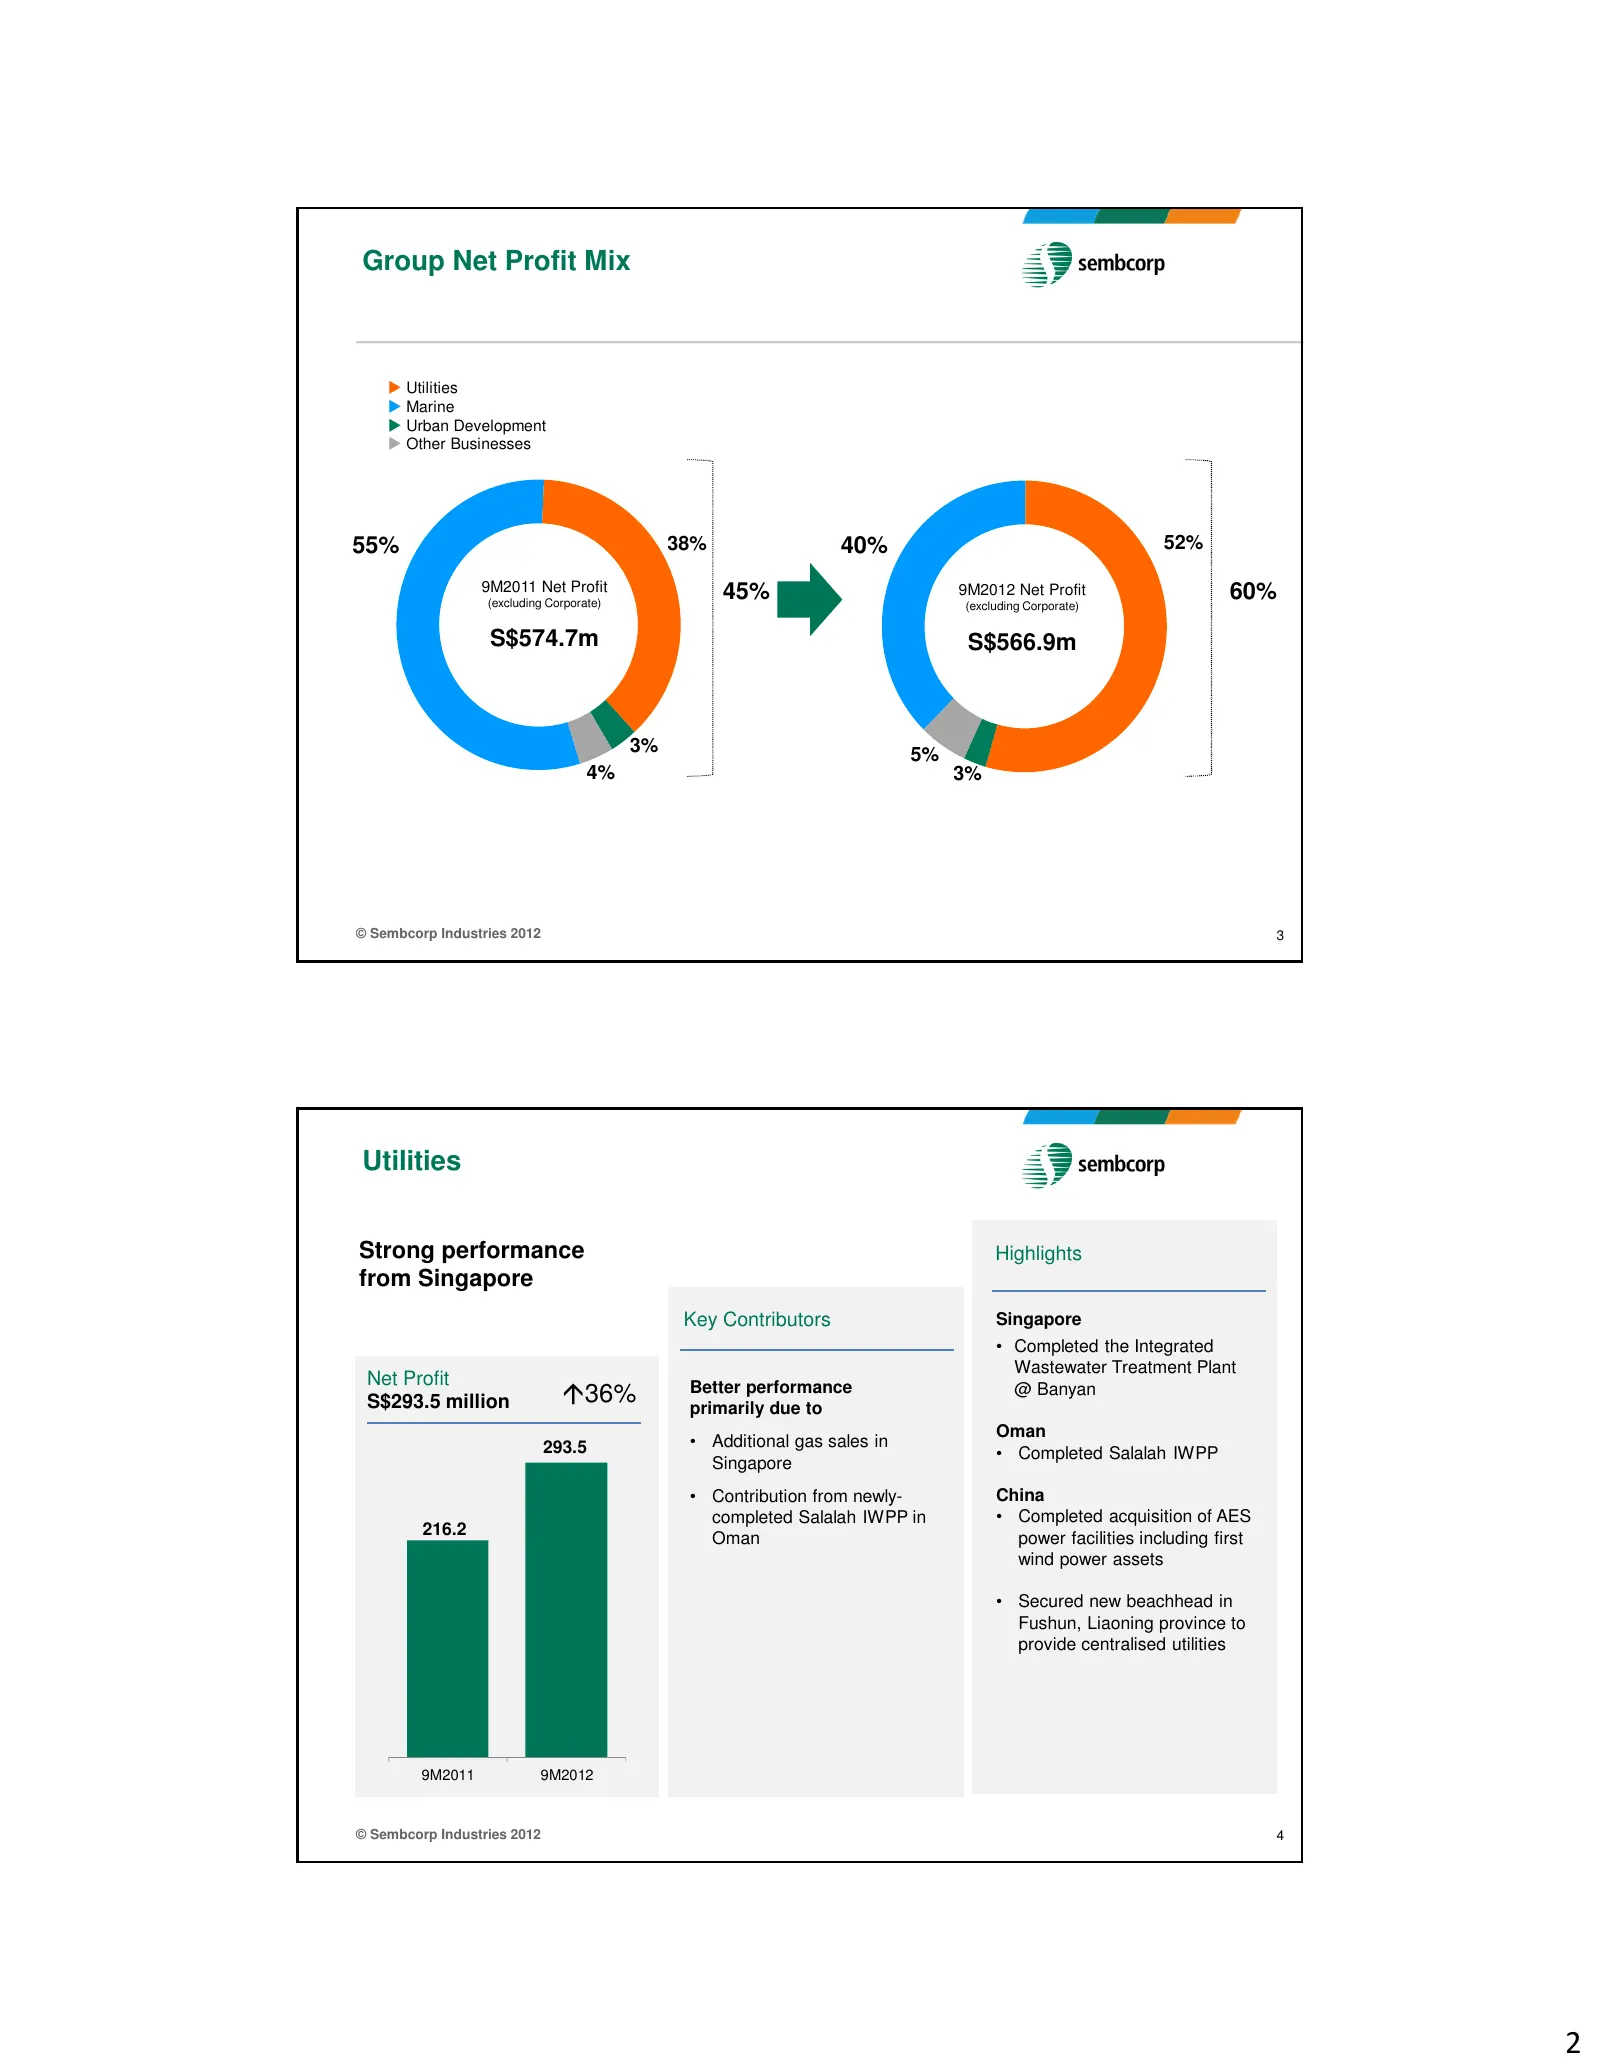
Group Net Profit Mix Utilities Marine Urban Development Other Businesses 55% 38% 40% 52% 9M2011 Net Profit 45% 9M2012 Net Profit 60% (excluding Corporate) (excluding Corporate) S$574.7m S$566.9m 3% 5% 4% 3% © Sembcorp Industries 2012 3 Utilities Strong performance Highlights from Singapore Key Contr
Slide 3: Marine; Urban Development
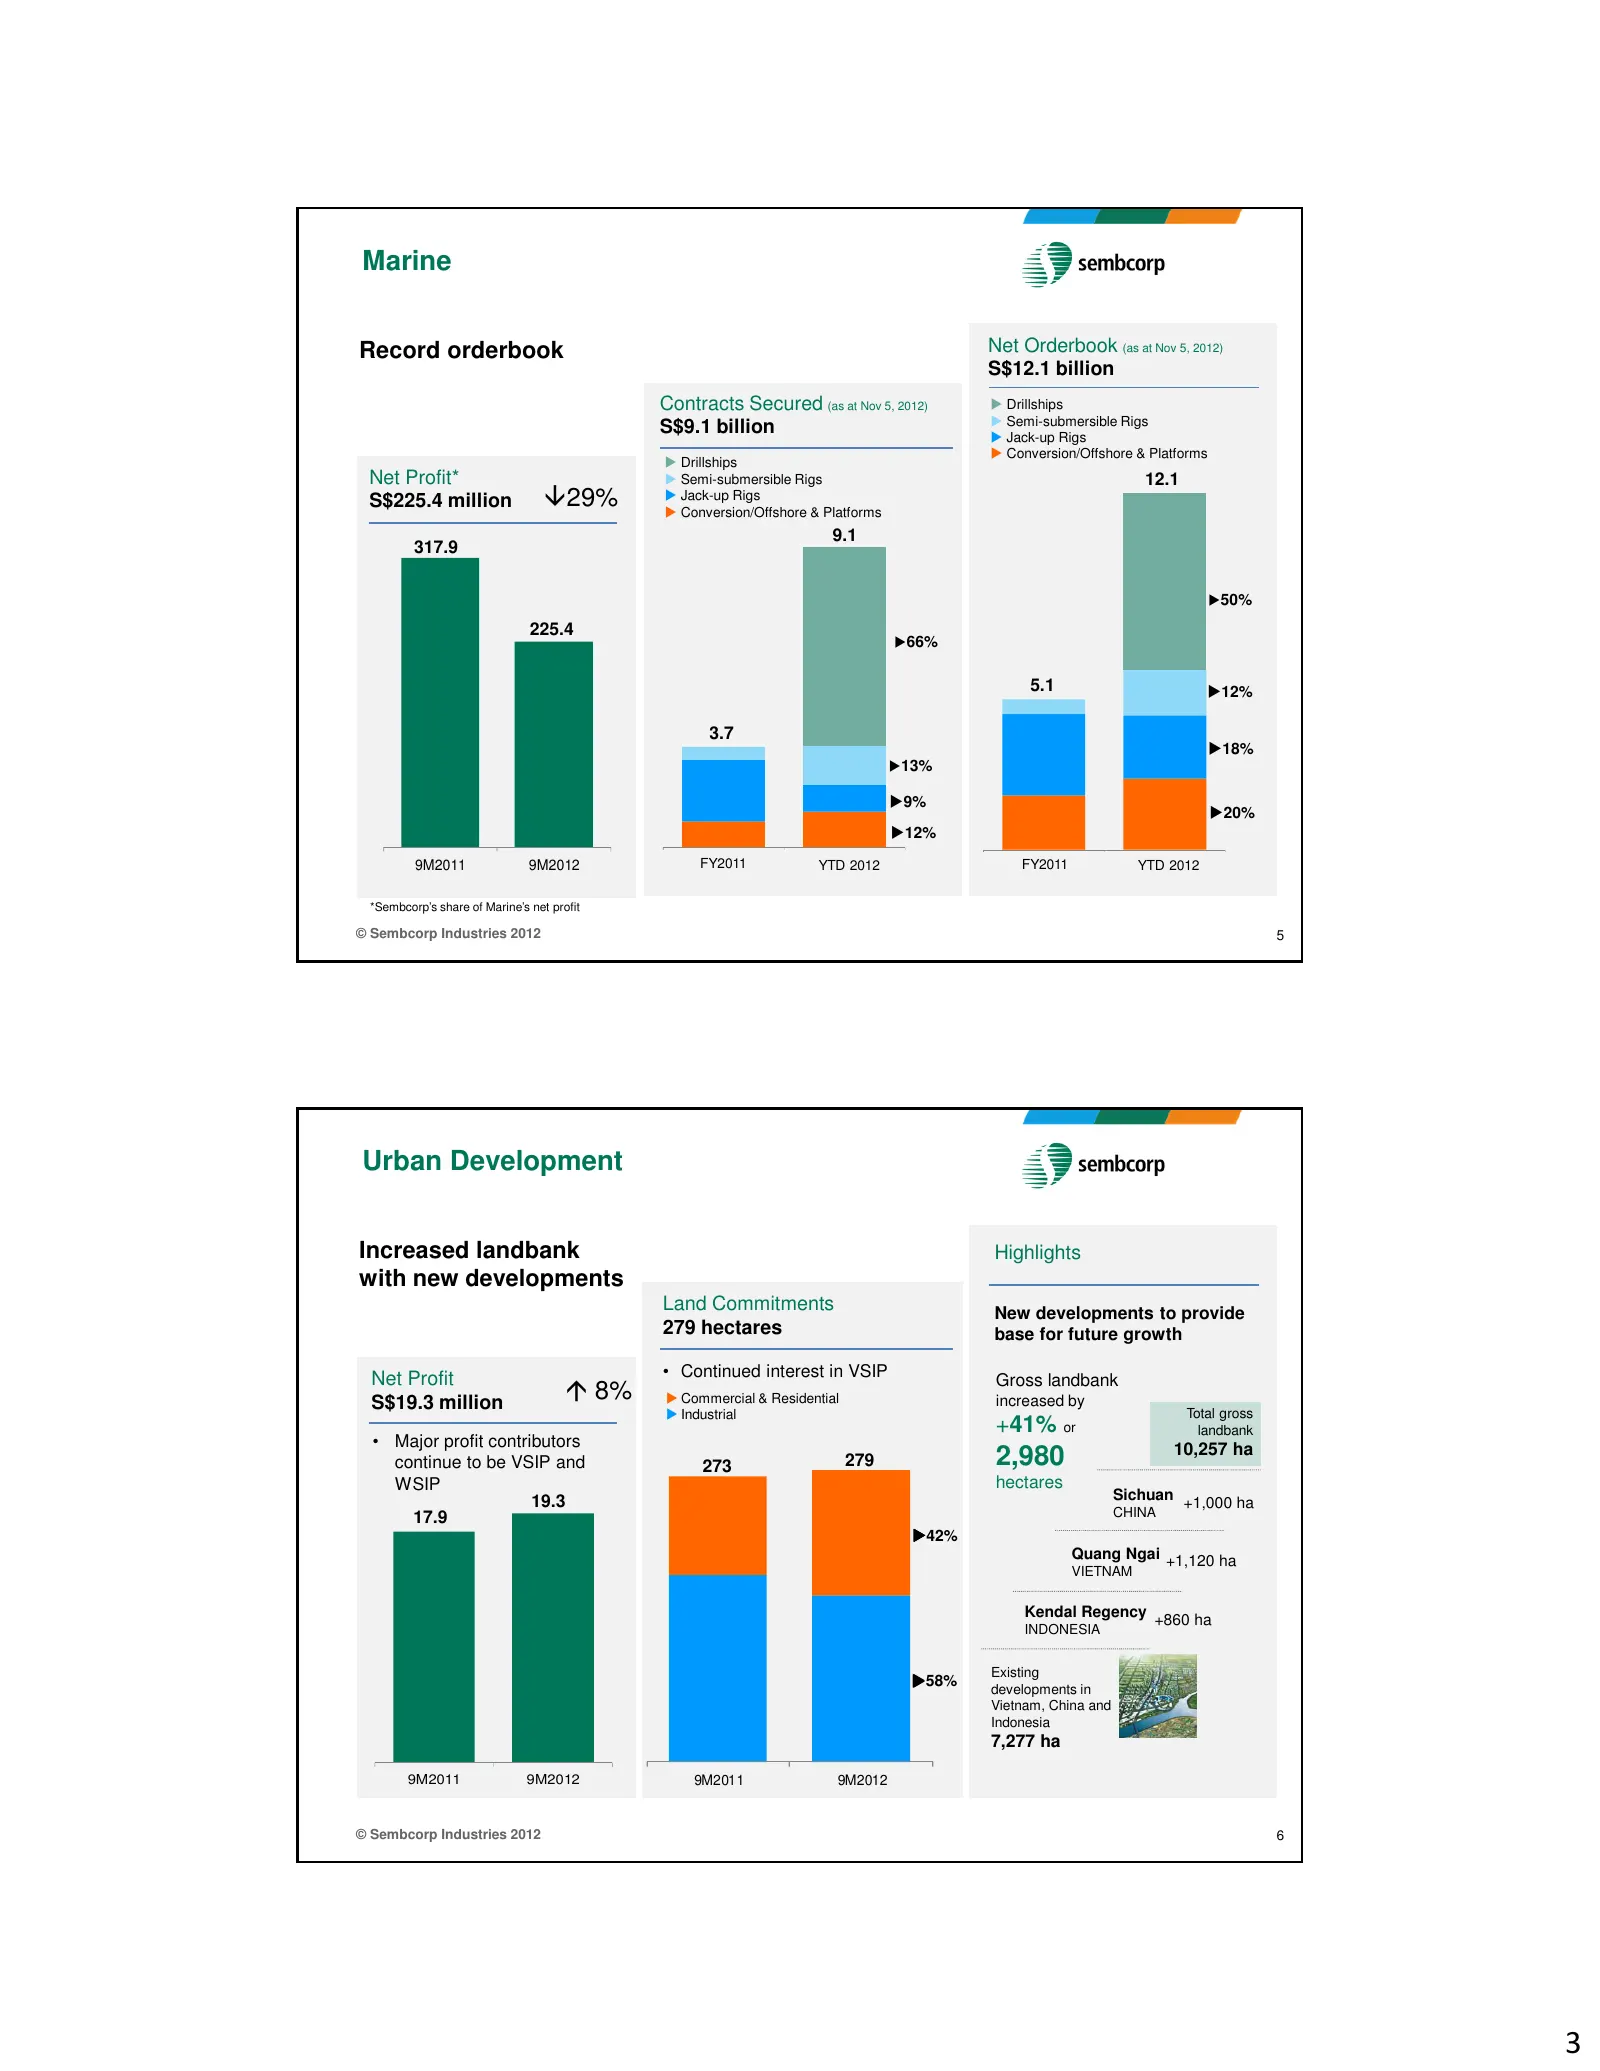
Marine Record orderbook Net Orderbook (as at Nov 5, 2012) S$12.1 billion Contracts Secured (as at Nov 5, 2012) Drillships Semi-submersible Rigs S$9.1 billion Jack-up Rigs Conversion/Offshore & Platforms Drillships Net Profit* Semi-submersible Rigs 12.1 S$225.4 million 29% Jack-up Rigs Conversion/Off
Slide 4: Financial Review
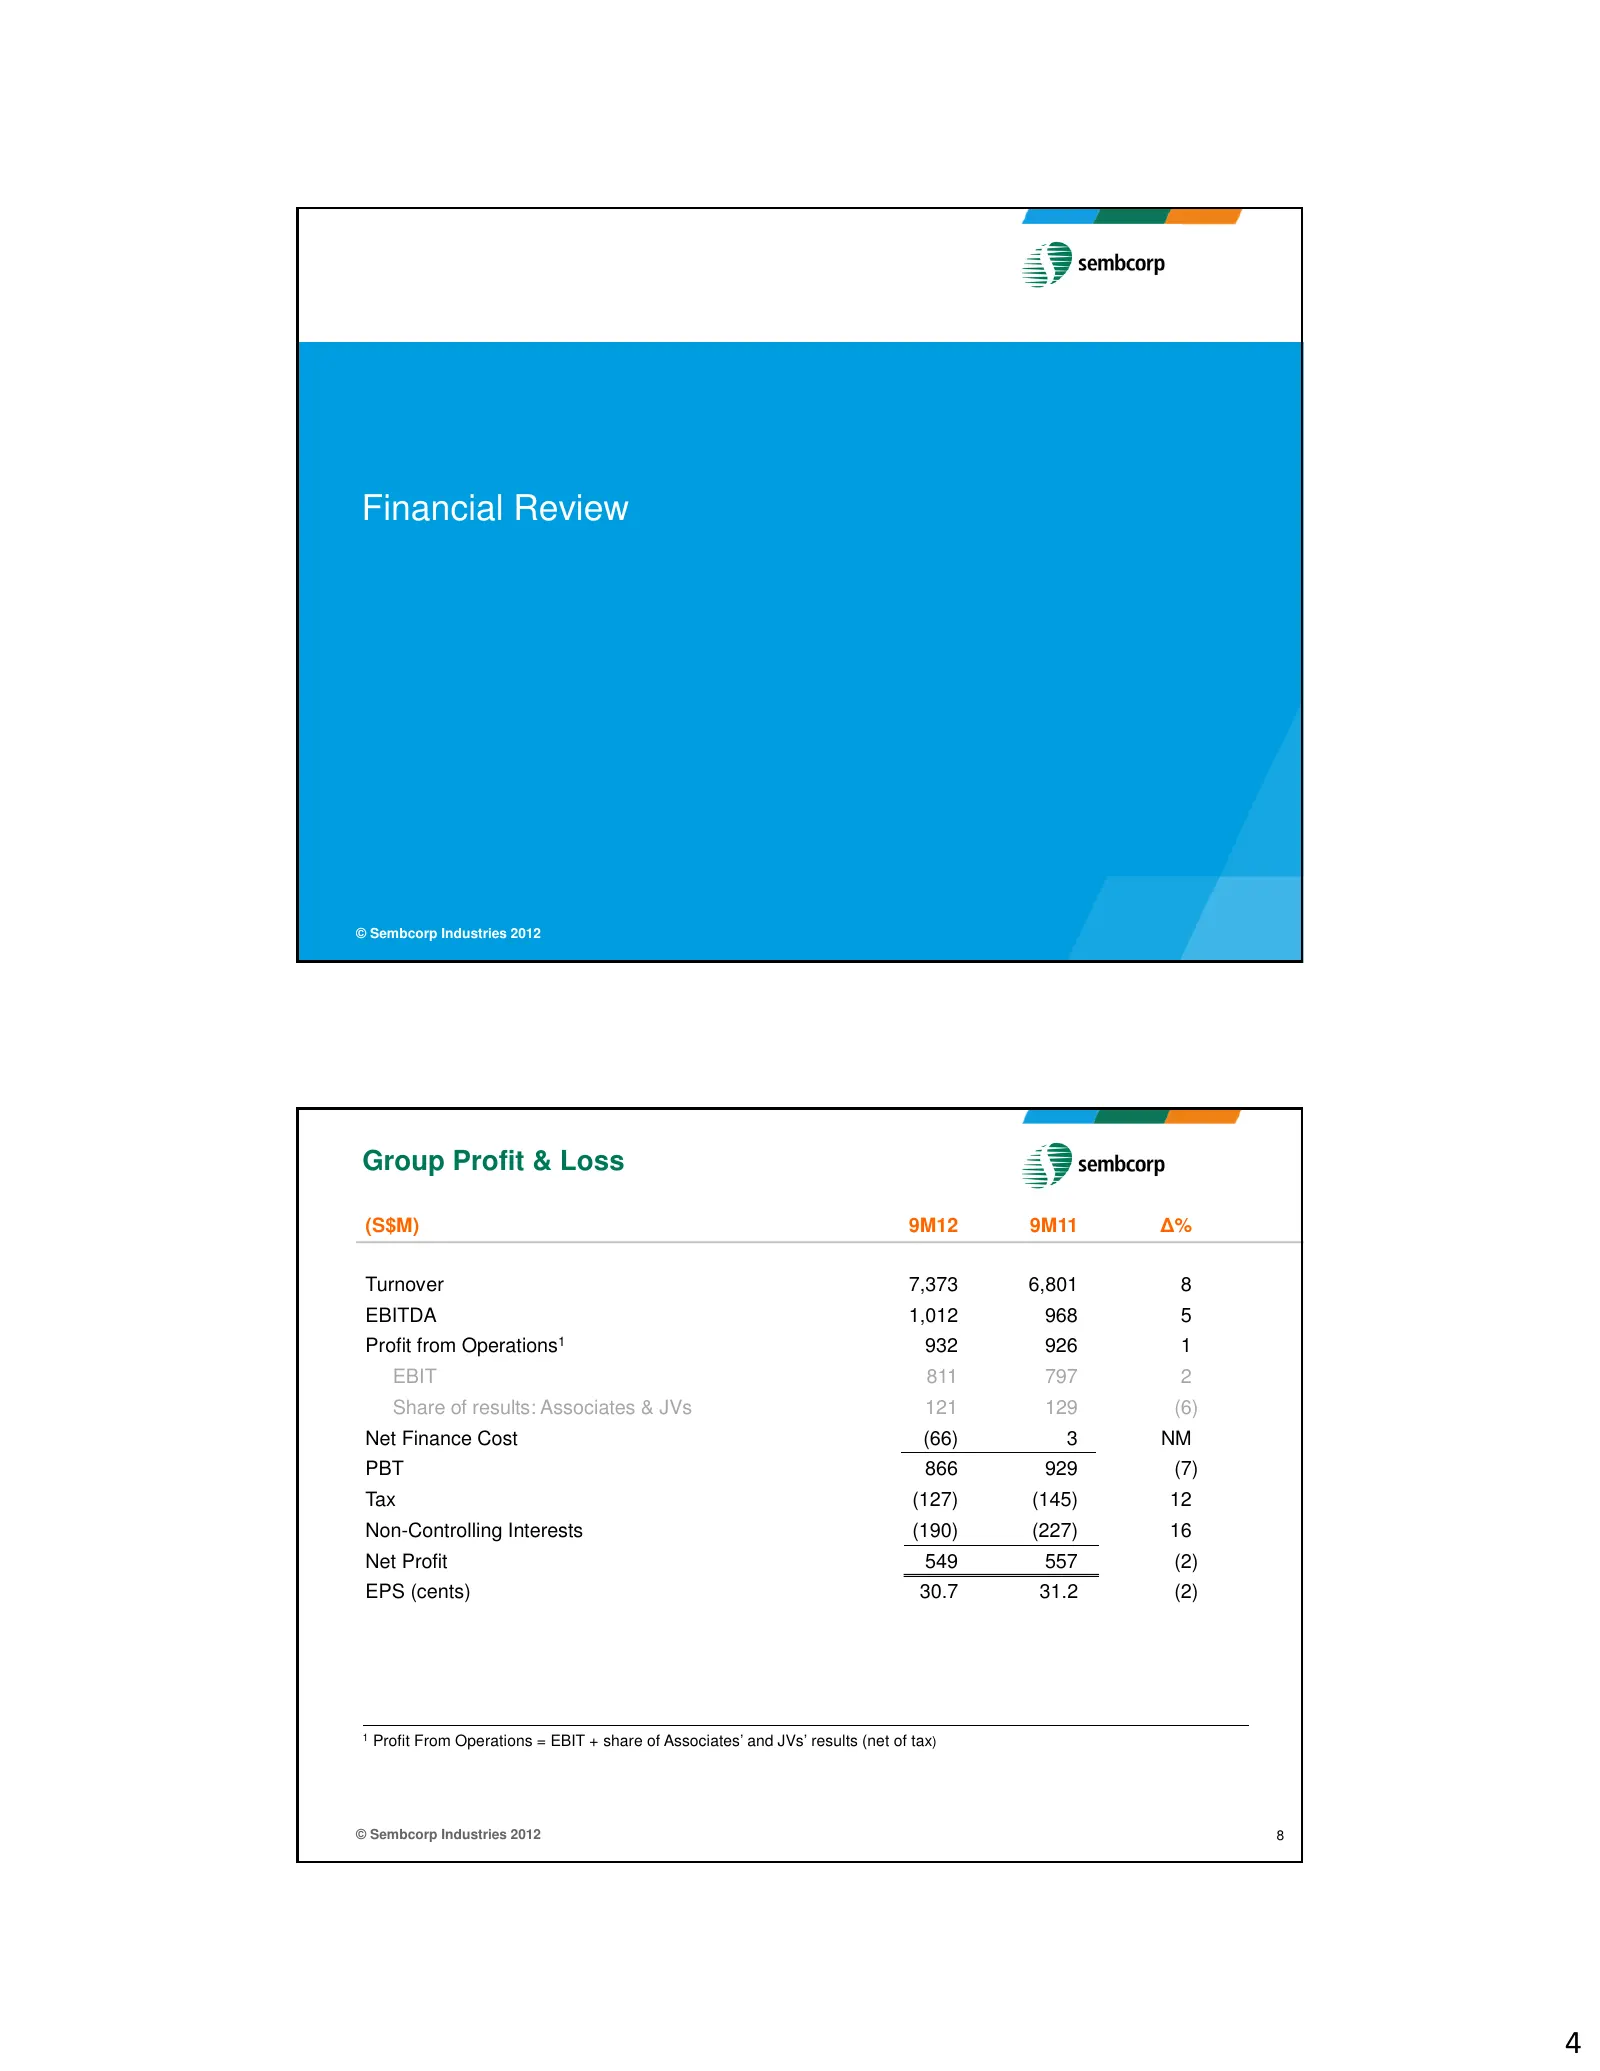
Financial Review © Sembcorp Industries 2012 Group Profit & Loss (S$M) 9M12 9M11 ∆% Turnover 7,373 6,801 8 EBITDA 1,012 968 5 Profit from Operations1 932 926 1 EBIT 811 797 2 Share of results: Associates & JVs 121 129 (6) Net Finance Cost (66) 3 NM PBT 866 929 (7) Tax (127) (145) 12 Non-Controlling I
Slide 5: Group Turnover; Group Profit from Operations
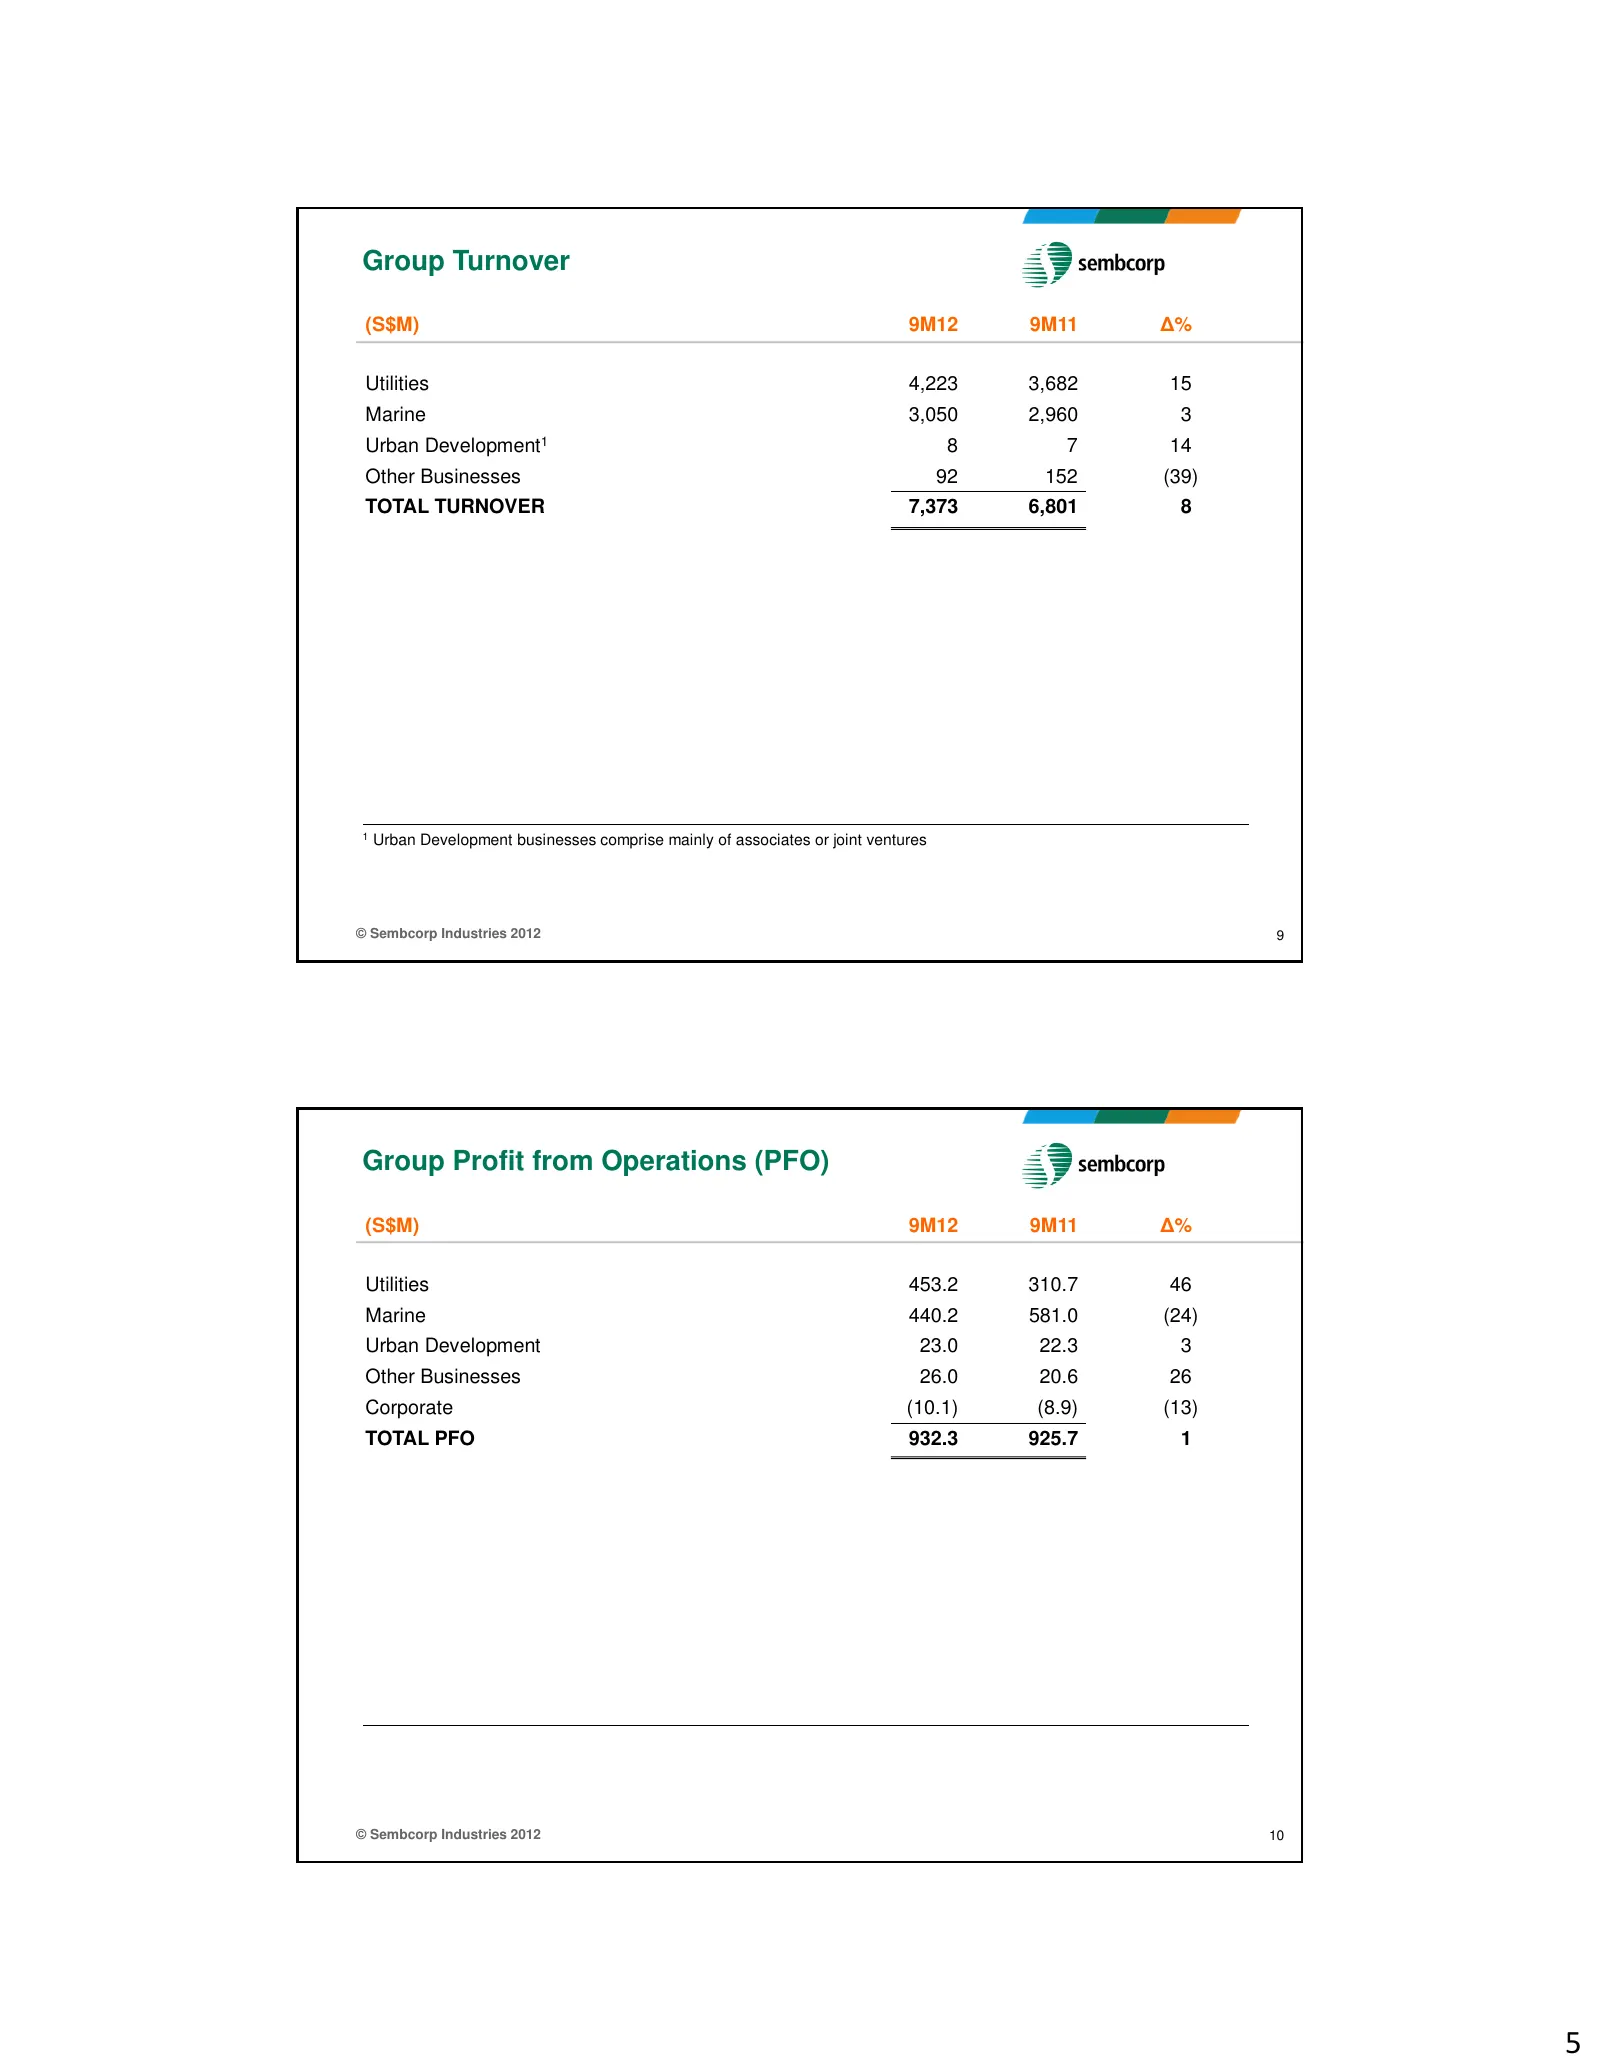
Group Turnover (S$M) 9M12 9M11 ∆% Utilities 4,223 3,682 15 Marine 3,050 2,960 3 Urban Development1 8 7 14 Other Businesses 92 152 (39) TOTAL TURNOVER 7,373 6,801 8 1 Urban Development businesses comprise mainly of associates or joint ventures © Sembcorp Industries 2012 9 Group Profit from Operations
Slide 6: Group Net Profit; Utilities Net Profit
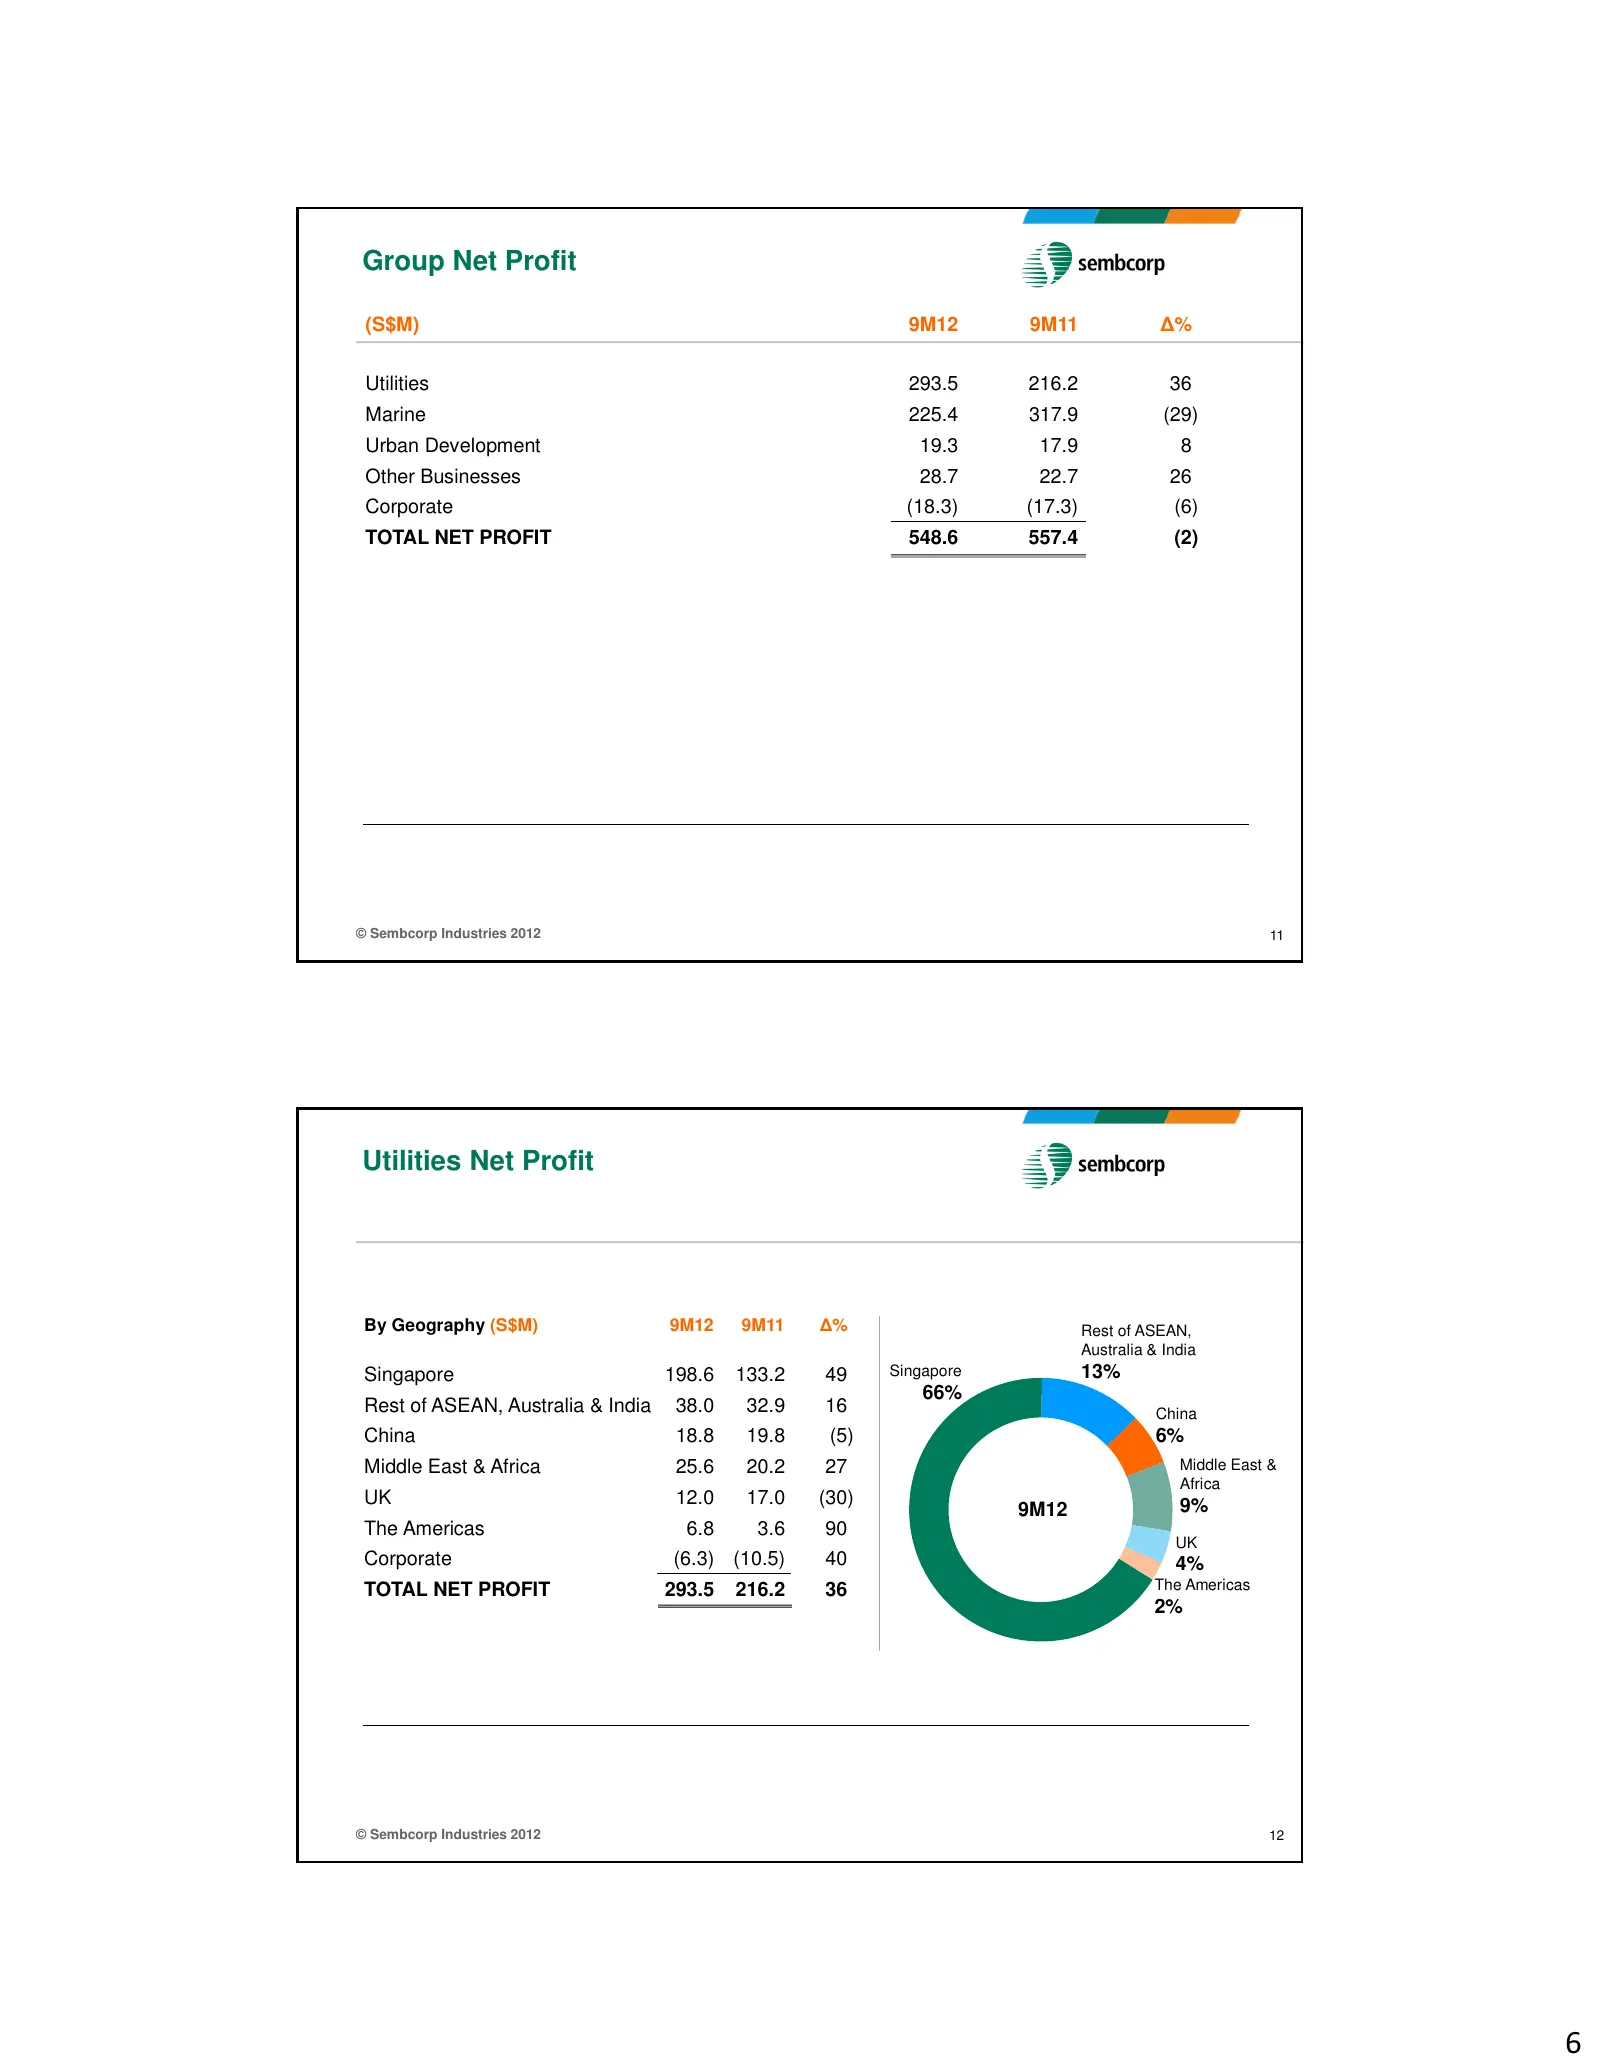
Group Net Profit (S$M) 9M12 9M11 ∆% Utilities 293.5 216.2 36 Marine 225.4 317.9 (29) Urban Development 19.3 17.9 8 Other Businesses 28.7 22.7 26 Corporate (18.3) (17.3) (6) TOTAL NET PROFIT 548.6 557.4 (2) © Sembcorp Industries 2012 11 Utilities Net Profit By Geography (S$M) 9M12 9M11 ∆% Rest of ASE
Slide 7: Utilities Net Profit; Group Capex and Equity Investment
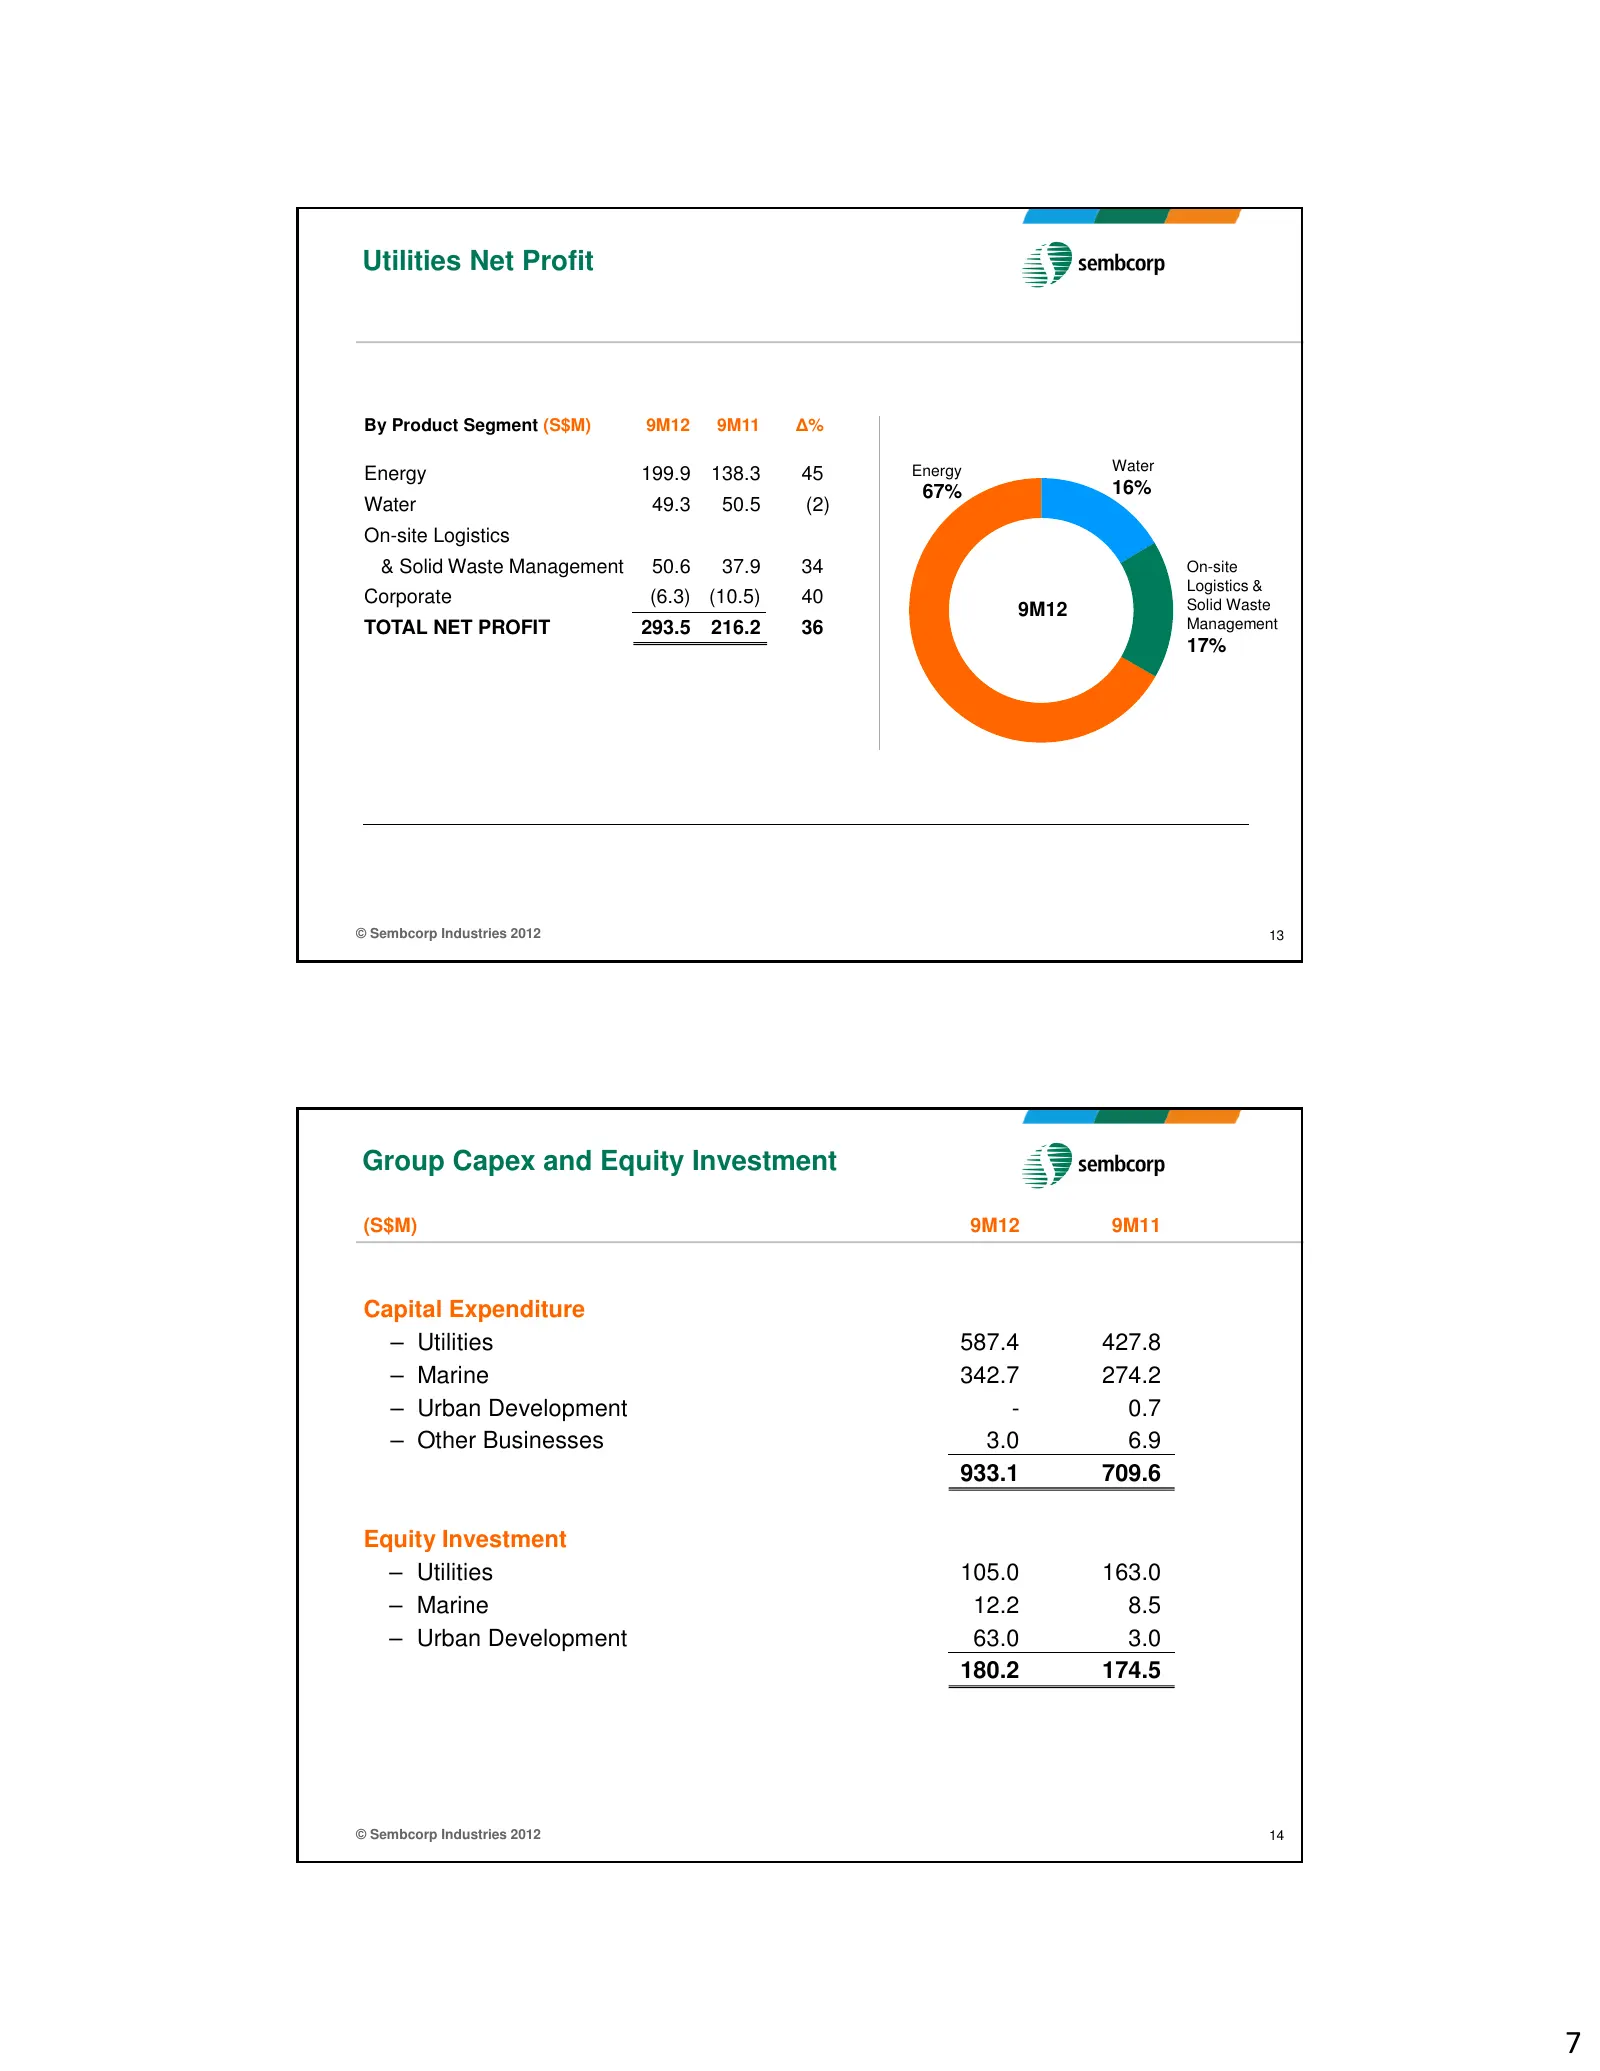
Utilities Net Profit By Product Segment (S$M) 9M12 9M11 ∆% Energy Water Energy 199.9 138.3 45 67% 16% Water 49.3 50.5 (2) On-site Logistics & Solid Waste Management 50.6 37.9 34 On-site Logistics & Corporate (6.3) (10.5) 40 Solid Waste 9M12 TOTAL NET PROFIT 293.5 216.2 36 Management 17% © Sembcorp I
Slide 8: Free Cash Flow; Group Borrowings
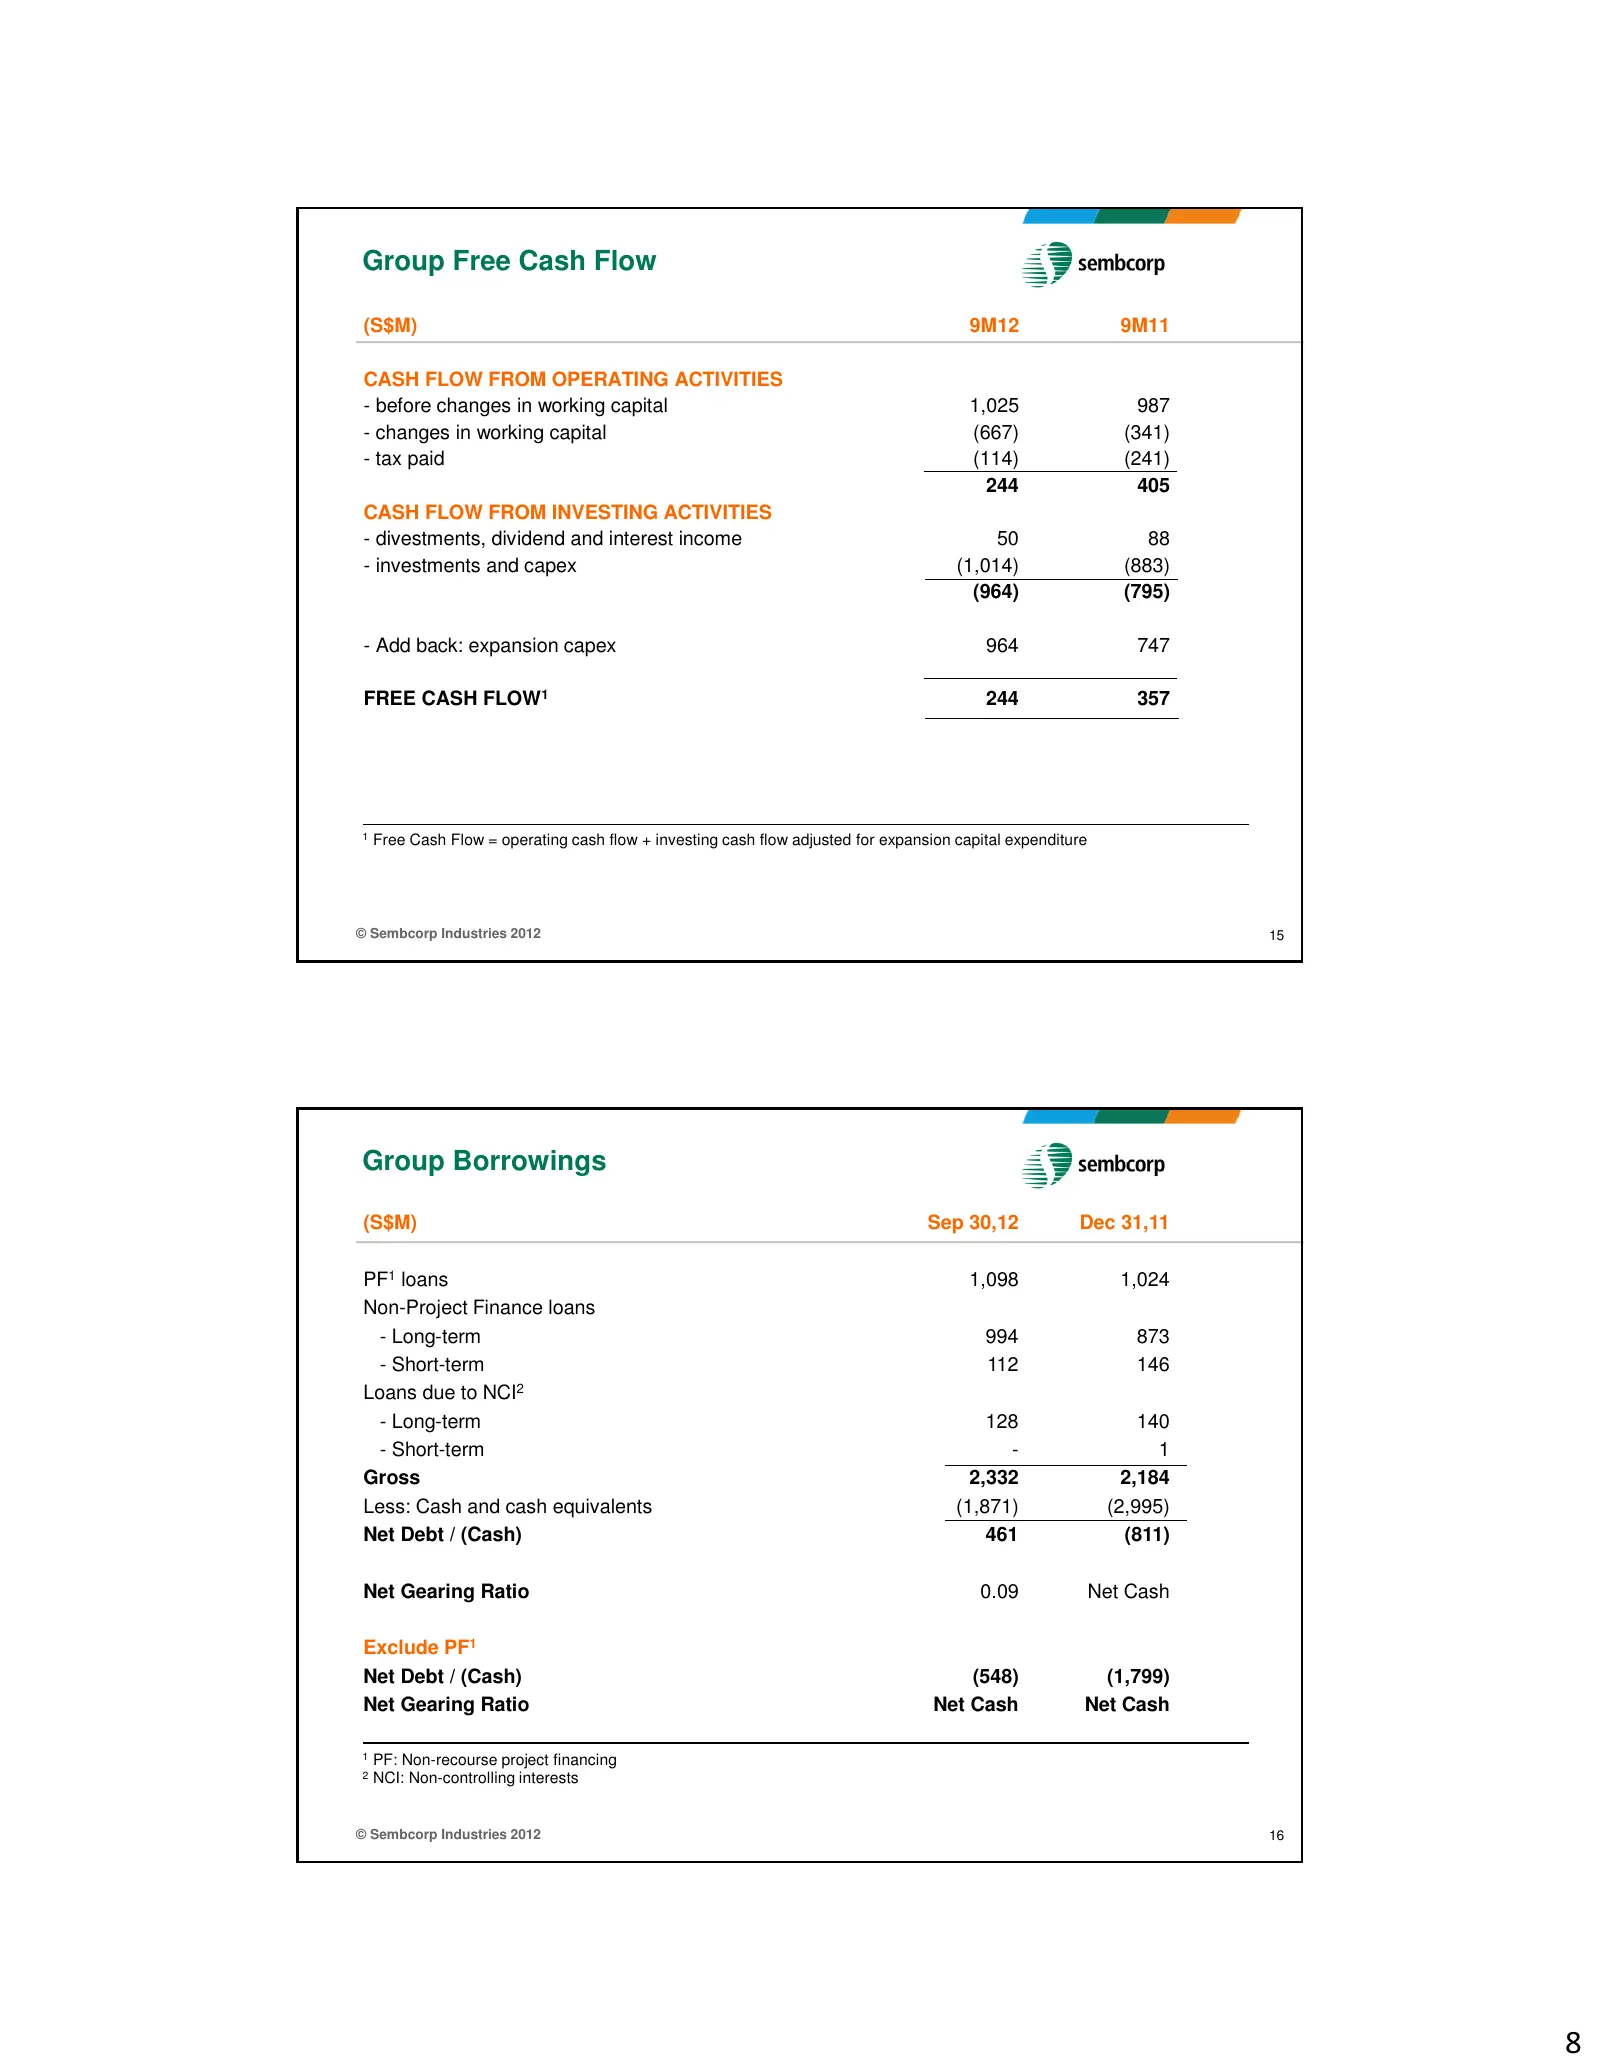
Group Free Cash Flow (S$M) 9M12 9M11 CASH FLOW FROM OPERATING ACTIVITIES - before changes in working capital 1,025 987 - changes in working capital (667) (341) - tax paid (114) (241) 244 405 CASH FLOW FROM INVESTING ACTIVITIES - divestments, dividend and interest income 50 88 - investments and capex
Slide 9: Group Borrowings; Financial Indicators
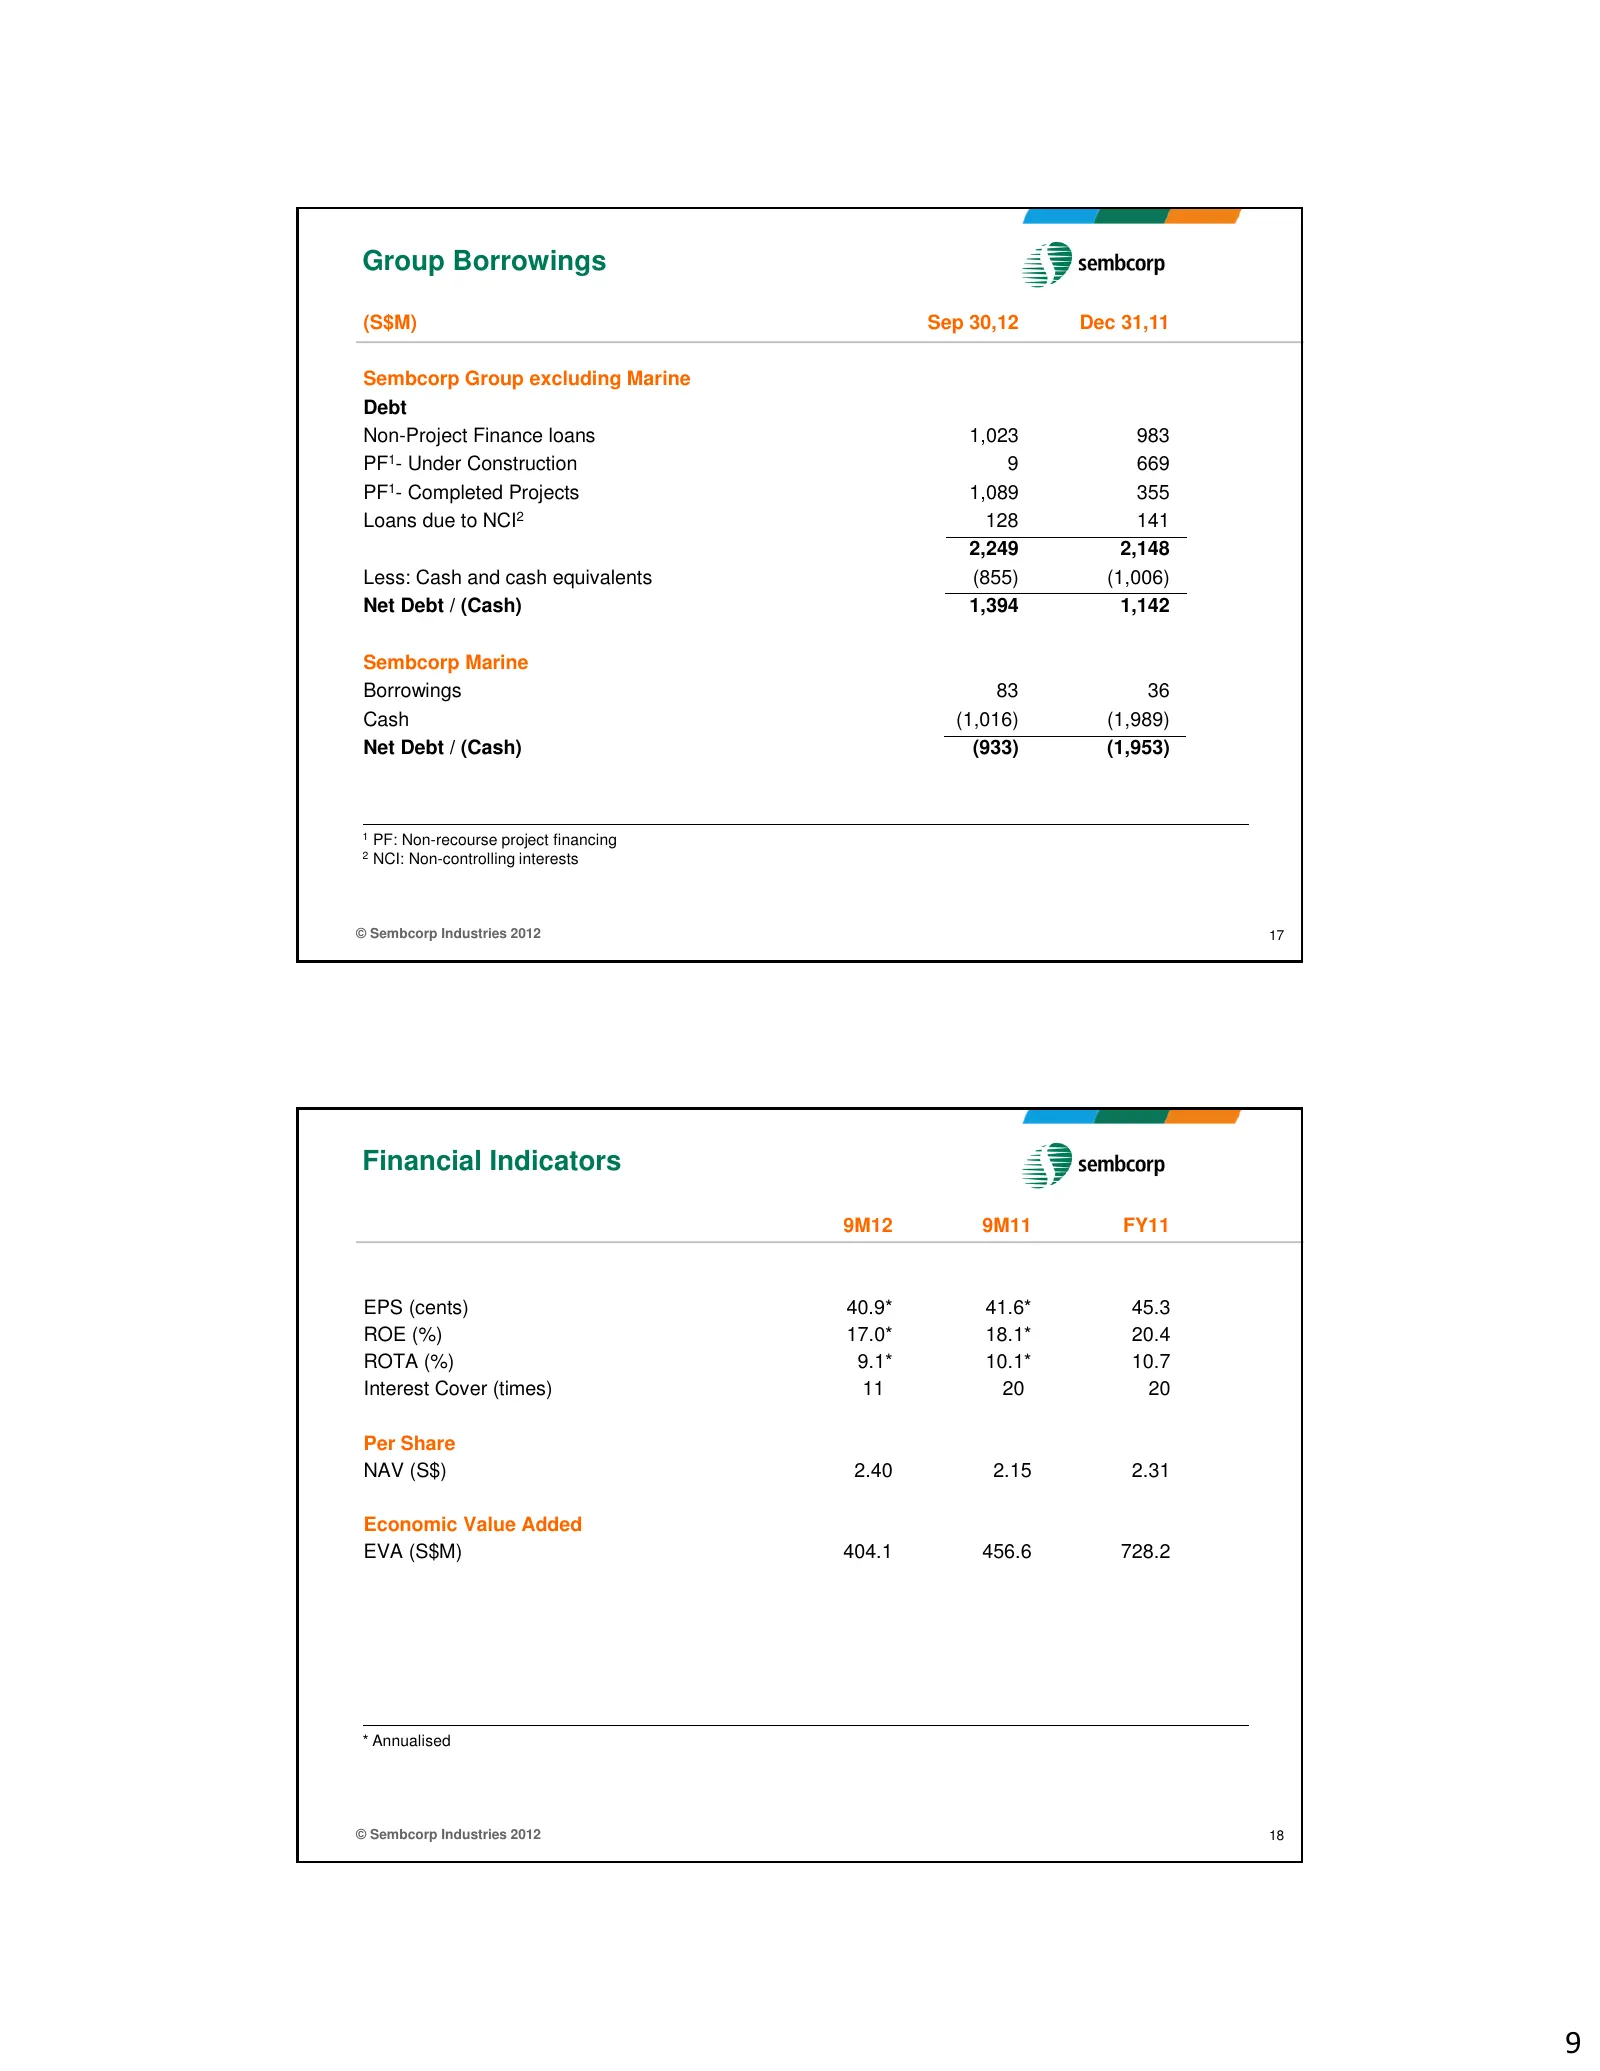
Group Borrowings (S$M) Sep 30,12 Dec 31,11 Sembcorp Group excluding Marine Debt Non-Project Finance loans 1,023 983 PF1- Under Construction 9 669 PF1- Completed Projects 1,089 355 Loans due to NCI2 128 141 2,249 2,148 Less: Cash and cash equivalents (855) (1,006) Net Debt / (Cash) 1,394 1,142 Sembco
Slide 10: Group Outlook
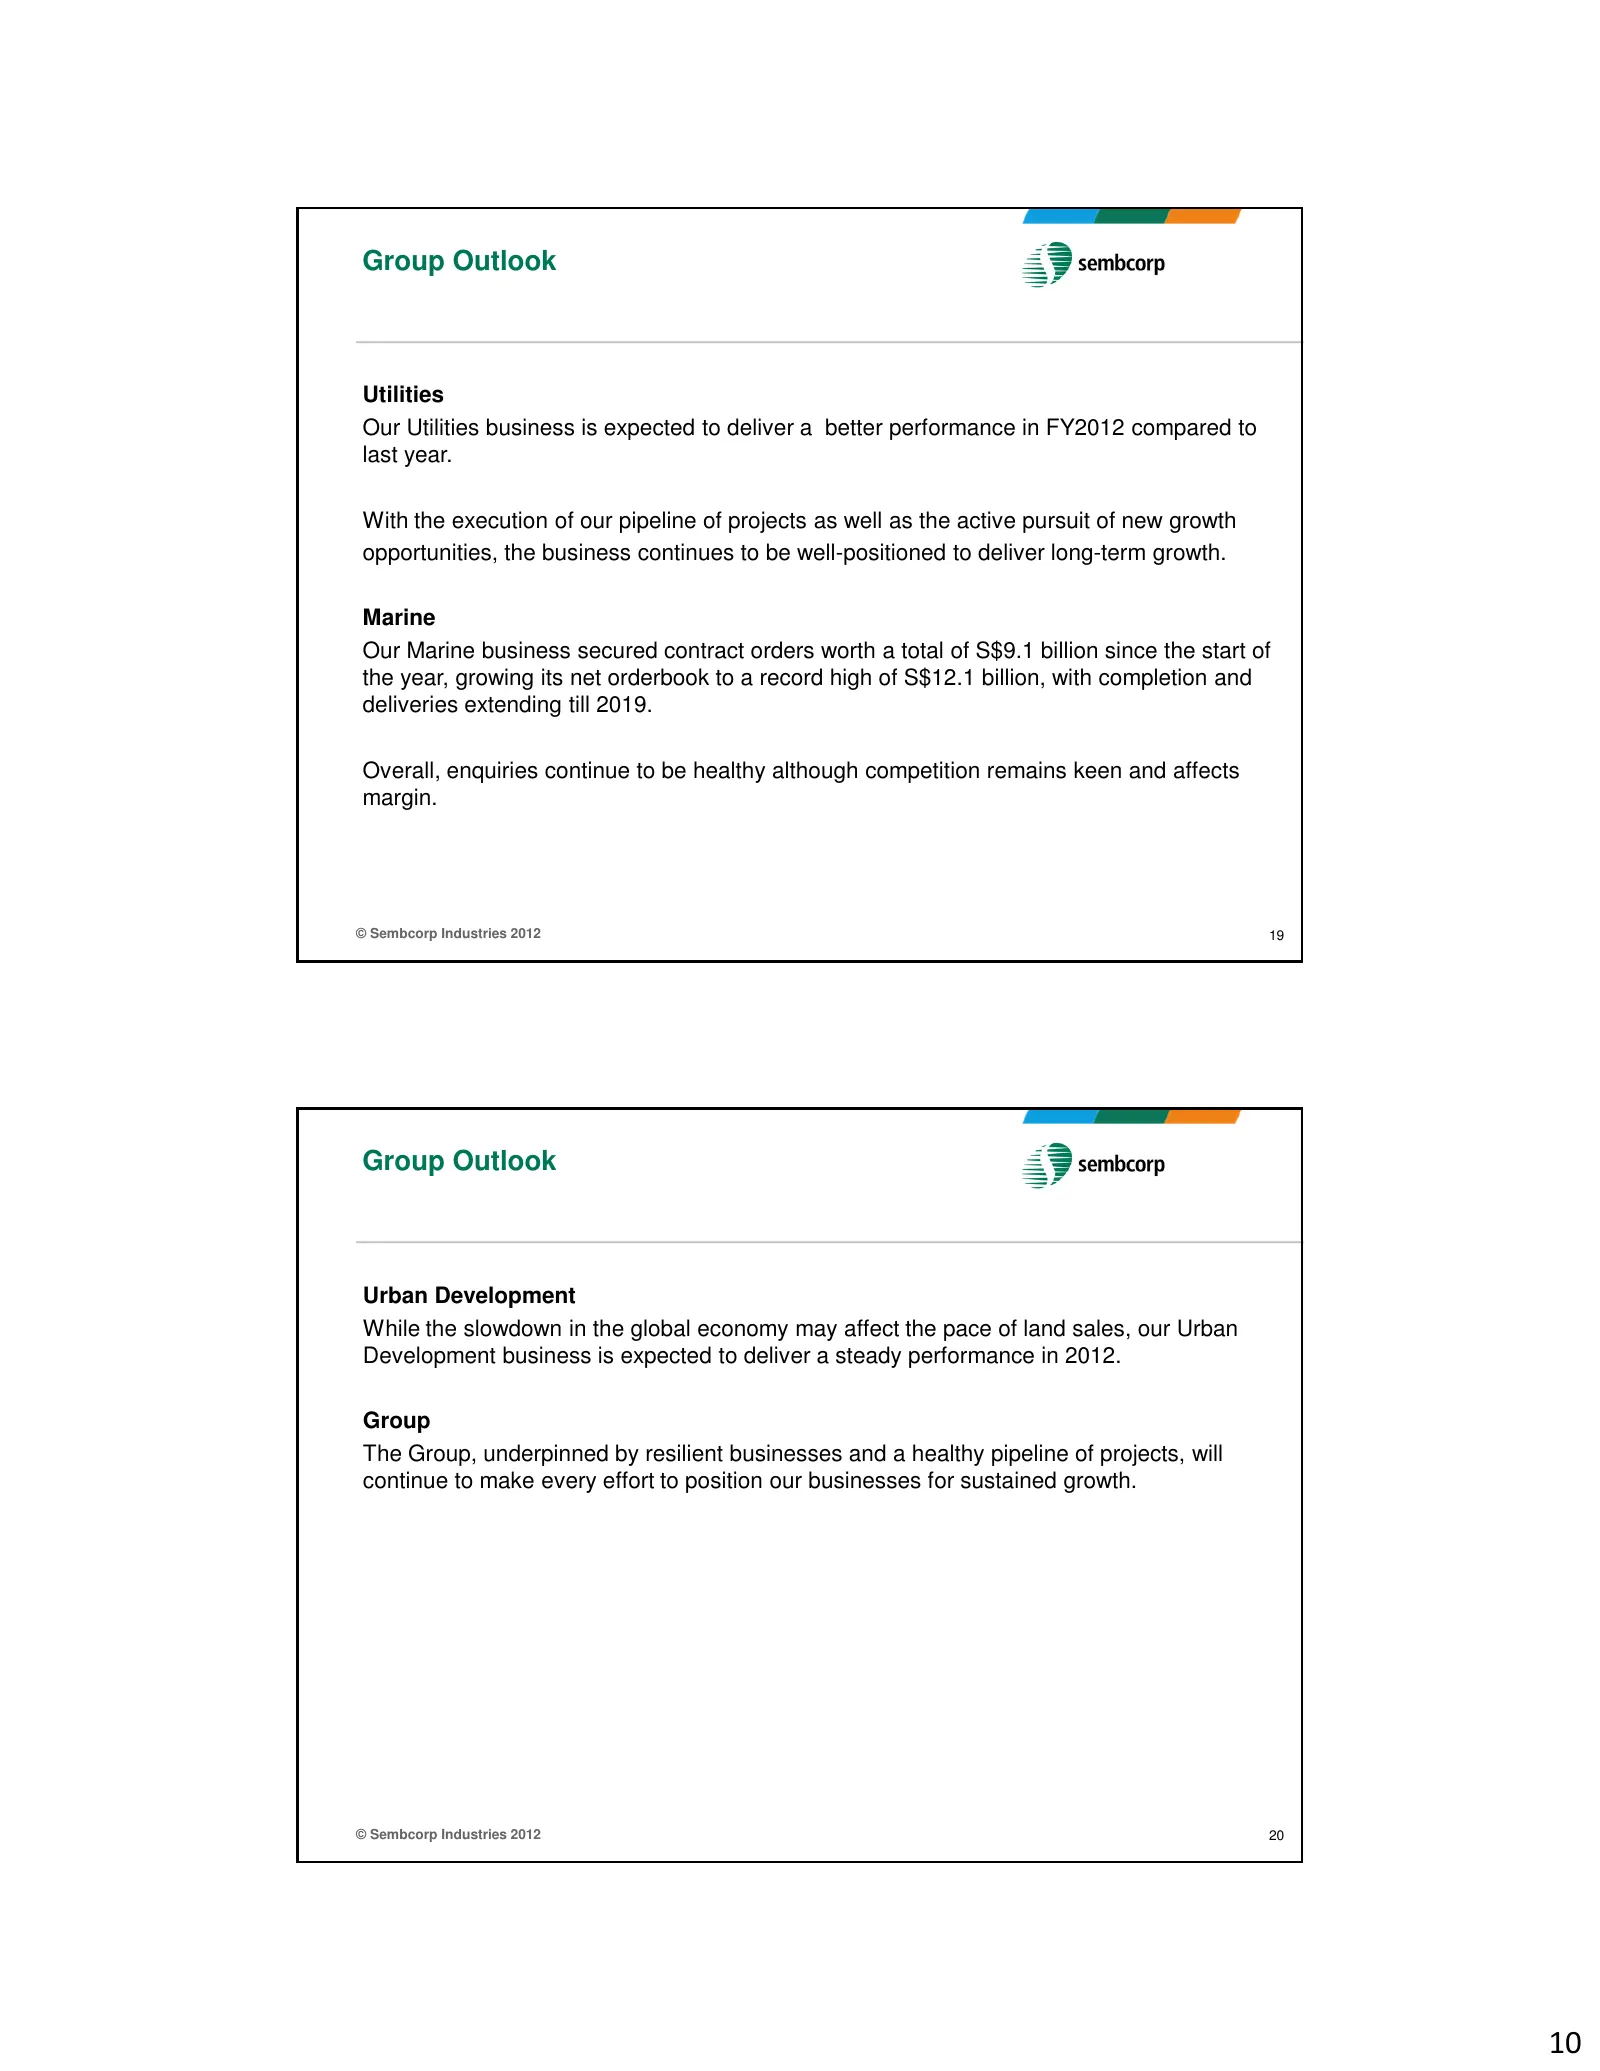
Group Outlook Utilities Our Utilities business is expected to deliver a better performance in FY2012 compared to last year. With the execution of our pipeline of projects as well as the active pursuit of new growth opportunities, the business continues to be well-positioned to deliver long-term grow
Slide 11: Disclaimer
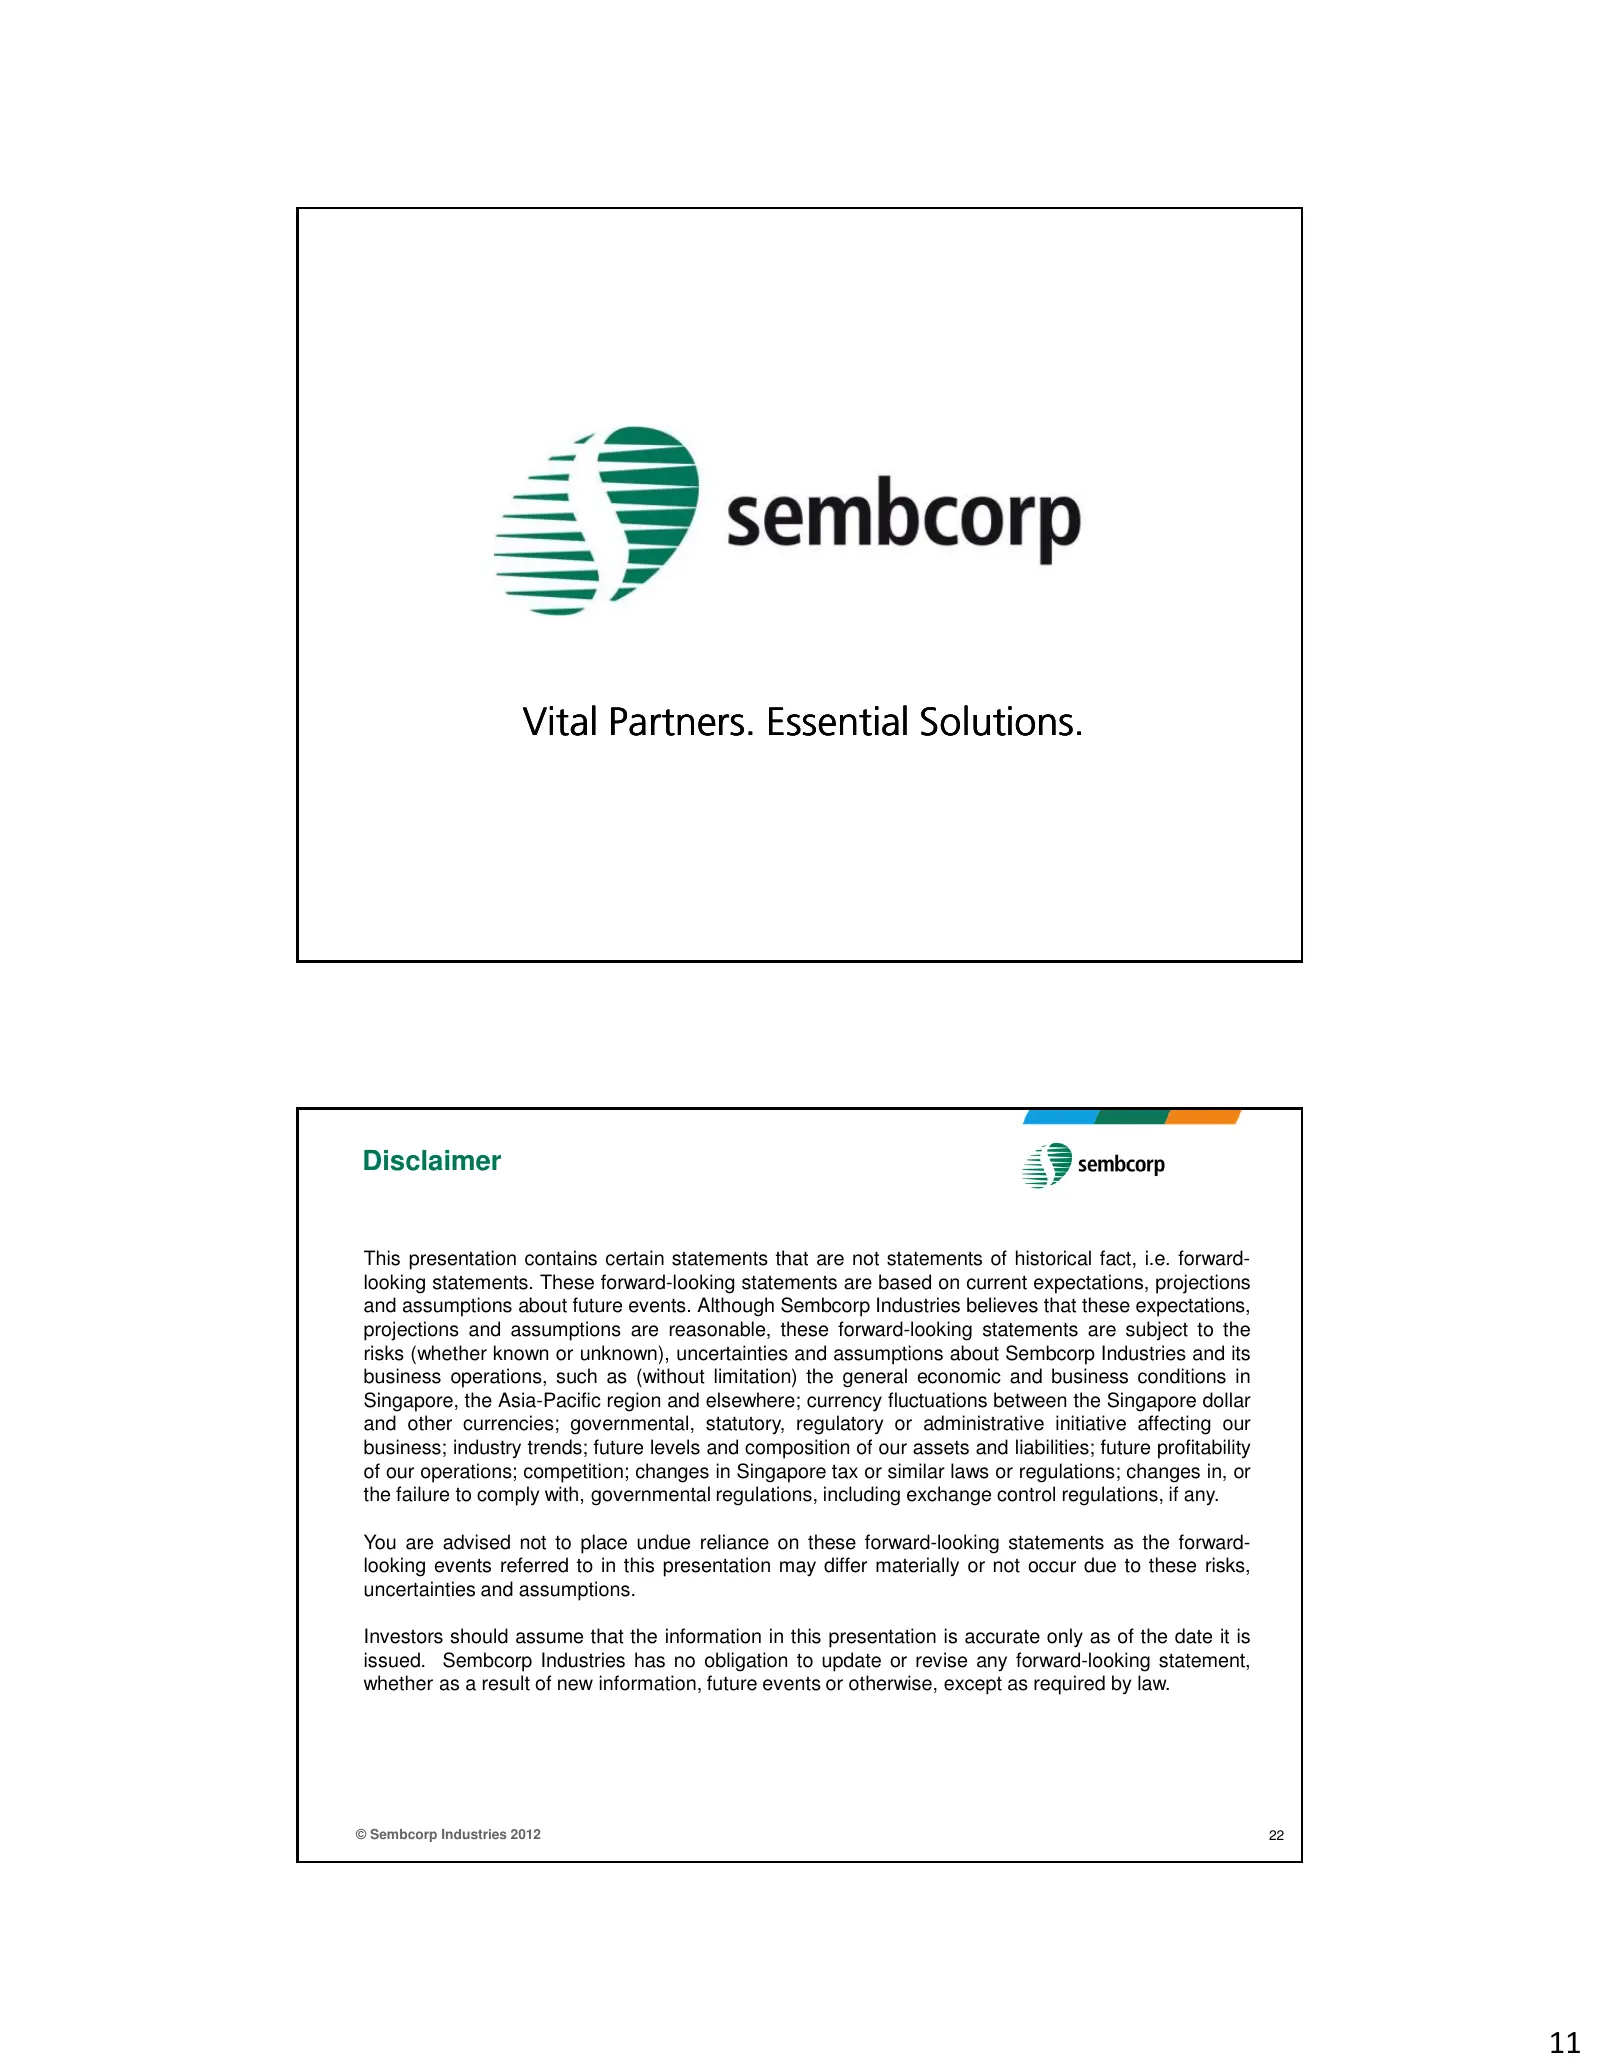
Vital Partners. Essential Solutions. Disclaimer This presentation contains certain statements that are not statements of historical fact, i.e. forward- looking statements. These forward-looking statements are based on current expectations, projections and assumptions about future events. Although Se
Slide 12: Appendix: Group Profit & Loss 3Q12
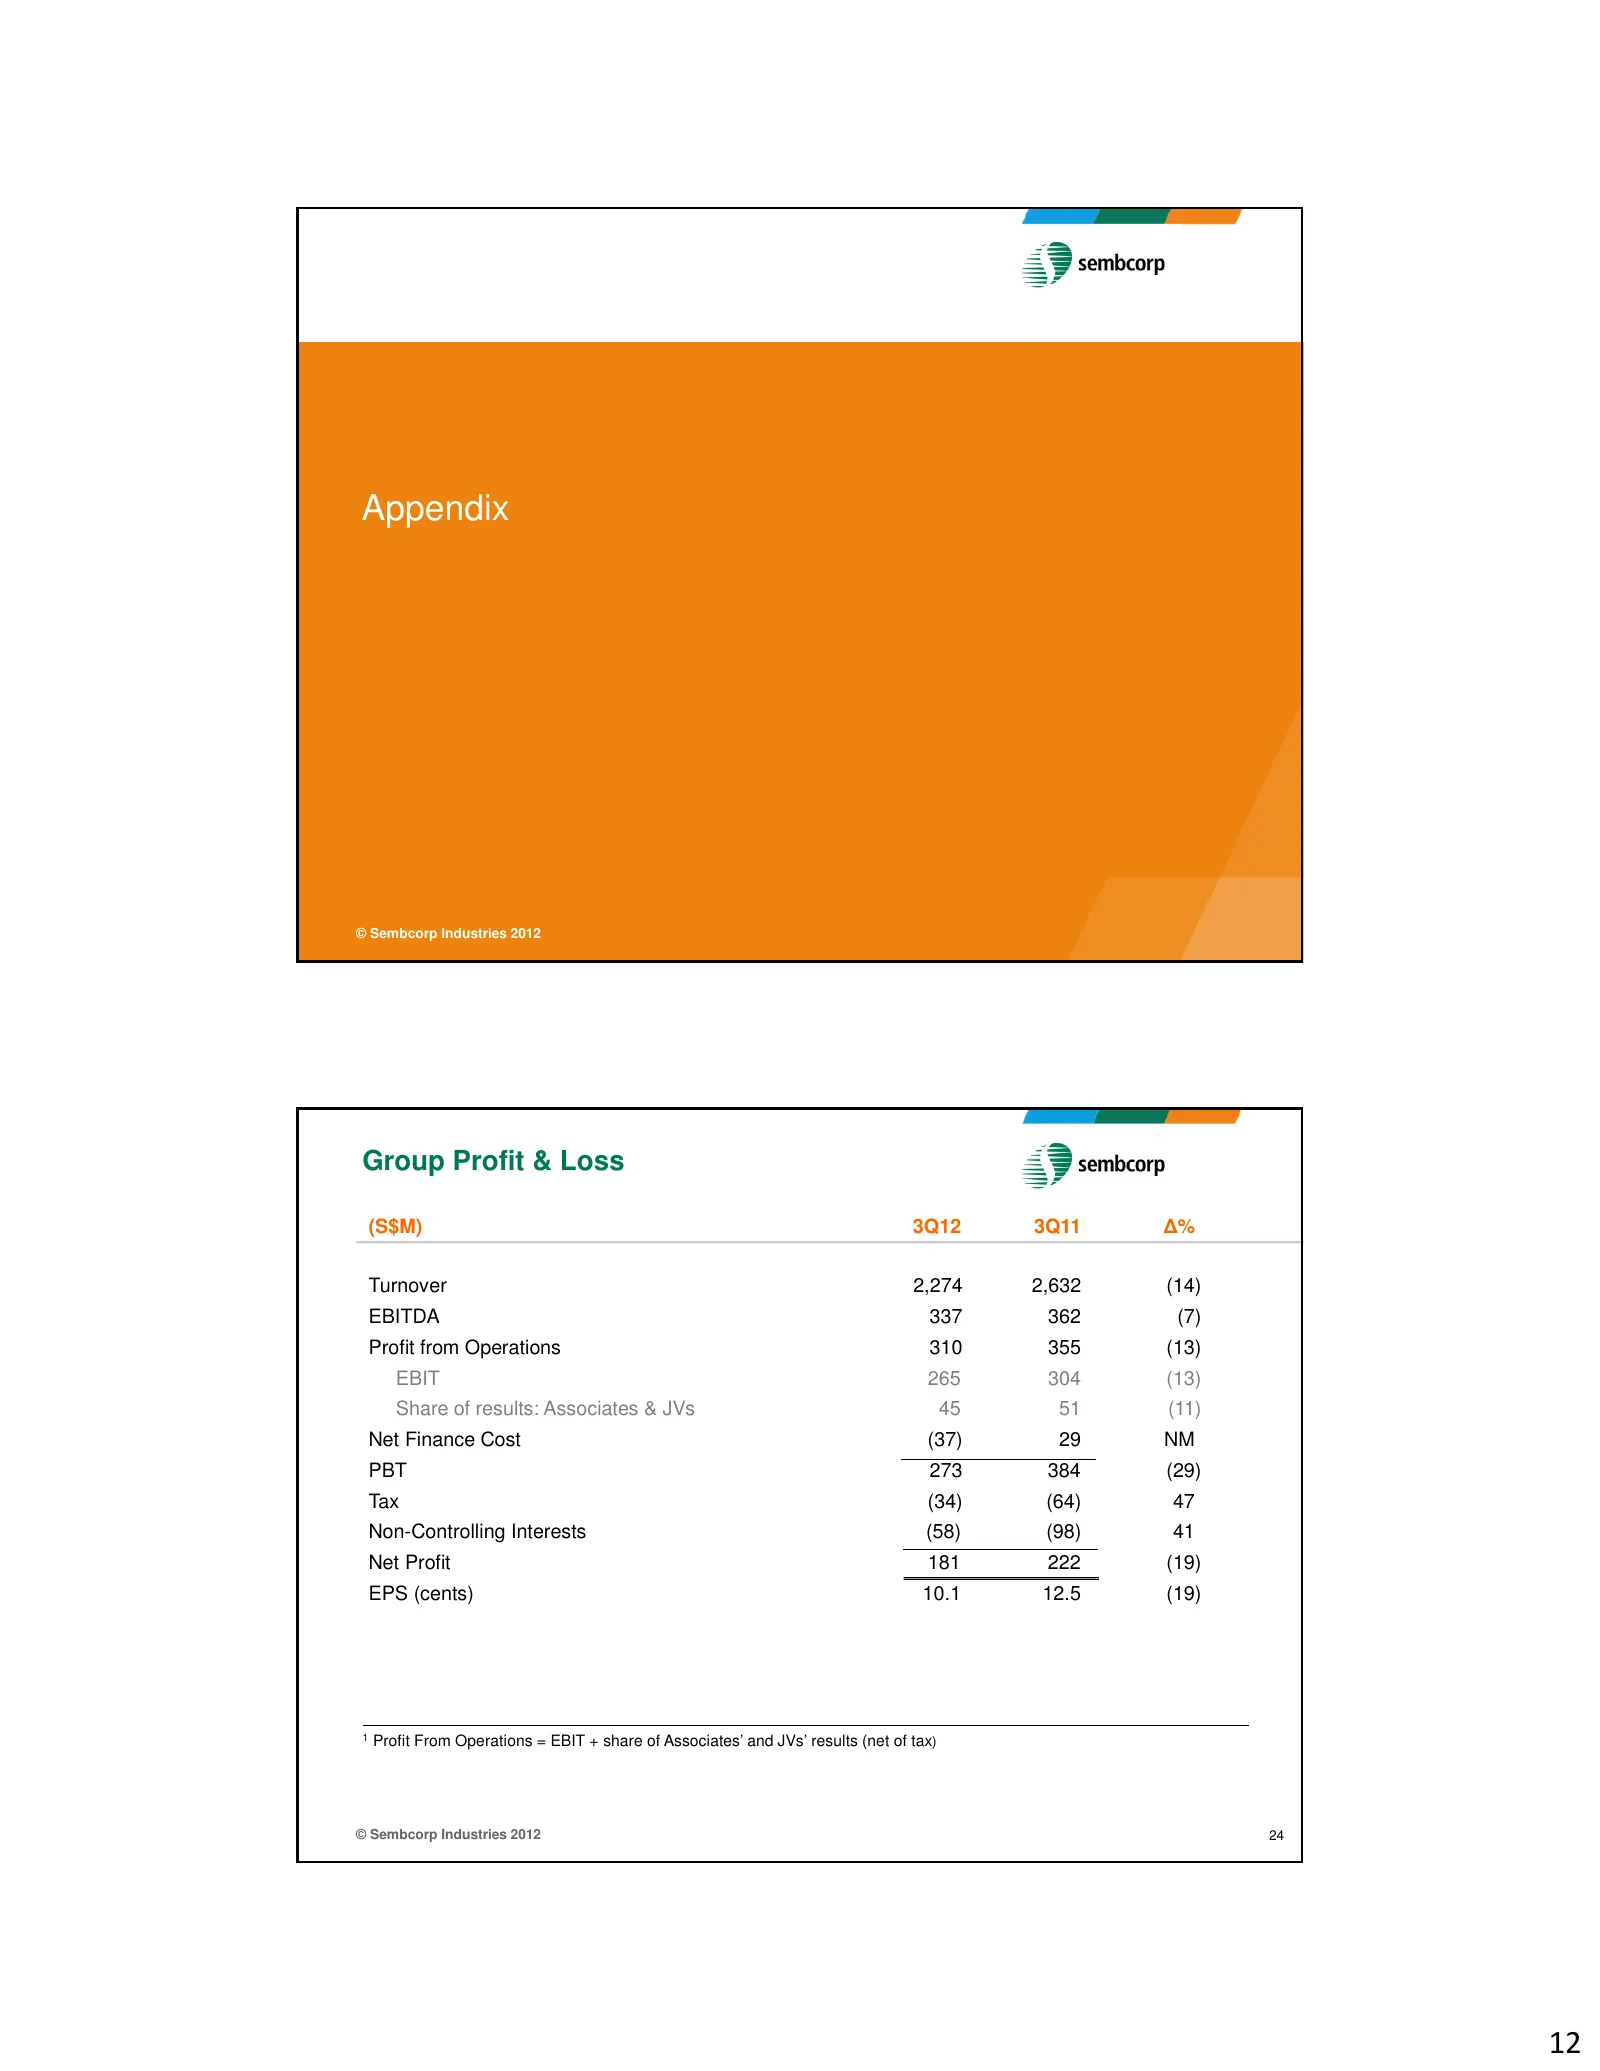
Appendix © Sembcorp Industries 2012 Group Profit & Loss (S$M) 3Q12 3Q11 ∆% Turnover 2,274 2,632 (14) EBITDA 337 362 (7) Profit from Operations 310 355 (13) EBIT 265 304 (13) Share of results: Associates & JVs 45 51 (11) Net Finance Cost (37) 29 NM PBT 273 384 (29) Tax (34) (64) 47 Non-Controlling In
Slide 13: Group Turnover; Group Profit from Operations
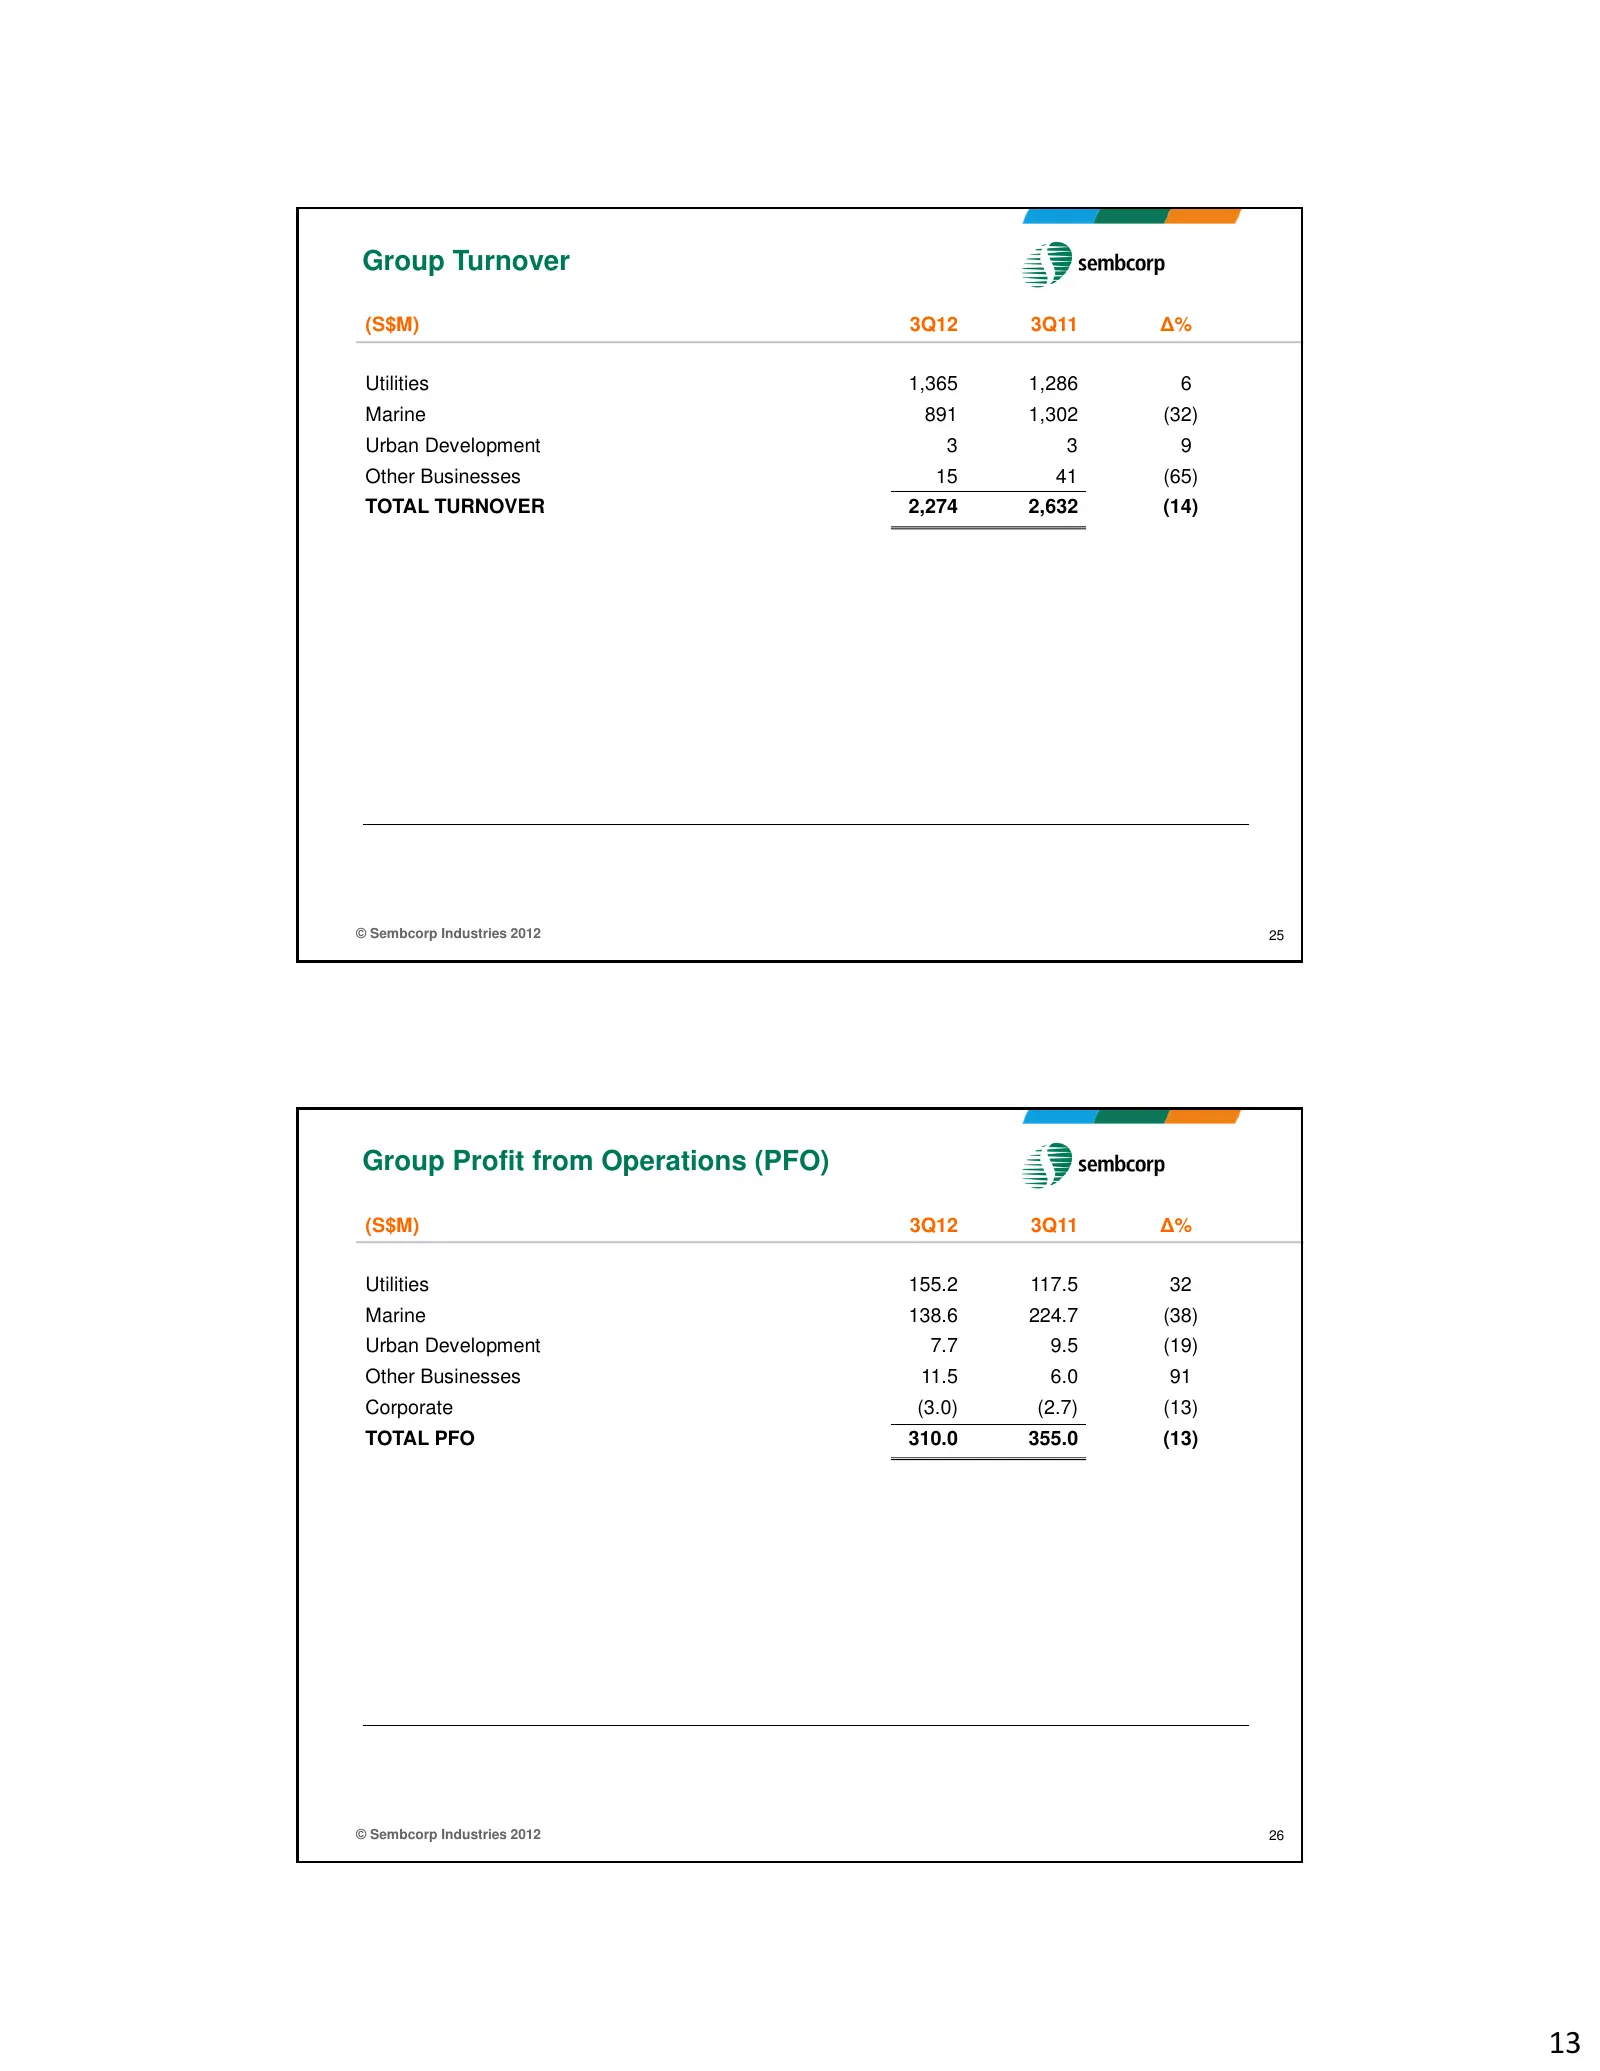
Group Turnover (S$M) 3Q12 3Q11 ∆% Utilities 1,365 1,286 6 Marine 891 1,302 (32) Urban Development 3 3 9 Other Businesses 15 41 (65) TOTAL TURNOVER 2,274 2,632 (14) © Sembcorp Industries 2012 25 Group Profit from Operations (PFO) (S$M) 3Q12 3Q11 ∆% Utilities 155.2 117.5 32 Marine 138.6 224.7 (38) Urb
Slide 14: Group Net Profit; Utilities Turnover
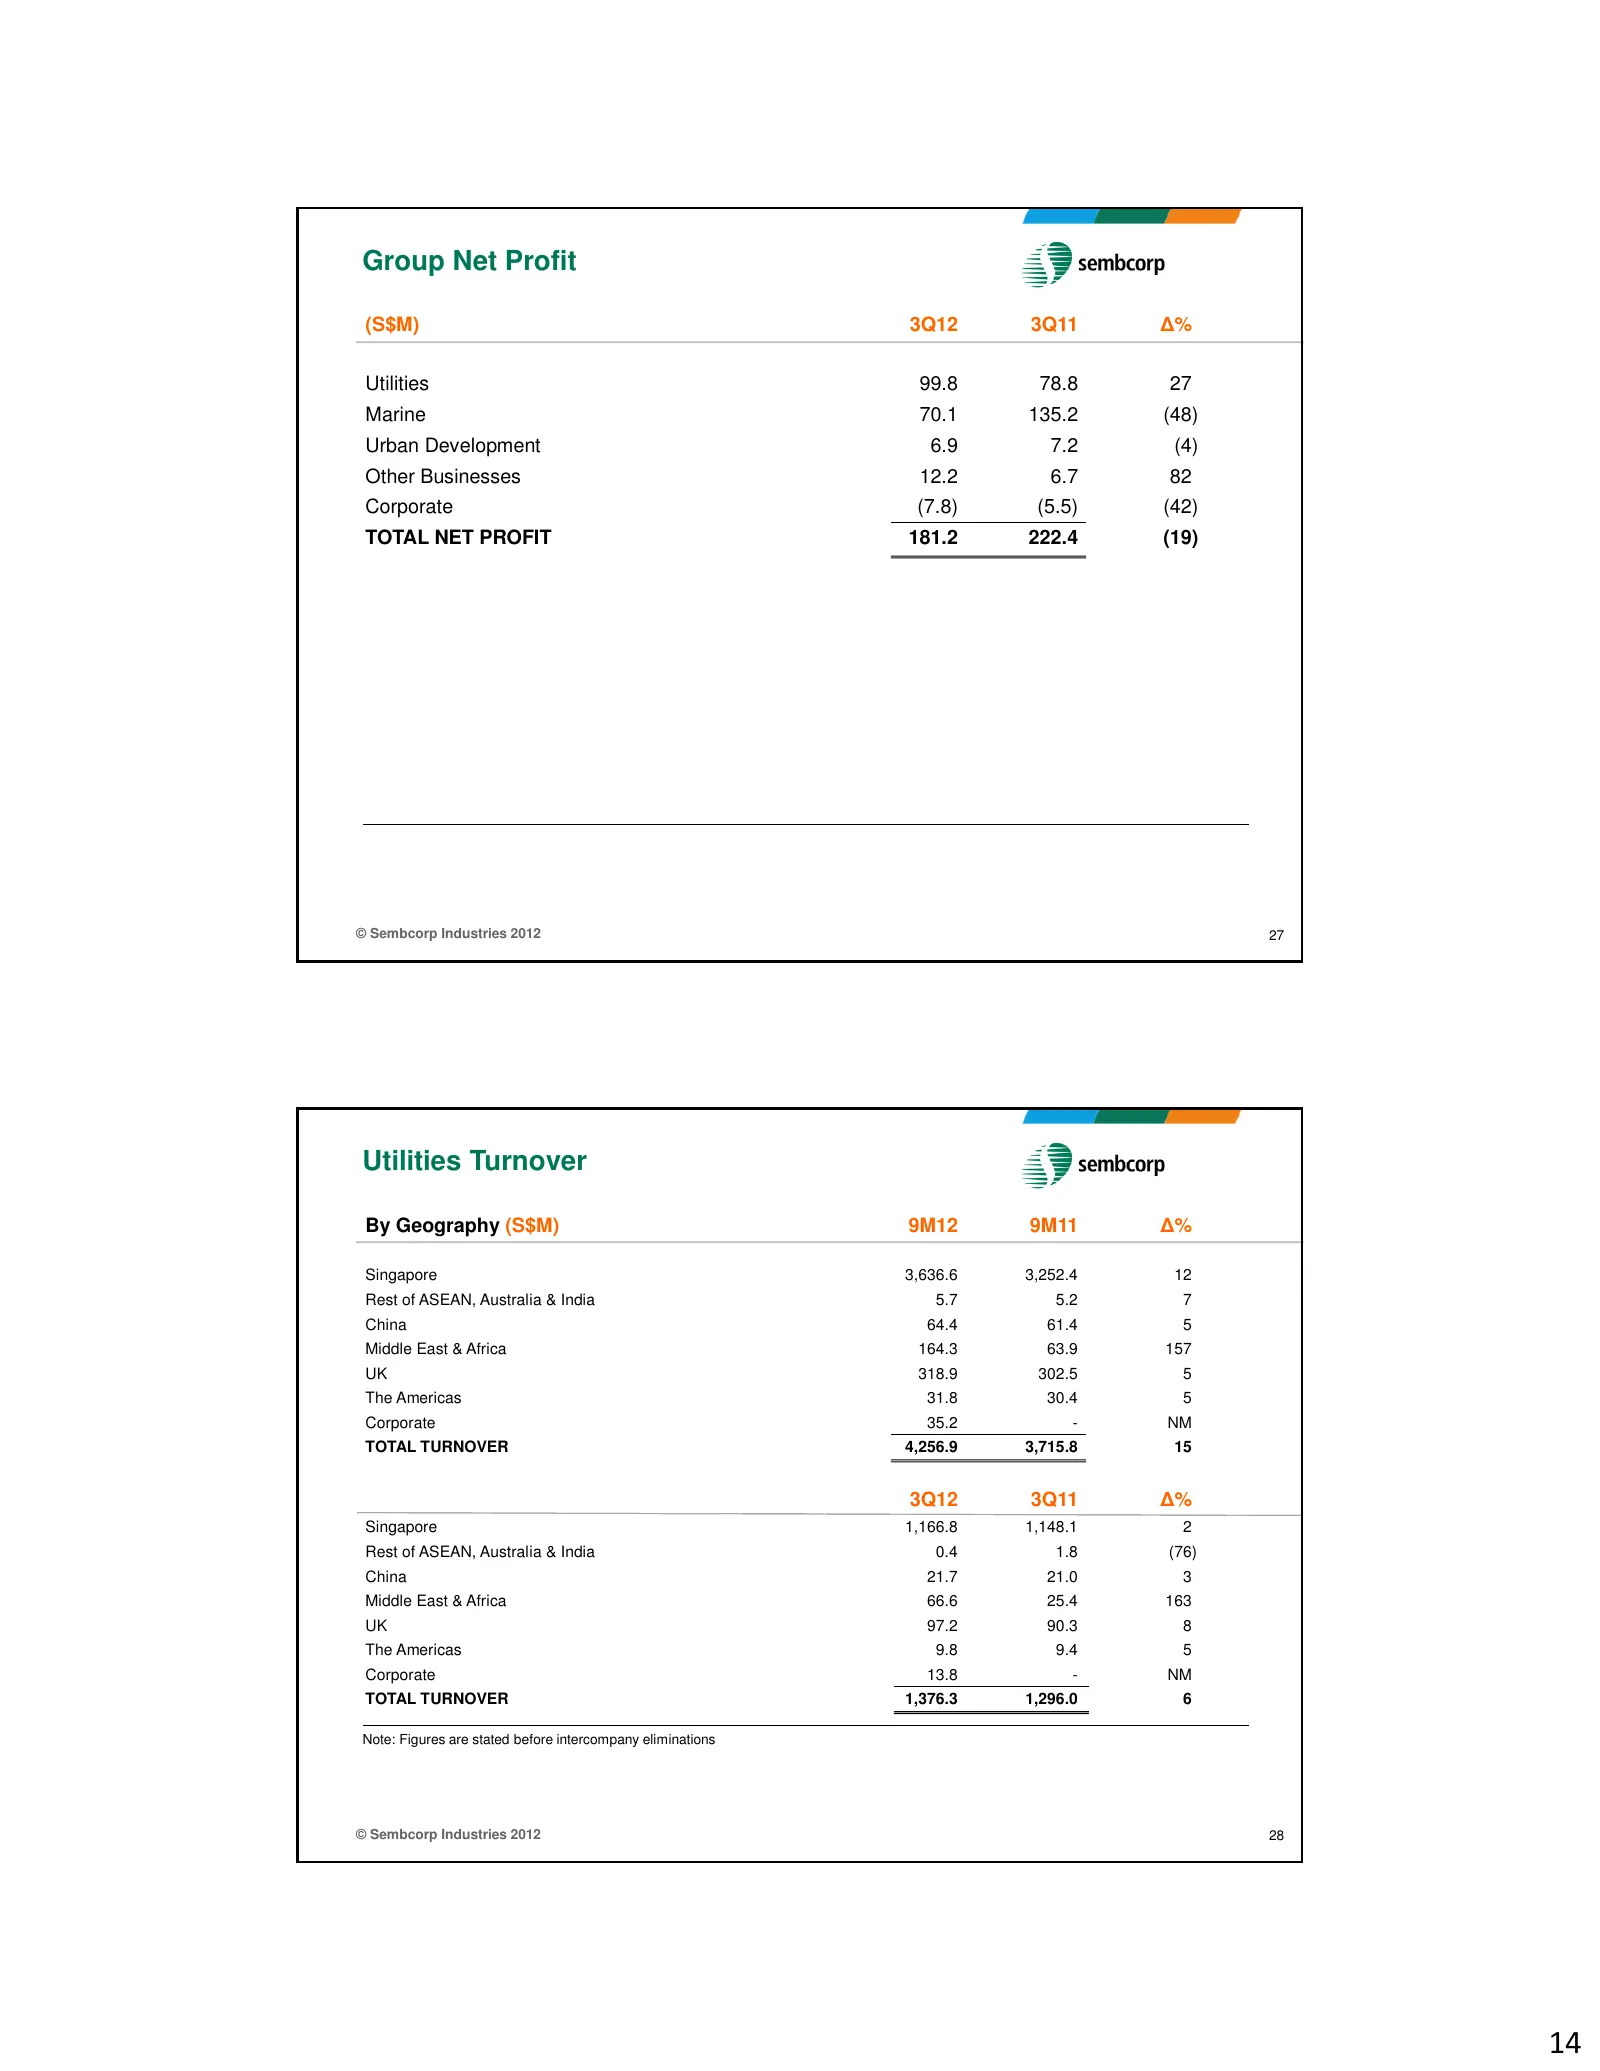
Group Net Profit (S$M) 3Q12 3Q11 ∆% Utilities 99.8 78.8 27 Marine 70.1 135.2 (48) Urban Development 6.9 7.2 (4) Other Businesses 12.2 6.7 82 Corporate (7.8) (5.5) (42) TOTAL NET PROFIT 181.2 222.4 (19) © Sembcorp Industries 2012 27 Utilities Turnover By Geography (S$M) 9M12 9M11 ∆% Singapore 3,636.6
Slide 15: Utilities PFO and Net Profit by Geography
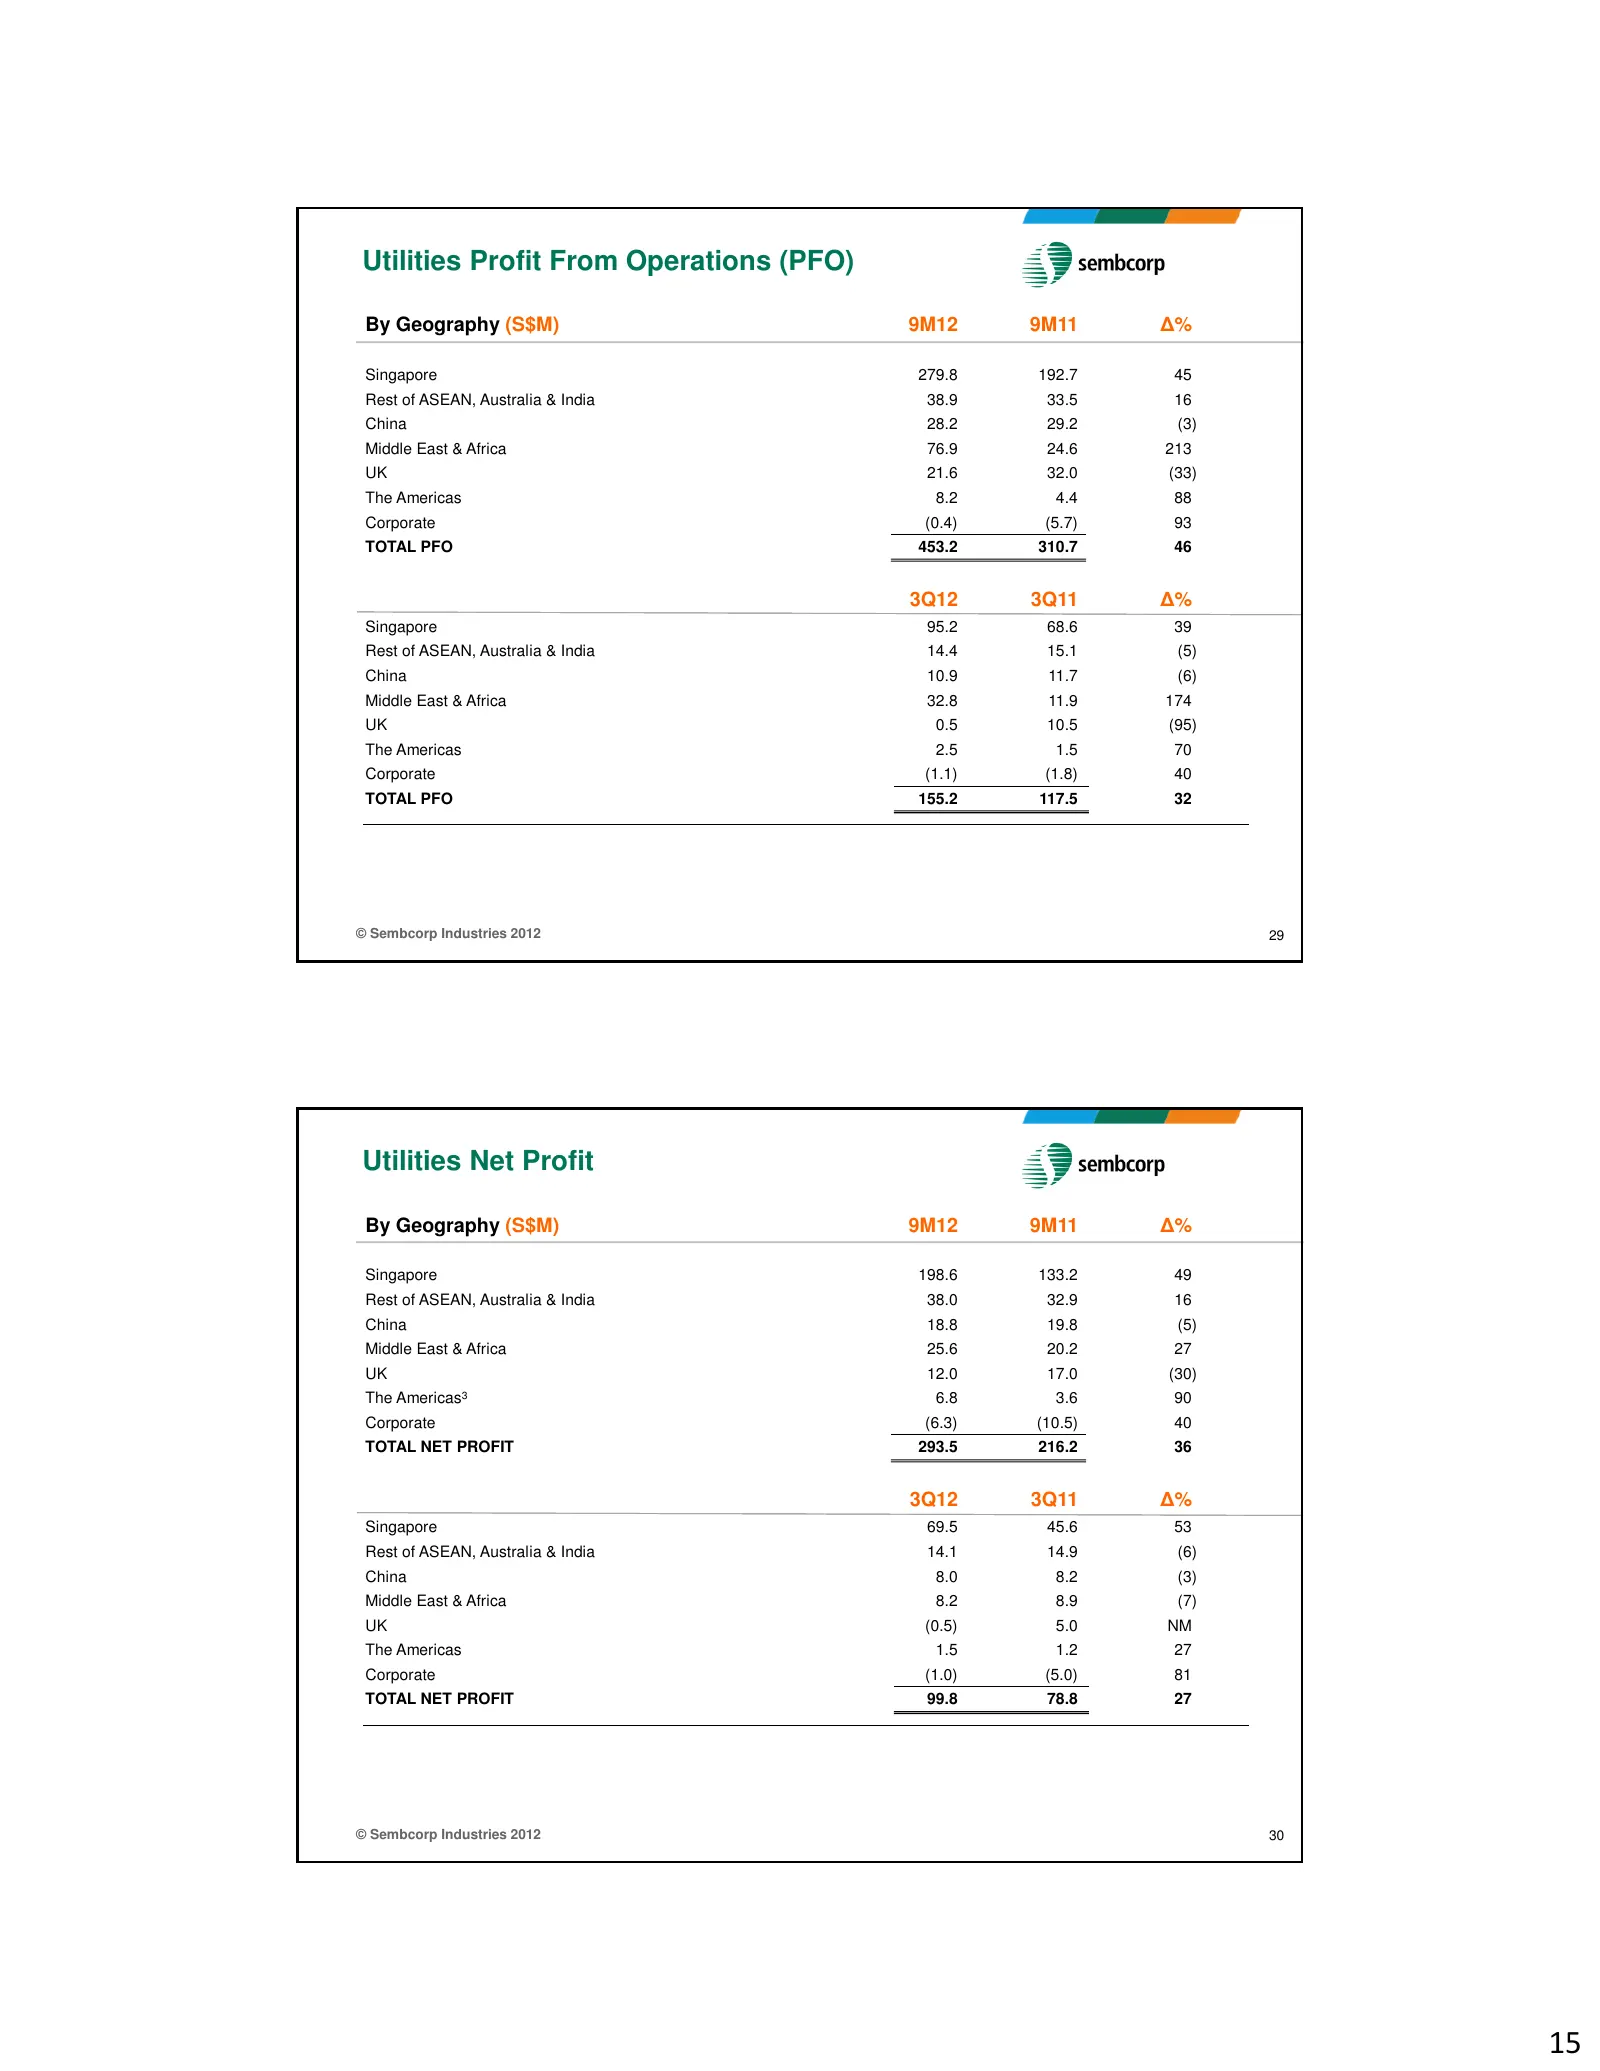
Utilities Profit From Operations (PFO) By Geography (S$M) 9M12 9M11 ∆% Singapore 279.8 192.7 45 Rest of ASEAN, Australia & India 38.9 33.5 16 China 28.2 29.2 (3) Middle East & Africa 76.9 24.6 213 UK 21.6 32.0 (33) The Americas 8.2 4.4 88 Corporate (0.4) (5.7) 93 TOTAL PFO 453.2 310.7 46 3Q12 3Q11 ∆
Slide 16: Utilities Turnover and PFO by Product Segment
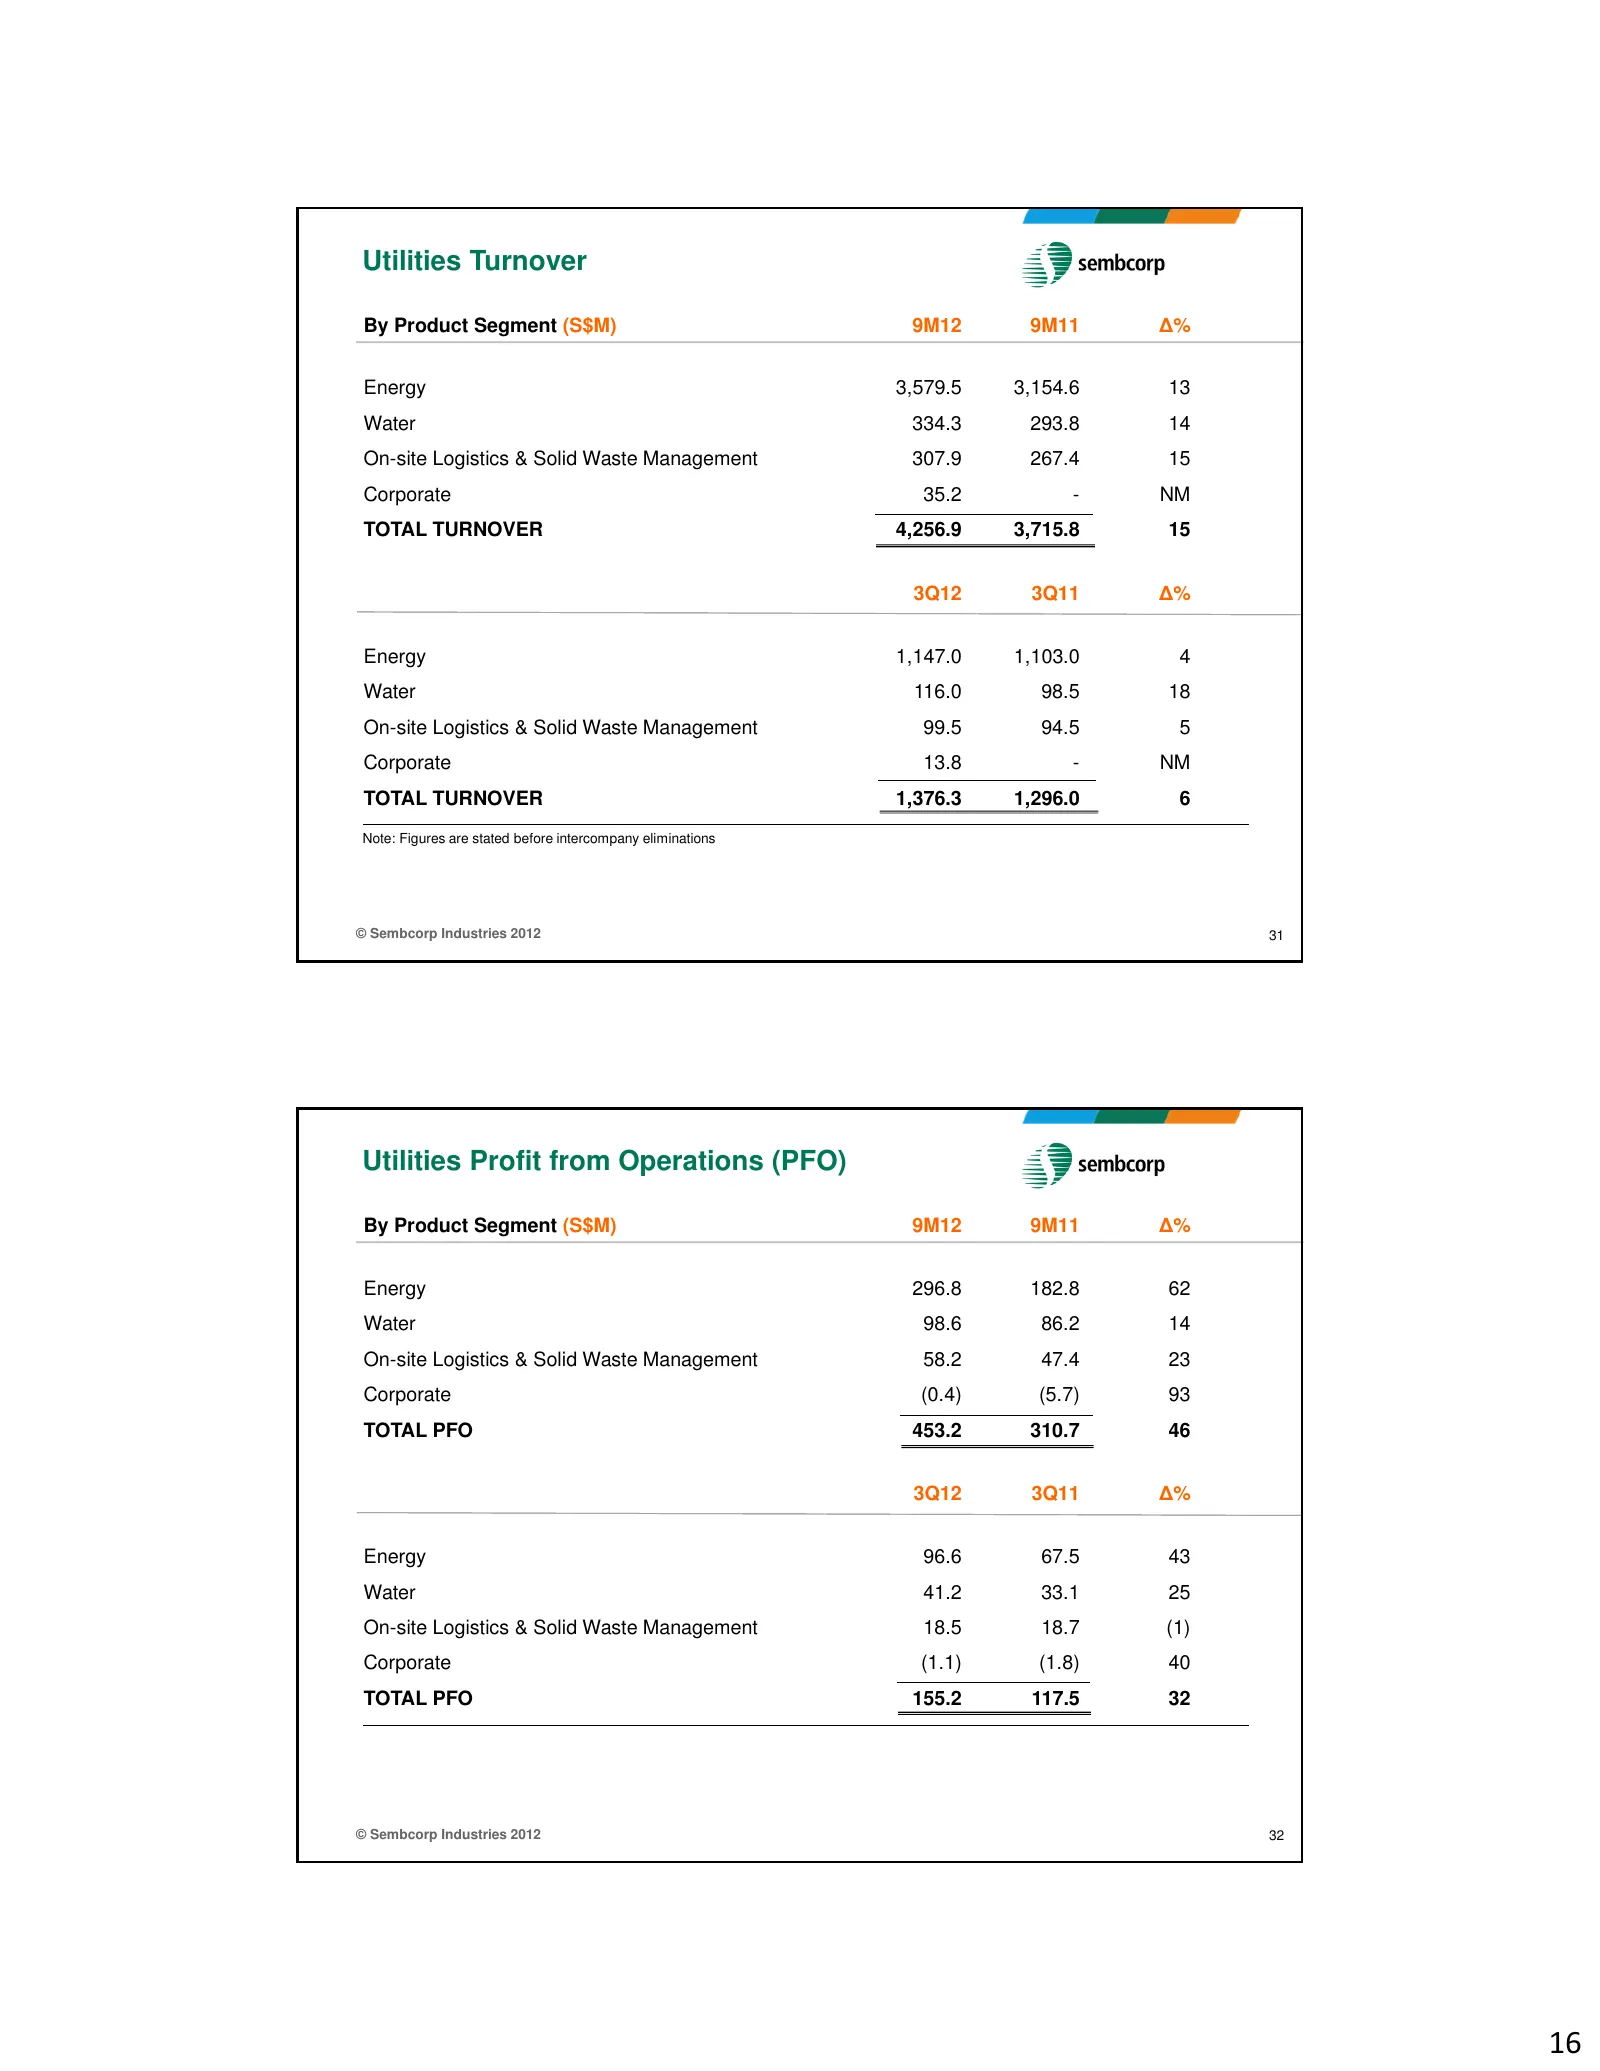
Utilities Turnover By Product Segment (S$M) 9M12 9M11 ∆% Energy 3,579.5 3,154.6 13 Water 334.3 293.8 14 On-site Logistics & Solid Waste Management 307.9 267.4 15 Corporate 35.2 - NM TOTAL TURNOVER 4,256.9 3,715.8 15 3Q12 3Q11 ∆% Energy 1,147.0 1,103.0 4 Water 116.0 98.5 18 On-site Logistics & Solid
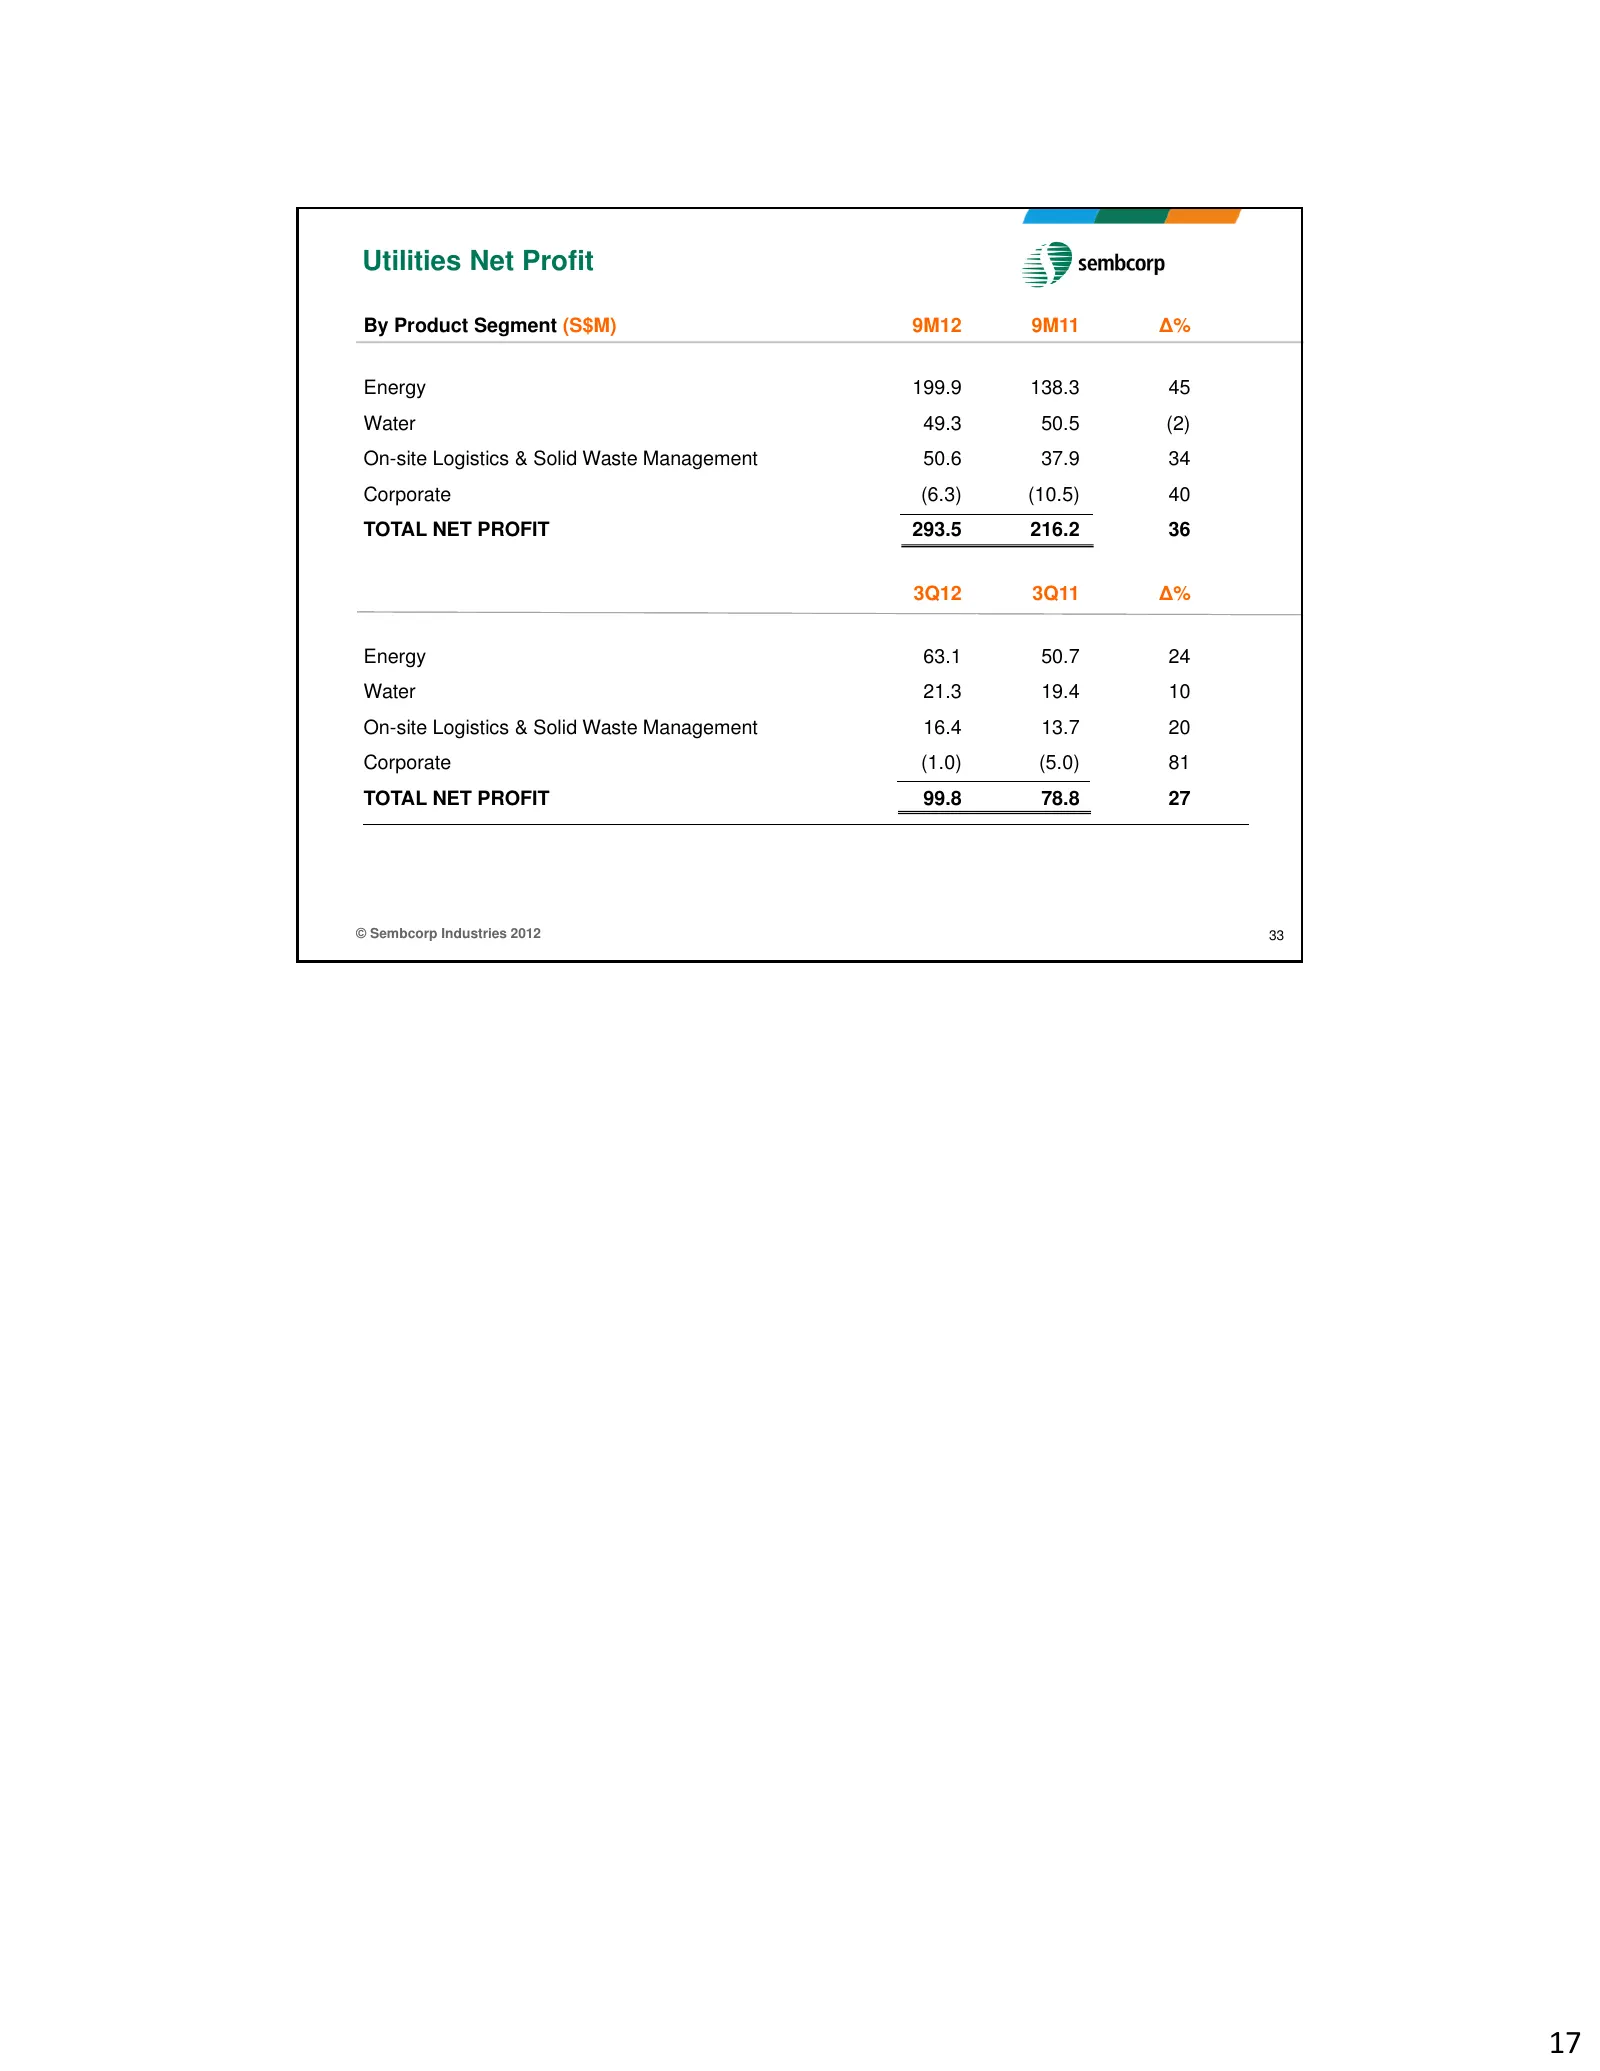
Slide 17: Utilities Net Profit by Product Segment
Utilities Net Profit By Product Segment (S$M) 9M12 9M11 ∆% Energy 199.9 138.3 45 Water 49.3 50.5 (2) On-site Logistics & Solid Waste Management 50.6 37.9 34 Corporate (6.3) (10.5) 40 TOTAL NET PROFIT 293.5 216.2 36 3Q12 3Q11 ∆% Energy 63.1 50.7 24 Water 21.3 19.4 10 On-site Logistics & Solid Waste M
Source: Internet Archive copy of sembcorp.com
More decks from Sembcorp Industries Ltd.
 H1 2026 Earnings Presentation26 slides · Aug 13, 2026
 Investor Presentation (June 2026)52 slides · June 2026
 Shareholder Meeting (April 2026)11 slides · Apr 29, 2026
 FY2025 Earnings Presentation35 slides · Feb 25, 2026
 Merger or Acquisition (January 2026)13 slides · Jan 30, 2026
 Merger or Acquisition (December 2025)24 slides · Dec 11, 2025