Capita plc · LSE:CPI
Capita — H1 2016 Earnings Presentation
36 slides from Capita's earnings presentation, Jul 27, 2016
Slide 1: Results for the half year ended 30 June 2016
Results for the half year ended 30 June 2016 27 July 2016 Capita plc
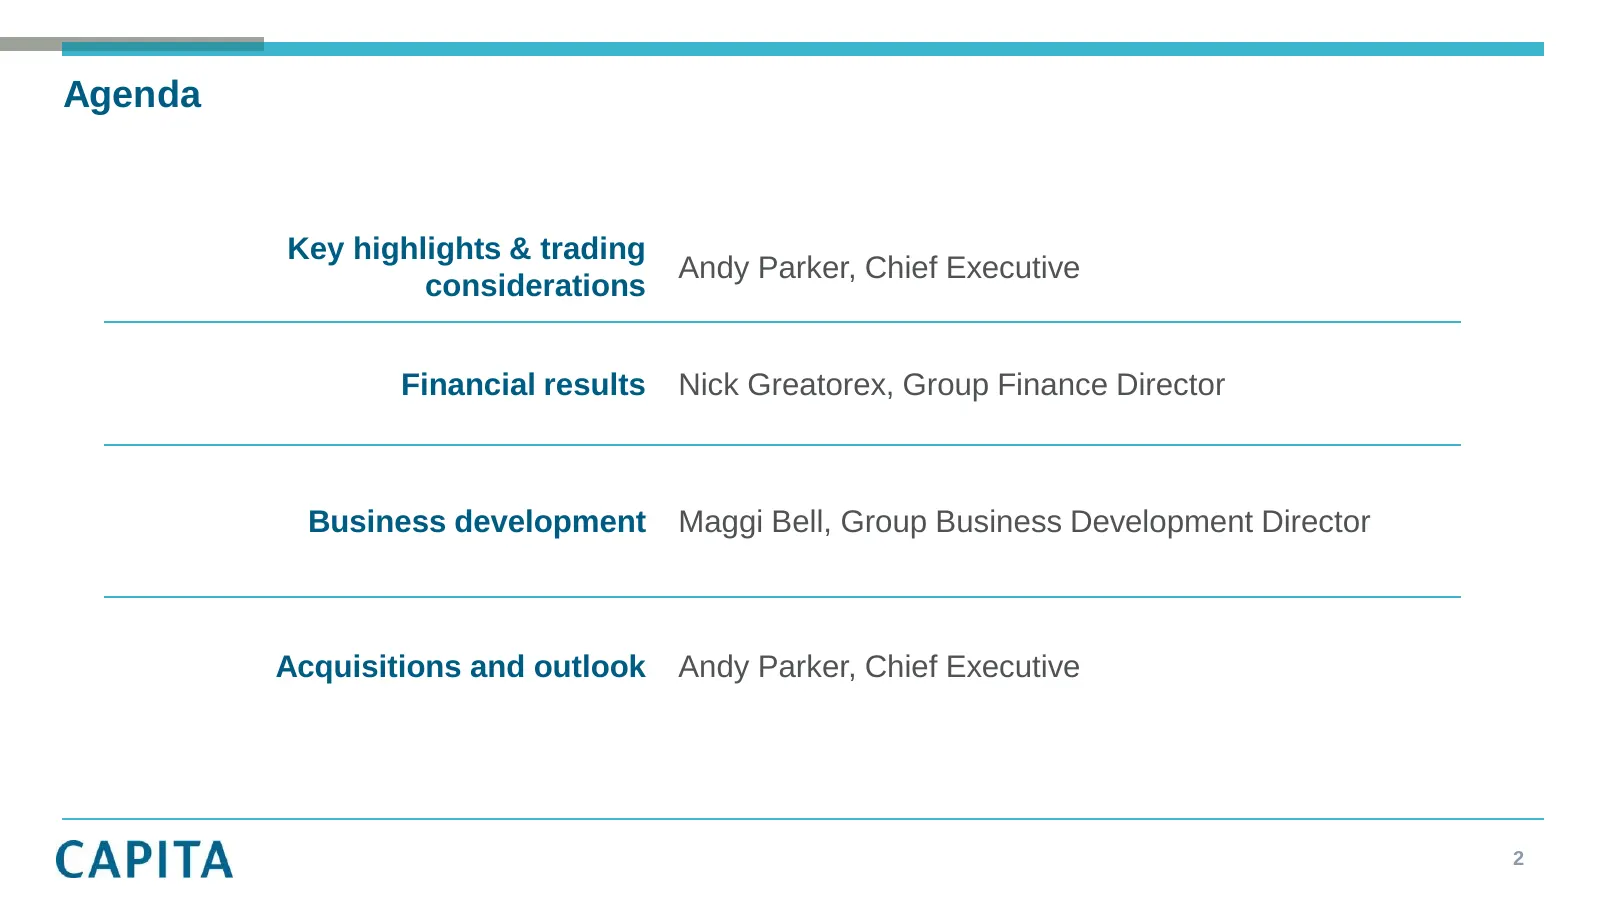
Slide 2: Agenda
Agenda Key highlights & trading Andy Parker, Chief Executive considerations Financial results Nick Greatorex, Group Finance Director Business development Maggi Bell, Group Business Development Director Acquisitions and outlook Andy Parker, Chief Executive 2
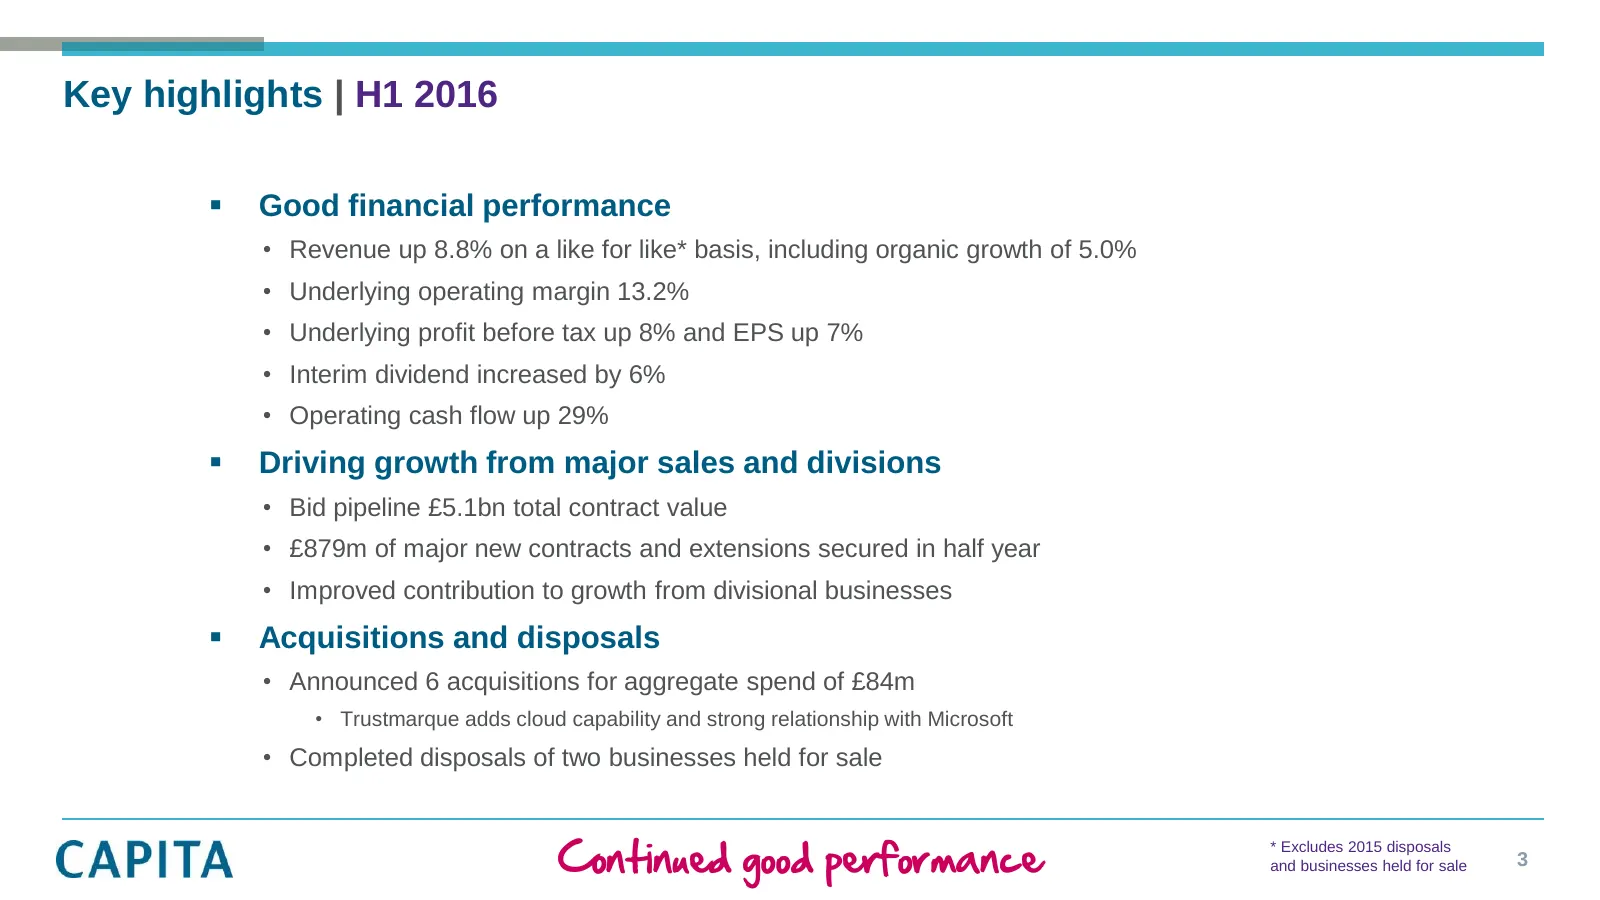
Slide 3: Key highlights H1 2016: Continued good performance
Key highlights | H1 2016 Good financial performance • Revenue up 8.8% on a like for like* basis, including organic growth of 5.0% • Underlying operating margin 13.2% • Underlying profit before tax up 8% and EPS up 7% • Interim dividend increased by 6% • Operating cash flow up 29% Driving growth
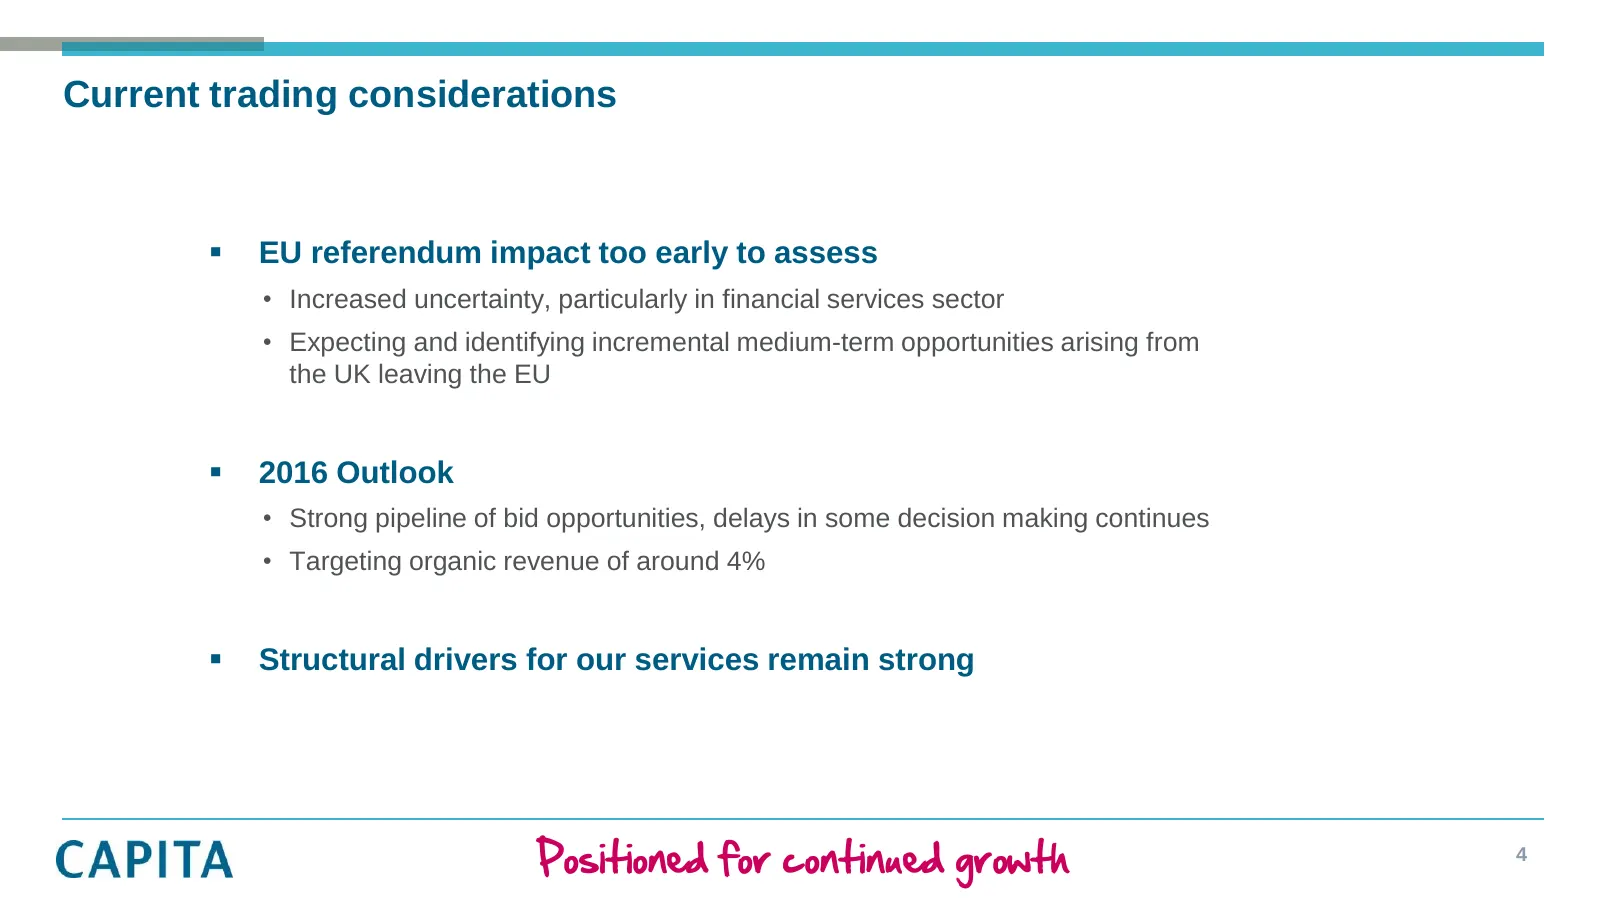
Slide 4: Current trading considerations: Positioned for continued growth
Current trading considerations EU referendum impact too early to assess • Increased uncertainty, particularly in financial services sector • Expecting and identifying incremental medium-term opportunities arising from the UK leaving the EU 2016 Outlook • Strong pipeline of bid opportunities, del
Slide 5: Financial results
Financial results Nick Greatorex Group Finance Director
Slide 6: Underlying income statement 30 June 2016
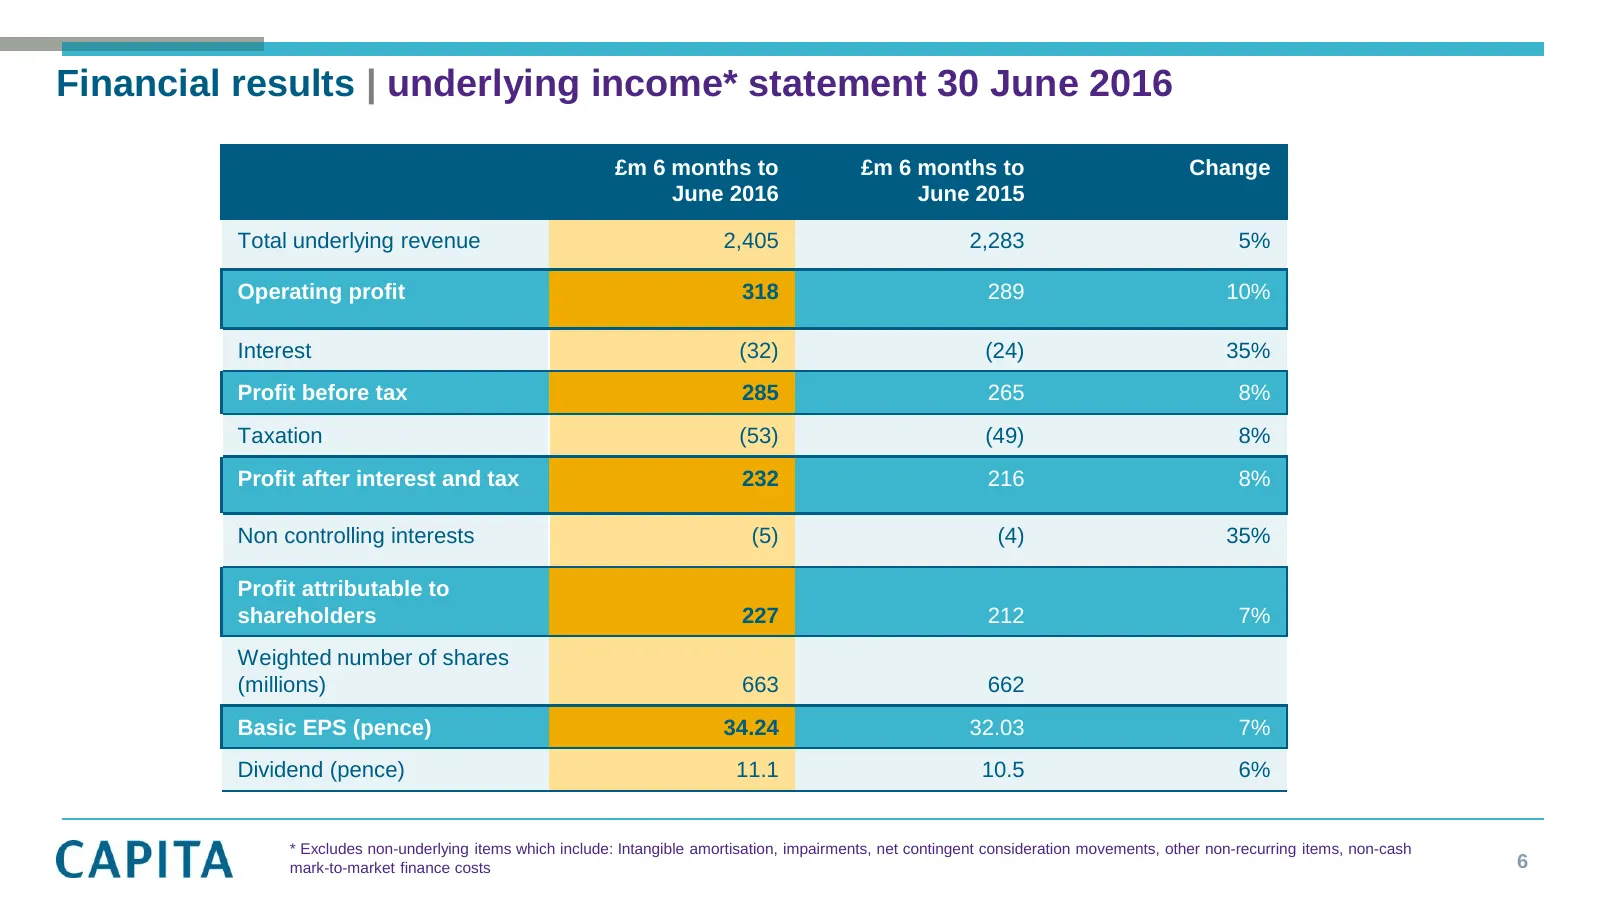
Financial results | underlying income* statement 30 June 2016 £m 6 months to £m 6 months to Change June 2016 June 2015 Total underlying revenue 2,405 2,283 5% Operating profit 318 289 10% Interest (32) (24) 35% Profit before tax 285 265 8% Taxation (53) (49) 8% Profit after interest and tax 232 216
Slide 7: Continued steady growth
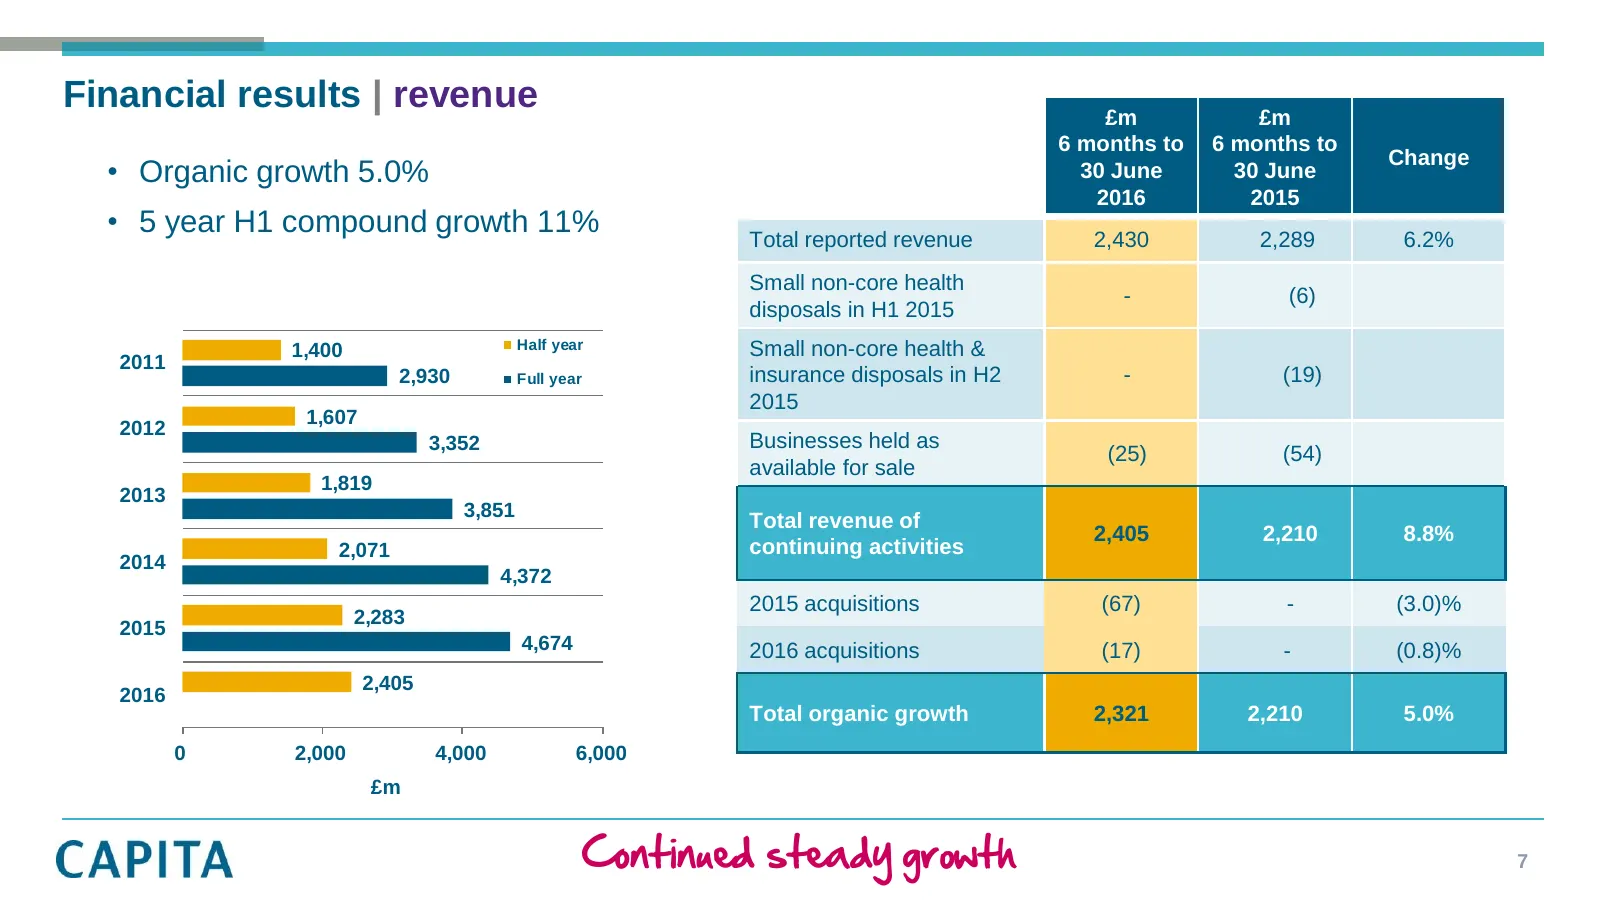
Financial results | revenue £m £m 6 months to 6 months to Change • Organic growth 5.0% 30 June 30 June 2016 2015 • 5 year H1 compound growth 11% Total reported revenue 2,430 2,289 6.2% Small non-core health - (6) disposals in H1 2015 1,400 Half year Small non-core health & 2011 2,930 Full year insur
Slide 8: Increased market diversification
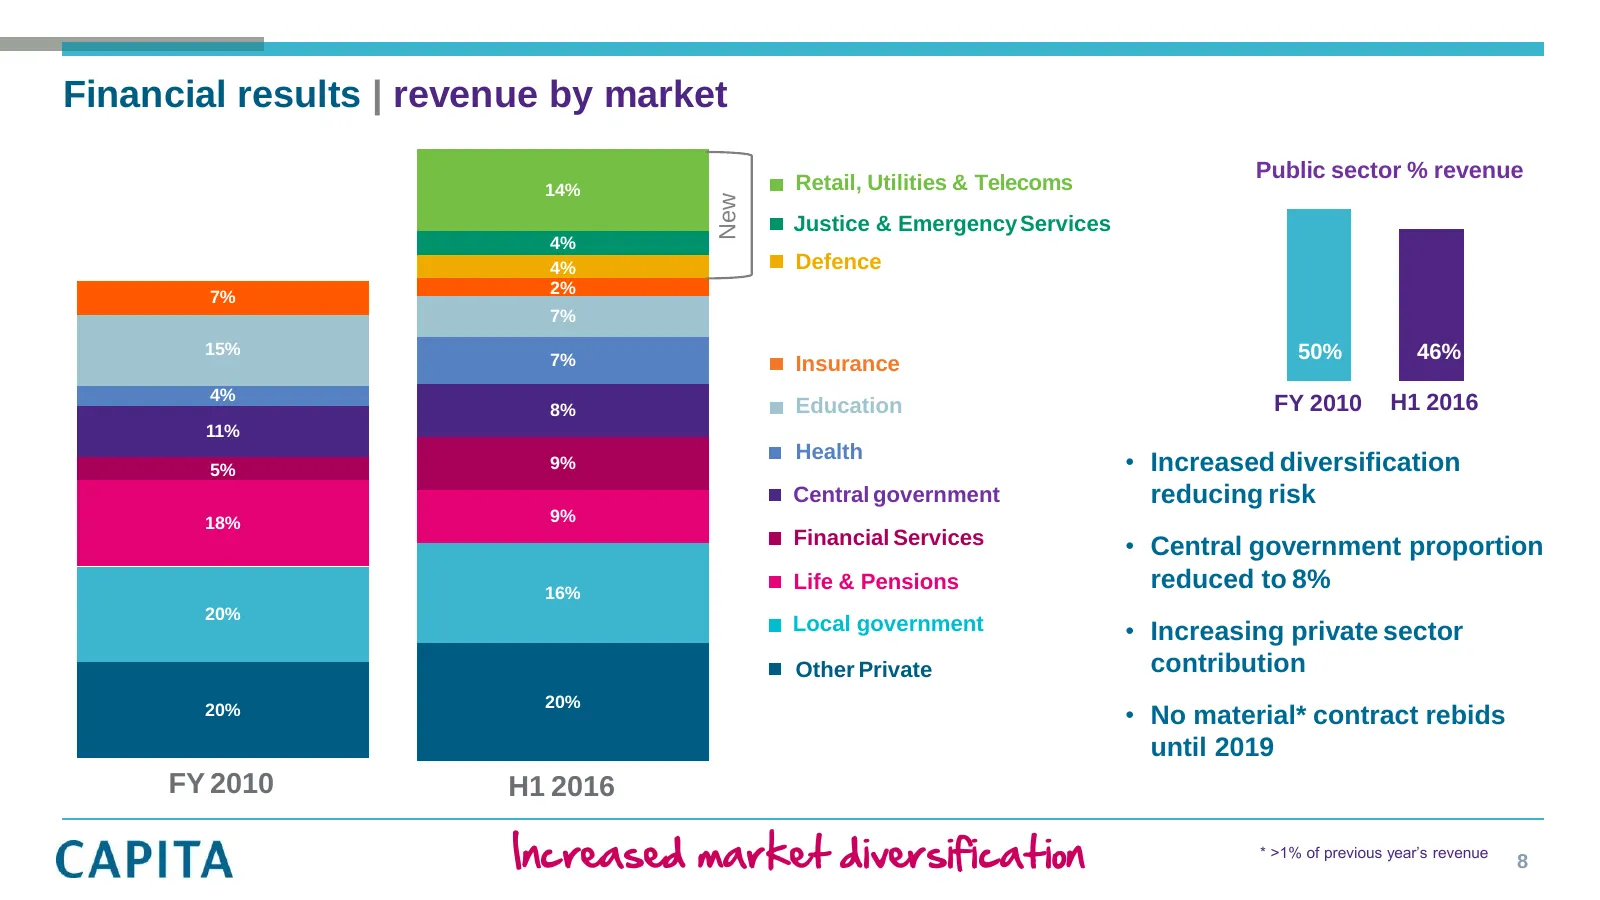
Financial results | revenue by market Retail, Utilities & Telecoms Public sector % revenue 14% New Justice & Emergency Services 4% 4% Defence 2% Private 7% 7% sector 15% 7% 50% 54%46% Insurance 4% 8% Education FY 2010 H1 2016 11% Health 5% 9% • Increased diversification Central government reducing r
Slide 9: Underlying profit measures
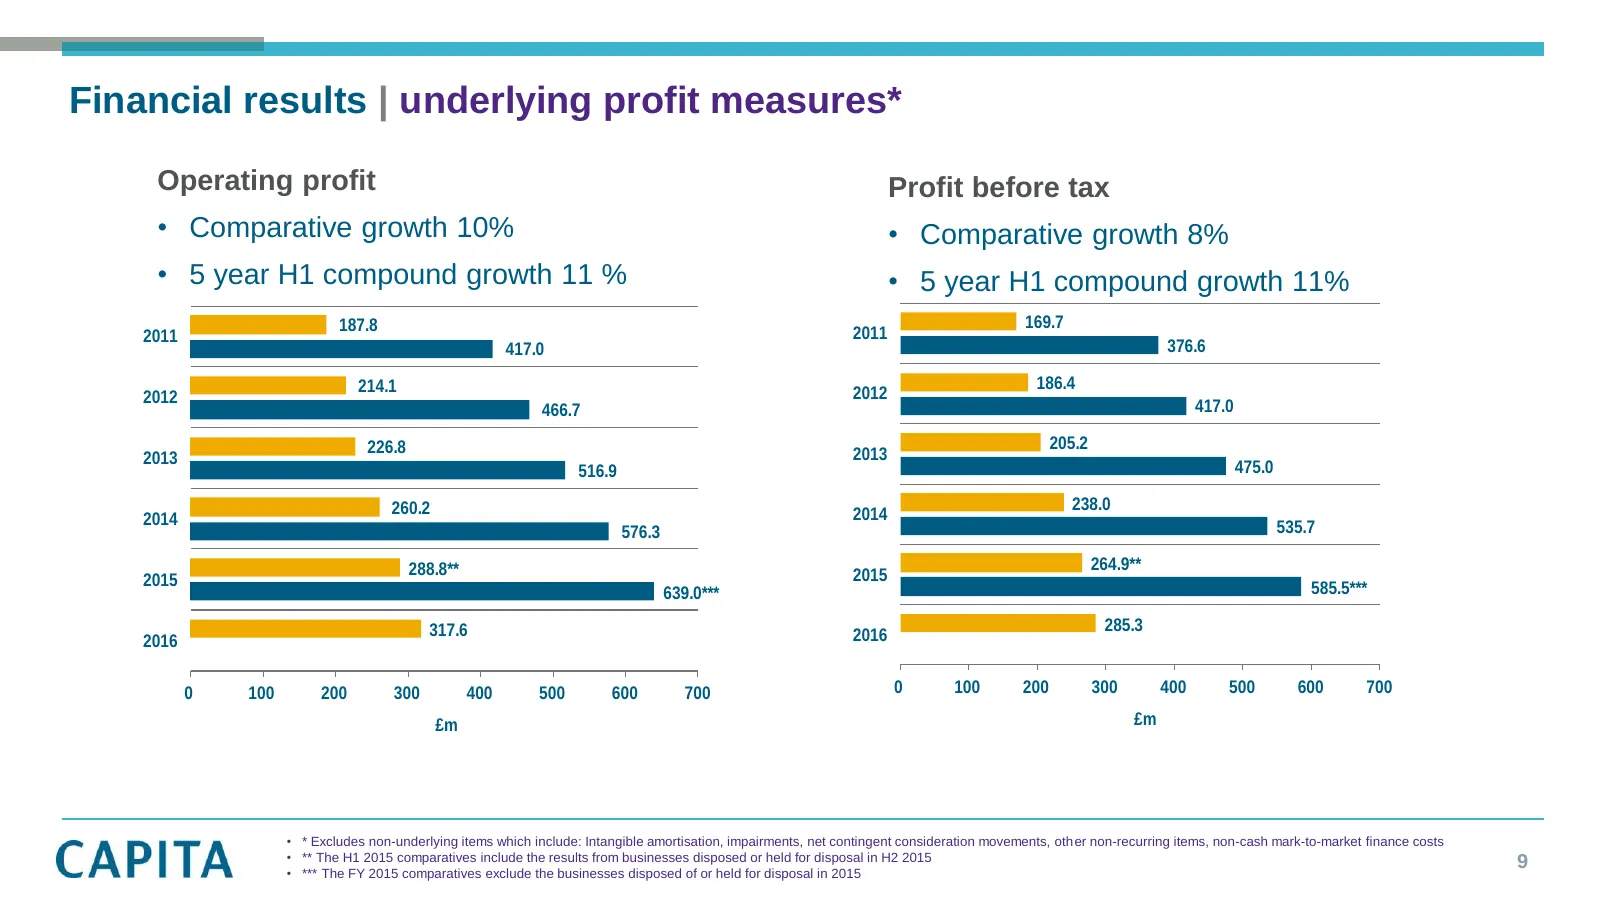
Financial results | underlying profit measures* Operating profit Profit before tax • Comparative growth 10% • Comparative growth 8% • 5 year H1 compound growth 11 % • 5 year H1 compound growth 11% 187.8 169.7 2011 2011 417.0 376.6 214.1 186.4 2012 2012 466.7 417.0 226.8 205.2 2013 2013 516.9 475.0 2
Slide 10: Underlying H1 operating margin
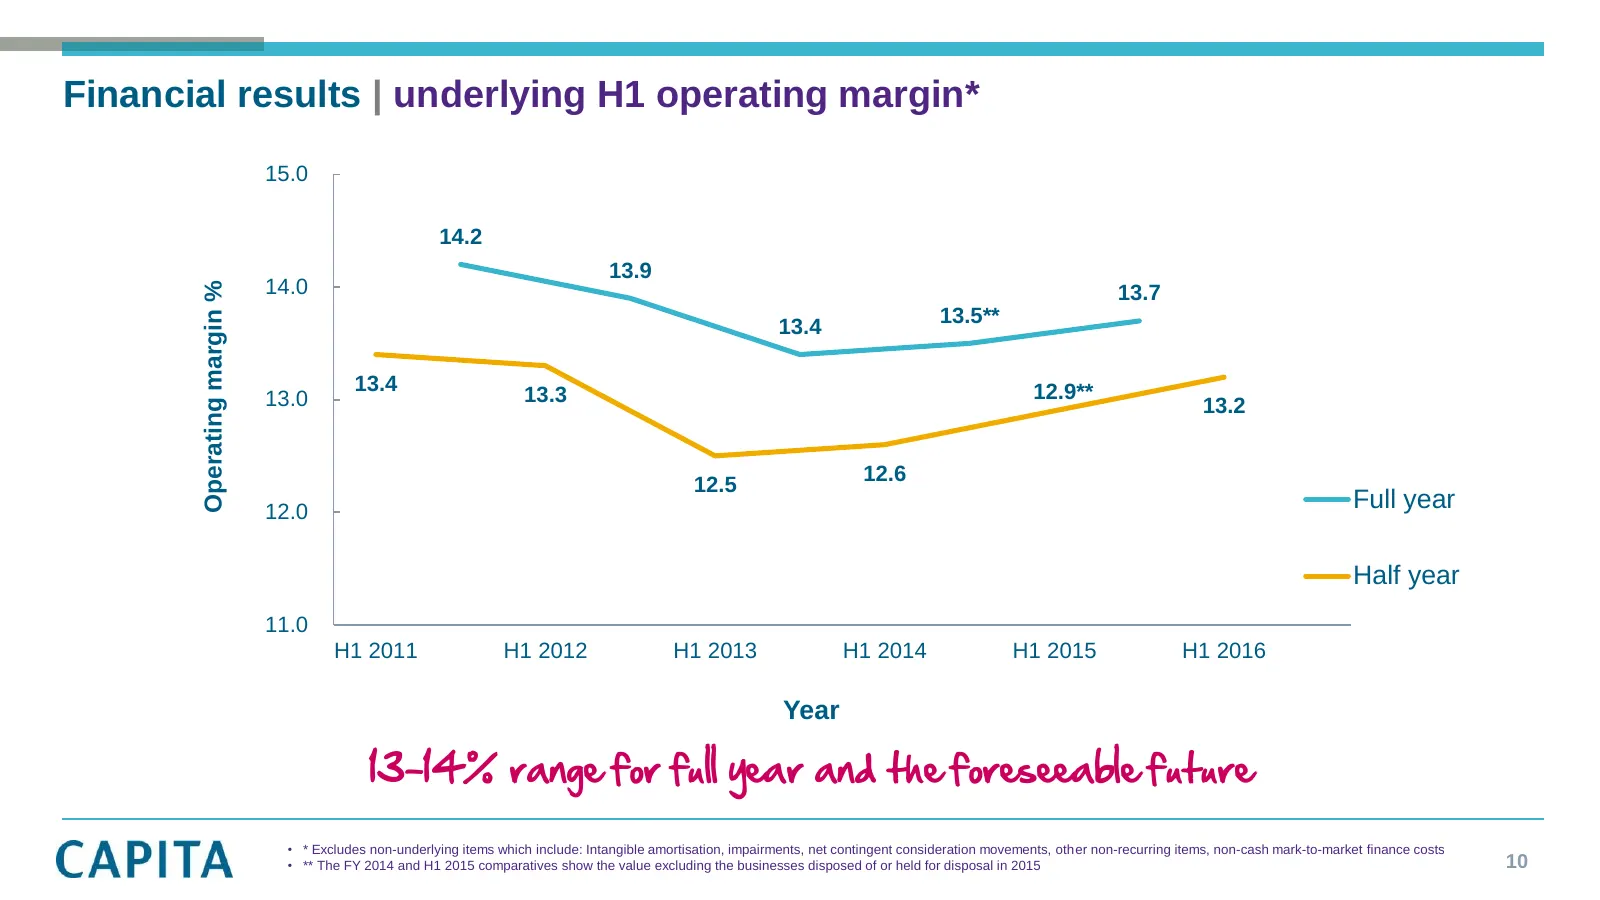
Financial results | underlying H1 operating margin* 15.0 14.2 13.9 14.0 Operating margin % 13.7 13.5** 13.4 13.4 12.9** 13.0 13.3 13.2 12.6 12.5 12.0 Full year Half year 11.0 H1 2011 H1 2012 H1 2013 H1 2014 H1 2015 H1 2016 Year 13-14% range for full year and the foreseeable future • * Excludes non-u
Slide 11: Underlying returns per share
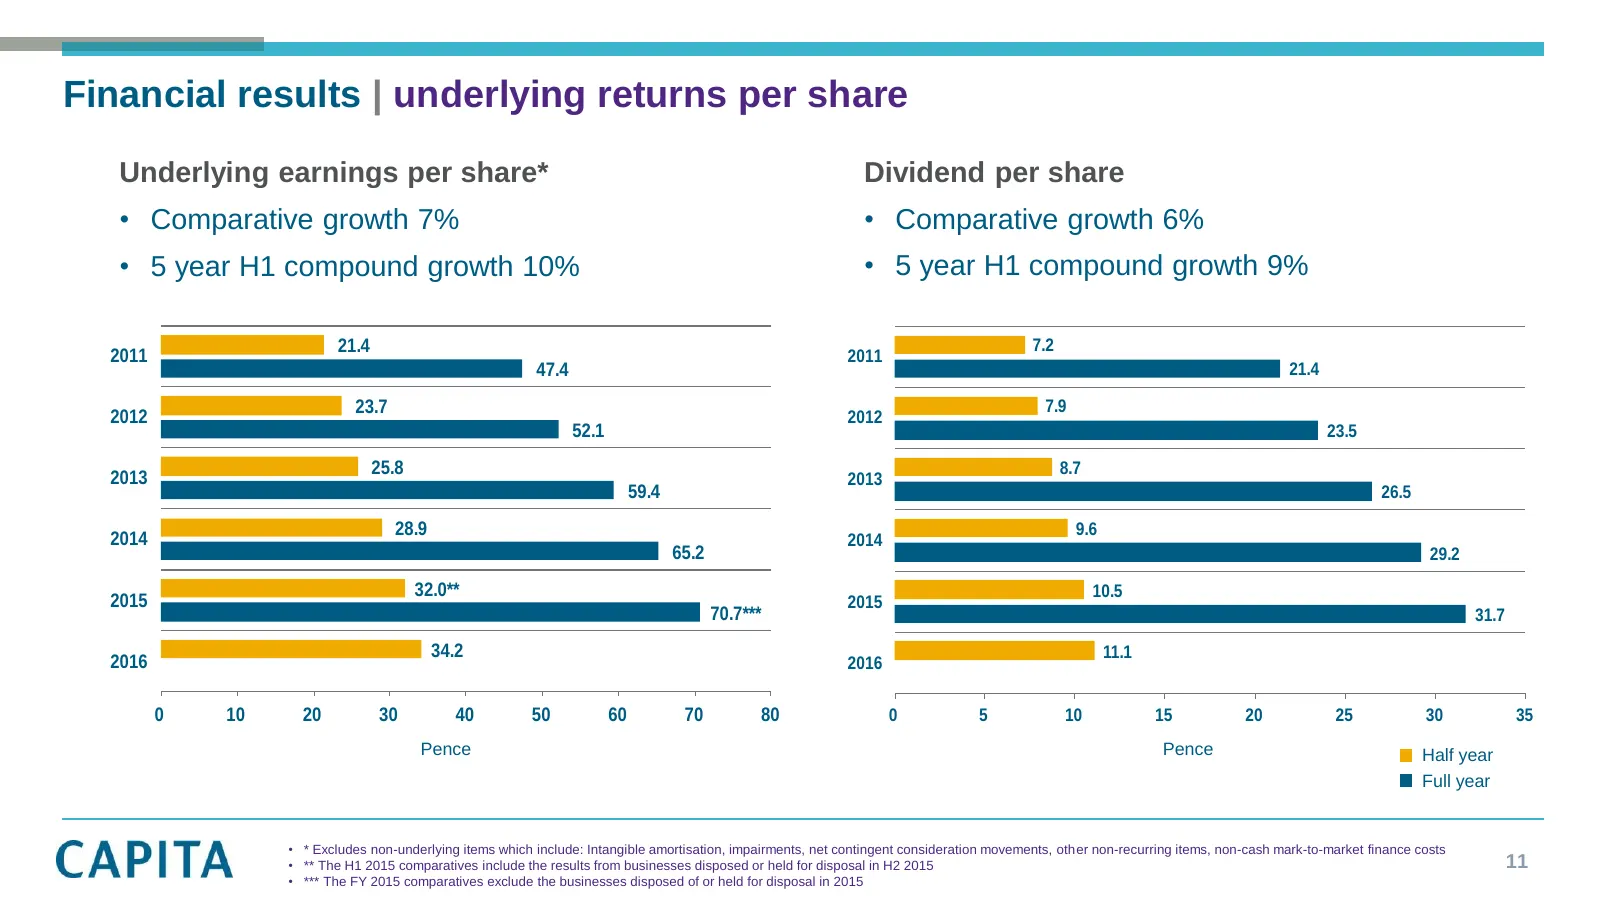
Financial results | underlying returns per share Underlying earnings per share* Dividend per share • Comparative growth 7% • Comparative growth 6% • 5 year H1 compound growth 10% • 5 year H1 compound growth 9% 21.4 7.2 2011 2011 47.4 21.4 23.7 7.9 2012 2012 52.1 23.5 25.8 8.7 2013 2013 59.4 26.5 28.
Slide 12: Targeting annual cash conversion at or above 100%
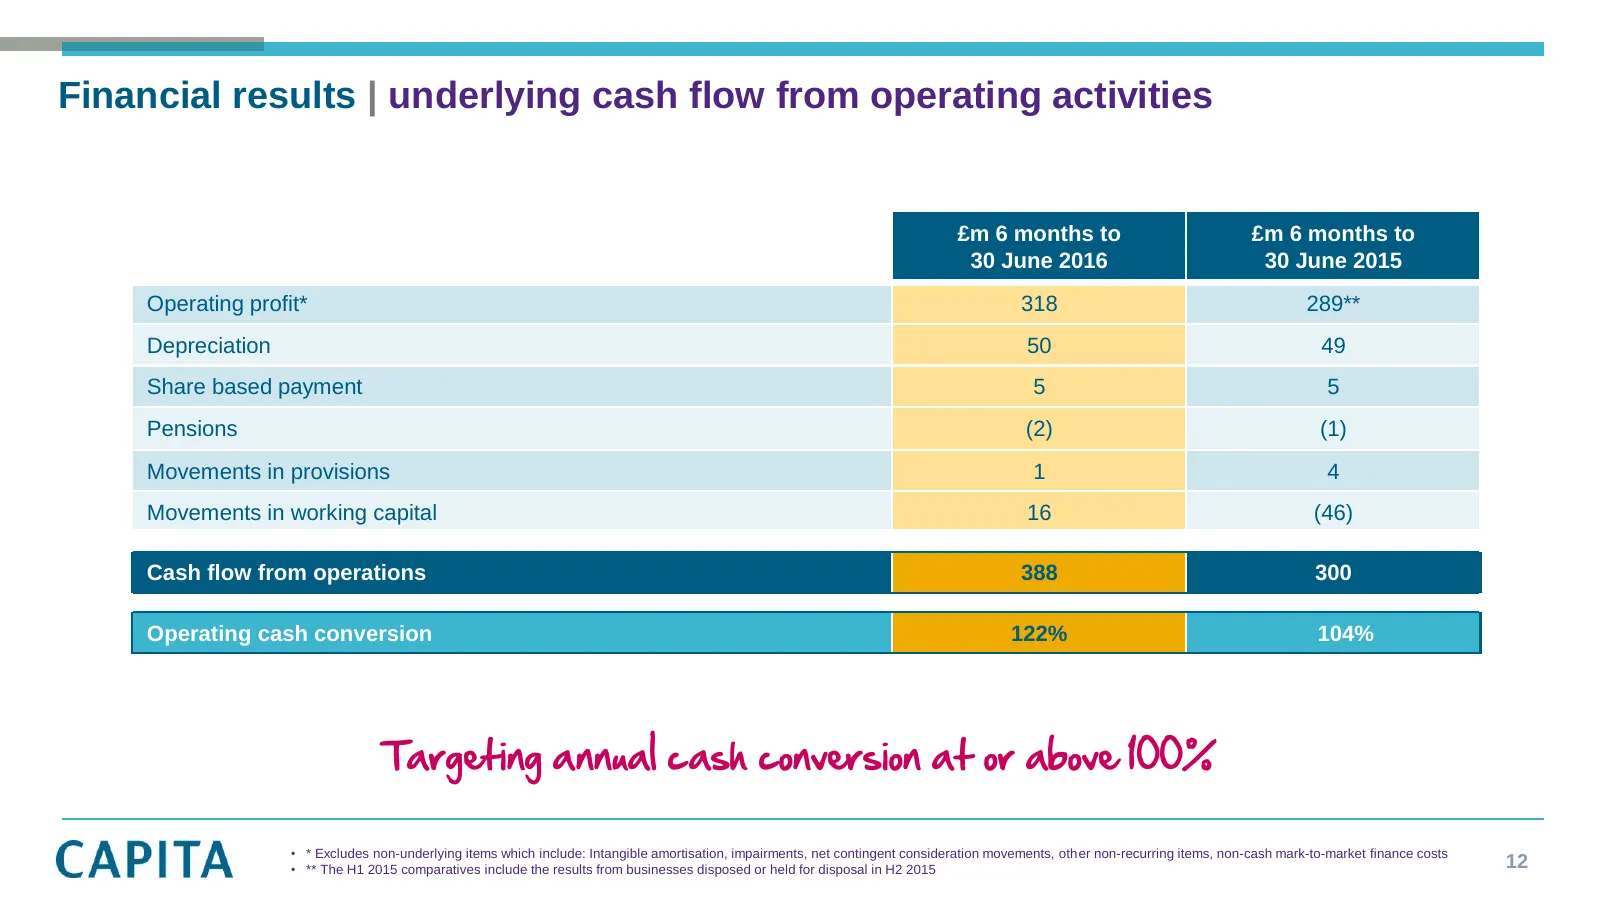
Financial results | underlying cash flow from operating activities £m 6 months to £m 6 months to 30 June 2016 30 June 2015 Operating profit* 318 289** Depreciation 50 49 Share based payment 5 5 Pensions (2) (1) Movements in provisions 1 4 Movements in working capital 16 (46) Cash flow from operation
Slide 13: Underlying cash flow statement
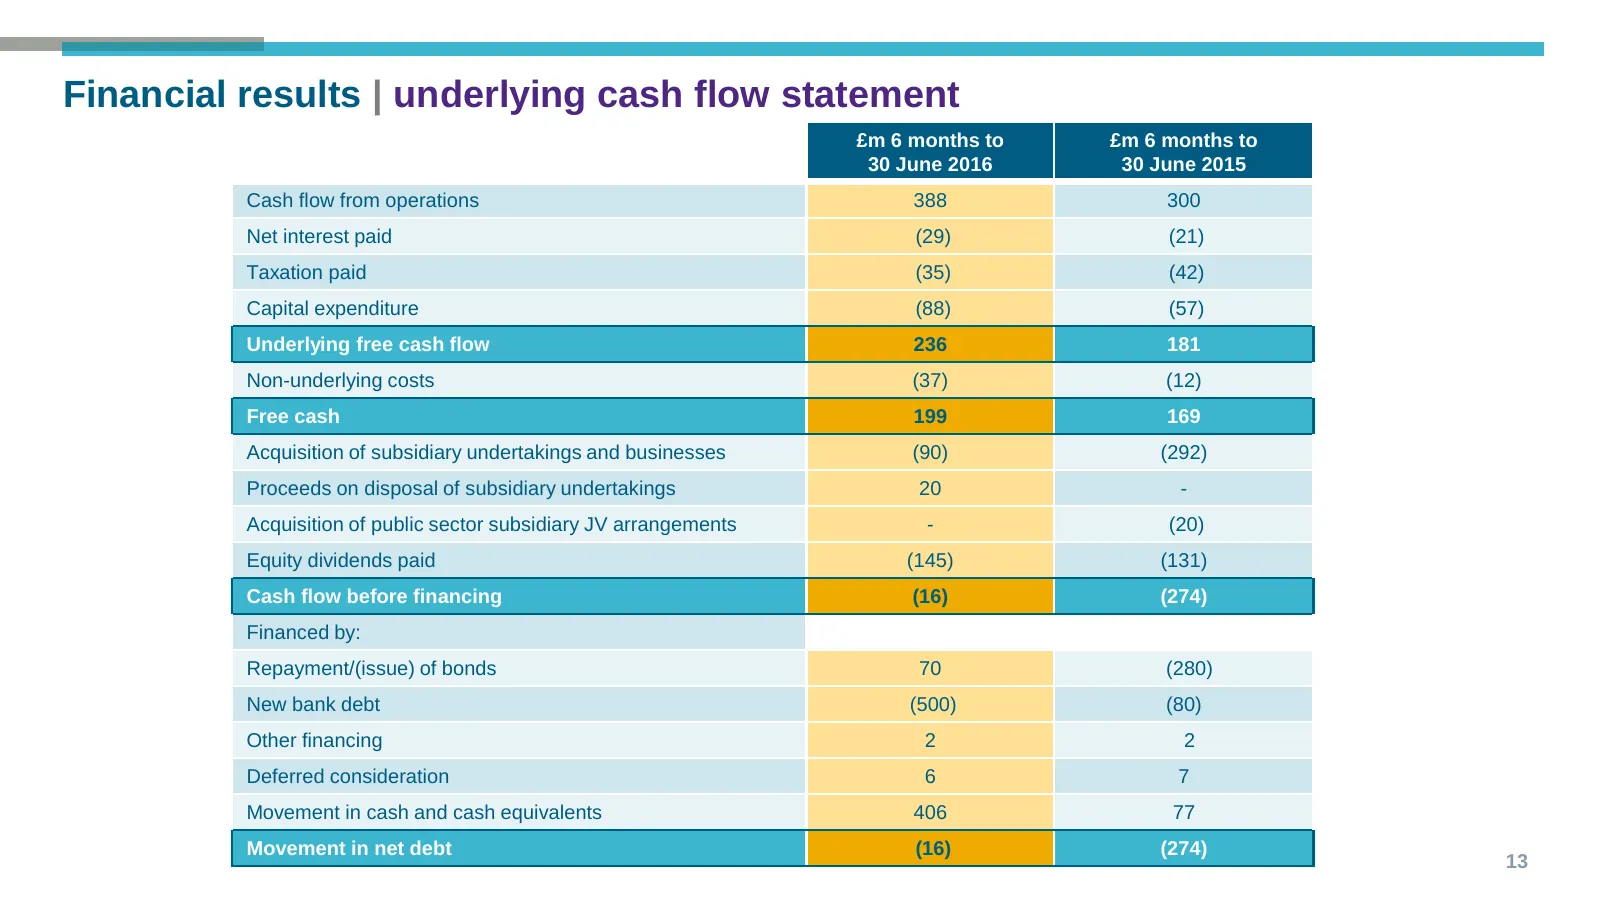
Financial results | underlying cash flow statement £m 6 months to £m 6 months to 30 June 2016 30 June 2015 Cash flow from operations 388 300 Net interest paid (29) (21) Taxation paid (35) (42) Capital expenditure (88) (57) Underlying free cash flow 236 181 Non-underlying costs (37) (12) Free cash 19
Slide 14: Controlled uses of cash
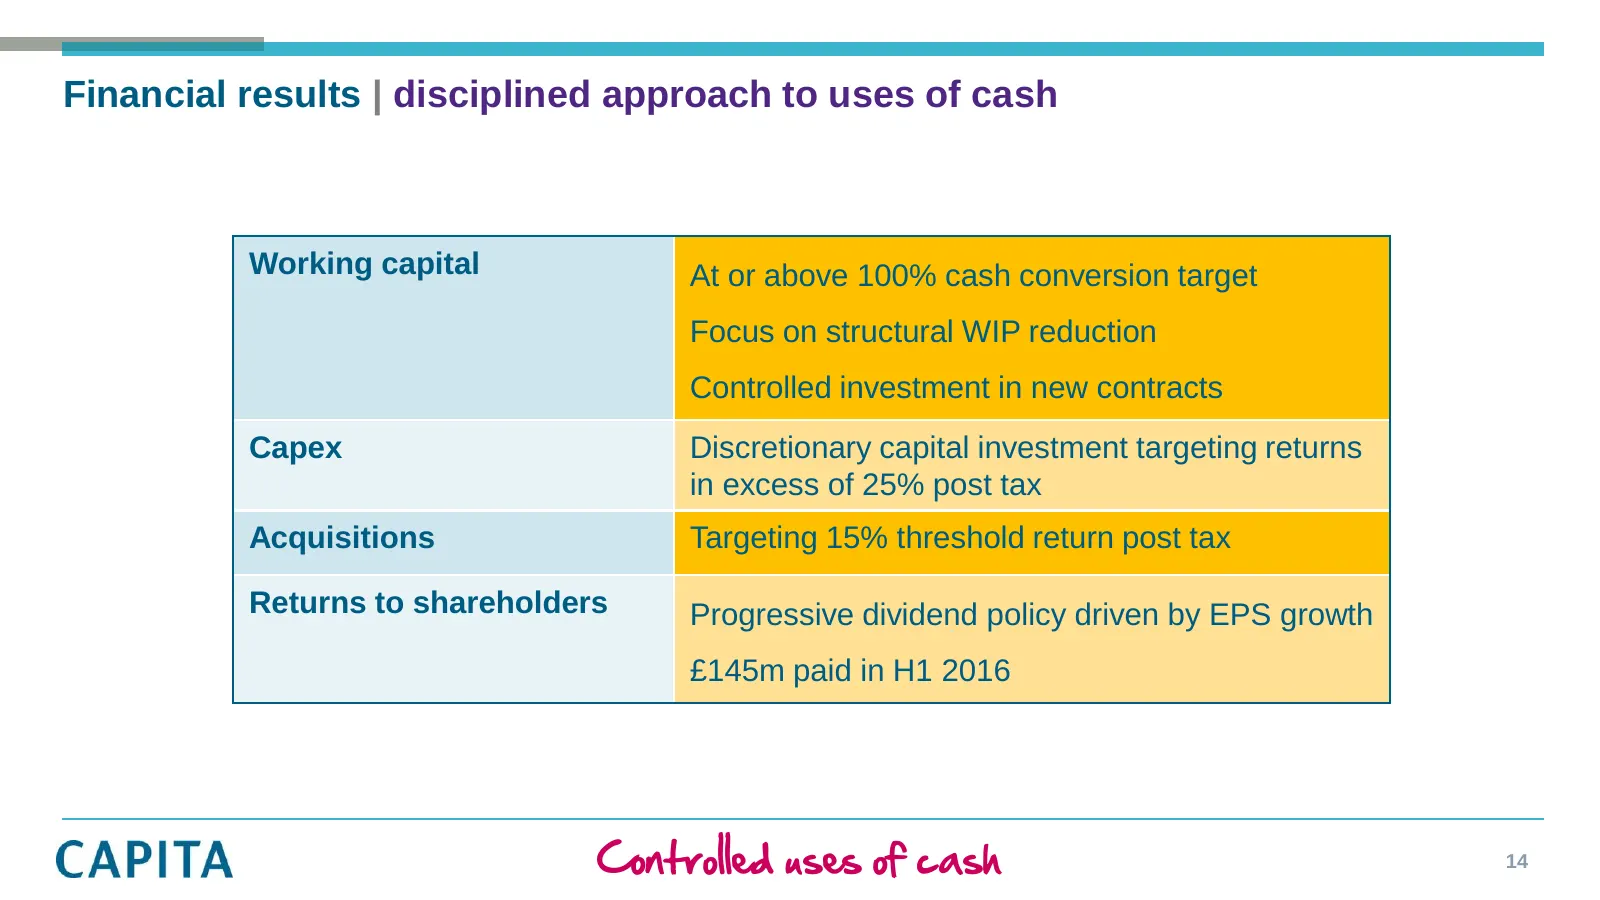
Financial results | disciplined approach to uses of cash Working capital At or above 100% cash conversion target Focus on structural WIP reduction Controlled investment in new contracts Capex Discretionary capital investment targeting returns in excess of 25% post tax Acquisitions Targeting 15% thre
Slide 15: Controlled capital expenditure
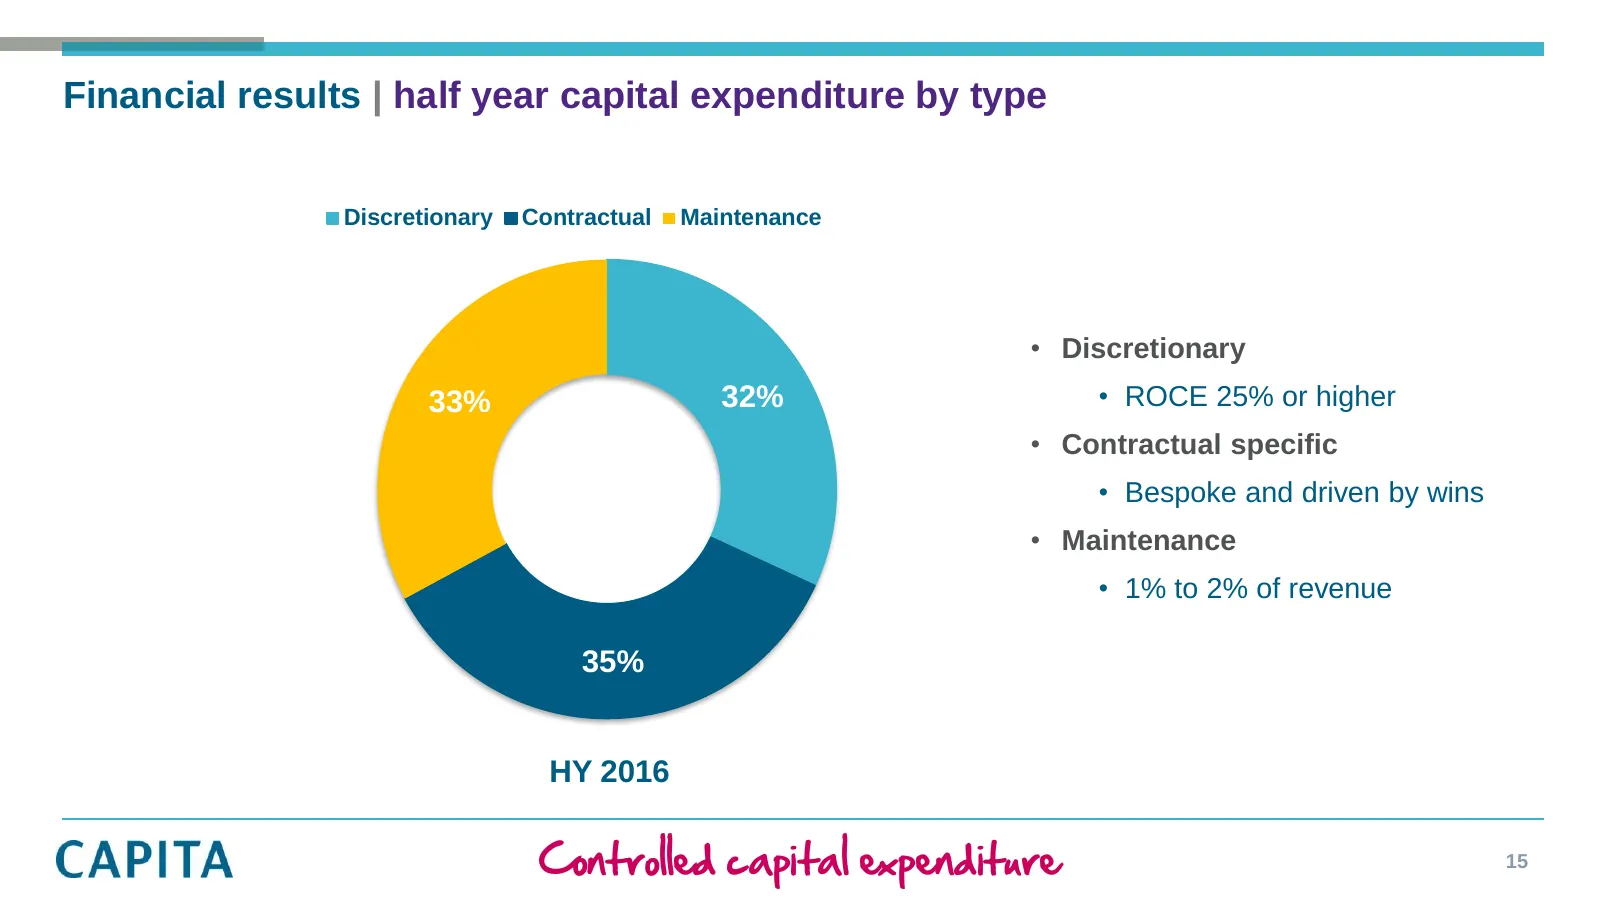
Financial results | half year capital expenditure by type Discretionary Contractual Maintenance • Discretionary 33% 32% • ROCE 25% or higher • Contractual specific • Bespoke and driven by wins • Maintenance • 1% to 2% of revenue 35% HY 2016 Controlled capital expenditure 15
Slide 16: Efficient balance sheet
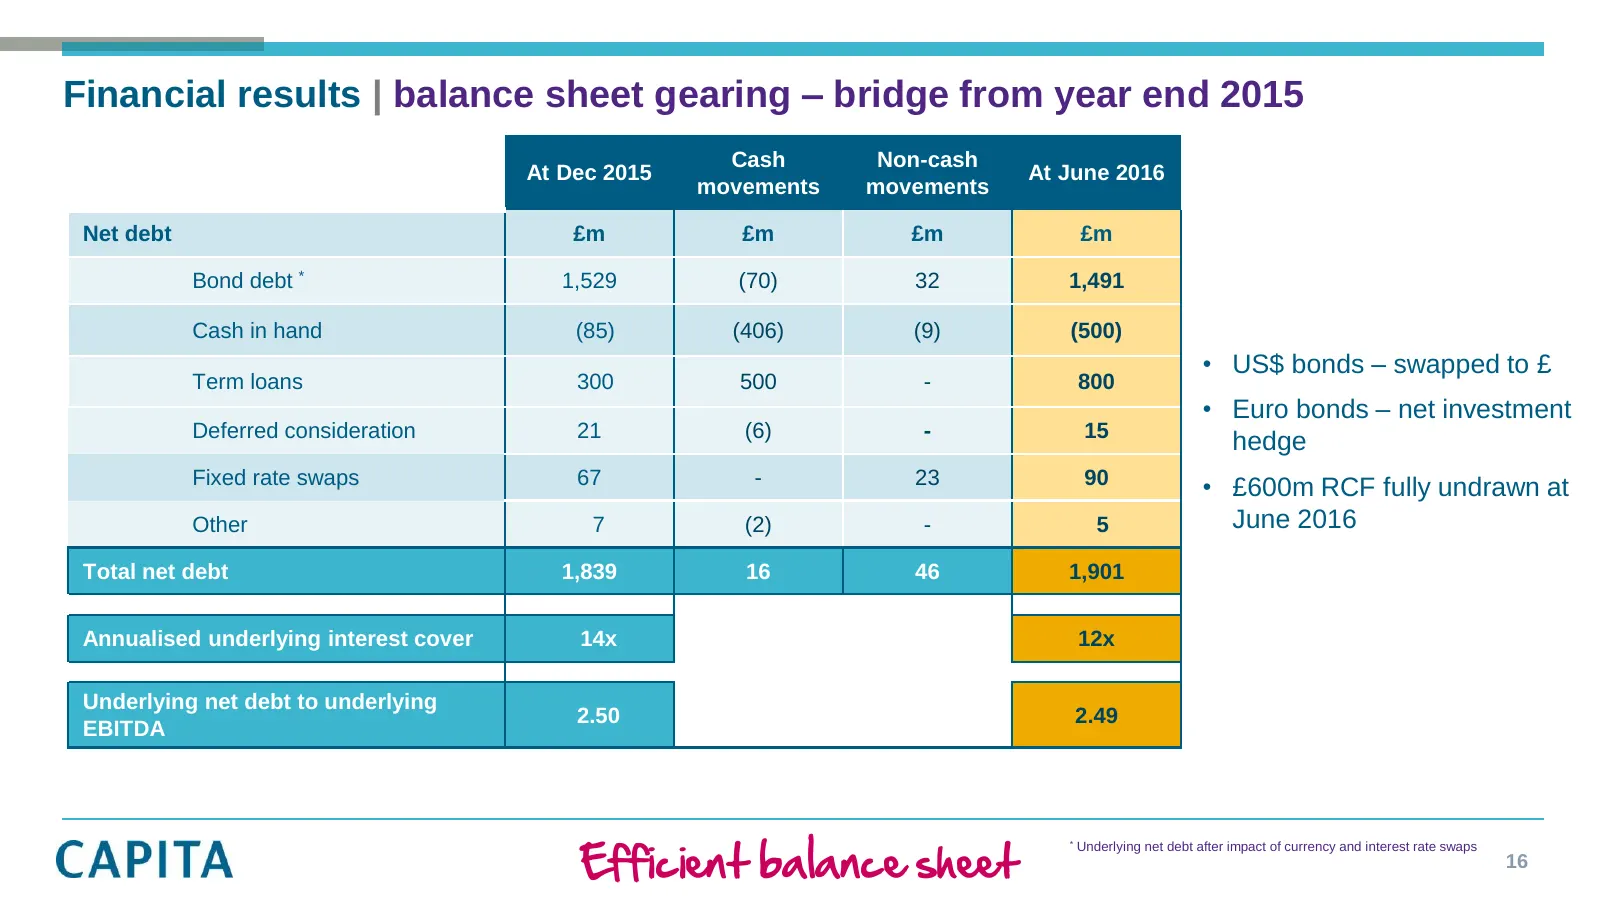
Financial results | balance sheet gearing – bridge from year end 2015 Cash Non-cash At Dec 2015 At June 2016 movements movements Net debt £m £m £m £m Bond debt * 1,529 (70) 32 1,491 Cash in hand (85) (406) (9) (500) • US$ bonds – swapped to £ Term loans 300 500 - 800 • Euro bonds – net investment De
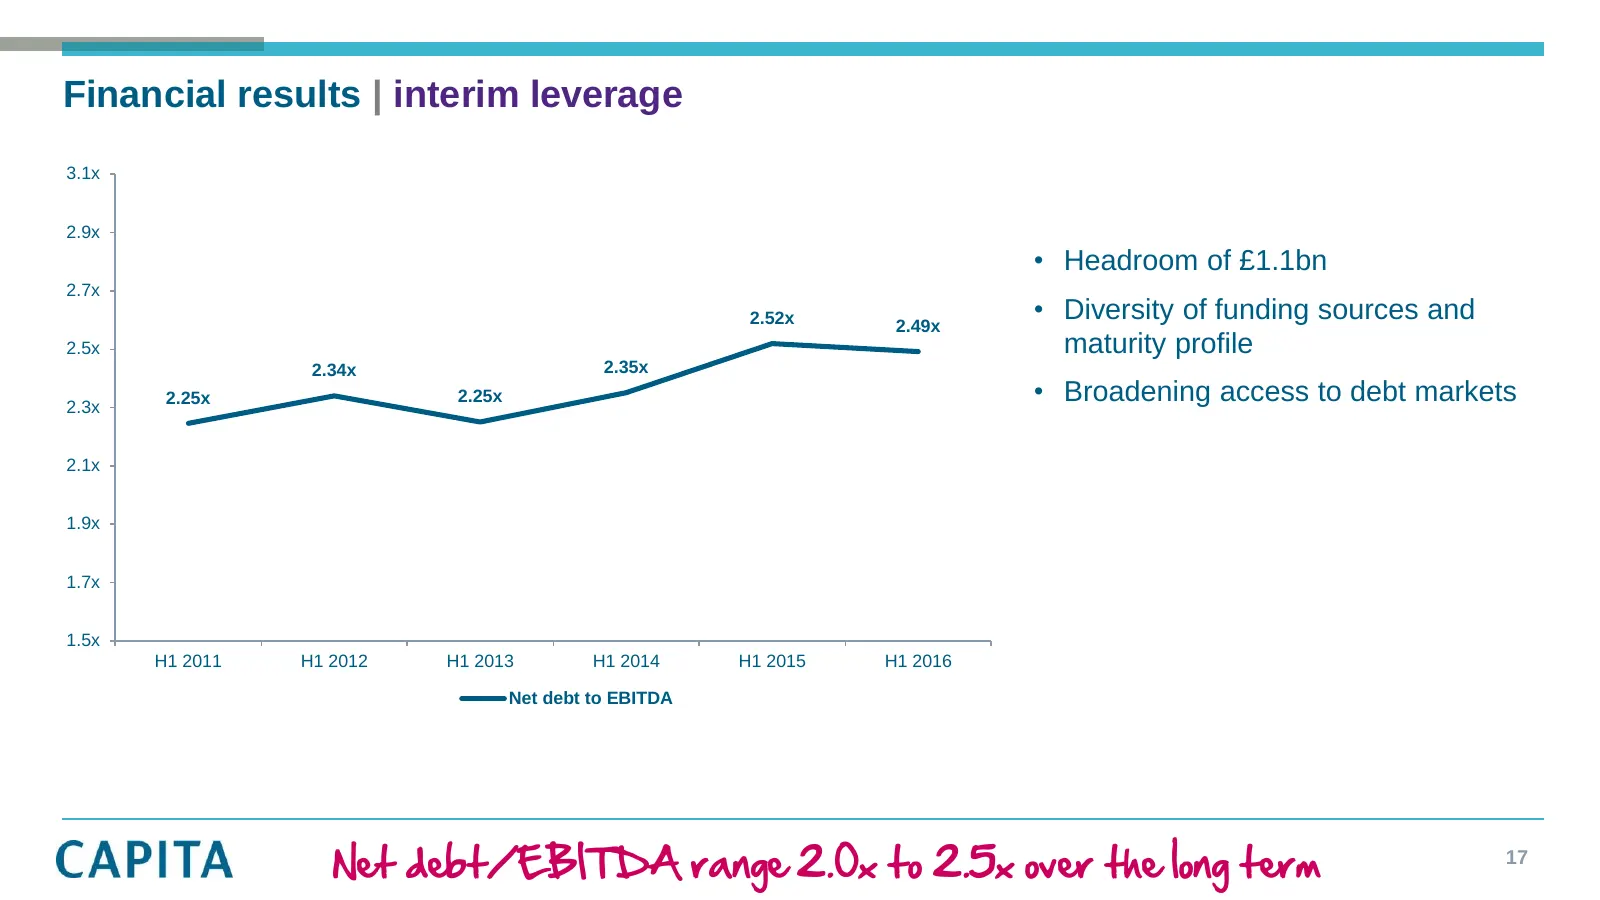
Slide 17: Net debt/EBITDA range 2.0x to 2.5x over the long term
Financial results | interim leverage 3.1x 2.9x • Headroom of £1.1bn 2.7x 2.52x 2.49x • Diversity of funding sources and 2.5x maturity profile 2.34x 2.35x 2.3x 2.25x 2.25x • Broadening access to debt markets 2.1x 1.9x 1.7x 1.5x H1 2011 H1 2012 H1 2013 H1 2014 H1 2015 H1 2016 Net debt to EBITDA Net de
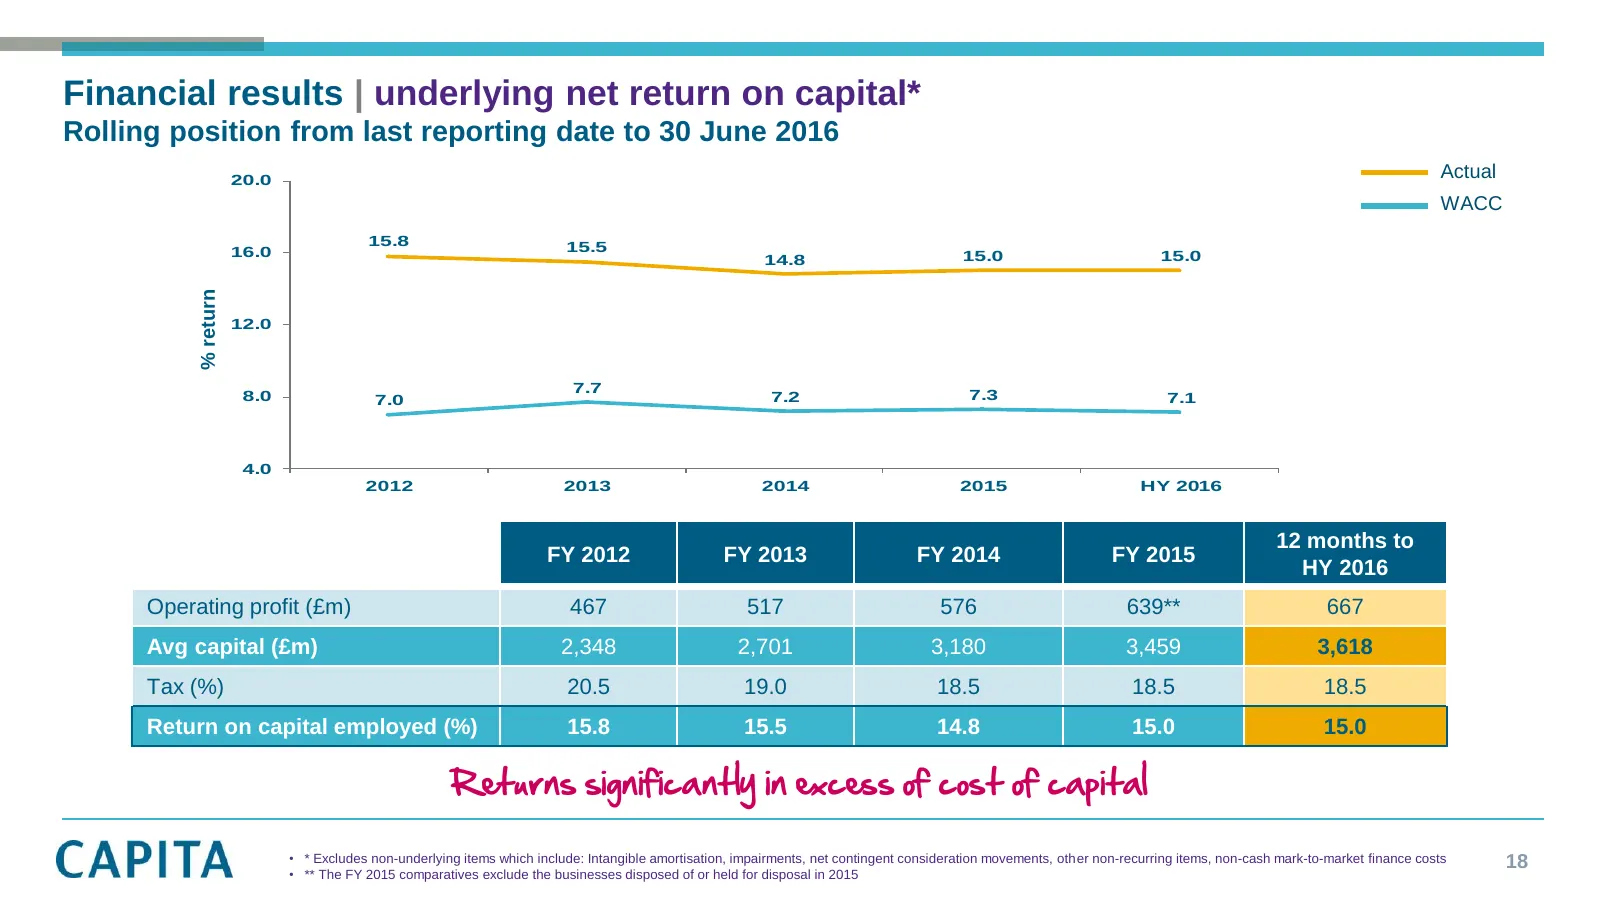
Slide 18: Underlying net return on capital
Financial results | underlying net return on capital* Rolling position from last reporting date to 30 June 2016 20.0 Actual WACC 15.8 15.5 16.0 15.0 15.0 14.8 % return 12.0 7.7 7.3 8.0 7.0 7.2 7.1 4.0 2012 2013 2014 2015 HY 2016 12 months to FY 2012 FY 2013 FY 2014 FY 2015 HY 2016 Operating profit (
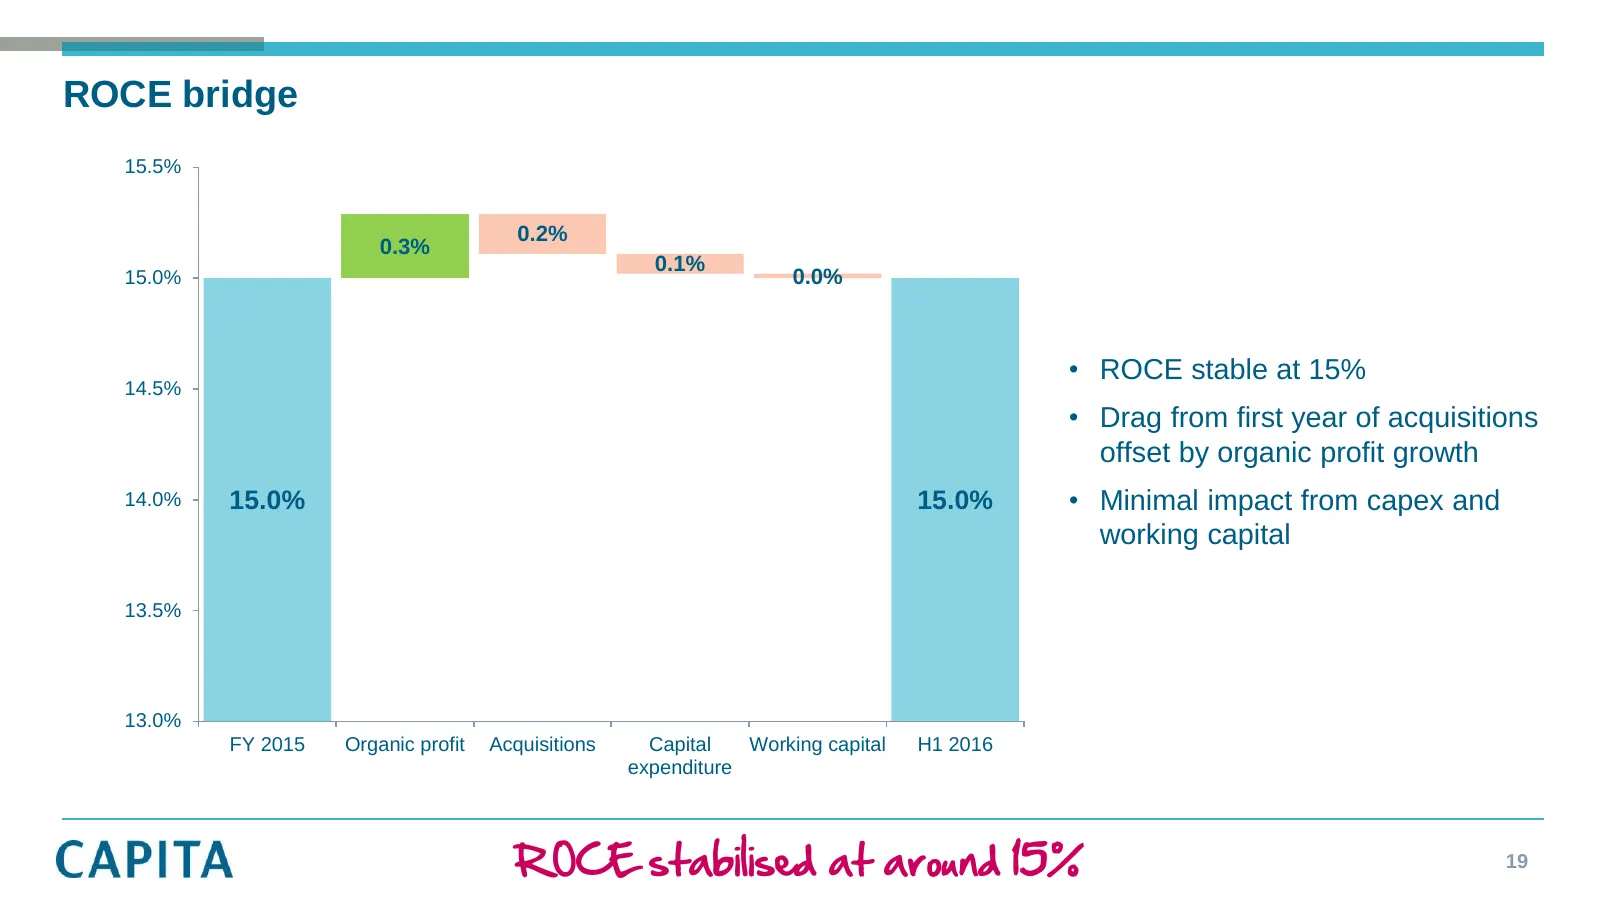
Slide 19: ROCE stabilised at around 15%
ROCE bridge 15.5% 0.2% 0.3% 0.1% 15.0% 0.0% • ROCE stable at 15% 14.5% • Drag from first year of acquisitions offset by organic profit growth 14.0% 15.0% 15.0% • Minimal impact from capex and working capital 13.5% 13.0% FY 2015 Organic profit Acquisitions Capital Working capital H1 2016 expenditure
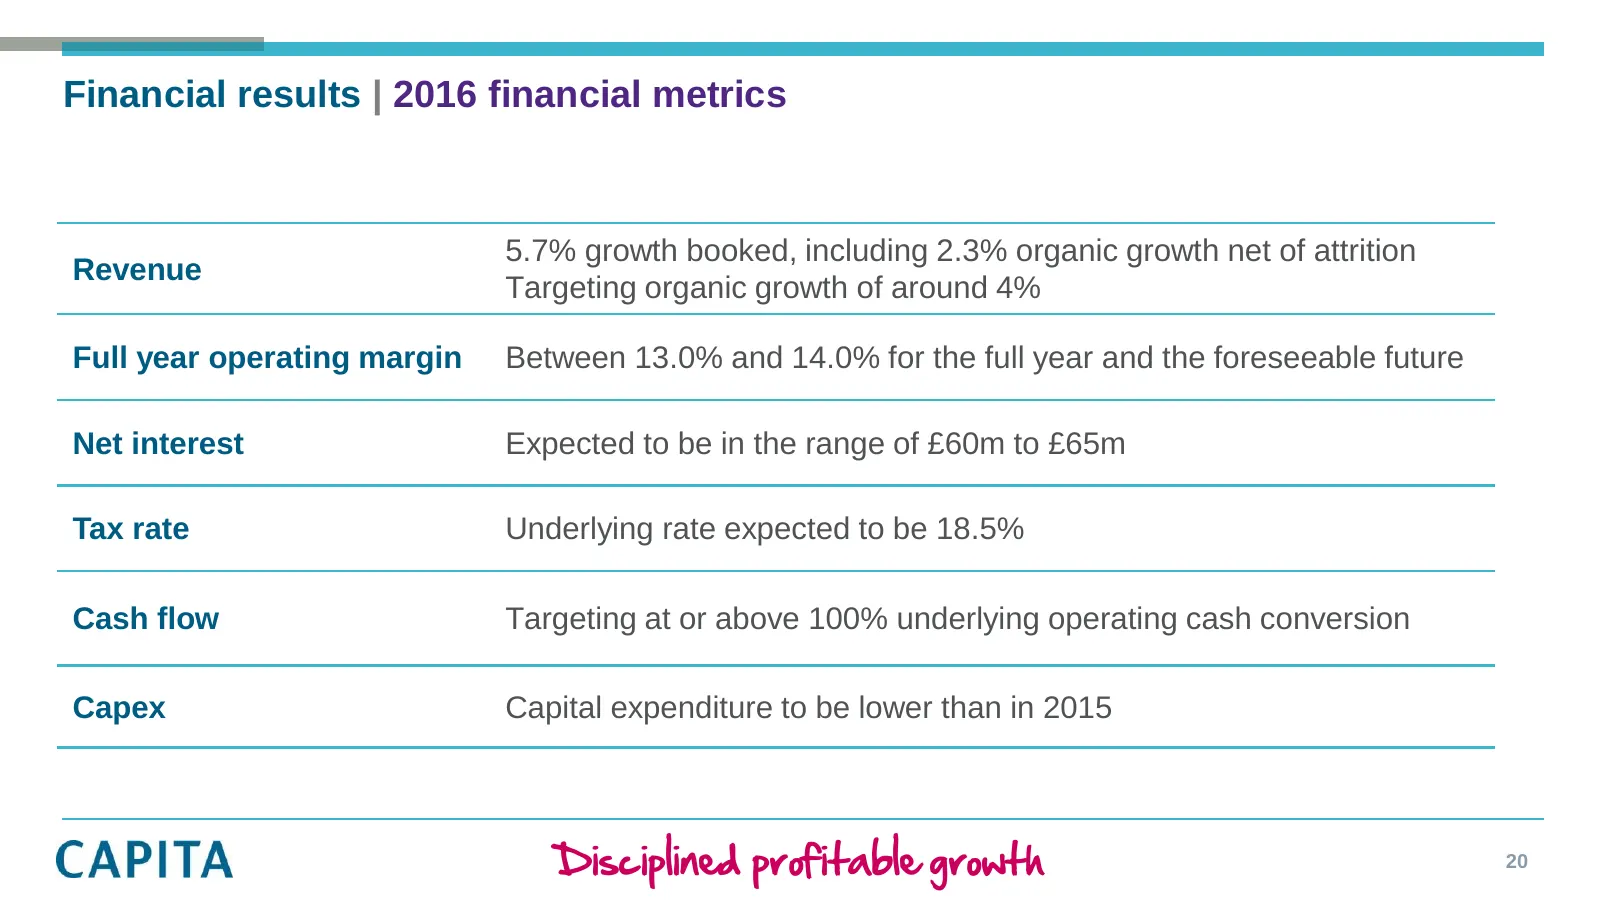
Slide 20: Disciplined profitable growth: 2016 financial metrics
Financial results | 2016 financial metrics 5.7% growth booked, including 2.3% organic growth net of attrition Revenue Targeting organic growth of around 4% Full year operating margin Between 13.0% and 14.0% for the full year and the foreseeable future Net interest Expected to be in the range of £60m
Slide 21: Driving organic growth: Business development
Driving organic growth: Business development Maggi Bell Group Business Development Director
Slide 22: Focusing sales resource and capability
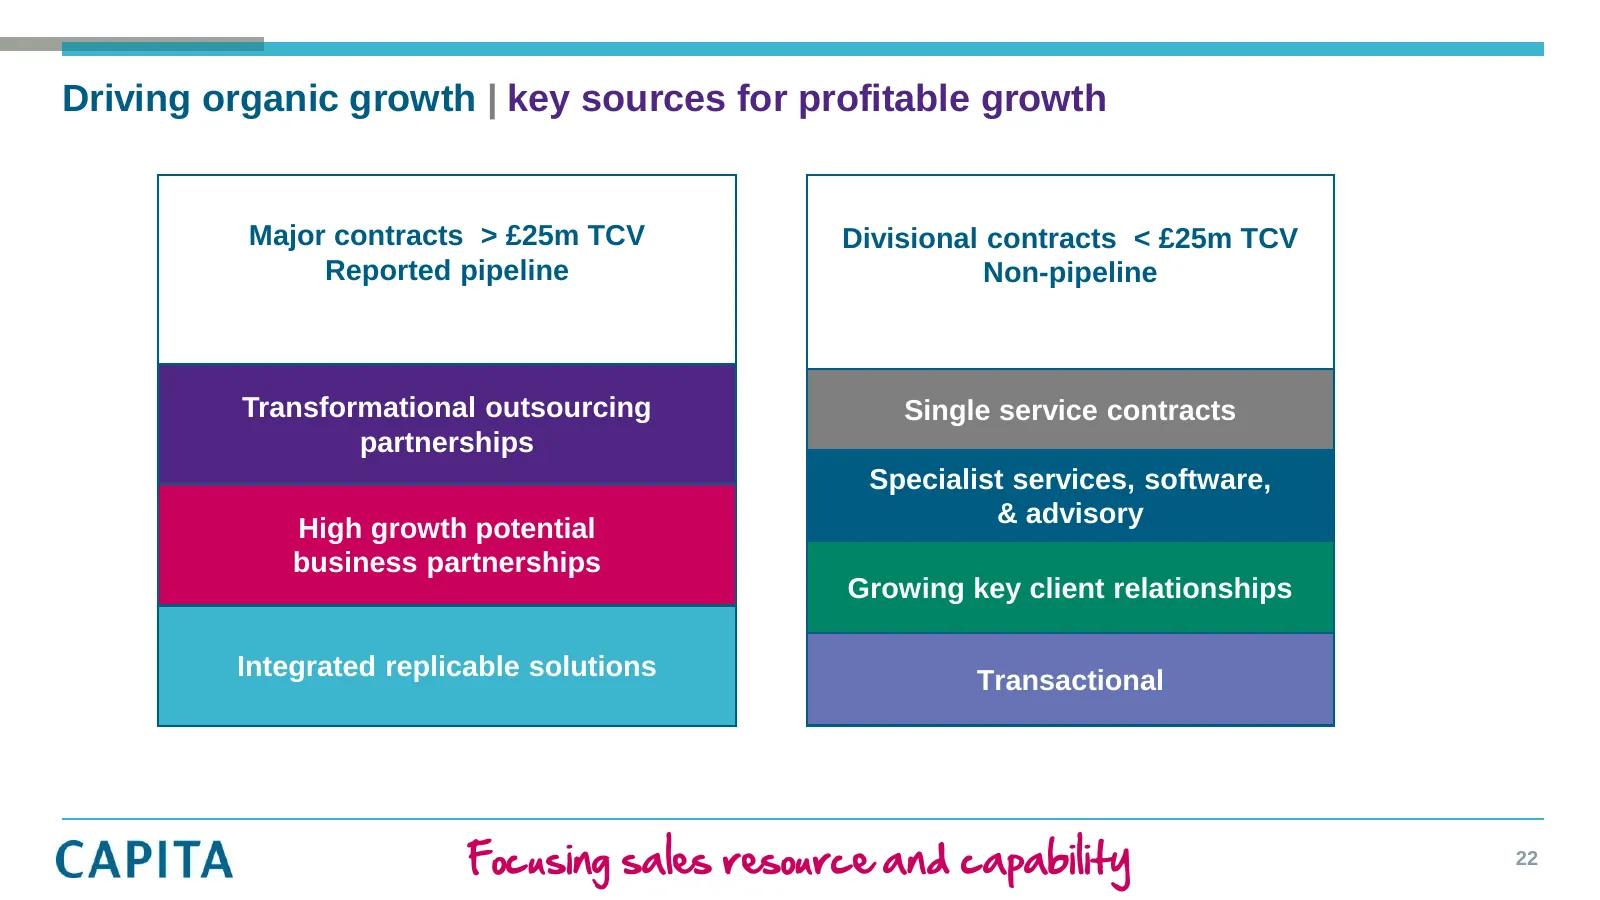
Driving organic growth | key sources for profitable growth Major contracts > £25m TCV Divisional contracts < £25m TCV Reported pipeline Non-pipeline Transformational outsourcing Single service contracts partnerships Specialist services, software, High growth potential & advisory business partnership
Slide 23: Fuelling future growth: major contract wins H1 2016
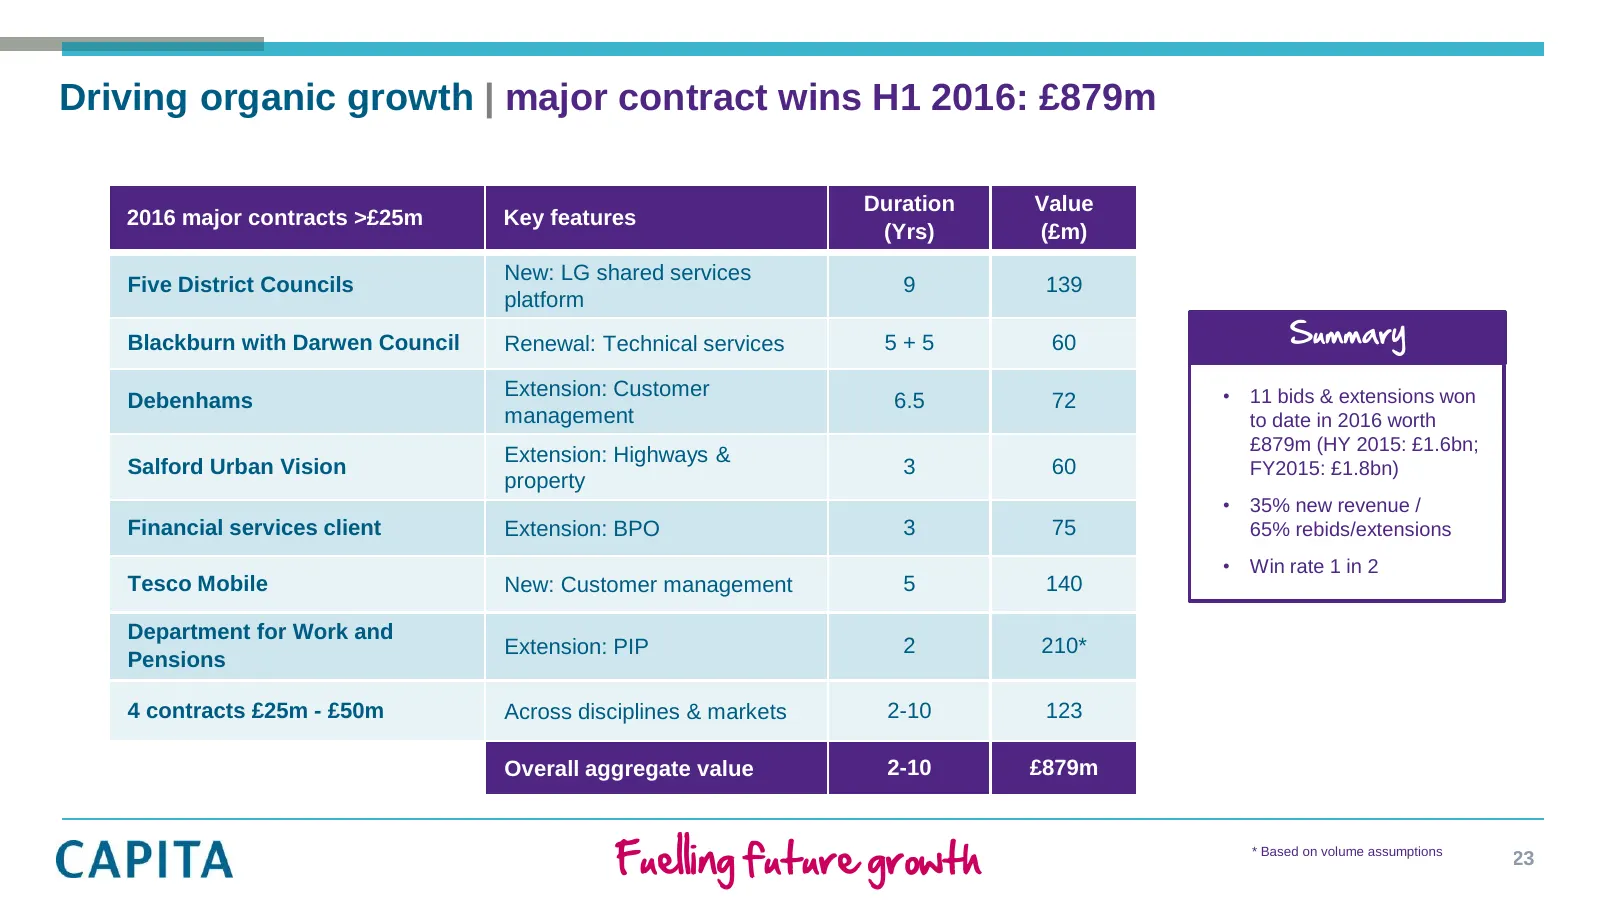
Driving organic growth | major contract wins H1 2016: £879m Duration Value 2016 major contracts >£25m Key features (Yrs) (£m) New: LG shared services Five District Councils 9 139 platform Blackburn with Darwen Council Renewal: Technical services 5+5 60 Summary Extension: Customer • 11 bids & extensi
Slide 24: Extending our customer management reach in telecoms
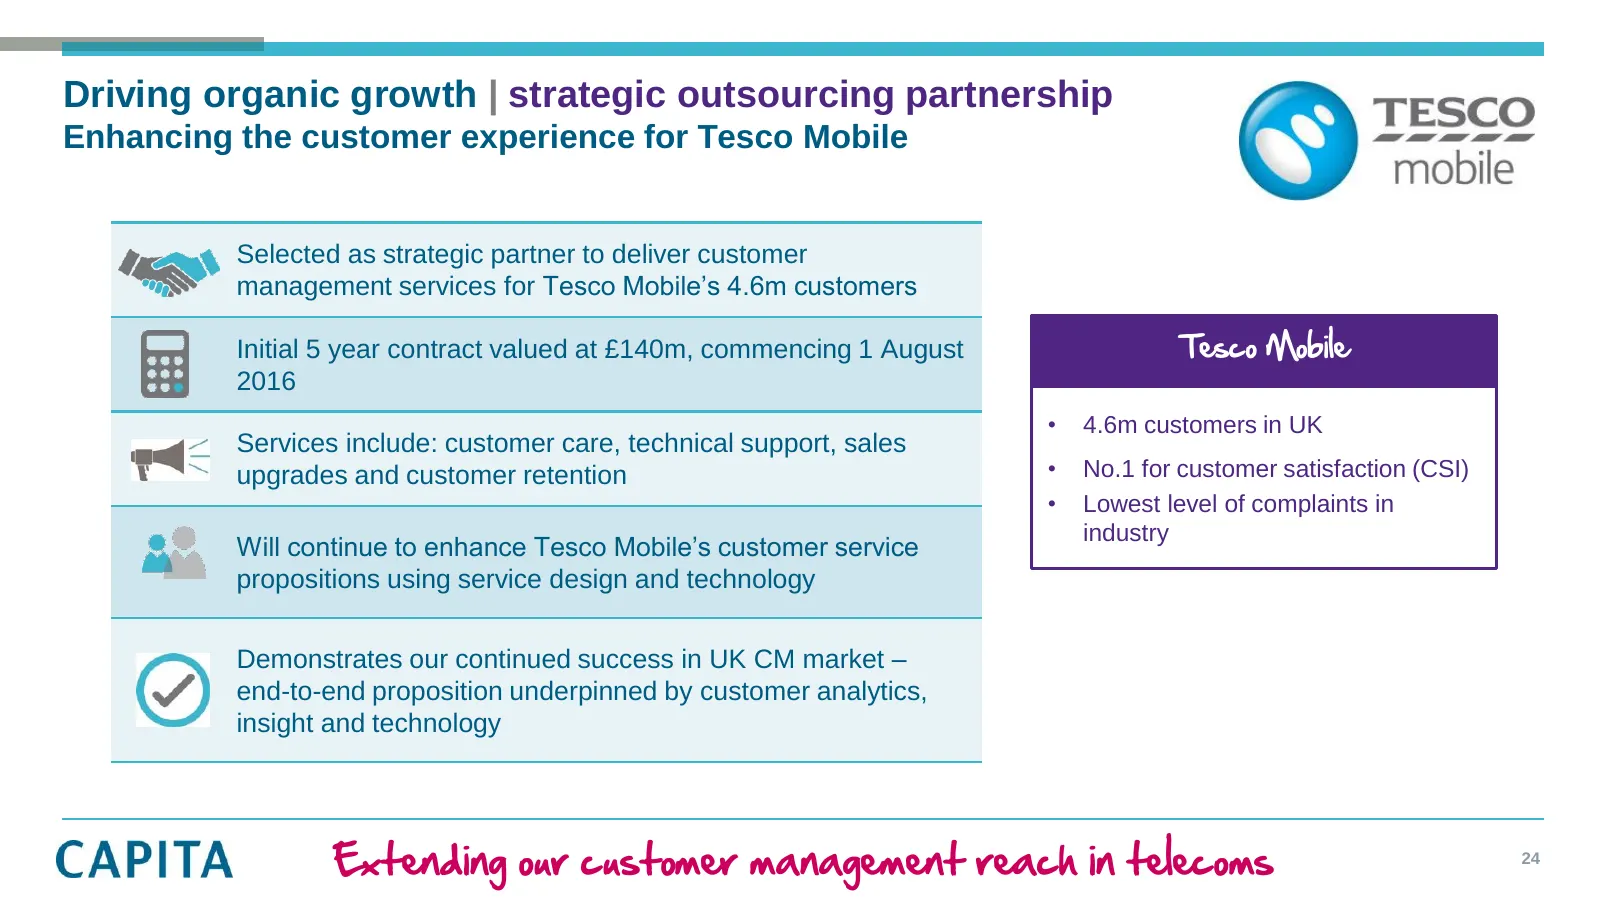
Driving organic growth | strategic outsourcing partnership Enhancing the customer experience for Tesco Mobile Selected as strategic partner to deliver customer management services for Tesco Mobile’s 4.6m customers Initial 5 year contract valued at £140m, commencing 1 August Tesco Mobile 2016 • 4.6m
Slide 25: Blackburn with Darwen: new partnership model
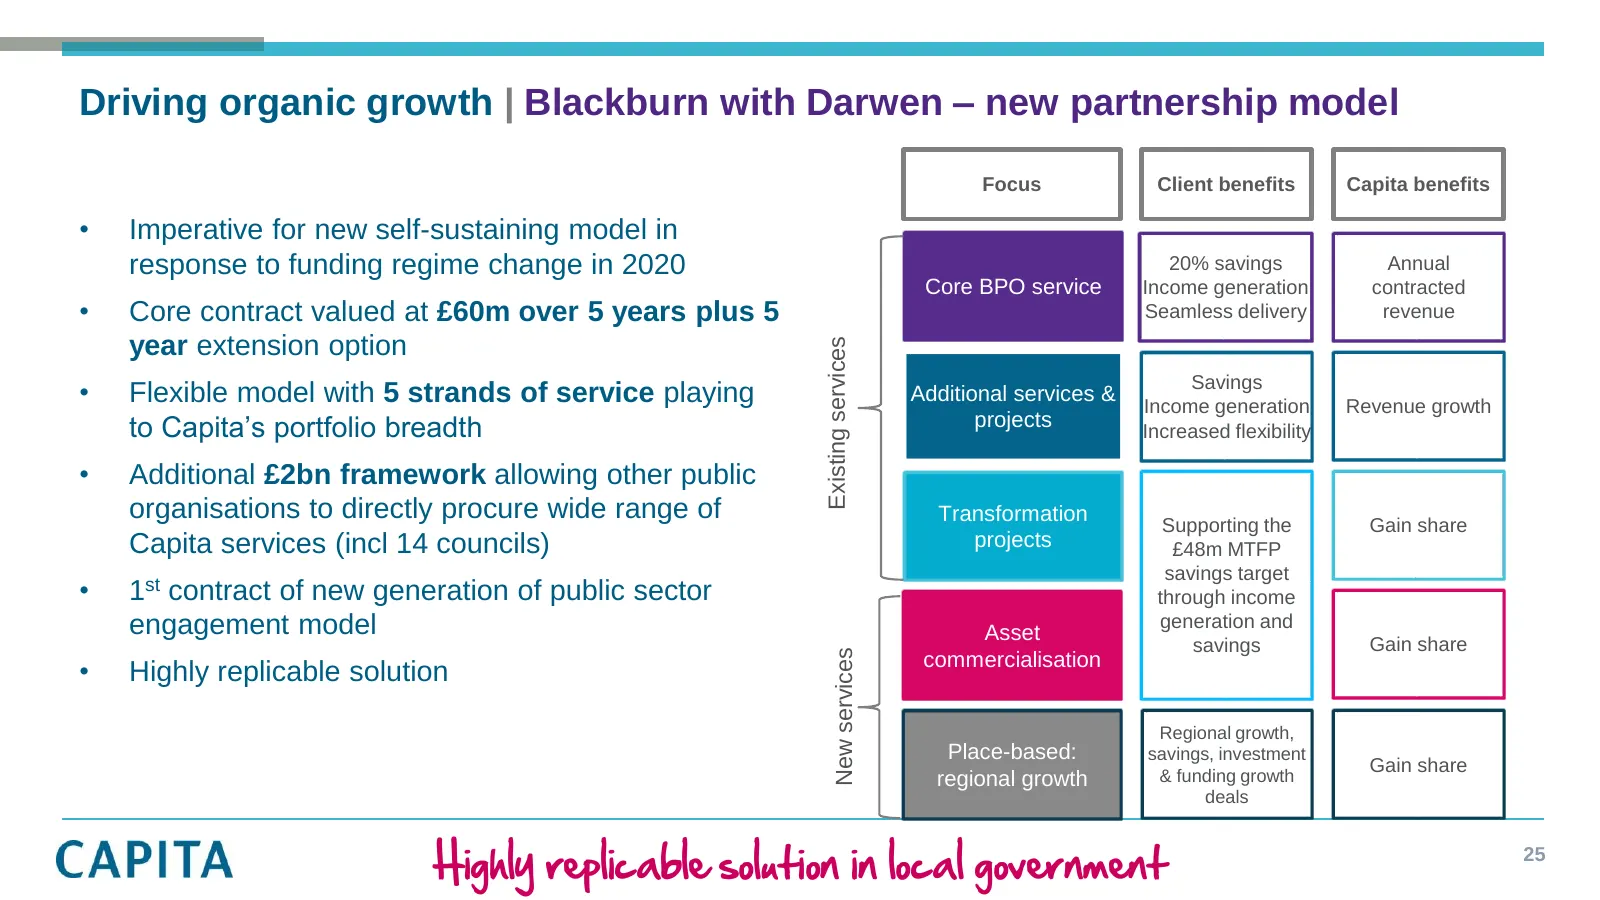
Driving organic growth | Blackburn with Darwen – new partnership model Focus Client benefits Capita benefits • Imperative for new self-sustaining model in response to funding regime change in 2020 20% savings Annual Core BPO service Income generation contracted • Core contract valued at £60m over 5
Slide 26: No material contract re-bids until 2019
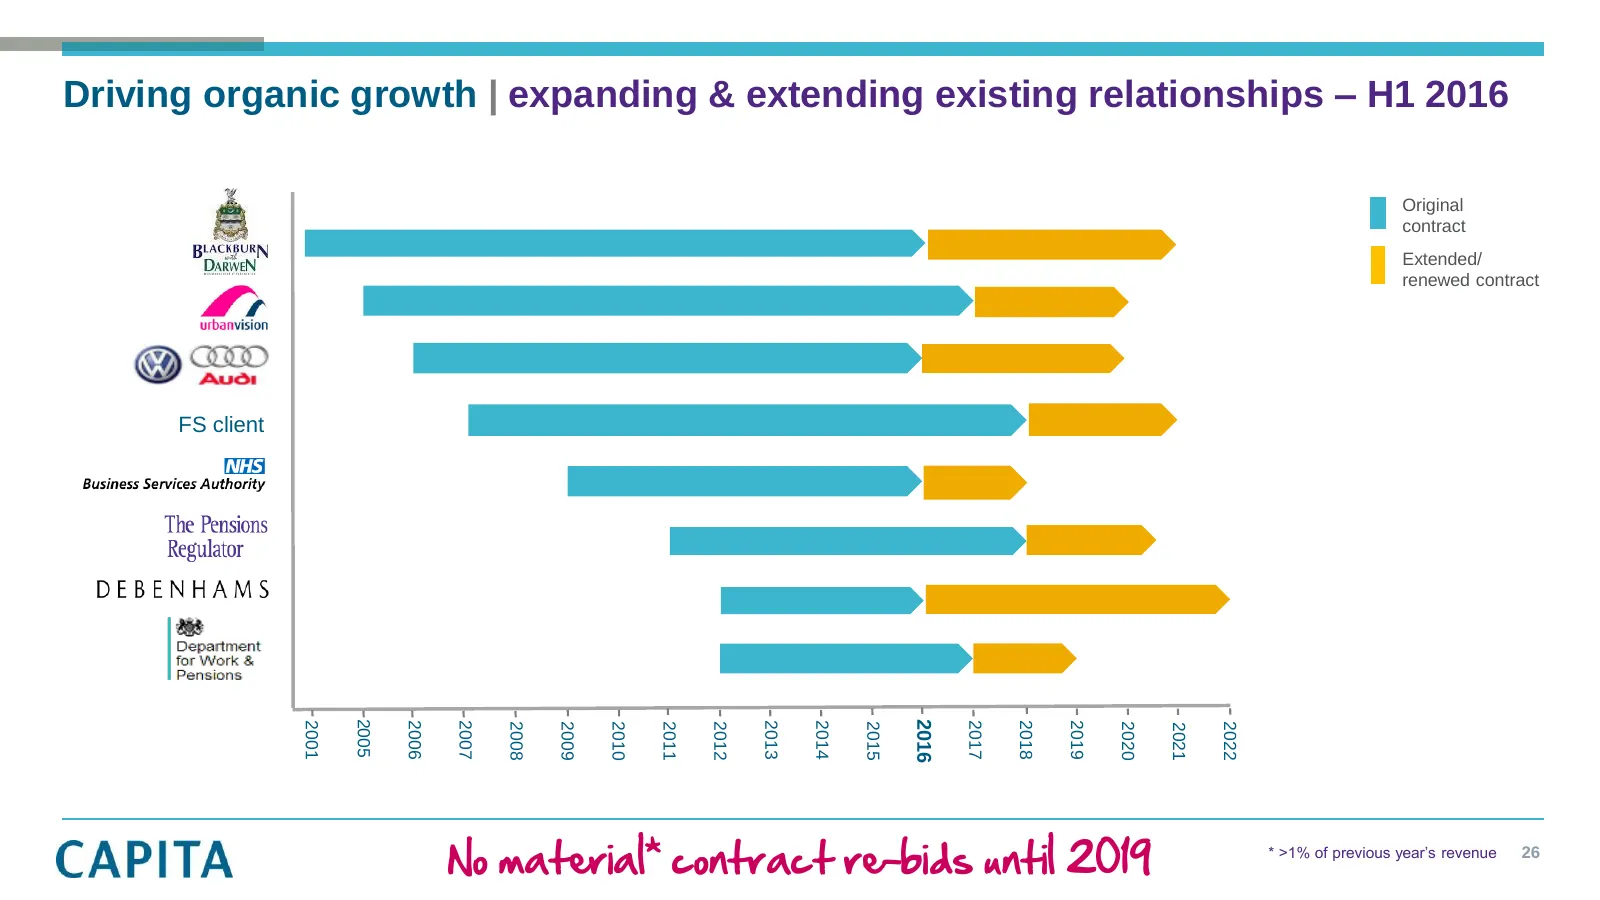
Driving organic growth | expanding & extending existing relationships – H1 2016 Original contract Extended/ renewed contract FS client 2005 2016 2001 2006 2007 2019 2013 2014 2017 2018 2008 2020 2022 2009 2010 2011 2012 2015 2021 No material* contract re-bids until 2019 * >1% of previous year’s reve
Slide 27: Targeting opportunities across diversified markets
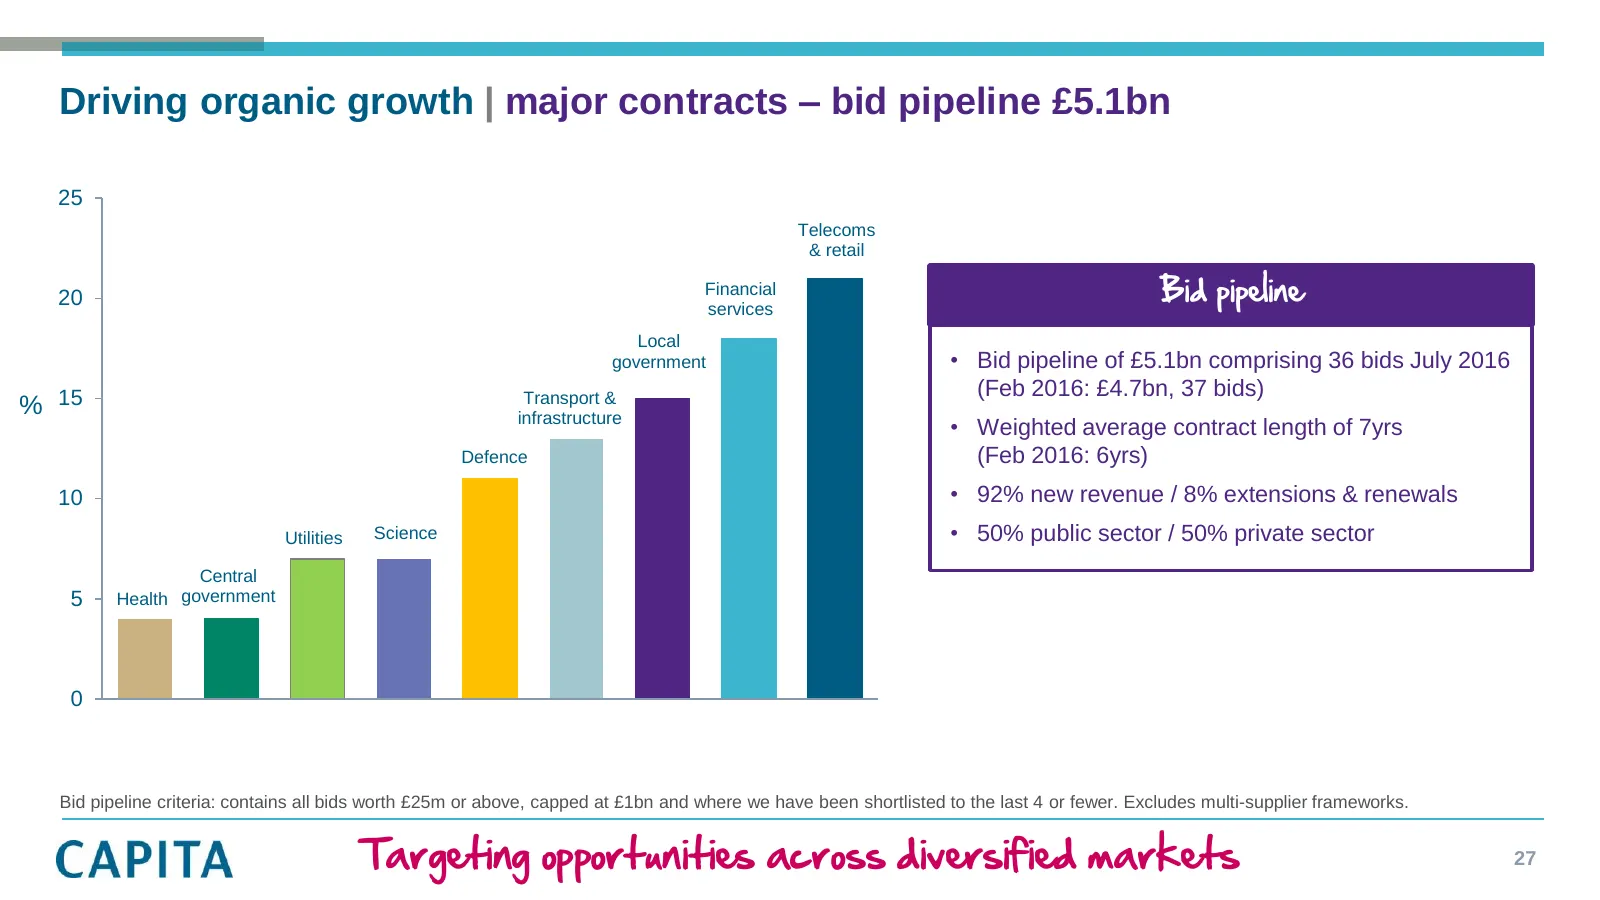
Driving organic growth | major contracts – bid pipeline £5.1bn 25 Telecoms & retail 20 Financial services Bid pipeline Local government • Bid pipeline of £5.1bn comprising 36 bids July 2016 (Feb 2016: £4.7bn, 37 bids) % 15 Transport & infrastructure • Weighted average contract length of 7yrs Defence
Slide 28: Markets are under-penetrated and growing
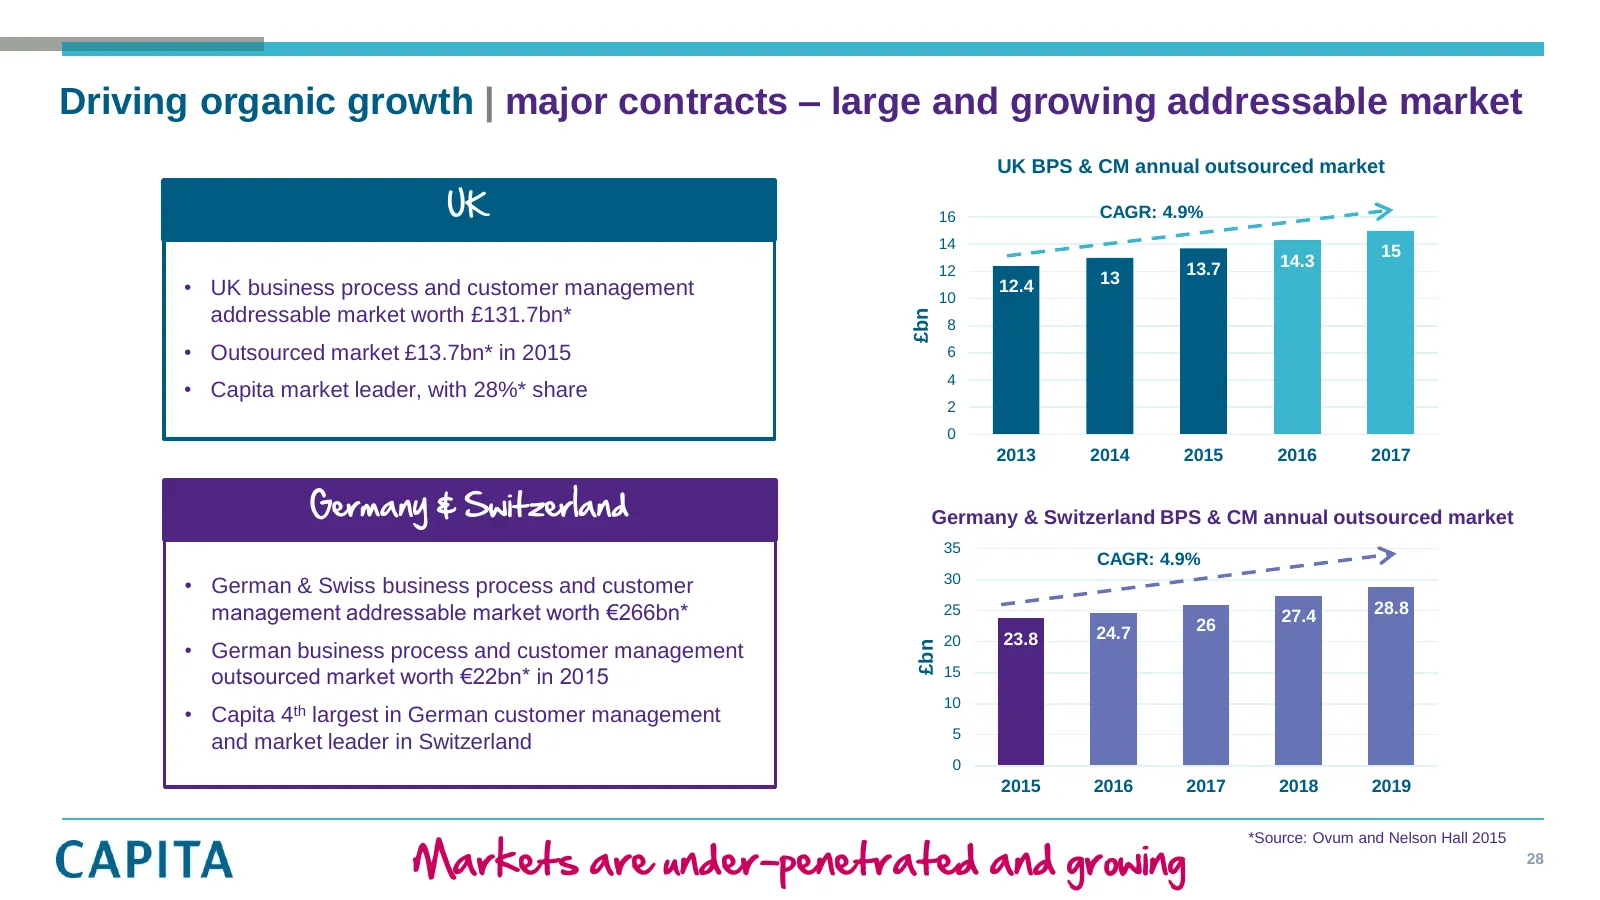
Driving organic growth | major contracts – large and growing addressable market UK BPS & CM annual outsourced market UK 16 CAGR: 4.9% 14 15 13.7 14.3 12 13 • UK business process and customer management 10 12.4 addressable market worth £131.7bn* £bn 8 • Outsourced market £13.7bn* in 2015 6 4 • Capita
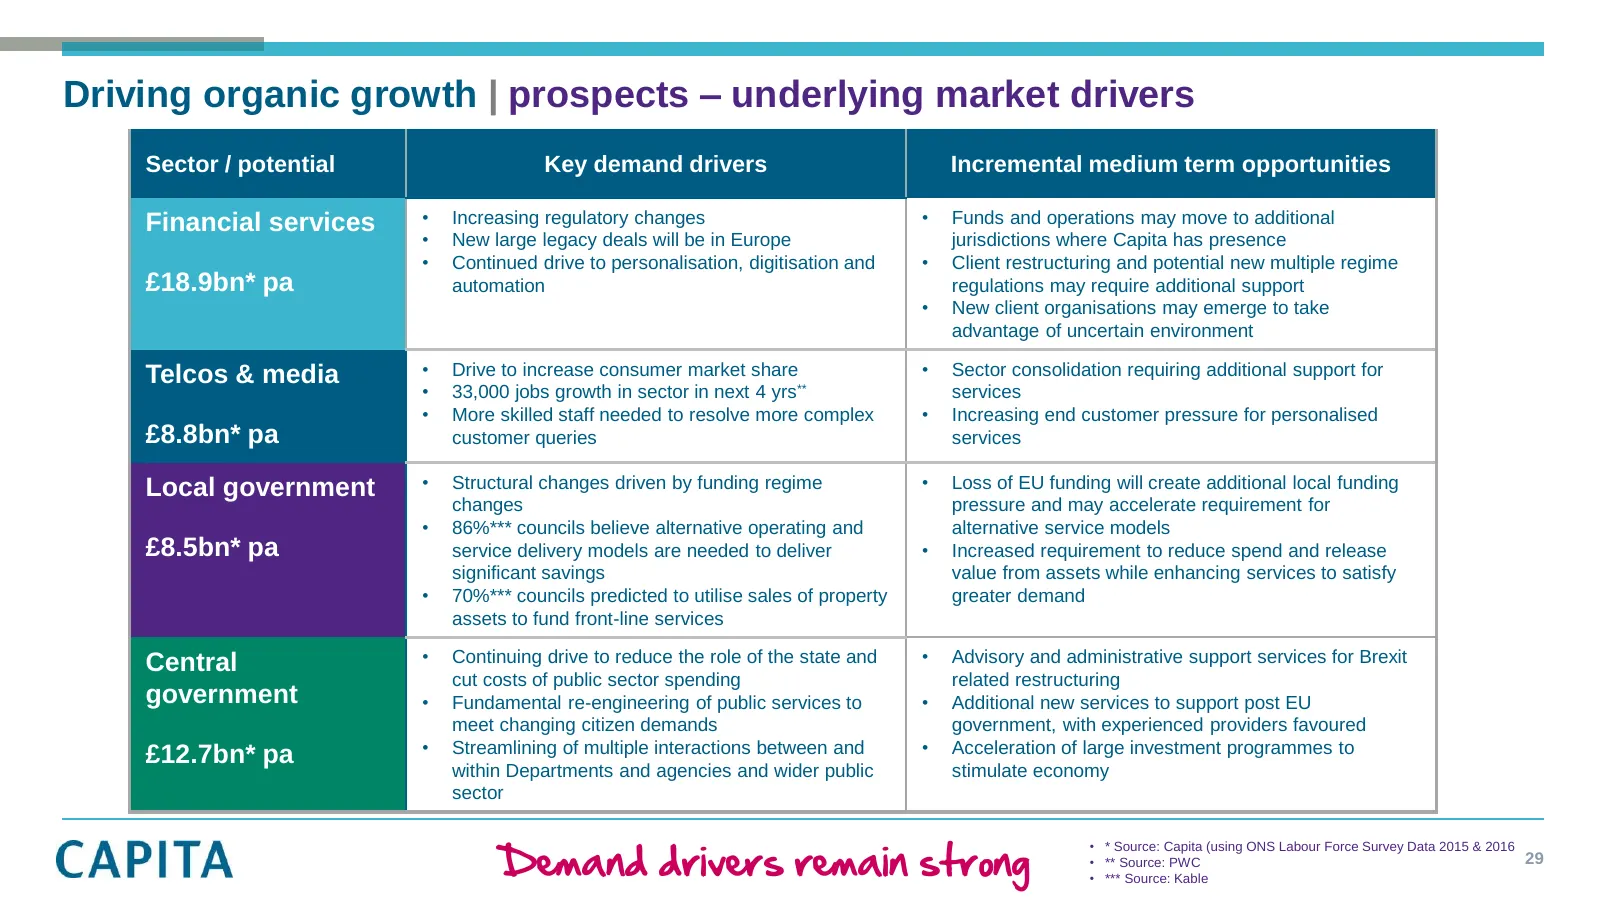
Slide 29: Demand drivers remain strong
Driving organic growth | prospects – underlying market drivers Sector / potential Key demand drivers Incremental medium term opportunities Financial services • Increasing regulatory changes • Funds and operations may move to additional • New large legacy deals will be in Europe jurisdictions where C
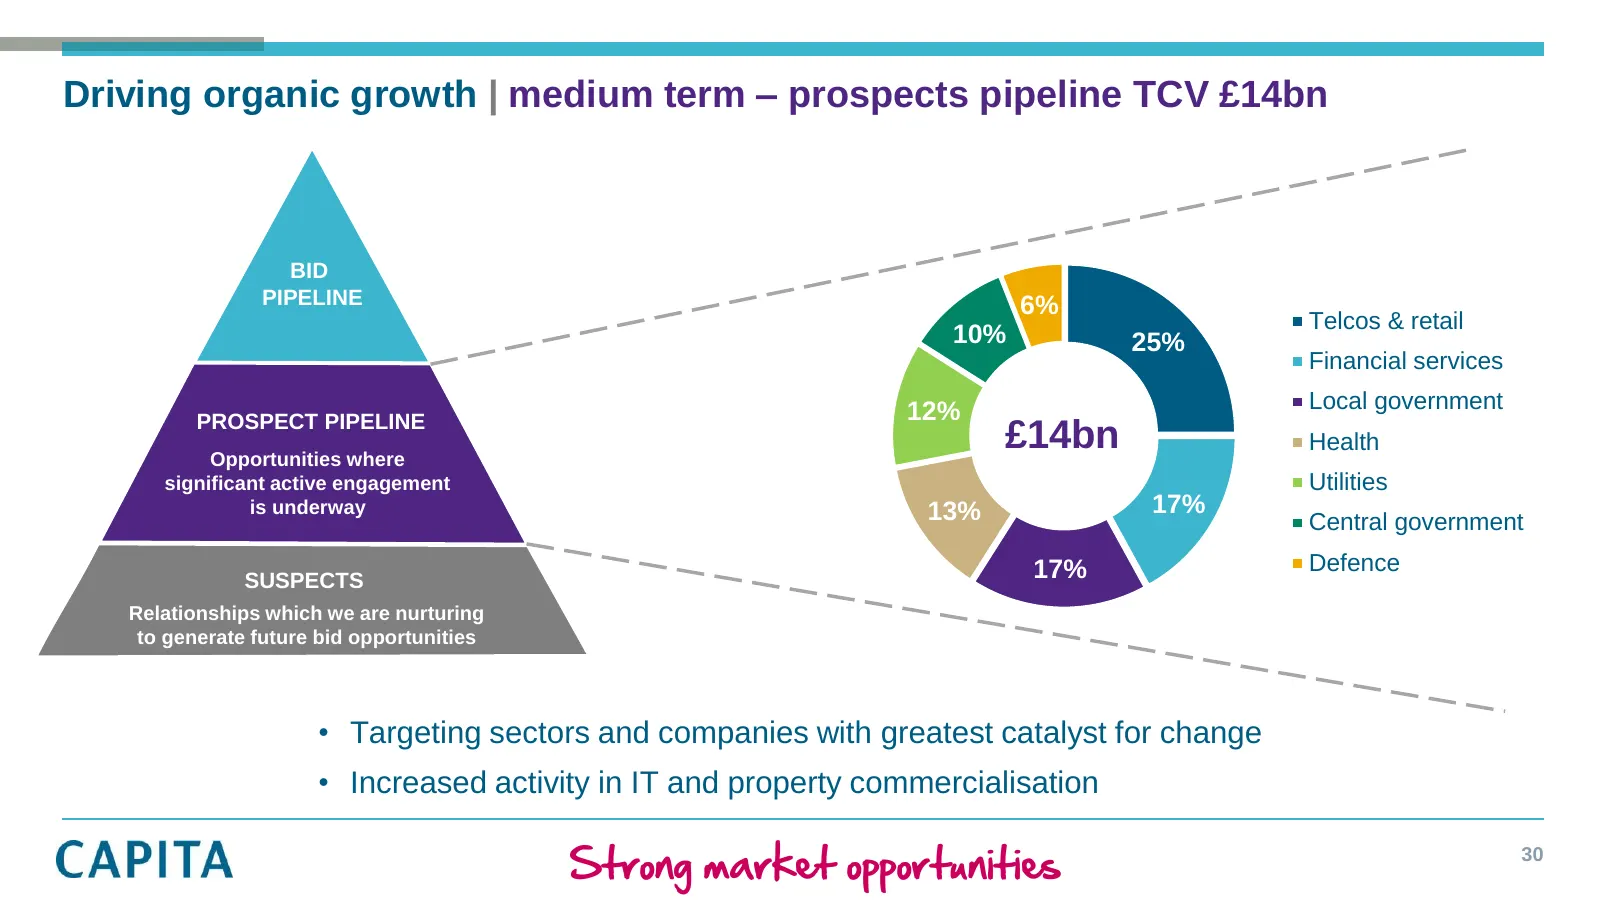
Slide 30: Strong market opportunities
Driving organic growth | medium term – prospects pipeline TCV £14bn BID PIPELINE 6% Telcos & retail 10% 25% Financial services 12% Local government PROSPECT PIPELINE Opportunities where £14bn Health significant active engagement Utilities is underway 13% 17% Central government 17% Defence SUSPECTS R

Slide 31: Acquisitions and outlook
Acquisitions and outlook Andy Parker Chief Executive
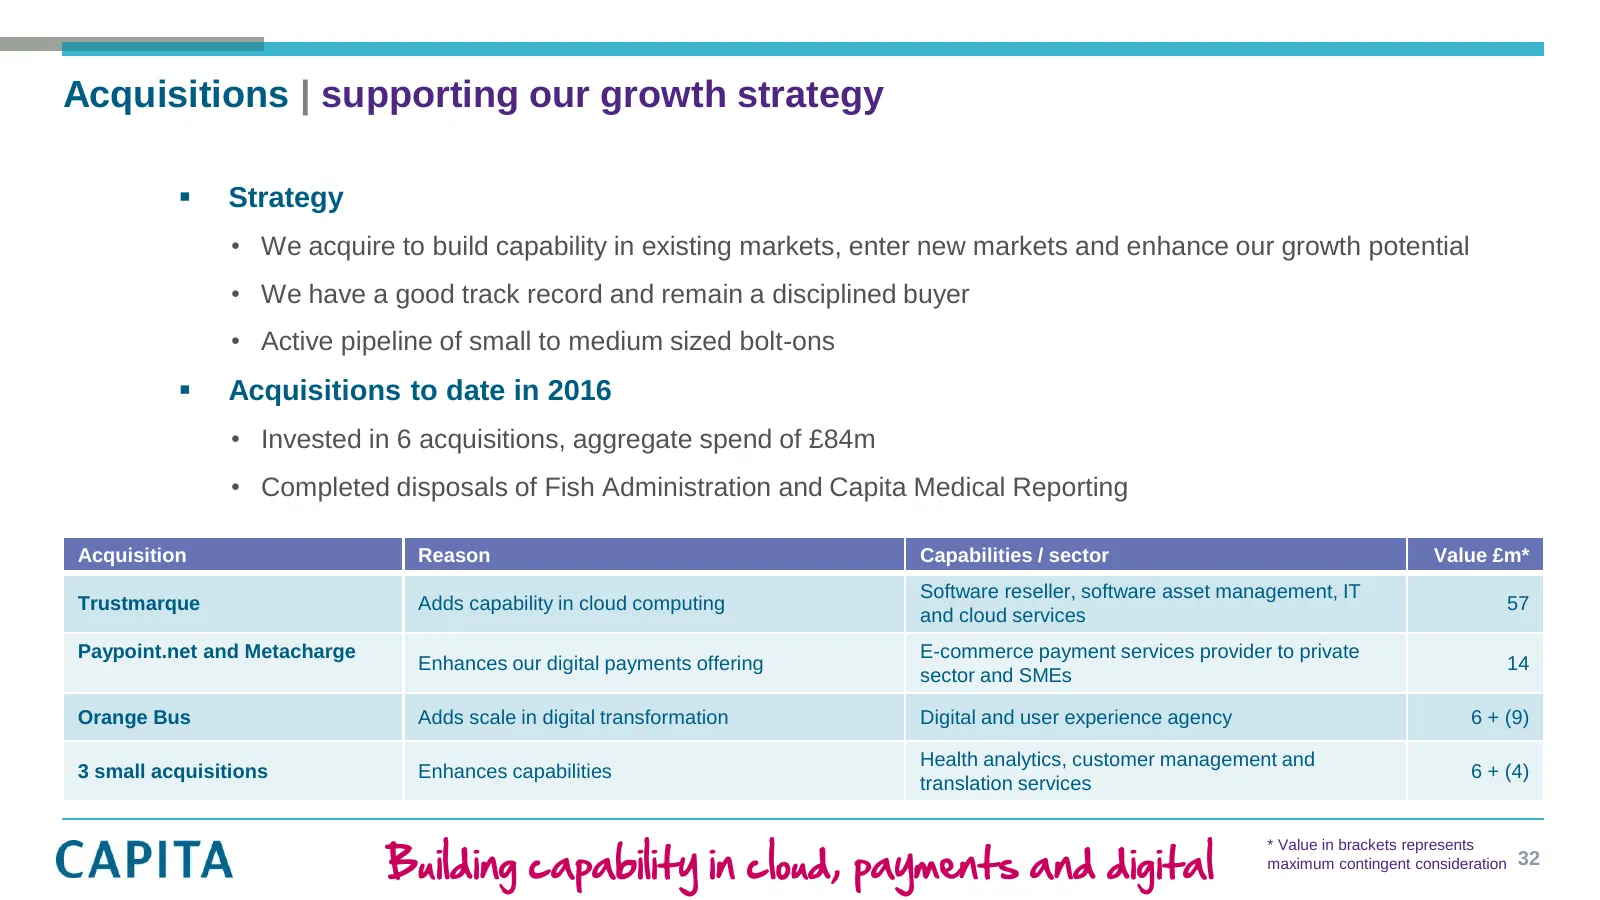
Slide 32: Building capability in cloud, payments and digital
Acquisitions | supporting our growth strategy Strategy • We acquire to build capability in existing markets, enter new markets and enhance our growth potential • We have a good track record and remain a disciplined buyer • Active pipeline of small to medium sized bolt-ons Acquisitions to date in
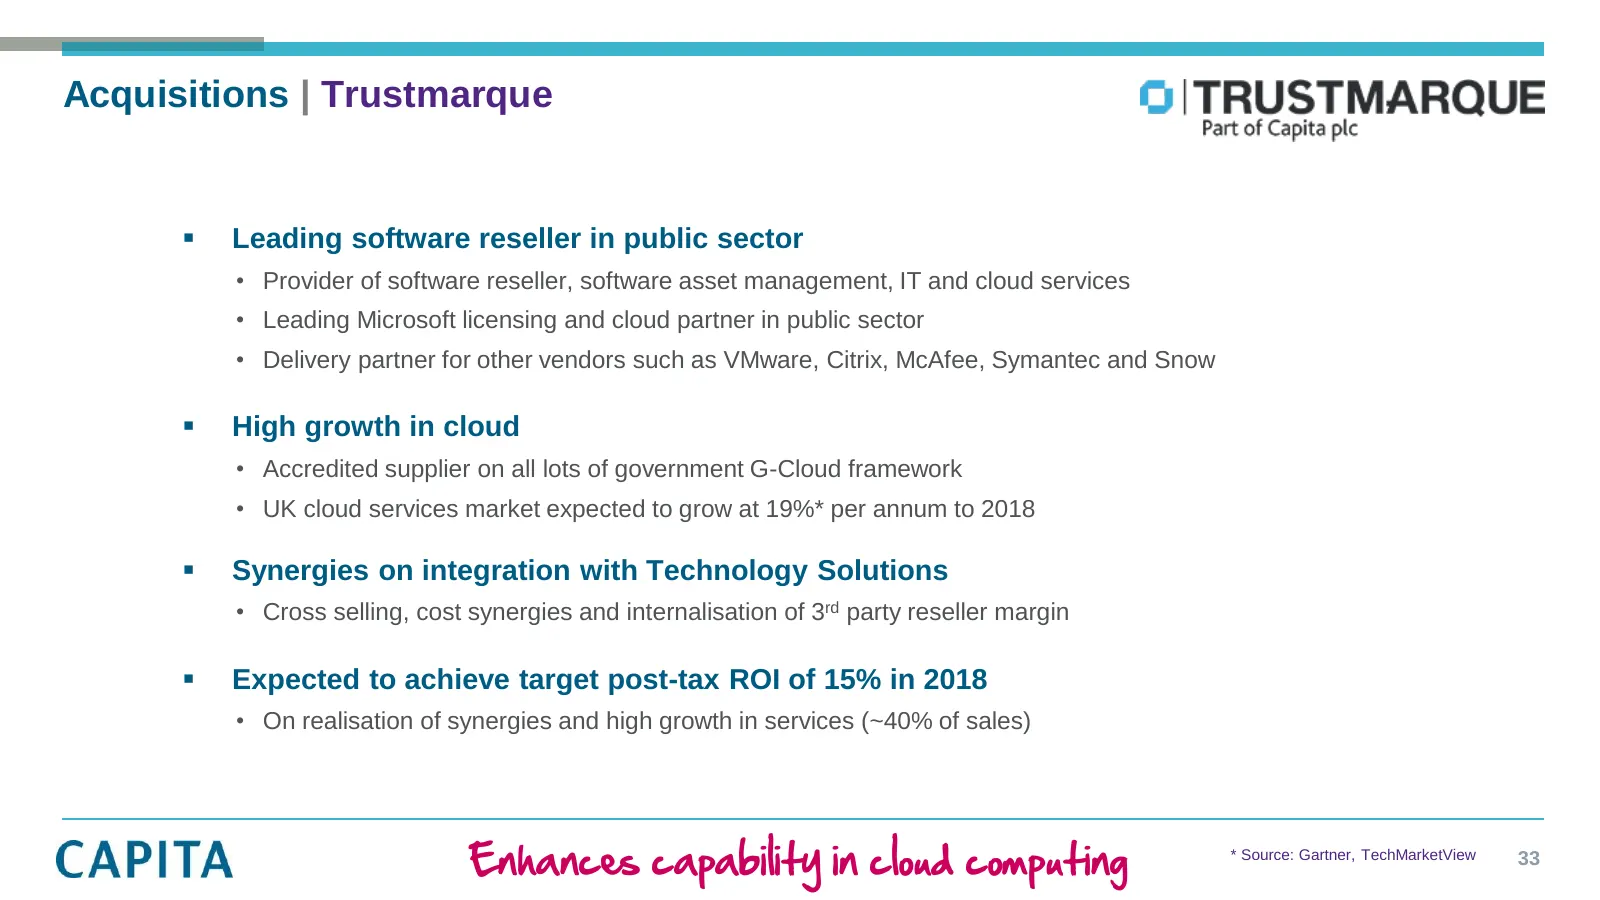
Slide 33: Trustmarque enhances capability in cloud computing
Acquisitions | Trustmarque Leading software reseller in public sector • Provider of software reseller, software asset management, IT and cloud services • Leading Microsoft licensing and cloud partner in public sector • Delivery partner for other vendors such as VMware, Citrix, McAfee, Symantec and
Slide 34: Positioning the Group for continued growth
Investing in talent and technology to drive forward growth and deliver value Technology • Software: creating new generation software releases and investing in cloud services and solutions • Automation: trialling large scale complex automation and introducing increased use of robotics • Infrastruct
Slide 35: Positioned well for continued growth
Summary and outlook | resilient business model Targeting organic growth for FY2016 of around 4% Over 80% of revenue is made up of long term contracts, annual rolling contracts and repeat work Good pipeline of major bids and value enhancing acquisitions Structural drivers for our services rem
Slide 36: Results for the half year ended 30 June 2016
Results for the half year ended 30 June 2016
Source: Internet Archive copy of capita.com
More decks from Capita plc
 H1 2026 Earnings Presentation44 slides · Aug 4, 2026
 FY2025 Earnings Presentation46 slides · March 2026
 Merger or Acquisition (March 2026)10 slides · March 2026
 H1 2025 Earnings Presentation51 slides · August 2025
 FY2024 Earnings Presentation44 slides · March 2025
 H1 2024 Earnings Presentation33 slides · Aug 1, 2024