Great Plains Energy Incorporated
Great Plains Energy — Investor Presentation (June 2014)
38 slides from Great Plains Energy's investor presentation, Jun 9, 2014
Slide 1: Investor Presentation June 2014
Investor Presentation June 2014 Exhibit 99.1
Slide 2: Forward-Looking Statement
Forward-Looking Statement Statements made in this presentation that are not based on historical facts are forward-looking, may involve risks and uncertainties, and are intended to be as of the date when made. Forward-looking statements include, but are not limited to, the outcome of regulatory proce
Slide 3: Recent Events
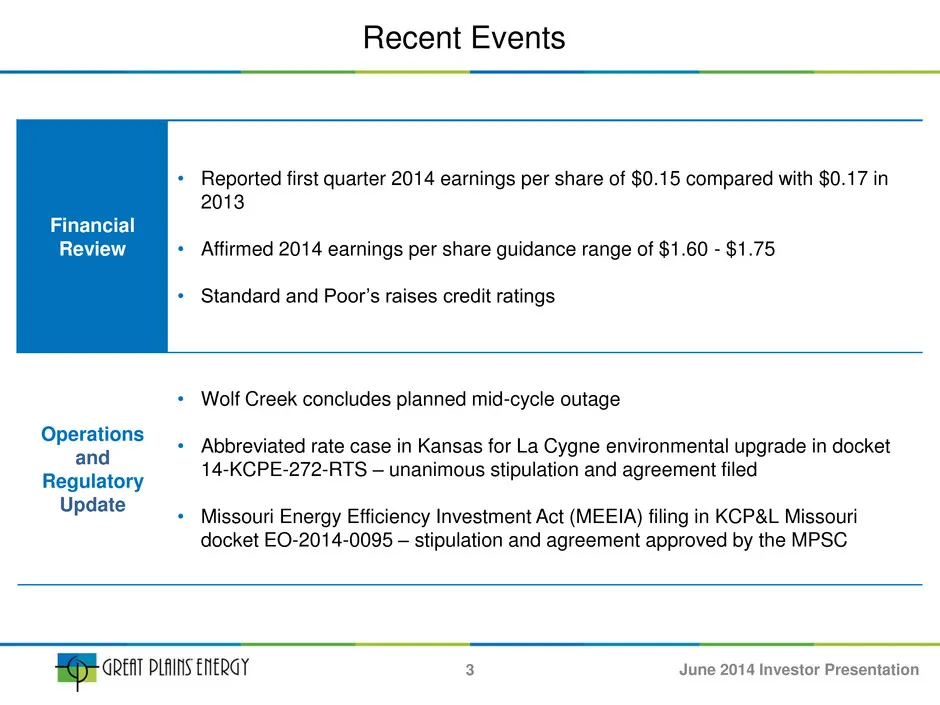
Recent Events Financial Review • Reported first quarter 2014 earnings per share of $0.15 compared with $0.17 in 2013 • Affirmed 2014 earnings per share guidance range of $1.60 - $1.75 • Standard and Poor’s raises credit ratings Operations and Regulatory Update • Wolf Creek concludes planned mid-cycl
Slide 4: Solid Vertically Integrated Midwest Utilities
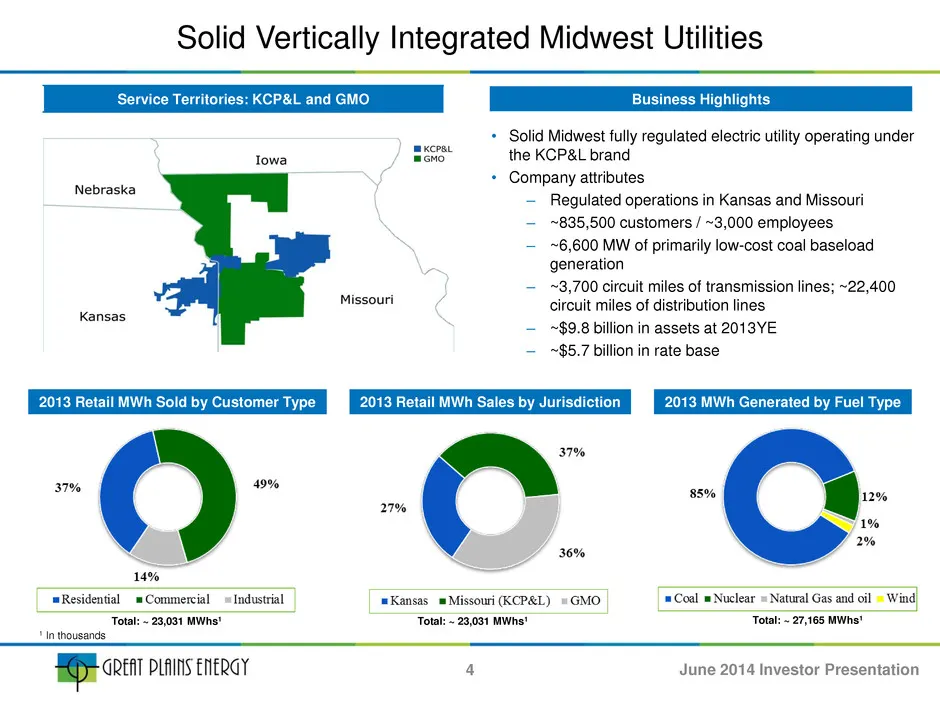
• Solid Midwest fully regulated electric utility operating under the KCP&L brand • Company attributes – Regulated operations in Kansas and Missouri – ~835,500 customers / ~3,000 employees – ~6,600 MW of primarily low-cost coal baseload generation – ~3,700 circuit miles of transmission lines; ~22,400
Slide 5: Investment Thesis
Investment Thesis • Solid track record of execution and constructive regulatory treatment • Focused on providing competitive total shareholder returns through earnings growth and a competitive dividend • Flexible investment opportunities with improved risk profile • Well positioned on the environmen
Slide 6: Track Record of Performance: Expanded Generation Capacity
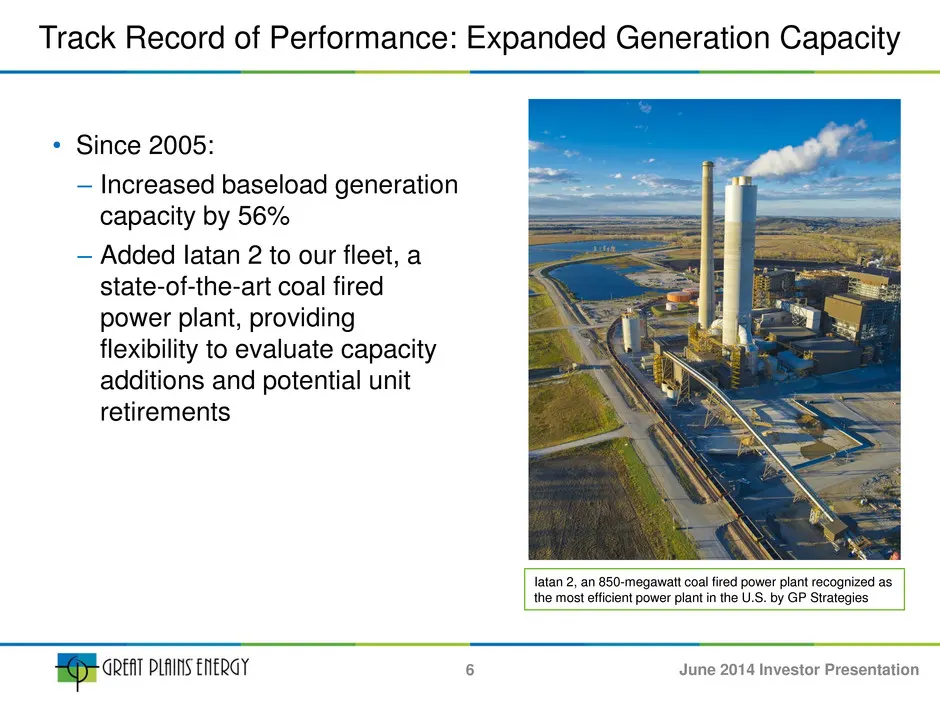
Track Record of Performance: Expanded Generation Capacity • Since 2005: – Increased baseload generation capacity by 56% – Added Iatan 2 to our fleet, a state-of-the-art coal fired power plant, providing flexibility to evaluate capacity additions and potential unit retirements Iatan 2, an 850-megawat
Slide 7: Track Record of Performance: Improved Environmental Footprint
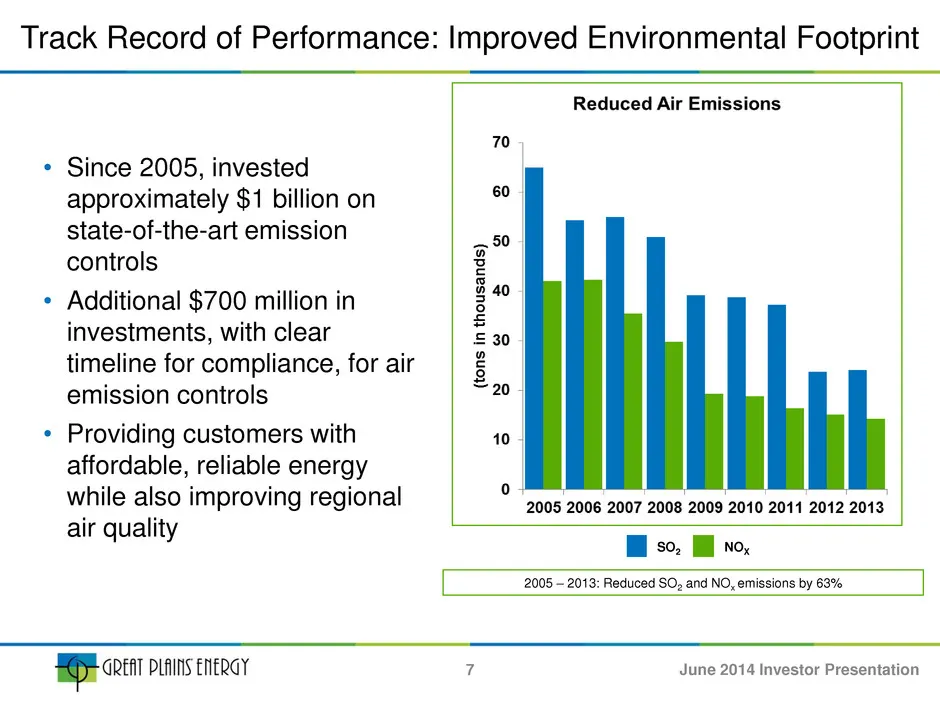
Track Record of Performance: Improved Environmental Footprint • Since 2005, invested approximately $1 billion on state-of-the-art emission controls • Additional $700 million in investments, with clear timeline for compliance, for air emission controls • Providing customers with affordable, reliable
Slide 8: Track Record of Performance: Regulatory Track Record
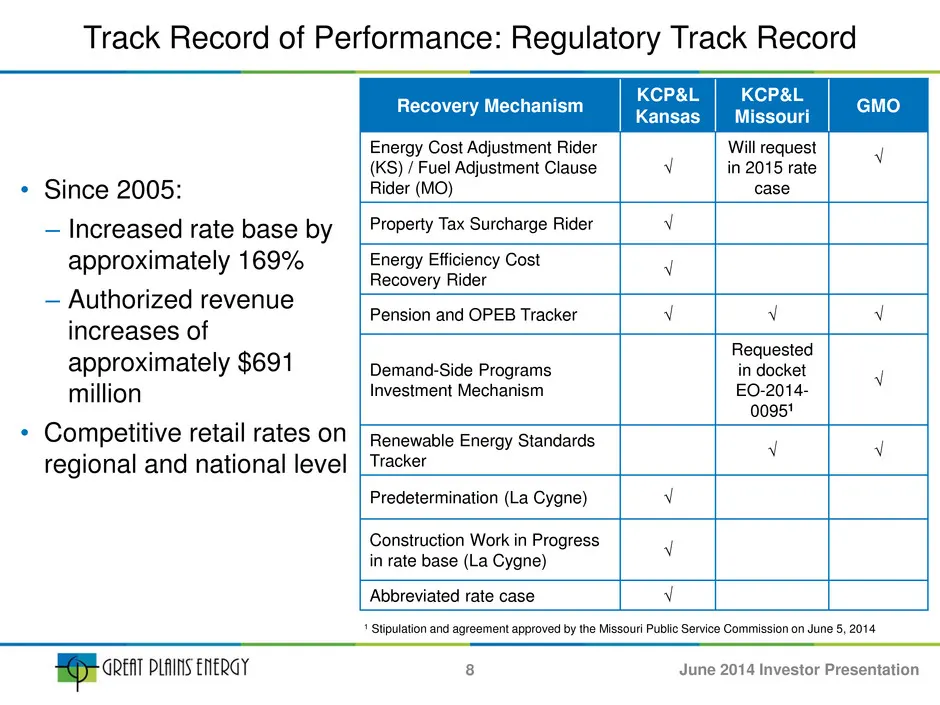
Track Record of Performance: Regulatory Track Record • Since 2005: – Increased rate base by approximately 169% – Authorized revenue increases of approximately $691 million • Competitive retail rates on regional and national level Recovery Mechanism KCP&L Kansas KCP&L Missouri GMO Energy Cost Adjustm
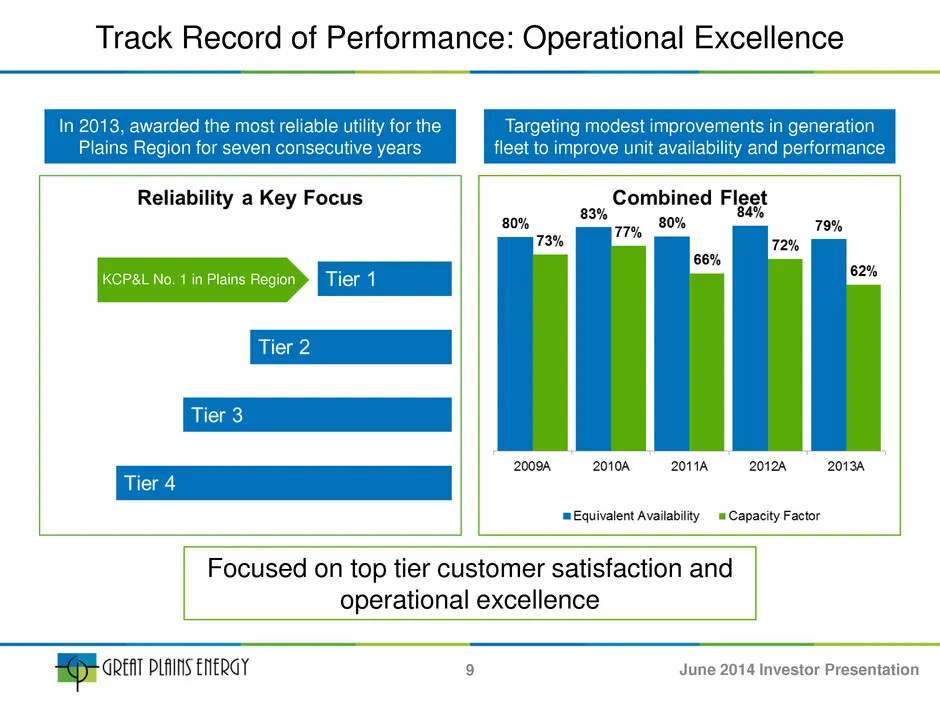
Slide 9: Track Record of Performance: Operational Excellence
Focused on top tier customer satisfaction and operational excellence In 2013, awarded the most reliable utility for the Plains Region for seven consecutive years Targeting modest improvements in generation fleet to improve unit availability and performance Track Record of Performance: Operational Ex
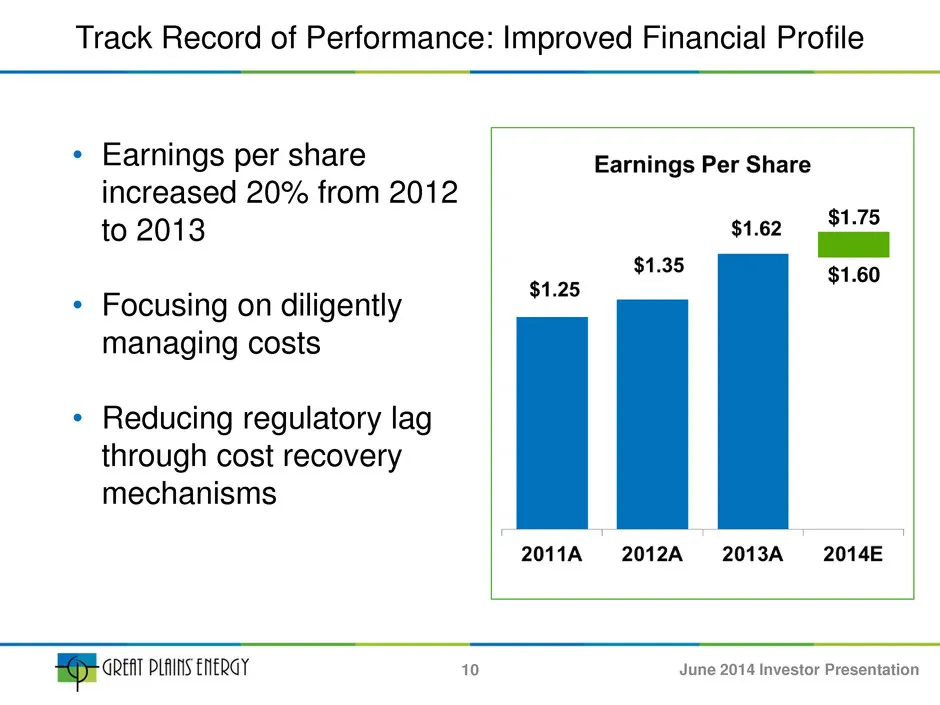
Slide 10: Track Record of Performance: Improved Financial Profile
Track Record of Performance: Improved Financial Profile $1.75 $1.60 10 • Earnings per share increased 20% from 2012 to 2013 • Focusing on diligently managing costs • Reducing regulatory lag through cost recovery mechanisms June 2014 Investor Presentation
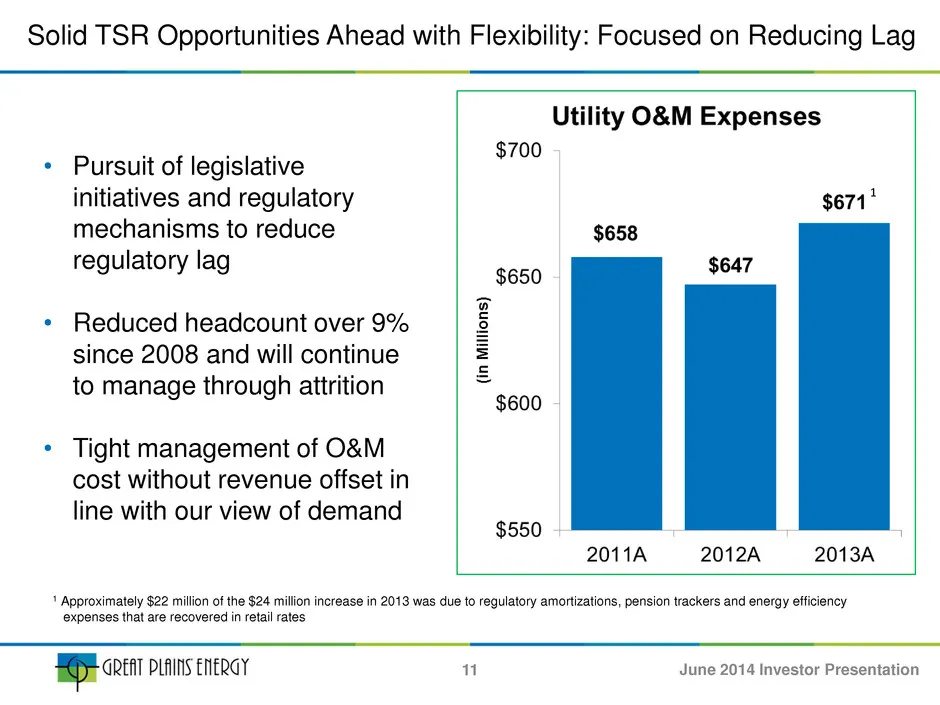
Slide 11: Solid TSR Opportunities Ahead: Focused on Reducing Lag
Solid TSR Opportunities Ahead with Flexibility: Focused on Reducing Lag • Pursuit of legislative initiatives and regulatory mechanisms to reduce regulatory lag • Reduced headcount over 9% since 2008 and will continue to manage through attrition • Tight management of O&M cost without revenue offset i
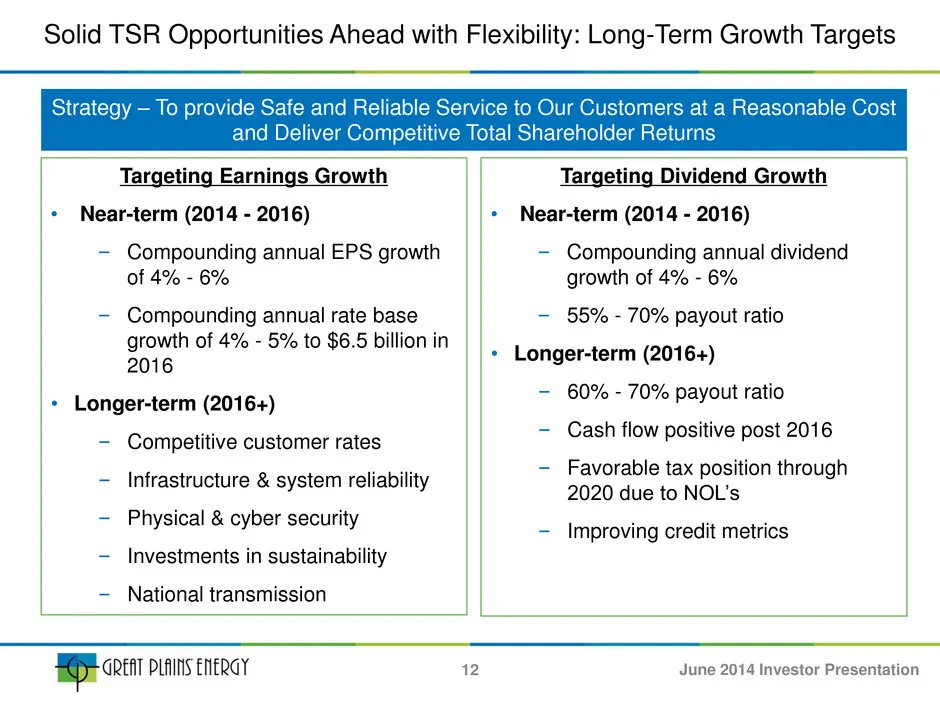
Slide 12: Solid TSR Opportunities Ahead: Long-Term Growth Targets
Solid TSR Opportunities Ahead with Flexibility: Long-Term Growth Targets Targeting Earnings Growth • Near-term (2014 - 2016) ‒ Compounding annual EPS growth of 4% - 6% ‒ Compounding annual rate base growth of 4% - 5% to $6.5 billion in 2016 • Longer-term (2016+) ‒ Competitive customer rates ‒ Infras
Slide 13: Solid TSR Opportunities Ahead: Dividend Growth
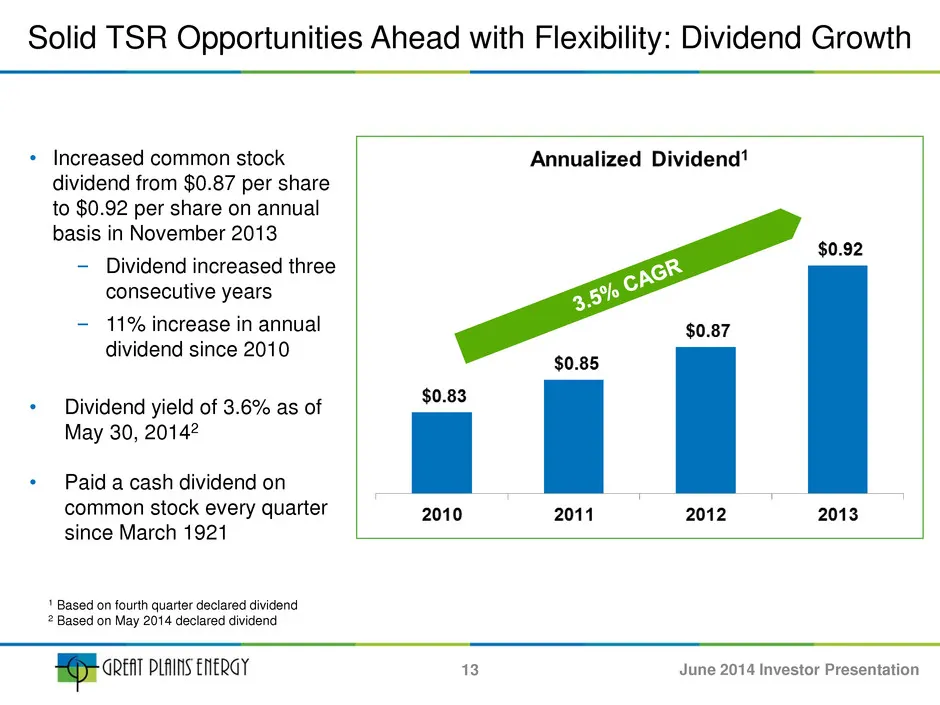
Solid TSR Opportunities Ahead with Flexibility: Dividend Growth • Increased common stock dividend from $0.87 per share to $0.92 per share on annual basis in November 2013 ‒ Dividend increased three consecutive years ‒ 11% increase in annual dividend since 2010 • Dividend yield of 3.6% as of May 30,
Slide 14: Focused on Shareholder Value Creation
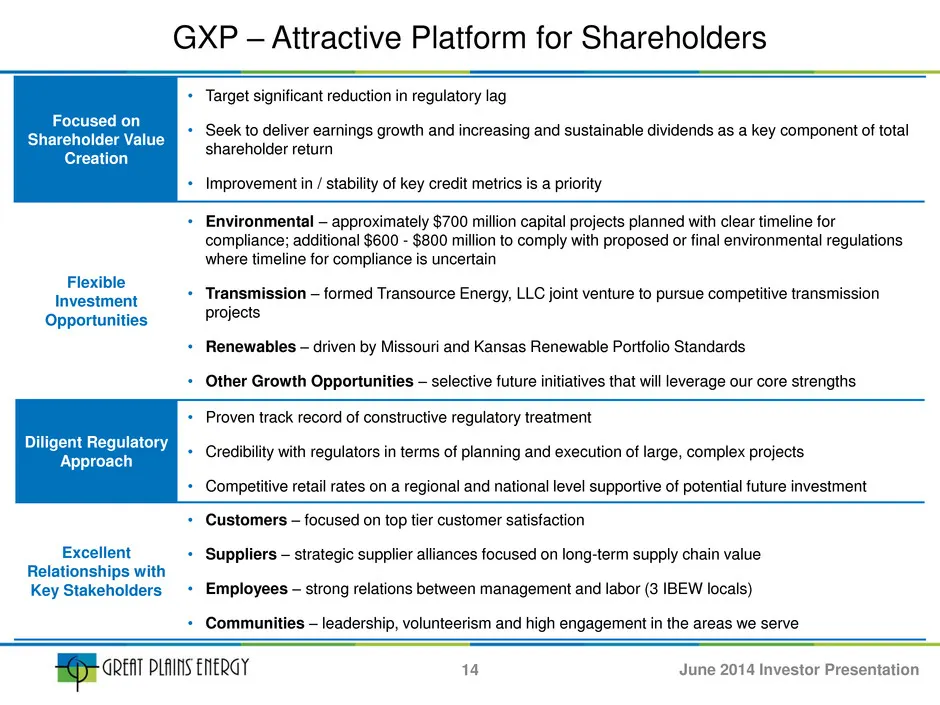
Focused on Shareholder Value Creation • Target significant reduction in regulatory lag • Seek to deliver earnings growth and increasing and sustainable dividends as a key component of total shareholder return • Improvement in / stability of key credit metrics is a priority Flexible Investment Opport
Slide 15: Company Contacts
• NYSE: GXP • www.greatplainsenergy.com • Company Contacts Tony Carreño Director, Investor Relations Great Plains Energy (816) 654 -1763 anthony.carreno@kcpl.com Calvin Girard Investor Relations Manager Great Plains Energy (816) 654 - 777 calvin.girard@kcpl.com Investor Relations Information 15 June
Slide 16: Appendix Pages
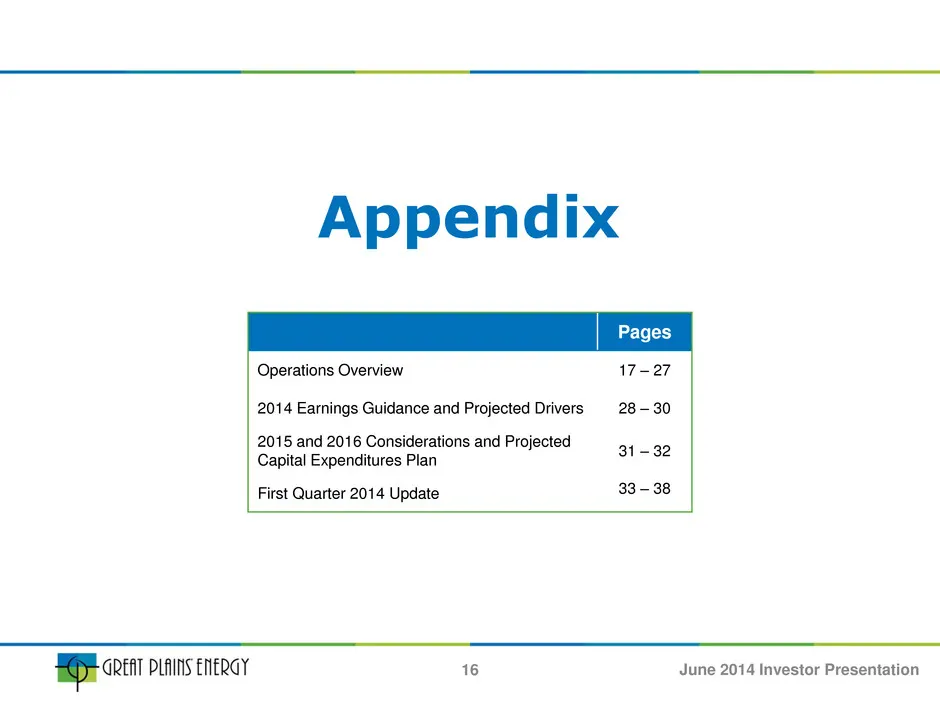
Appendix Pages Operations Overview 17 – 27 2014 Earnings Guidance and Projected Drivers 28 – 30 2015 and 2016 Considerations and Projected Capital Expenditures Plan 31 – 32 First Quarter 2014 Update 33 – 38 16 June 2014 Investor Presentation
Slide 17: Environmental
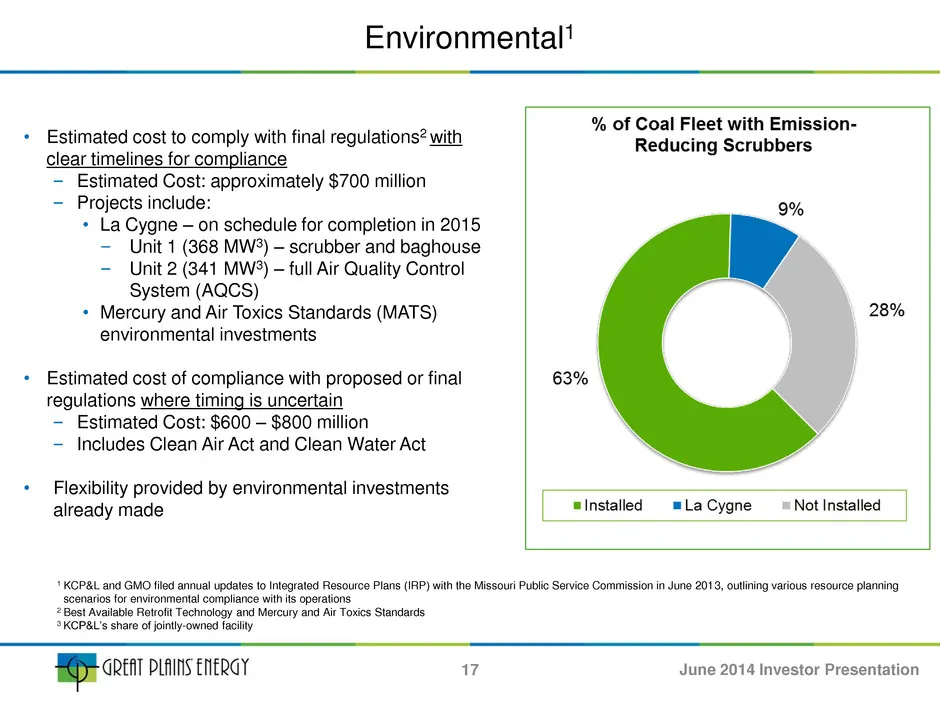
Environmental1 • Estimated cost to comply with final regulations2 with clear timelines for compliance – Estimated Cost: approximately $700 million – Projects include: • La Cygne – on schedule for completion in 2015 ‒ Unit 1 (368 MW3) – scrubber and baghouse ‒ Unit 2 (341 MW3) – full Air Quality Cont
Slide 18: La Cygne Generation Station: Key Steps to Completion
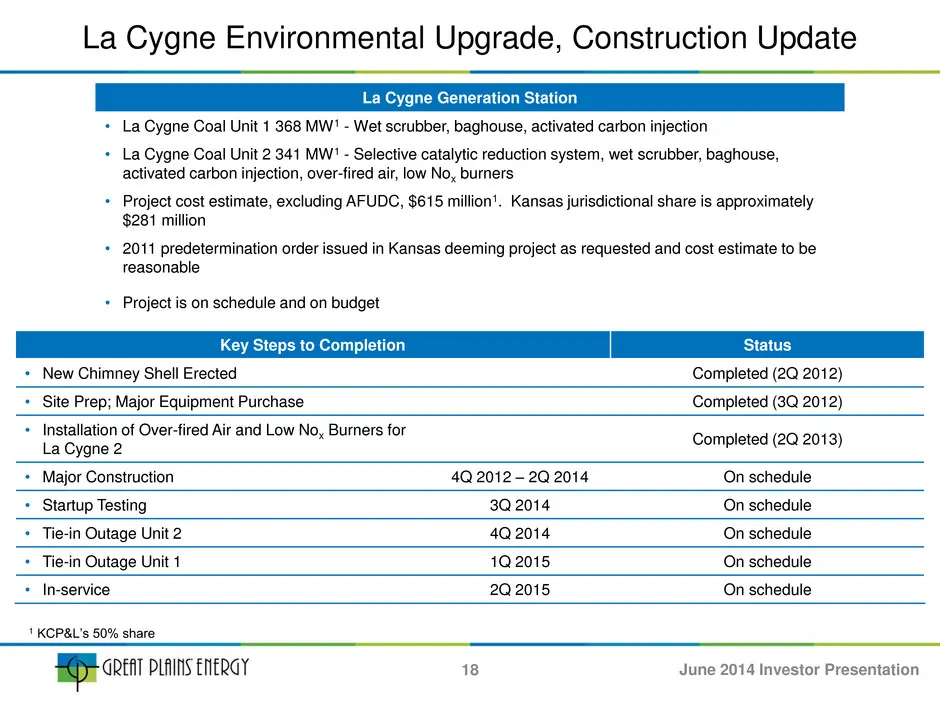
Key Steps to Completion Status • New Chimney Shell Erected Completed (2Q 2012) • Site Prep; Major Equipment Purchase Completed (3Q 2012) • Installation of Over-fired Air and Low Nox Burners for La Cygne 2 Completed (2Q 2013) • Major Construction 4Q 2012 – 2Q 2014 On schedule • Startup Testing 3Q 201
Slide 19: Renewable Energy and Energy Efficiency
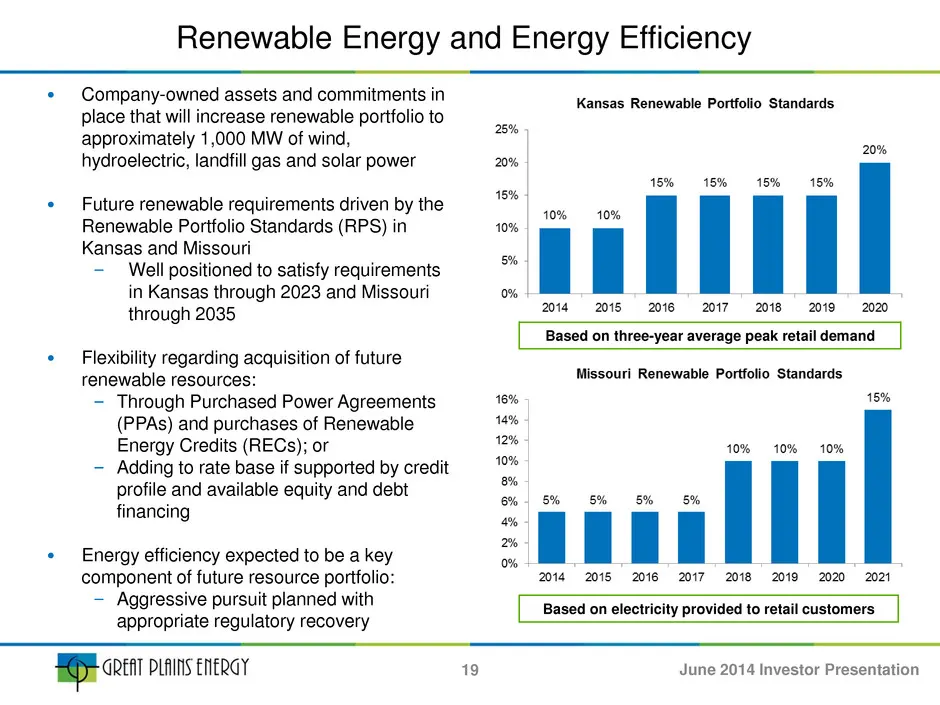
• Company-owned assets and commitments in place that will increase renewable portfolio to approximately 1,000 MW of wind, hydroelectric, landfill gas and solar power • Future renewable requirements driven by the Renewable Portfolio Standards (RPS) in Kansas and Missouri ‒ Well positioned to satisfy
Slide 20: Transource Overview
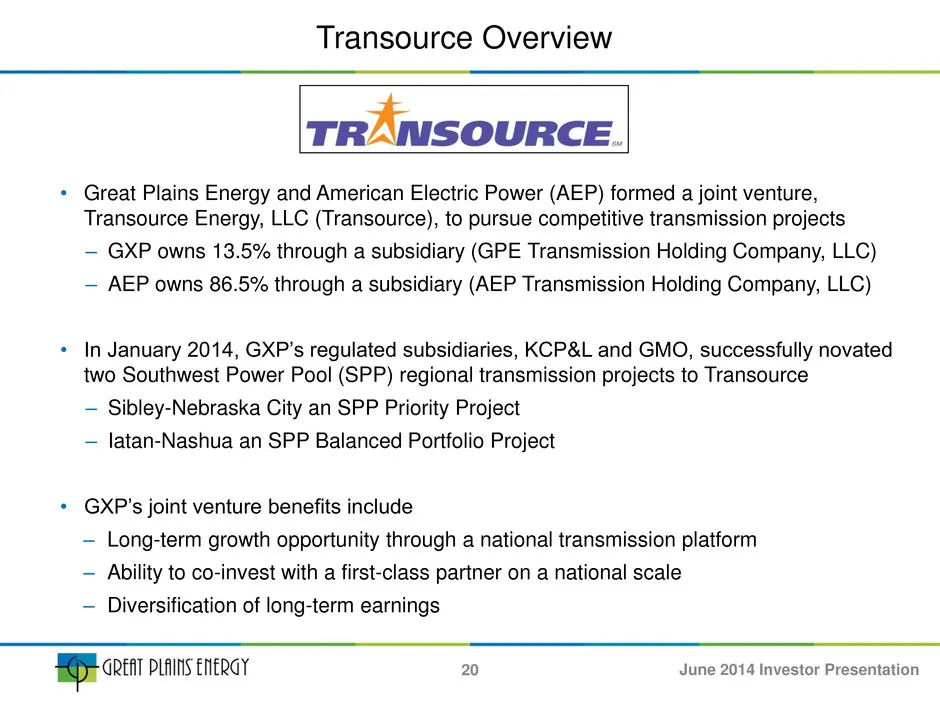
• Great Plains Energy and American Electric Power (AEP) formed a joint venture, Transource Energy, LLC (Transource), to pursue competitive transmission projects – GXP owns 13.5% through a subsidiary (GPE Transmission Holding Company, LLC) – AEP owns 86.5% through a subsidiary (AEP Transmission Holdi
Slide 21: Transource's Iatan–Nashua Project
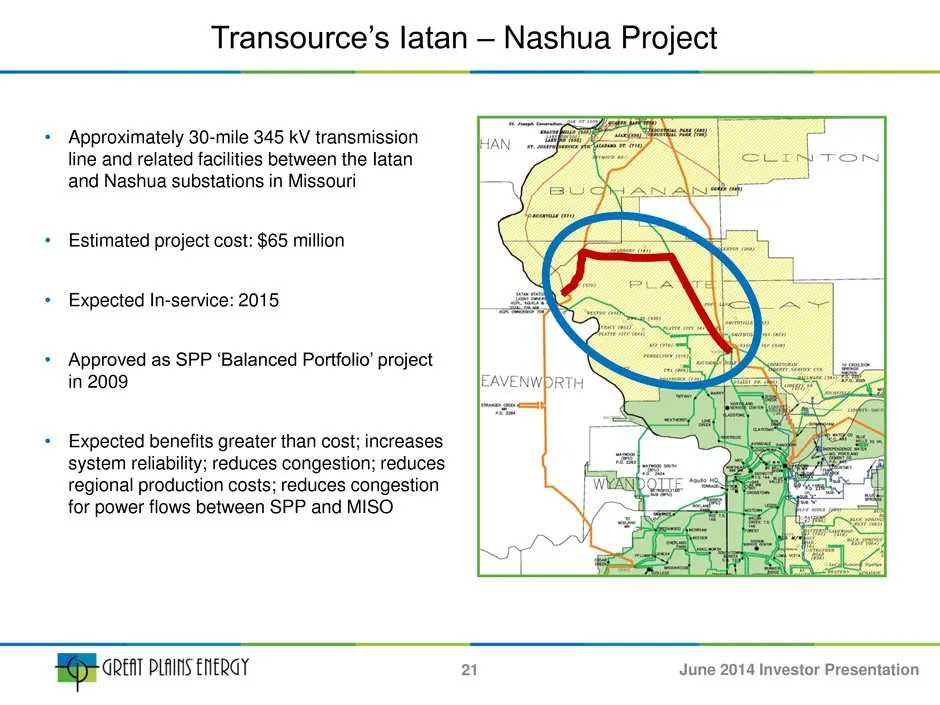
• Approximately 30-mile 345 kV transmission line and related facilities between the Iatan and Nashua substations in Missouri • Estimated project cost: $65 million • Expected In-service: 2015 • Approved as SPP ‘Balanced Portfolio’ project in 2009 • Expected benefits greater than cost; increases syste
Slide 22: Transource's Sibley–Nebraska City Project
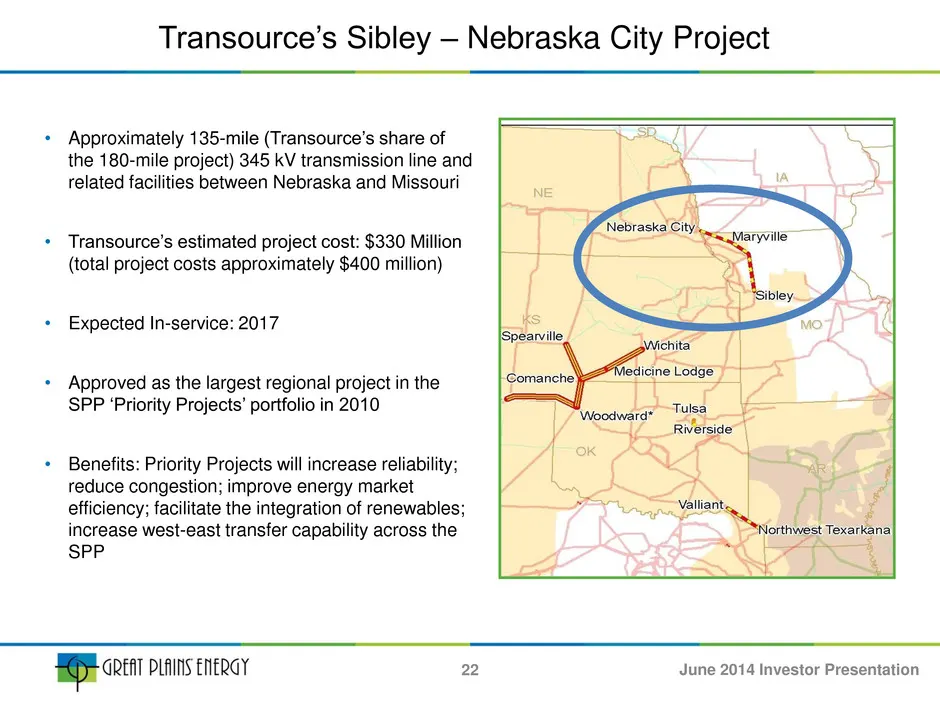
• Approximately 135-mile (Transource’s share of the 180-mile project) 345 kV transmission line and related facilities between Nebraska and Missouri • Transource’s estimated project cost: $330 Million (total project costs approximately $400 million) • Expected In-service: 2017 • Approved as the large
Slide 23: Transource FERC 205 Filing
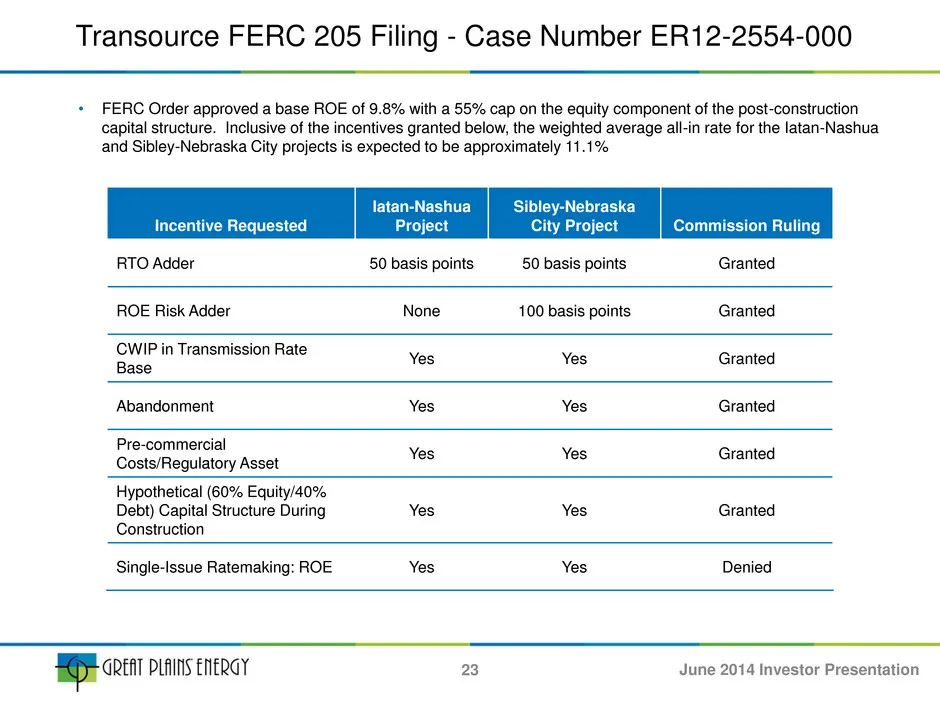
Incentive Requested Iatan-Nashua Project Sibley-Nebraska City Project Commission Ruling RTO Adder 50 basis points 50 basis points Granted ROE Risk Adder None 100 basis points Granted CWIP in Transmission Rate Base Yes Yes Granted Abandonment Yes Yes Granted Pre-commercial Costs/Regulatory Asset Yes
Slide 24: Economic Development Activity
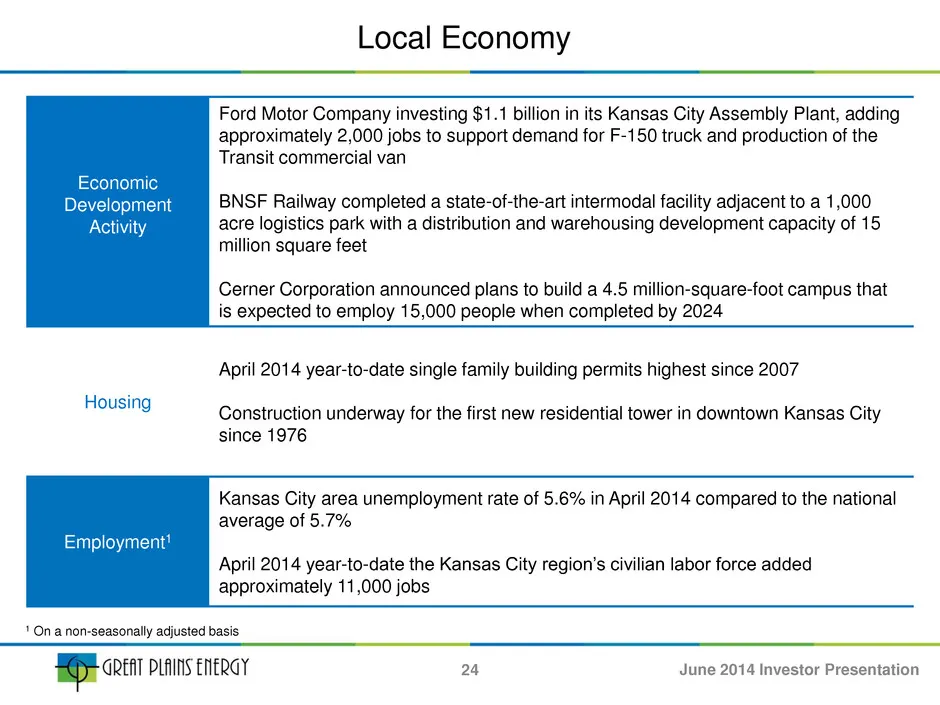
Economic Development Activity Ford Motor Company investing $1.1 billion in its Kansas City Assembly Plant, adding approximately 2,000 jobs to support demand for F-150 truck and production of the Transit commercial van BNSF Railway completed a state-of-the-art intermodal facility adjacent to a 1,000
Slide 25: Kansas Abbreviated Rate Case Summary
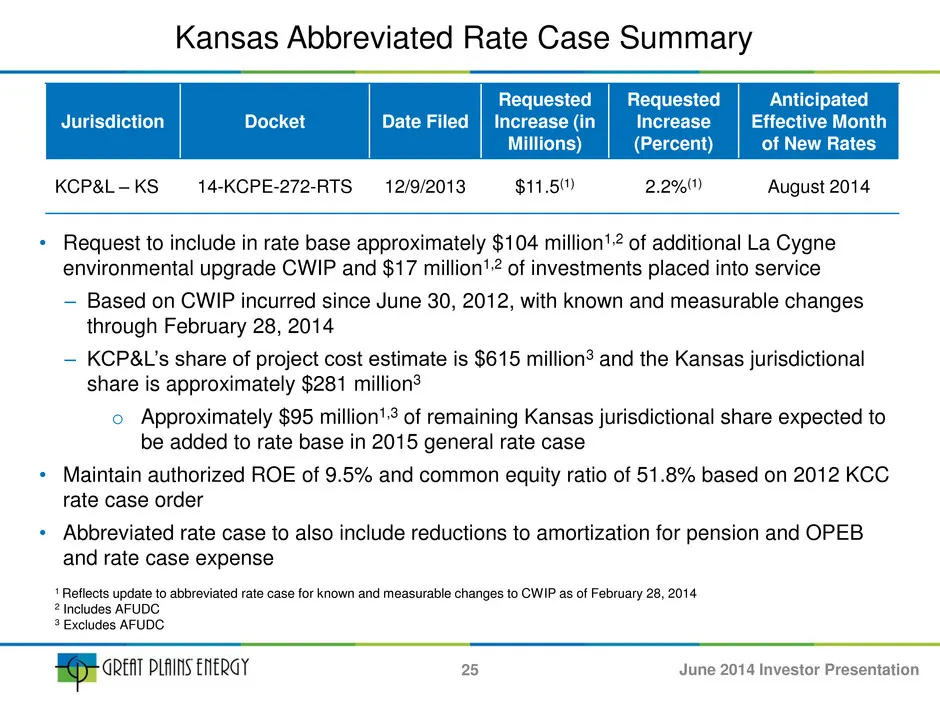
Kansas Abbreviated Rate Case Summary • Request to include in rate base approximately $104 million1,2 of additional La Cygne environmental upgrade CWIP and $17 million1,2 of investments placed into service – Based on CWIP incurred since June 30, 2012, with known and measurable changes through Februar
Slide 26: Key Elements of 2006 - 2012 Rate Cases
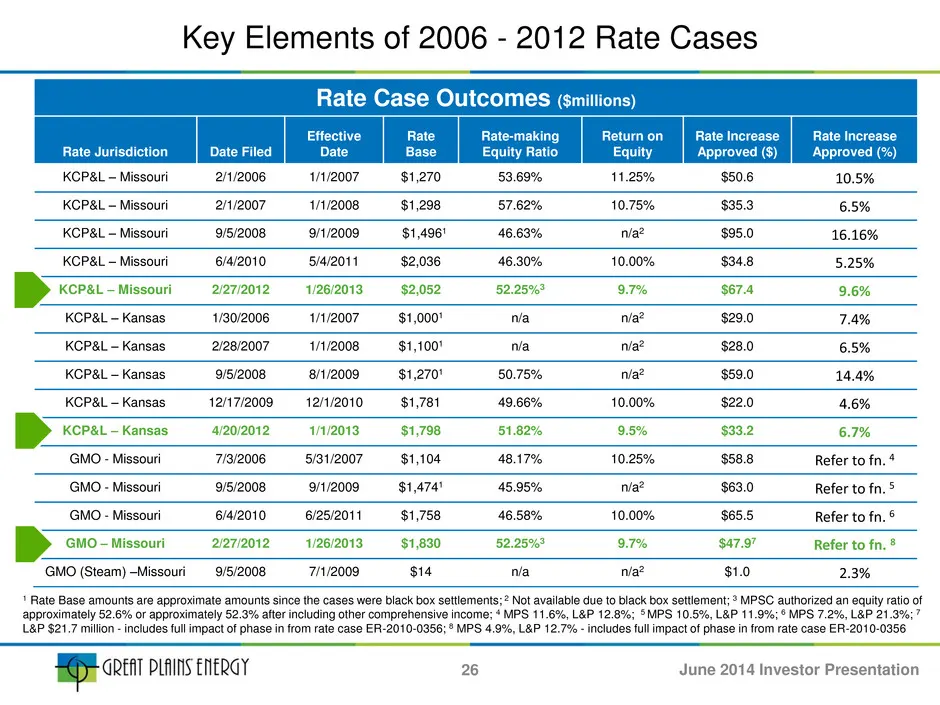
Key Elements of 2006 - 2012 Rate Cases Rate Case Outcomes ($millions) Rate Jurisdiction Date Filed Effective Date Rate Base Rate-making Equity Ratio Return on Equity Rate Increase Approved ($) Rate Increase Approved (%) KCP&L – Missouri 2/1/2006 1/1/2007 $1,270 53.69% 11.25% $50.6 10.5% KCP&L – Miss
Slide 27: State Commissioners
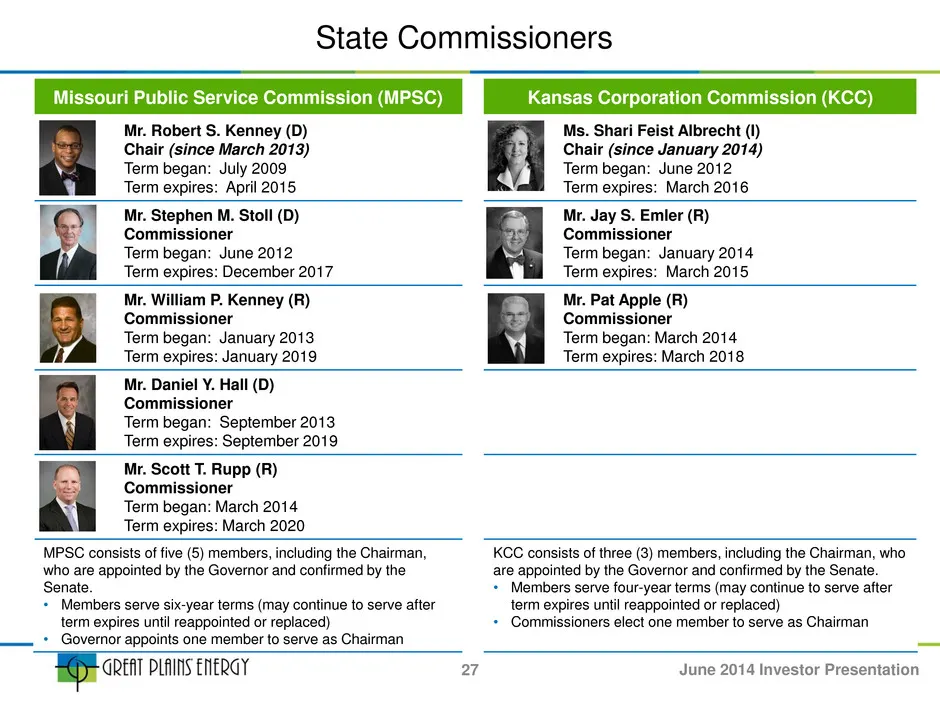
State Commissioners Missouri Public Service Commission (MPSC) Kansas Corporation Commission (KCC) Mr. Robert S. Kenney (D) Chair (since March 2013) Term began: July 2009 Term expires: April 2015 Ms. Shari Feist Albrecht (I) Chair (since January 2014) Term began: June 2012 Term expires: March 2016 Mr
Slide 28: 2014 Earnings Guidance
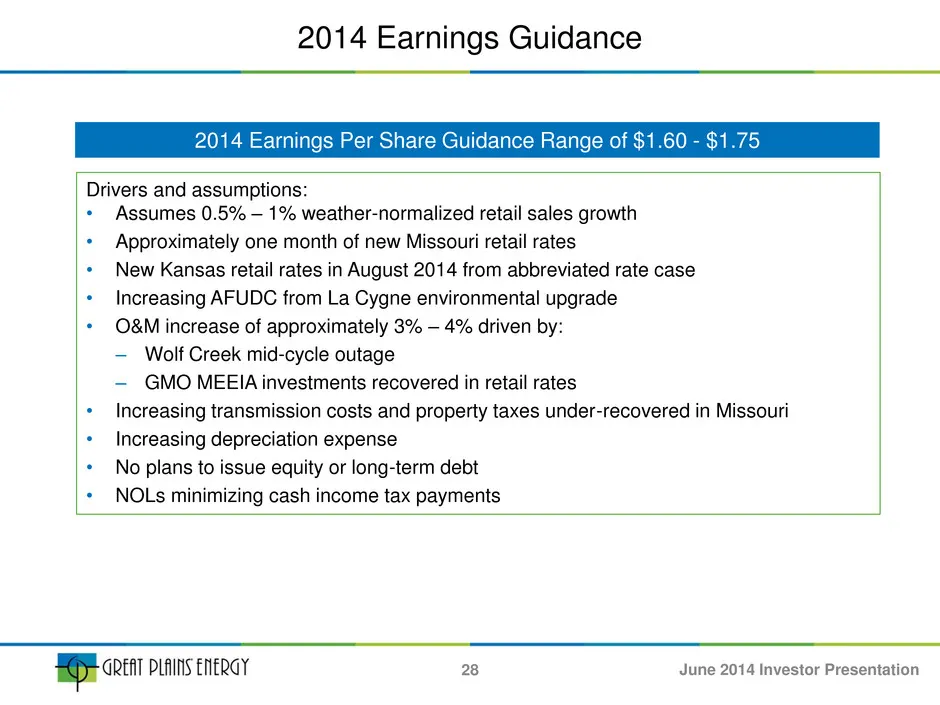
2014 Earnings Guidance 2014 Earnings Per Share Guidance Range of $1.60 - $1.75 Drivers and assumptions: • Assumes 0.5% – 1% weather-normalized retail sales growth • Approximately one month of new Missouri retail rates • New Kansas retail rates in August 2014 from abbreviated rate case • Increasing A
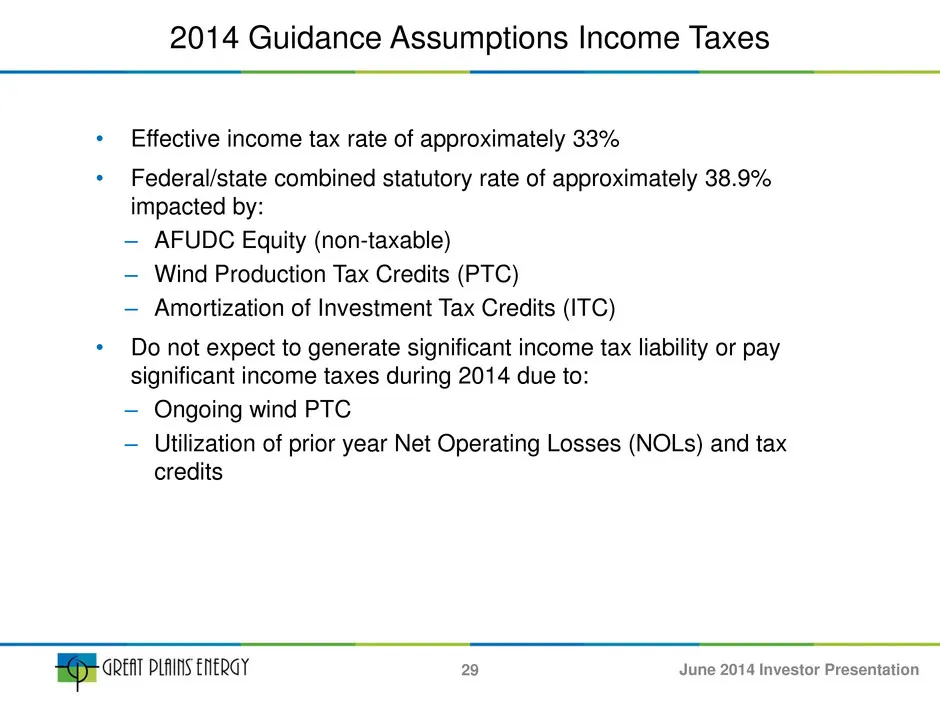
Slide 29: 2014 Guidance Assumptions: Income Taxes
• Effective income tax rate of approximately 33% • Federal/state combined statutory rate of approximately 38.9% impacted by: ‒ AFUDC Equity (non-taxable) ‒ Wind Production Tax Credits (PTC) ‒ Amortization of Investment Tax Credits (ITC) • Do not expect to generate significant income tax liability or
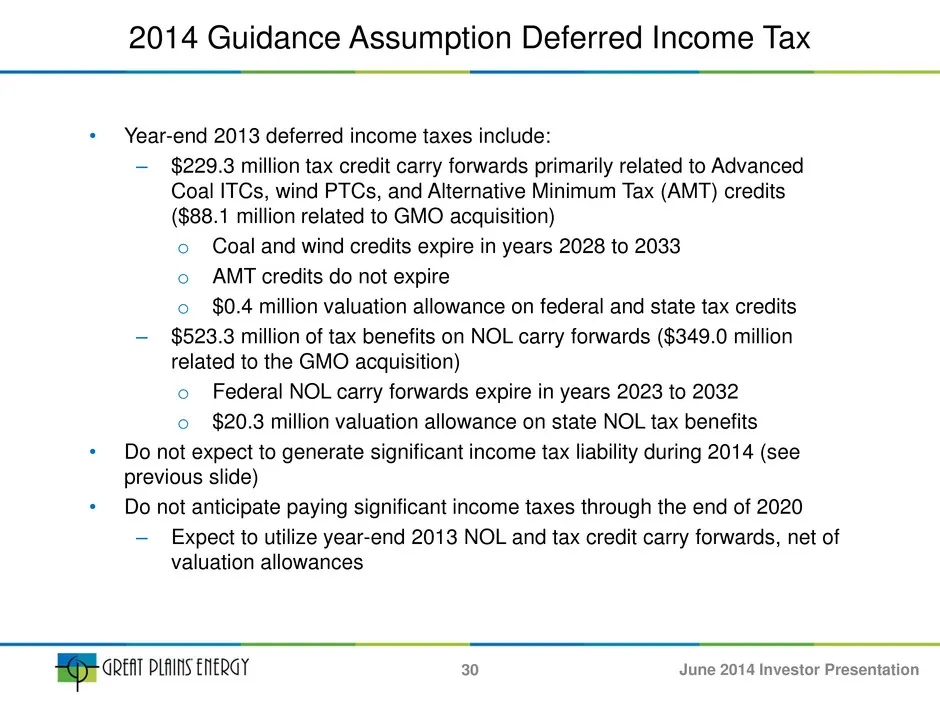
Slide 30: 2014 Guidance Assumption: Deferred Income Taxes
• Year-end 2013 deferred income taxes include: – $229.3 million tax credit carry forwards primarily related to Advanced Coal ITCs, wind PTCs, and Alternative Minimum Tax (AMT) credits ($88.1 million related to GMO acquisition) o Coal and wind credits expire in years 2028 to 2033 o AMT credits do not
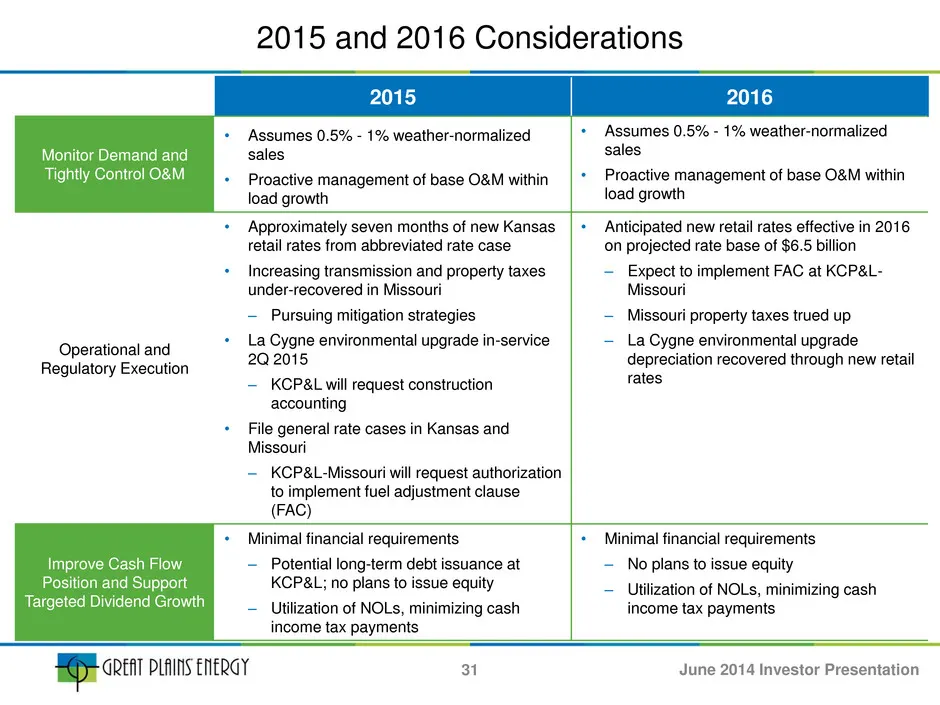
Slide 31: 2015 and 2016 Considerations
2015 and 2016 Considerations 2015 2016 Monitor Demand and Tightly Control O&M • Assumes 0.5% - 1% weather-normalized sales • Proactive management of base O&M within load growth • Assumes 0.5% - 1% weather-normalized sales • Proactive management of base O&M within load growth Operational and Regulato
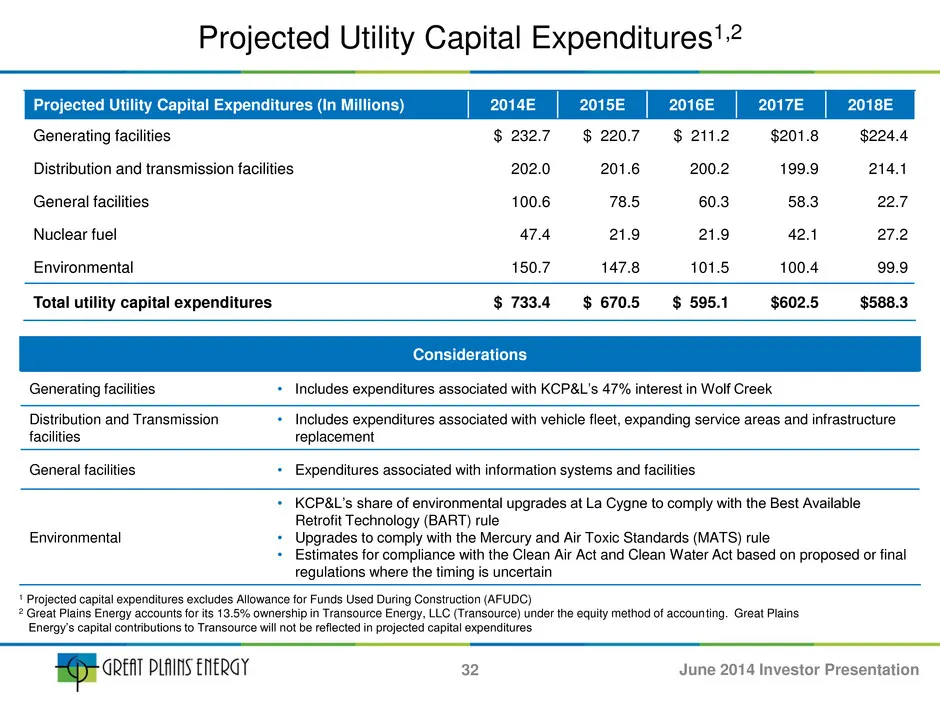
Slide 32: Projected Utility Capital Expenditures
Considerations Generating facilities • Includes expenditures associated with KCP&L’s 47% interest in Wolf Creek Distribution and Transmission facilities • Includes expenditures associated with vehicle fleet, expanding service areas and infrastructure replacement General facilities • Expenditures ass
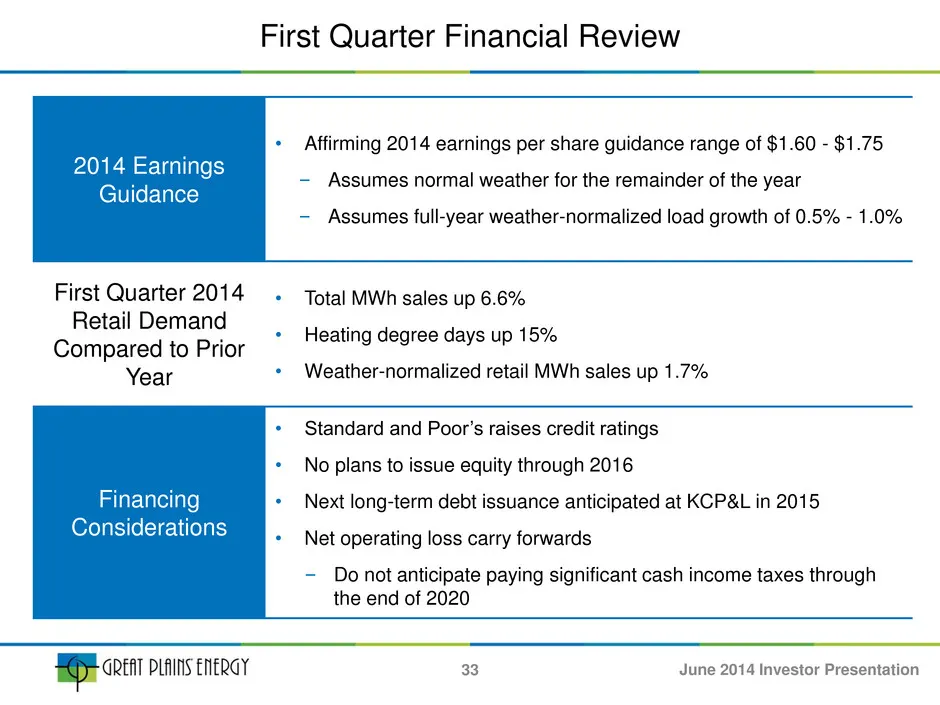
Slide 33: First Quarter Financial Review
First Quarter Financial Review 2014 Earnings Guidance • Affirming 2014 earnings per share guidance range of $1.60 - $1.75 ‒ Assumes normal weather for the remainder of the year ‒ Assumes full-year weather-normalized load growth of 0.5% - 1.0% First Quarter 2014 Retail Demand Compared to Prior Year •
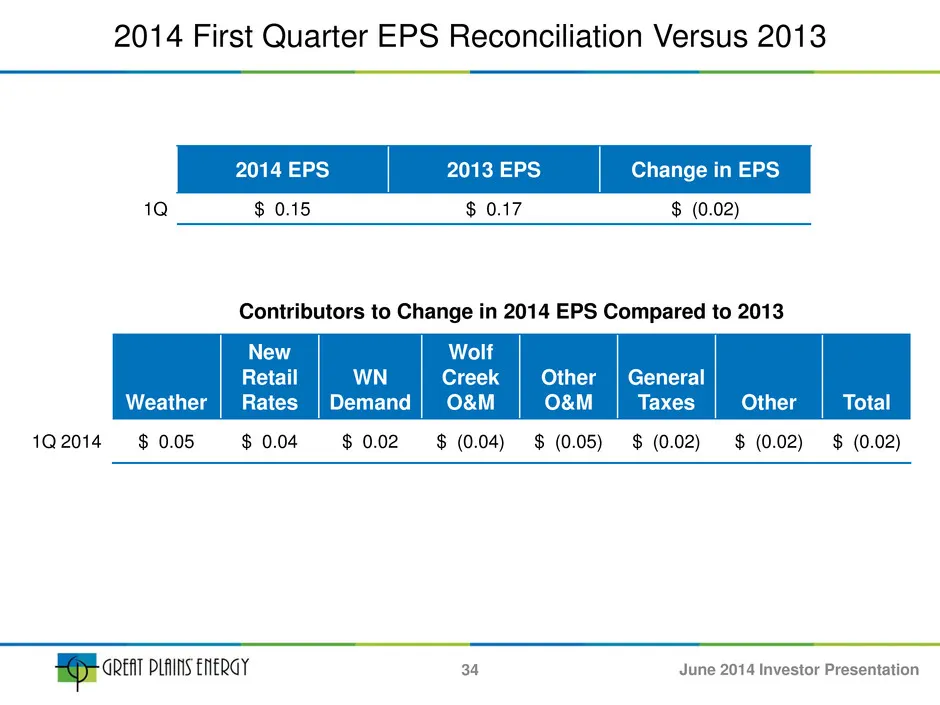
Slide 34: 2014 First Quarter EPS Reconciliation Versus 2013
2014 First Quarter EPS Reconciliation Versus 2013 Contributors to Change in 2014 EPS Compared to 2013 Weather New Retail Rates WN Demand Wolf Creek O&M Other O&M General Taxes Other Total 1Q 2014 $ 0.05 $ 0.04 $ 0.02 $ (0.04) $ (0.05) $ (0.02) $ (0.02) $ (0.02) 2014 EPS 2013 EPS Change in EPS 1Q $ 0
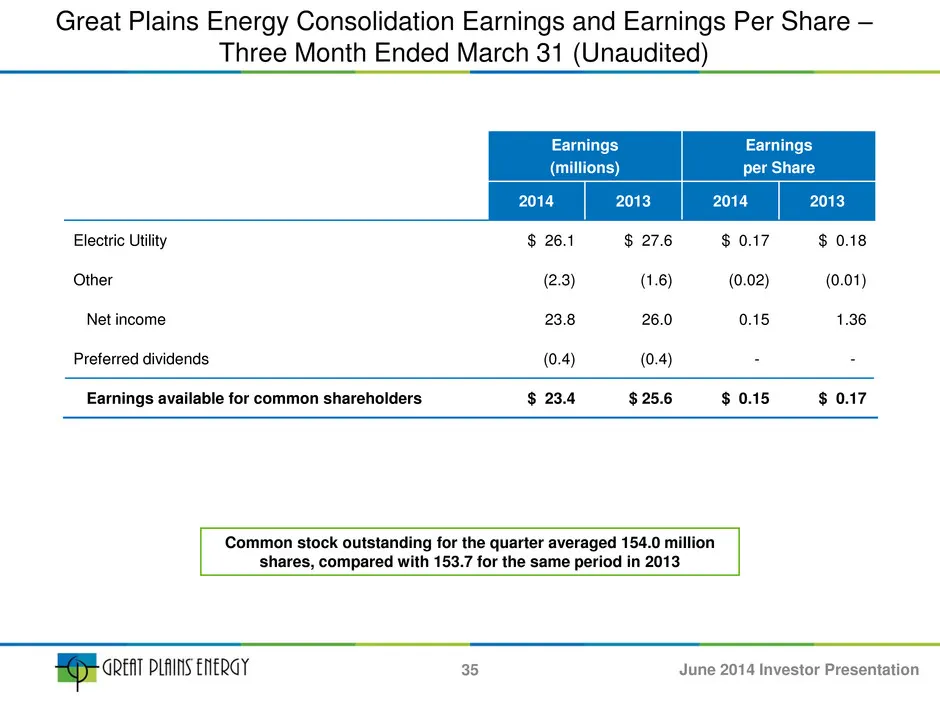
Slide 35: Consolidated Earnings and Earnings Per Share
Earnings (millions) Earnings per Share 2014 2013 2014 2013 Electric Utility $ 26.1 $ 27.6 $ 0.17 $ 0.18 Other (2.3) (1.6) (0.02) (0.01) Net income 23.8 26.0 0.15 1.36 Preferred dividends (0.4) (0.4) - - Earnings available for common shareholders $ 23.4 $ 25.6 $ 0.15 $ 0.17 Great Plains Energy Consol
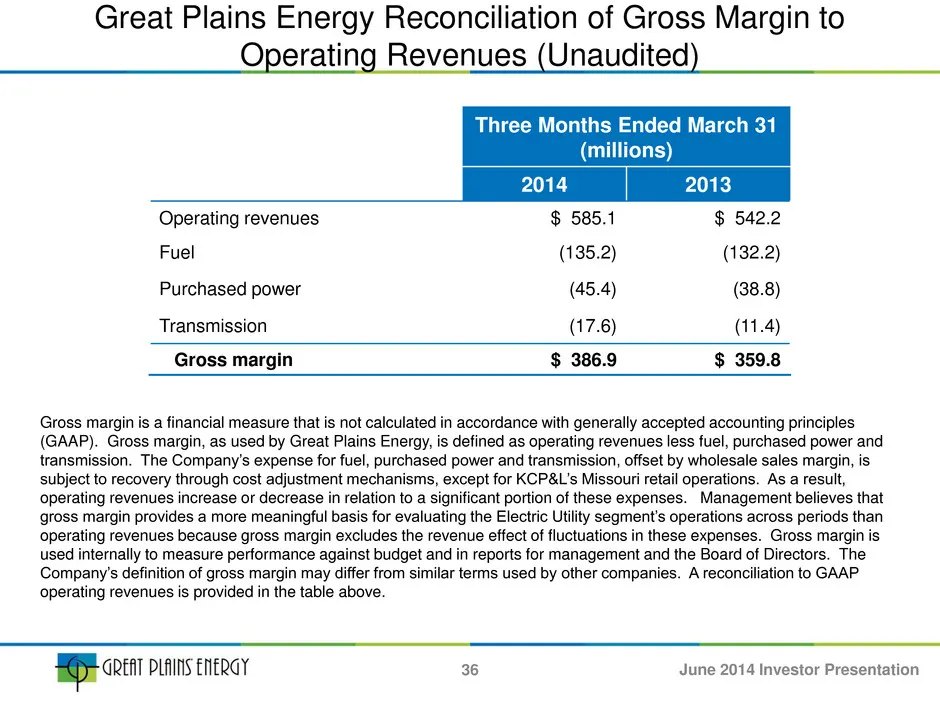
Slide 36: Reconciliation of Gross Margin to Operating Revenues
Great Plains Energy Reconciliation of Gross Margin to Operating Revenues (Unaudited) Three Months Ended March 31 (millions) 2014 2013 Operating revenues $ 585.1 $ 542.2 Fuel (135.2) (132.2) Purchased power (45.4) (38.8) Transmission (17.6) (11.4) Gross margin $ 386.9 $ 359.8 Gross margin is a financ
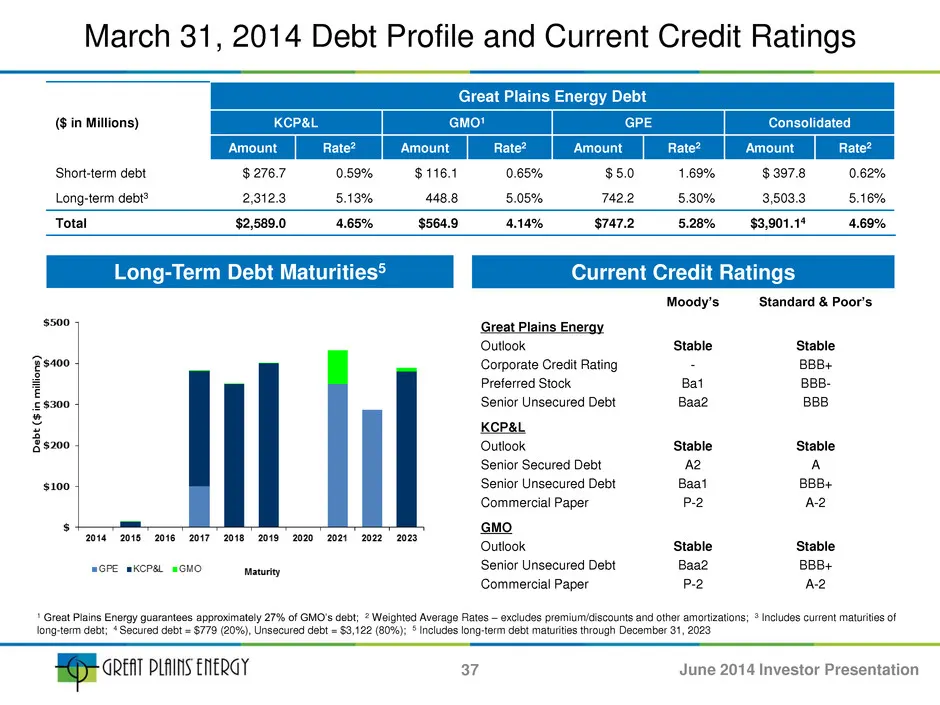
Slide 37: Debt Profile and Current Credit Ratings
March 31, 2014 Debt Profile and Current Credit Ratings Great Plains Energy Debt ($ in Millions) KCP&L GMO1 GPE Consolidated Amount Rate2 Amount Rate2 Amount Rate2 Amount Rate2 Short-term debt $ 276.7 0.59% $ 116.1 0.65% $ 5.0 1.69% $ 397.8 0.62% Long-term debt3 2,312.3 5.13% 448.8 5.05% 742.2 5.30%
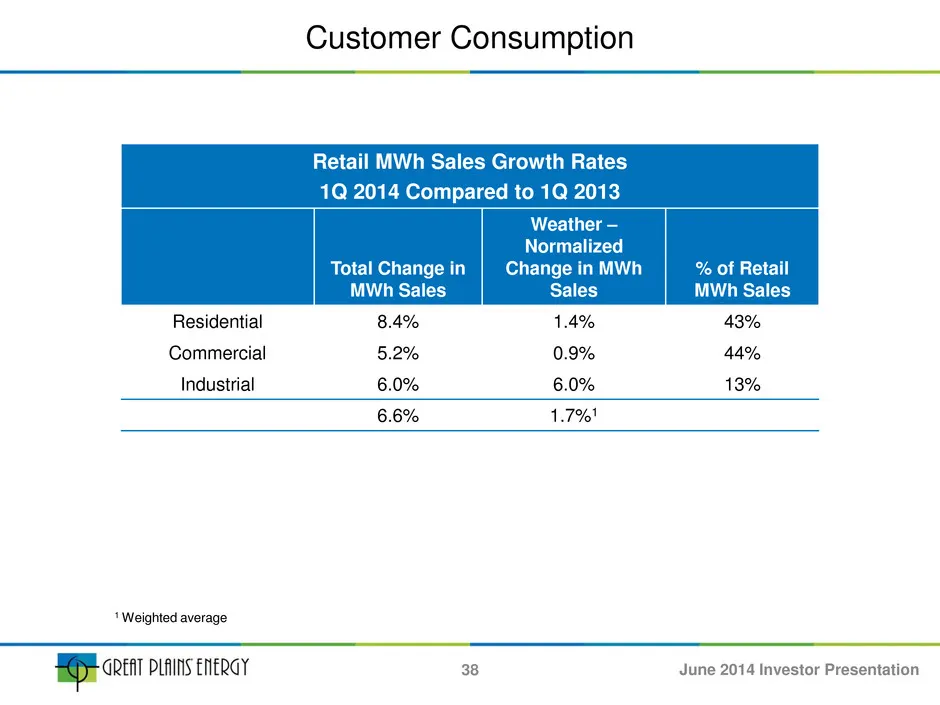
Slide 38: Customer Consumption
Customer Consumption 38 Retail MWh Sales Growth Rates 1Q 2014 Compared to 1Q 2013 Total Change in MWh Sales Weather – Normalized Change in MWh Sales % of Retail MWh Sales Residential 8.4% 1.4% 43% Commercial 5.2% 0.9% 44% Industrial 6.0% 6.0% 13% 6.6% 1.7%1 1 Weighted average June 2014 Investor Pres
Source: SEC EDGAR · 8-K filed Jun 9, 2014
More decks from Great Plains Energy Incorporated
 Merger or Acquisition (January 2018)27 slides · Jan 10, 2018
 2017 Edison Electric Institute Financial Conference25 slides · Nov 3, 2017
 Merger or Acquisition (October 2017)14 slides · Oct 31, 2017
 Merger or Acquisition (October 2017)9 slides · Oct 31, 2017
 Merger or Acquisition (August 2017)18 slides · Aug 8, 2017
 Merger or Acquisition (August 2017)9 slides · Aug 8, 2017