United Financial Bancorp — Rockville Financial — Investor Presentation (December 2012)
40 slides from United Financial Bancorp's investor presentation, Dec 17, 2012
Slide 1: Investor Meetings December 17th, 2012
Exhibit 99.1 Exhibit 99.1 Transition NASDAQ Investor December Meetings Values 17th, Global2012 Success Select Market RCKB
Slide 2: Forward-Looking Statements
Forward This management and statements are update forward-looking With 2presented beyond future Presentation regard forward-looking Looking in or can involve our to this and conditional presentations be control nature presentation are contains Statements identified risks subject — we statements and
Slide 3: Table of Contents
TableRockville Rockville Page Why Recent Strategic Financial Municipal Loans Deposits Asset Institutional Insider 3Appendix—Peer of Quality 21Strategic Ownership Contents 26 Priorities Performance Financial Bond Ownership 31Financial Portfolio Initiatives Analysis 35 11 Overview 14 33619 36 7 5
Slide 4: Corporate Contacts
Corporate William President Scott John Mark Executive Eric Investor 4Senior R. T. C. A.Vice Newell Lund Bechtle H. Information: Kucia &Vice Contacts W. President, Chief Crawford, President, Executive Marliese Director Investor IV Chief Commercial Officer L. Relations of Risk Financial Shaw Treasury
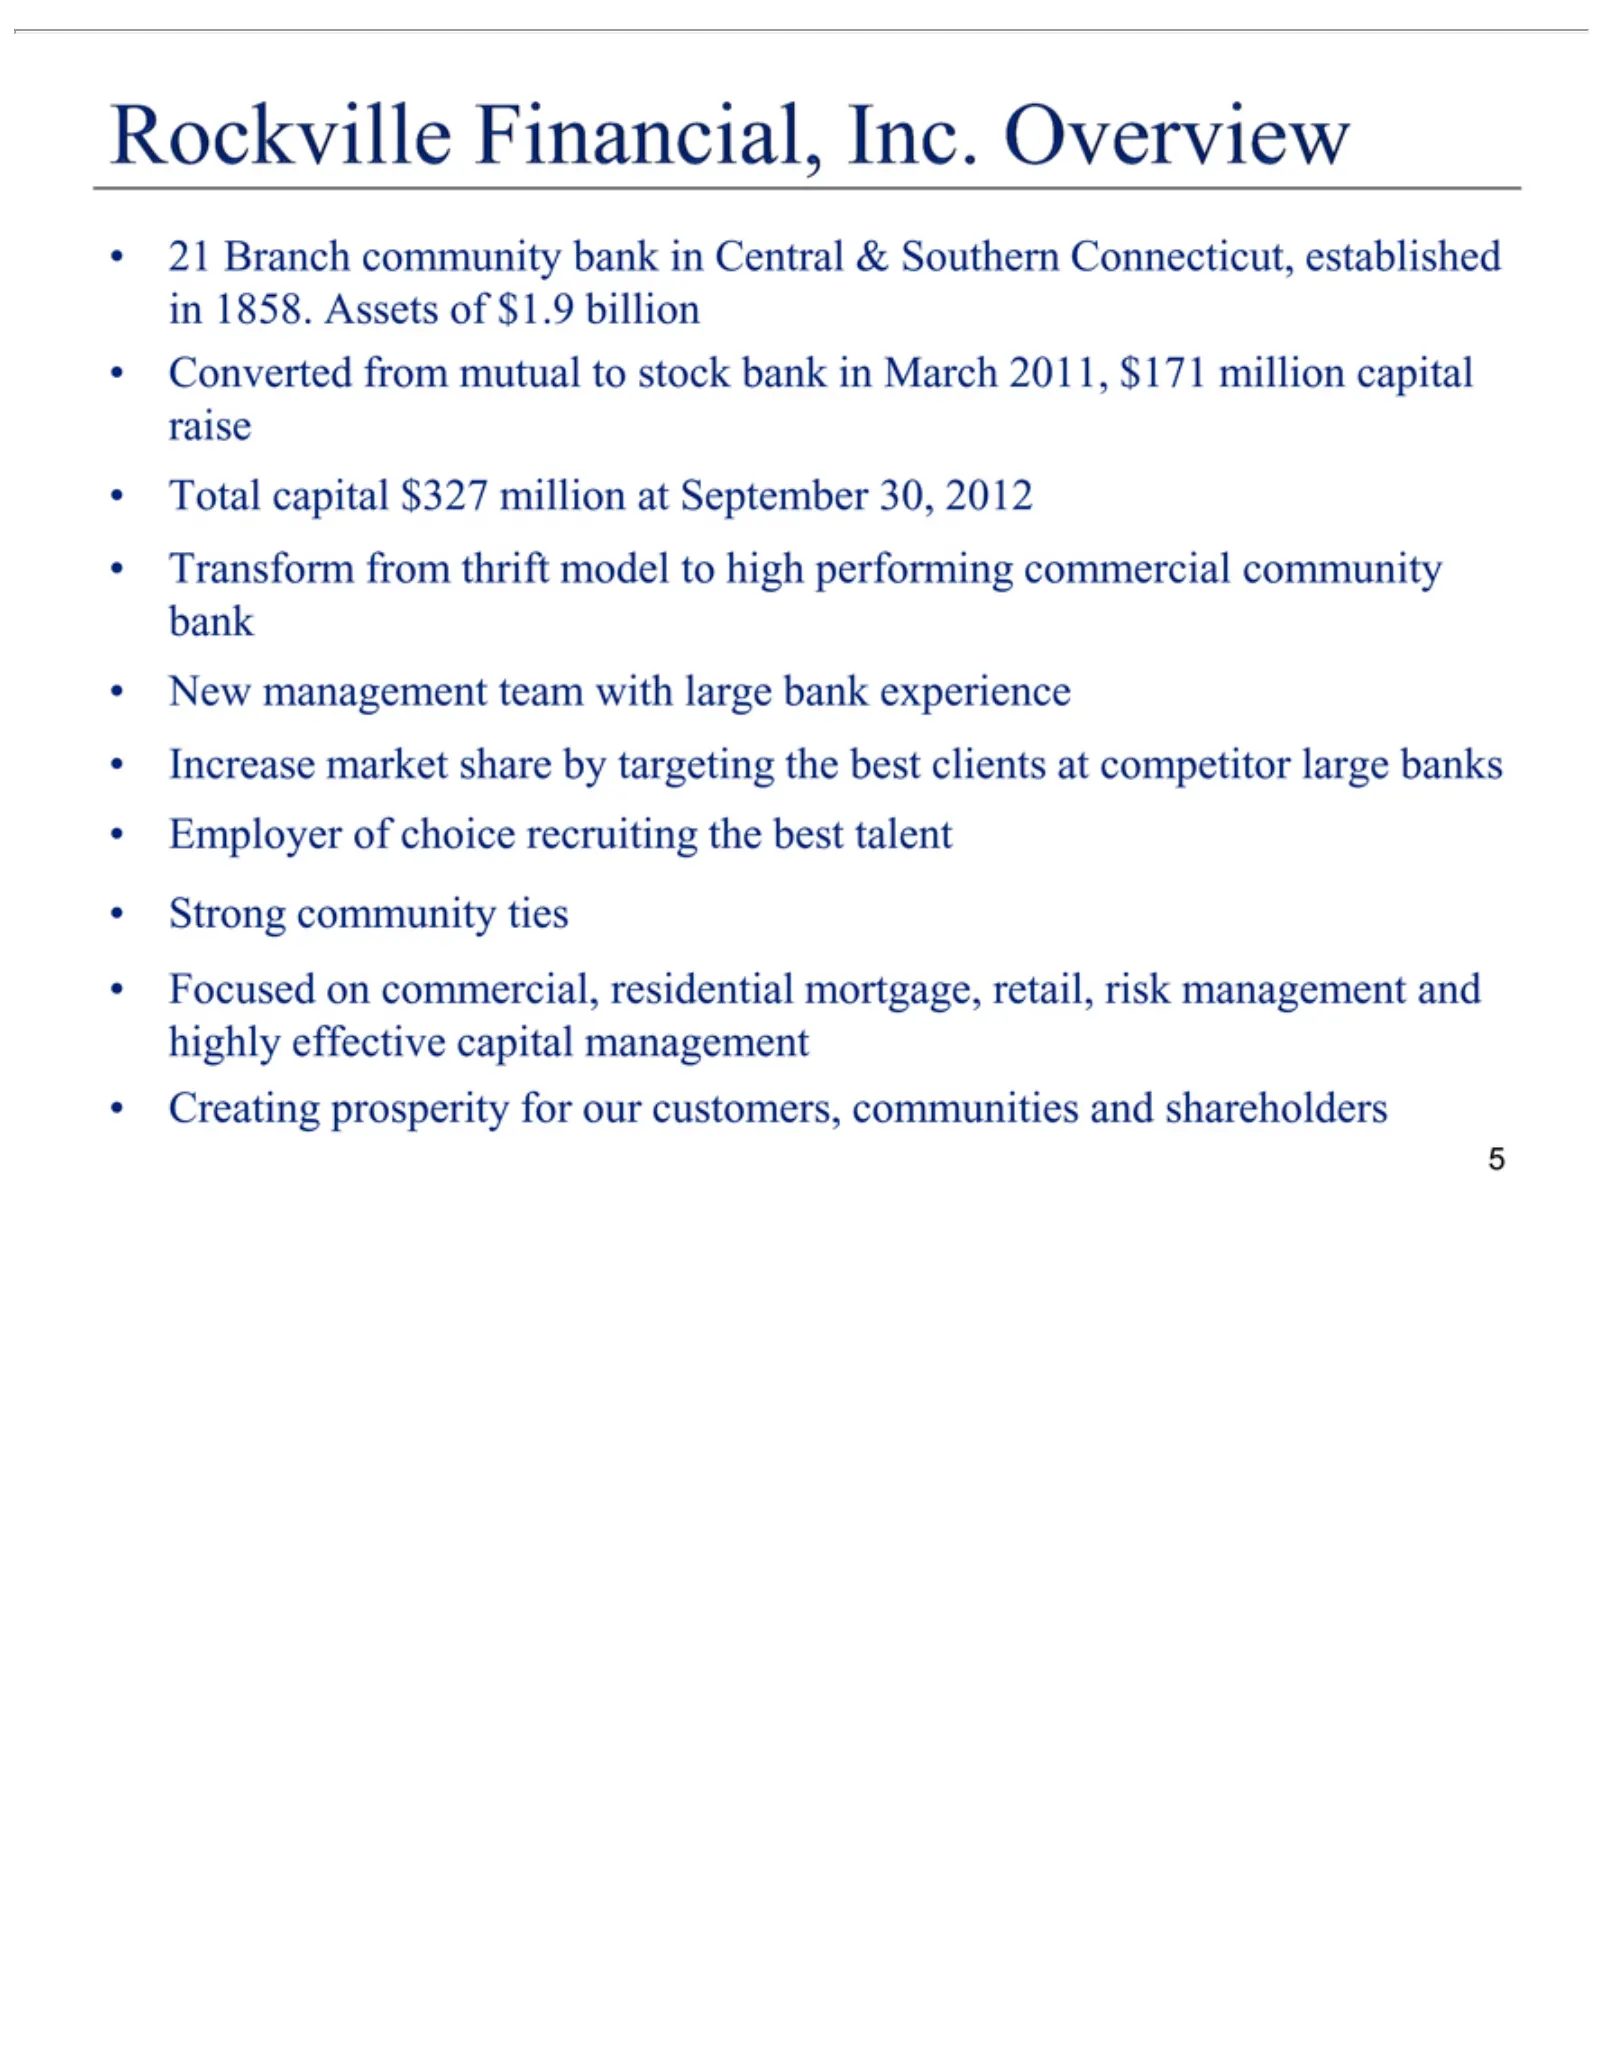
Slide 5: Rockville Financial Overview
Rockville 21 Converted Total Transform New Increase Employer Strong Focused 5Creating Branch management capital community market on prosperity Financial, of community from commercial, $327 choice share mutual thrift million team ties for recruiting Inc. model by bank our to with residential Overview
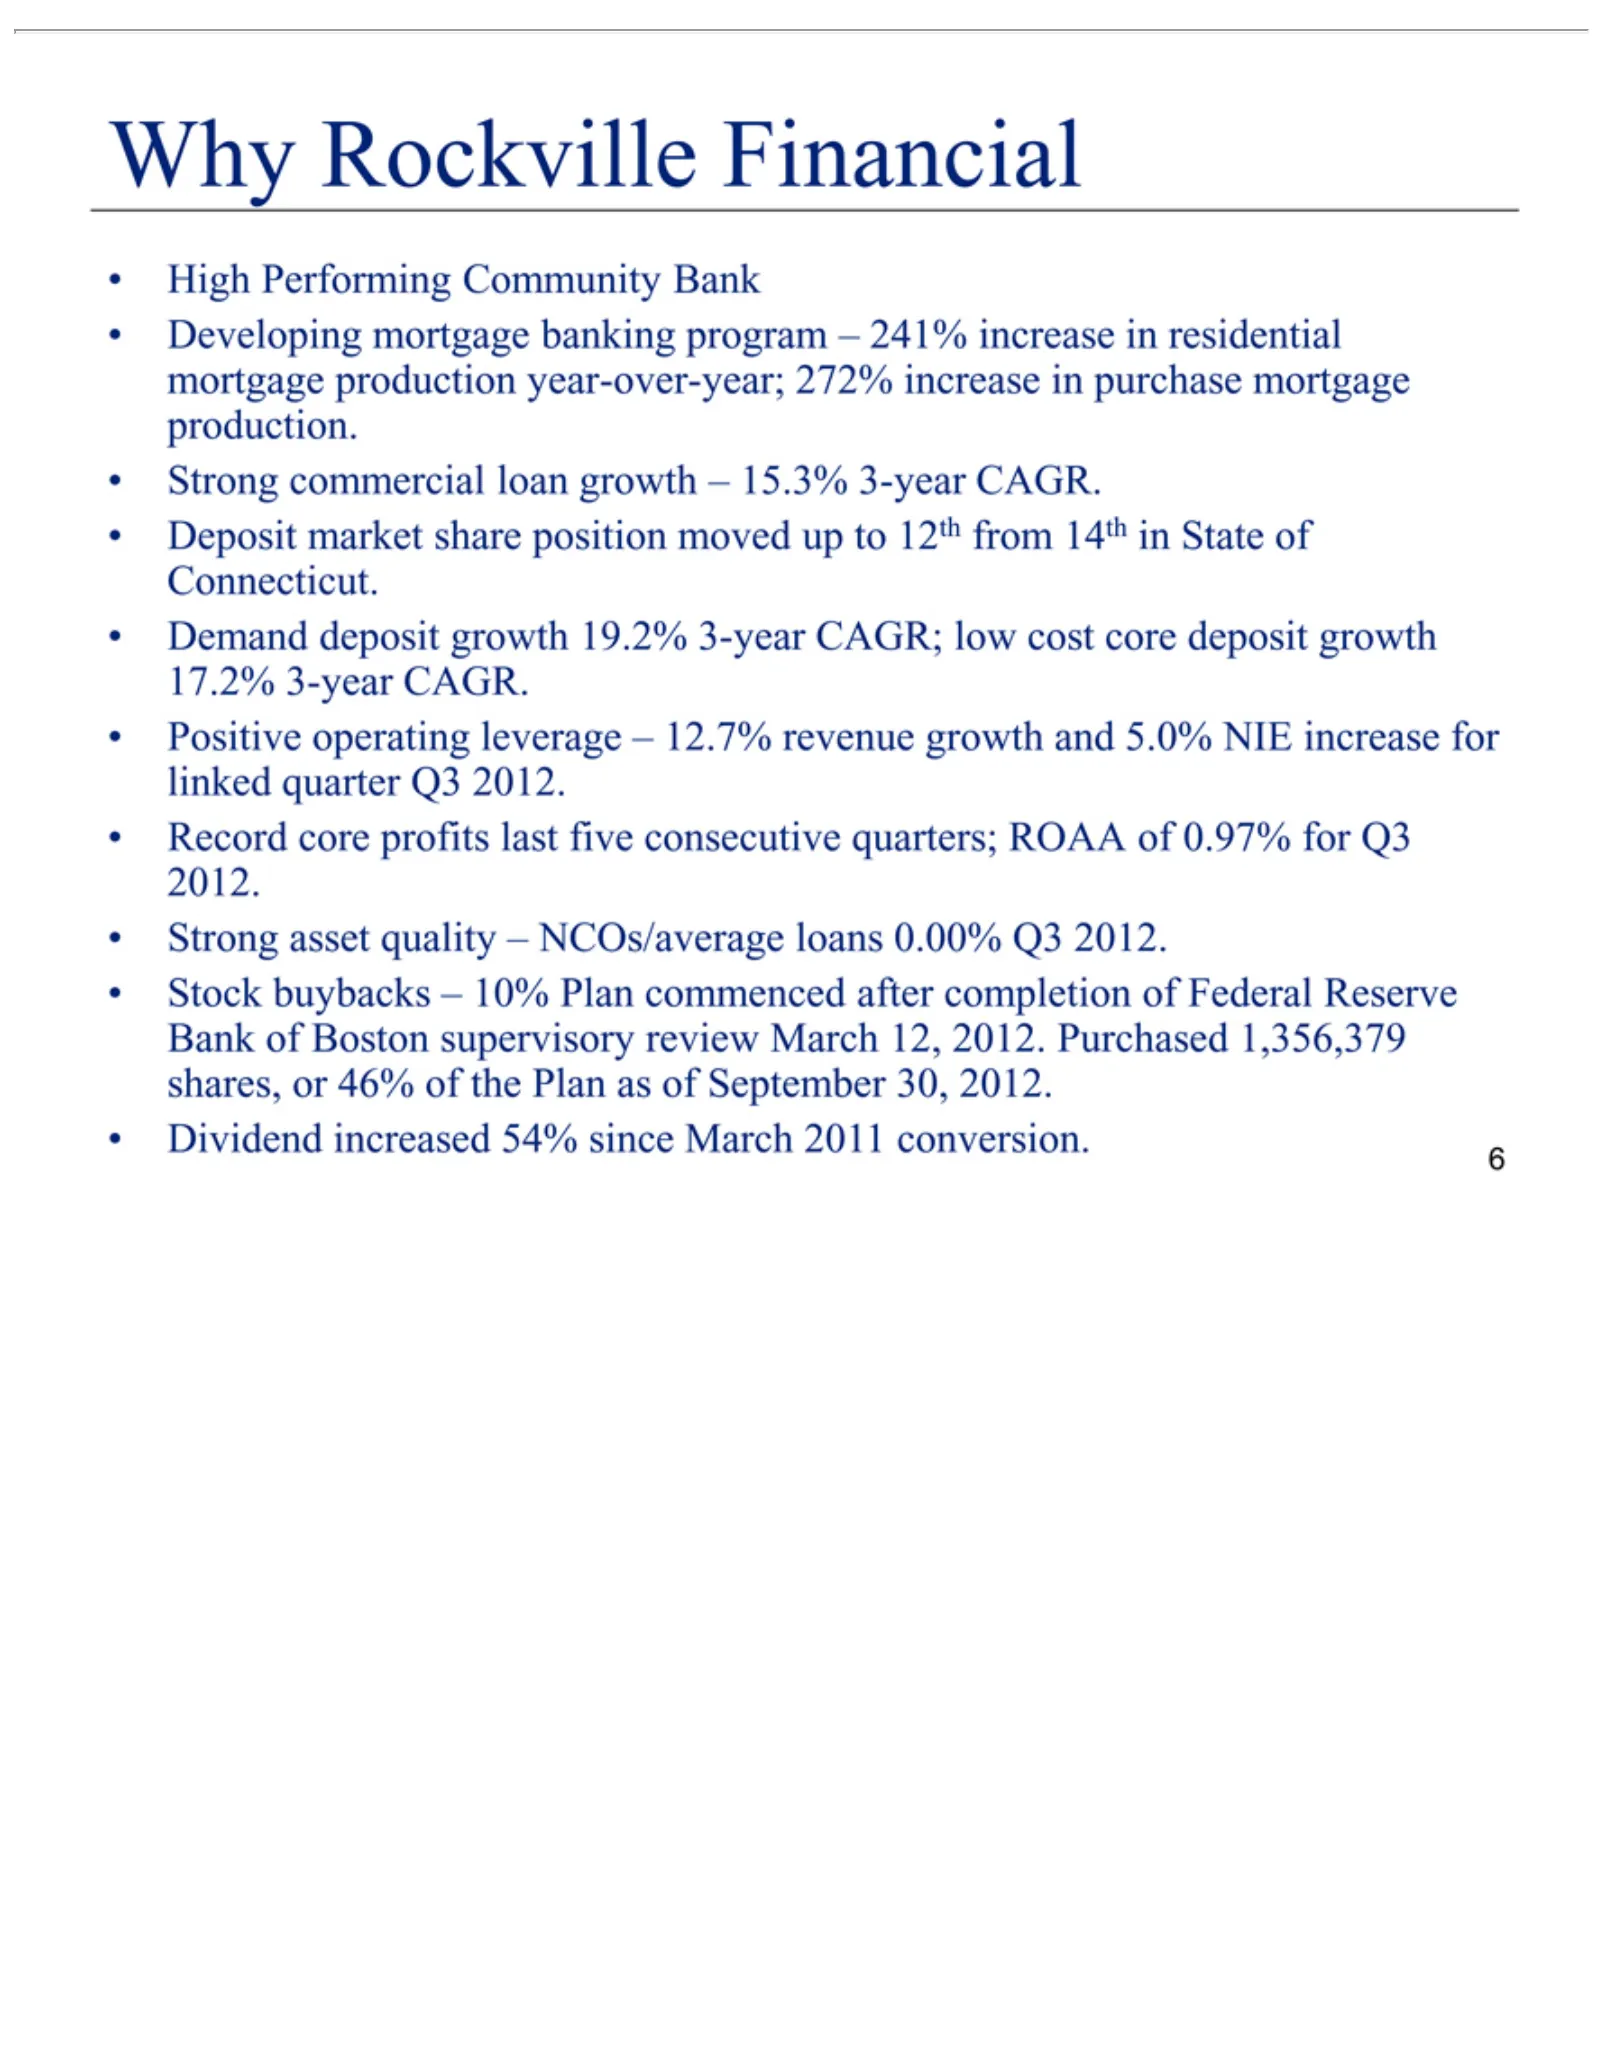
Slide 6: Why Rockville Financial
Why Rockville High Developing Deposit Demand 17.2% Positive Record Strong Stock 6Dividend Performing buybacks 3-year commercial asset core market operating deposit increased mortgage profits quality CAGR. Financial share –growth Community 10% leverage loan last 54% – position NCOs/average banking Pl
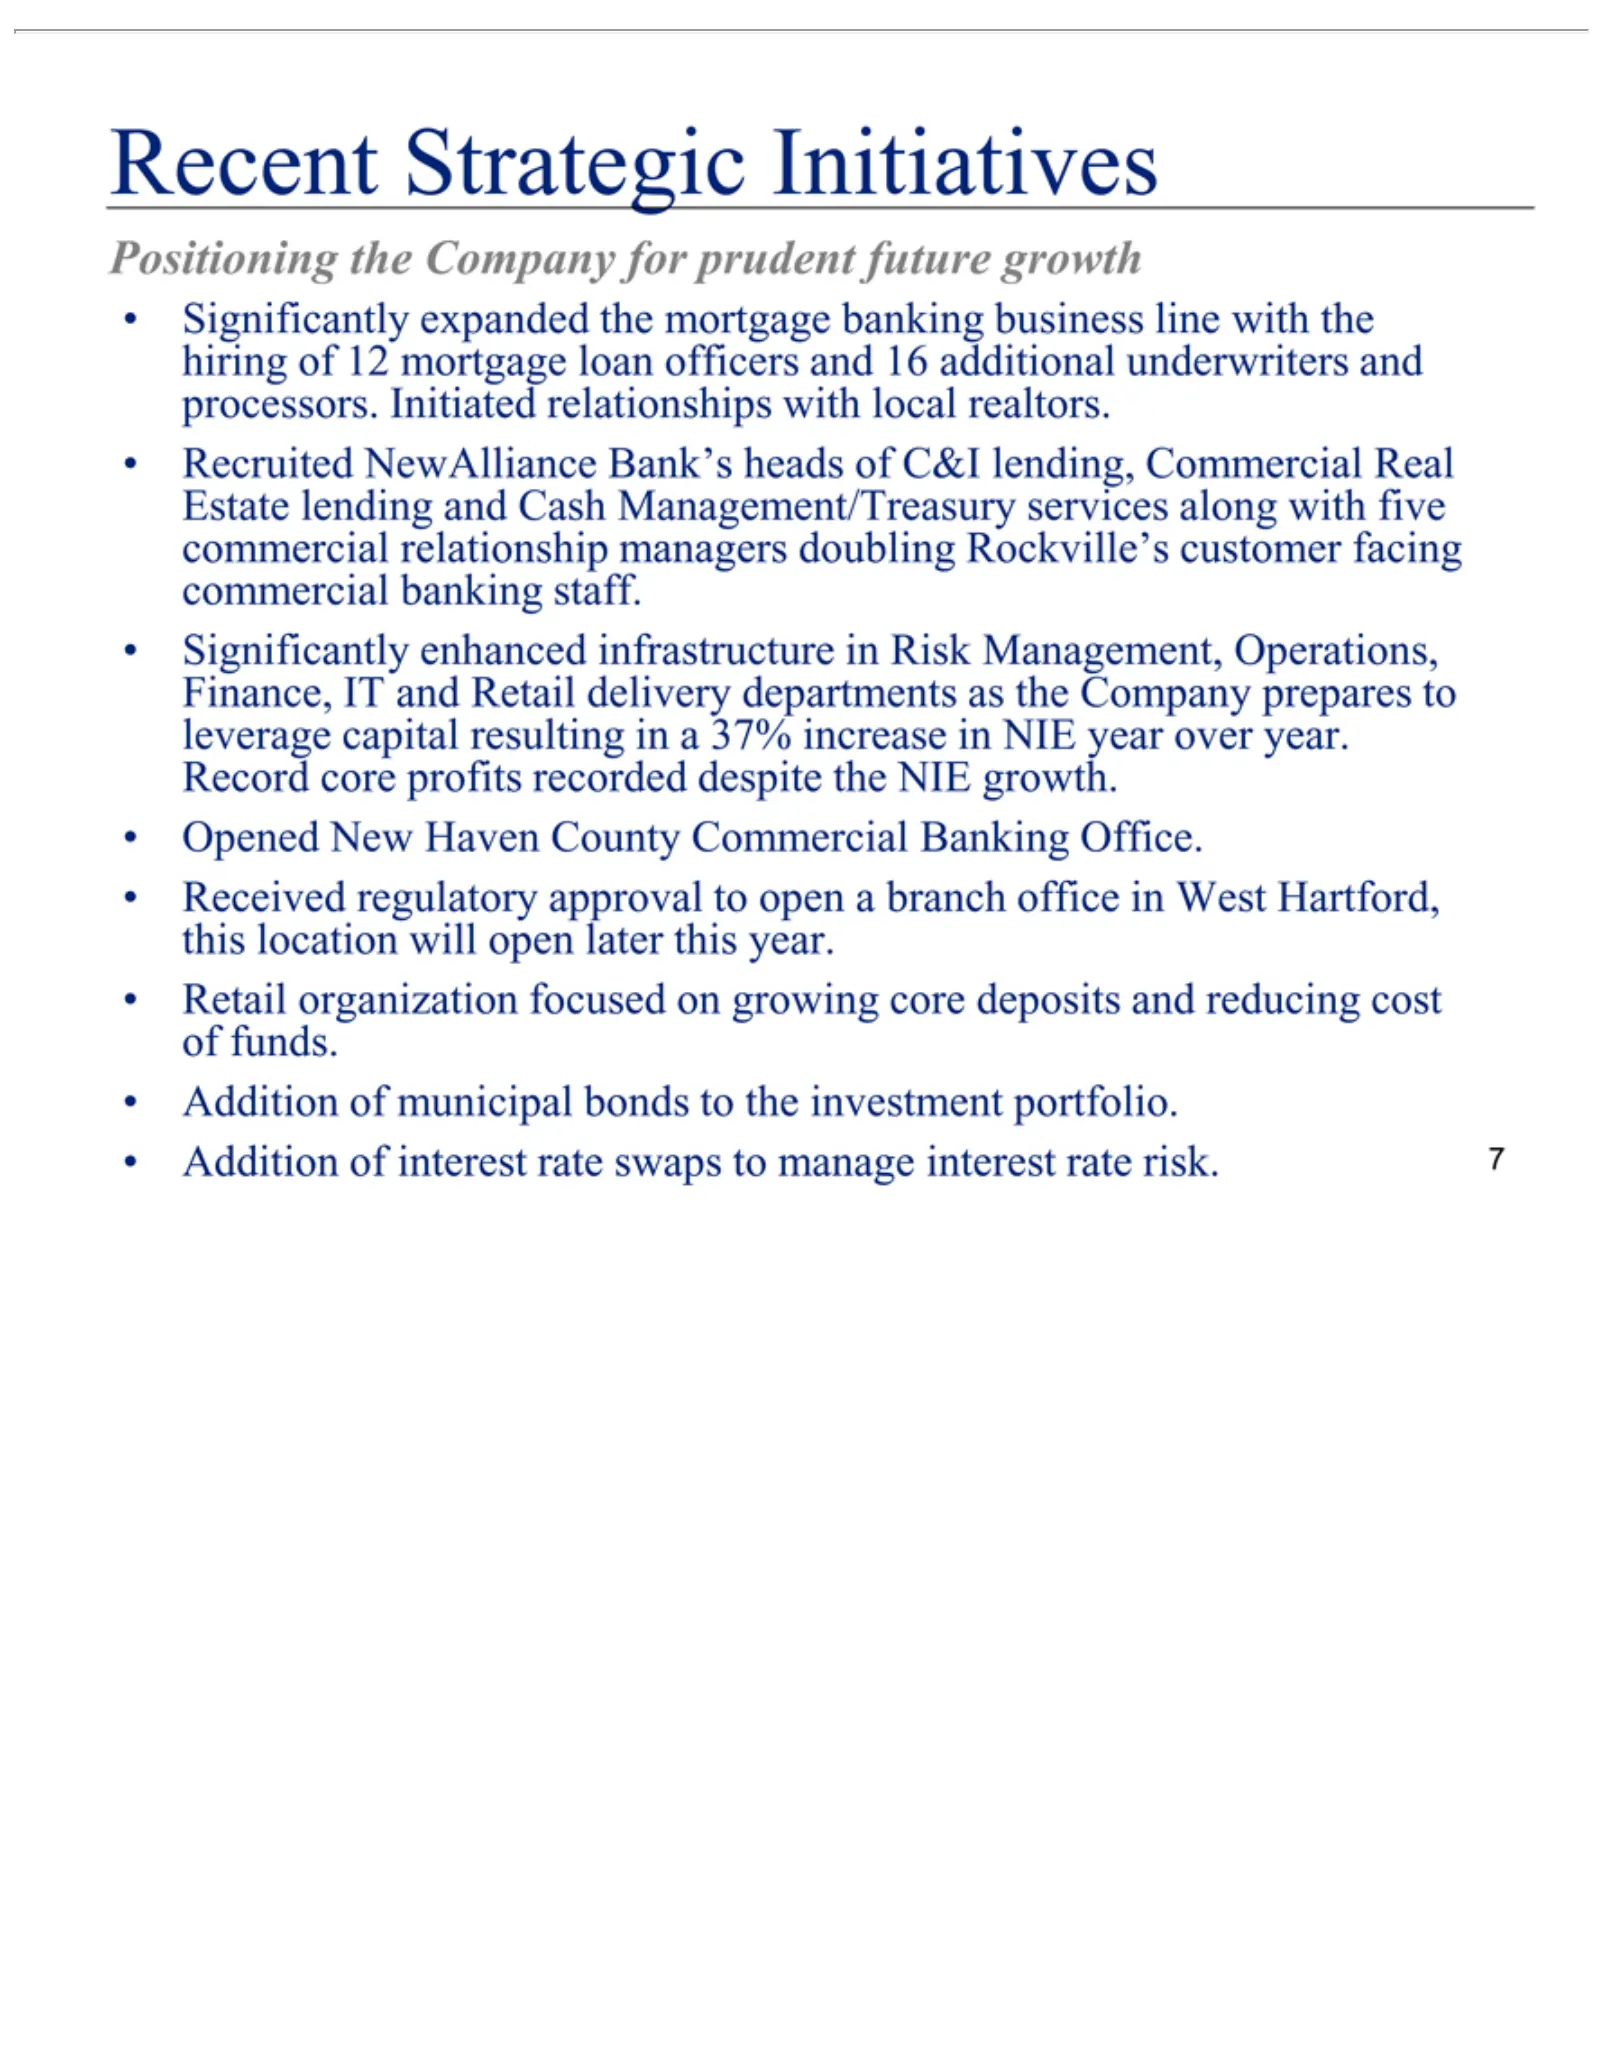
Slide 7: Recent Strategic Initiatives
Recentorganization Positioning Recruited Estate Significantly Record Opened Received Retail 7Addition lending Strategic core New of regulatory NewAlliance the municipal interest profits expanded enhanced Haven and Company Initiatives Cash focused recorded rate approval County bonds infrastructure th
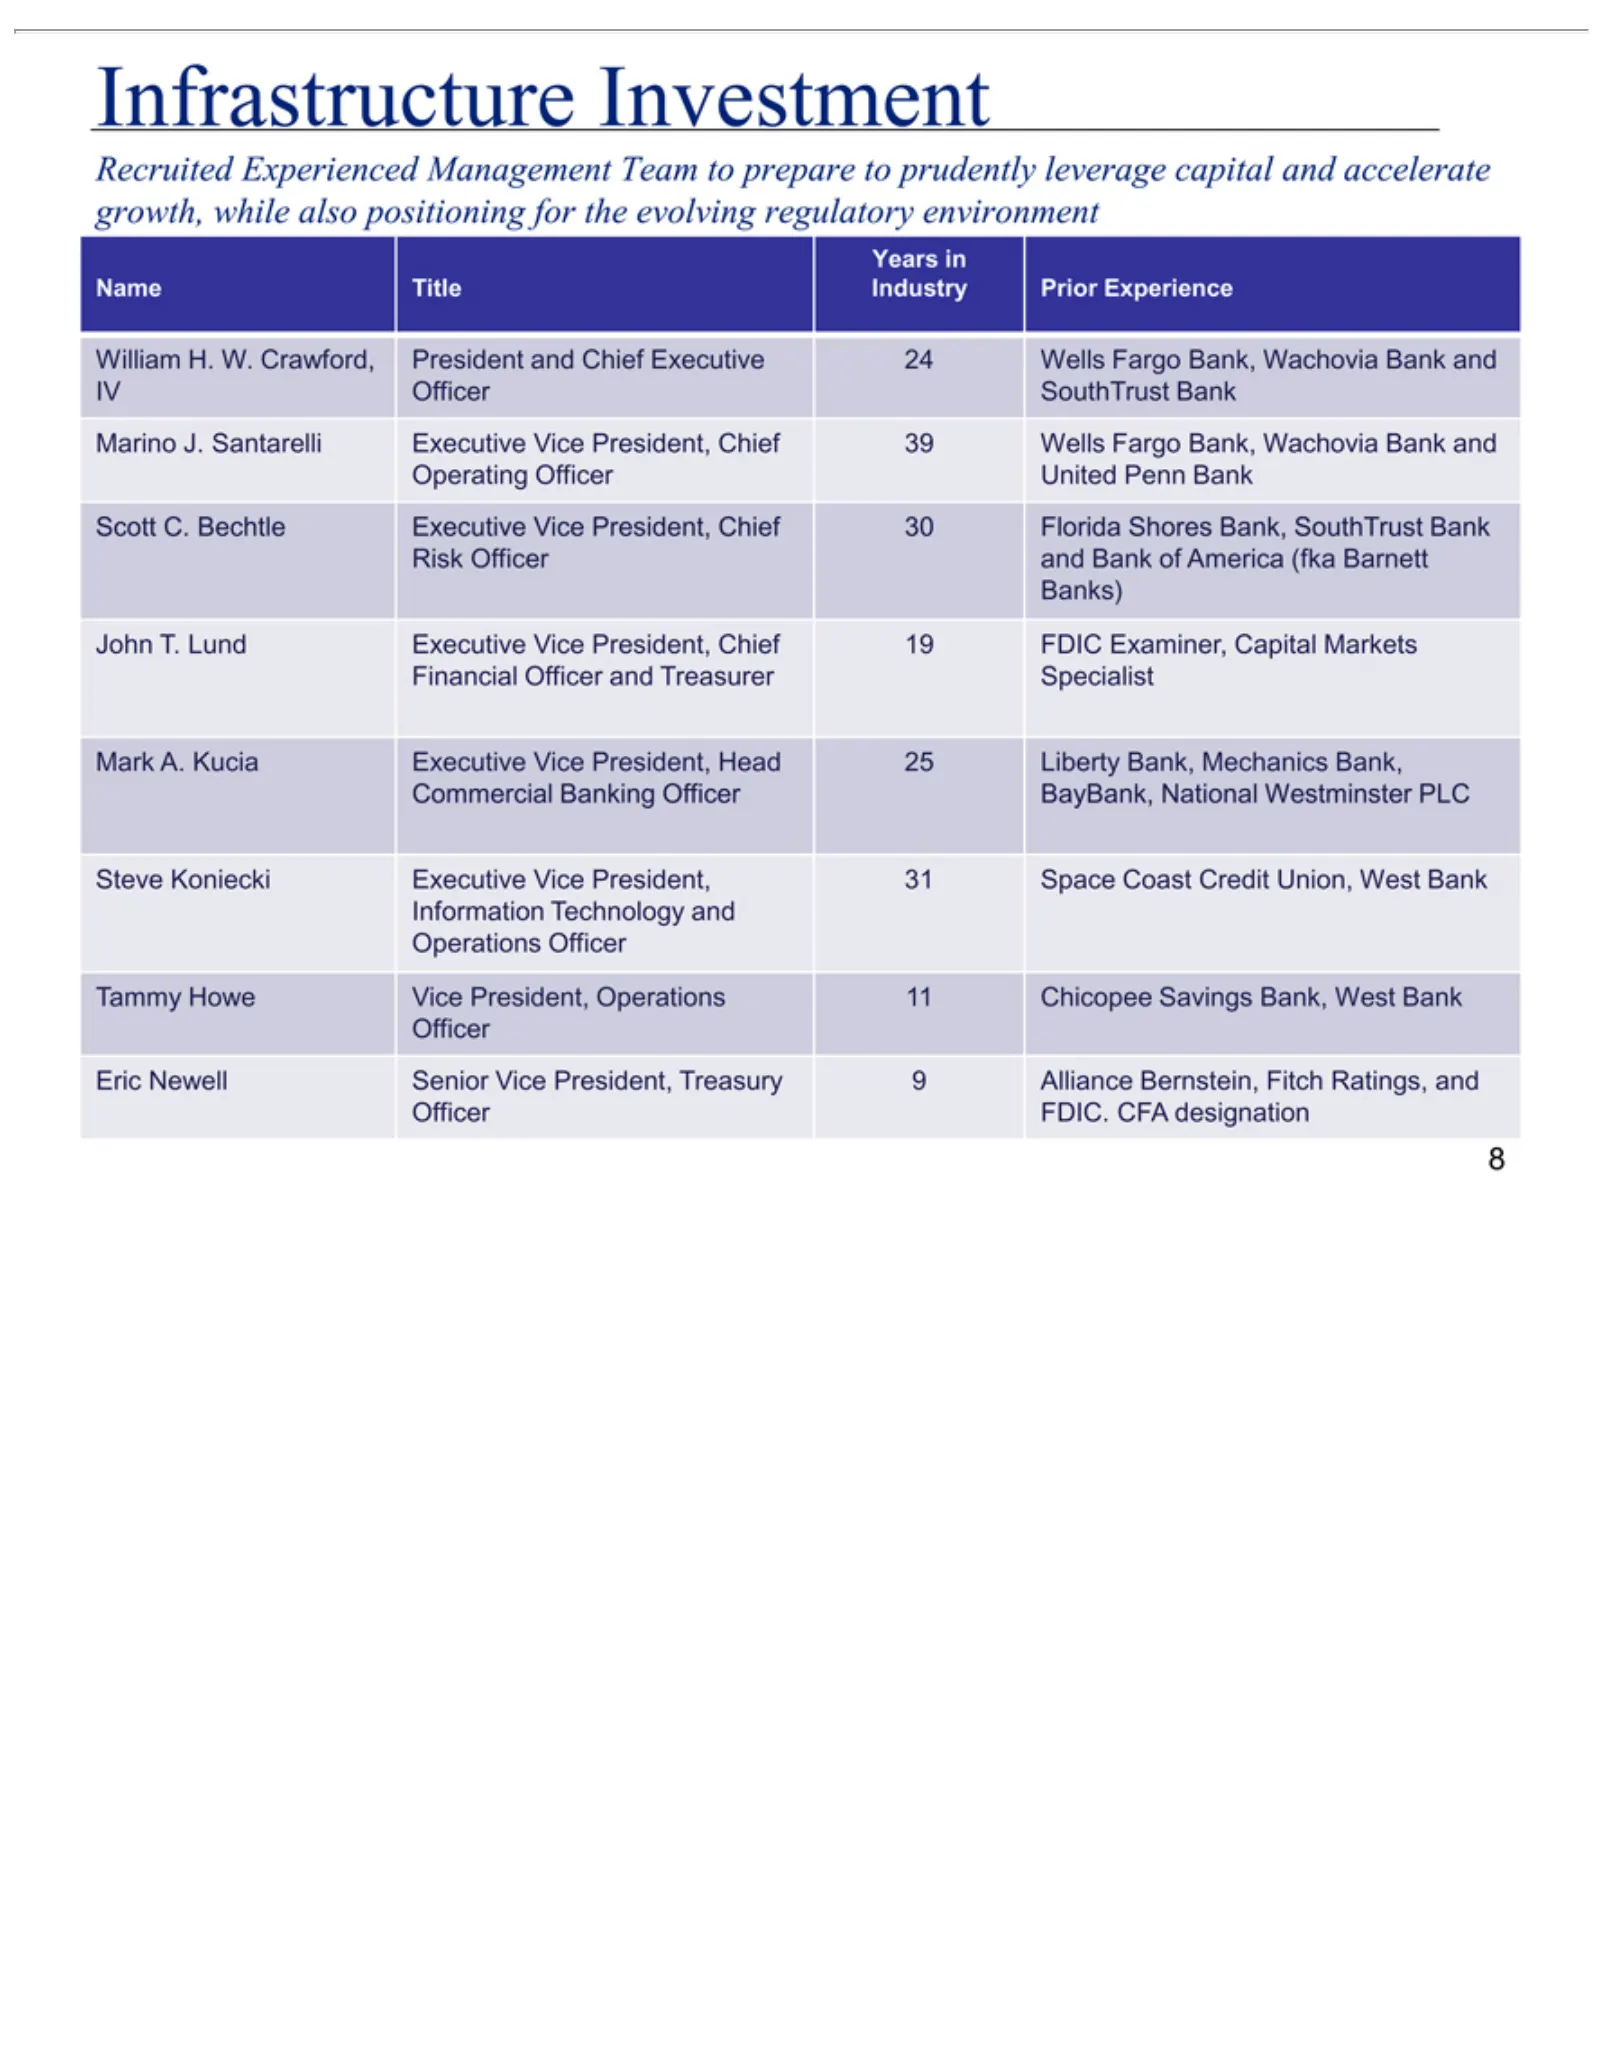
Slide 8: Infrastructure: Recruited Experienced Team
Infrastructure Recruited Years Name William IV Marino Operating Scott Risk John Banks) Financial Mark Commercial Steve Information Operations Tammy Eric 8Officer Officer Newell Officer T. C. A. Koniecki in Title FDIC. Lund J. Howe Bechtle H. Kucia Officer Santarelli Experienced Officer SouthTrust Of
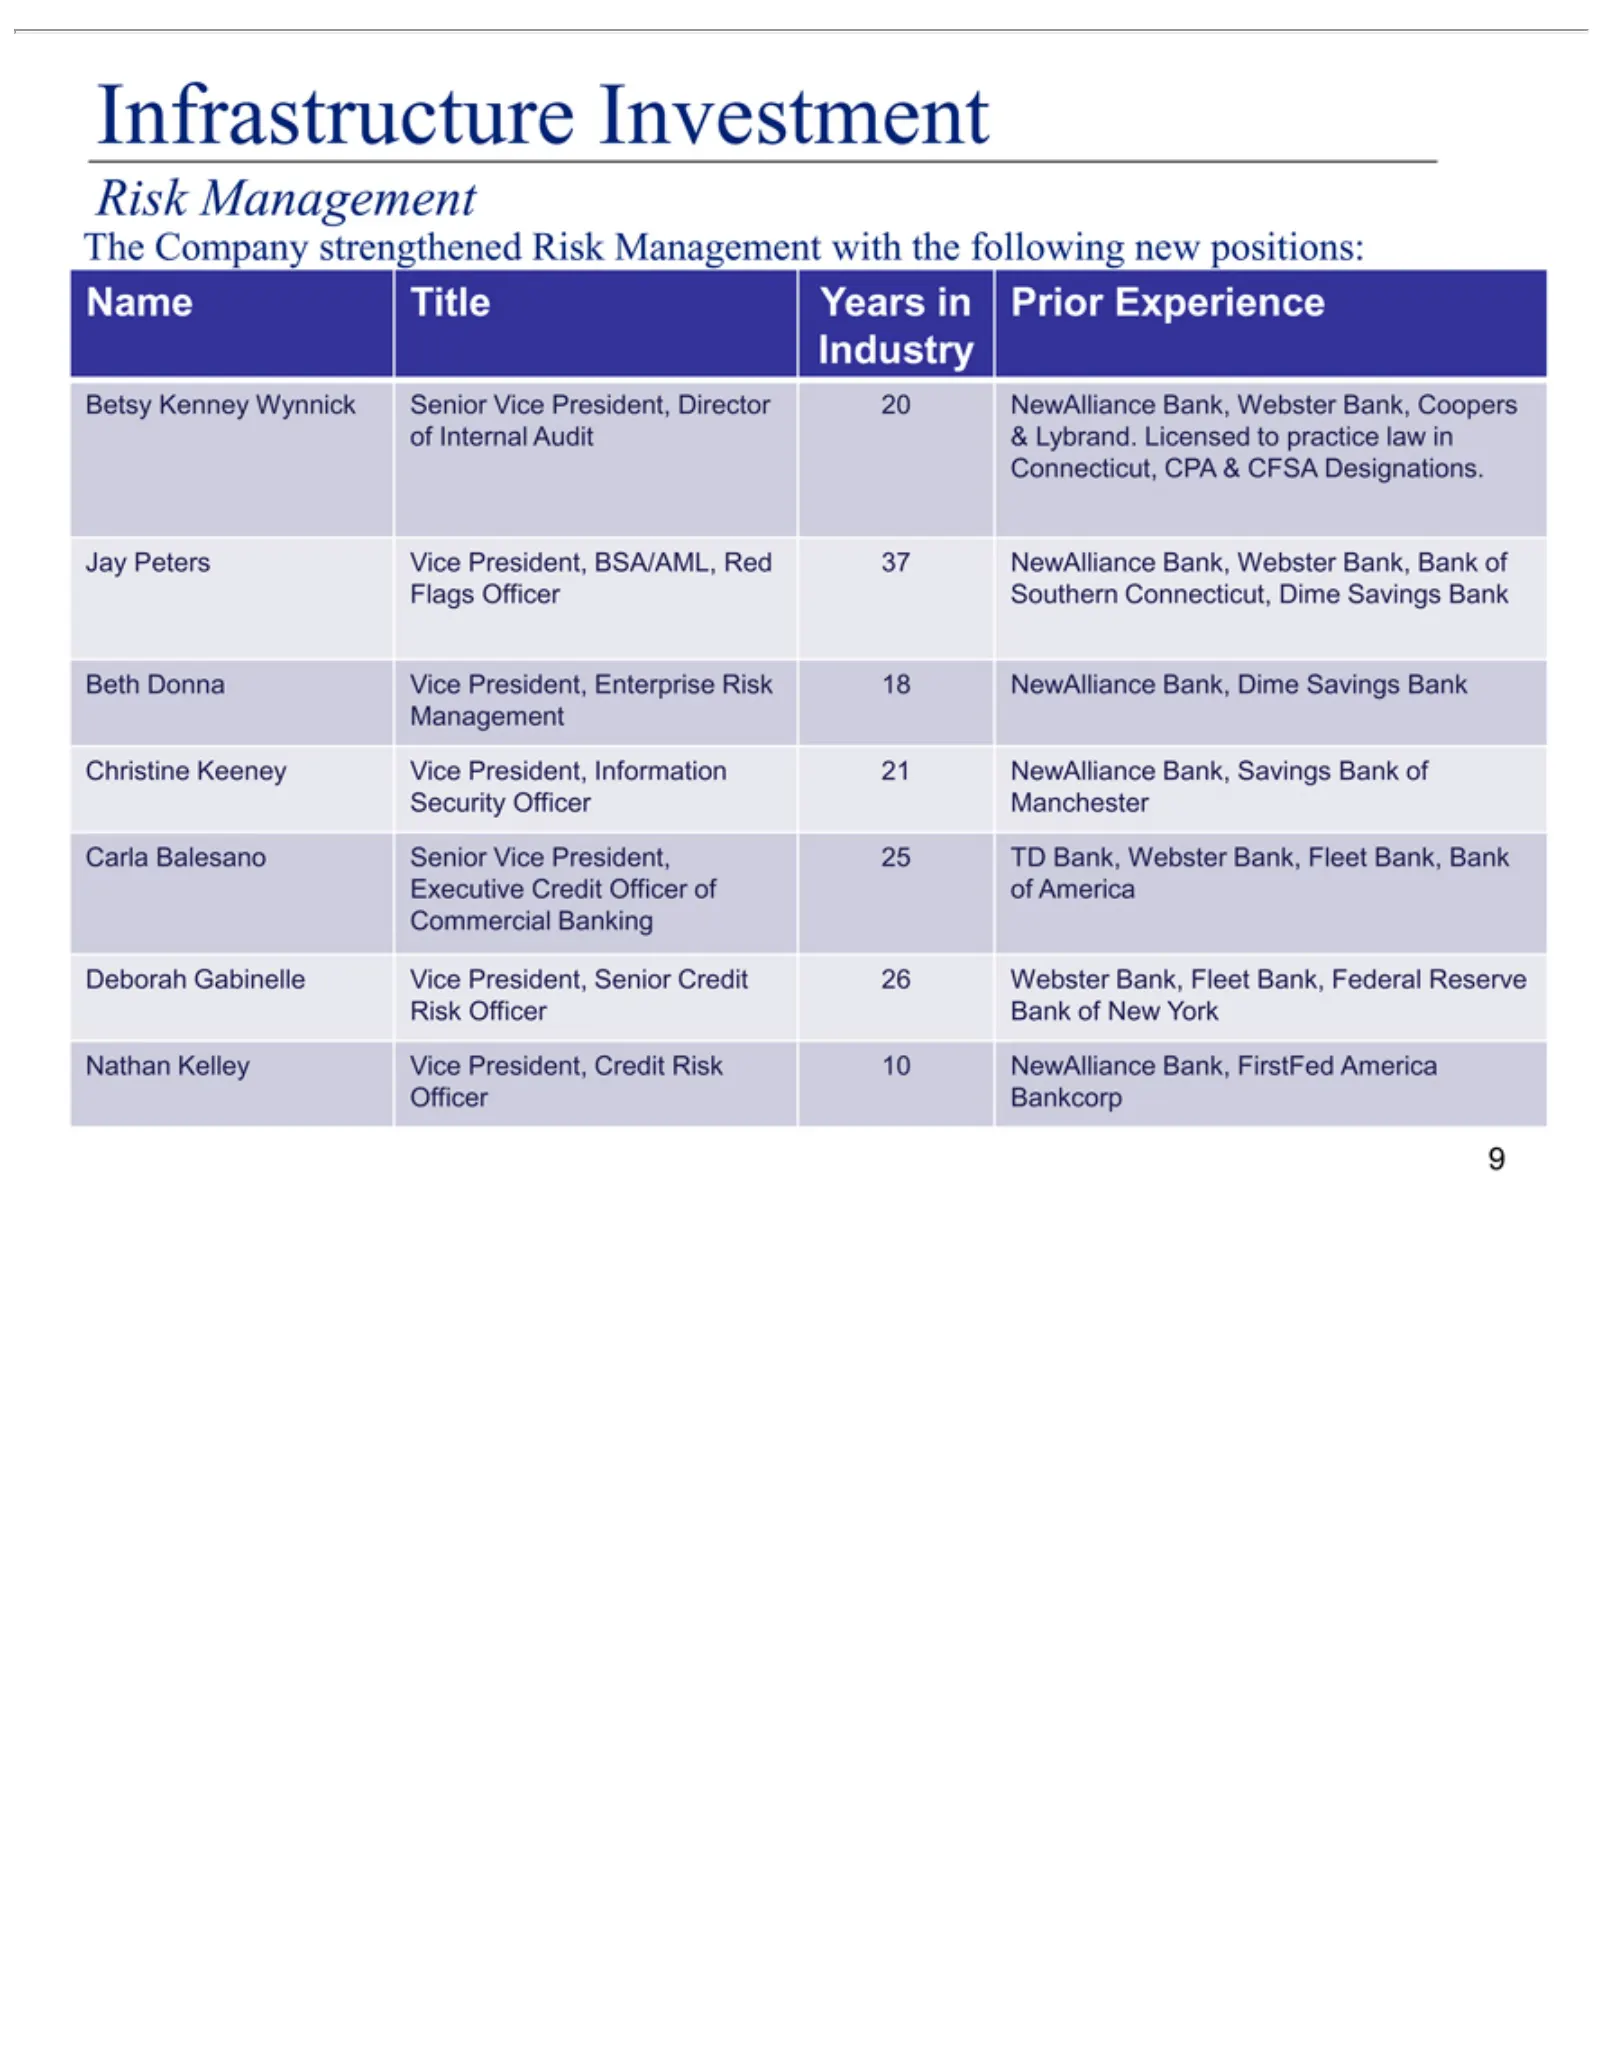
Slide 9: Infrastructure Strengthened
Infrastructure The Name Betsy Industry of Connecticut, Jay Flags Beth Christine Management Security Carla Executive Commercial Deborah Risk Nathan 9Officer Internal Peters Company Management Officer Donna Balesano Officer Kenney Title Bankcorp Kelley Officer Gabinelle Keeney Credit Vice Audit Years
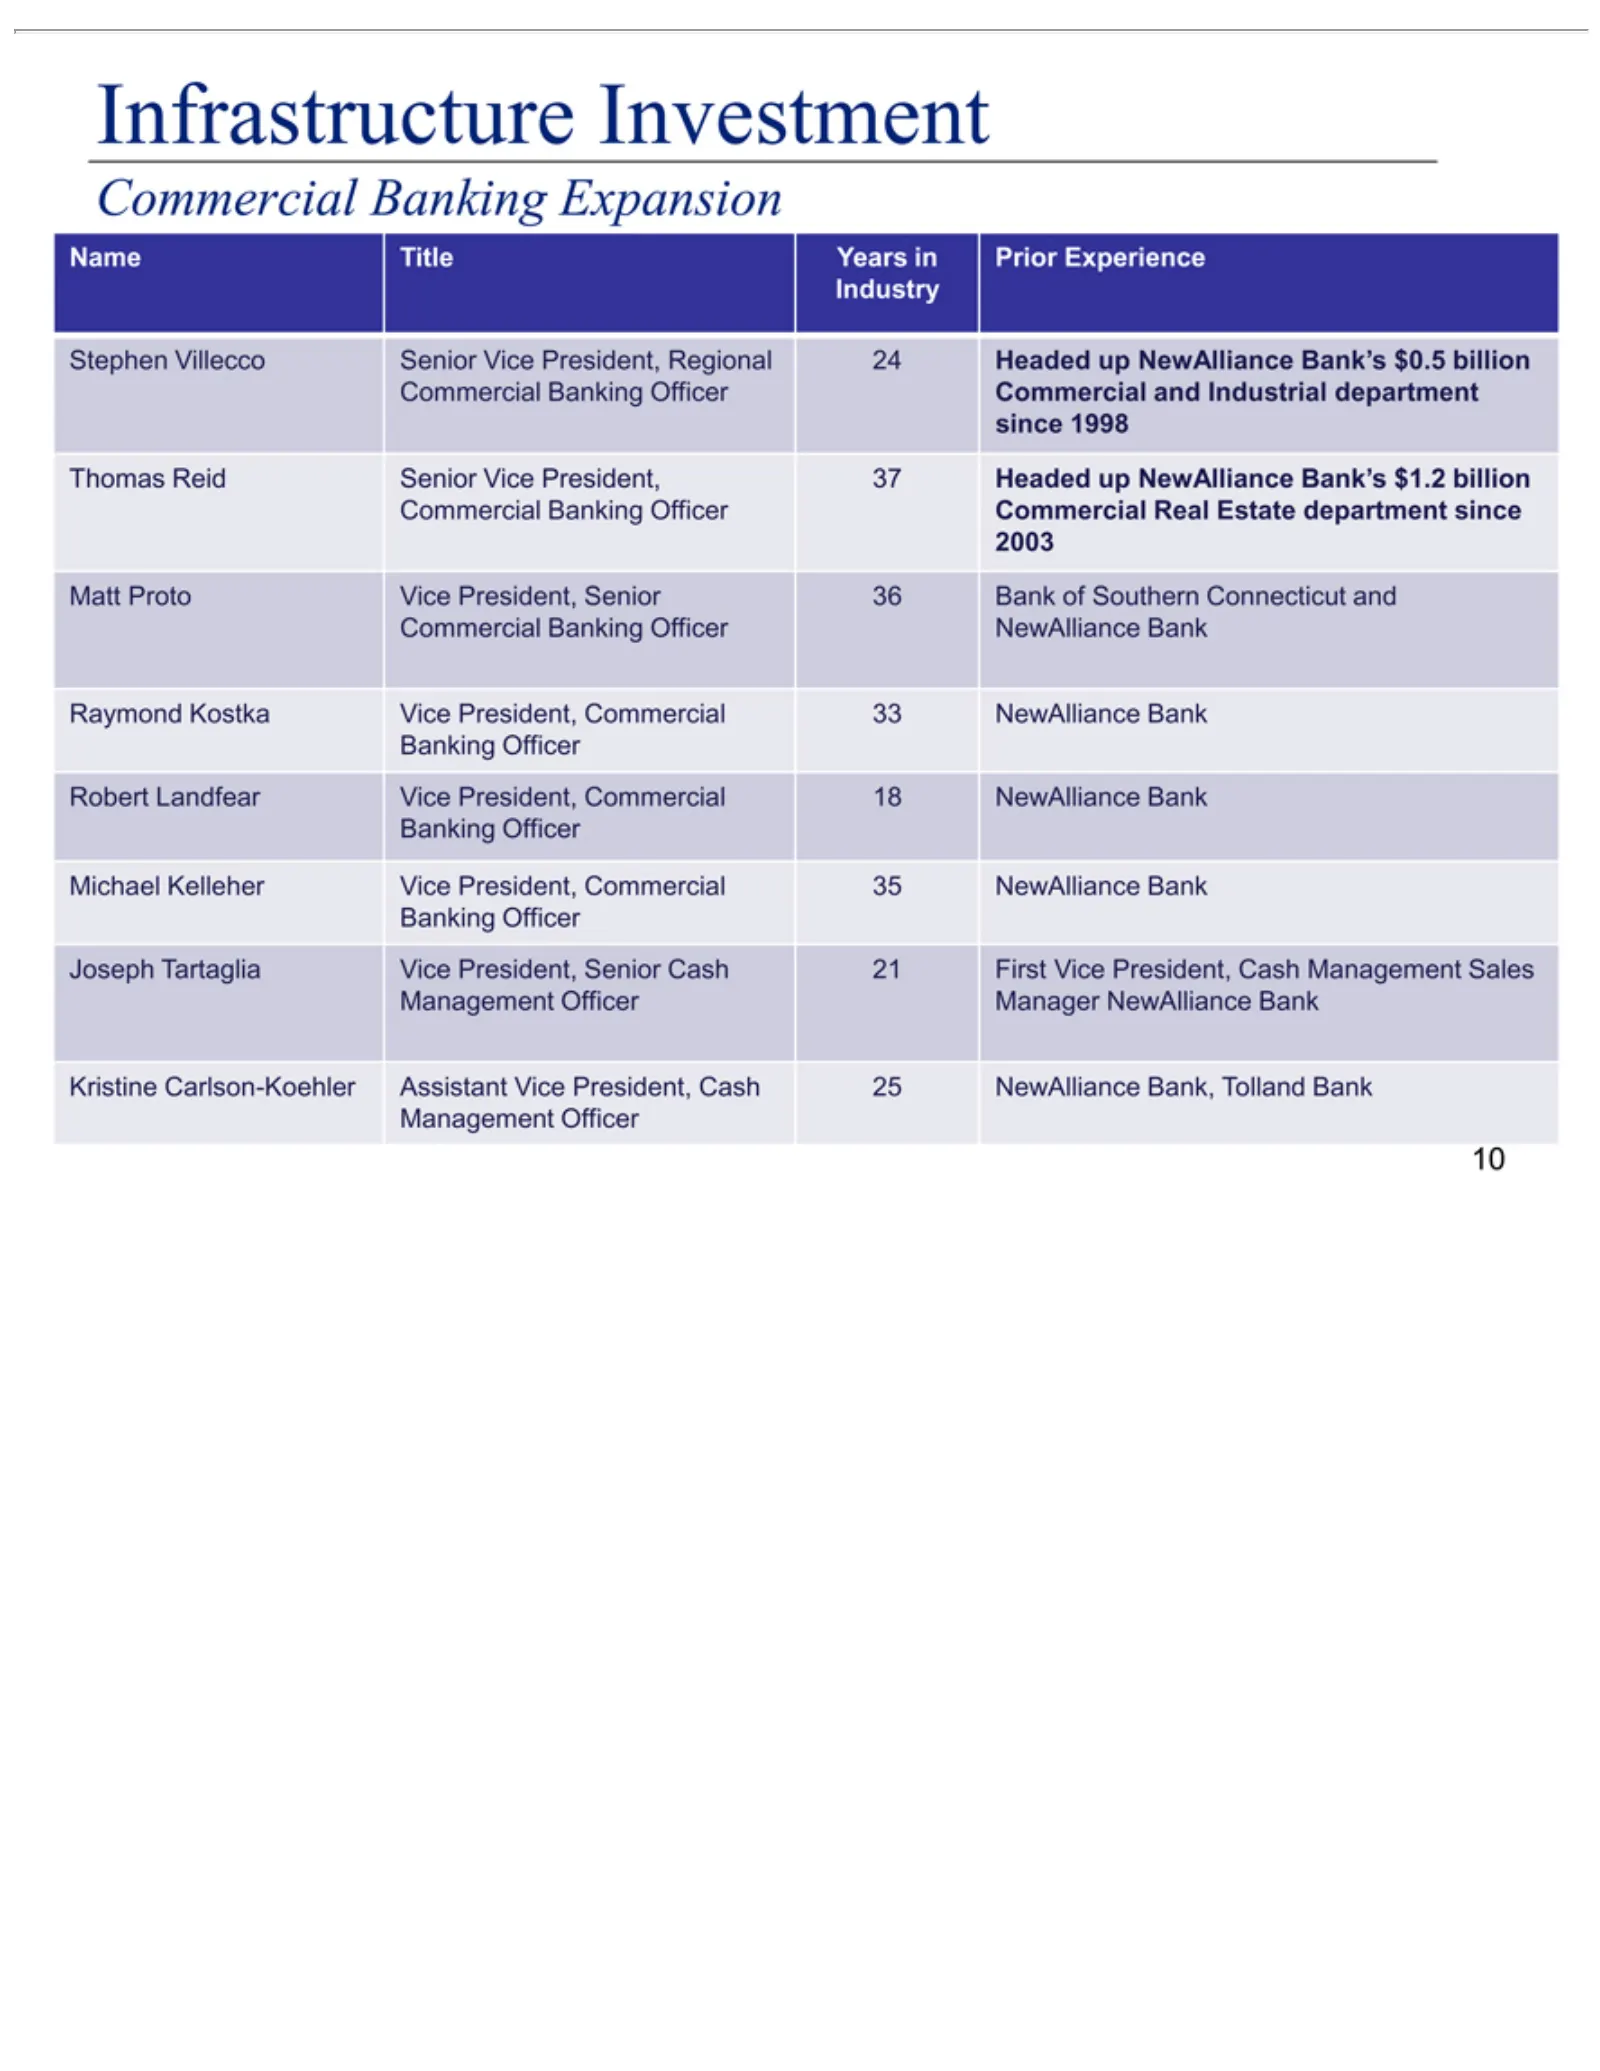
Slide 10: Infrastructure: Commercial Banking Team
Infrastructure Name Stephen Industry since Thomas Matt 2003 Commercial Raymond Robert Michael Banking Joseph Kristine Management 10 Proto 1998 Title Tartaglia Landfear Villecco Reid Carlson-Koehler Kelleher Officer Kostka Vice Years Banking Officer Senior Investment President, Vice Senior in Vice Pr
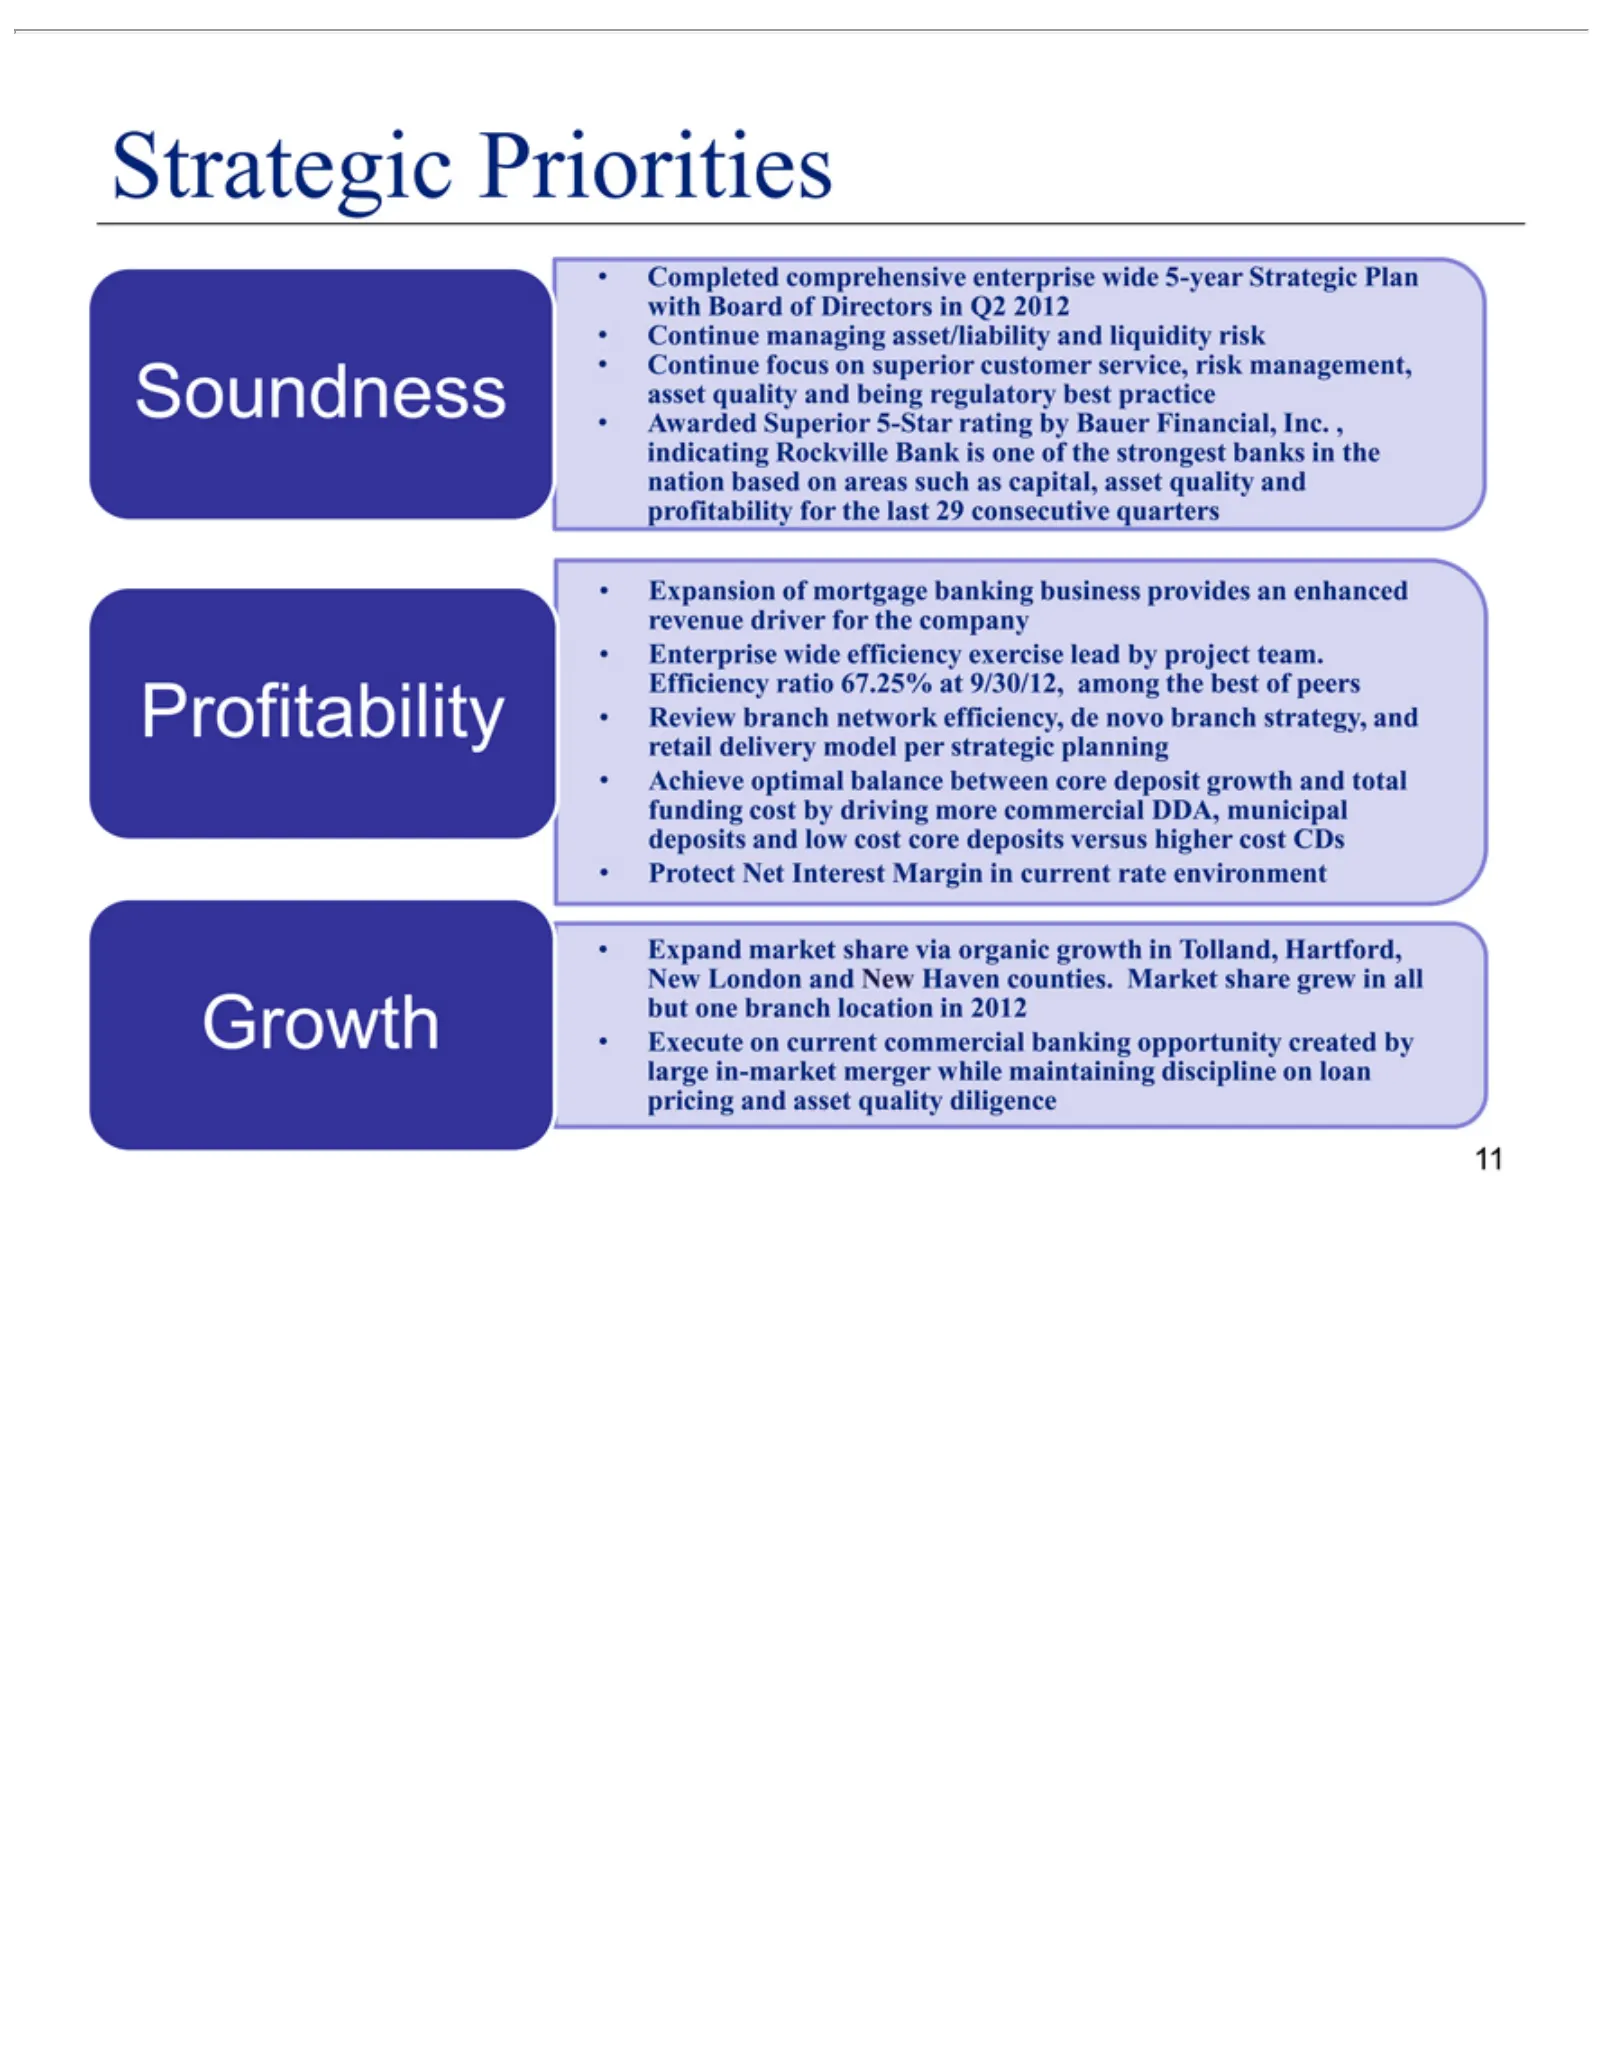
Slide 11: Strategic Priorities
Strategic Completed Soundness asset and Expansion Profitability Review DDA, Expand Growth created 11 profitability quality municipal by market branch Priorities large of comprehensive and mortgage network share in-market for being deposits the via regulatory banking last efficiency, organic and merg
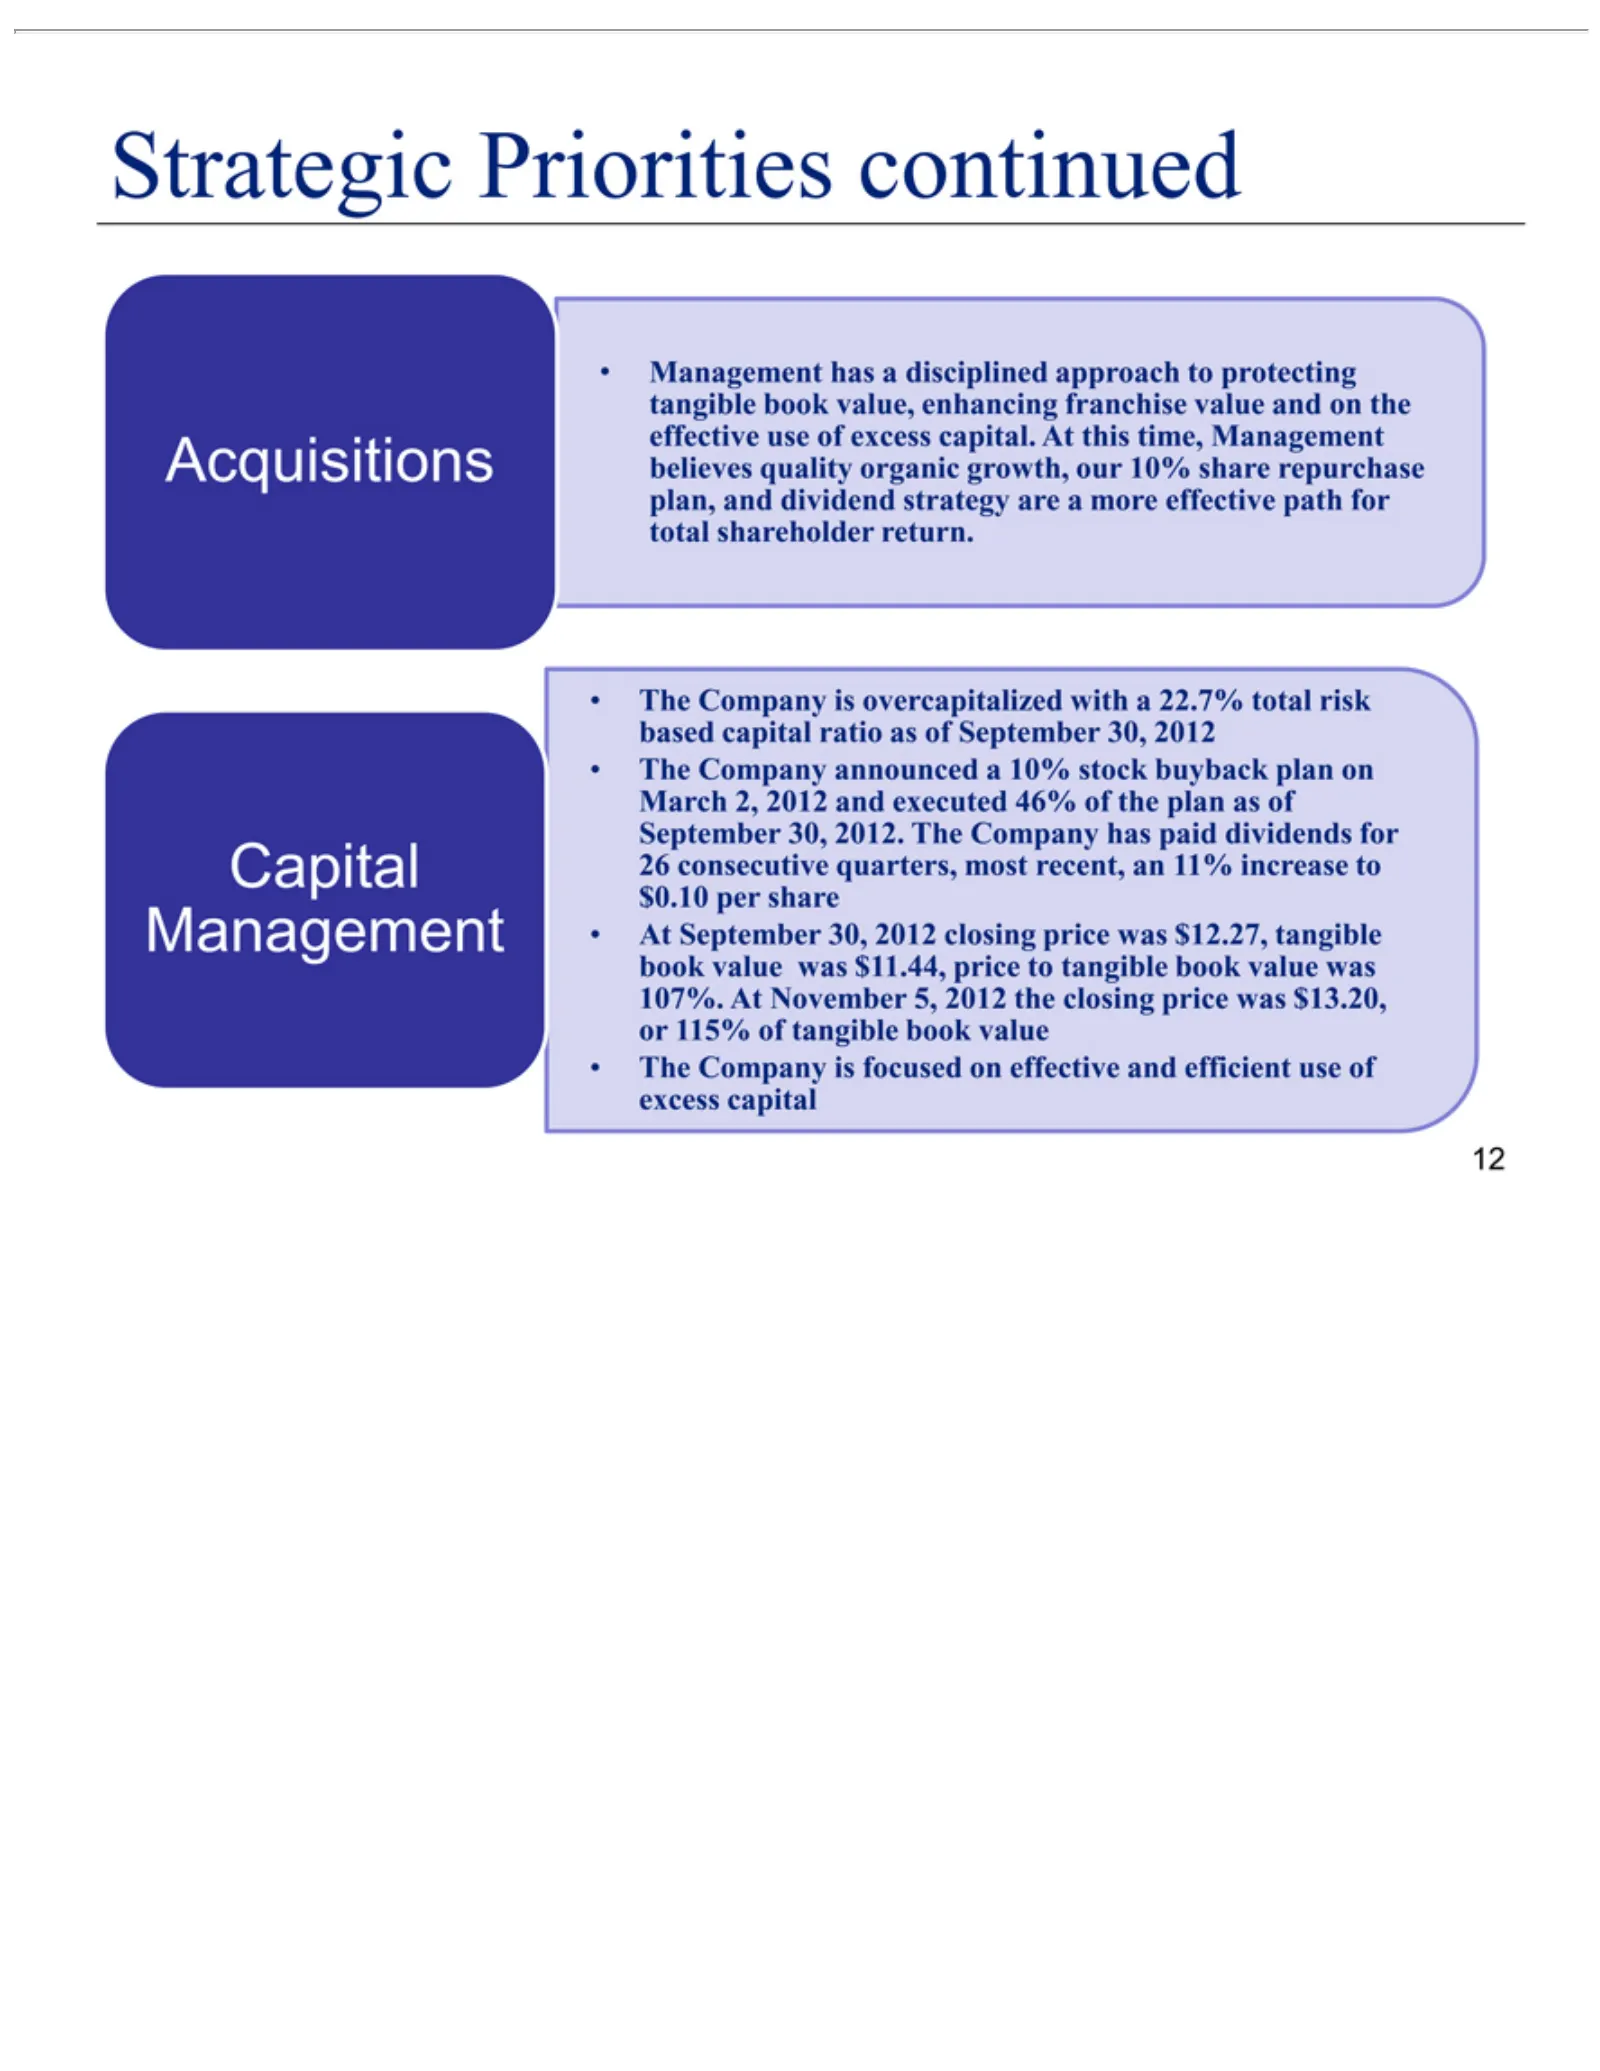
Slide 12: Strategic Priorities: Capital Management
Strategic Management Acquisitions repurchase Capital The September price 12 Company to Management tangible Priorities 30, plan, has is 2012. book and overcapitalized a continued disciplined dividend The value Company wasstrategy approach with 107%. has aare 22.7% At paid to aNovember protecting more
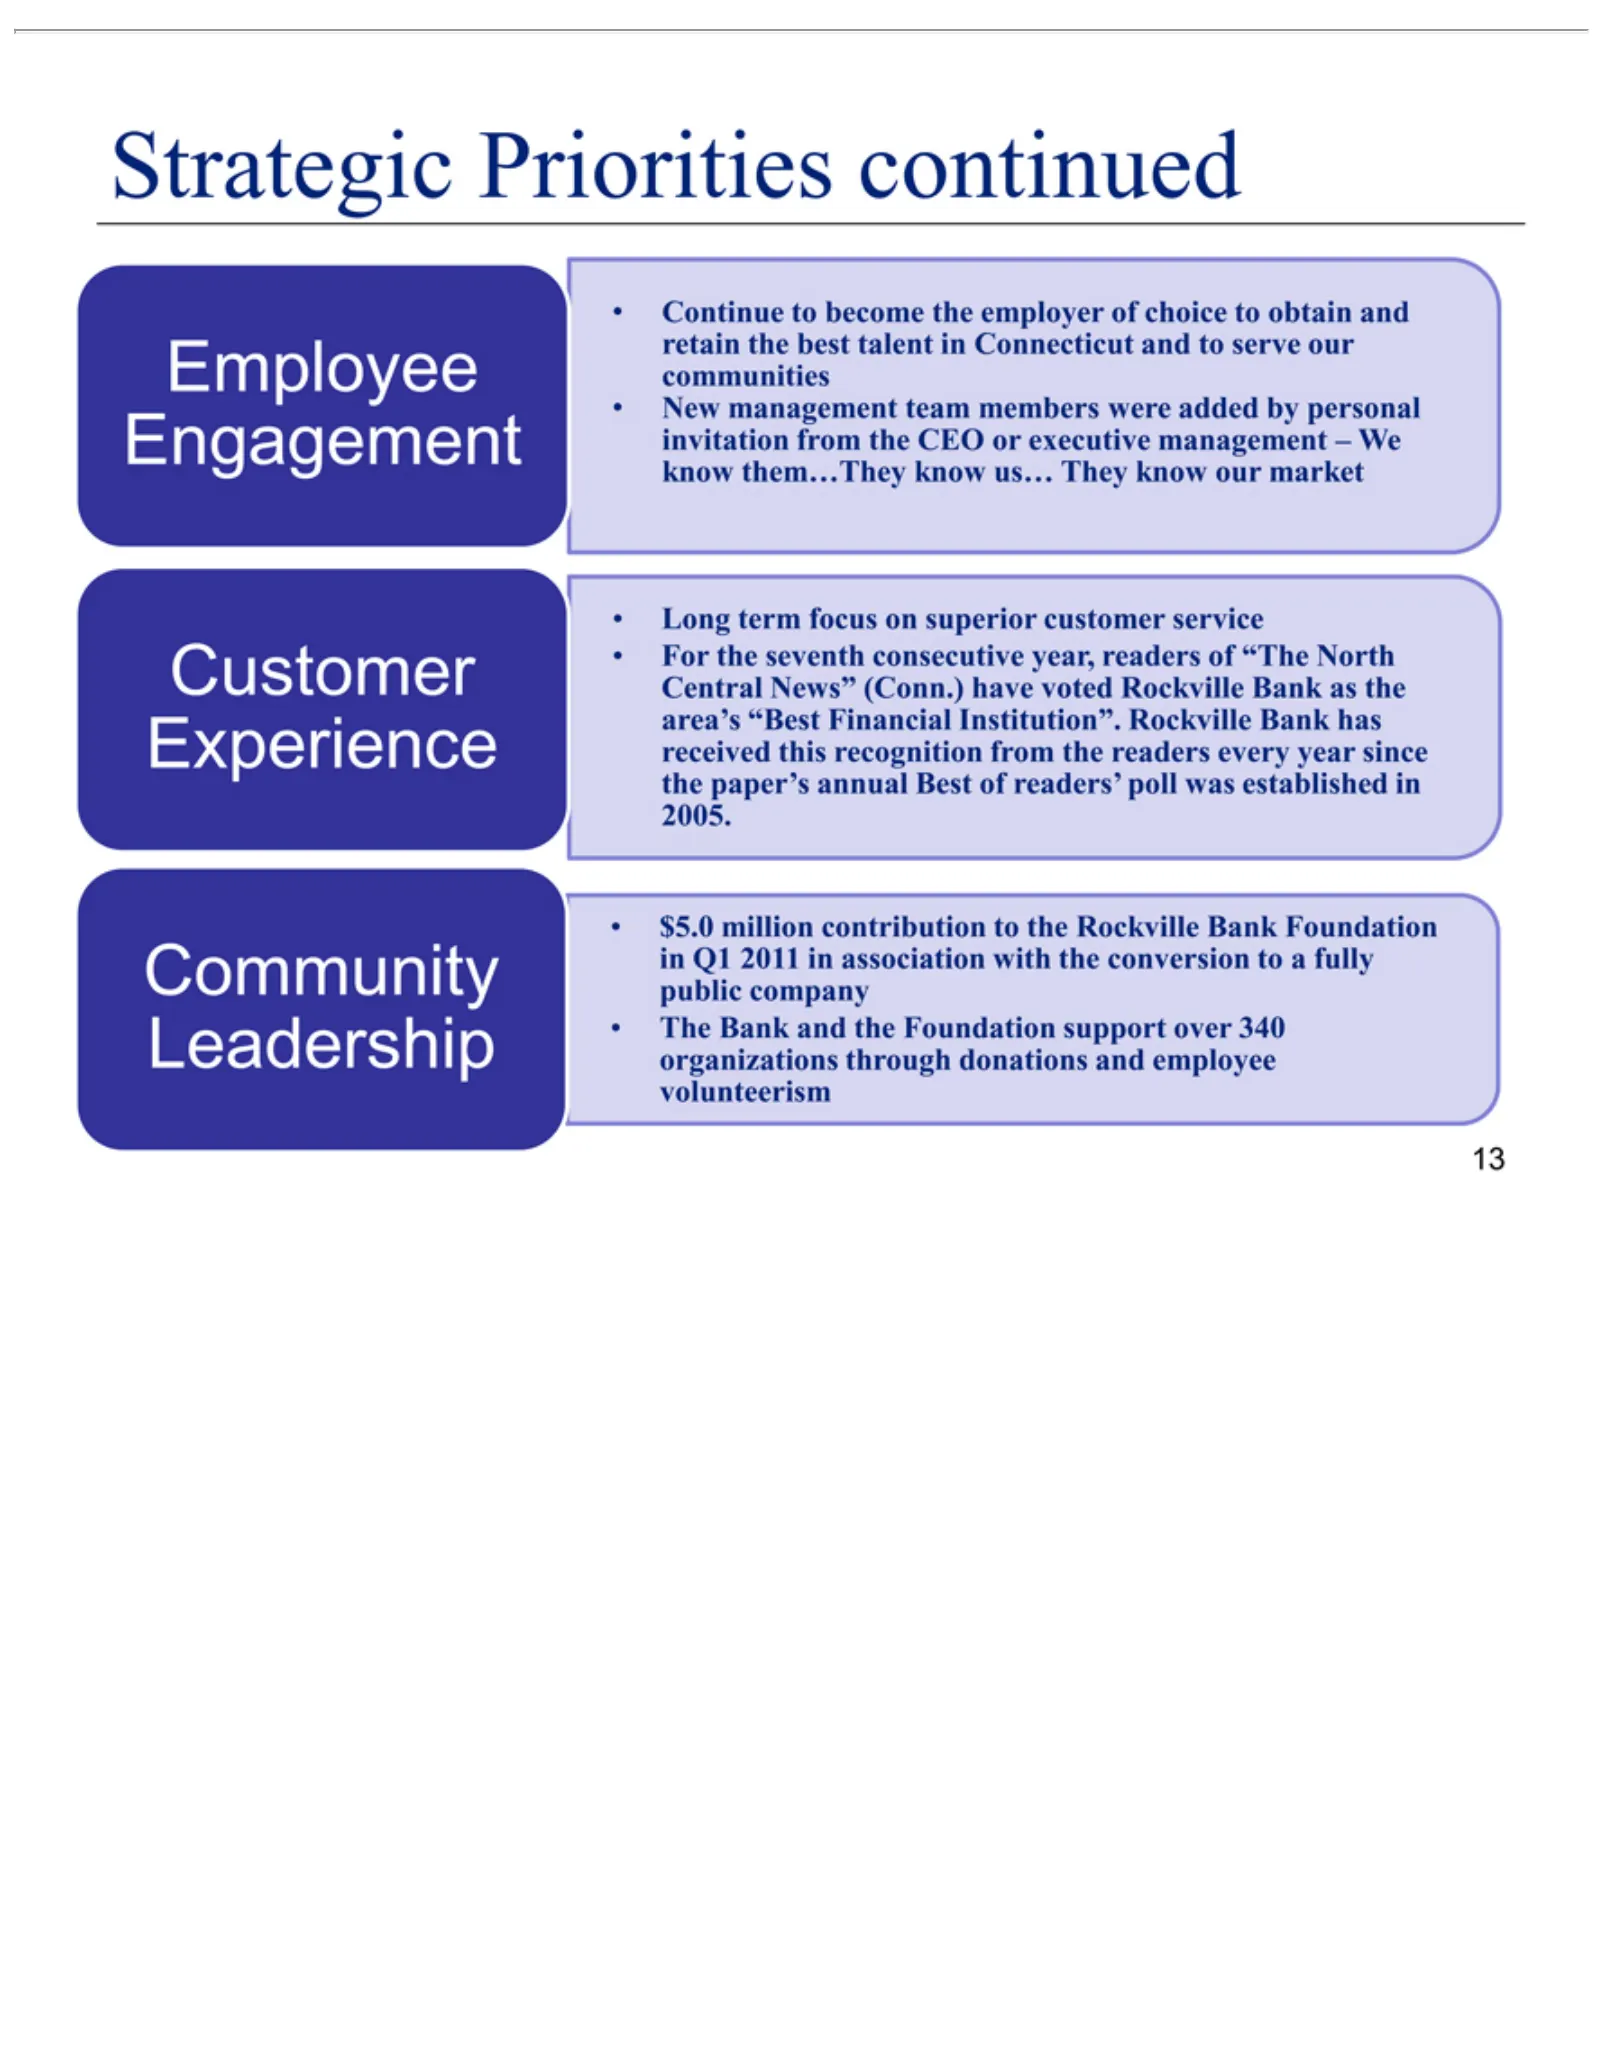
Slide 13: Strategic Priorities: Employee Engagement and Customer Experience
Strategic Employee Continue executive Customer Long For year Community 2005. $5.0 employee 13 the since million term seventh Priorities to management volunteerism Experience the Engagement focus become Leadership contribution paper’s consecutive oncontinued superior the annual –employer We to the ye
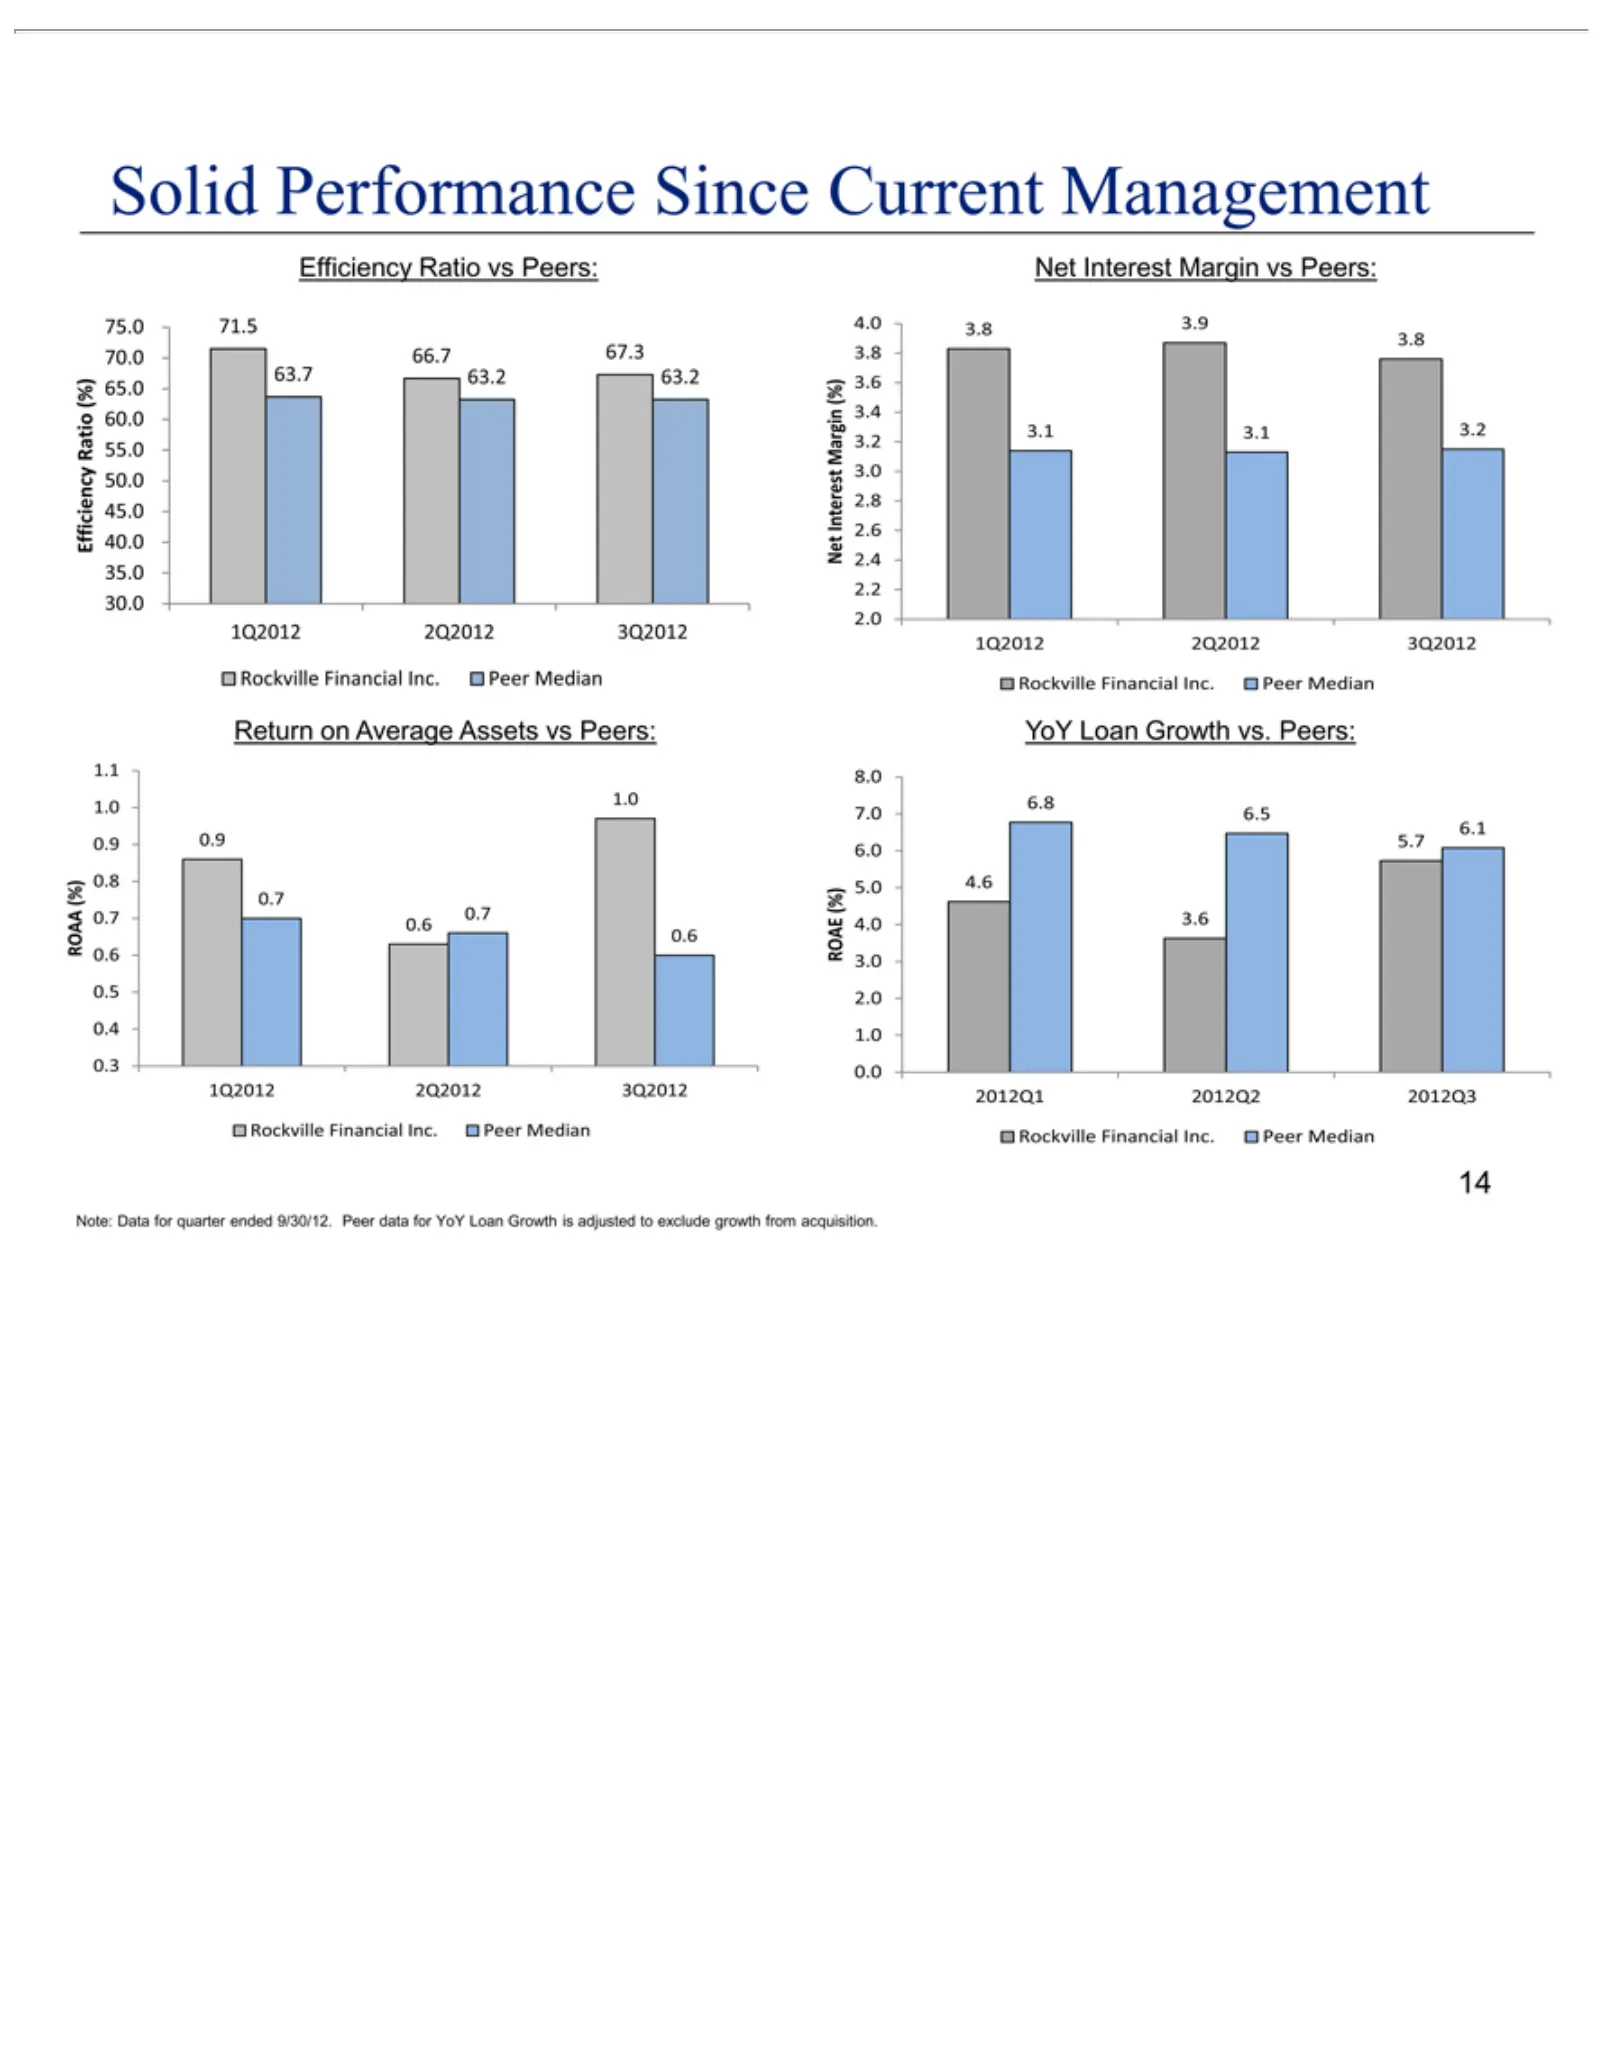
Slide 14: Solid Financial Performance
Solid Efficiency 75.0 67.3 63.2 66.7 63.7 71.5 Net 3.1 3.8 4.0 Return ROAA 1.1 0.7 0.9 1.0 1Q2012 0.6 YoY ROAE 8.0 6.5 6.8 2012Q1 3.6 4.6 5.7 Rockville Note: 14 3.9 3.1 3.8 1.0 0.7 7.0 6.1 Interest 70.0 Loan Performance Data on (%) 3.2 3.6 0.9 6.0 2Q2012 2012Q2 65.0 Financial Average Growth Ratio 3.
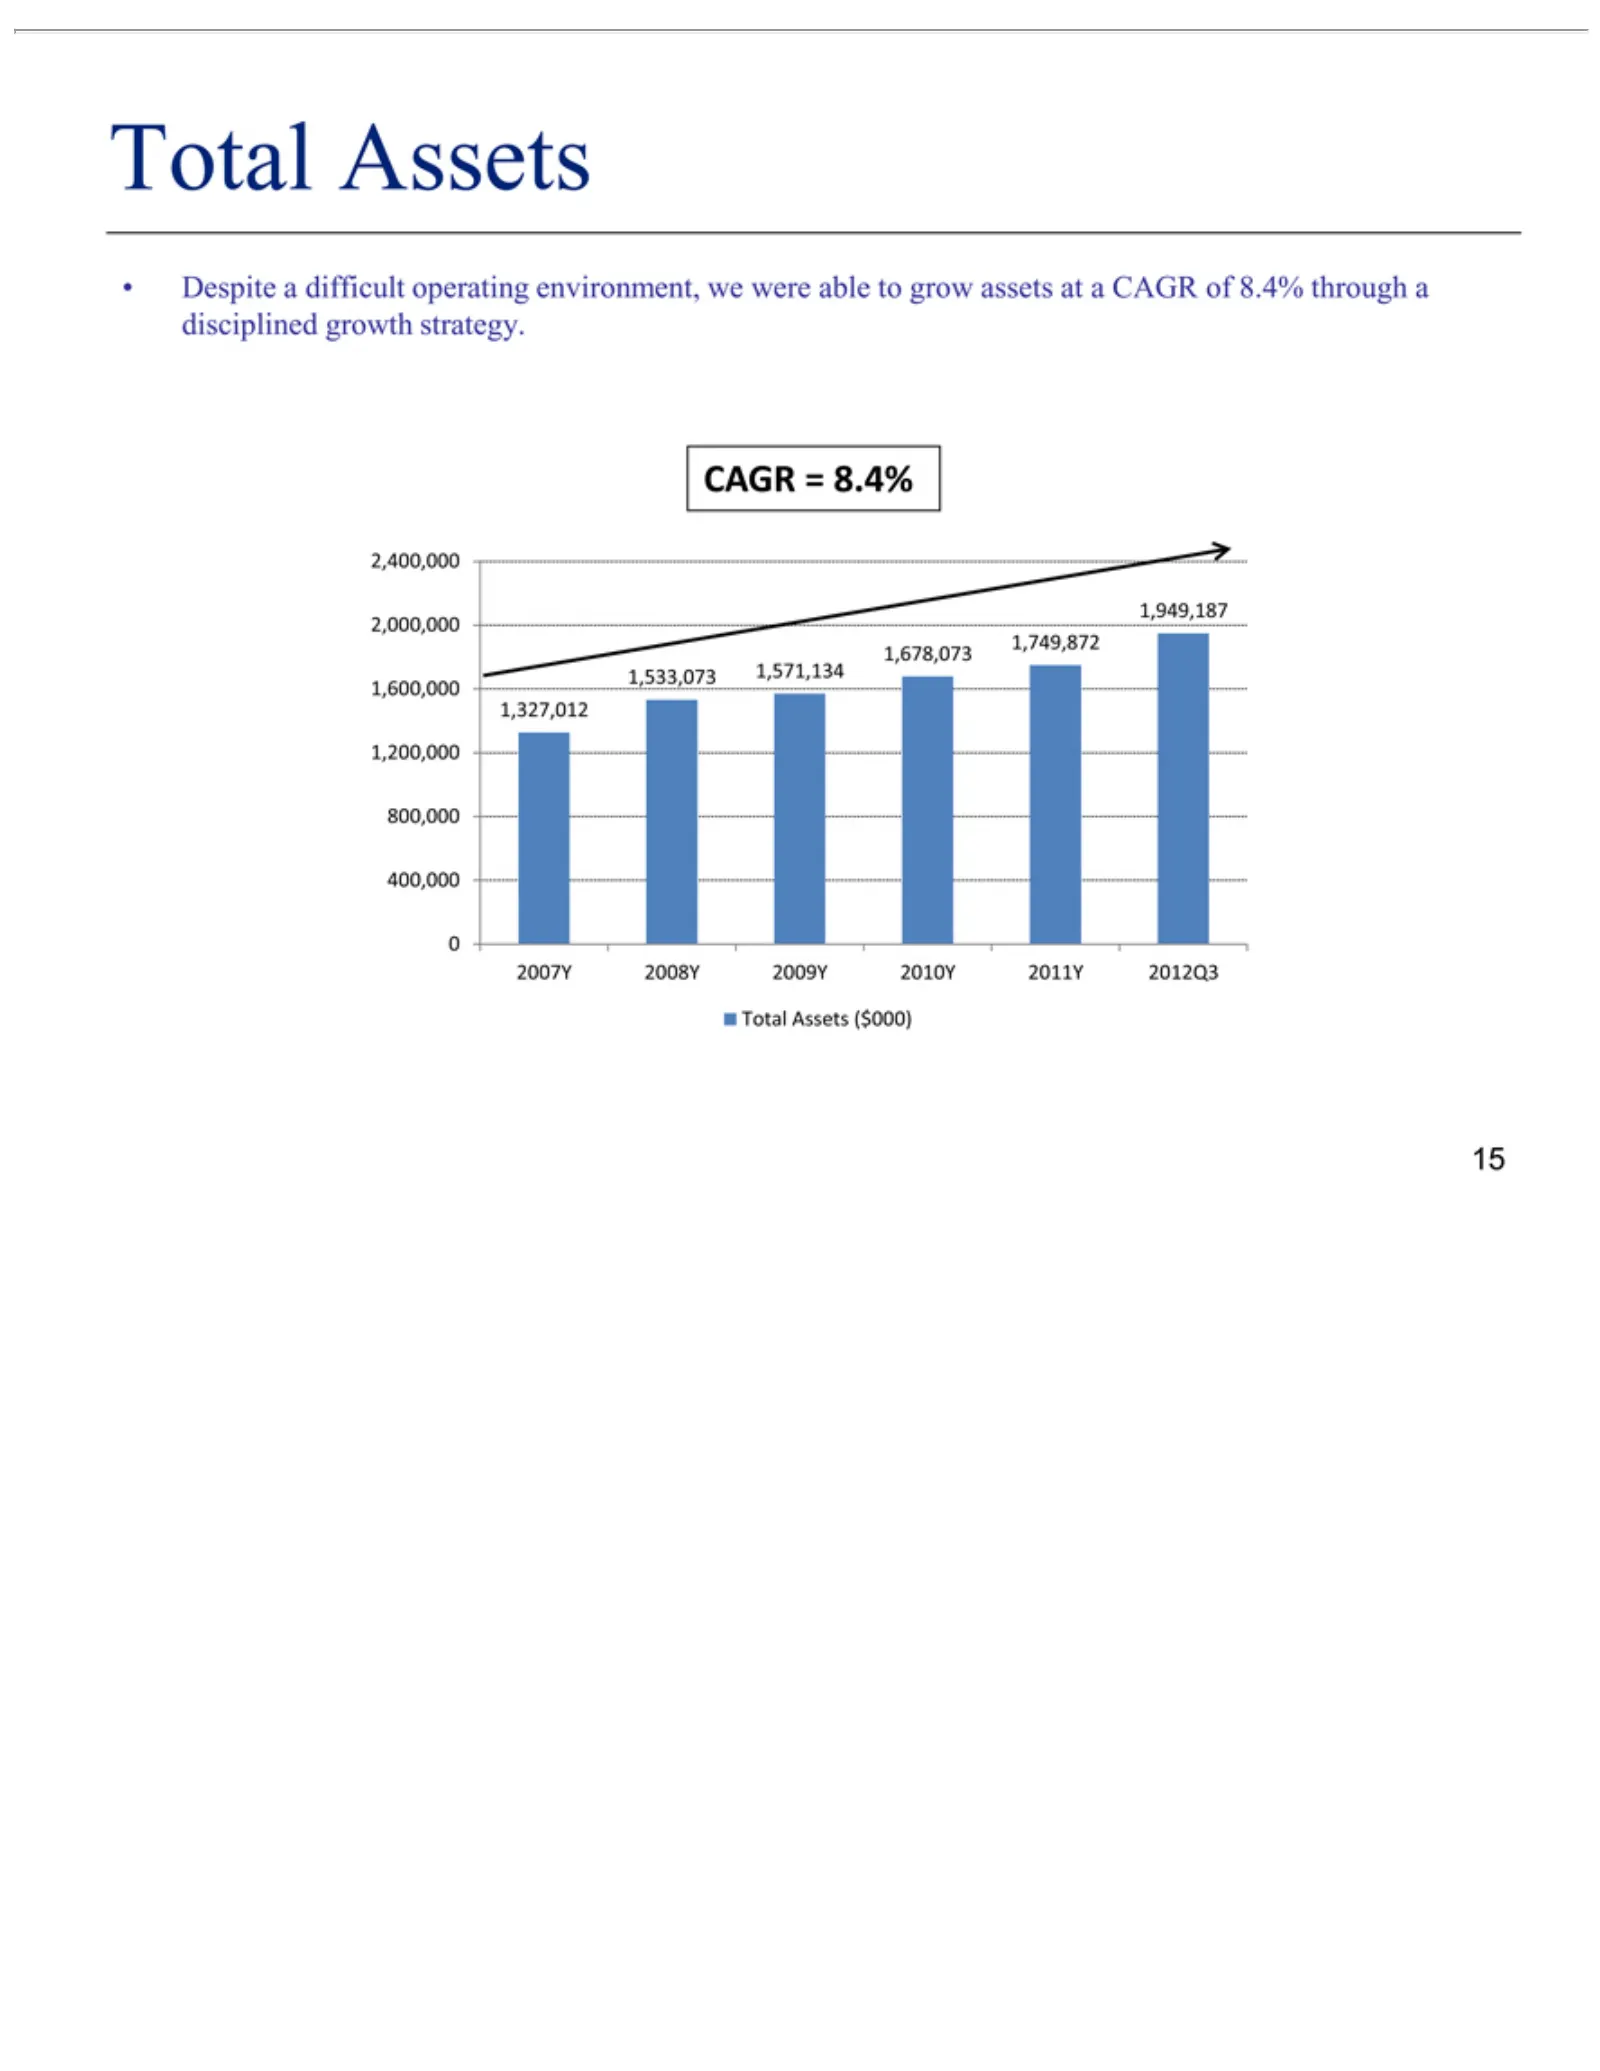
Slide 15: Total Assets Growth
Despite CAGR 2,400,000 1,949,187 2007Y Total 15 Assets 2008Y =a 8.4% difficult 2,000,000 1,749,872 ($000) 2009Yoperating 1,600,000 1,571,134 2010Yenvironment, 2011Y 1,200,000 1,678,073 2012Q3800,000 1,533,073 we were 400,000 able 1,327,012 to grow 0 assets at a CAGR of 8.4% through a disciplined gro
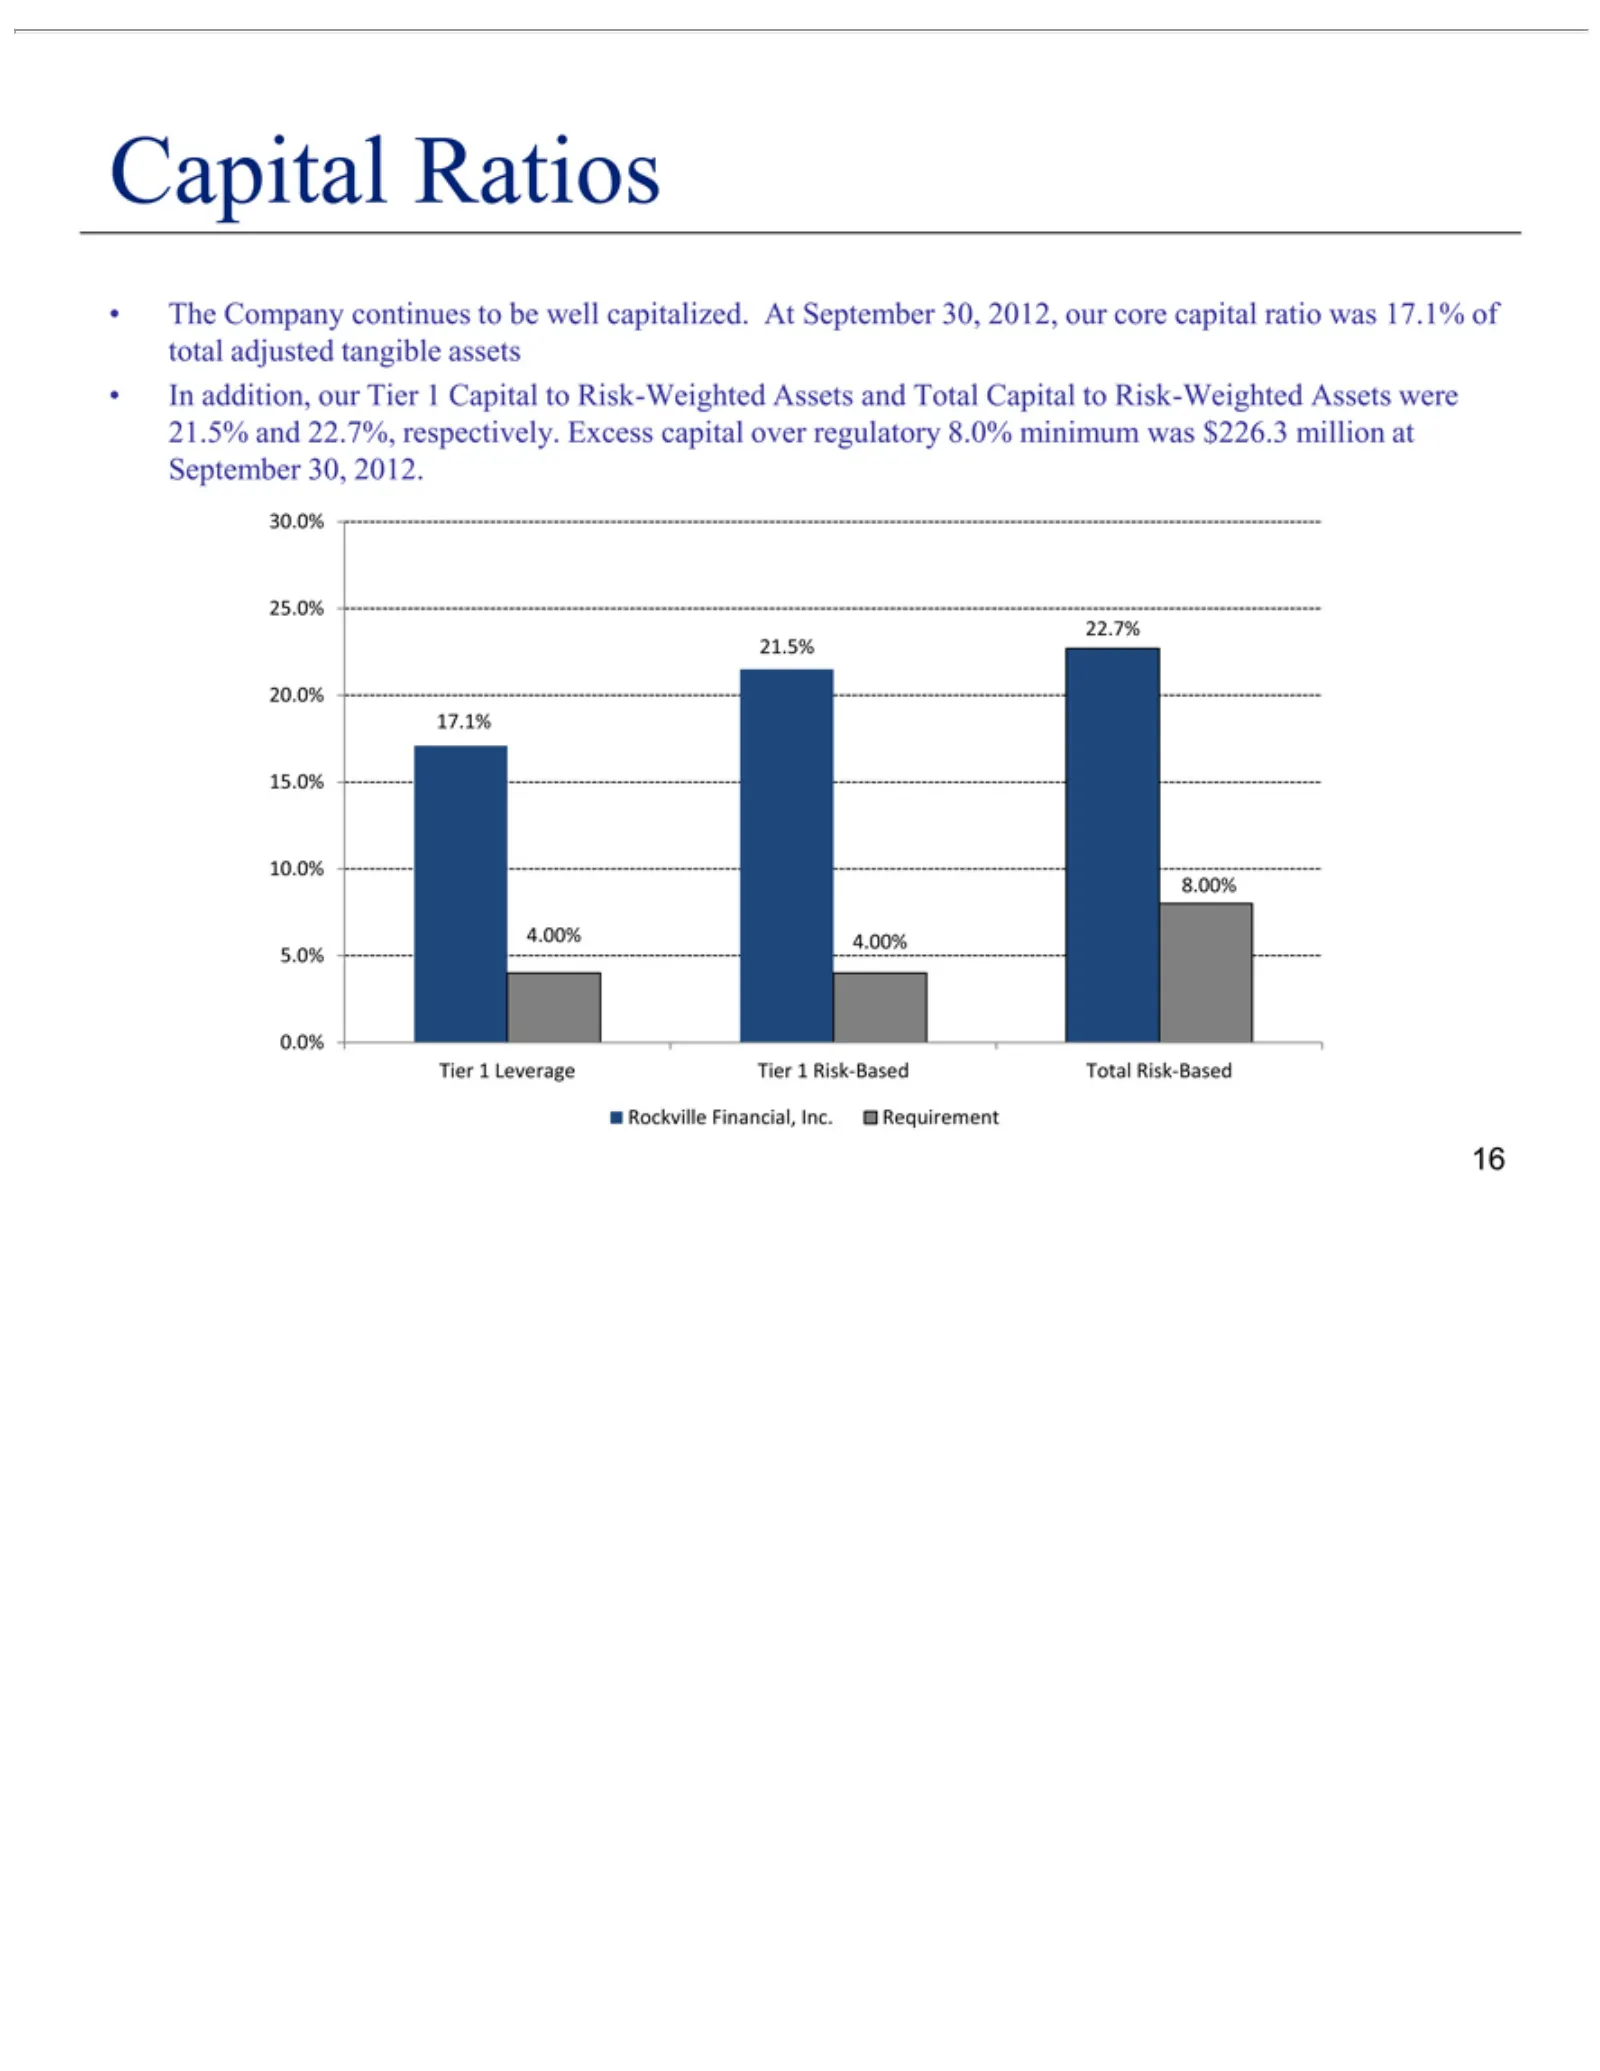
Slide 16: Capital Ratios
Capital The Risk-Weighted 30.0% 22.7% 4.00% 8.00% 17.1% Tier Rockville 16 Company 1 Leverage 25.0% 21.5% 4.00% Ratios Financial, 20.0% continues Assets Tier Inc. 115.0% were Risk-Based to Requirement be 21.5% 10.0% well Total and 5.0% capitalized. 22.7%, Risk-Based 0.0% respectively. At SeptemberExc
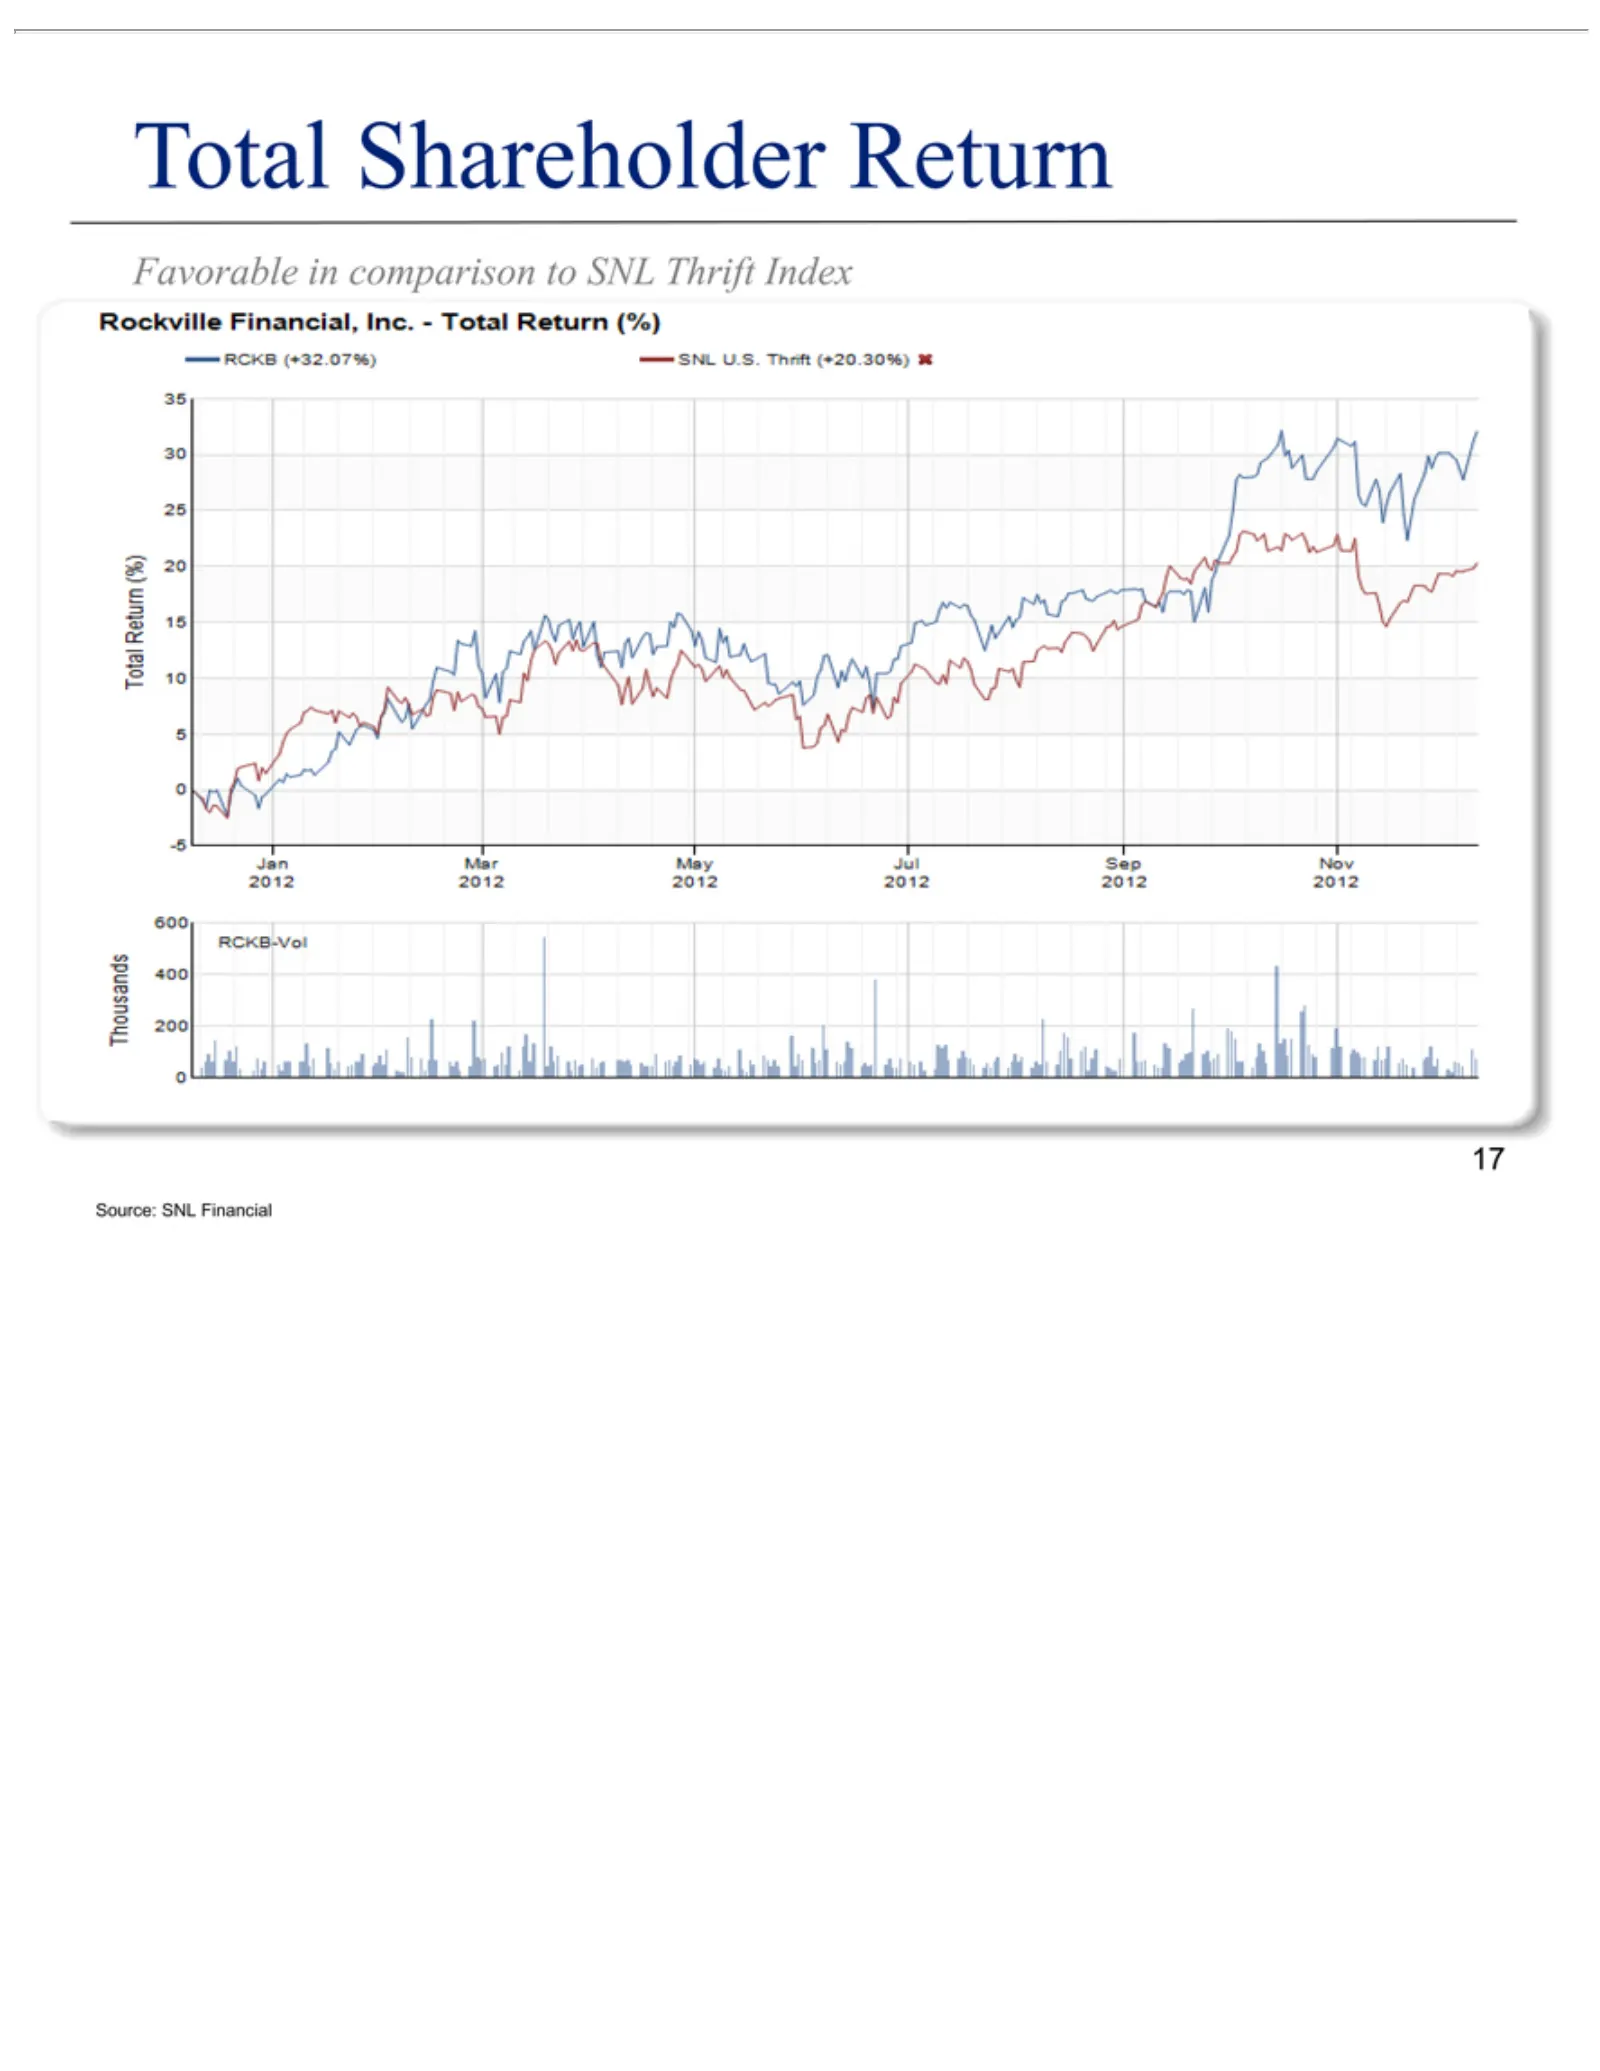
Slide 17: Favorable Total Return Performance
Favorable Rockville RCKB Total -5 0Jan Thousands Source: RCKB-Vol 17200 02012 5return Shareholder 400 10 (+32.07%) SNL 15 mar Financial, in 600 (%) 20 comparison Financial 2012 25 Return SNL 30 may Inc. 35U.S. 2012 –toTotal SNL thrift julReturn Thrift 2012 (+20.30%) sep Index (%)2012 nov 2012
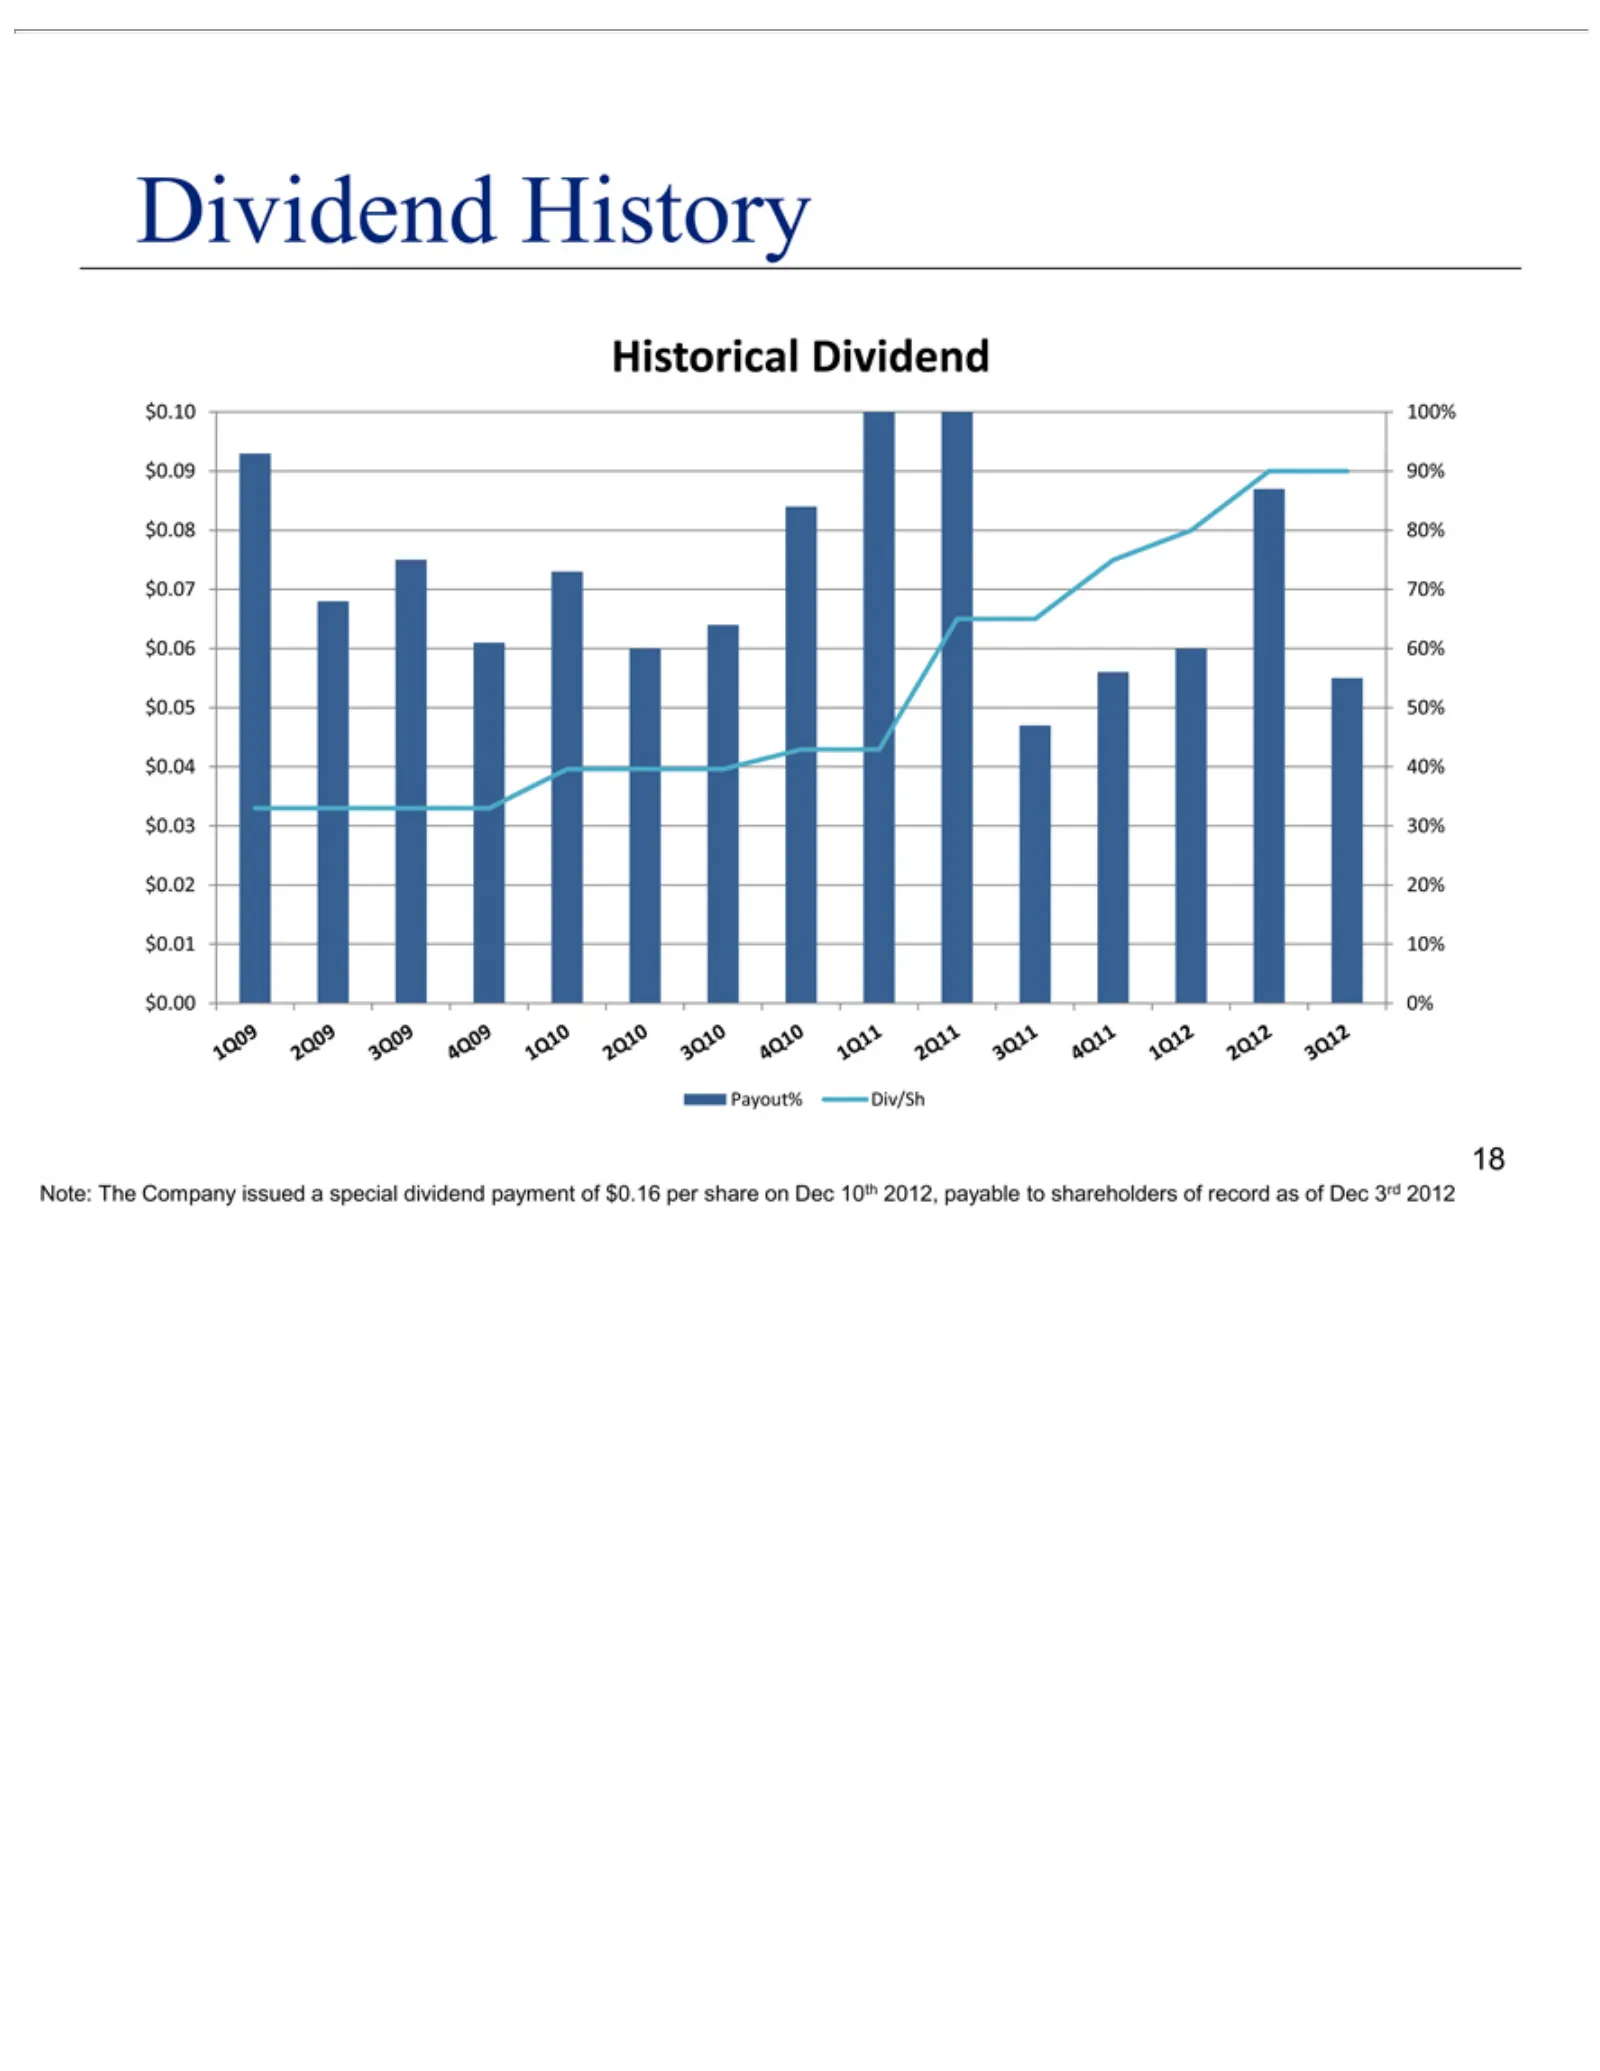
Slide 18: Dividend History
Dividend Historical $0.10 1Q09 1Q11 1Q12 100% Payout% Note: 18 2Q11 The 2Q09 2Q12 $0.09 90% Div/Sh History Dividend Company 80% 3Q11 3Q09 3Q12 $0.0870% 4Q11 4Q09 $0.07 issued 60%1Q10 $0.06 50% a special 2Q10 $0.05 40%3Q10 dividend $0.04 30% 20% 4Q10 $0.03 payment 10% $0.02 0%of $0.01 $0.16 $0.00 per
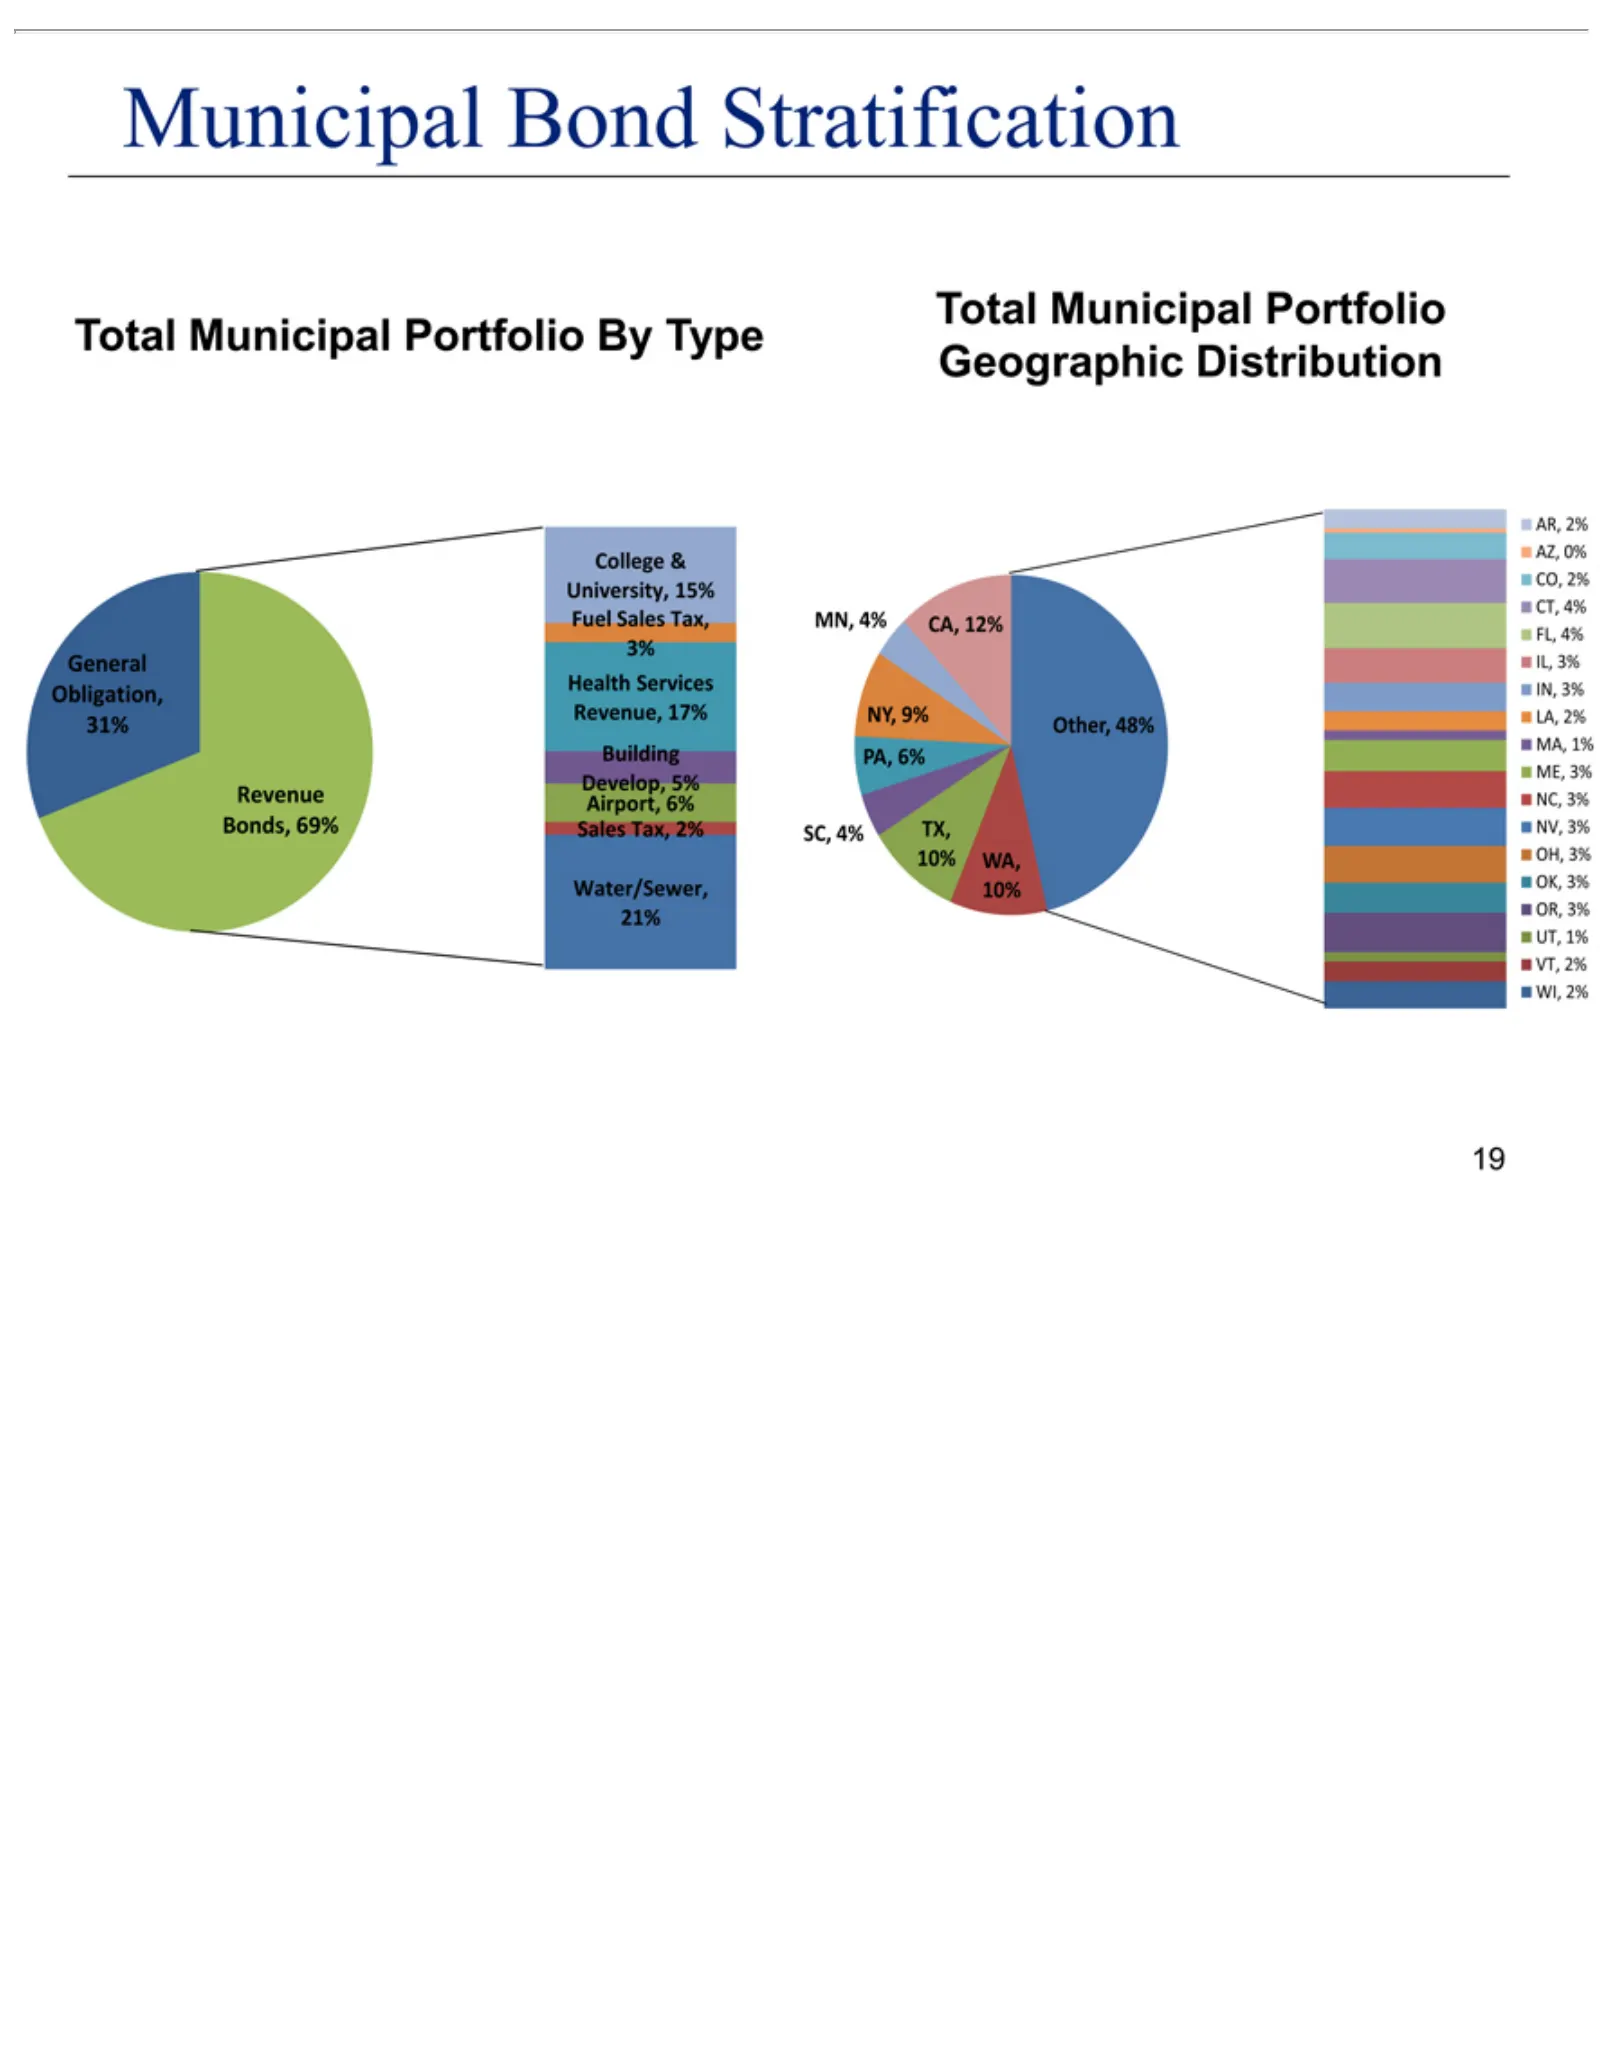
Slide 19: Municipal Bond Portfolio Stratification
Municipal Total College Building Water/Sewer, Obligation, General Bonds, Revenue MN, NY, Other, SC, AR, AZ, CT, FL, 19 4% 9% 0% 2%4% Municipal 48% 69% IL, TX, & CO, CA, Develop, Bond University, 3% 31% PA, 10% 2% 12% 21% IN, 6% Portfolio Stratification WA, 5% 3%15% Airport, 10% LA,ByFuel Geographic
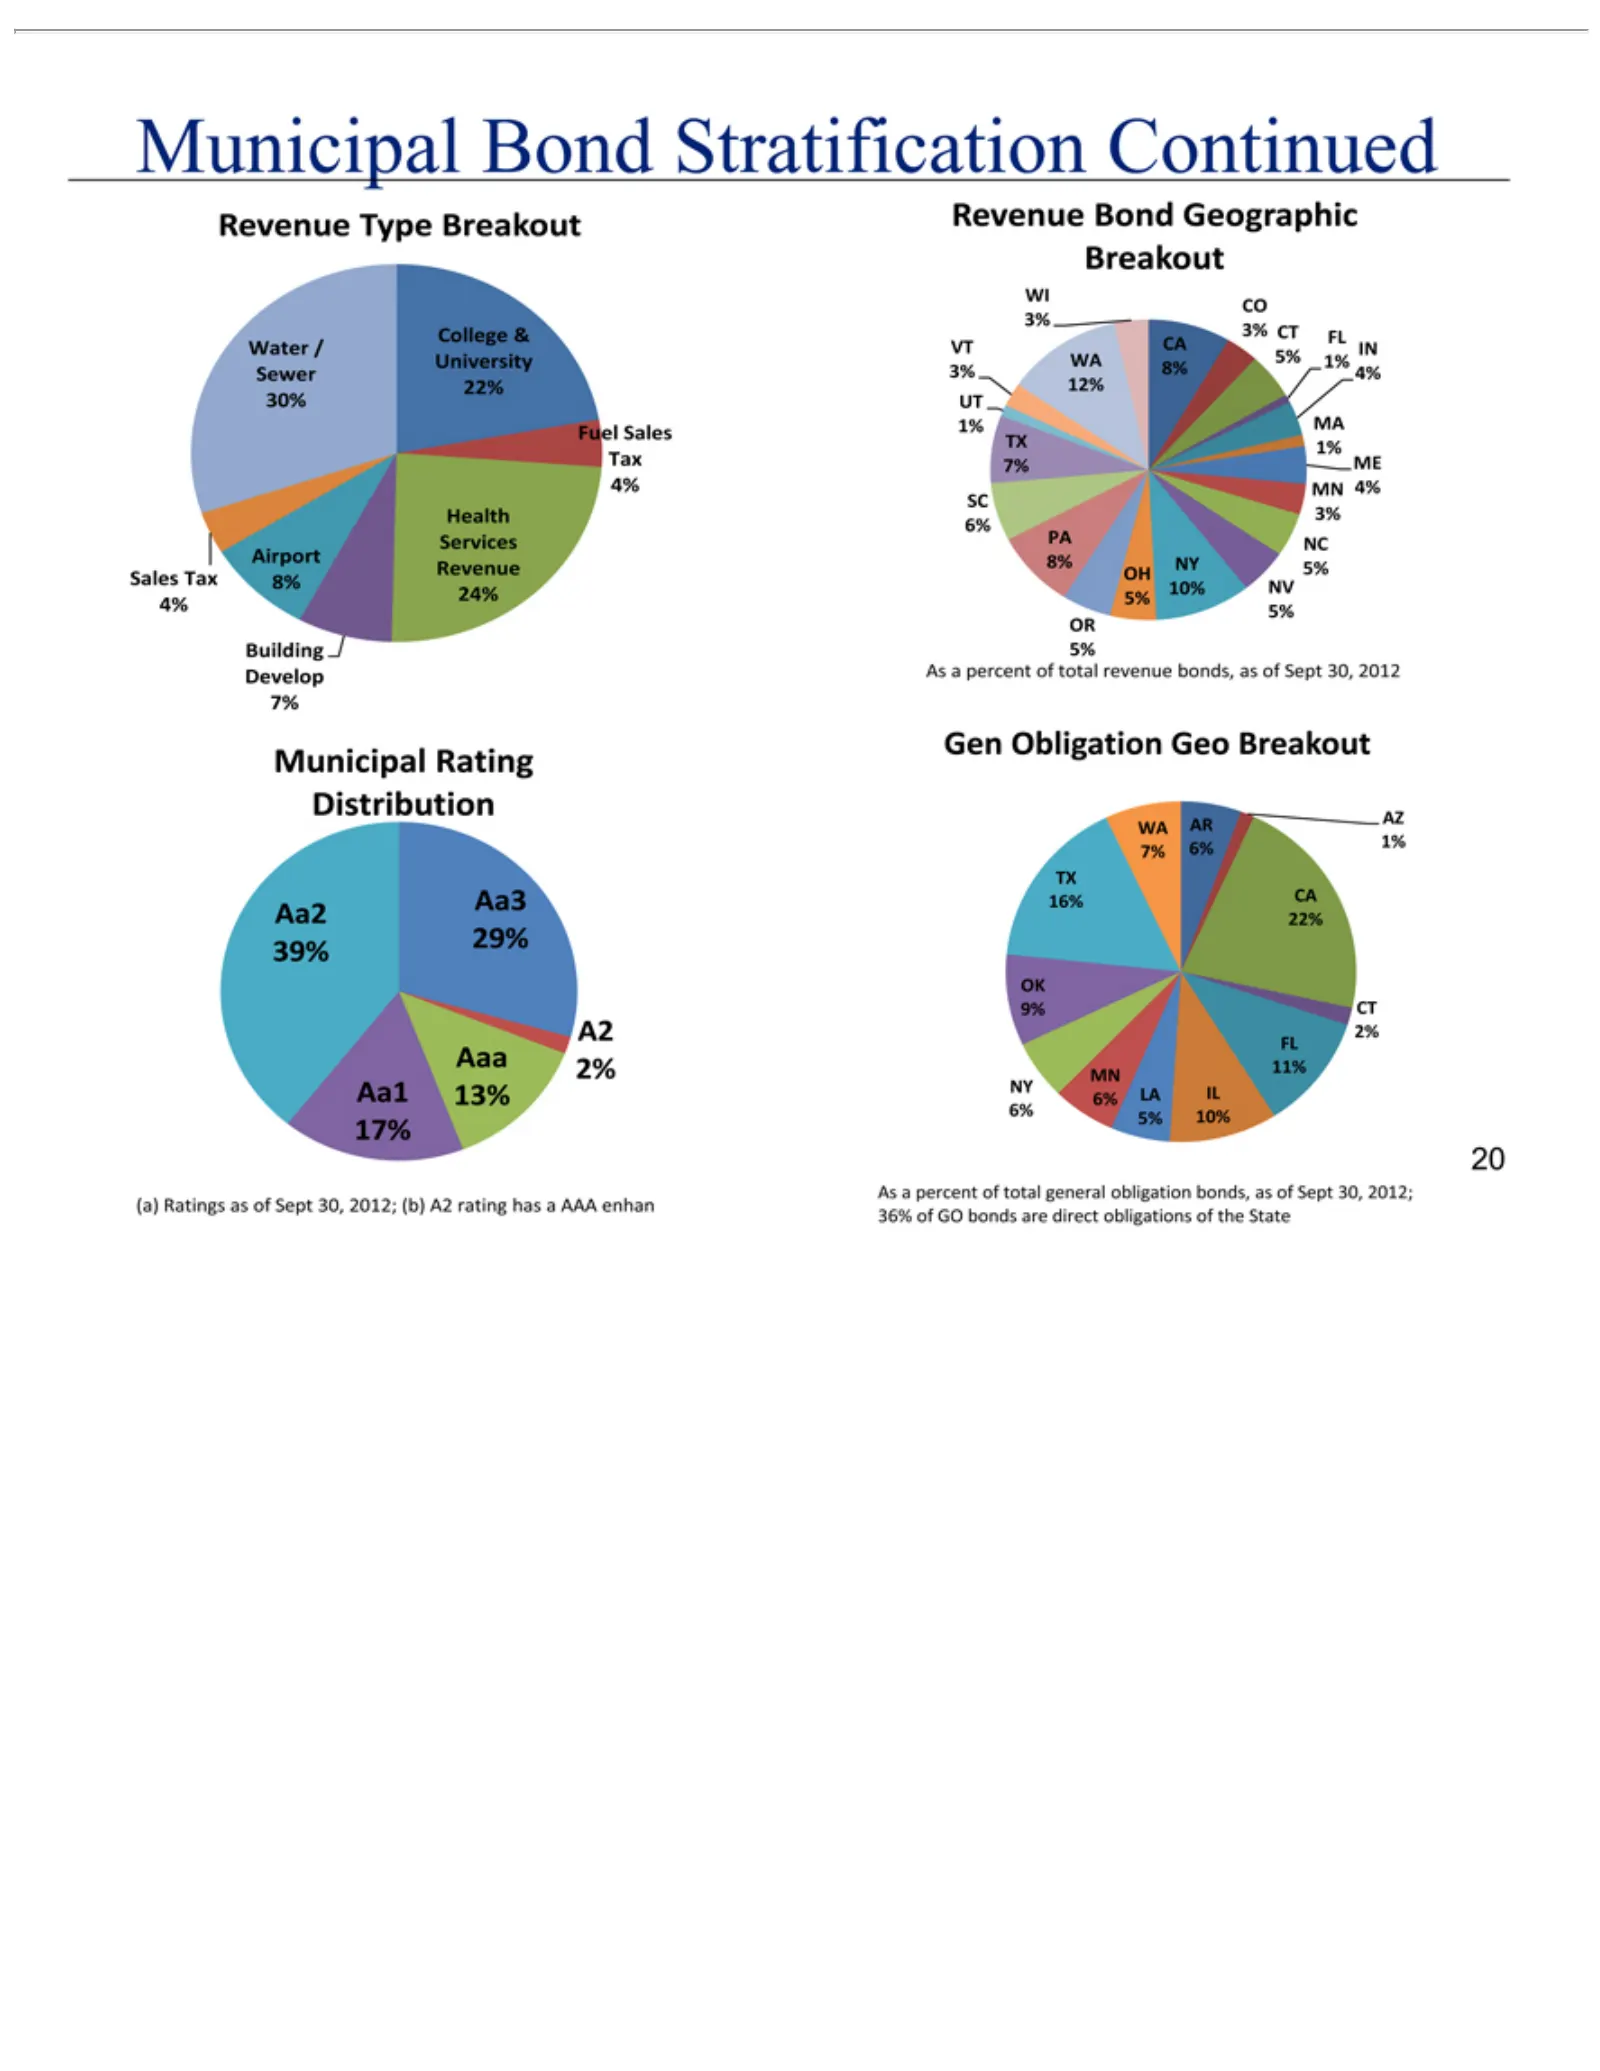
Slide 20: Municipal Bond Portfolio Breakout
College Fuel Building Revenue WI VT 1% TX MN 3% 8% 10% 5% Municipal Aa3 A2 (a) 20 Gen AR 7% 16% 9% OK 11% NY 6% As aAaa CA CO 8% MA 1% ME NY Aa2 4% Sales NV2% 6% CT LA 10% AZ IL FL IN 4% PA 5% 2% & SC Ratings Type Bond Develop 29% Bond Rating Water Tax WA NC 12% Aa1 OH 5% Obligation MN percent CA TX
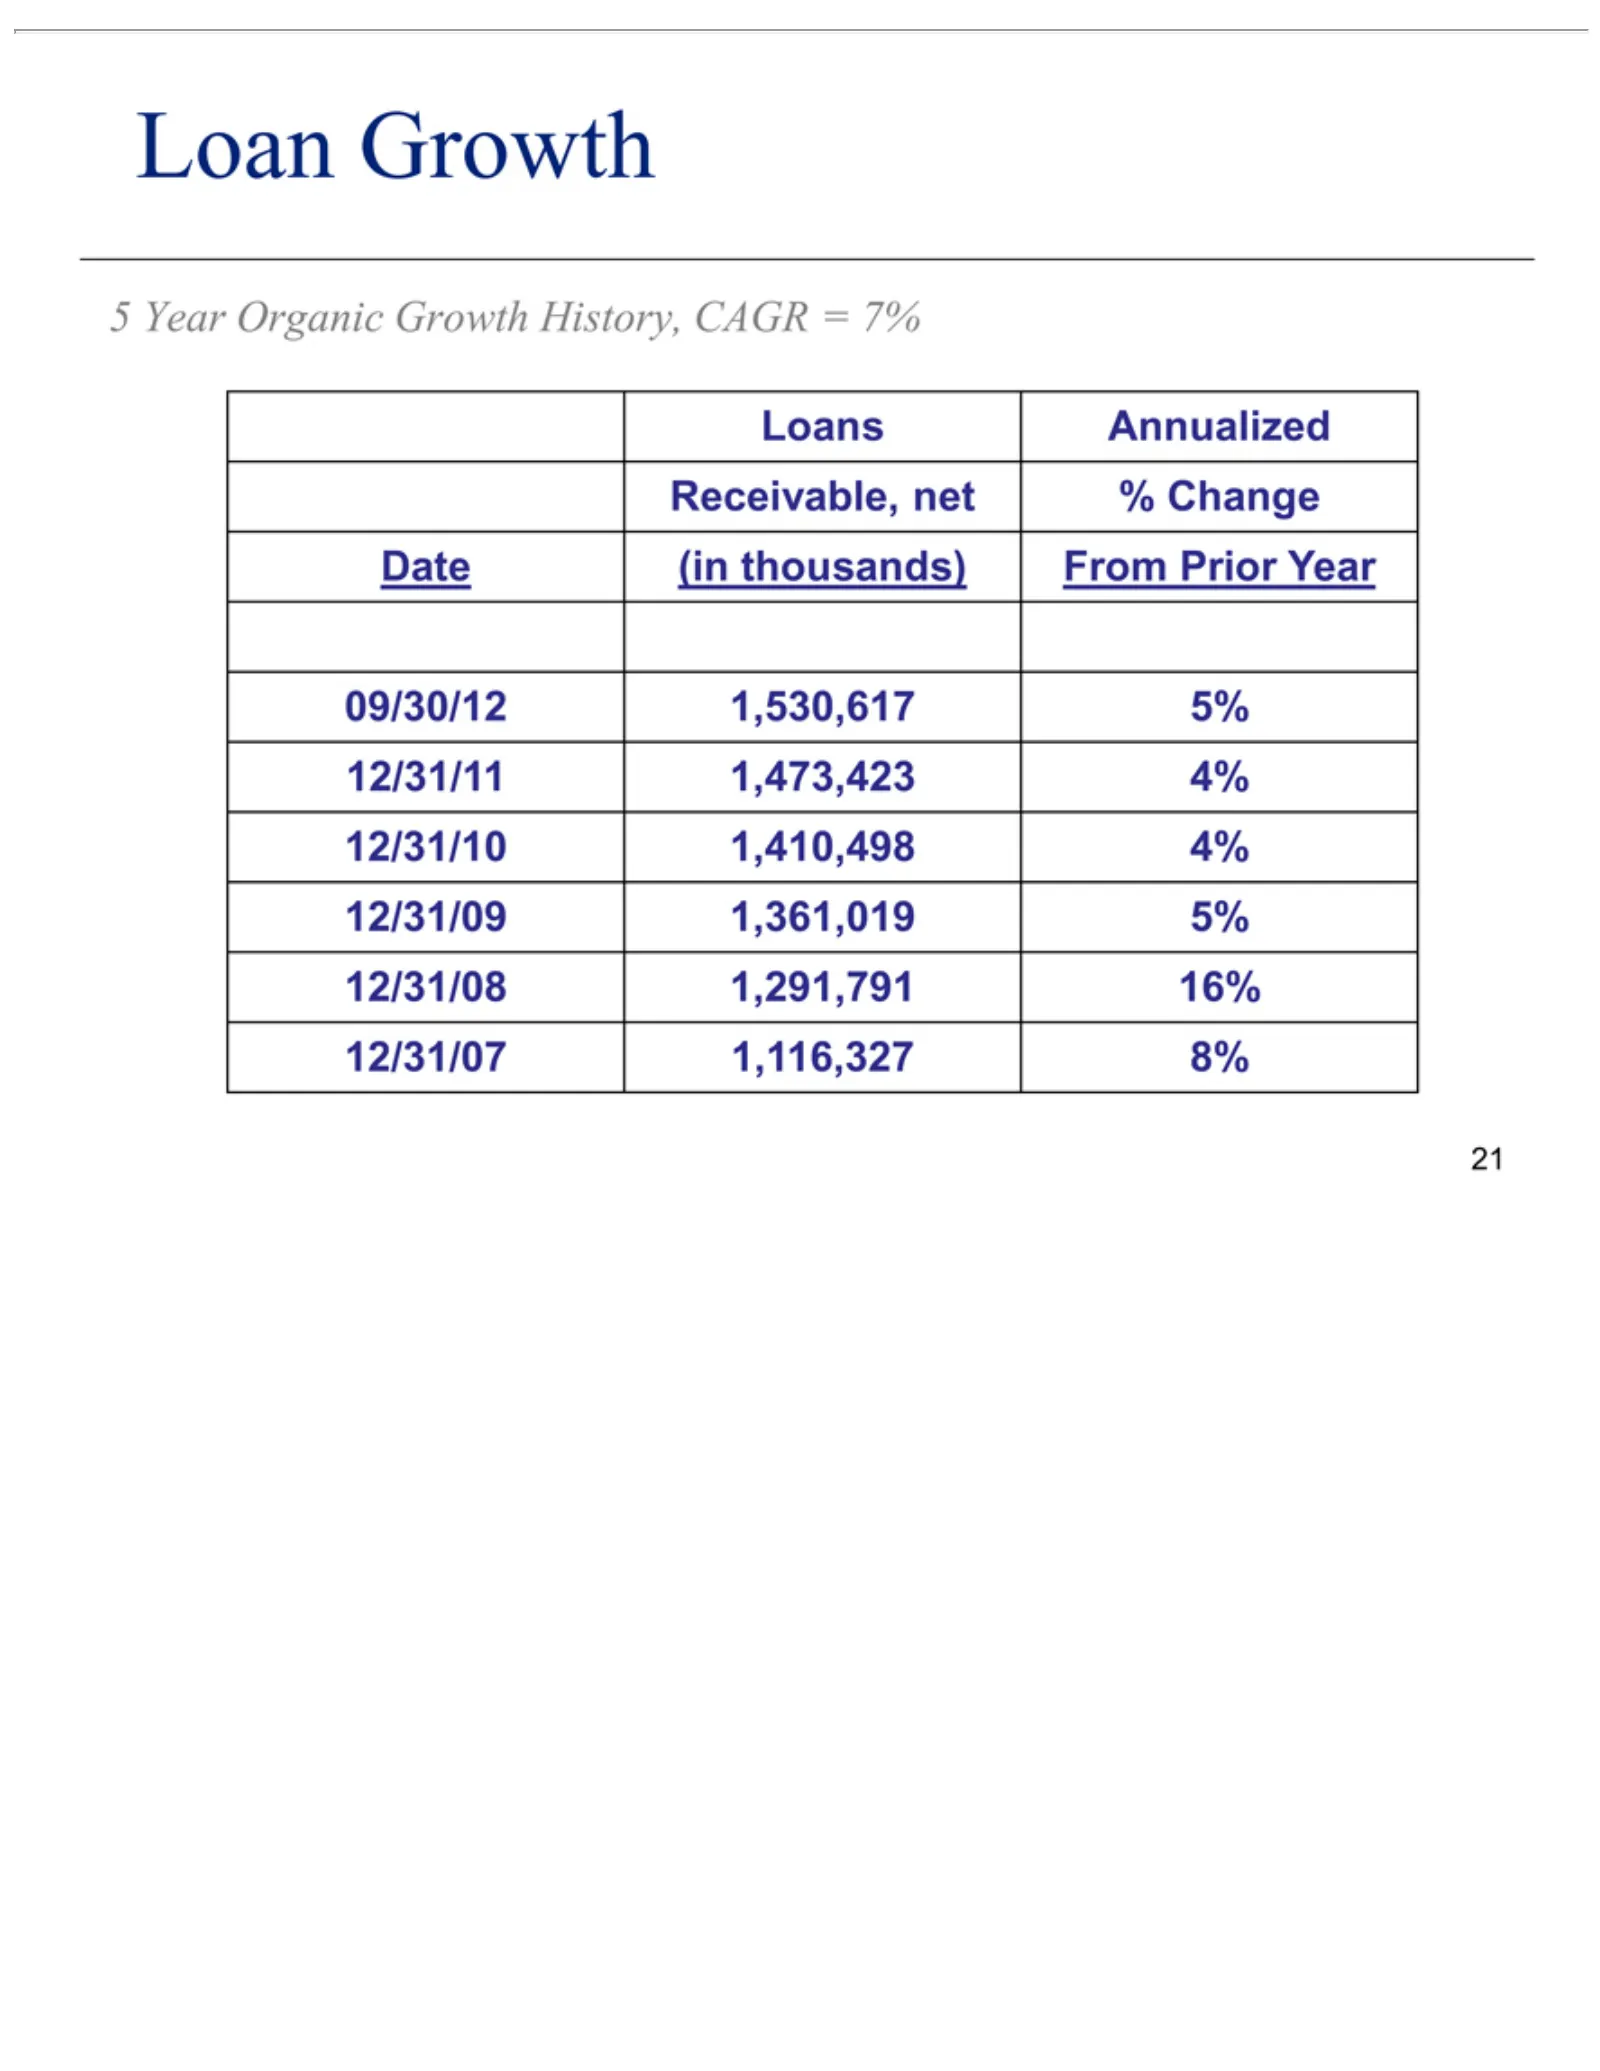
Slide 21: 5 Year Loan Growth
5Loan 21 Growth Loans(in Year Receivable, Date 09/30/12 12/31/11 12/31/10 12/31/09 12/31/08 12/31/07 Organic Annualized thousands) 1,473,423 1,530,617 1,410,498 1,361,019 1,291,791 1,116,327 net Growth % Change 4% 8% 5% 16% From PriorHistory, Year CAGR = 7%
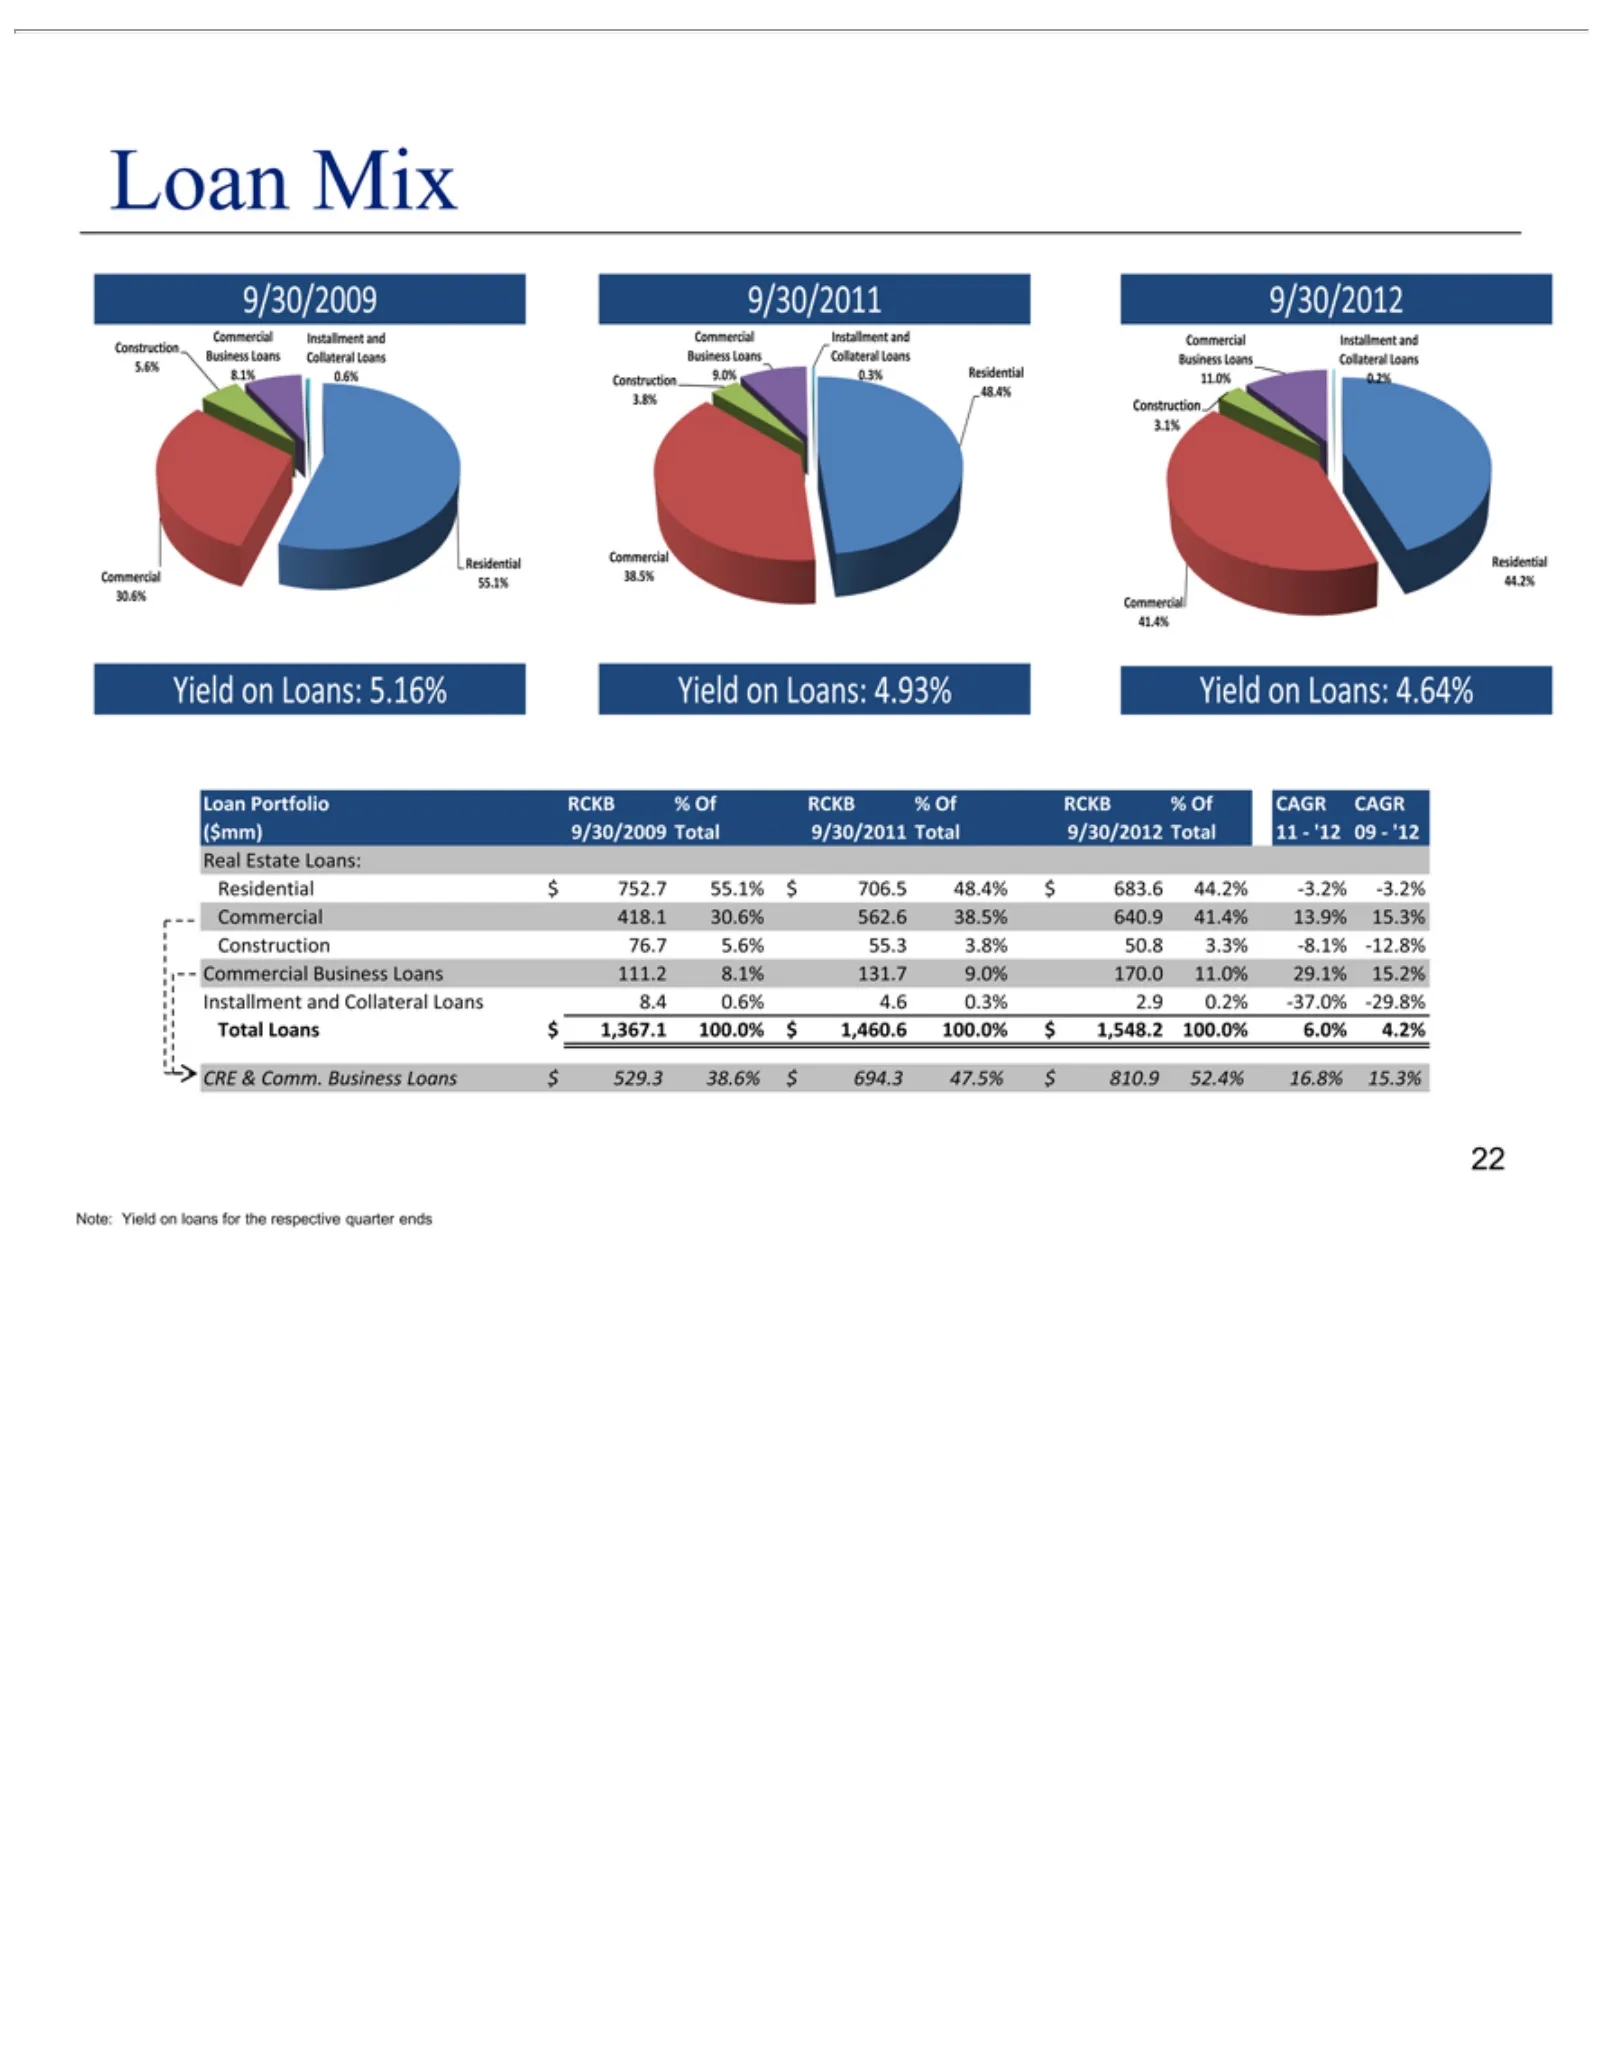
Slide 22: Loan Portfolio Mix and Yield
5.6% 8.1% 9/30/2011 9.0% 3.8% Commercial 9/30/2012 3.1% Construction Yield Loan Real Residential CRE RCKB 9/30/2009 $752.7 418.1 76.7 111.2 8.4 $1,367.1 $529.3 Note: 22 0.6% 5.6% Estate & Mix Portfolio Business 0.6% 0.3% on 81% Yield 30.6% % 55.1% 38.6% Comm. Loans: 100.0% 4.6 Of Total 55.3 131.7 Re
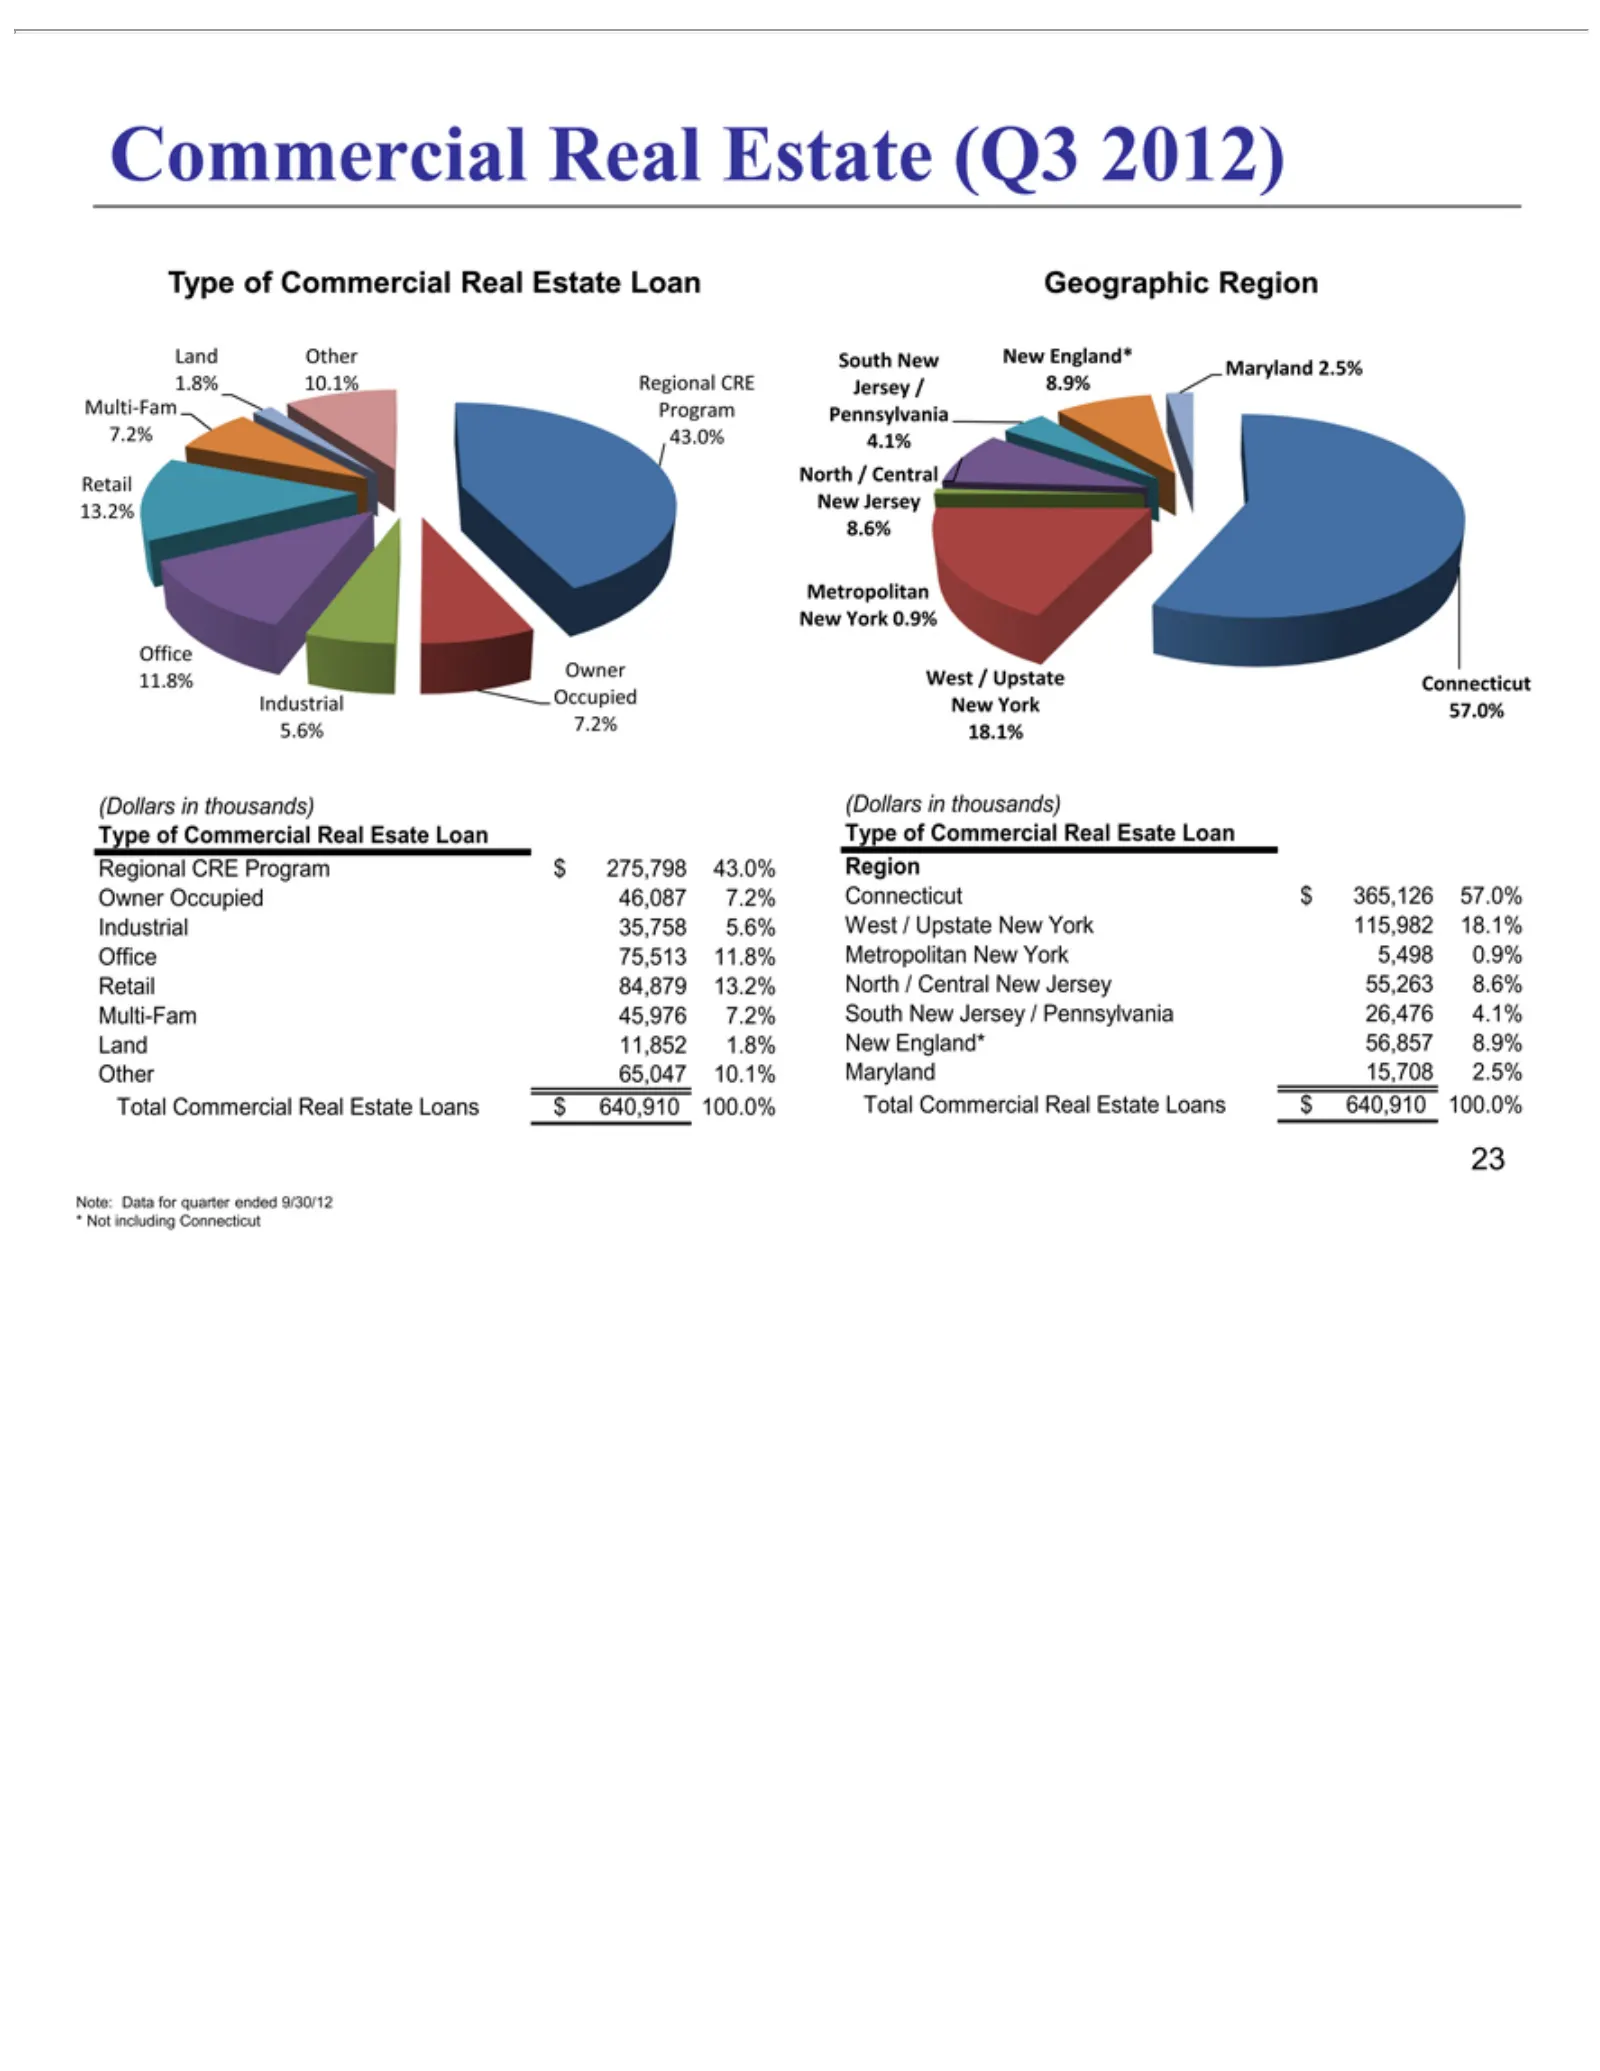
Slide 23: Commercial Real Estate Geographic and Type Distribution
Commercial 1.8% 7.2% 5.6% Geographic 4.1% 8.6% Regional Owner Industrial Office Retail Multi-Fam Land Other (Dollars Type Connecticut Region West Metropolitan North South New Maryland Total *Note: 23 England* /of Commercial Other 11,852 10.1% 43.0% 7.2% North Data 65,047 /New 13.2% 84,879 Upstate Ow
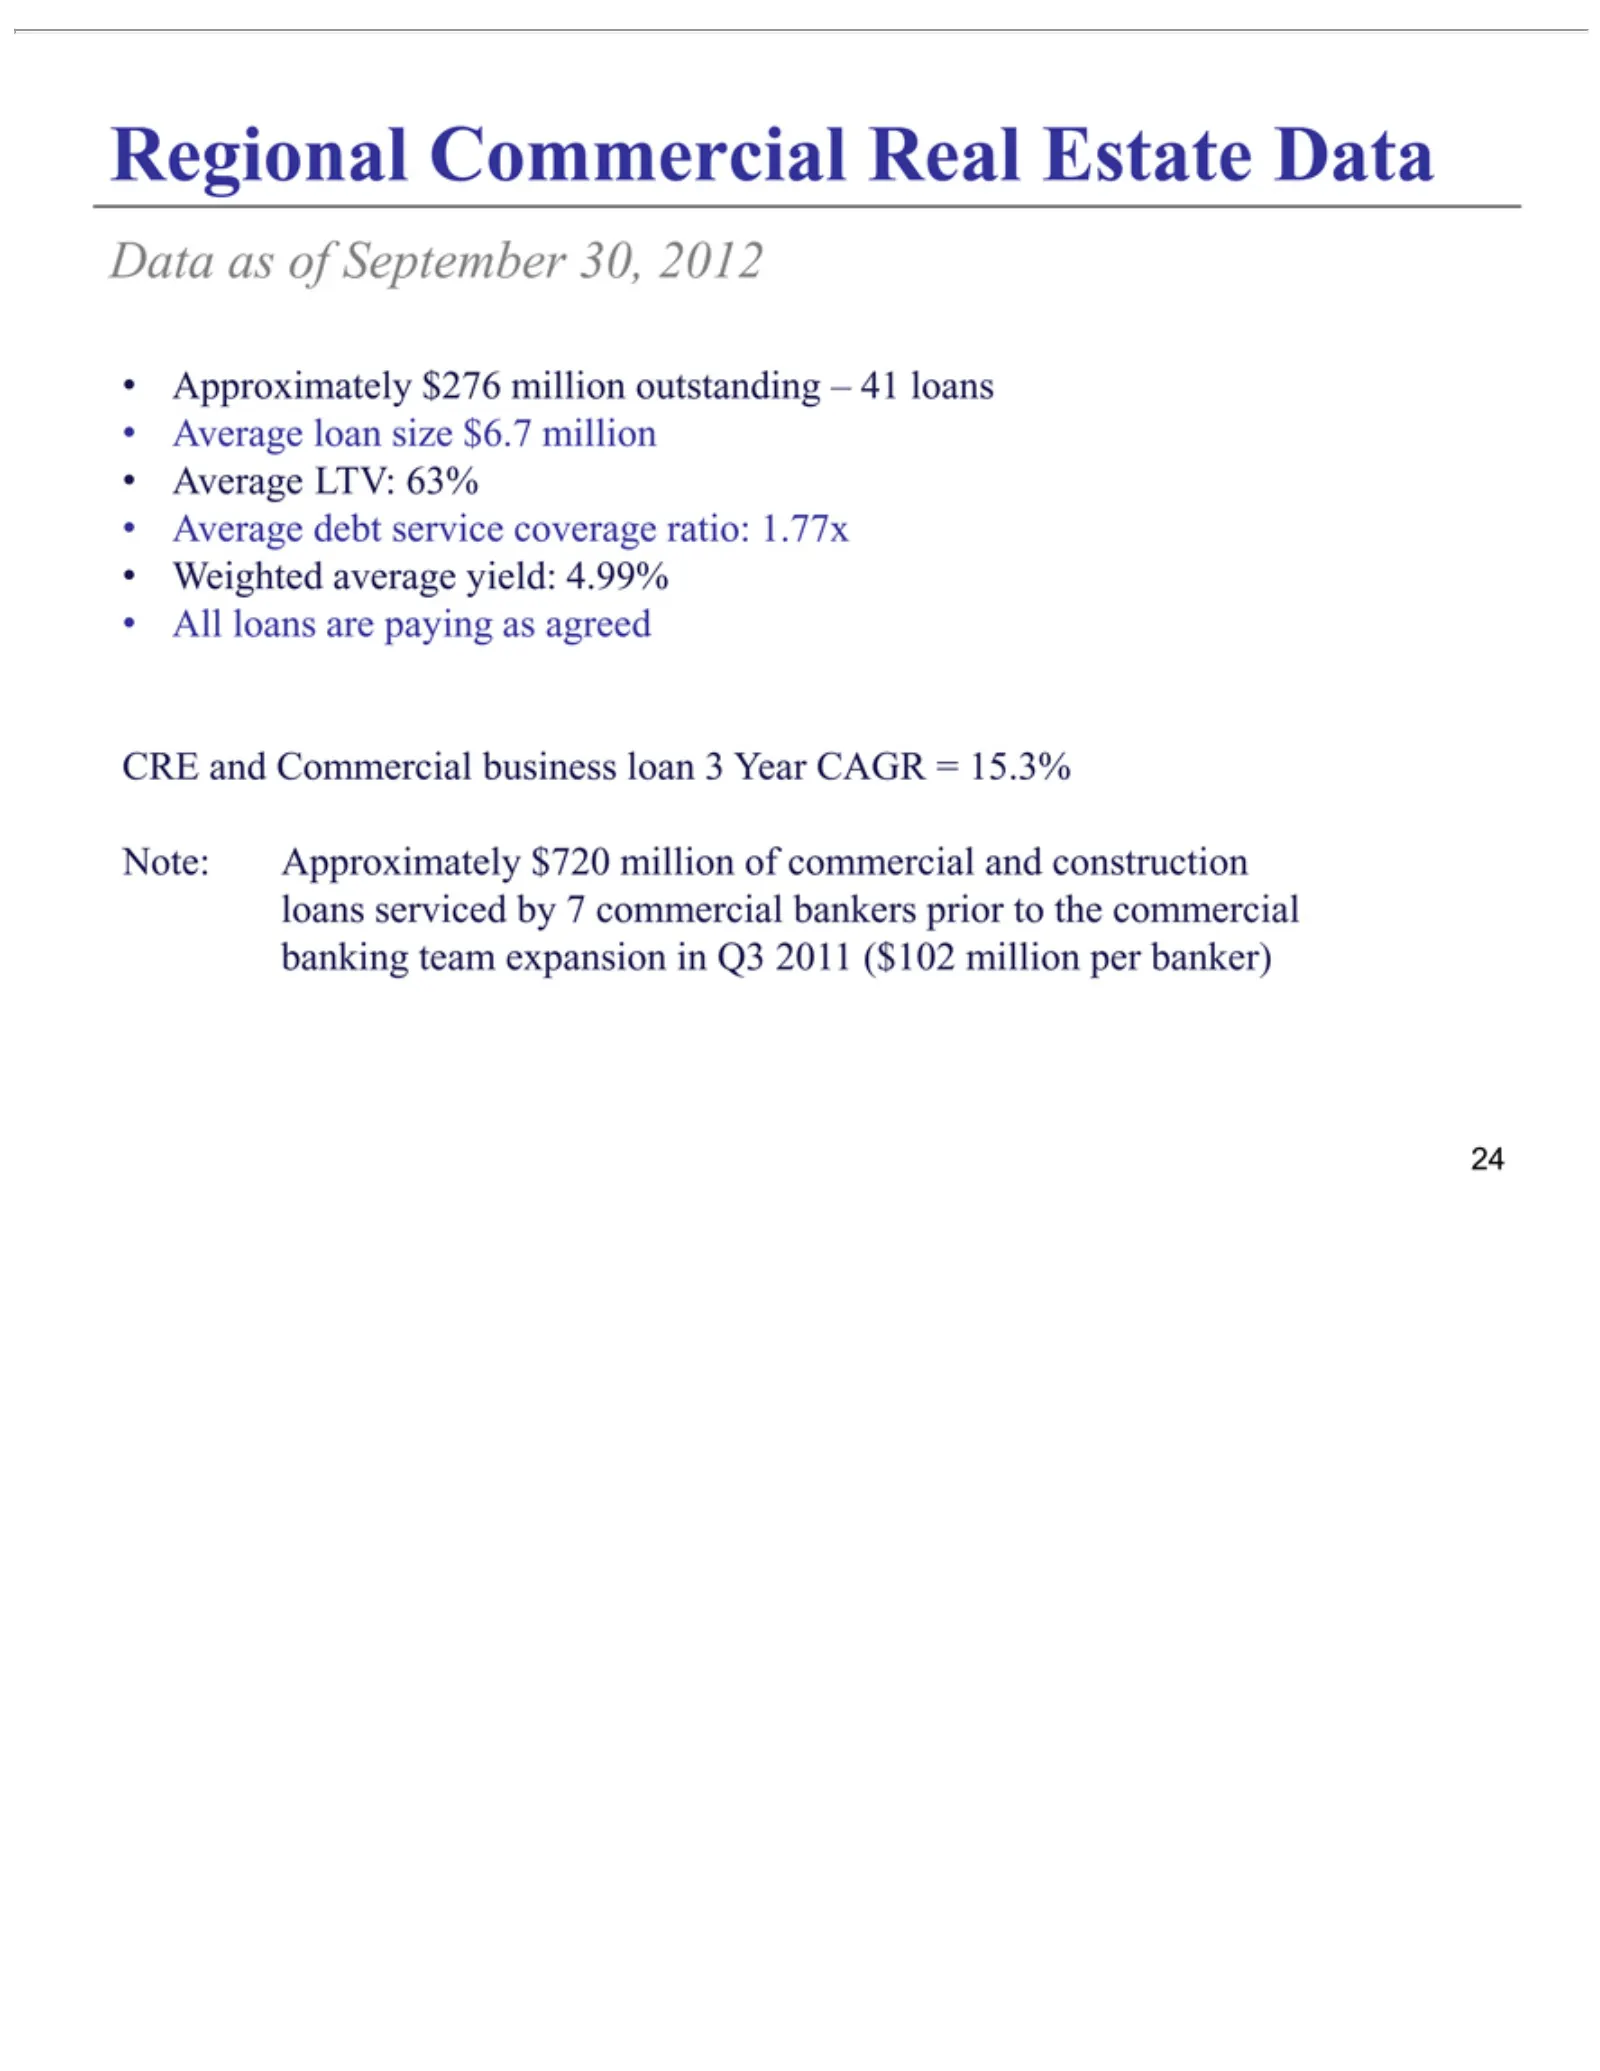
Slide 24: Commercial Loan Regional Data
Regional Data Approximately Average Weighted All CRE Note: loans banking 24 loans as and serviced Approximately of team loan LTV: debt Commercial are average September paying size service expansion 63% by $276 7$6.7 yield: commercial as million coverage $720 30, Real business million agreed 4.99% in
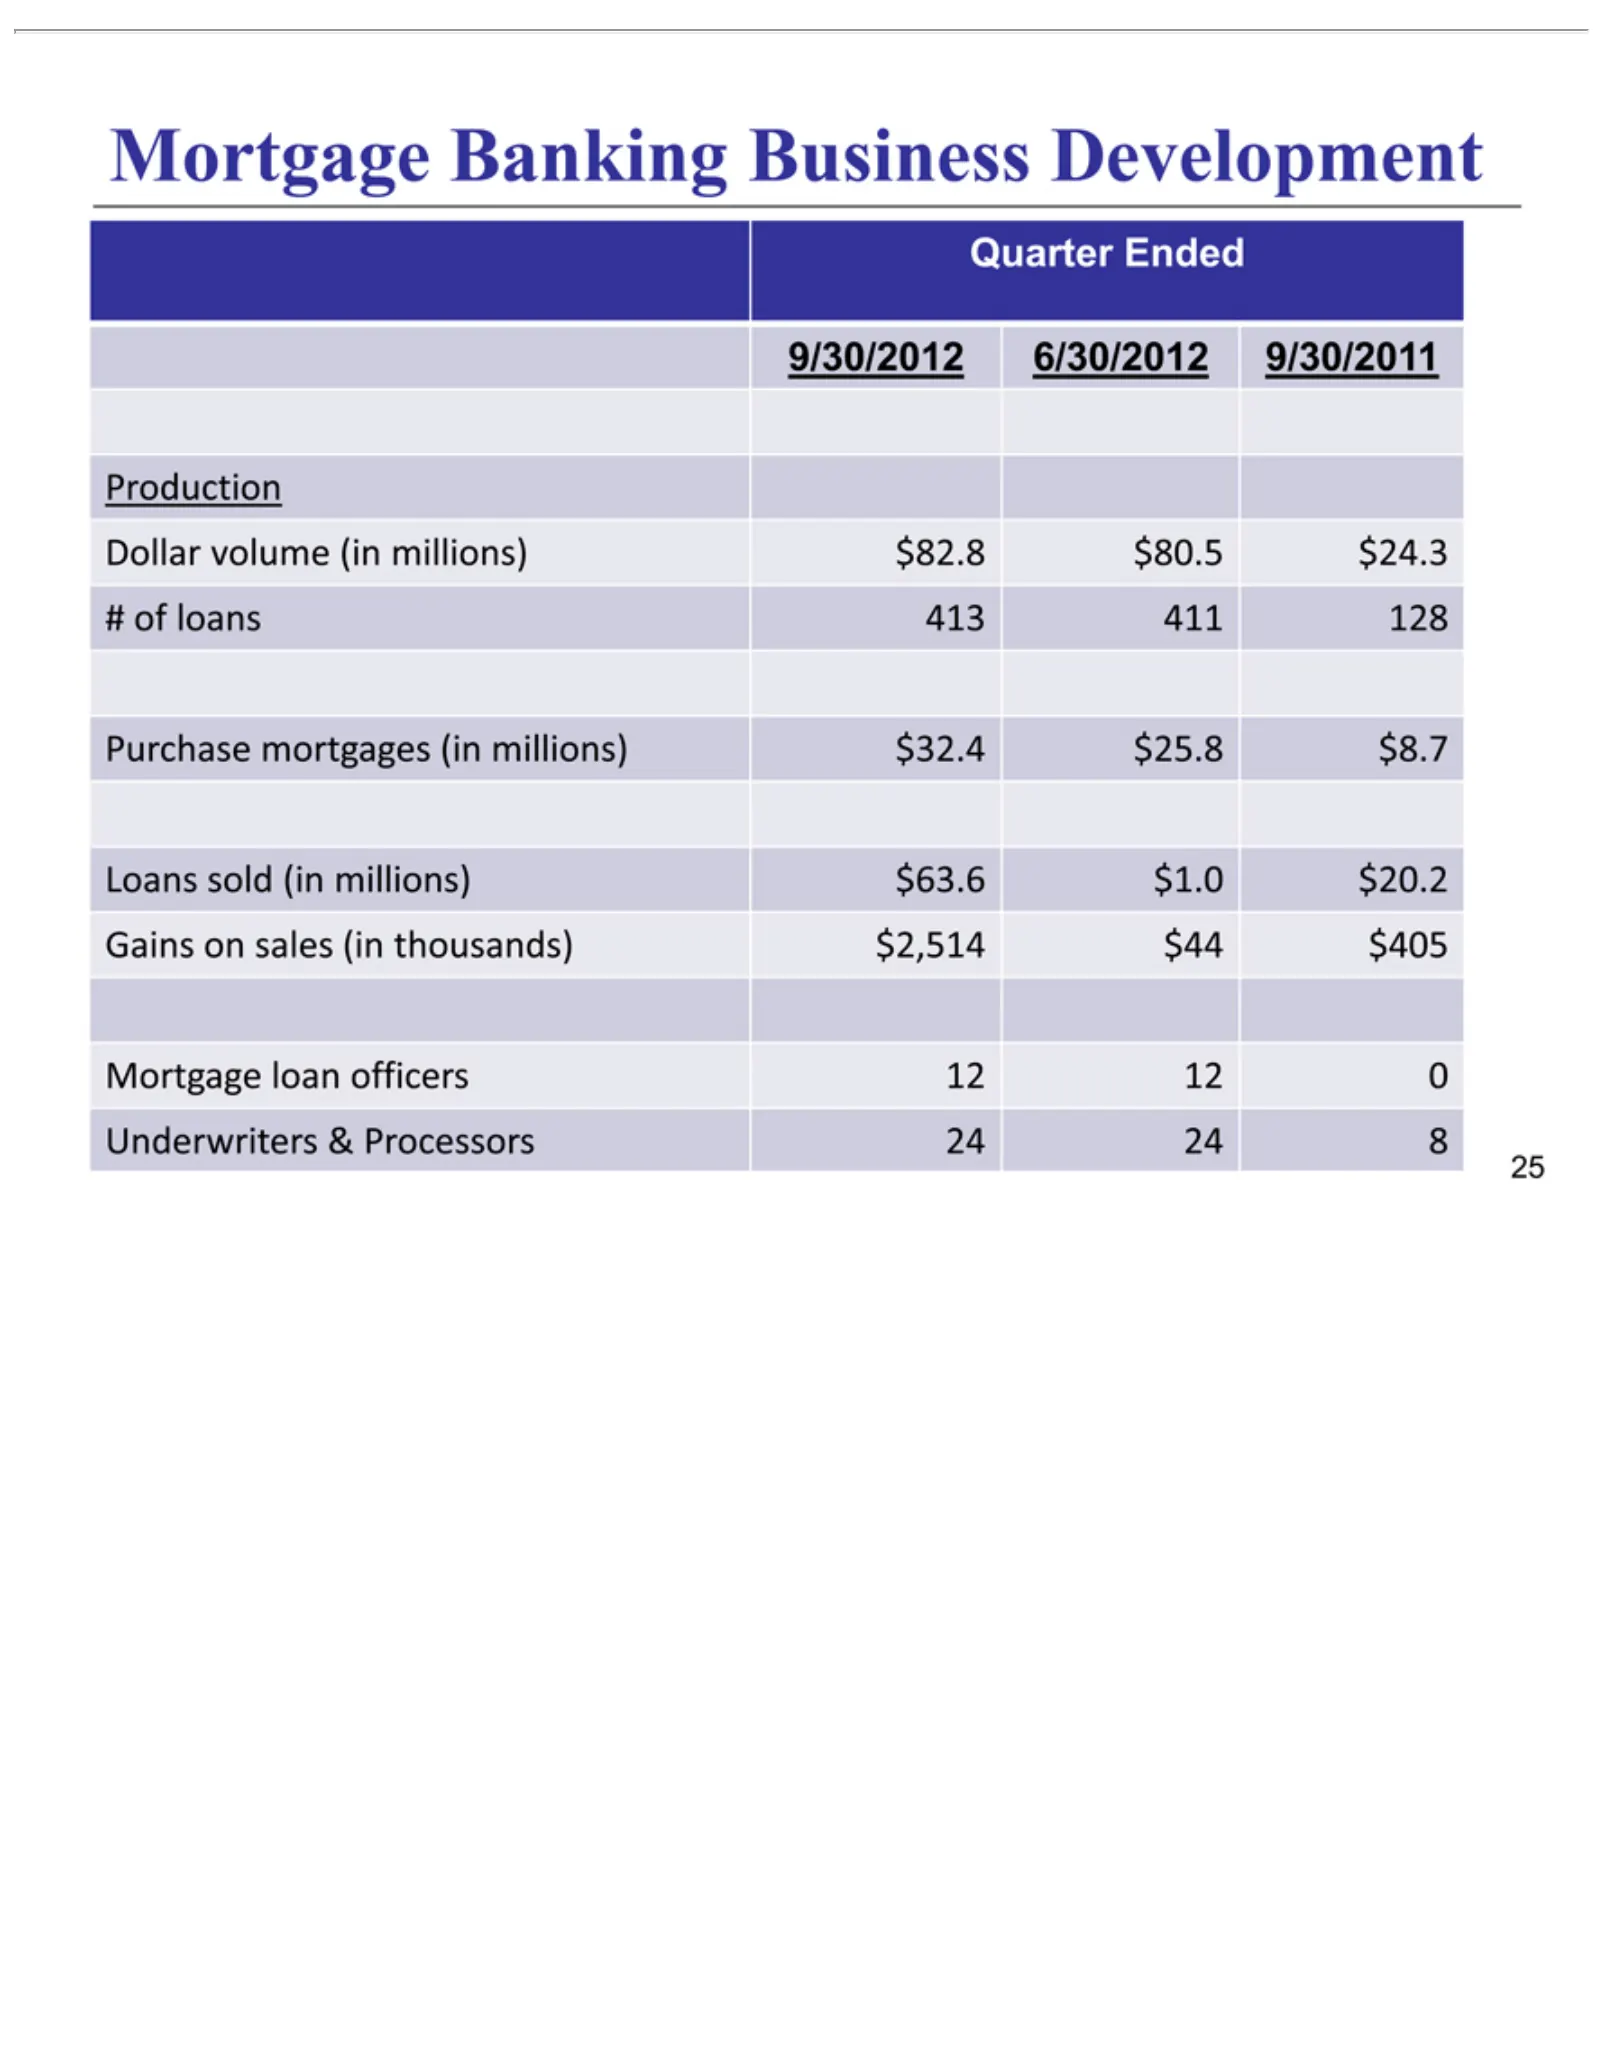
Slide 25: Mortgage Banking Production
Quarter 9/30/2012 Dollar #Production Purchase Loans Gains Mortgage Underwriters 25of loans on sold volume Ended sales mortgages Banking loan 413 6/30/2012 (in&411 millions) (in officers Processors thousands) millions) 128 Business (in 9/30/2011 12 millions) $63.6 12 24 $82.8 Development 0$2,514 24 $
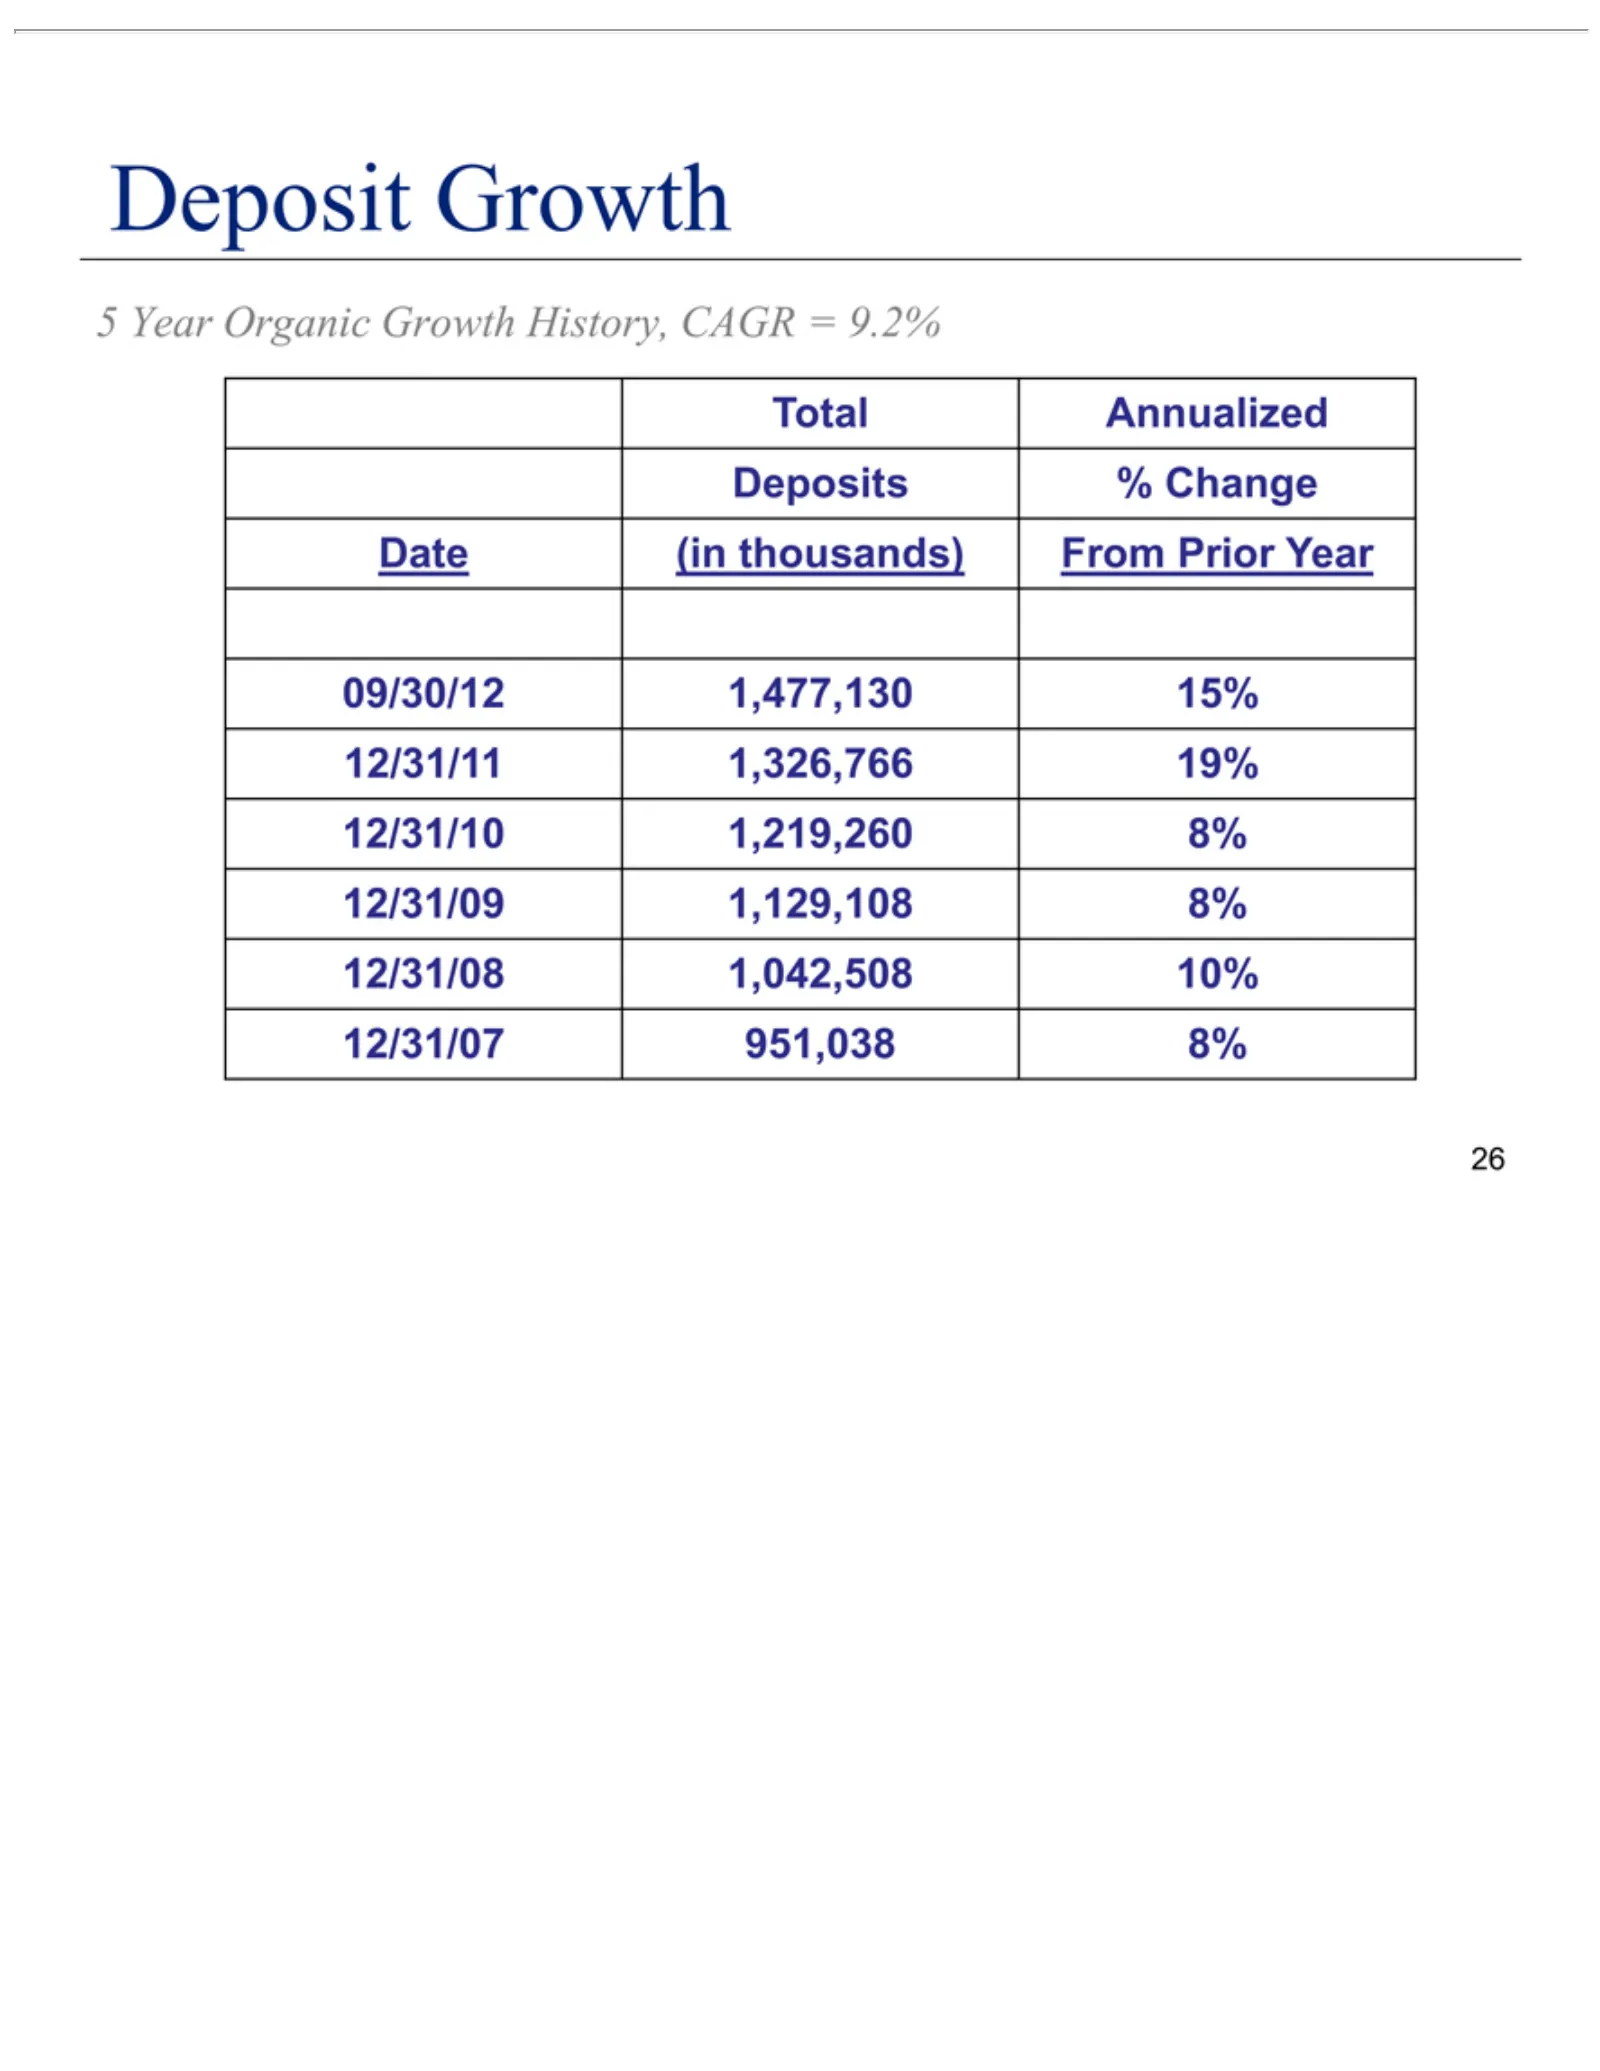
Slide 26: 5 Year Deposit Growth
5Deposit 12/31/07 26 Growth Year Organic Total Annualized Deposits% Date(in 09/30/12 12/31/11 12/31/10 12/31/09 12/31/08thousands) 1,326,766 1,477,130 1,219,260 1,129,108 1,042,508 951,038 Change8% Growth From 19% 15% 8% 10% Prior History, Year CAGR = 9.2%
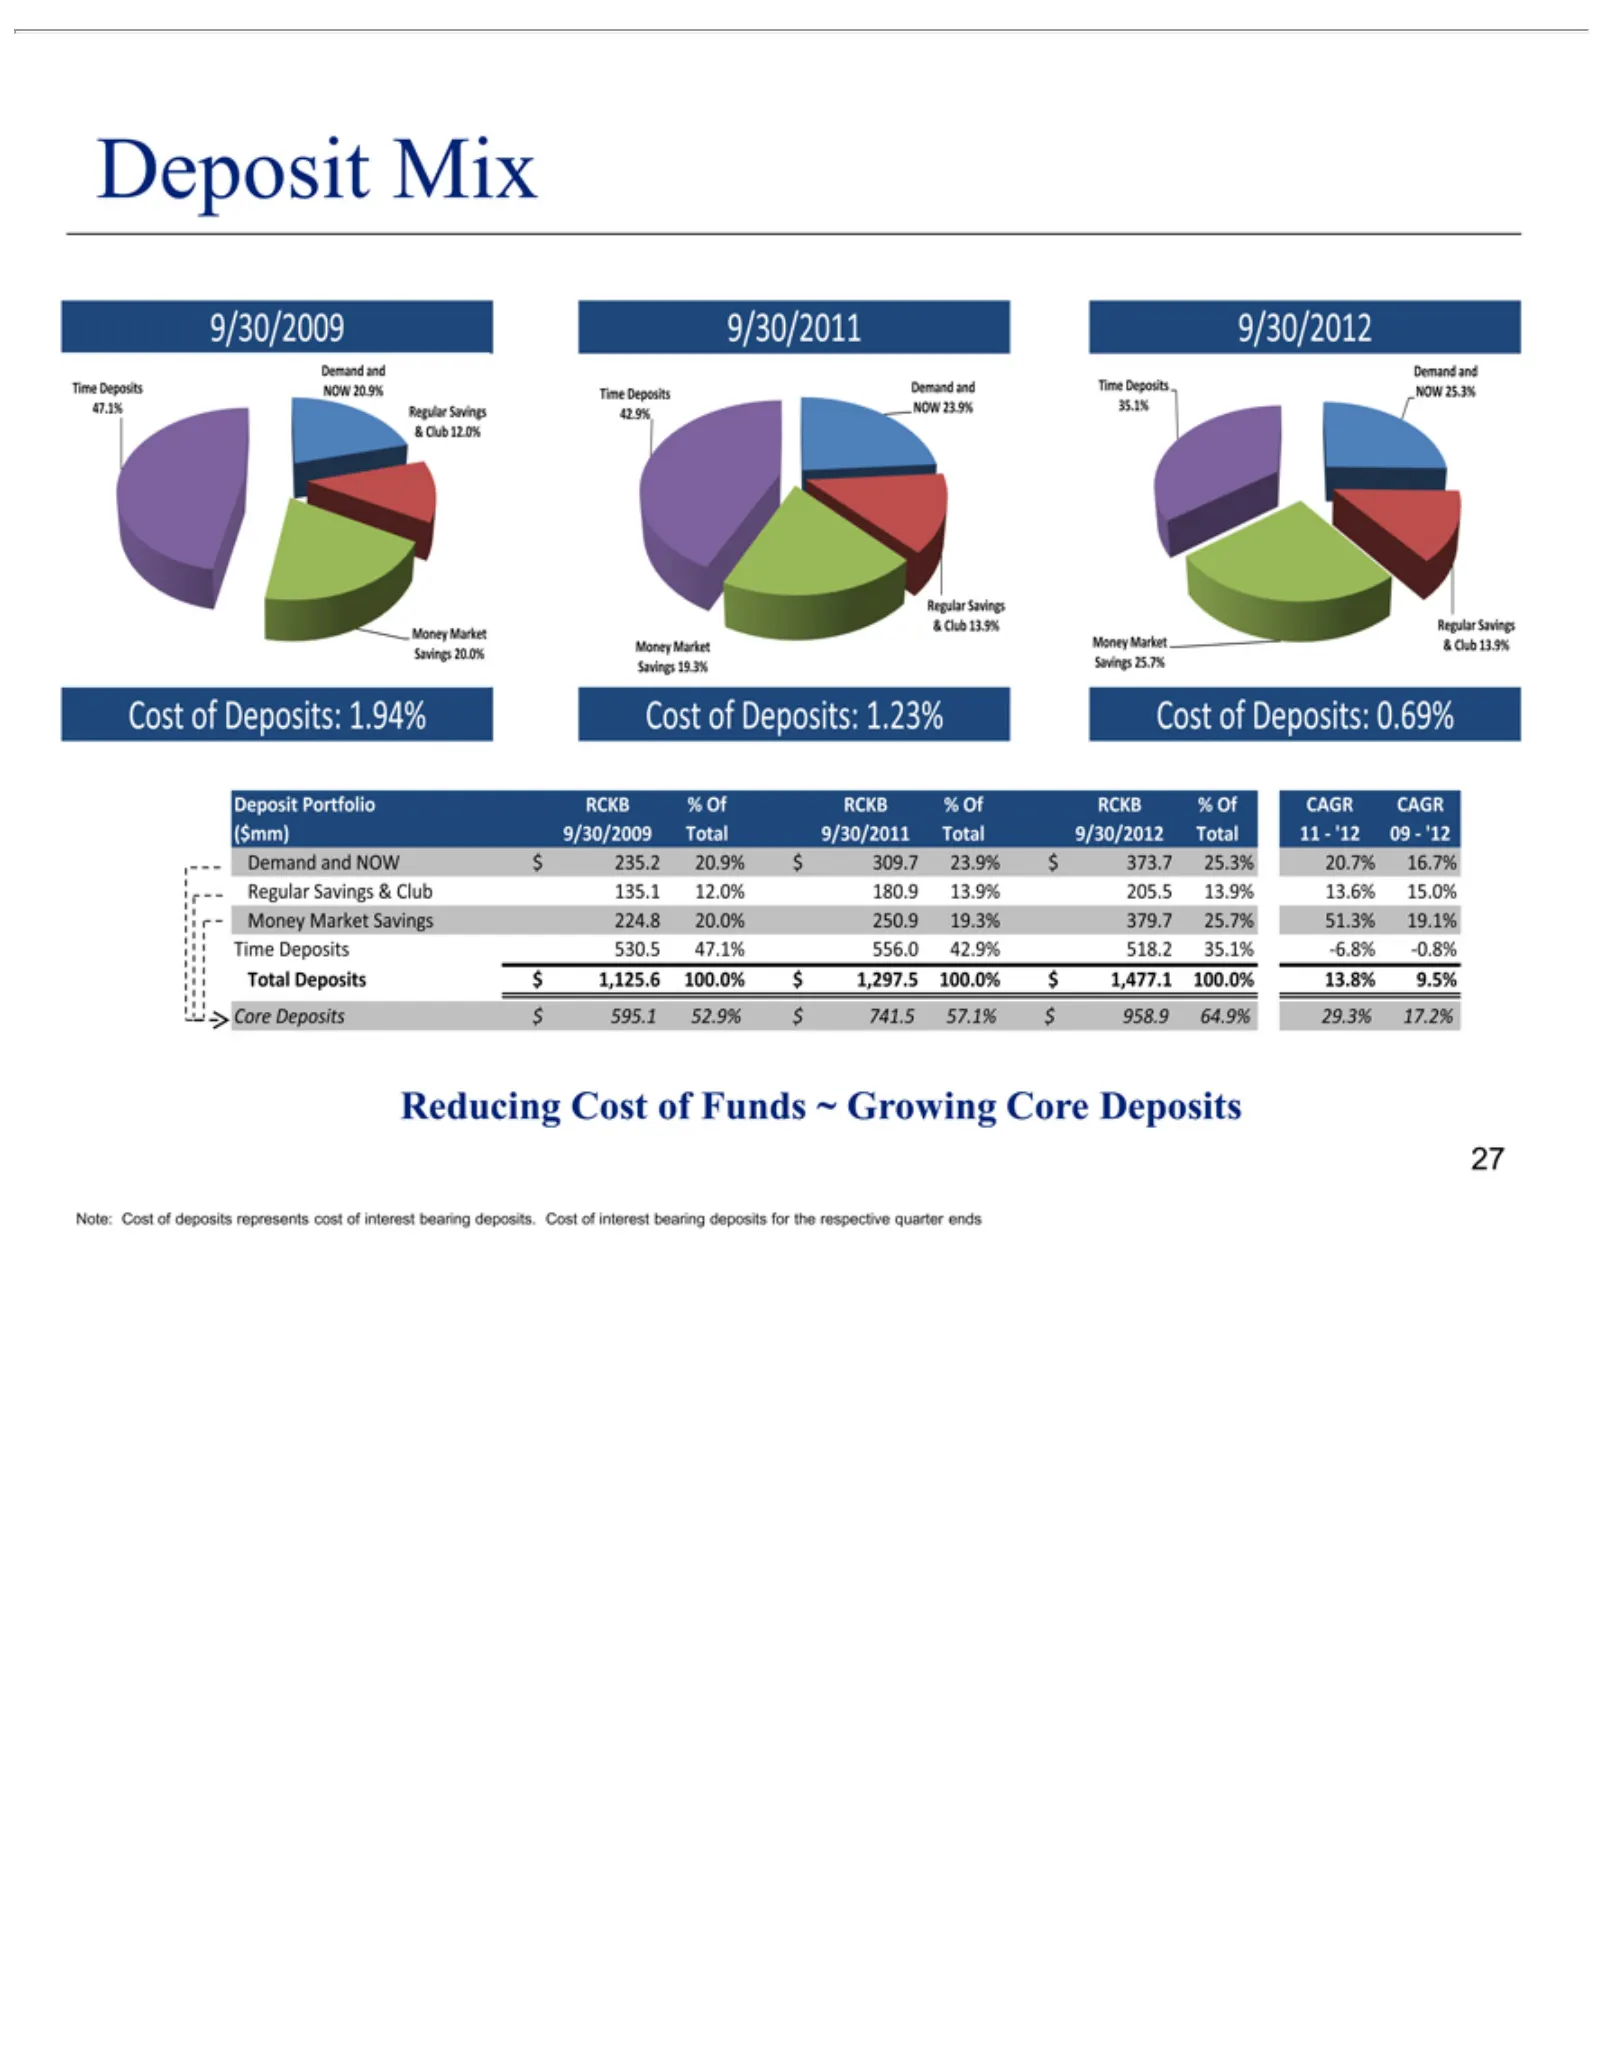
Slide 27: Deposit Mix and Cost of Funds
Deposit 9/30/2009 47.1% Money & Demand 9/30/2012 Regular 35.1% Cost RCKB% $9/30/2011 180.9 309.7 Club 250.9 $556.0 Funds Note: 27 ofCost ~Regular Market 1,297.5 741.5 Deposits: 12.0% 13.9% 23.9% Mix Savings 13.9% and Of Total ofRCKB% 19.3% 42.9% 57.1% Time Growing 100.0%Money $$Savings 205.5 9/30/20
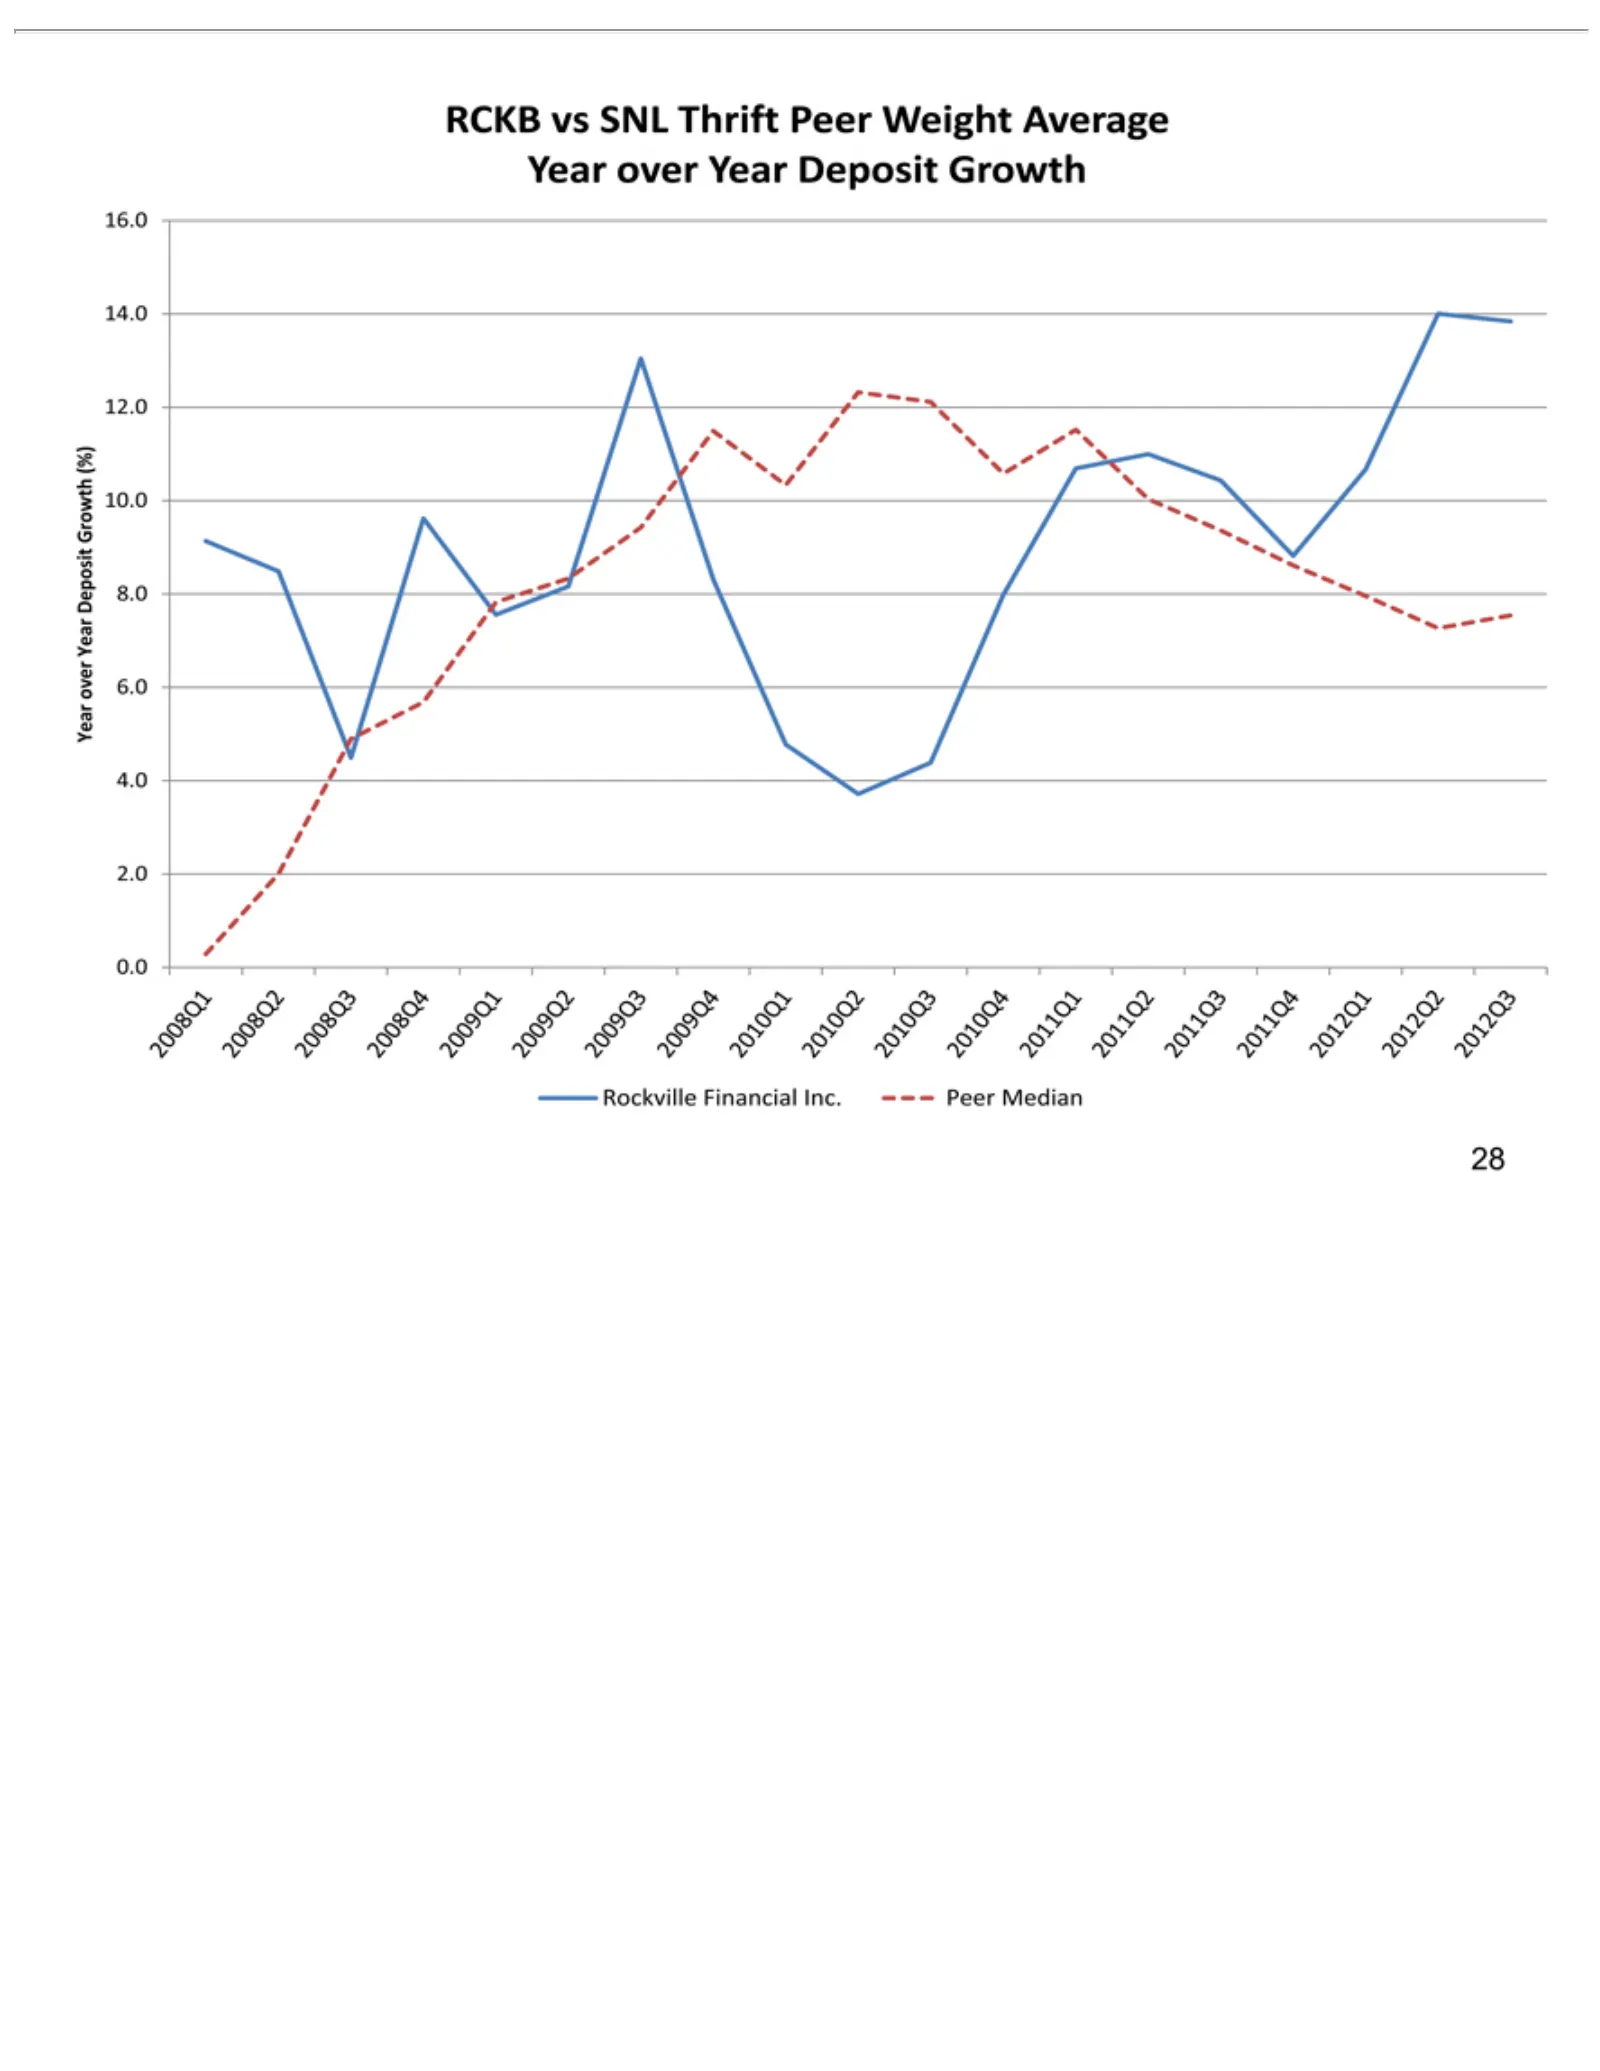
Slide 28: Deposit Growth vs Peers
RCKB Year 16.0 2008Q1 0.0 2.0 4.0 6.0 8.0 2009Q1 2010Q1 2011Q1 2012Q1 Rockville 28 14.0 over vs2011Q2 2008Q2 2009Q2 2010Q2 2012Q2 12.0 Year SNL Financial 10.0 Deposit Thrift 2011Q3 2008Q3 2009Q3 2010Q3 2012Q3 Inc. Peer Growth Peer 2011Q4 2008Q4 2009Q4 2010Q4 Weight Median (%)Average
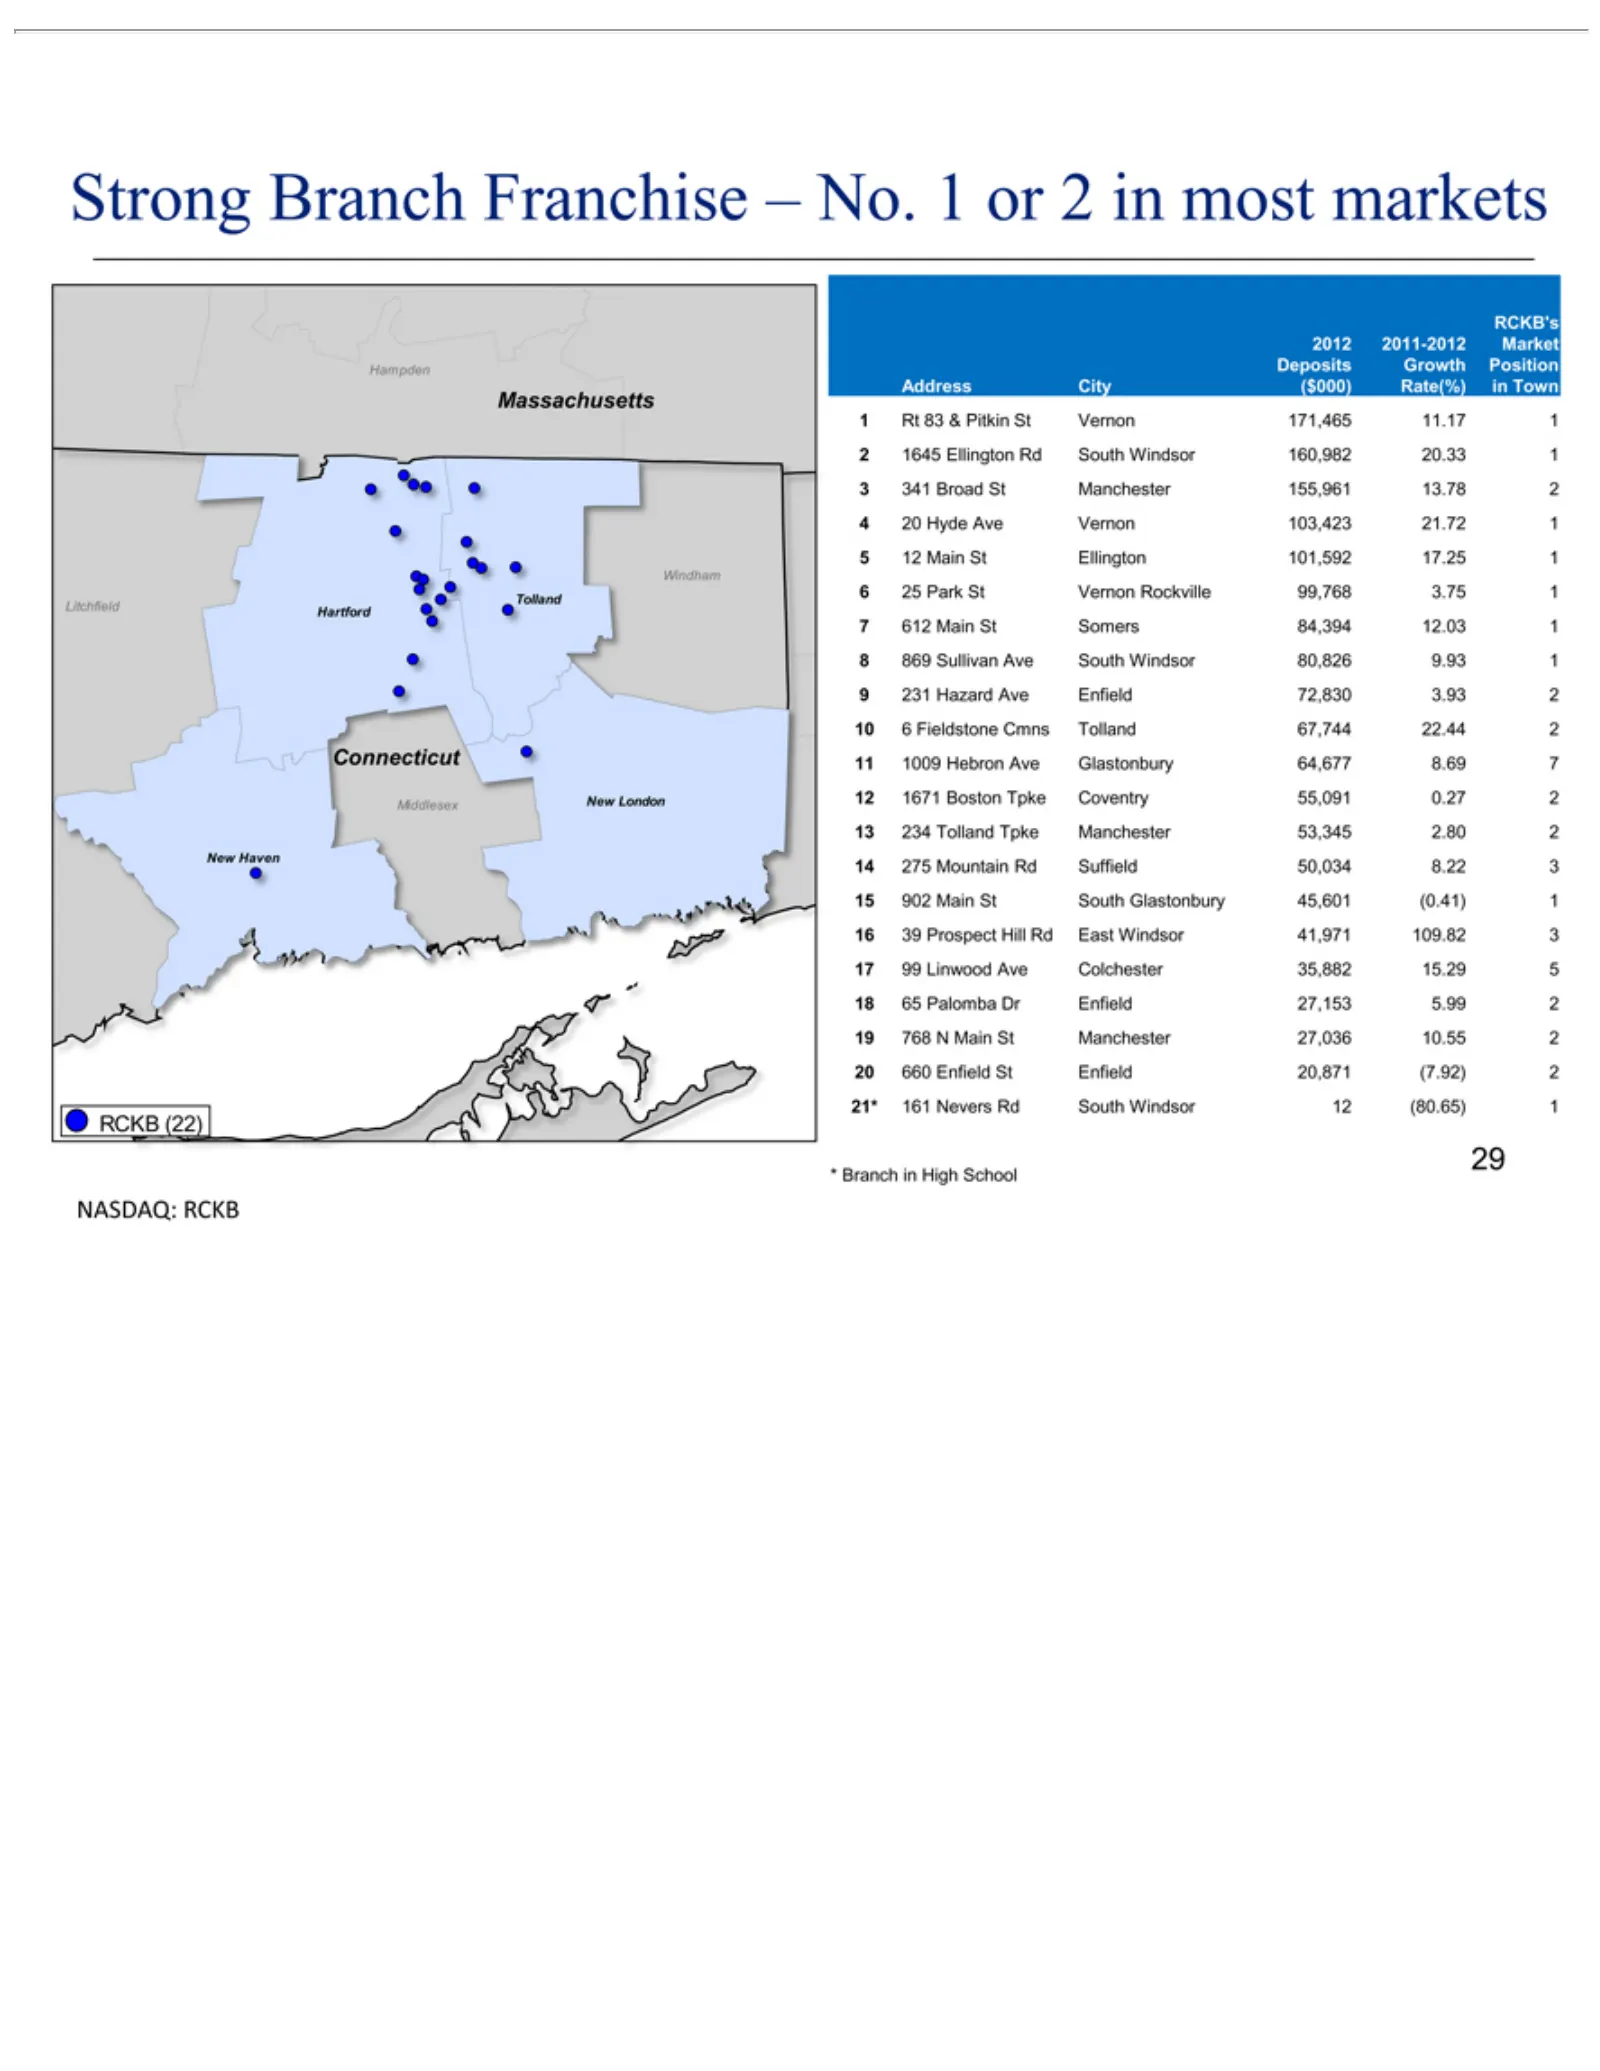
Slide 29: Strong Connecticut Franchise and Branch Network
Strong RCKB Connecticut Massachusetts Berkshire NASDAQ: 2012 RCKB’s Deposits 21Address 2011-2012 Branch (22) Rt City($000) Growth 164583 RCKB &Franchise Market Pitkin Position Rate(%) Ellington St–Vernon Rd No. in South1Town or 171,465 212.03 in Windsor most 11.17 markets 160,982 121 20.33 1 9876543
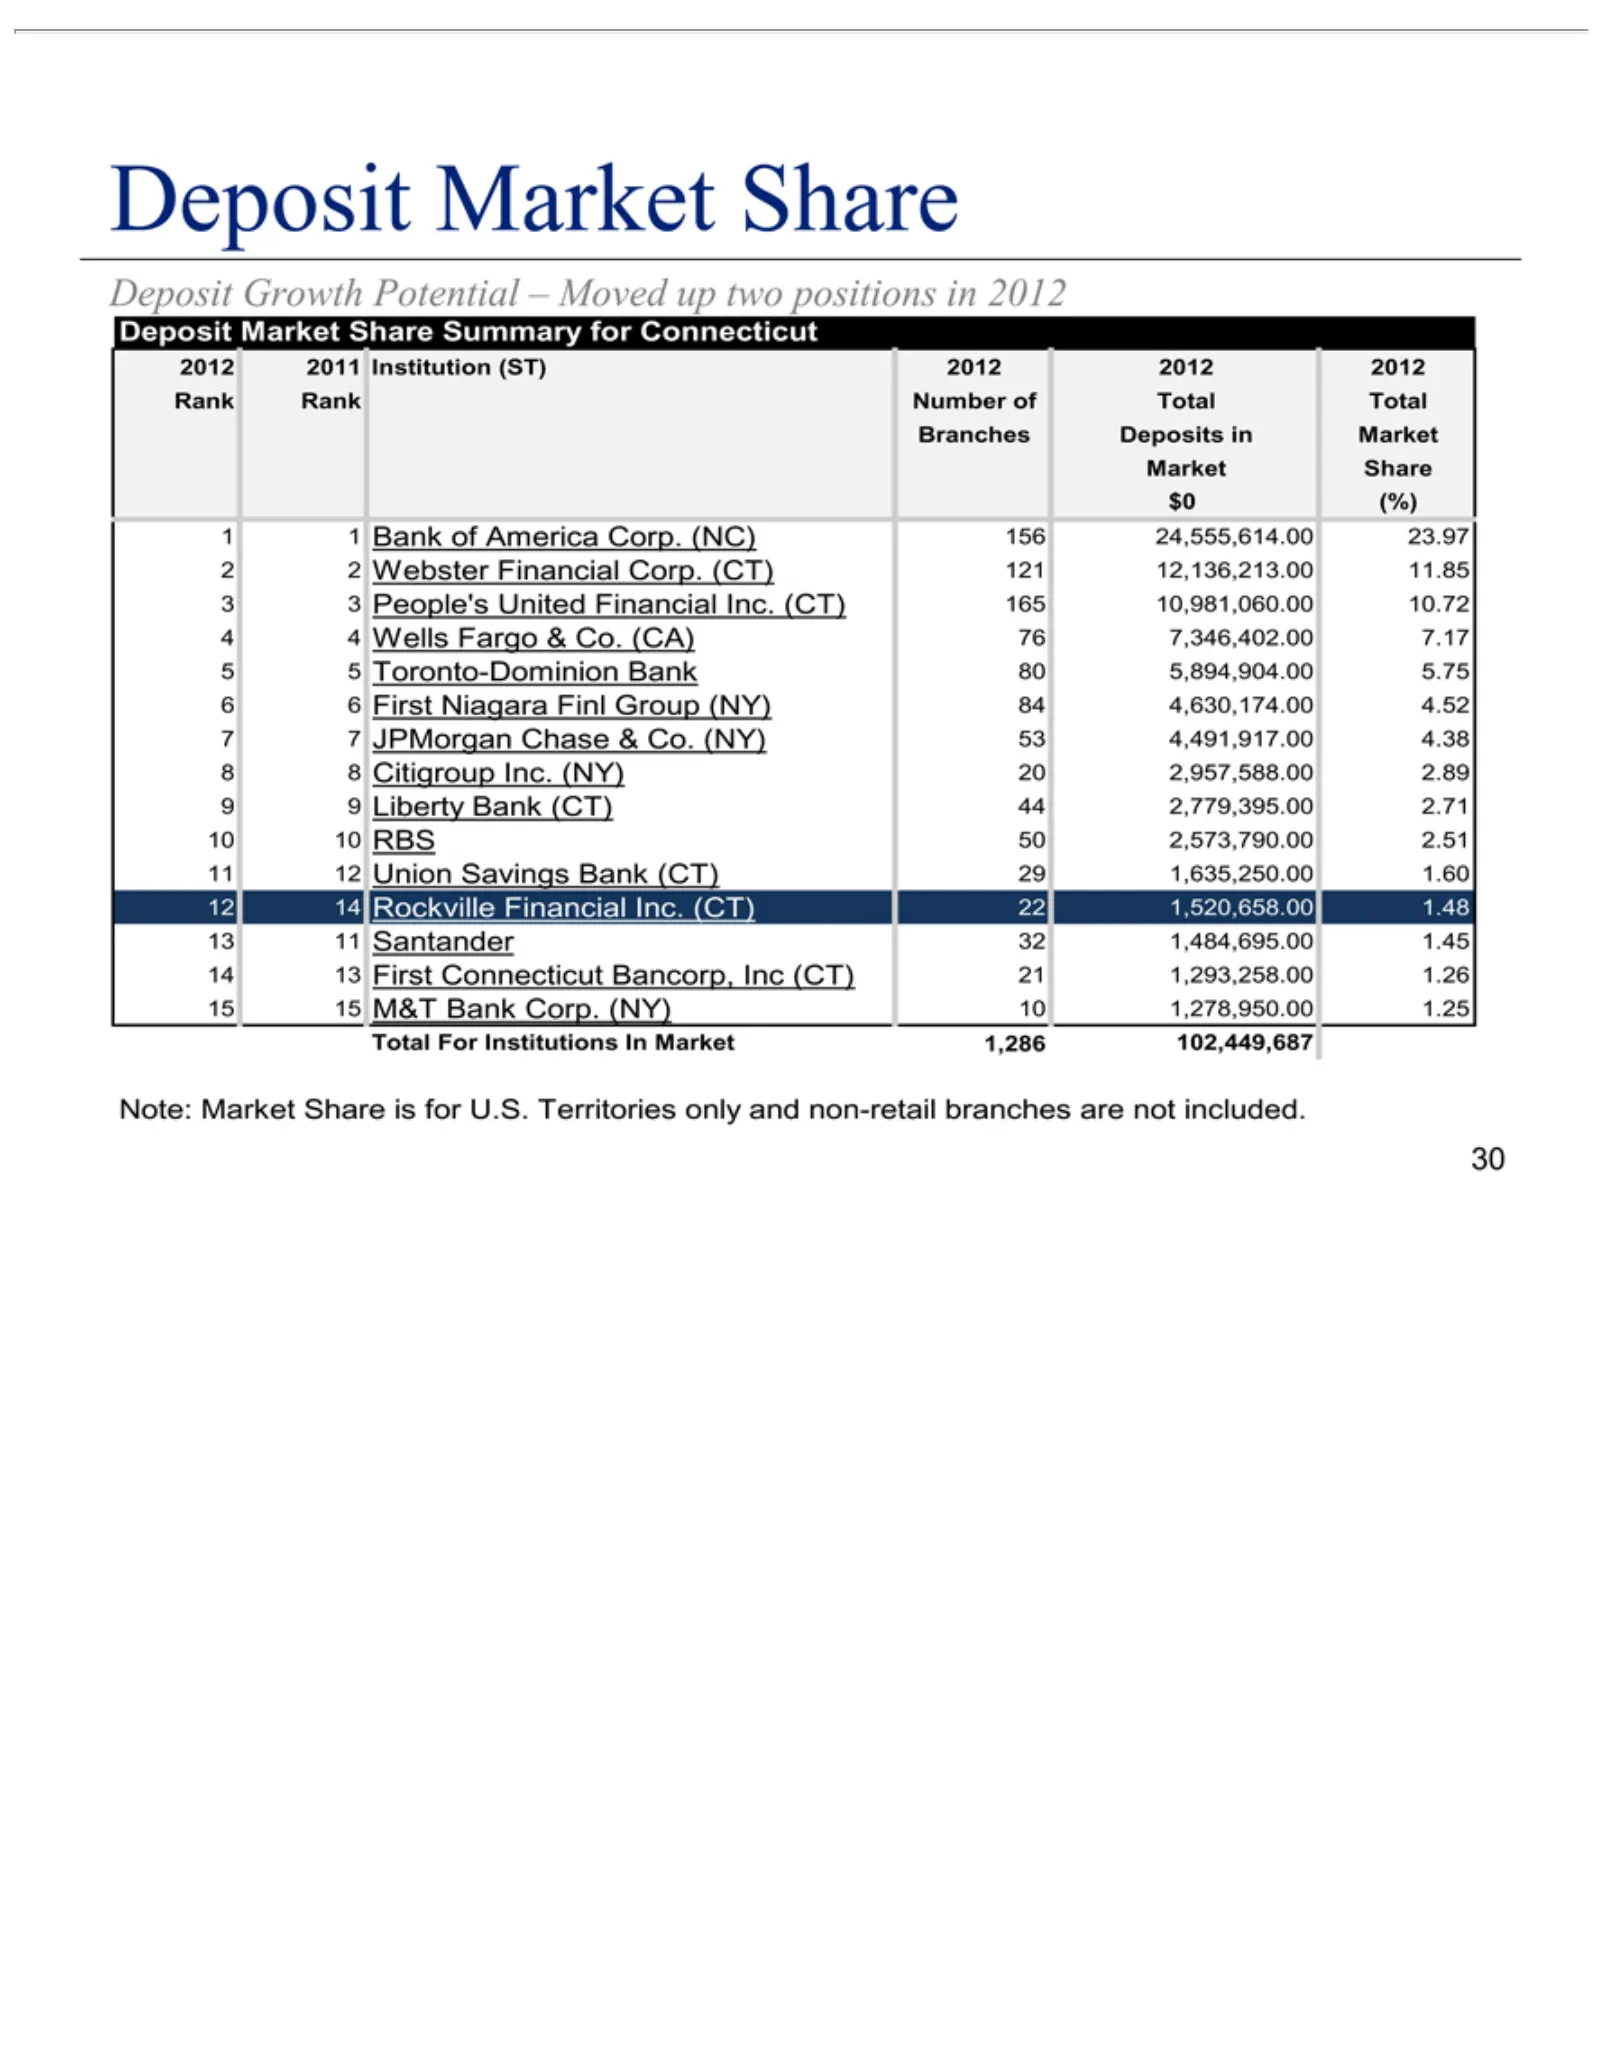
Slide 30: Connecticut Deposit Market Share
Deposit 2012 Rank Branches 1Market 2$0(%) 2011 Rank Share Growth Market 1 3Deposits 2 Bank Institution Number WebsterShare of Potential America inofMarket (ST) Summary Total Financial–Financial 2012 Moved Corp. Total 2012 for Corp. (NC) upConnecticut (CT) 2012 two 156 121positions 24,555,614.00 in 2
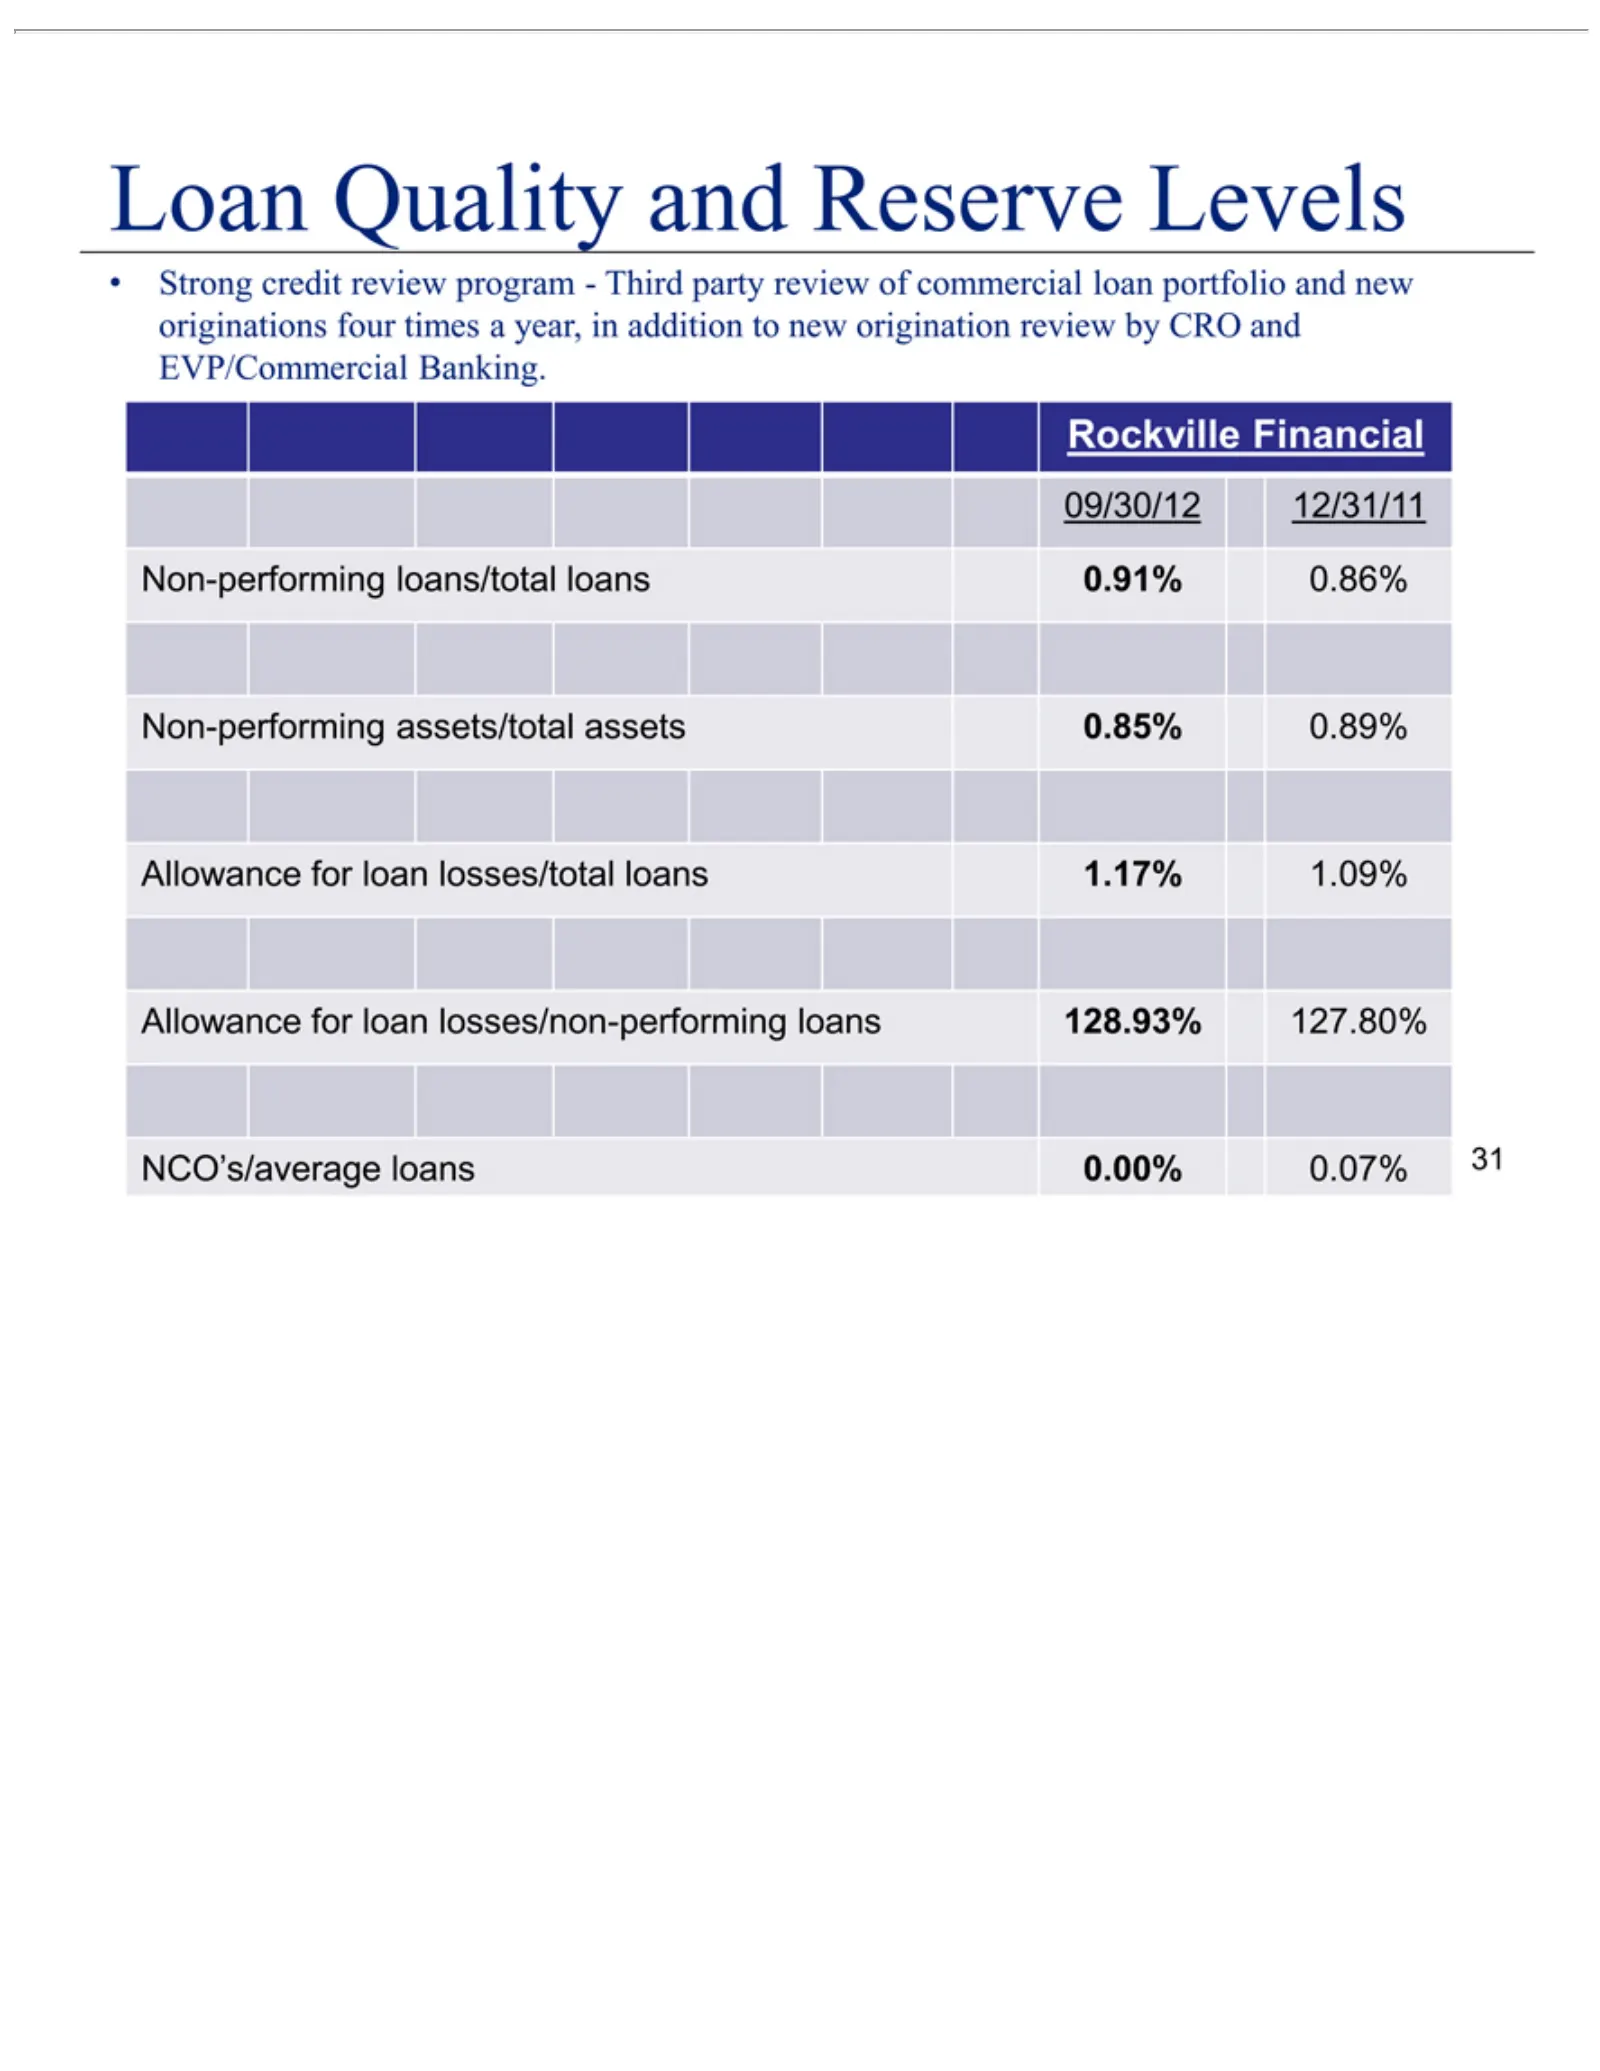
Slide 31: Strong Loan Quality
Loan Quality Strong Rockville 09/30/12 Non-performing Allowance NCO’s/average 31 credit 12/31/11 Financial forreview and loan loans loans/total assets/total Reserve losses/total losses/non-performing program 0.00% Levels loans assets 0.07% - Third loans 0.91% 0.85% 1.17% party 0.86% 0.89% loans revi
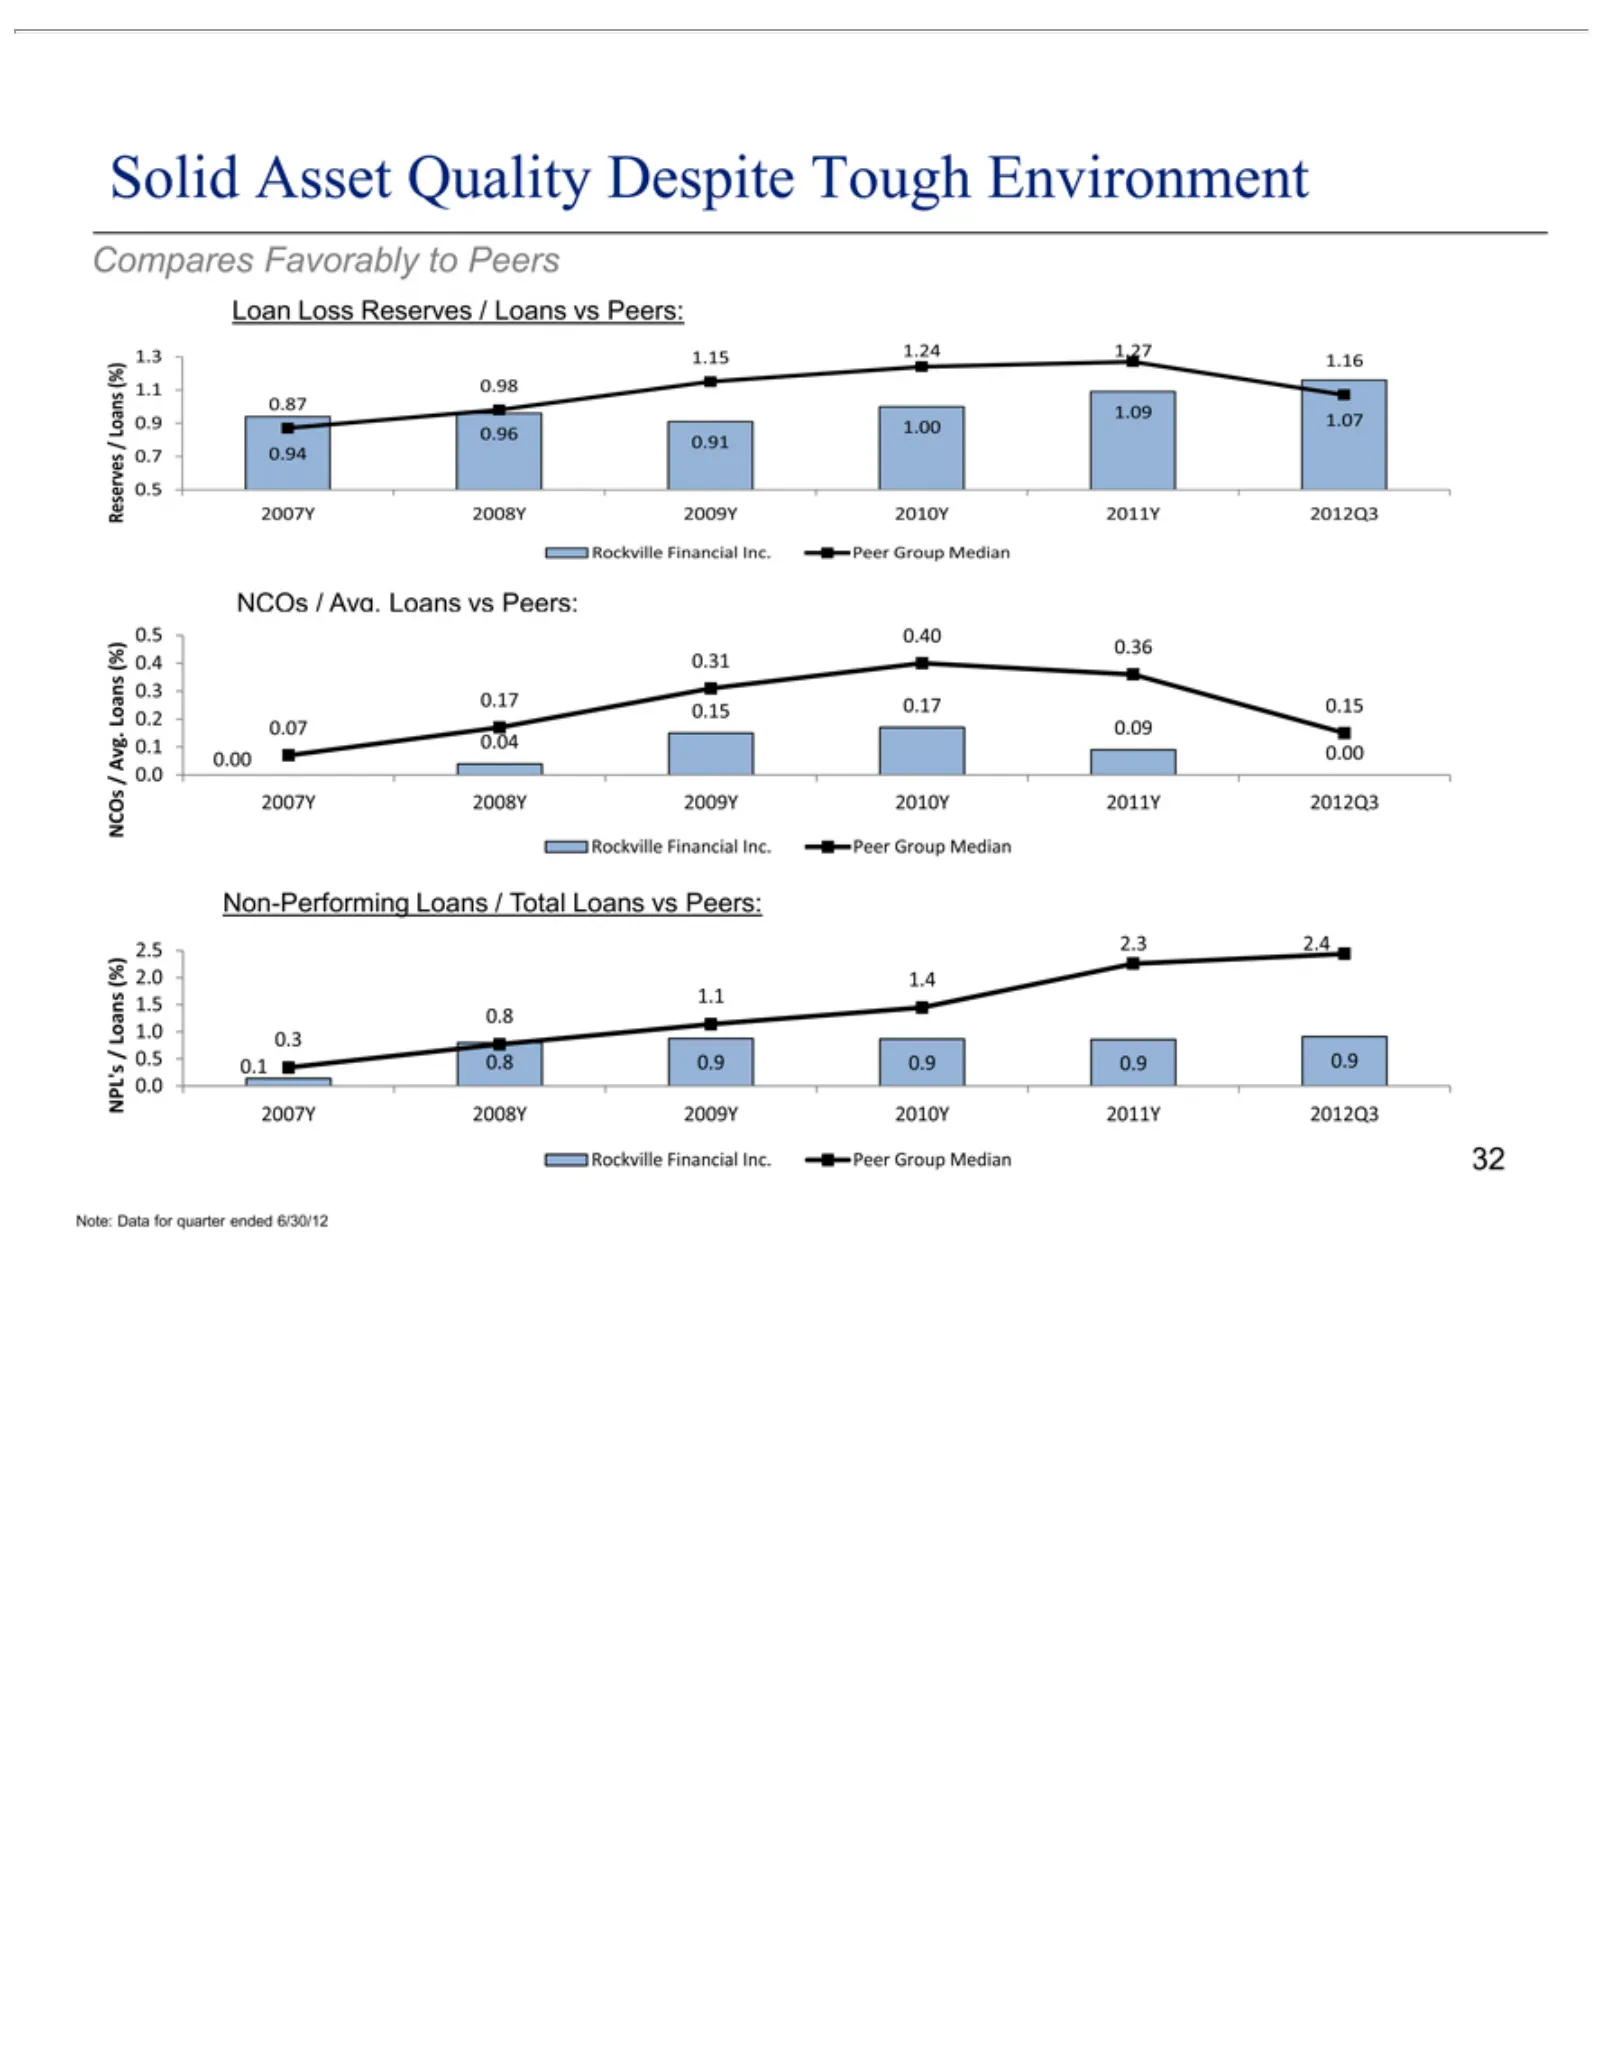
Slide 32: Solid Asset Quality Compares Favorably to Peers
Solid Compares Reserves 0.5 1.07 1.09 1.00 0.91 0.96 0.94 1.16 1.27 1.24 1.15 0.98 )0.87 (% /Loan 0.09 0.04 0.15 0.36 0.40 0.31 0.17 0.07 0.00 NCOs Non-Performing (%) 2.5 Loans NPL’s Rockville 2012Q3 2011Y 2010Y 2009Y 2008Y 2007Y 0.9 2.4 2.3 1.4 1.1 0.8 0.3 0.1 Peer Note: 32 0.0 0.50.4 0.7 2.0 Group
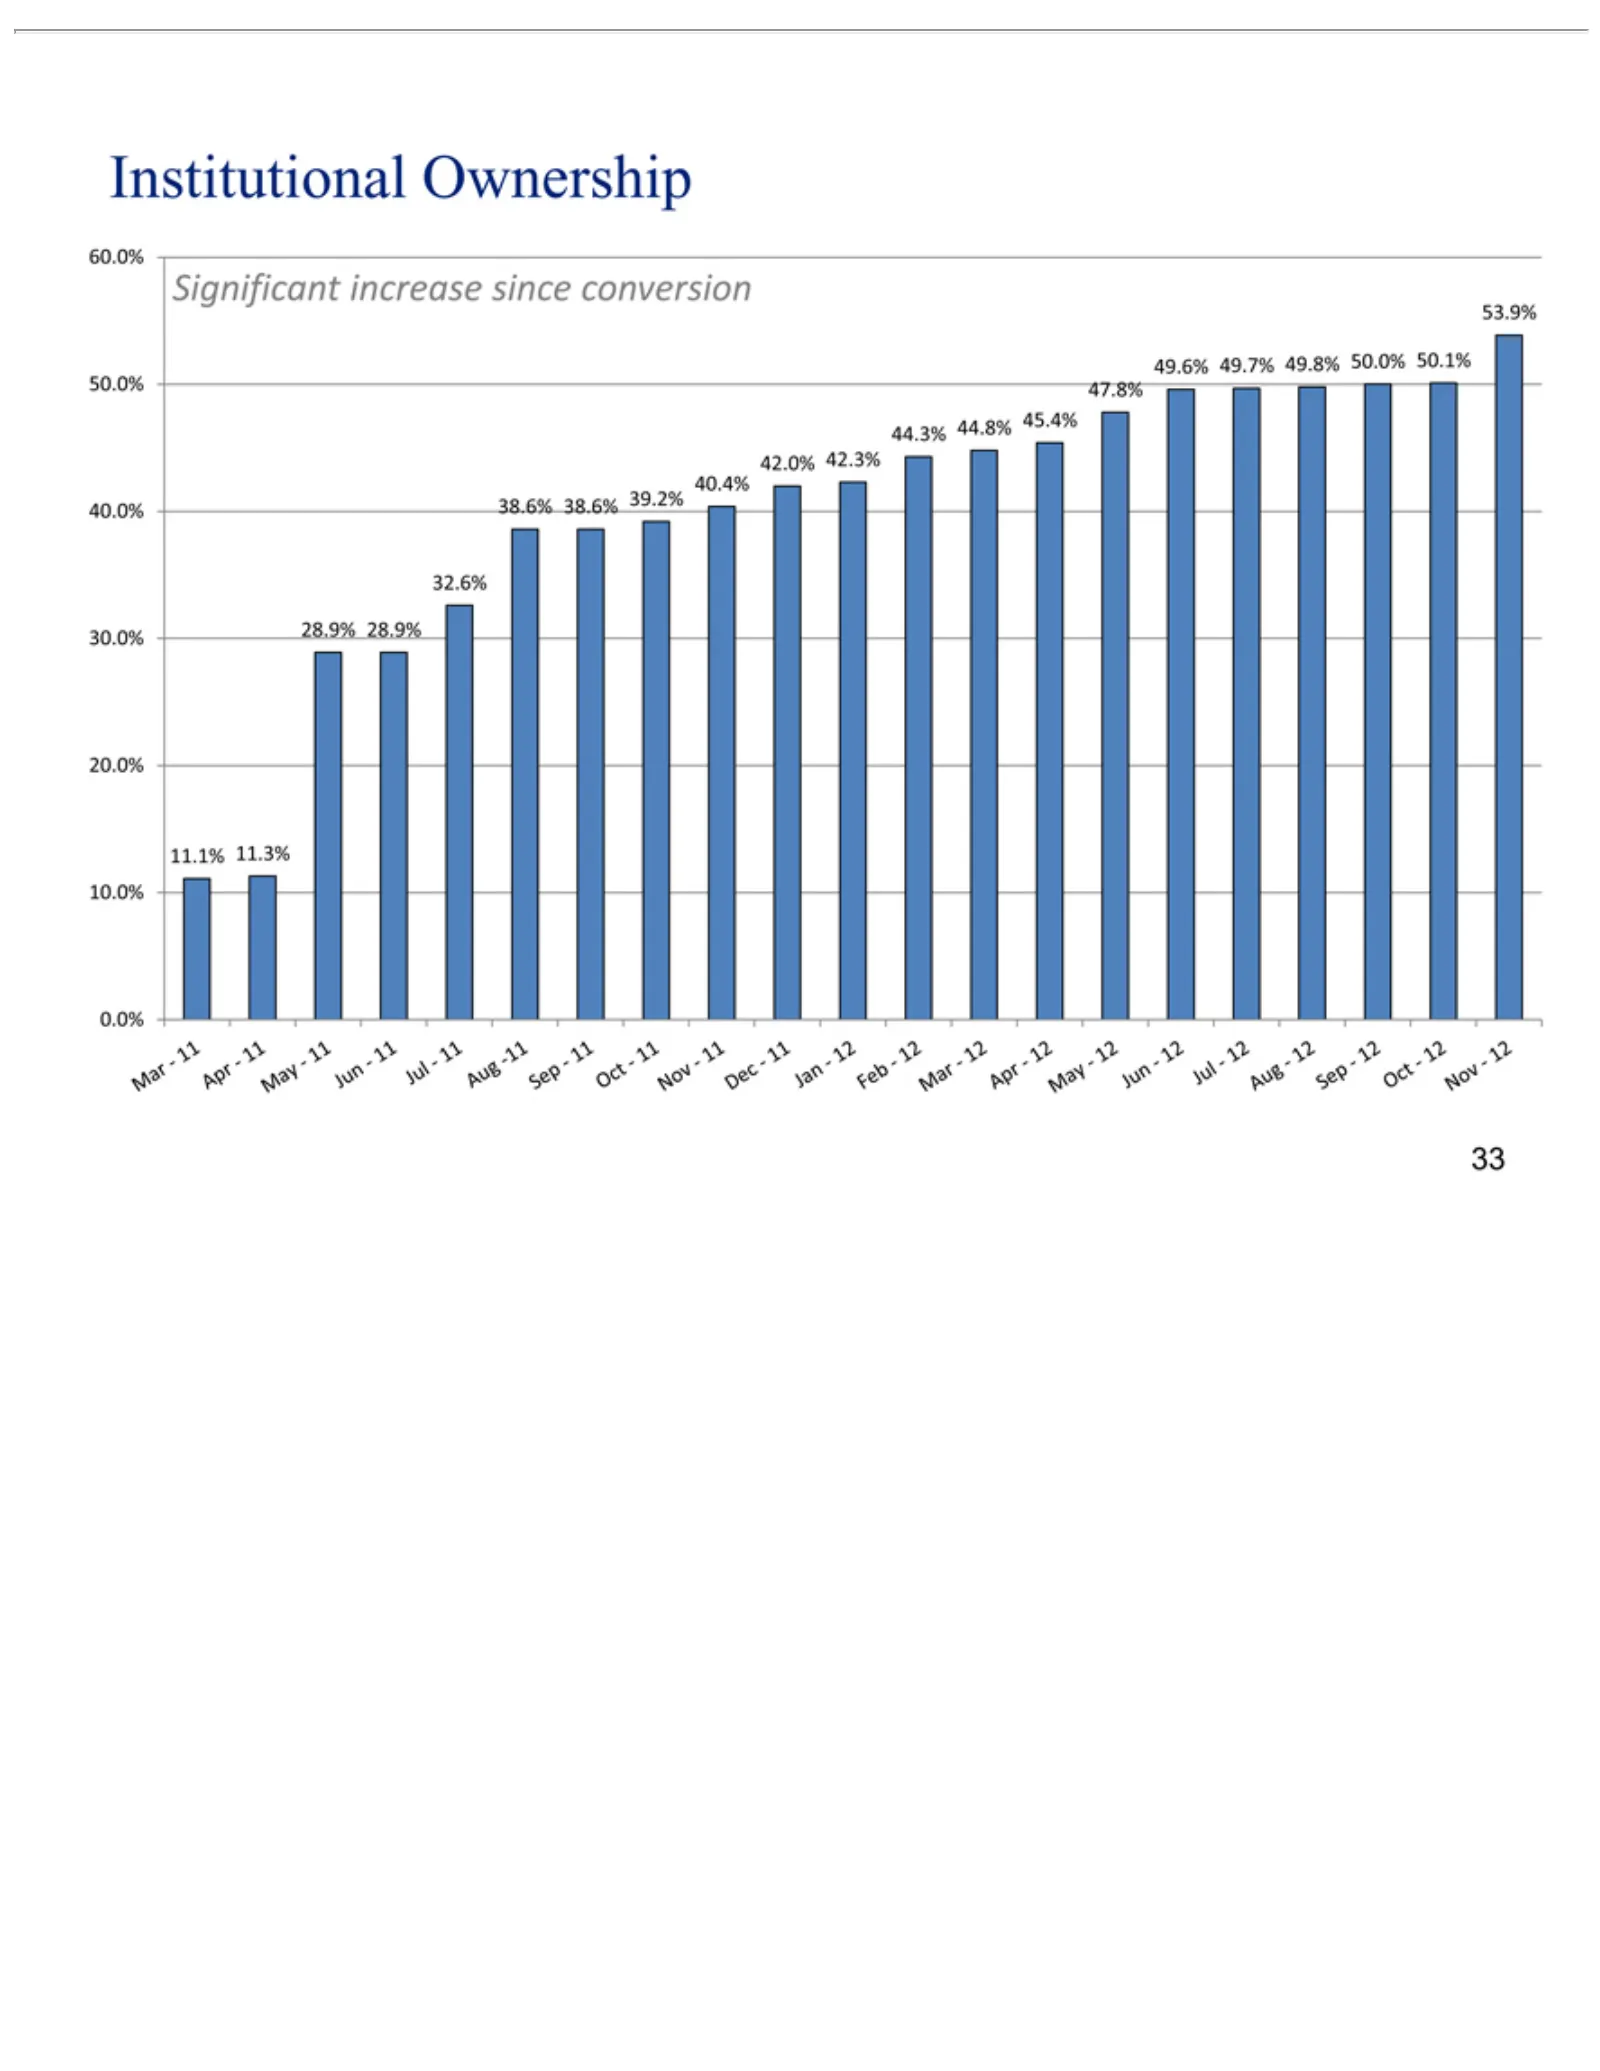
Slide 33: Institutional Ownership
Institutional Significant 11.1% 0.0% 10.0% 20.0% 30.0% 40.0% 60.0% 28.9% 38.6% 32.6% 53.9% 50.1% 50.0% 49.8% 49.7% 49.6% 47.8% 45.4% 44.8% 44.3% 42.3% 42.0% 40.4% Dec Jan Feb Mar Apr May Jun Jul Aug Sep Oct Nov 33 ––––––12 11 12 11 12 11 12 11 12 11 11.3% 28.9% 38.6% 11 increase 12 Ownership 39.2%si
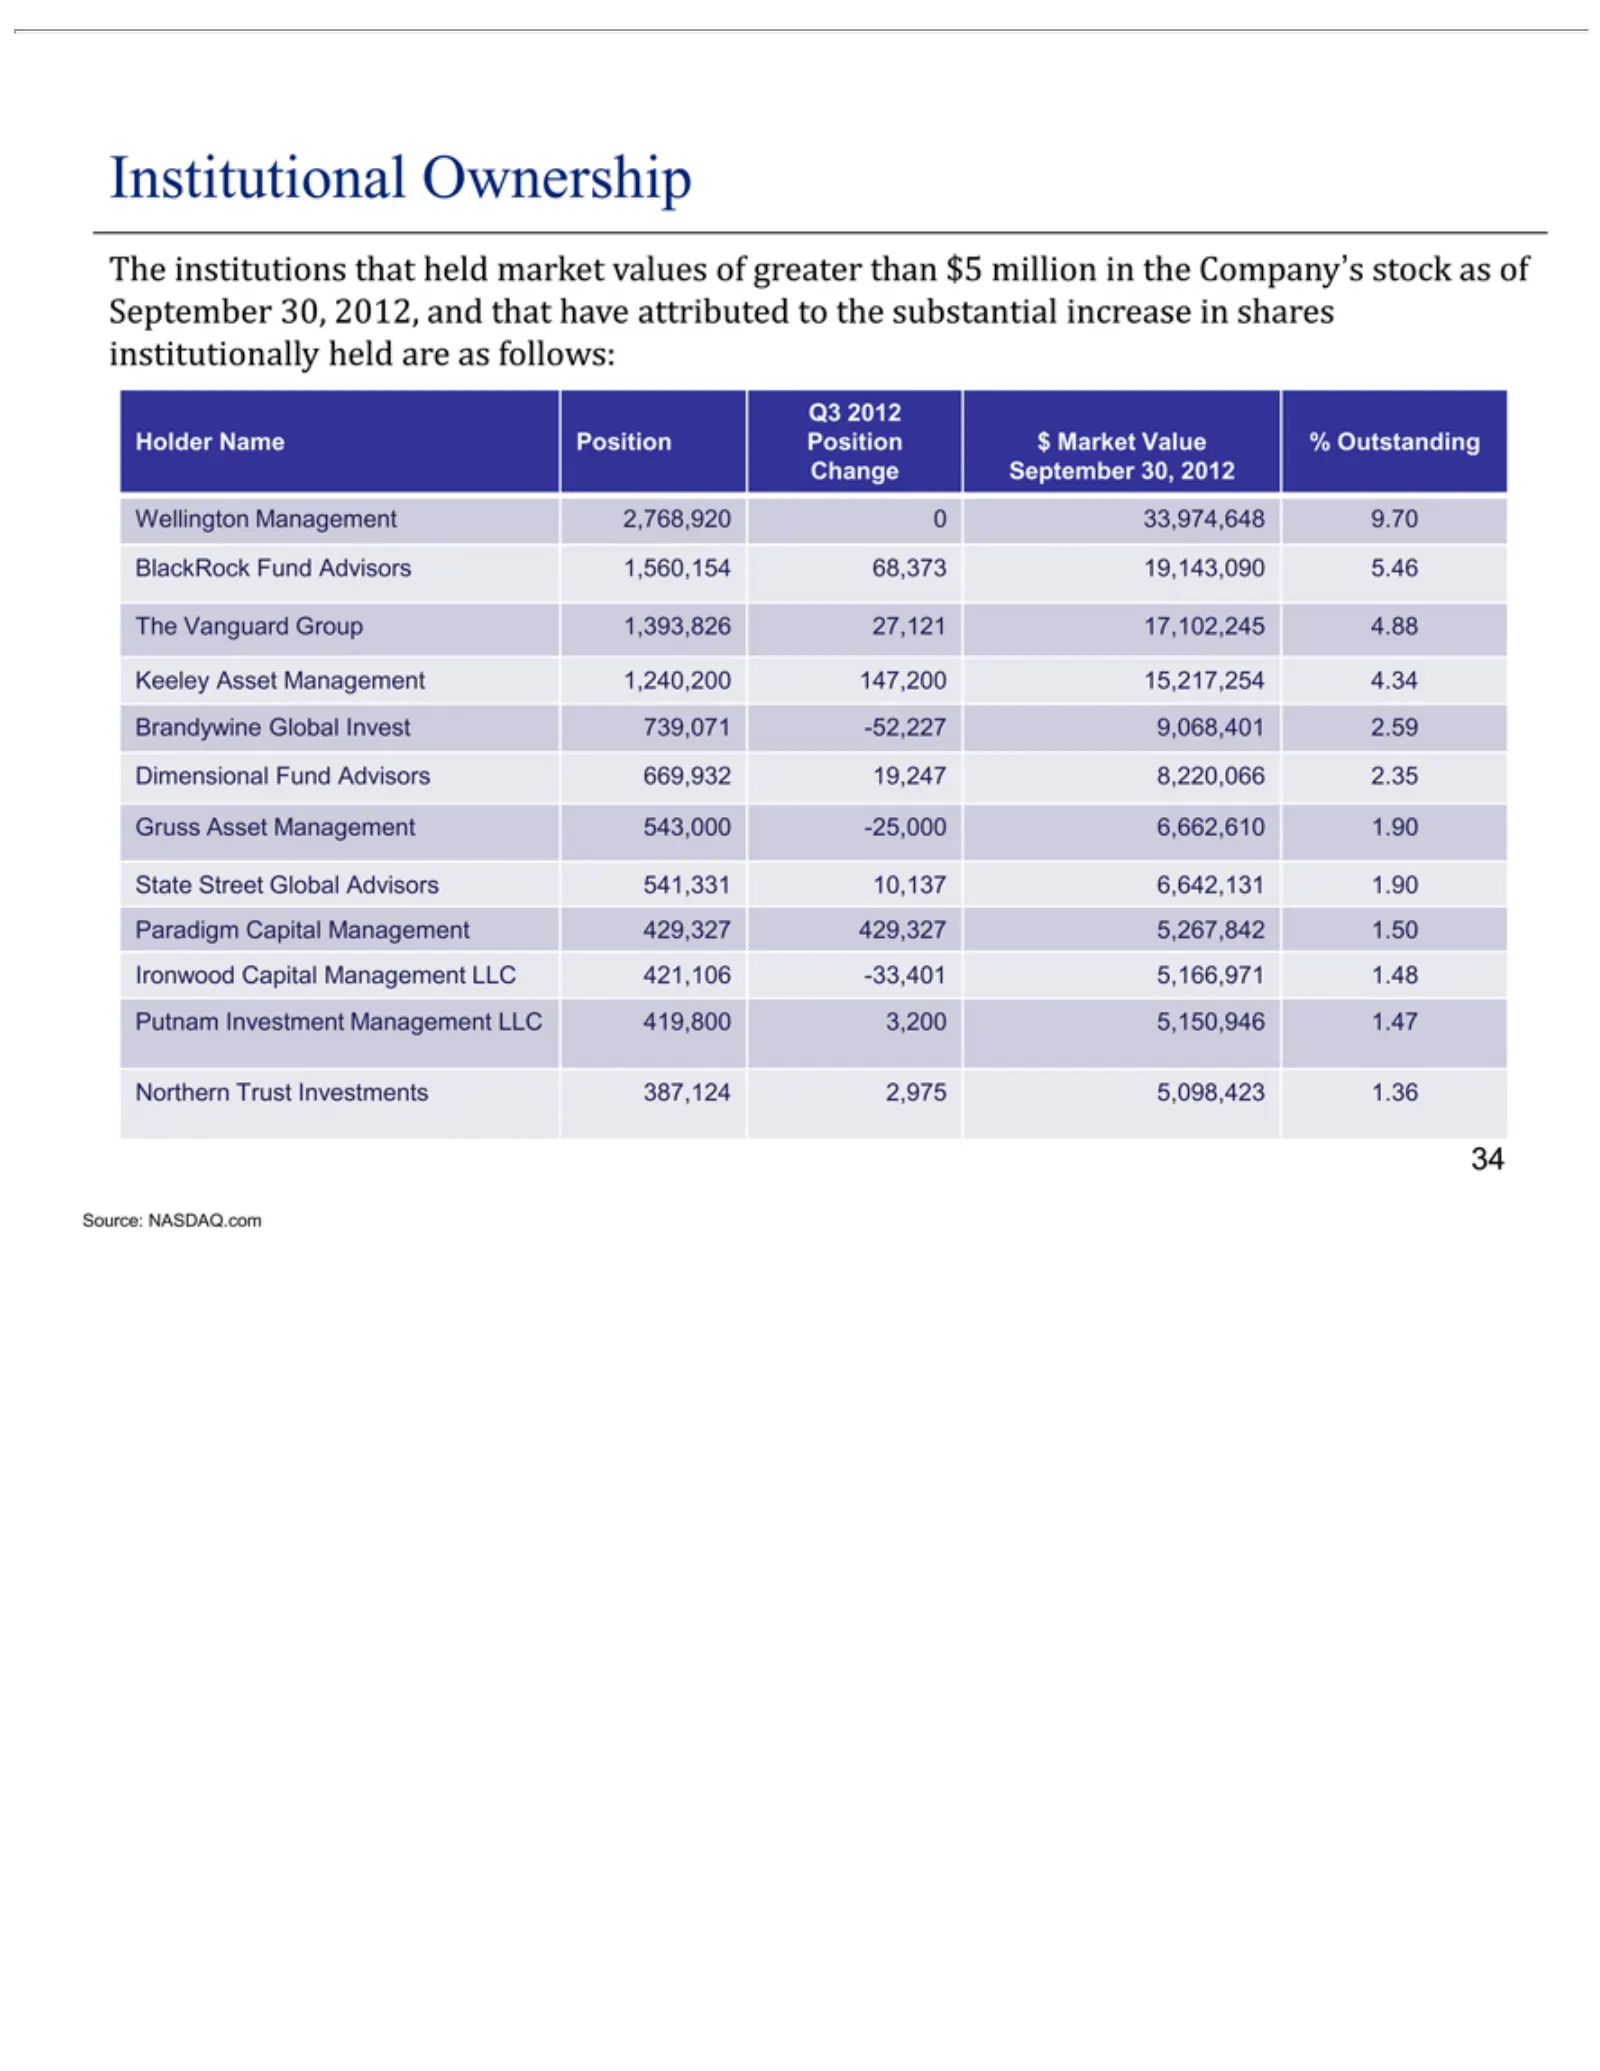
Slide 34: Significant Institutional Holders
Institutional Q3 Holder Change Wellington BlackRock The Keeley Brandywine Dimensional Gruss State Paradigm Ironwood Putnam Northern Source: 34 2012 Vanguard institutions Street Asset Asset Name NASDAQ.com September Investment Trust Capital Management Fund Global Management Ownership Global Fund Mana
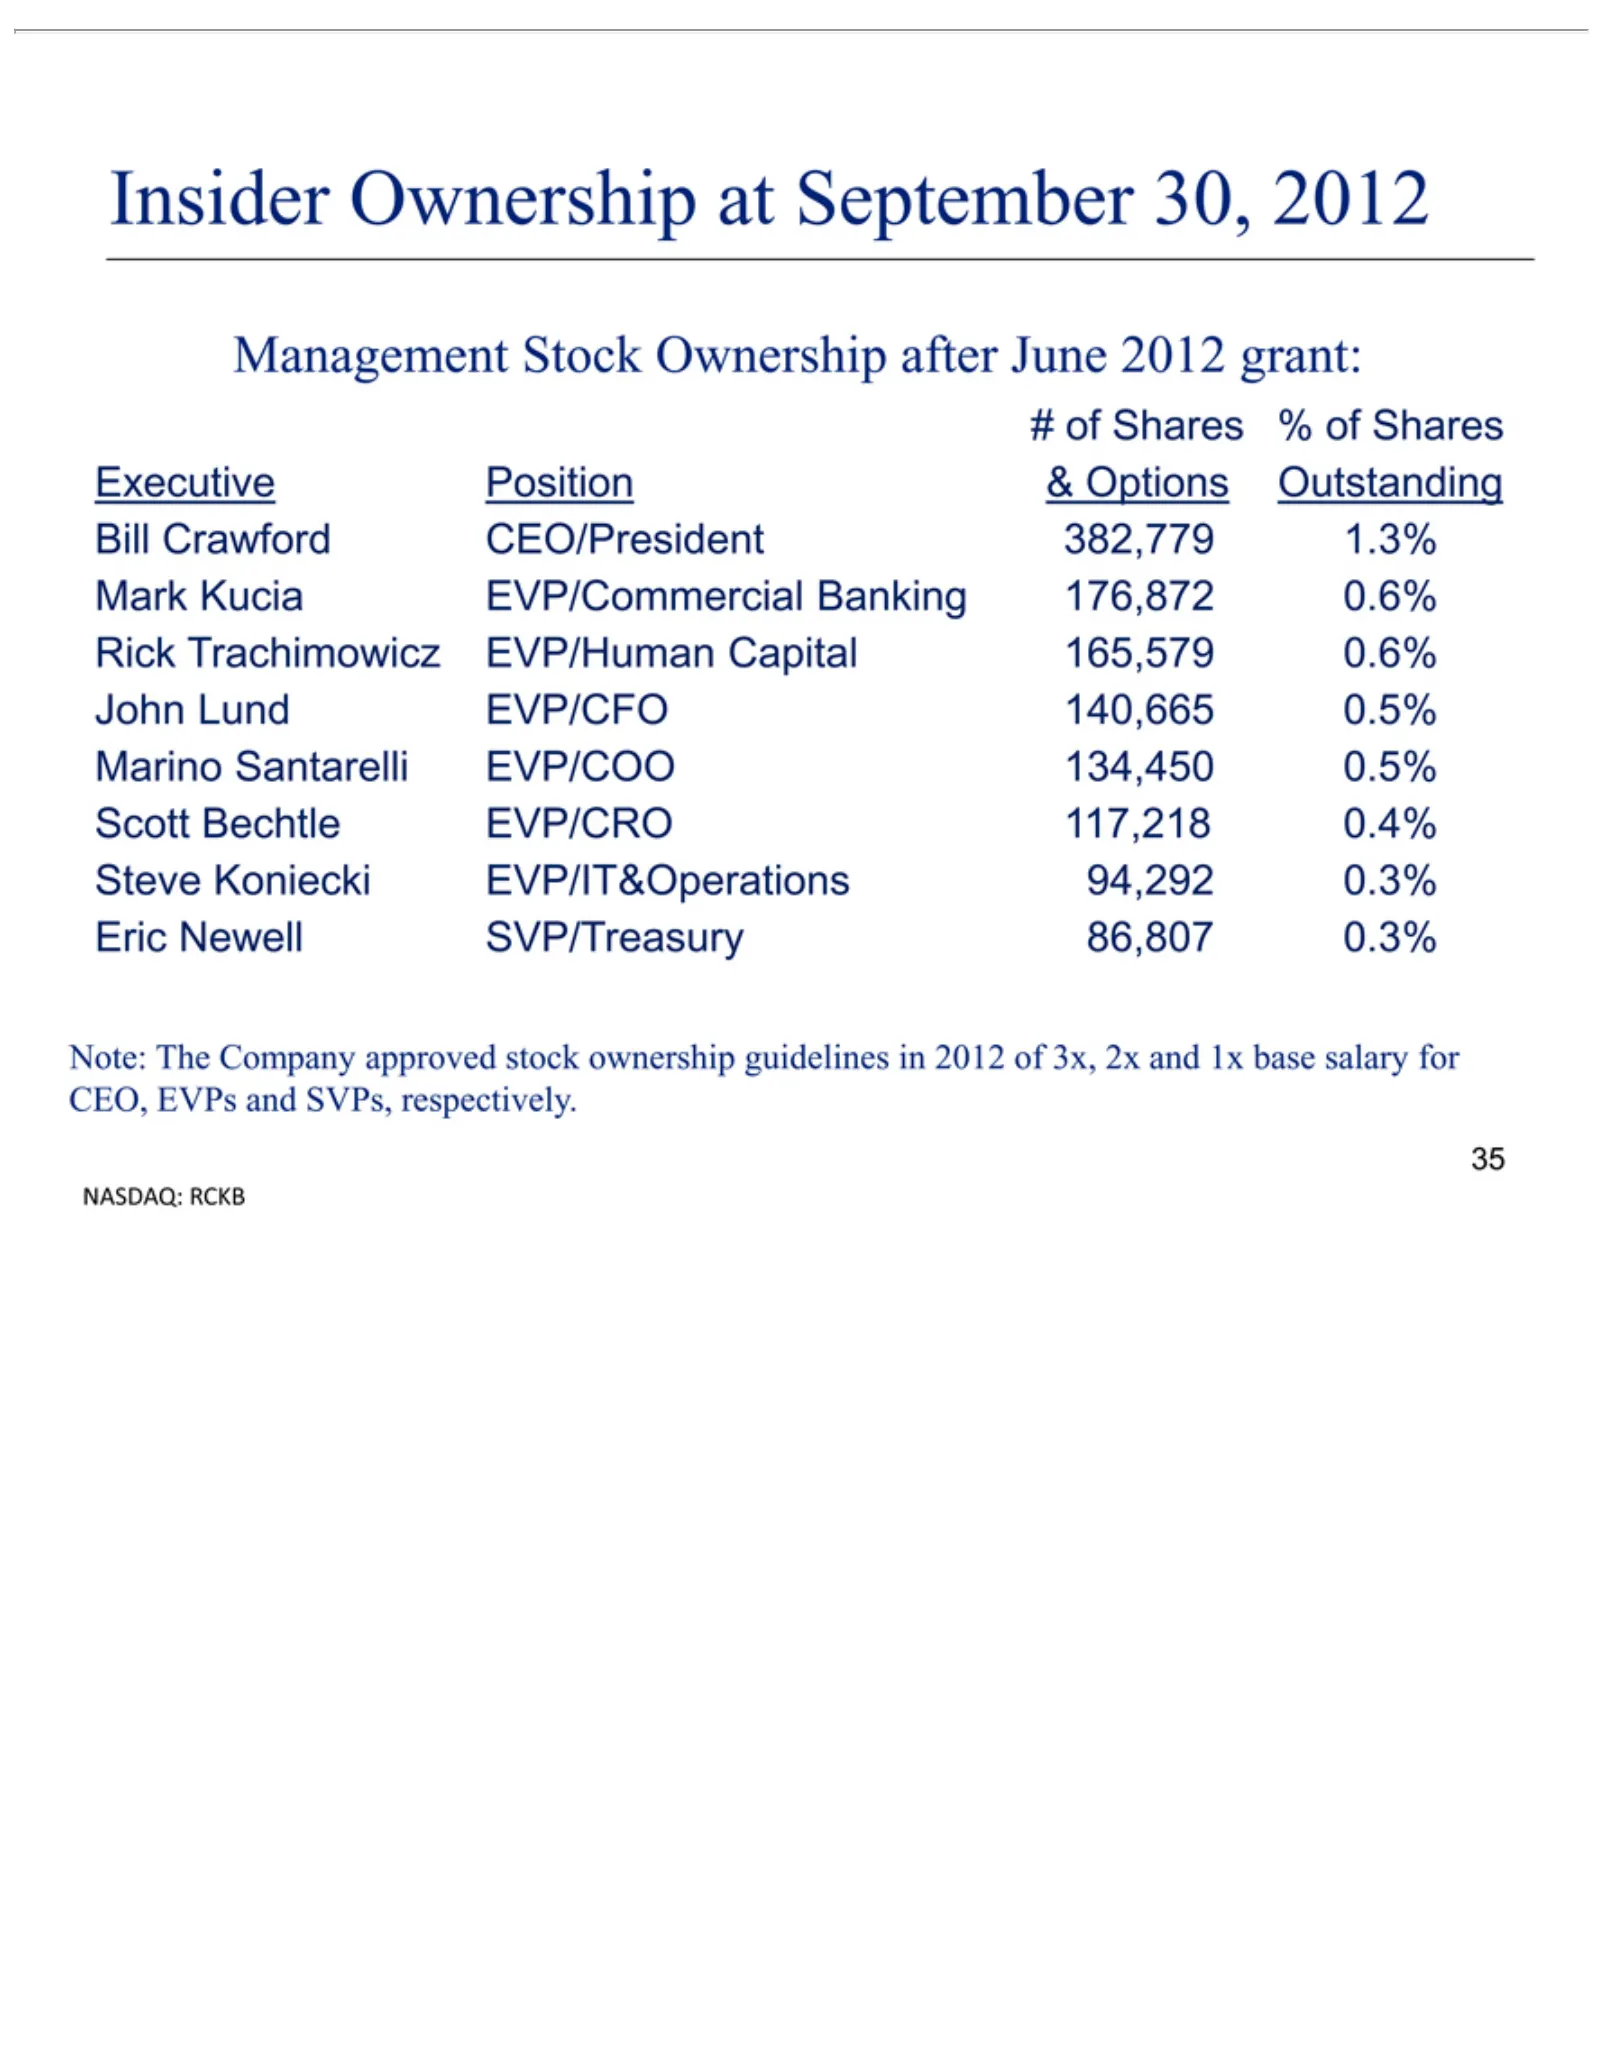
Slide 35: Insider Ownership
Insider #Management Executive Bill Mark Rick John Marino Scott Steve Eric Note: NASDAQ: 35of Crawford Shares Newell Trachimowicz Lund Bechtle Kucia The Koniecki Ownership Santarelli Position Company EVP/CFO RCKB %SVP/Treasury EVP/Commercial Stock EVP/CRO of CEO/President EVP/IT&Operations Shares EVP
Slide 36: Appendix
36 APPENDIX
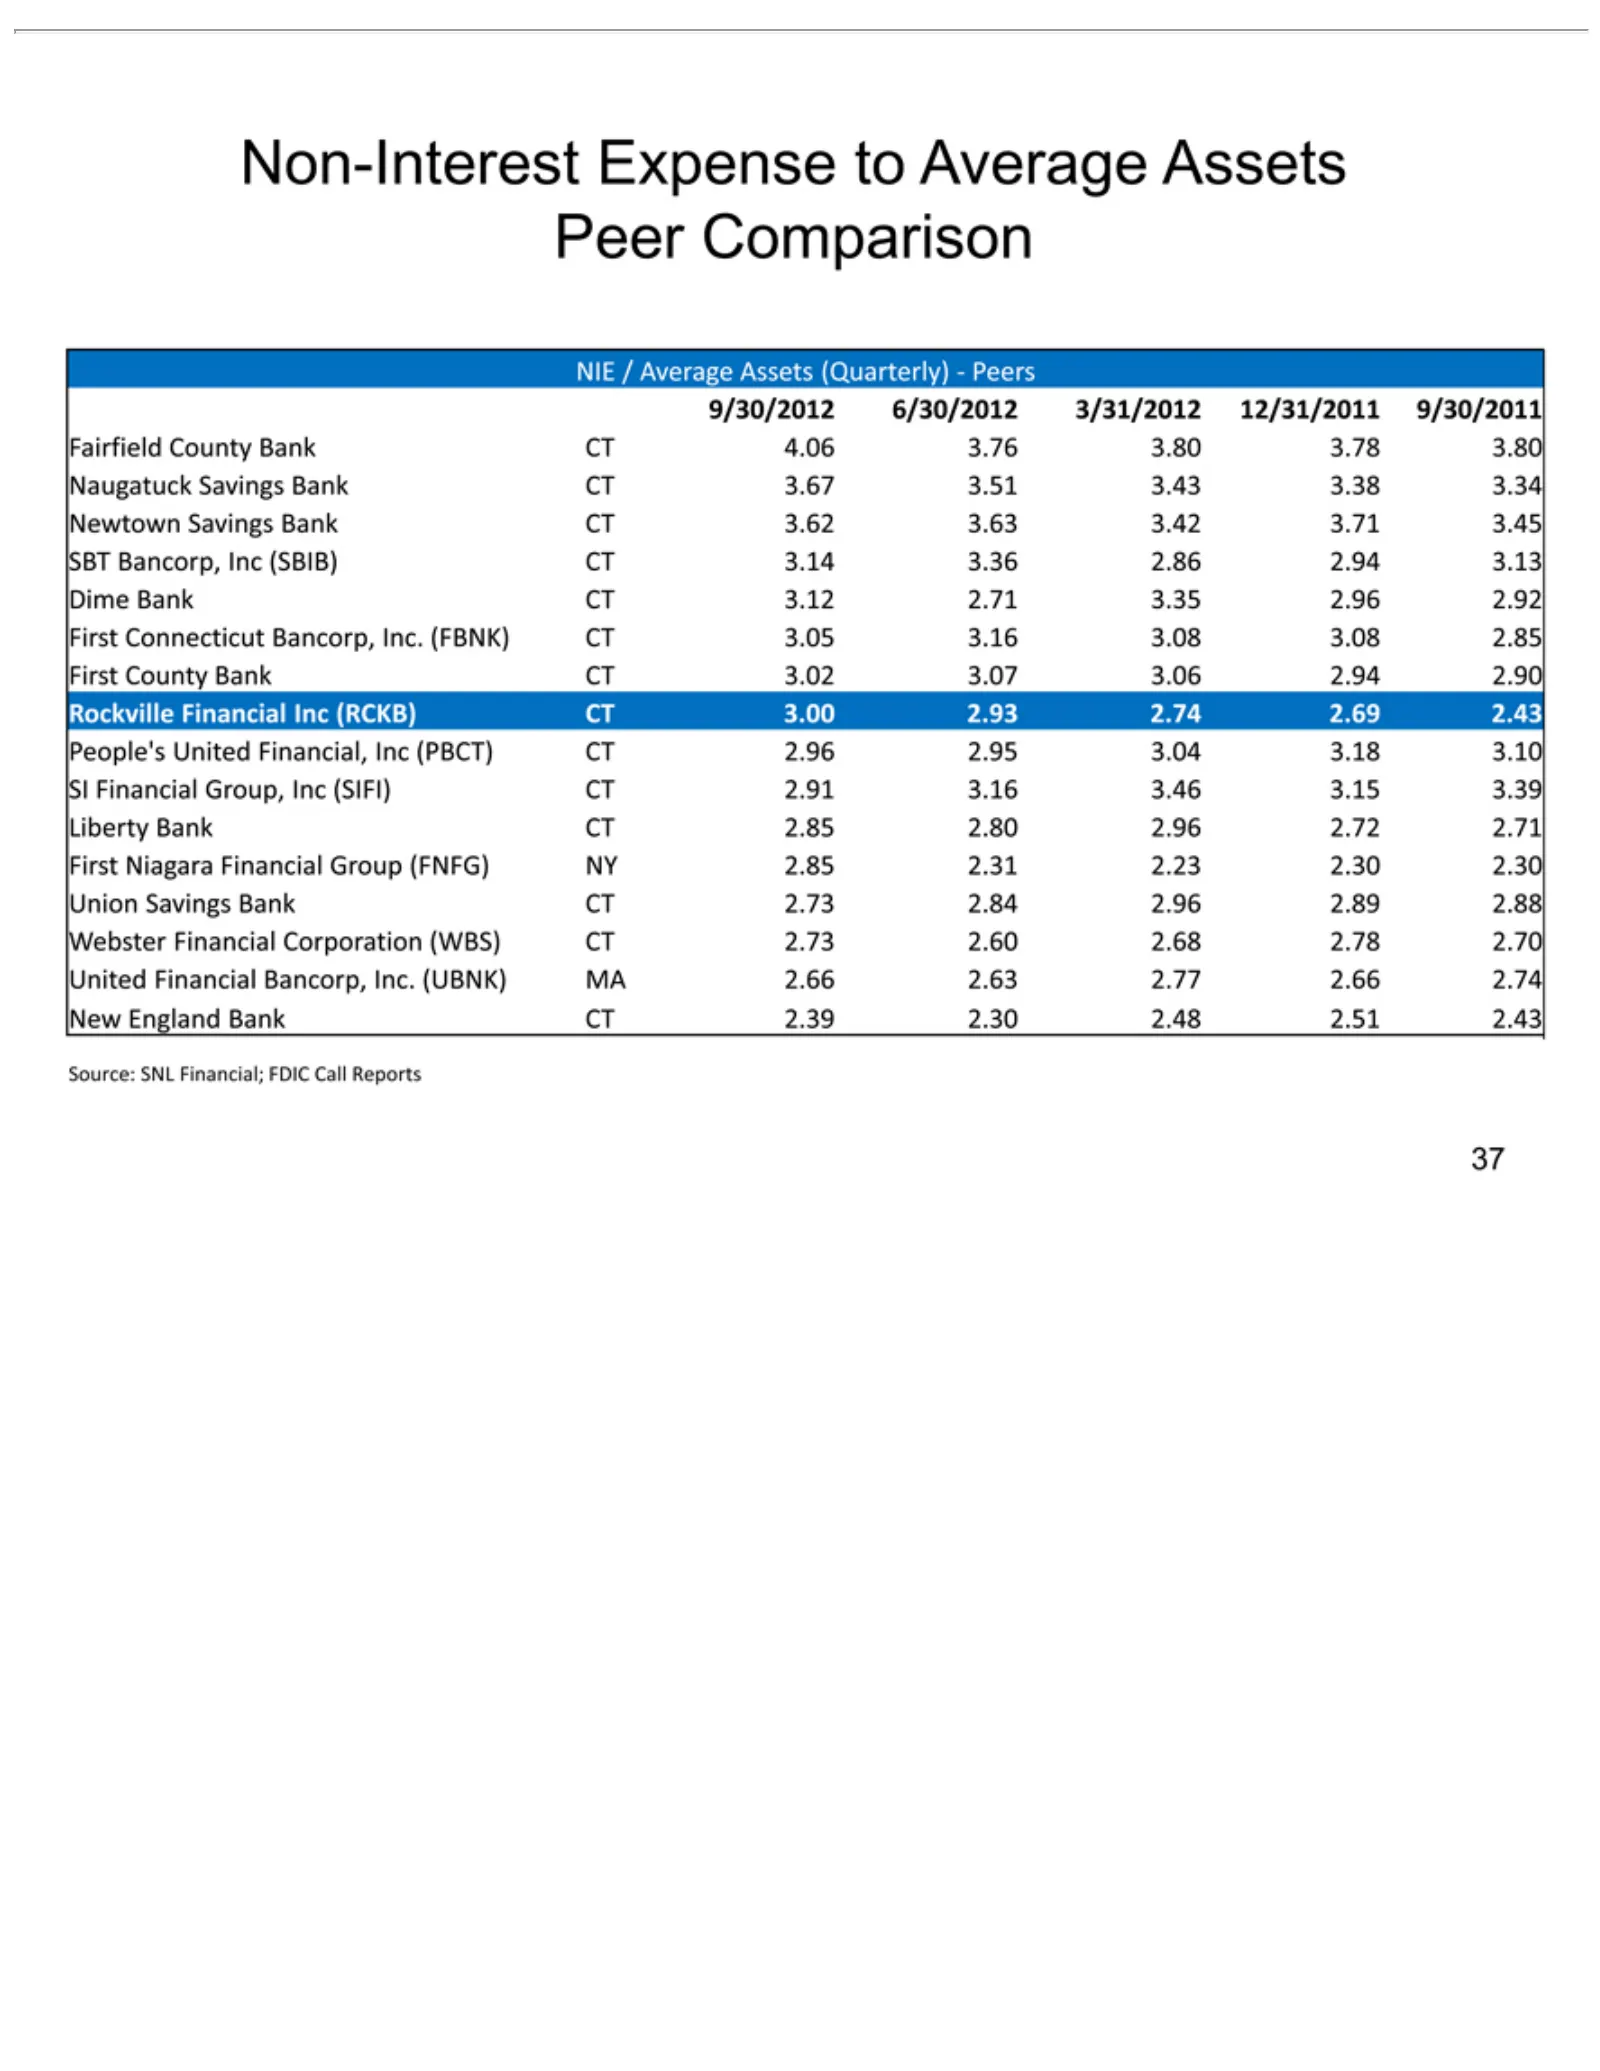
Slide 37: Non-Interest Expense to Assets Peer Comparison
Non-Interest NIE 9/30/2012 Fairfield Naugatuck Newtown SBT Dime Rockville People’s SI Liberty First Union Webster United New Source: 37 Financial /Bancorp, Connecticut County Niagara England Average Bank Savings Financial Bank SNL Financial United County Savings Financial 6/30/2012 Savings CT Group,
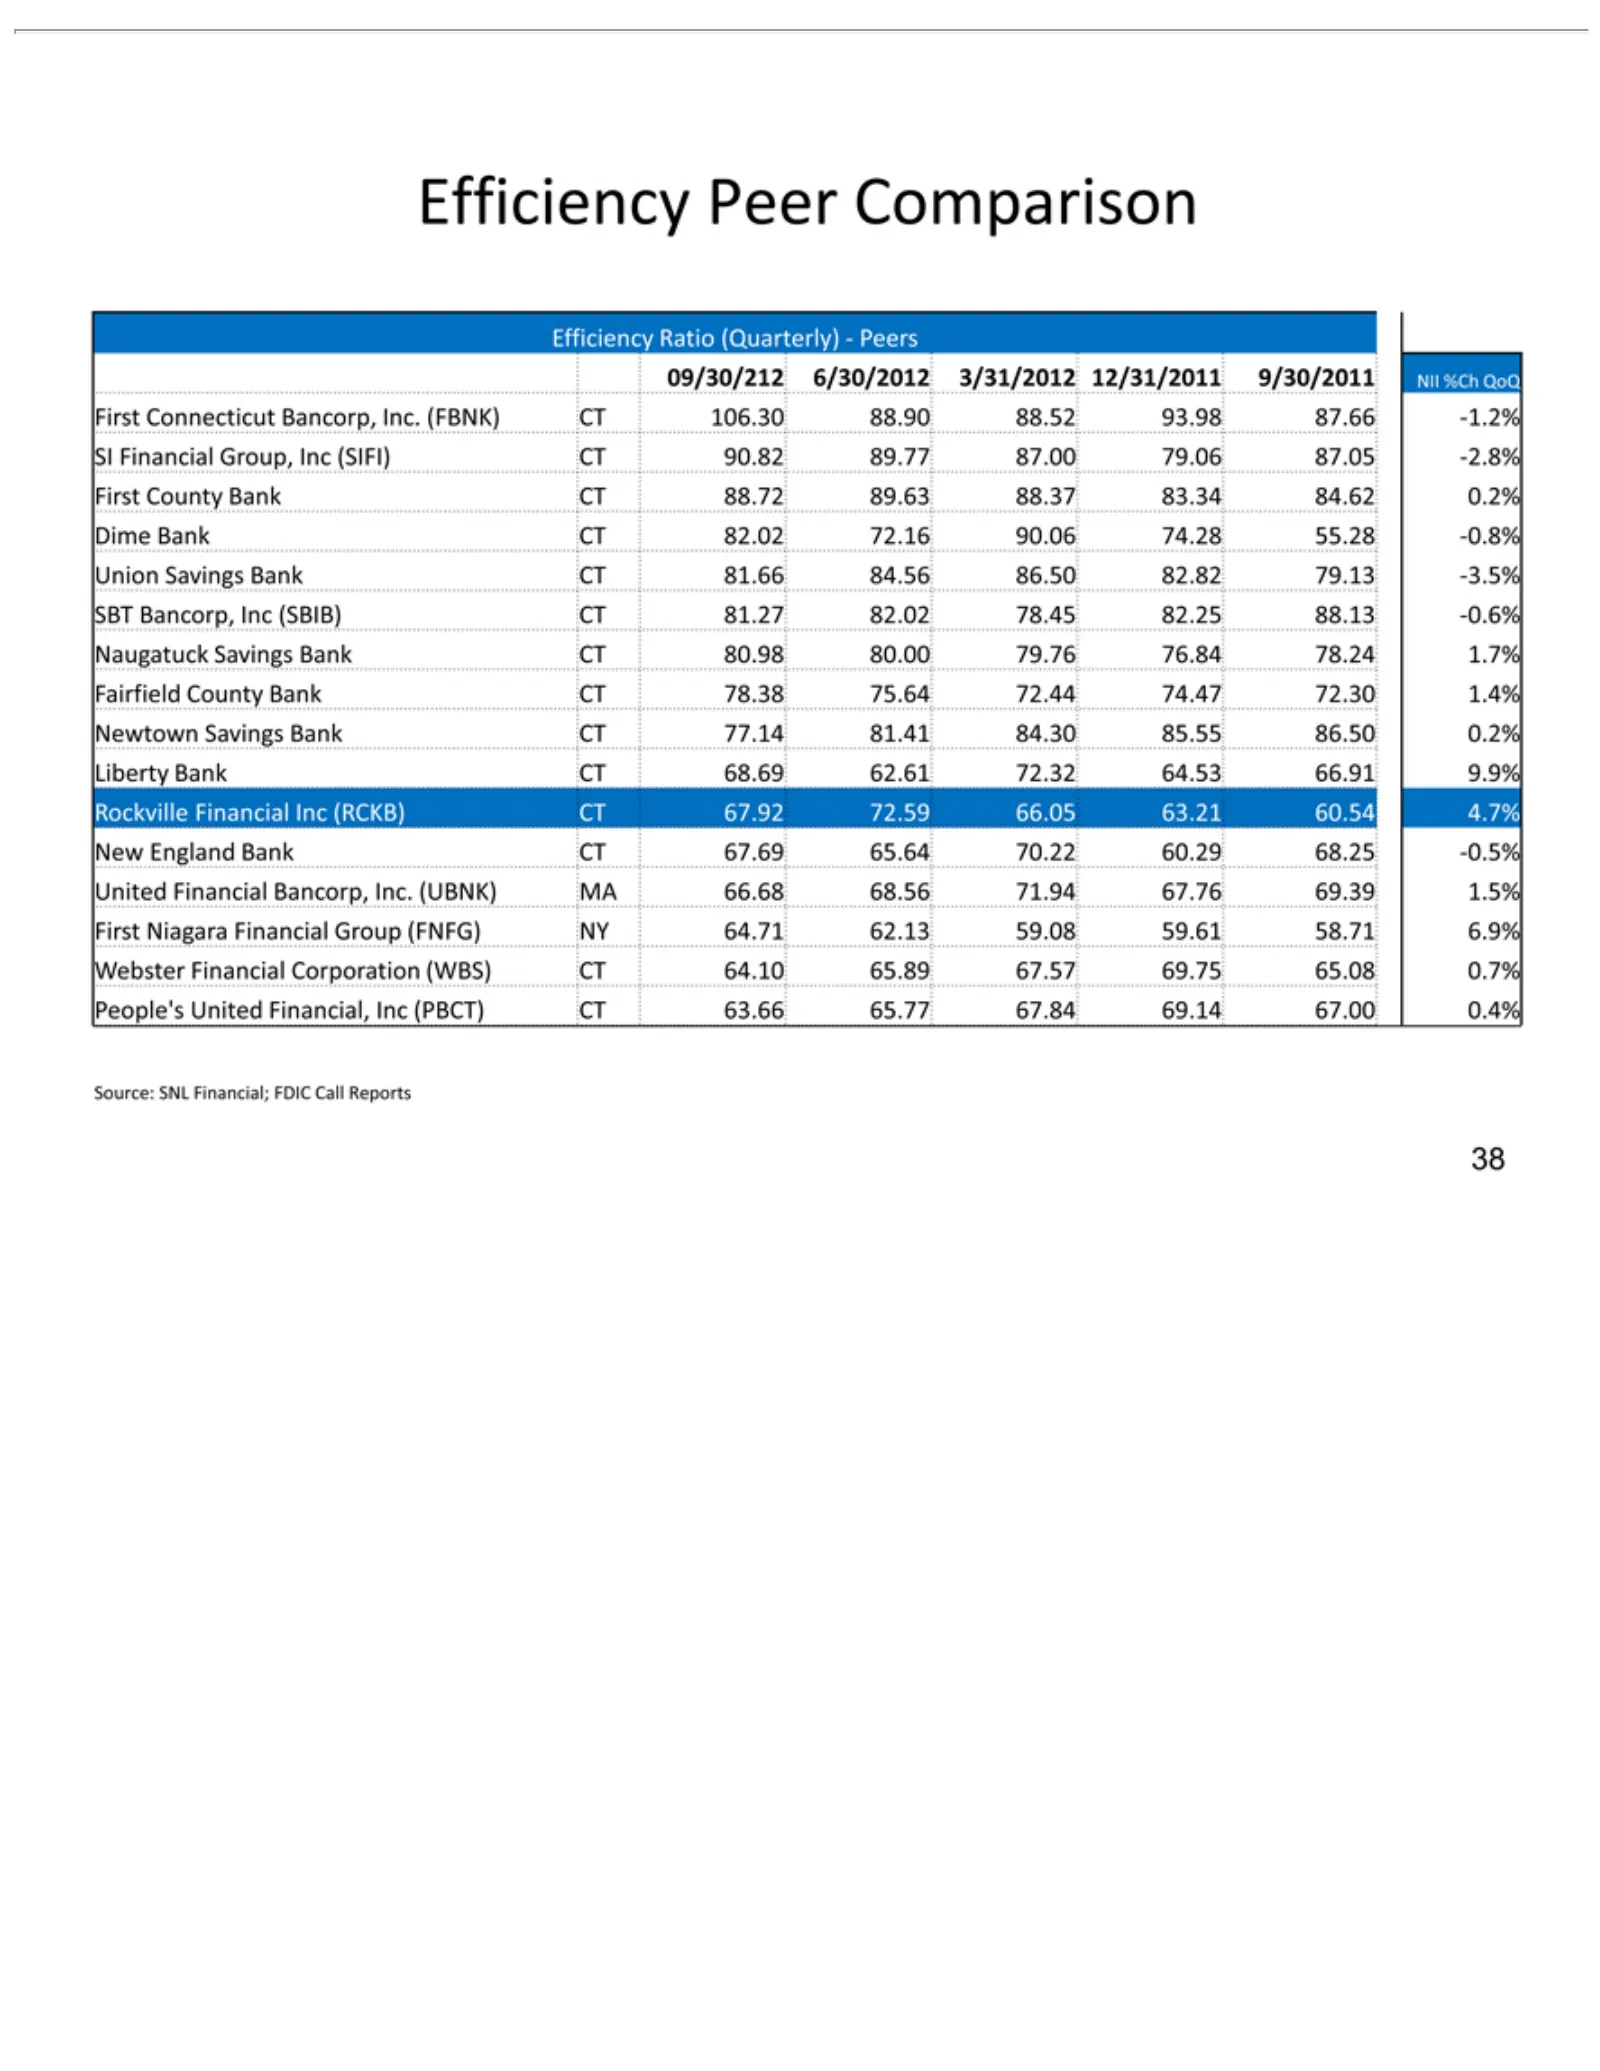
Slide 38: Efficiency Ratio Peer Comparison
Efficiency 09/30/212 SI Dime Union SBT Naugatuck Fairfield Newtown Liberty Rockville New United First Webster People’s Source: 38 Financial Bancorp, Connecticut County Niagara England Bank Savings Financial Bank SNL Financial United County Savings Financial 6/30/2012 Peer Ratio Savings CT Group, Ban
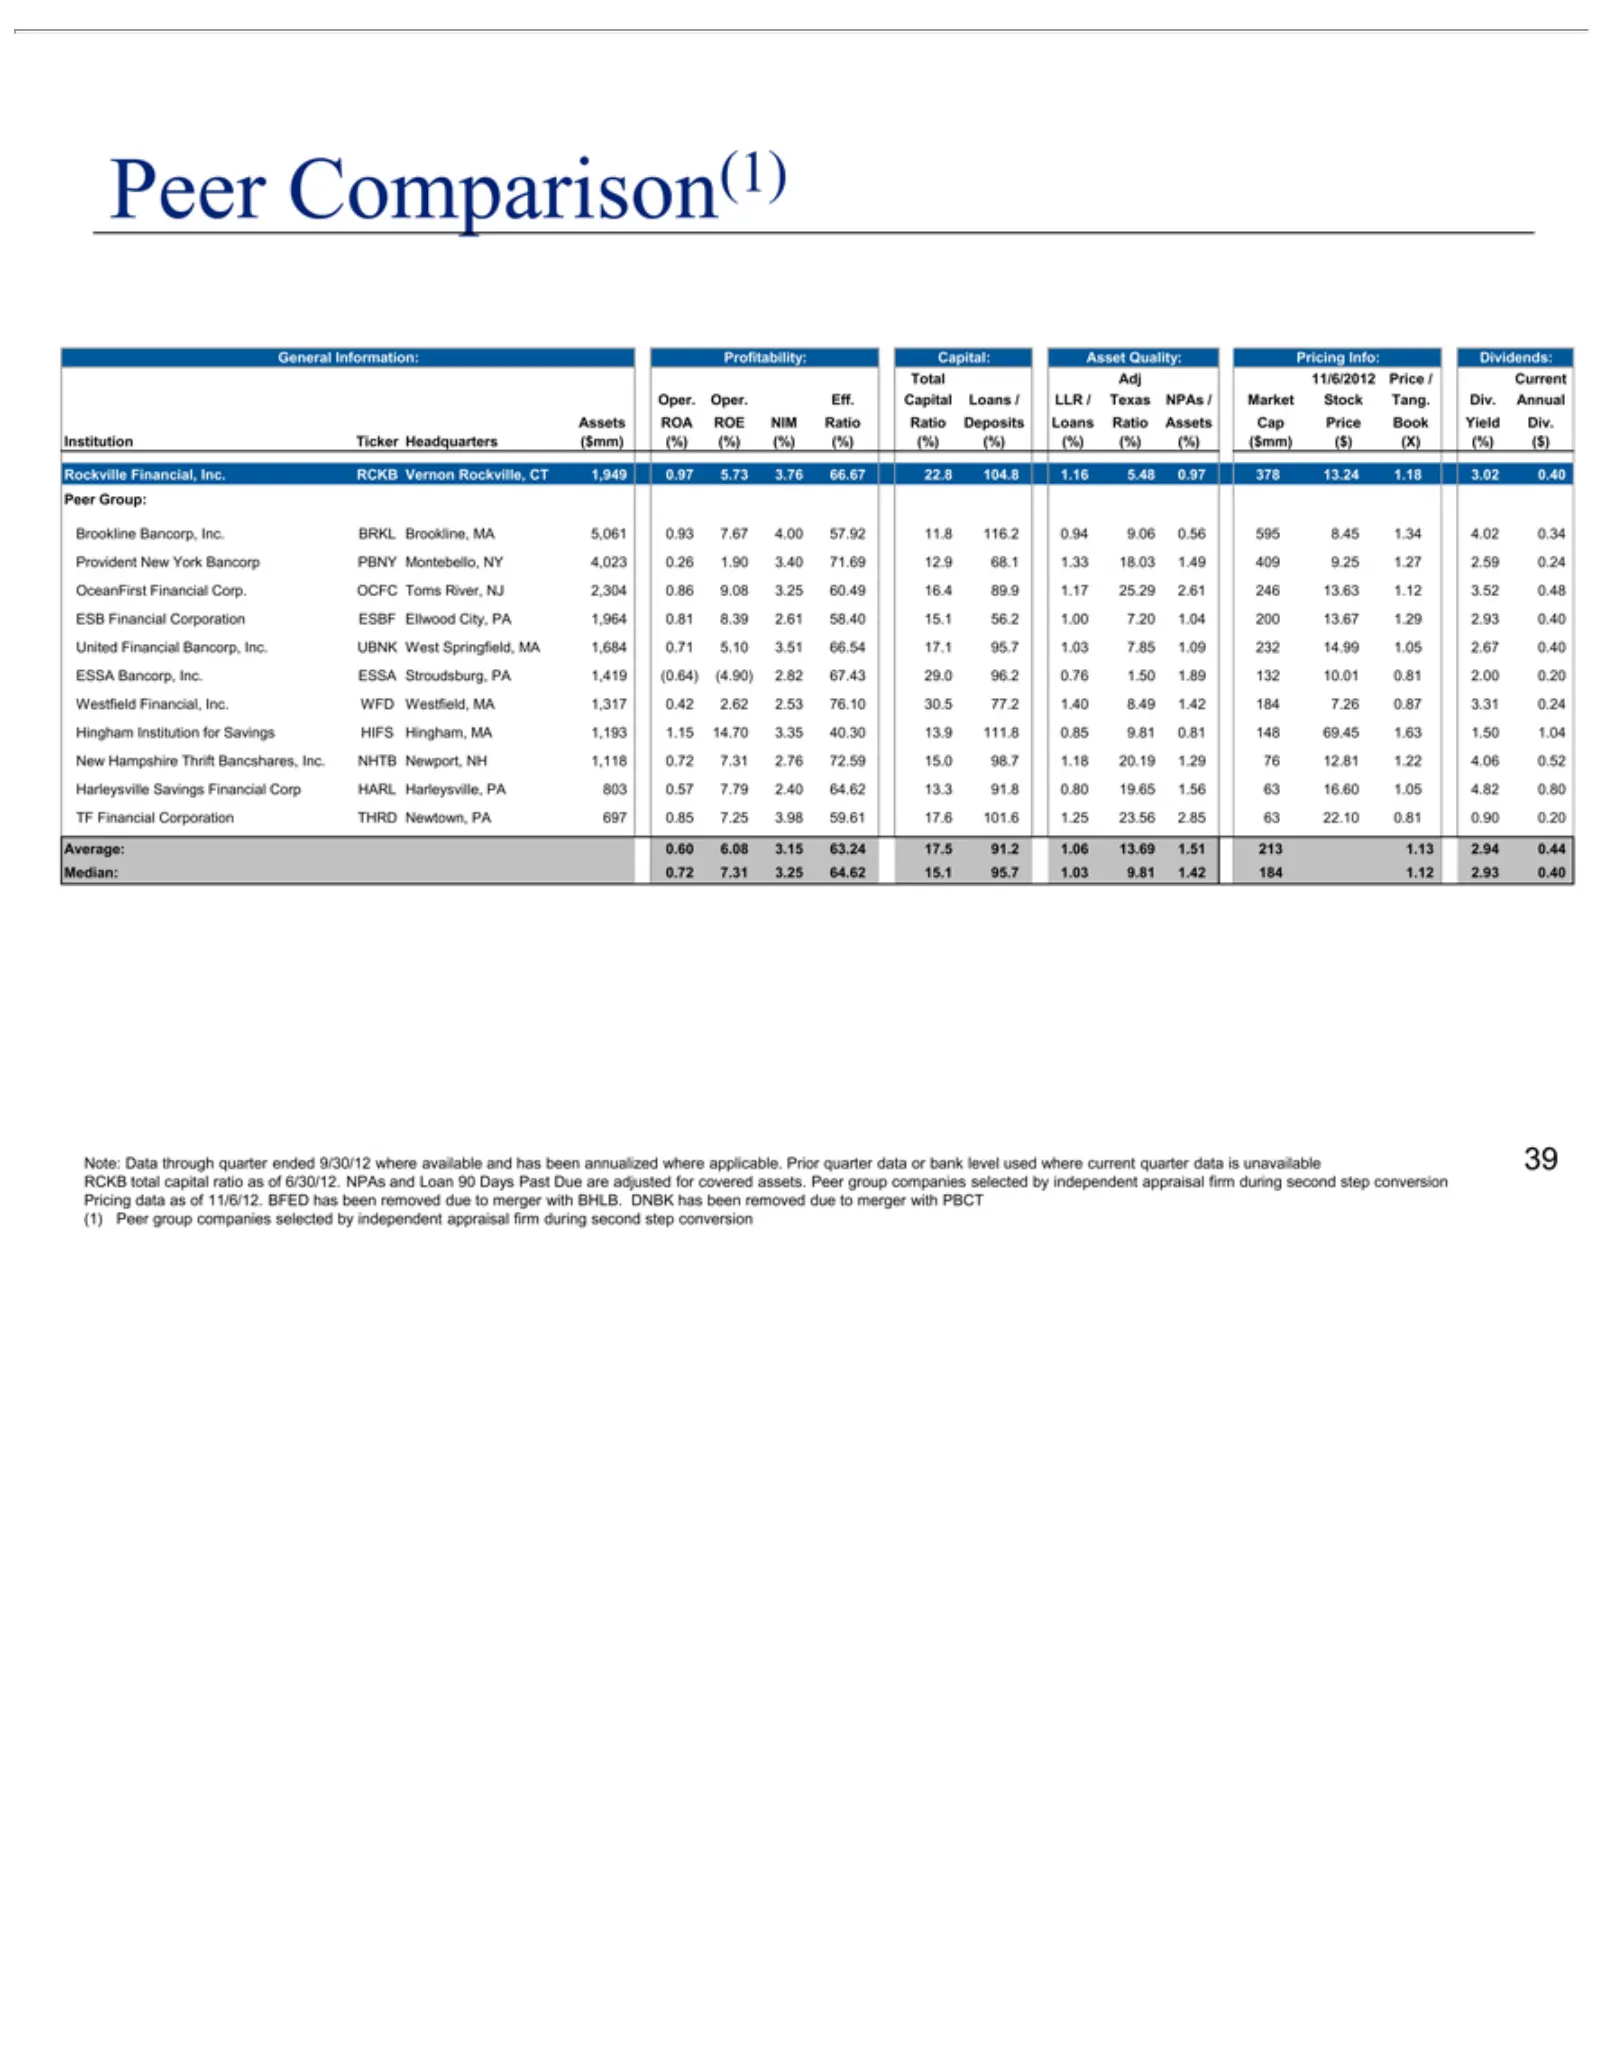
Slide 39: General Financial Information: Peer Group Comparison
General Total Oper. Assets Institution Rockville Peer Brookline Provident OceanFirst ESB United ESSA Westfield Hingham New Harleysville TF Average: Median: Note: RCKB 11/6/12. (1) 39 Financial Comparison(1) Group: Financial Hampshire Adj Oper. Data Bancorp, ROA Financial total Information: Peer BFED
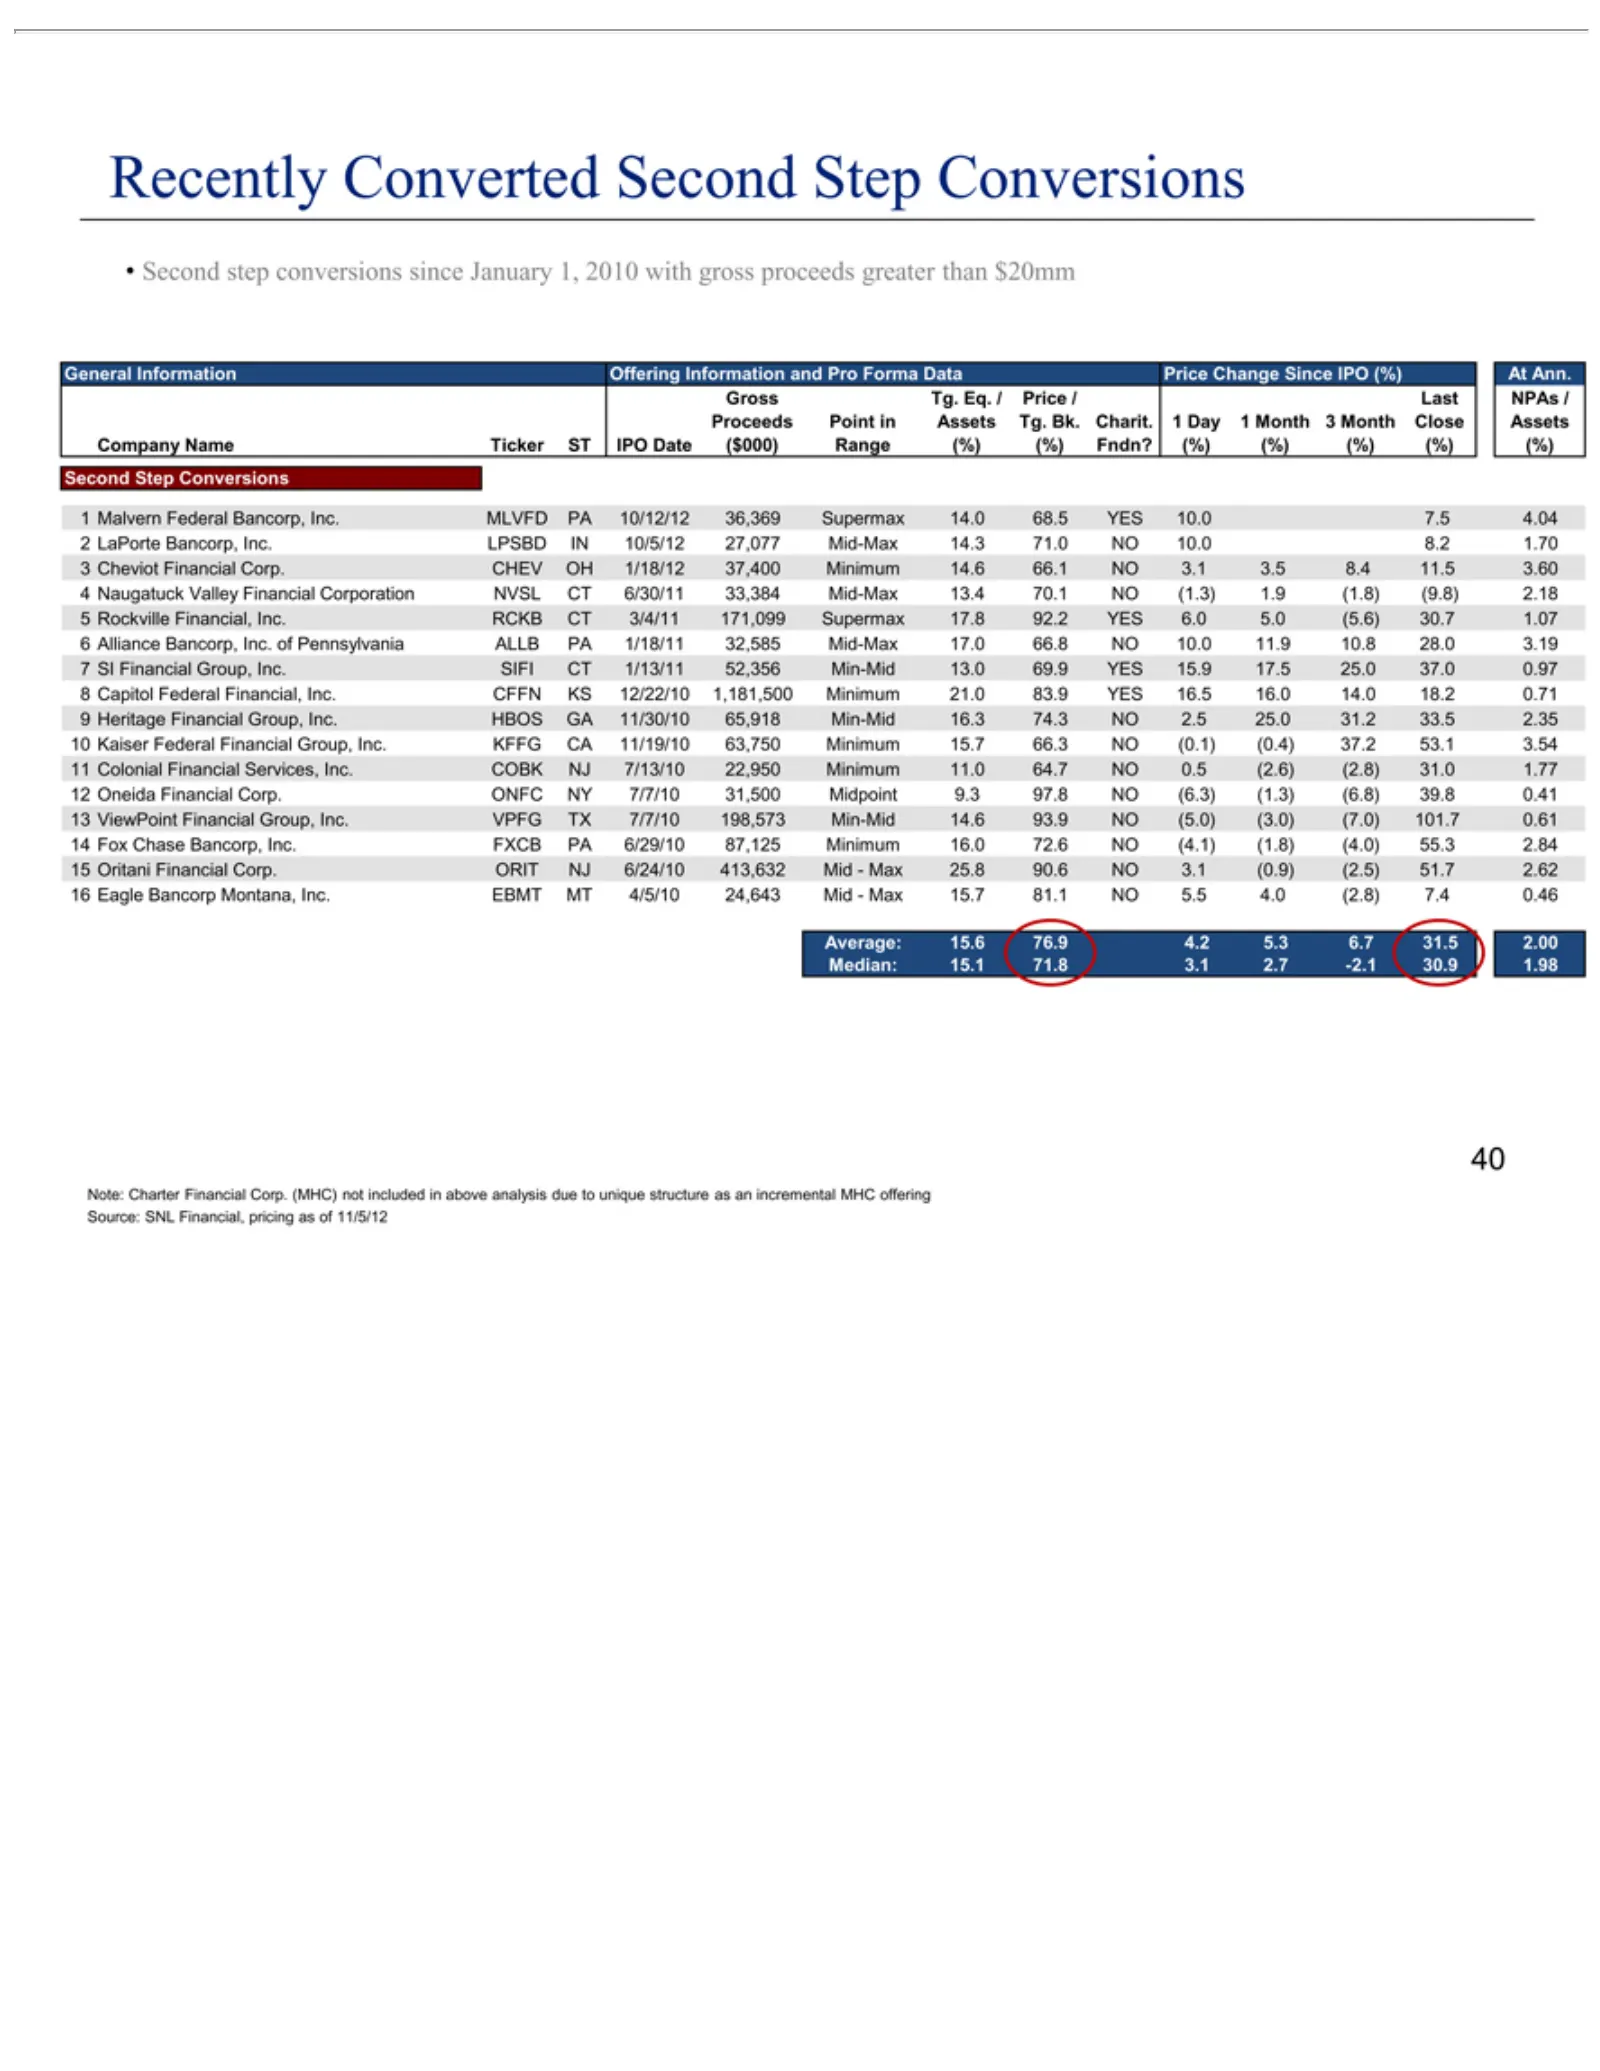
Slide 40: Recently Converted Second Step Conversions
Recently General Gross Proceeds Company 987654321Second 10 11 12 13 14 15 16 Average: Median: Note: 40 Alliance Malvern LaPorte Cheviot Naugatuck Rockville SI Capitol Heritage Colonial ViewPoint Kaiser Oneida Fox Oritani Eagle Financial Charter Tg. Chase step Step Information 15.1 Bancorp Converted
Source: SEC EDGAR · 8-K filed Dec 17, 2012
More decks from United Financial Bancorp Inc
 Merger or Acquisition (July 2019)10 slides · Jul 15, 2019
 Shareholder Meeting (May 2019)14 slides · May 13, 2019
 Q1 2019 Earnings Presentation27 slides · Apr 16, 2019
 Q4 2018 Earnings Presentation26 slides · Jan 22, 2019
 Q3 2018 Earnings Presentation25 slides · Oct 16, 2018
 Q2 2018 Earnings Presentation25 slides · Jul 17, 2018