Hammerson plc · LSE:HMSO
Hammerson — Investor Day (November 2015)
97 slides from Hammerson's investor day presentation, Nov 13, 2015

Slide 1: Capital Markets Day 2015
Capital Markets Day 2015 13th November 2015
Slide 2: Today's agenda
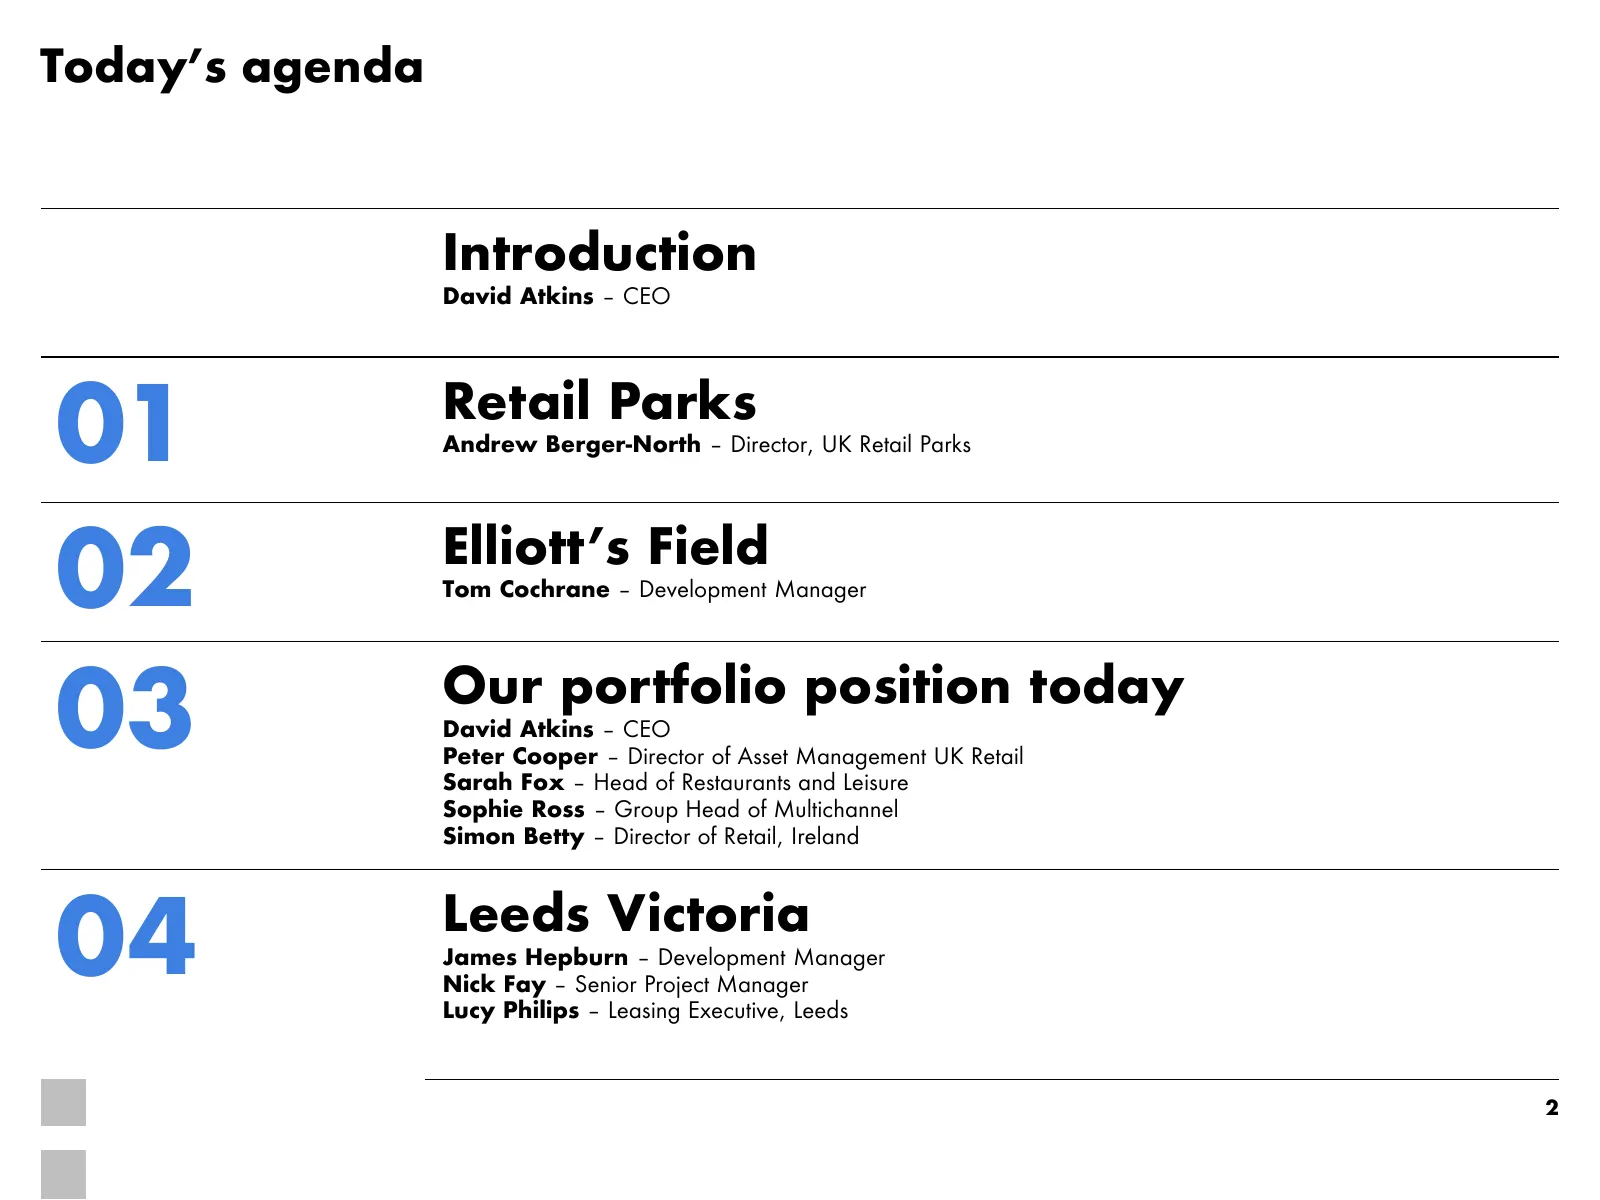
Today’s agenda Introduction David Atkins – CEO 01 Retail Parks Andrew Berger-North – Director, UK Retail Parks 02 Elliott’s Field Tom Cochrane – Development Manager 03 Our portfolio position today David Atkins – CEO Peter Cooper – Director of Asset Management UK Retail Sarah Fox – Head of Restaurant
Slide 3: We create desirability
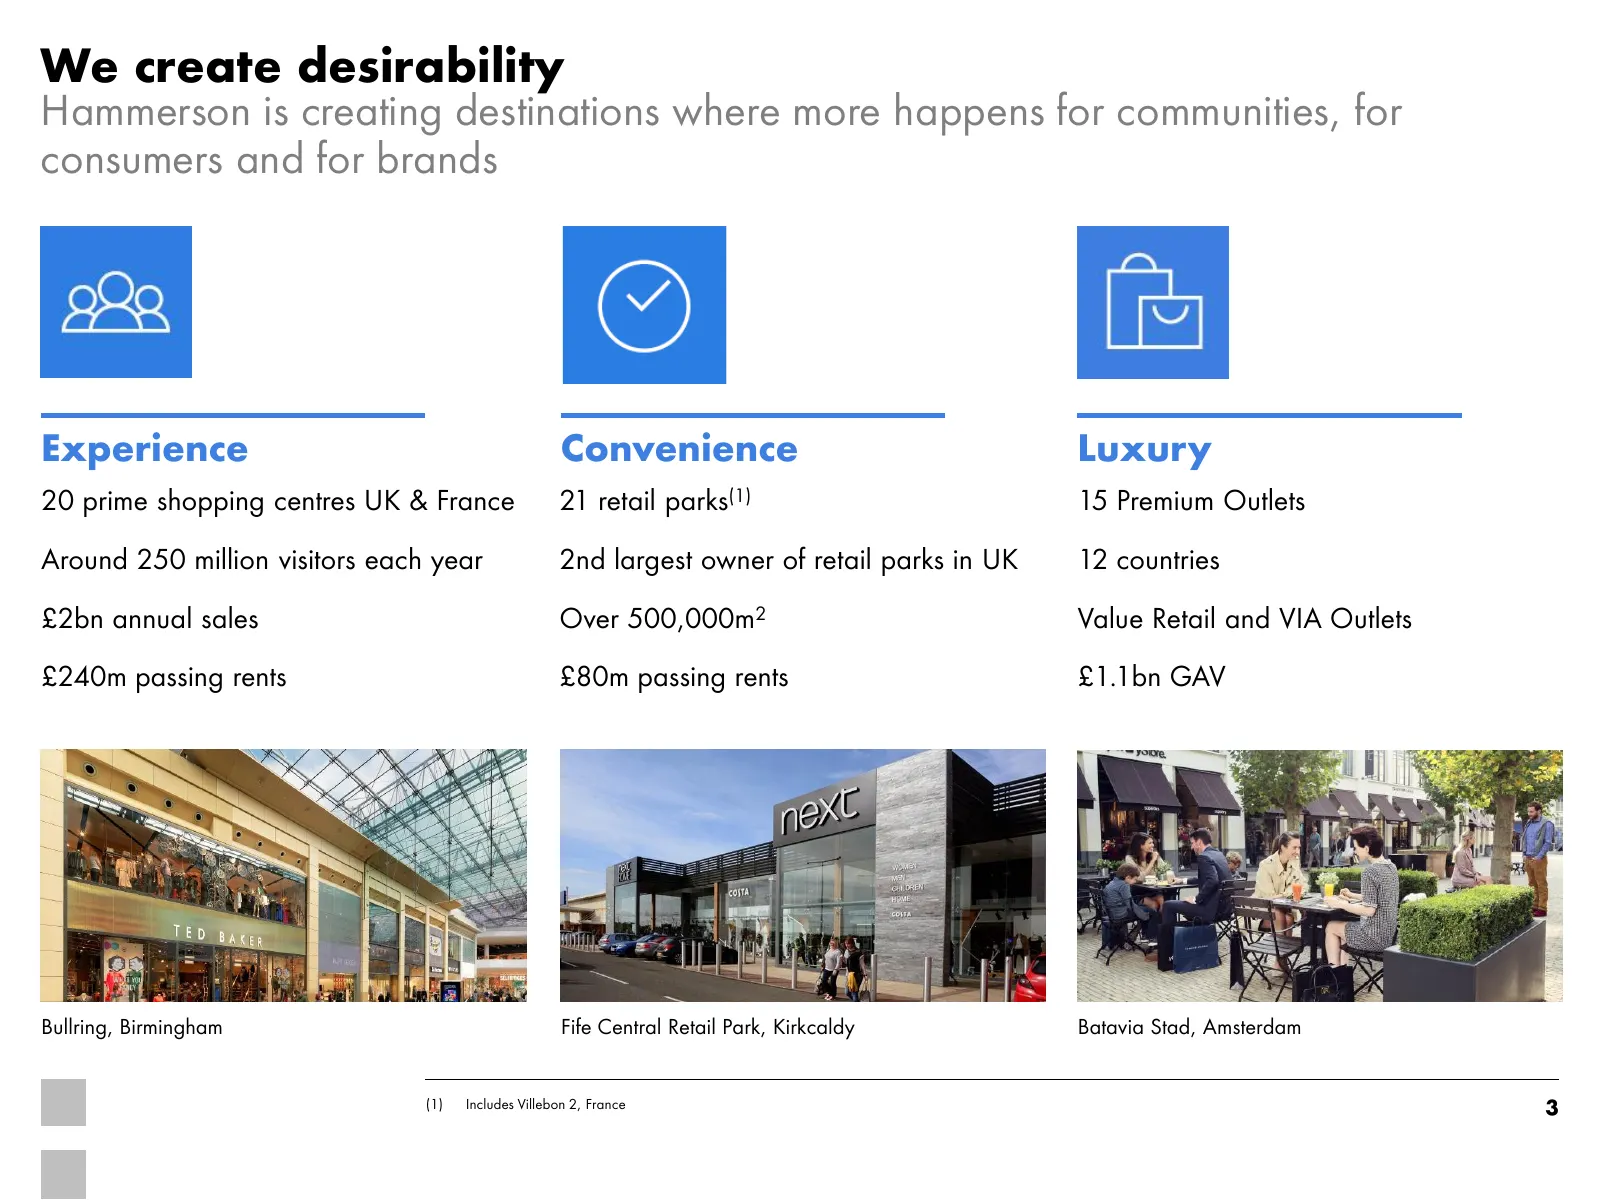
We create desirability Hammerson is creating destinations where more happens for communities, for consumers and for brands Experience Convenience Luxury 20 prime shopping centres UK & France 21 retail parks(1) 15 Premium Outlets Around 250 million visitors each year 2nd largest owner of retail parks
Slide 4: Retail parks
01 Retail parks Andrew Berger-North Director, UK retail parks 4
Slide 5: Retail parks: a major strength within our portfolio
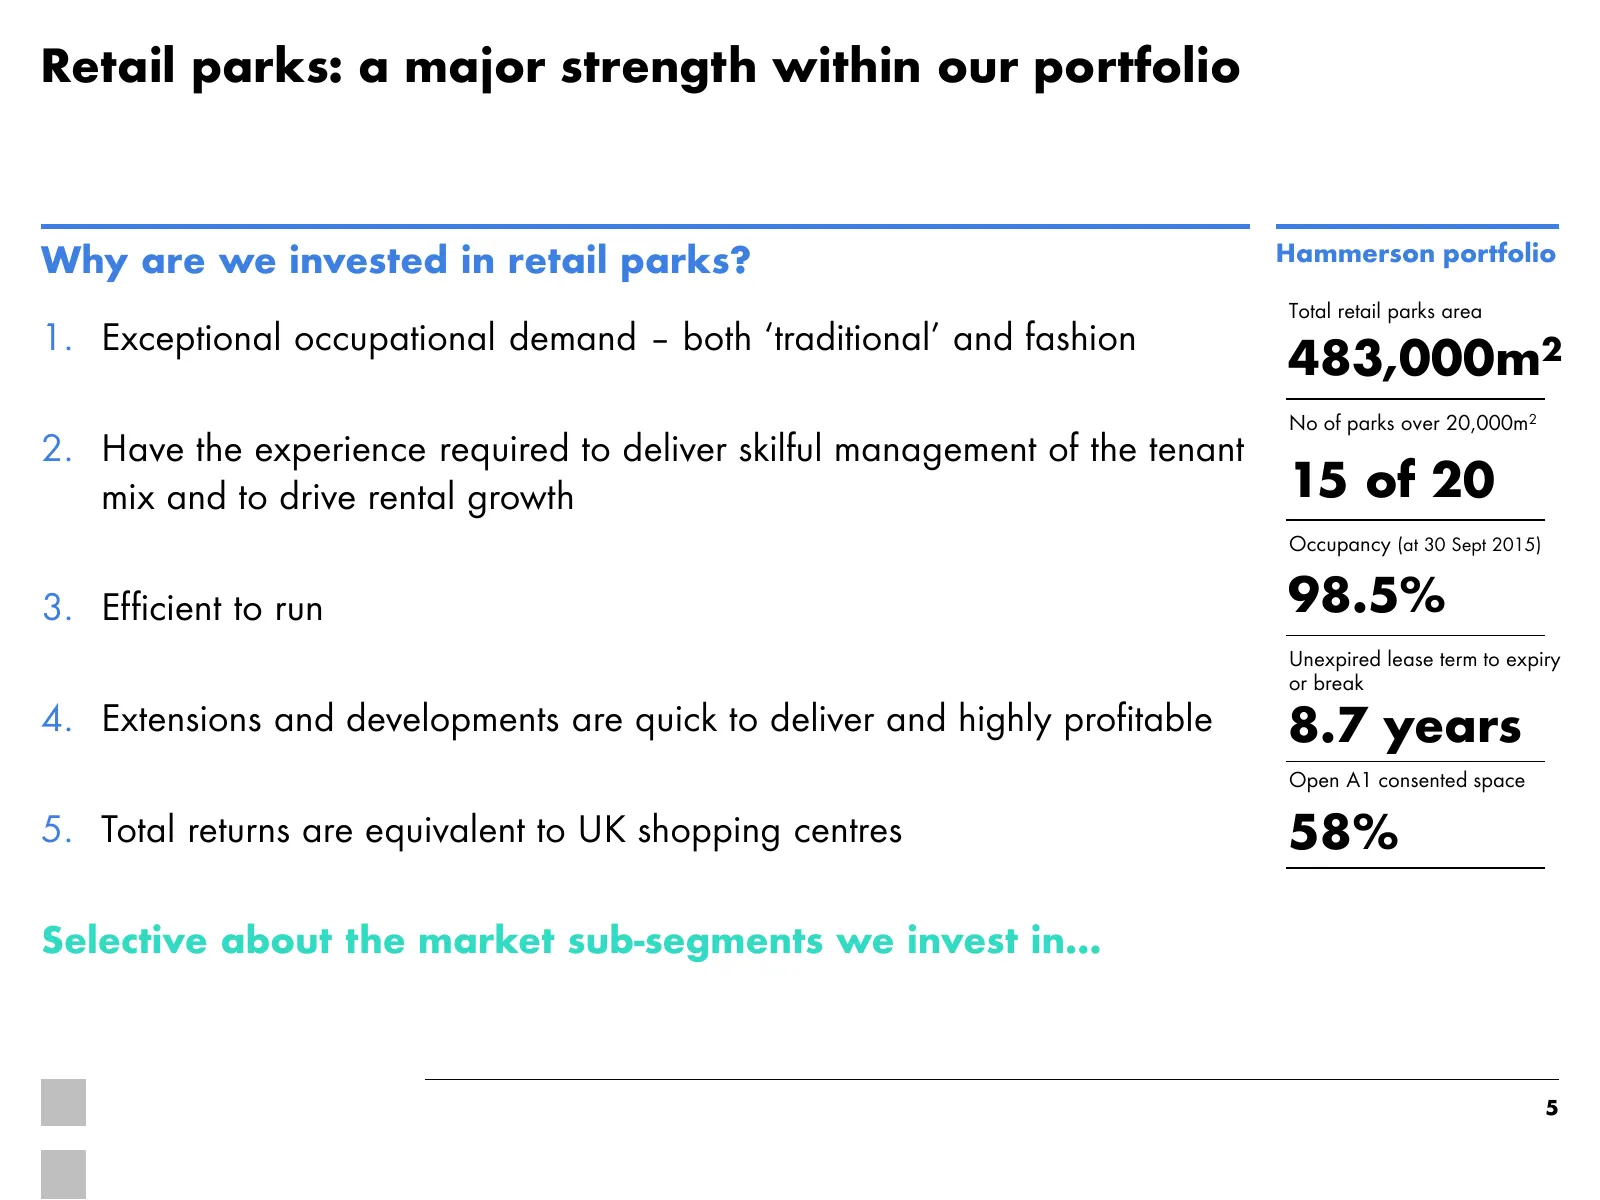
Retail parks: a major strength within our portfolio Why are we invested in retail parks? Hammerson portfolio Total retail parks area 1. Exceptional occupational demand – both ‘traditional’ and fashion 483,000m2 No of parks over 20,000m2 2. Have the experience required to deliver skilful management o
Slide 6: Retail parks are not all the same…the market has a number of sub-segments
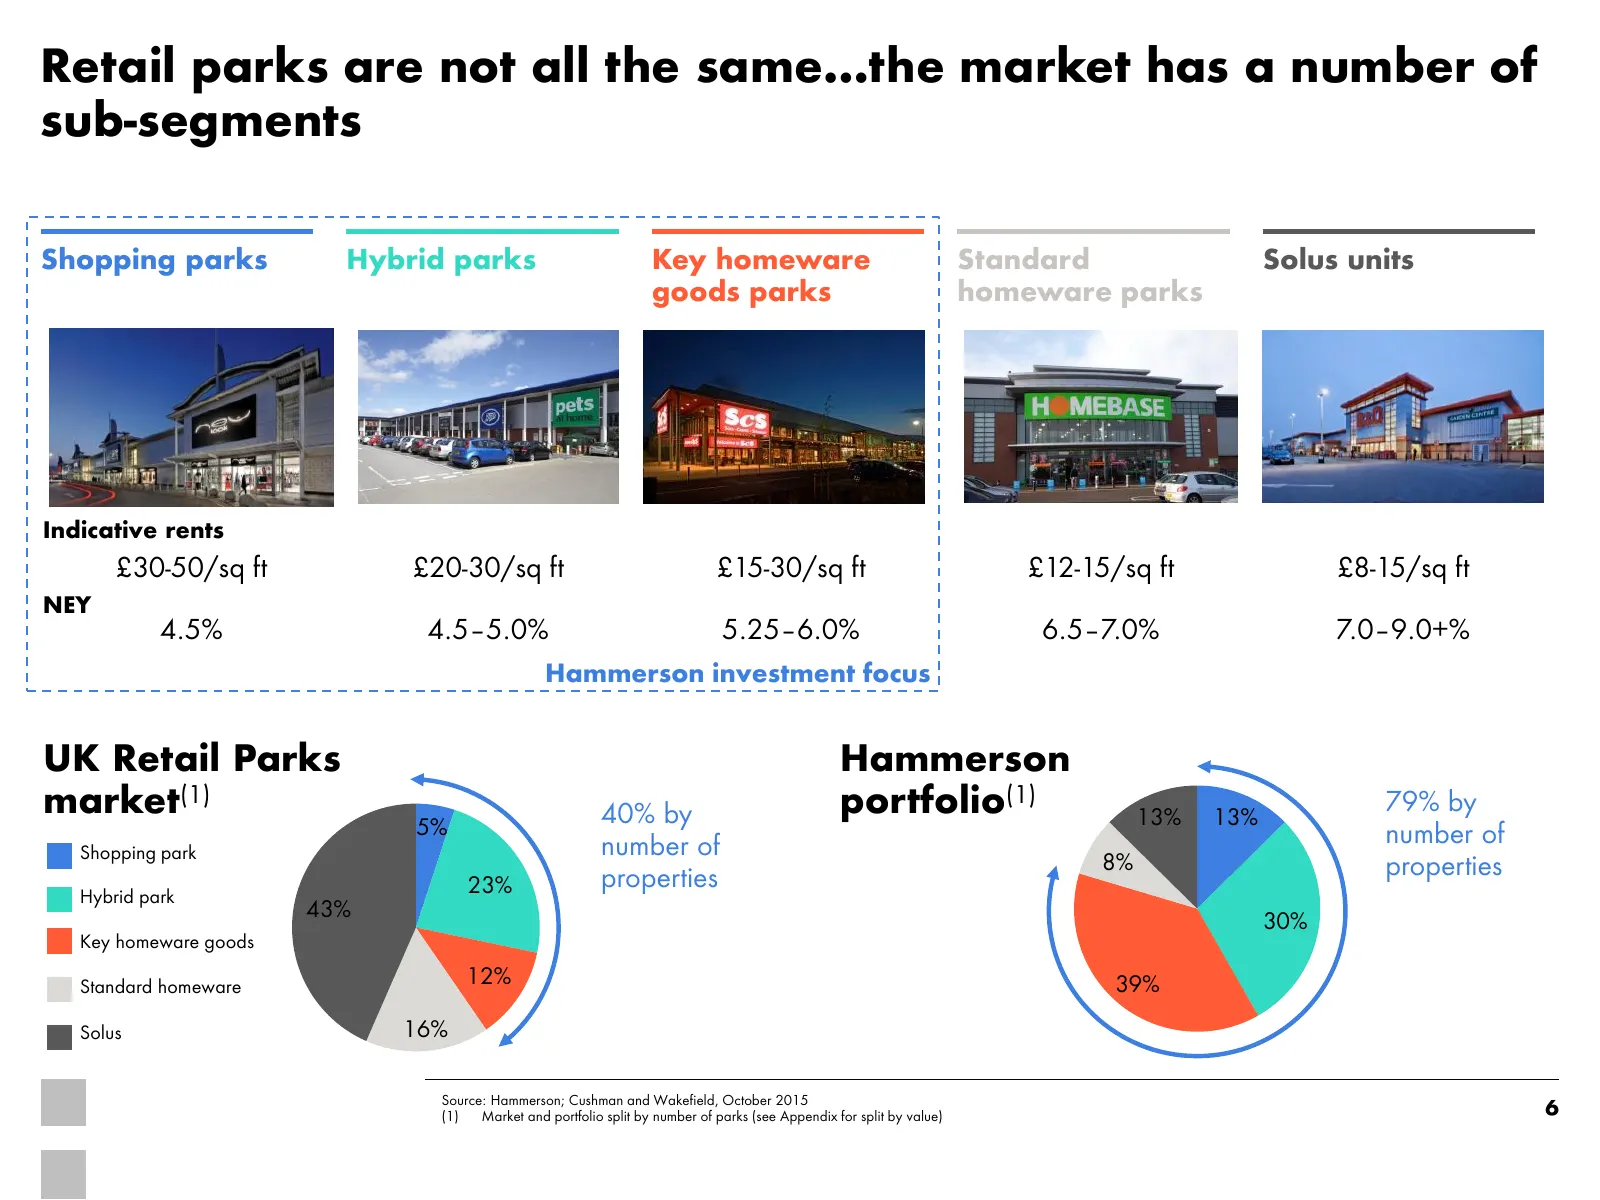
Retail parks are not all the same…the market has a number of sub-segments Shopping parks Hybrid parks Key homeware Standard Solus units goods parks homeware parks Indicative rents £30-50/sq ft £20-30/sq ft £15-30/sq ft £12-15/sq ft £8-15/sq ft NEY 4.5% 4.5–5.0% 5.25–6.0% 6.5–7.0% 7.0–9.0+% Hammerson
Slide 7: Vacancy is falling but remains high for secondary homeware goods parks
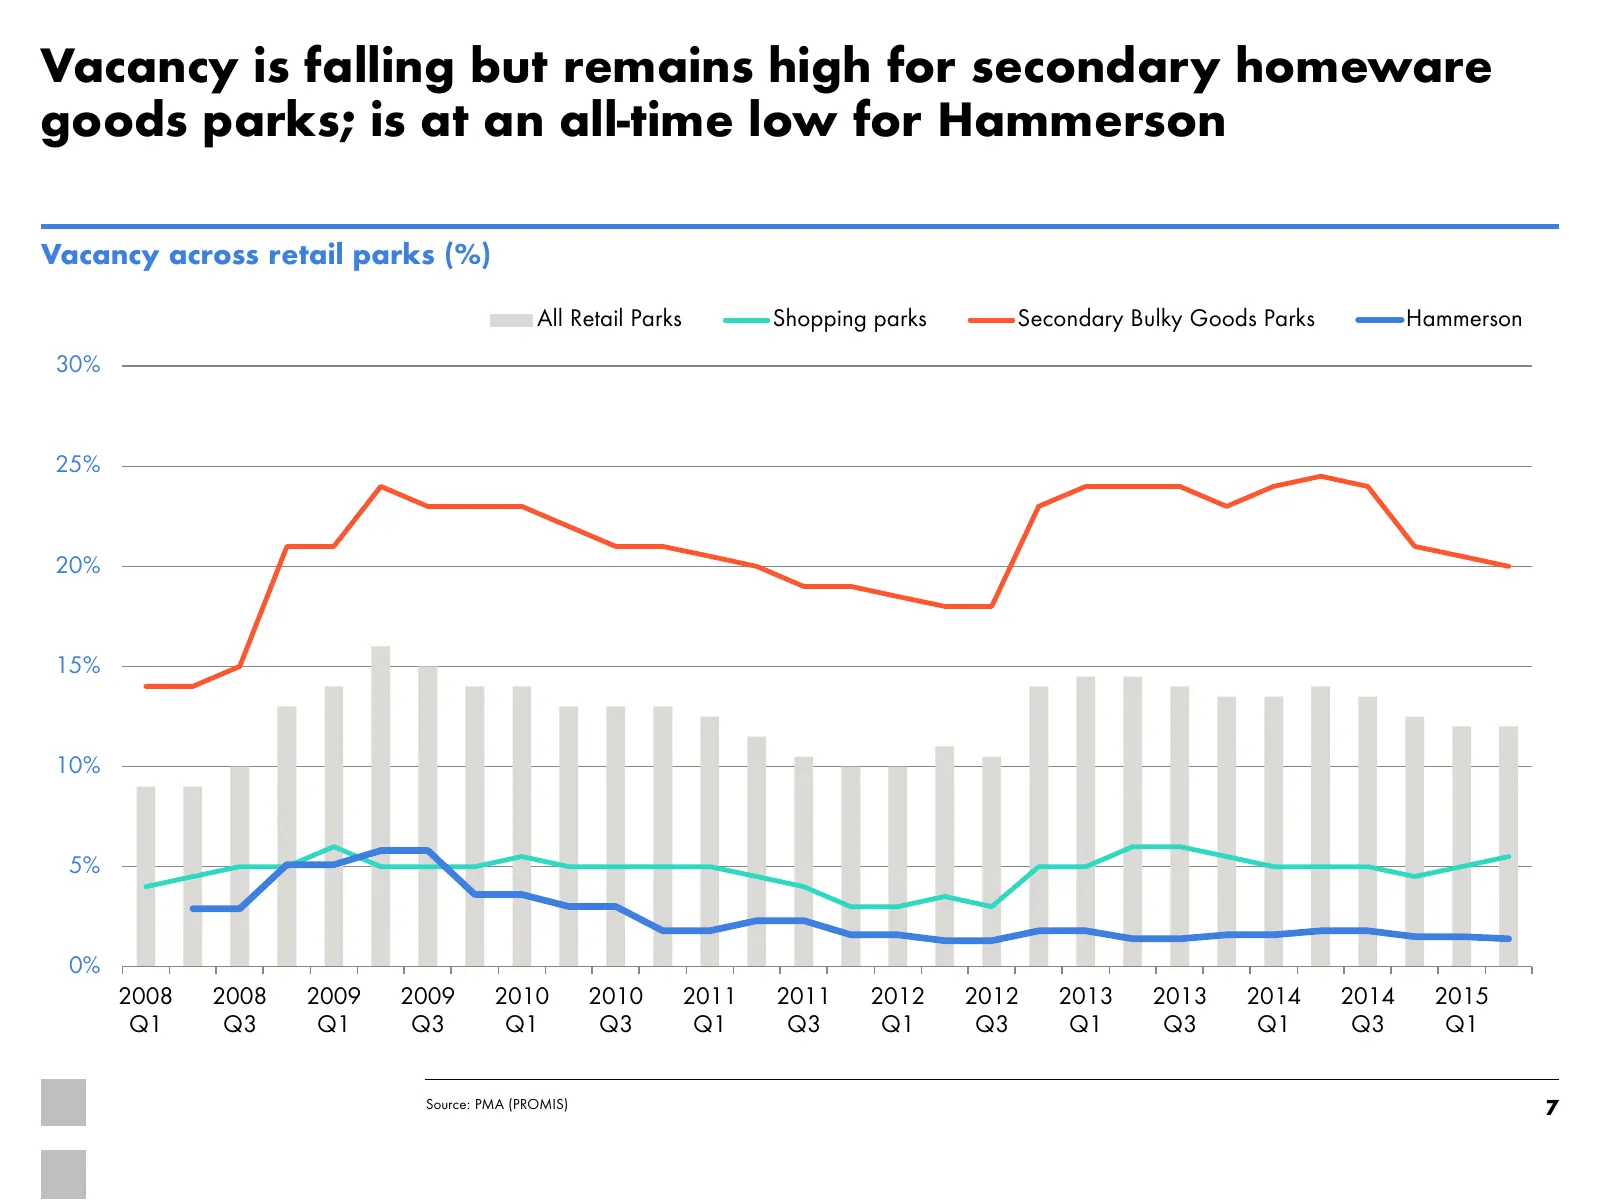
Vacancy is falling but remains high for secondary homeware goods parks; is at an all-time low for Hammerson Vacancy across retail parks (%) All Retail Parks Shopping parks Secondary Bulky Goods Parks Hammerson 30% 25% 20% 15% 10% 5% 0% 2008 2008 2009 2009 2010 2010 2011 2011 2012 2012 2013 2013 2014
Slide 8: Exceptional occupational demand: 'traditional' homeware goods
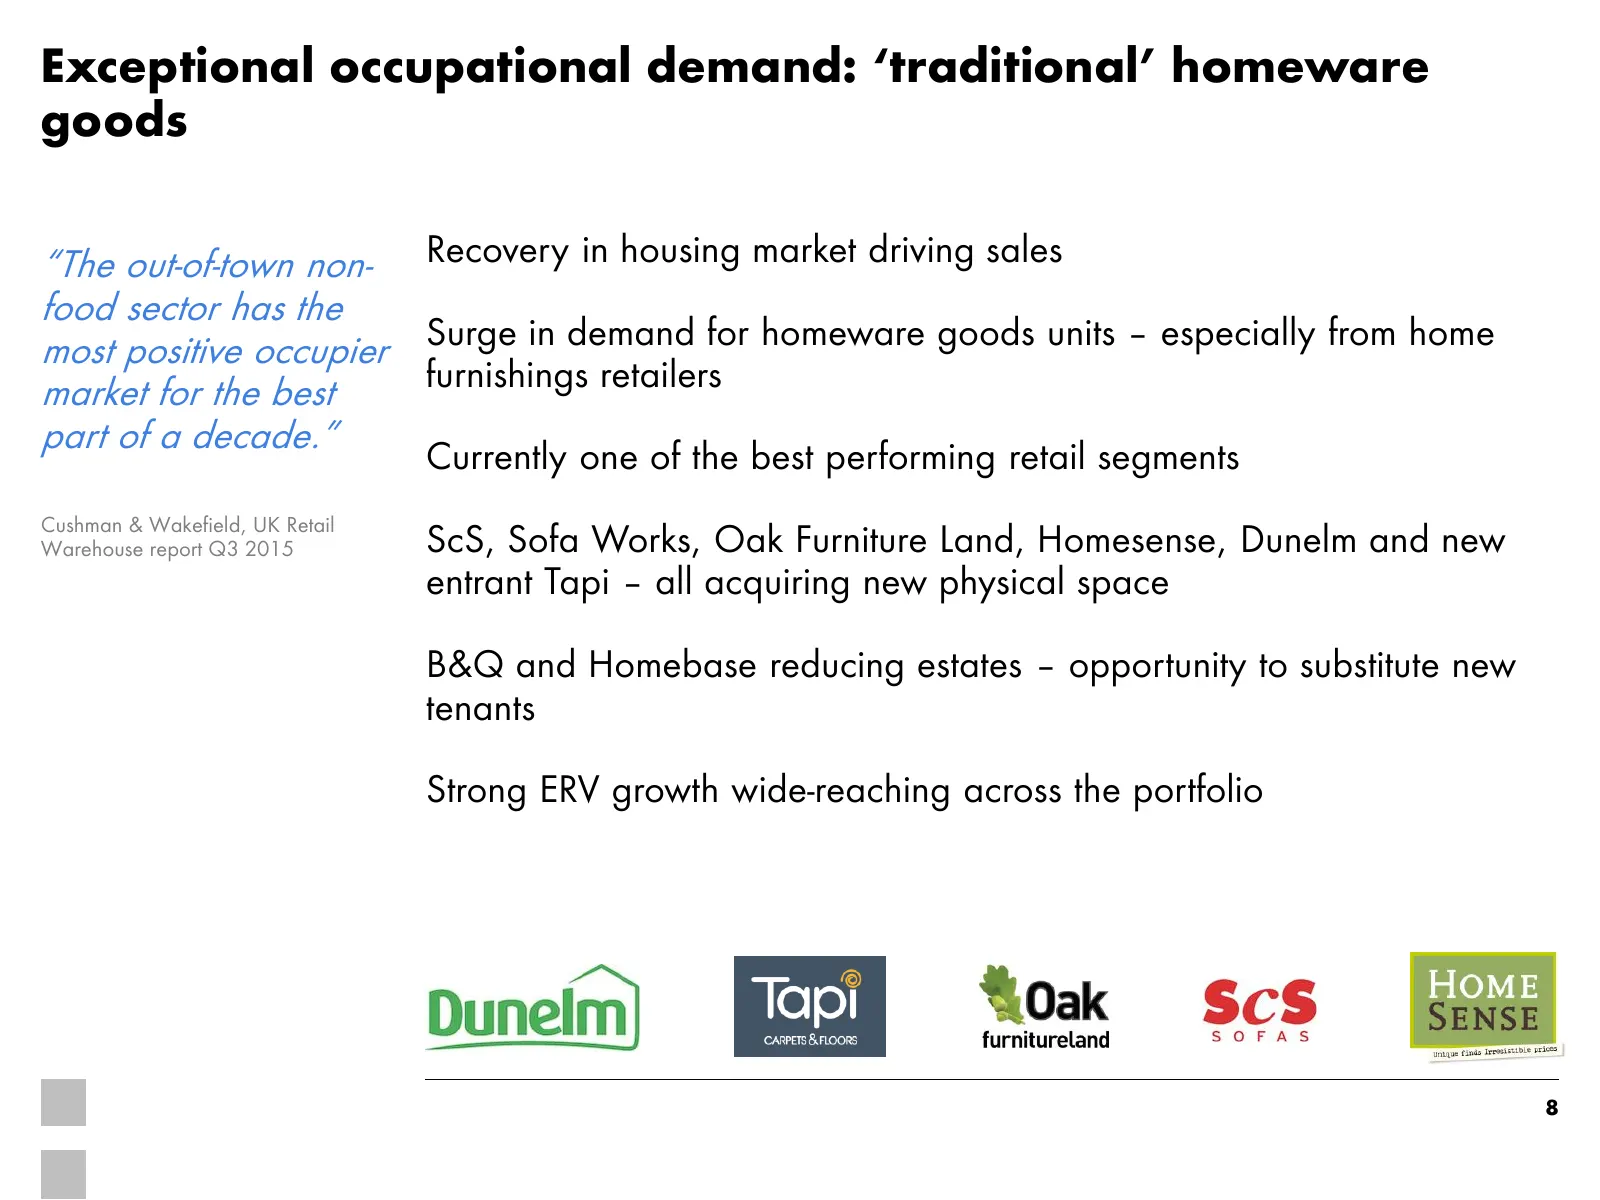
Exceptional occupational demand: ‘traditional’ homeware goods “The out-of-town non- Recovery in housing market driving sales food sector has the Surge in demand for homeware goods units – especially from home most positive occupier furnishings retailers market for the best part of a decade.” Current
Slide 9: Household goods sector driven by strong furniture sales
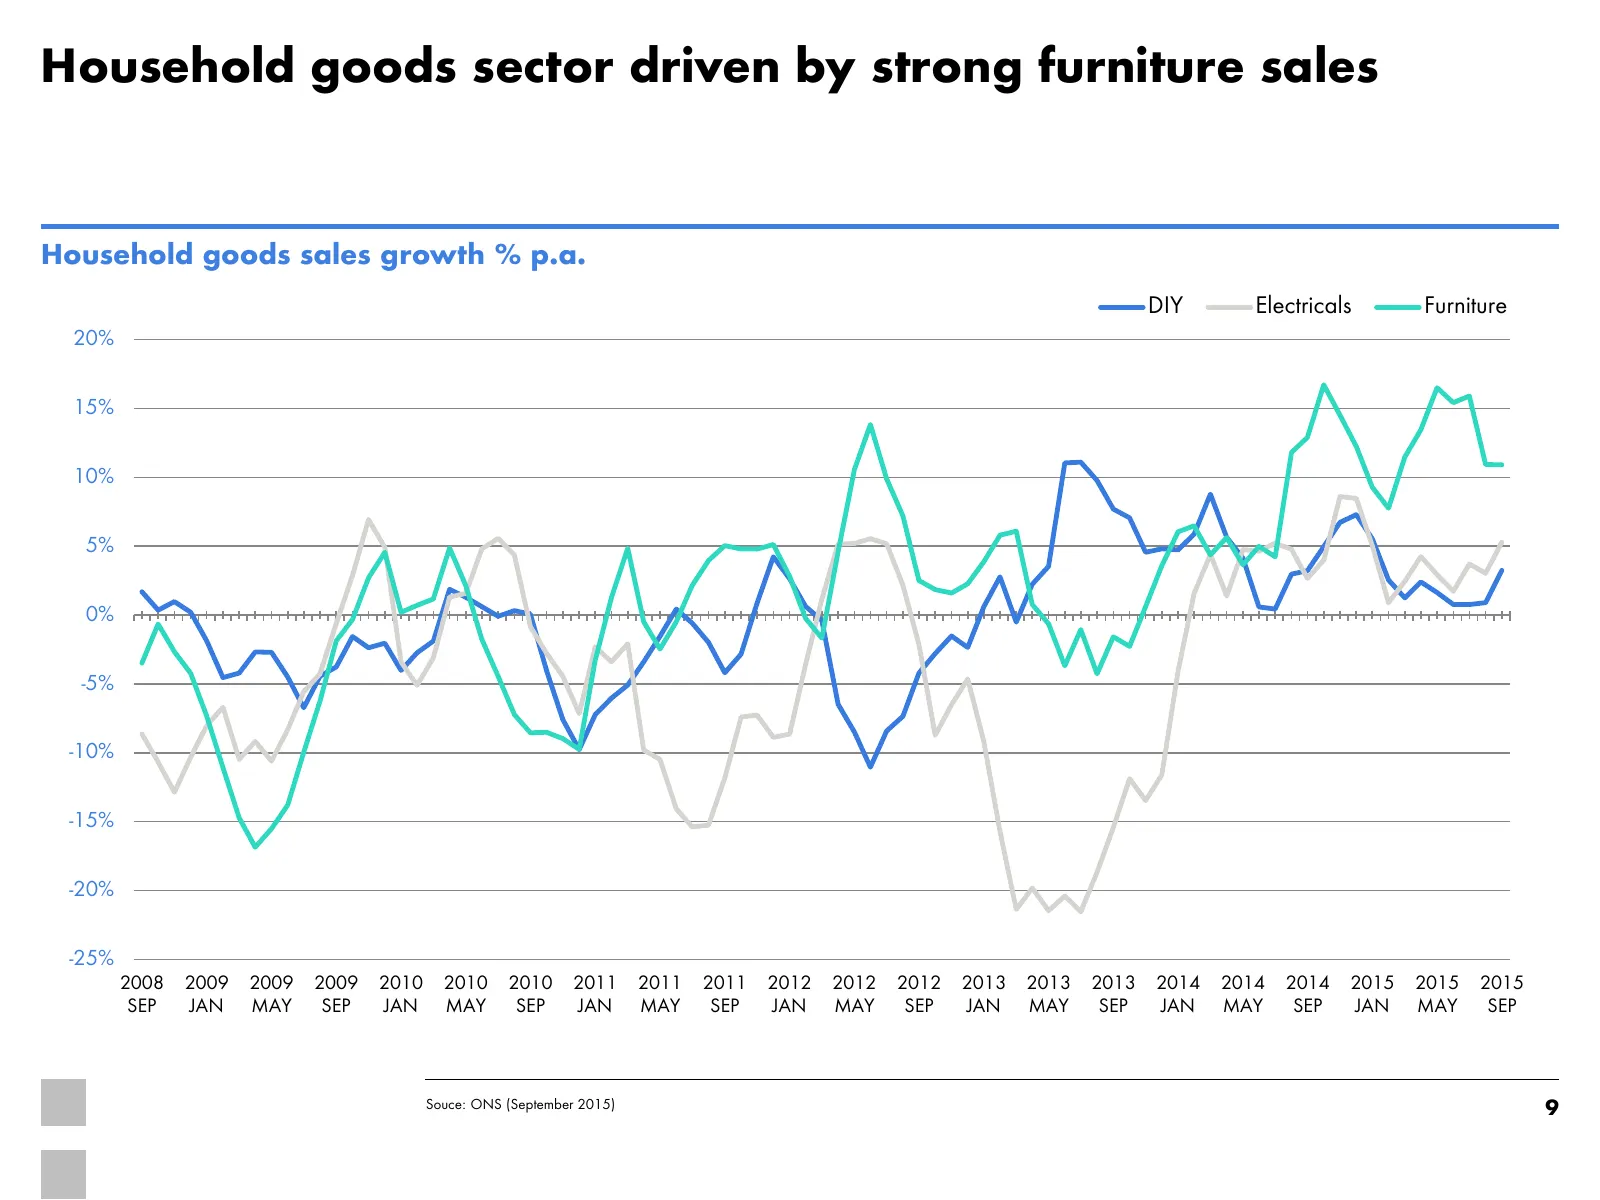
Household goods sector driven by strong furniture sales Household goods sales growth % p.a. DIY Electricals Furniture 20% 15% 10% 5% 0% -5% -10% -15% -20% -25% 2008 2009 2009 2009 2010 2010 2010 2011 2011 2011 2012 2012 2012 2013 2013 2013 2014 2014 2014 2015 2015 2015 SEP JAN MAY SEP JAN MAY SEP JA
Slide 10: Low vacancy together with strong occupational demand is triggering impressive letting deals
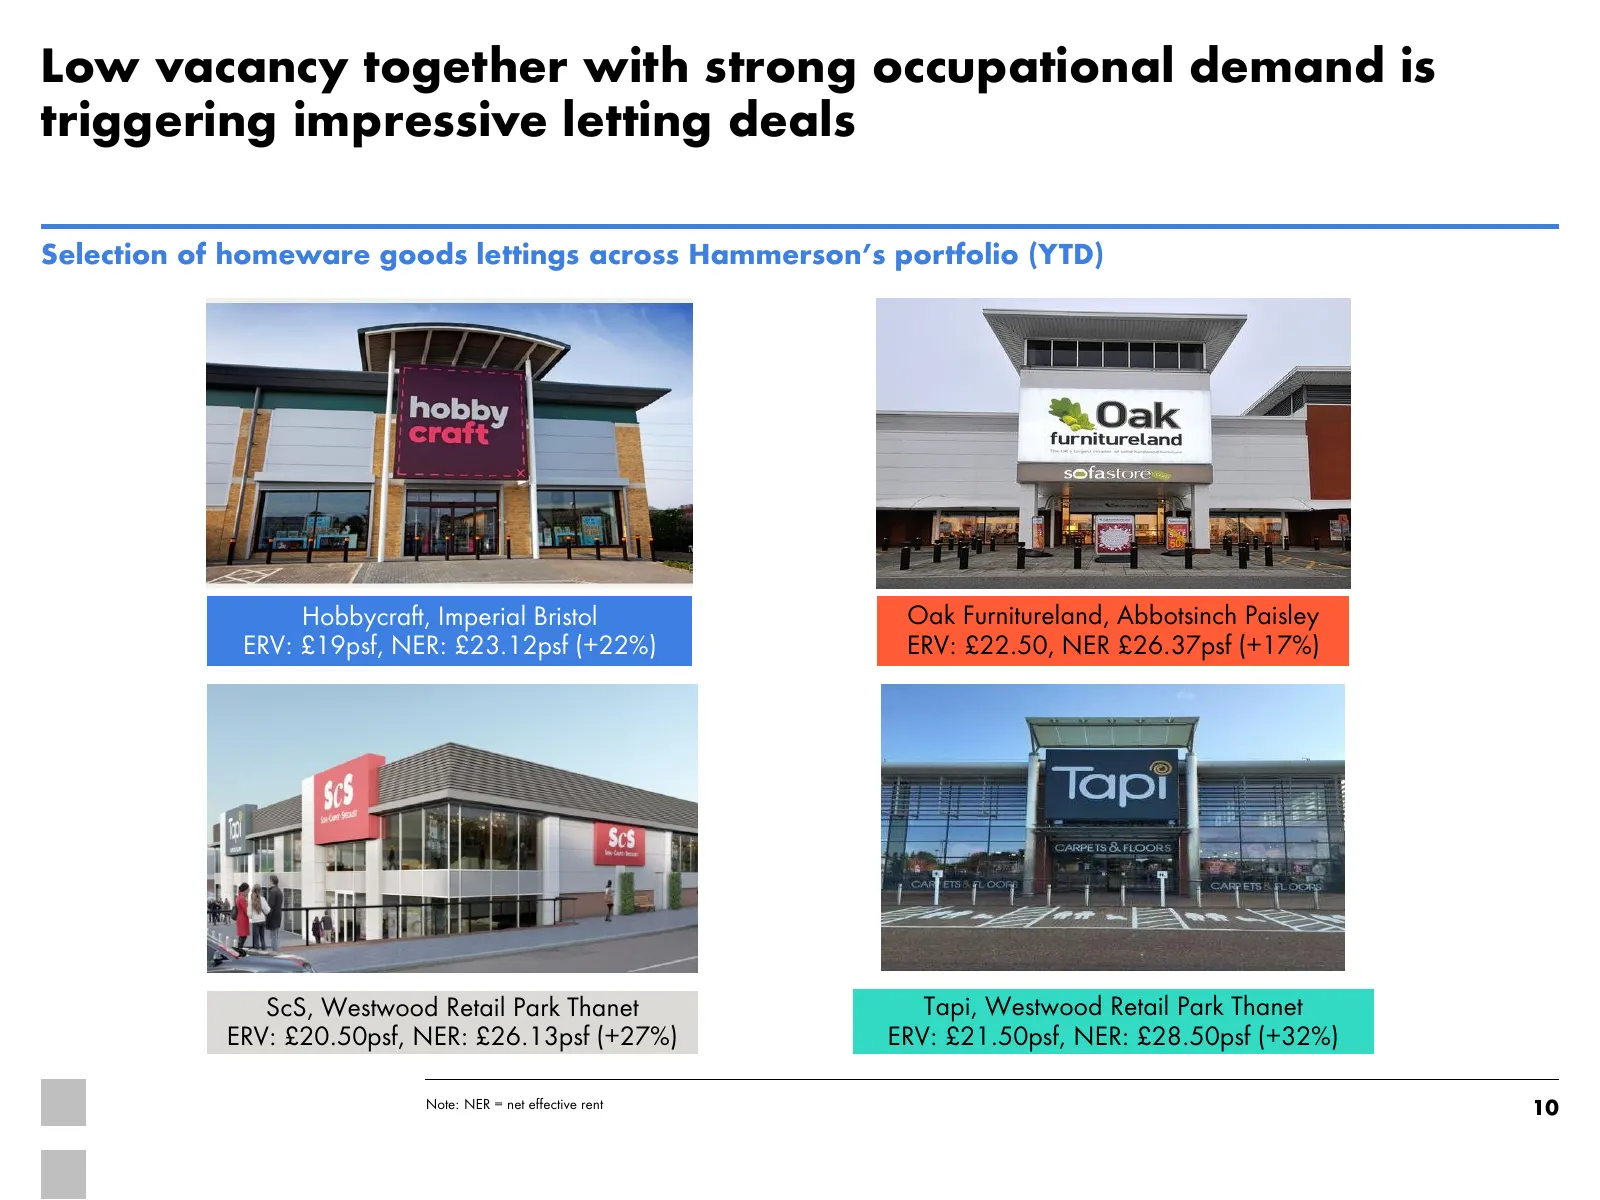
Low vacancy together with strong occupational demand is triggering impressive letting deals Selection of homeware goods lettings across Hammerson’s portfolio (YTD) Hobbycraft, Imperial Bristol Oak Furnitureland, Abbotsinch Paisley ERV: £19psf, NER: £23.12psf (+22%) ERV: £22.50, NER £26.37psf (+17%)
Slide 11: Tenant administrations and right-sizing of DIY retailers presents an opportunity
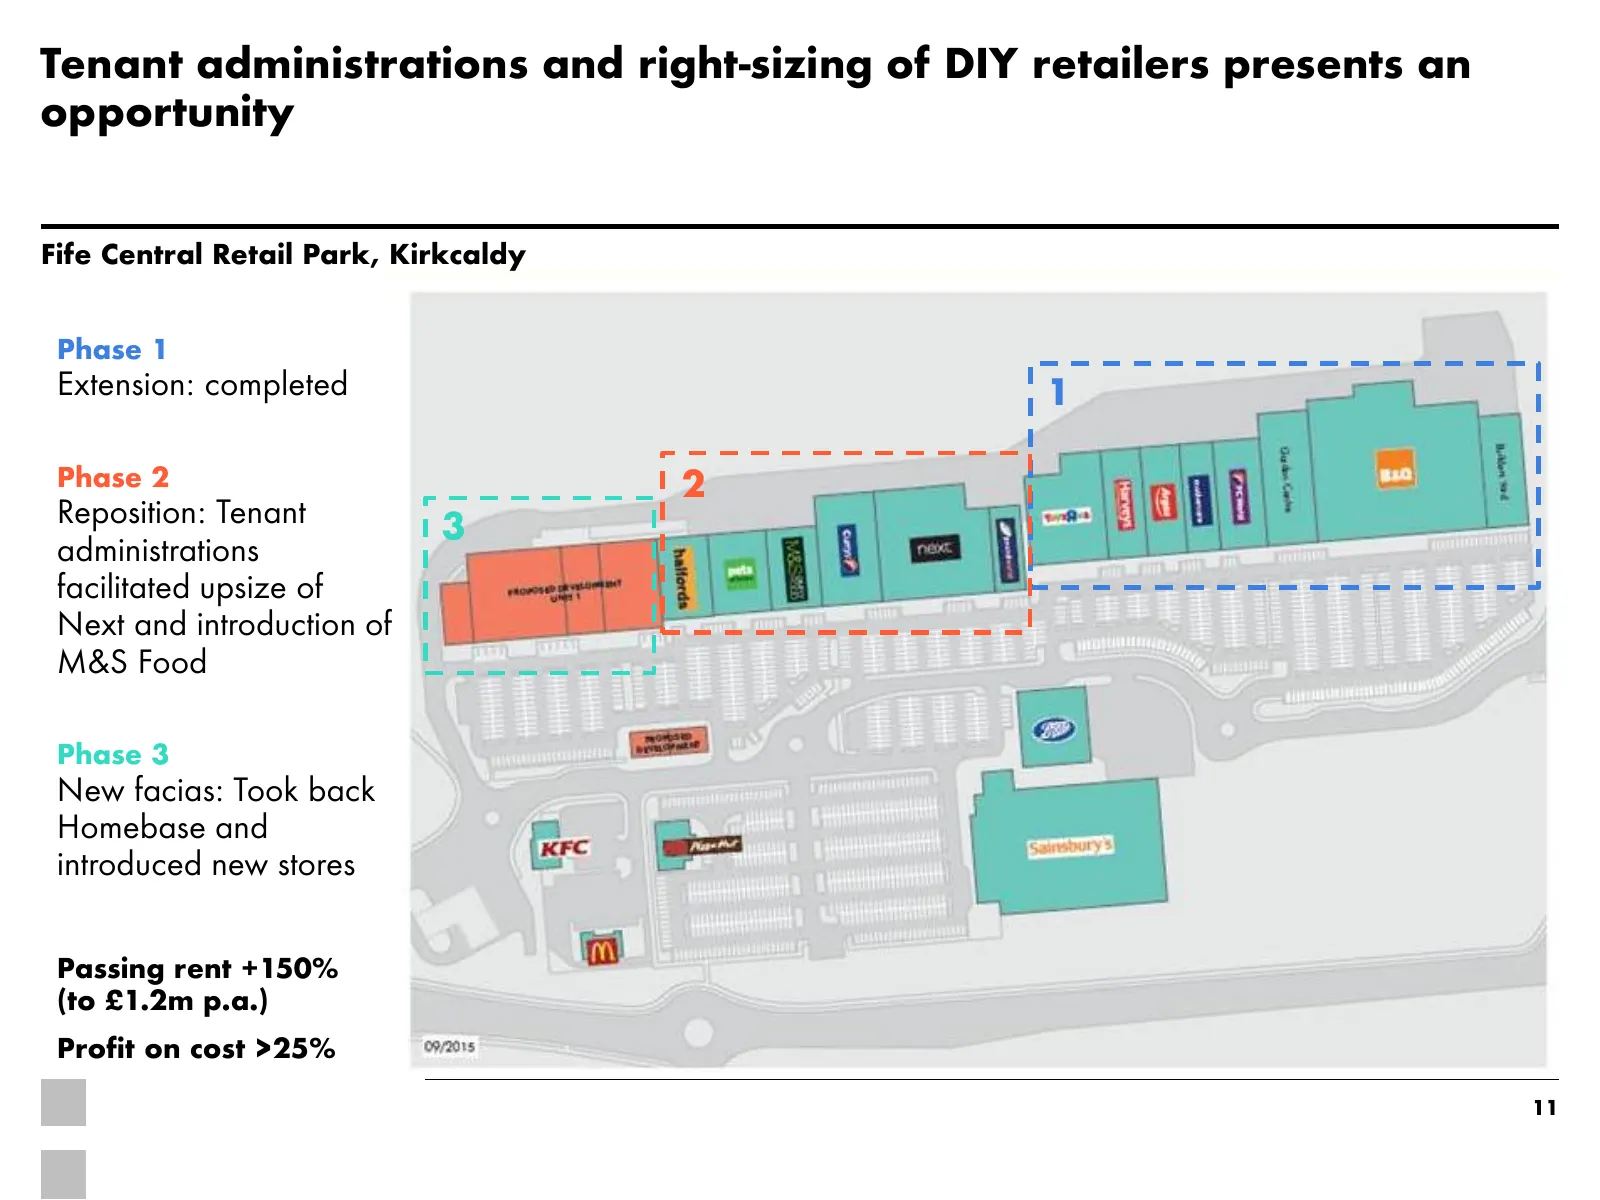
Tenant administrations and right-sizing of DIY retailers presents an opportunity Fife Central Retail Park, Kirkcaldy Phase 1 Extension: completed 1 Phase 2 2 Reposition: Tenant 3 administrations facilitated upsize of Next and introduction of M&S Food Phase 3 New facias: Took back Homebase and introd
Slide 12: Actively managing retailer substitution
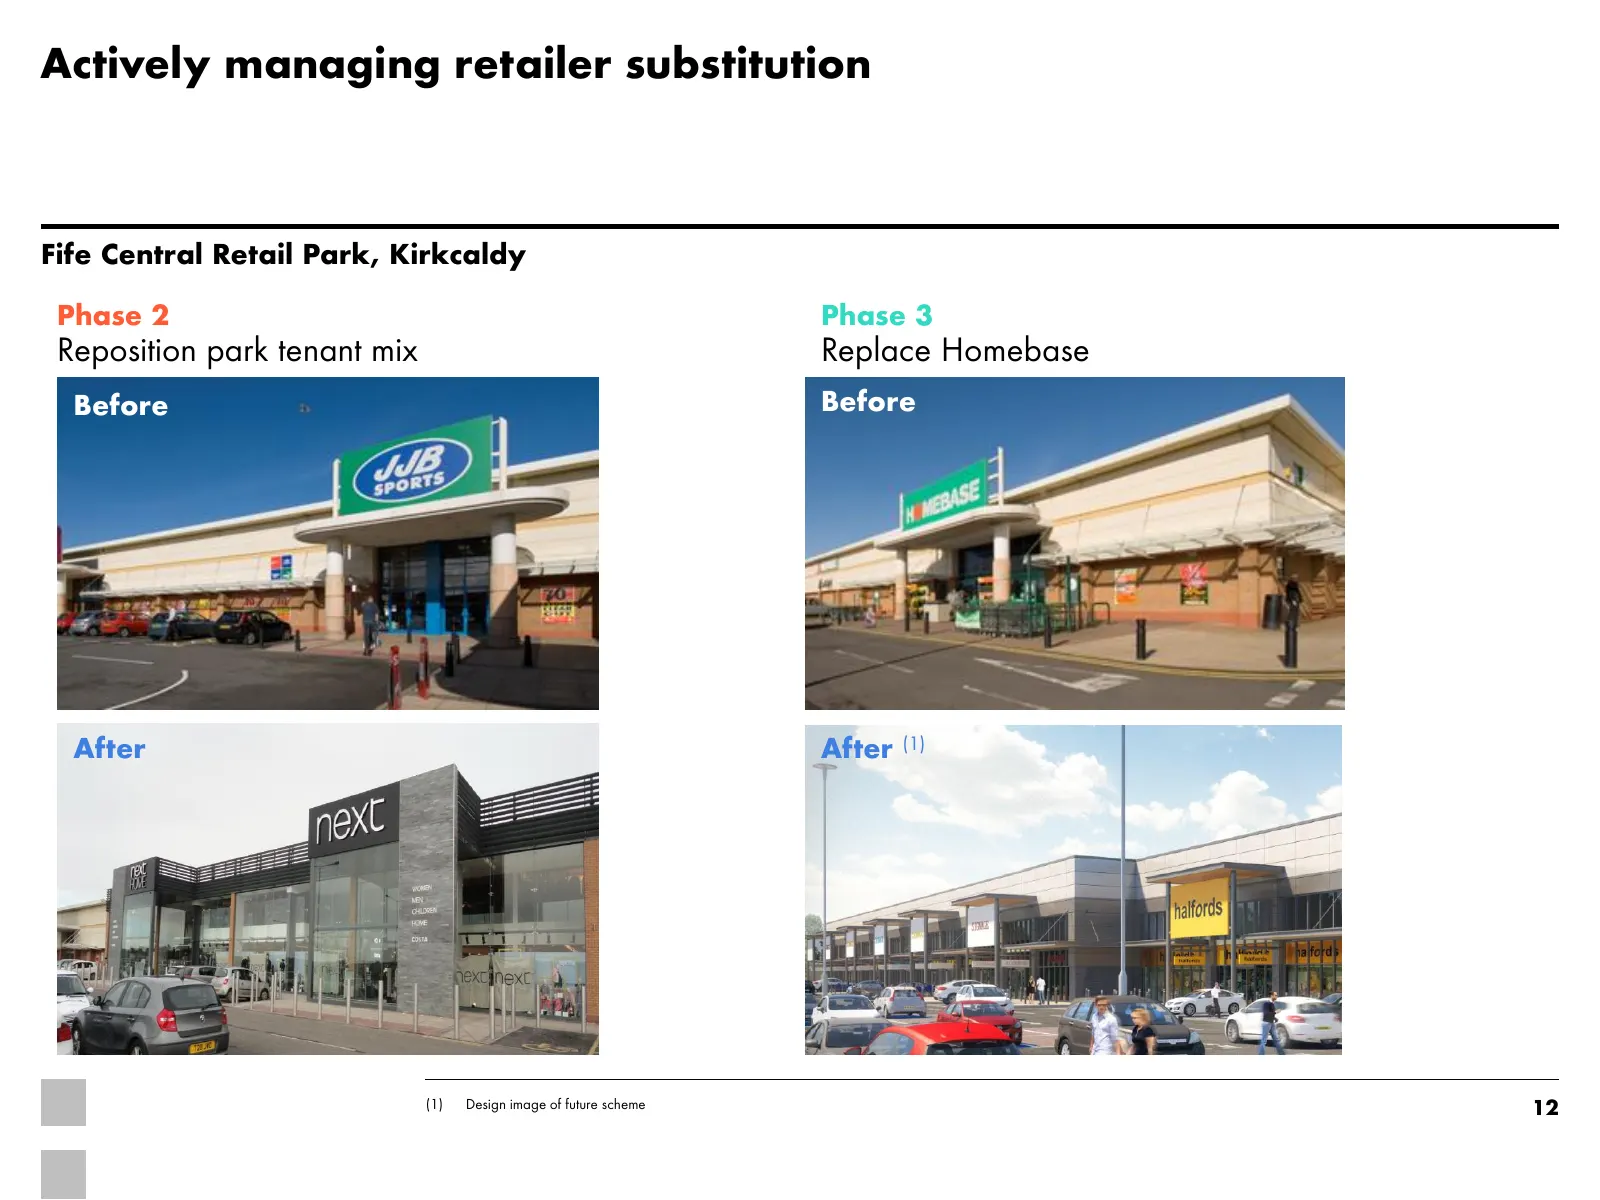
Actively managing retailer substitution Fife Central Retail Park, Kirkcaldy Phase 2 Phase 3 Reposition park tenant mix Replace Homebase Before Before After After (1) (1) Design image of future scheme 12
Slide 13: Strong occupational demand: shopping parks
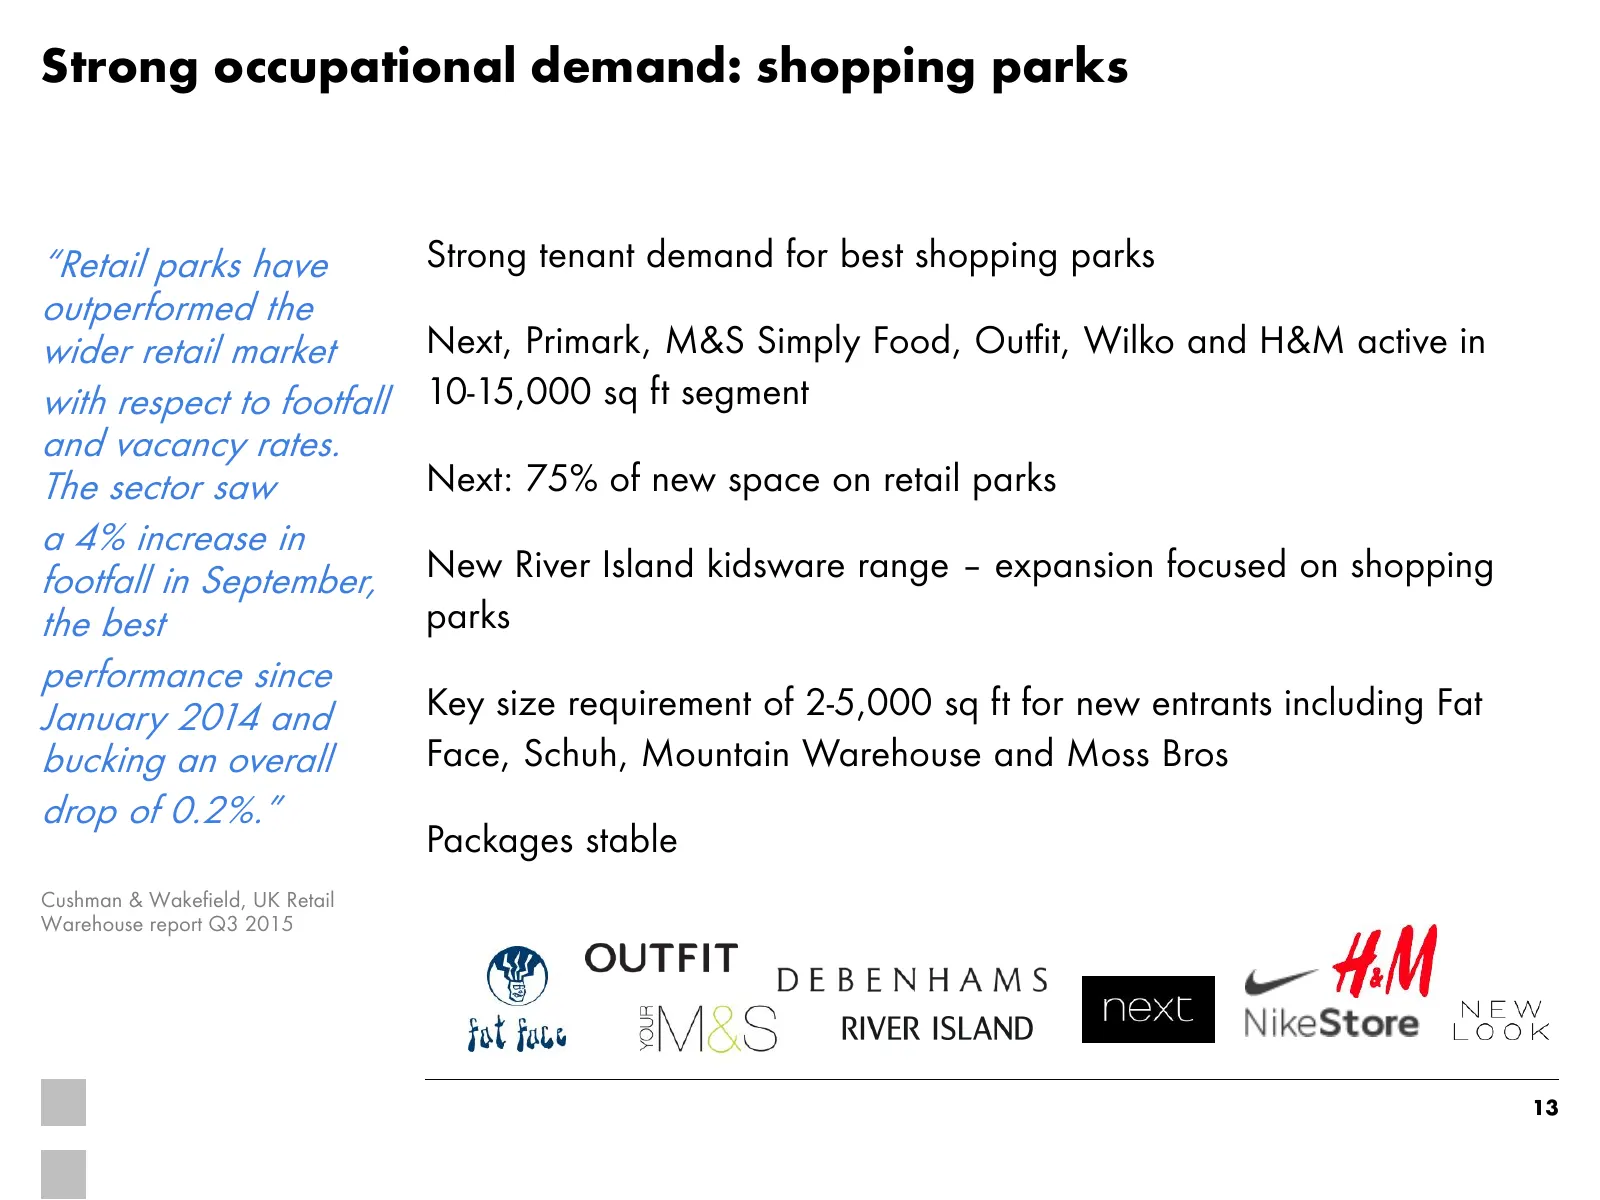
Strong occupational demand: shopping parks “Retail parks have Strong tenant demand for best shopping parks outperformed the wider retail market Next, Primark, M&S Simply Food, Outfit, Wilko and H&M active in with respect to footfall 10-15,000 sq ft segment and vacancy rates. The sector saw Next: 75%
Slide 14: Material tenant overlap with shopping centres creates synergies
Material tenant overlap with shopping centres creates synergies Hammerson coordinated approach Tenant overlap with shopping centres “Retailer of the Month” meeting Customer-centric approach: one voice to our customers Retailers’ leasing teams are regional, not by property type Coherent approach to l
Slide 15: Extensions and developments are quick to deliver and highly profitable
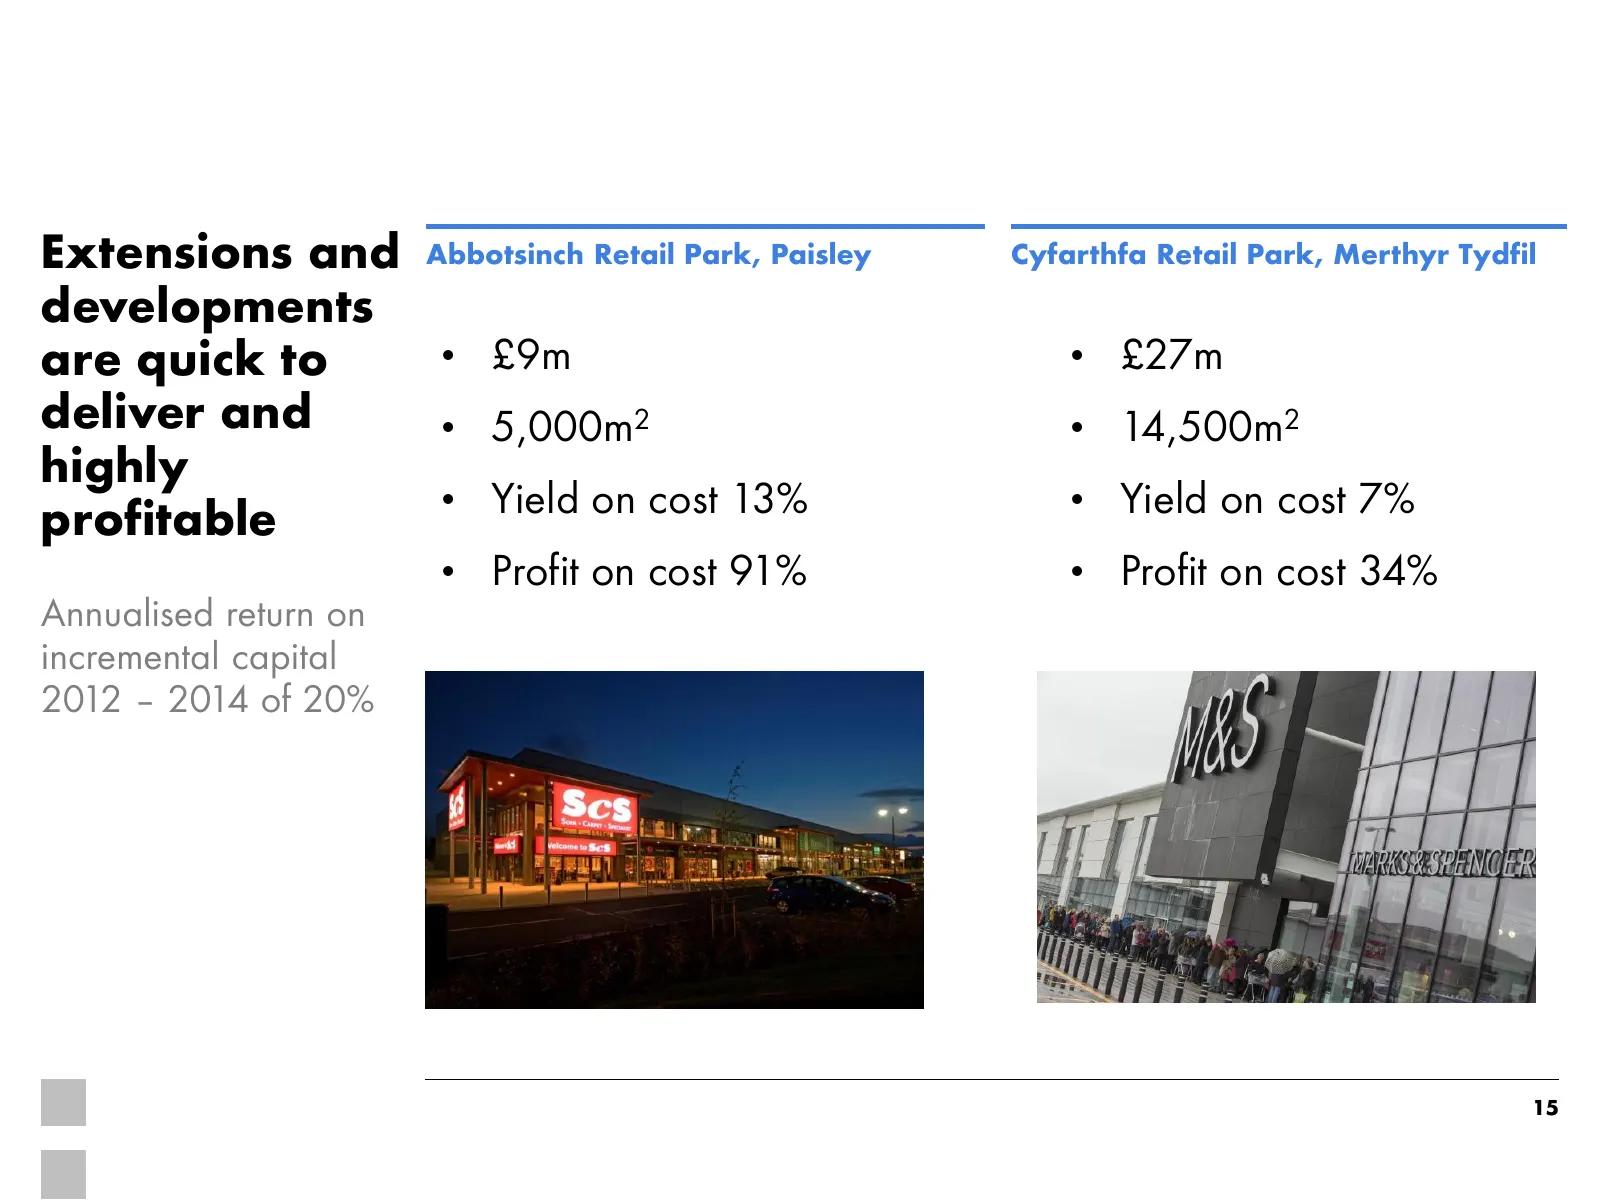
Extensions and Abbotsinch Retail Park, Paisley Cyfarthfa Retail Park, Merthyr Tydfil developments are quick to • £9m • £27m deliver and • 5,000m2 • 14,500m2 highly • Yield on cost 13% • Yield on cost 7% profitable • Profit on cost 91% • Profit on cost 34% Annualised return on incremental capital 201
Slide 16: Total returns at retail parks are equivalent to shopping centres
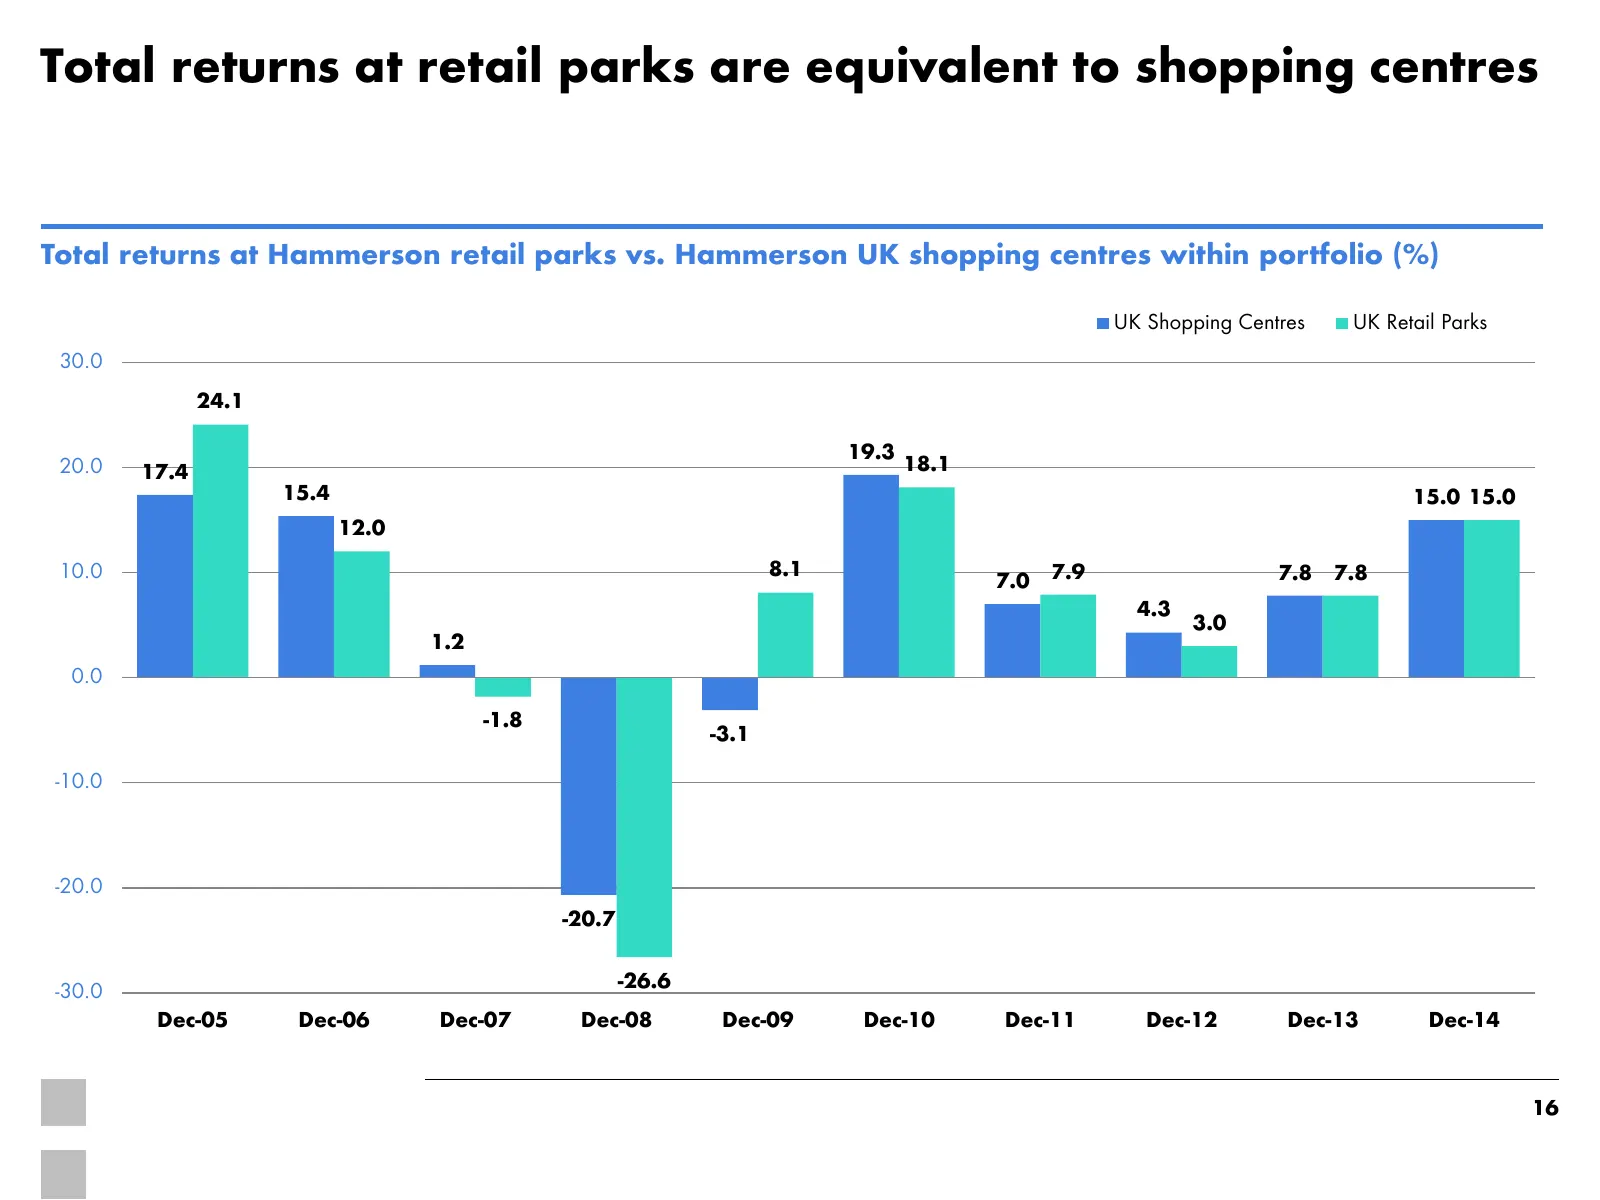
Total returns at retail parks are equivalent to shopping centres Total returns at Hammerson retail parks vs. Hammerson UK shopping centres within portfolio (%) UK Shopping Centres UK Retail Parks 30.0 24.1 19.3 20.0 17.4 18.1 15.4 15.0 15.0 12.0 10.0 8.1 7.9 7.8 7.8 7.0 4.3 3.0 1.2 0.0 -1.8 -3.1 -10
Slide 17: Retail parks portfolio is efficient to run
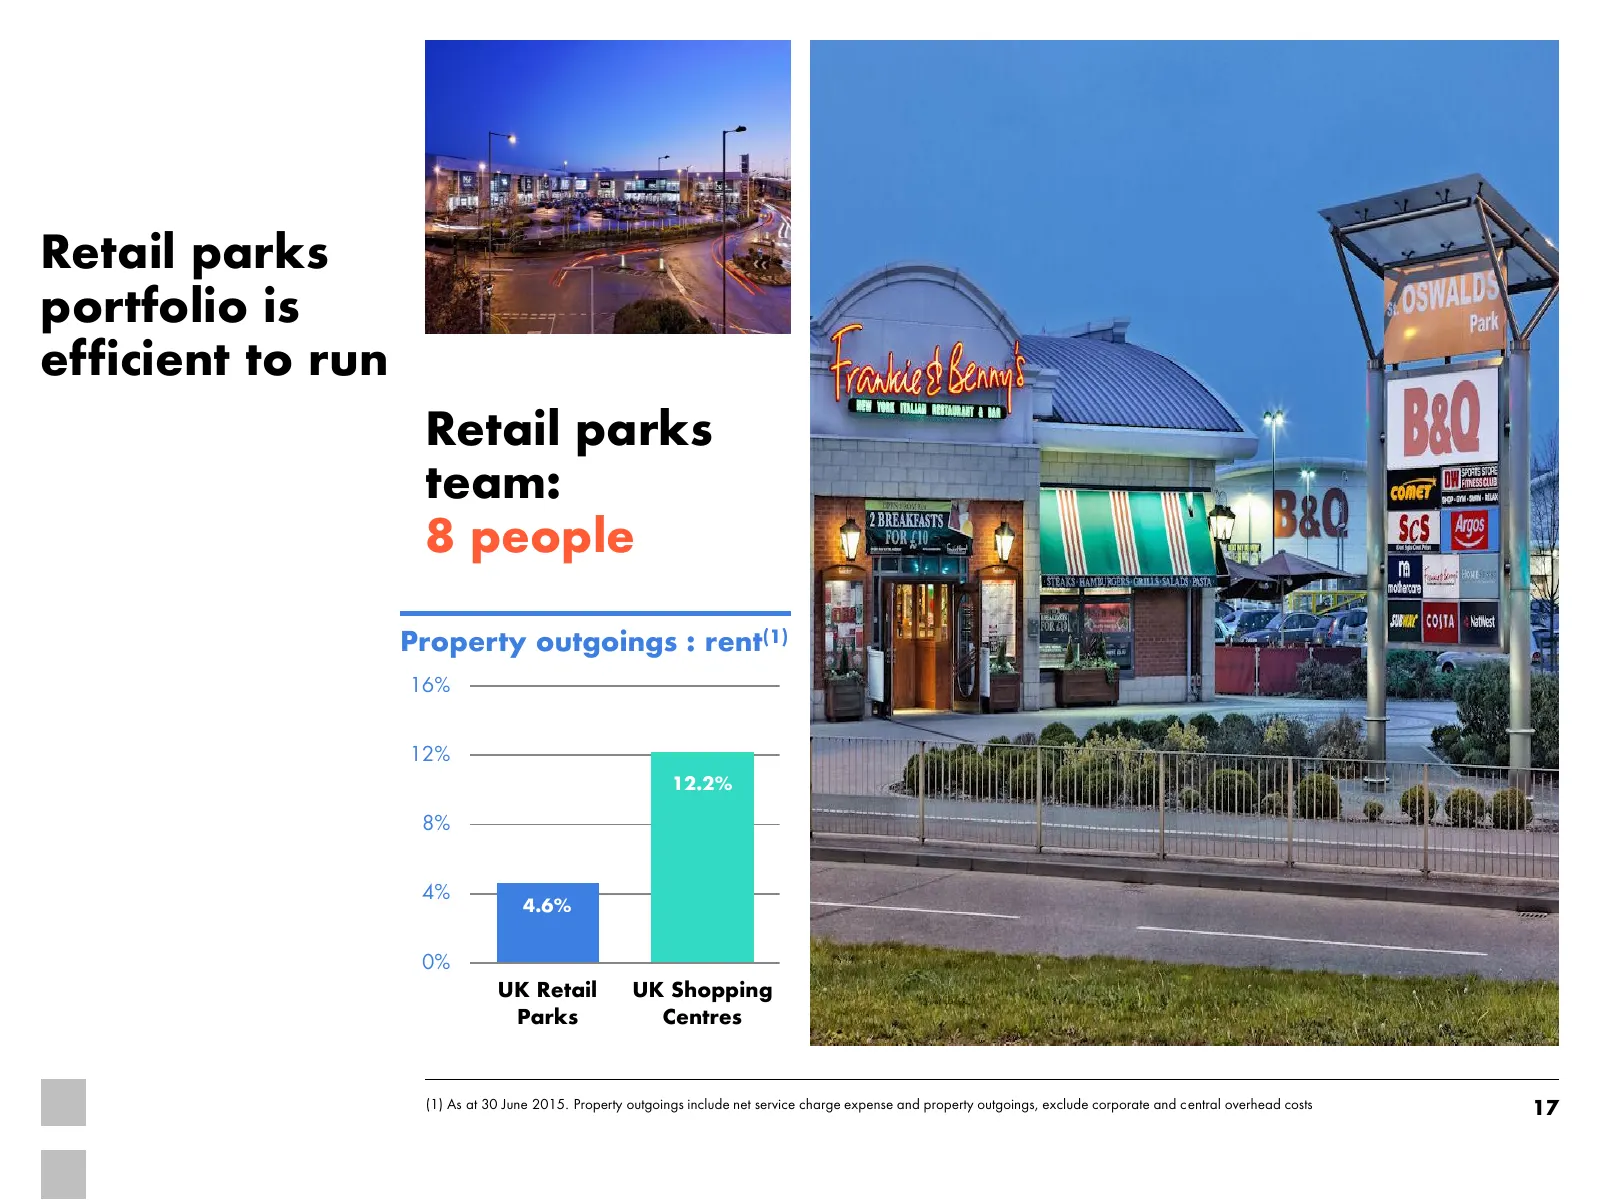
Retail parks portfolio is efficient to run Retail parks team: 8 people Property outgoings : rent(1) 16% 12% 12.2% 8% 4% 4.6% 0% UK Retail UK Shopping Parks Centres (1) As at 30 June 2015. Property outgoings include net service charge expense and property outgoings, exclude corporate and central over
Slide 18: Elliott's Field, Rugby
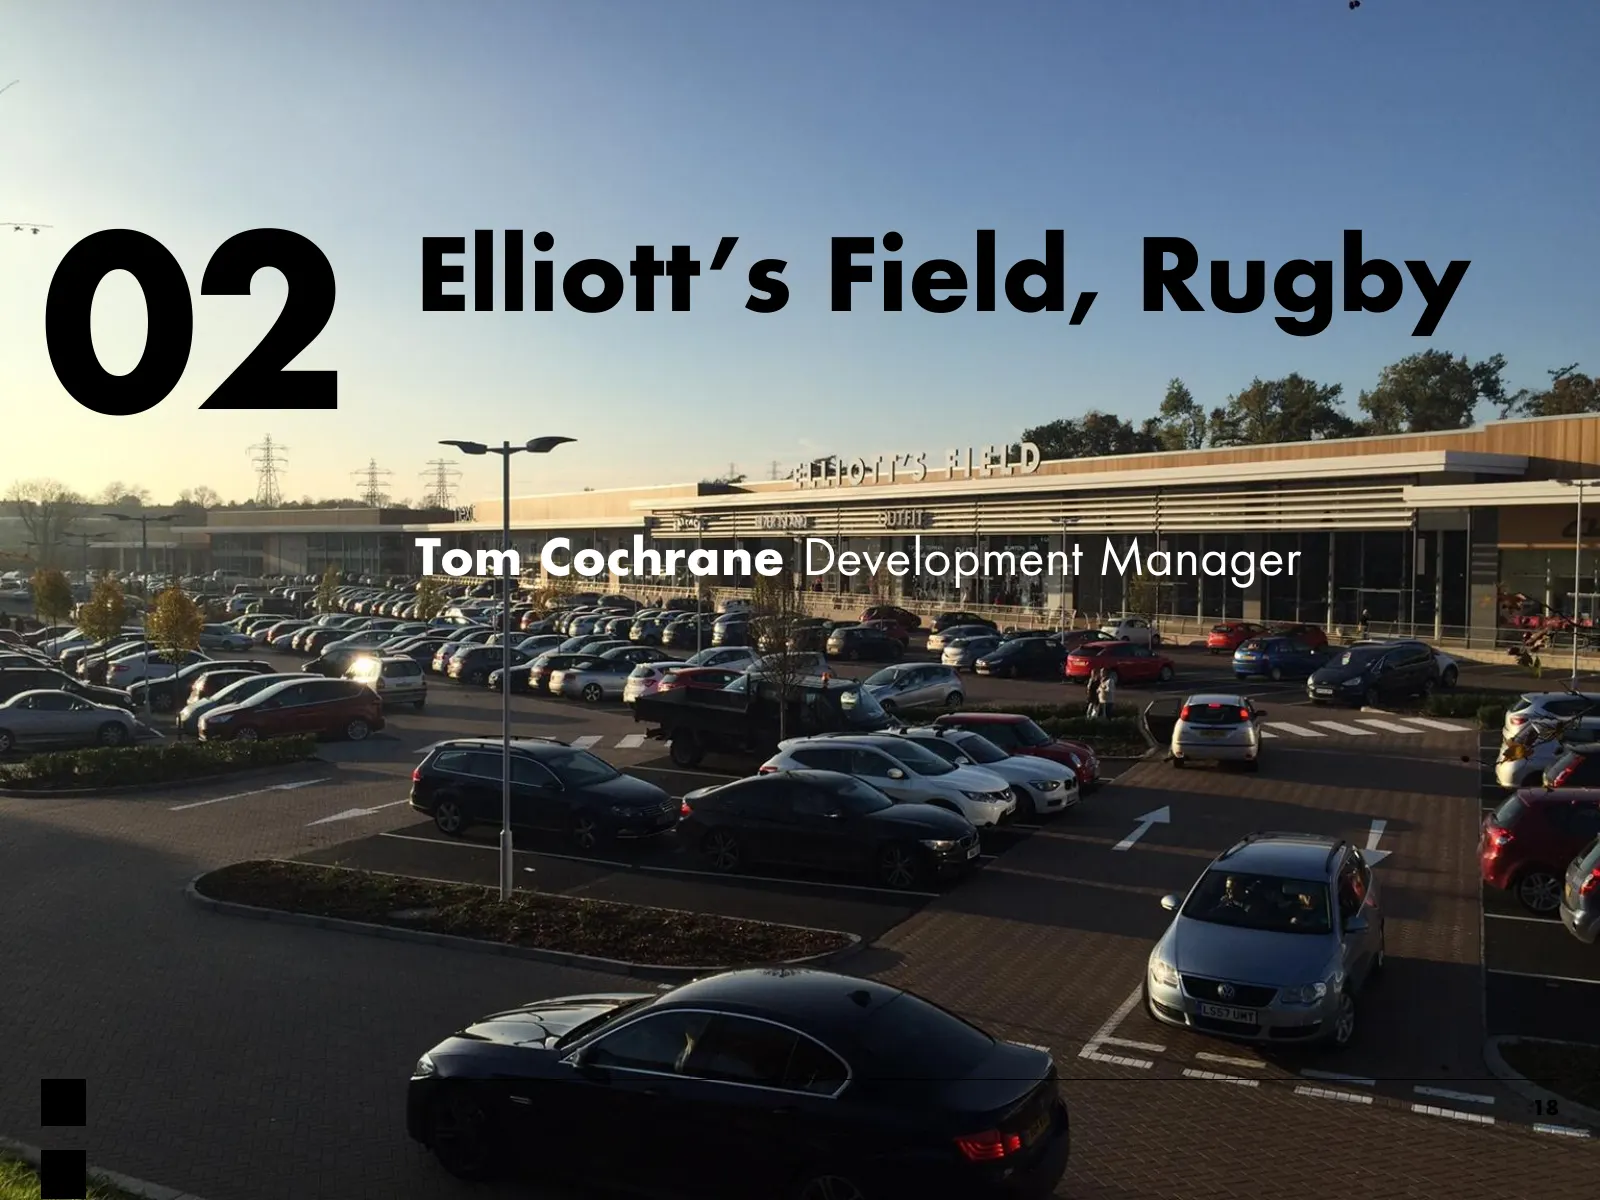
02 Elliott’s Field, Rugby Tom Cochrane Development Manager 18
Slide 19: Elliott's Field one year ago…
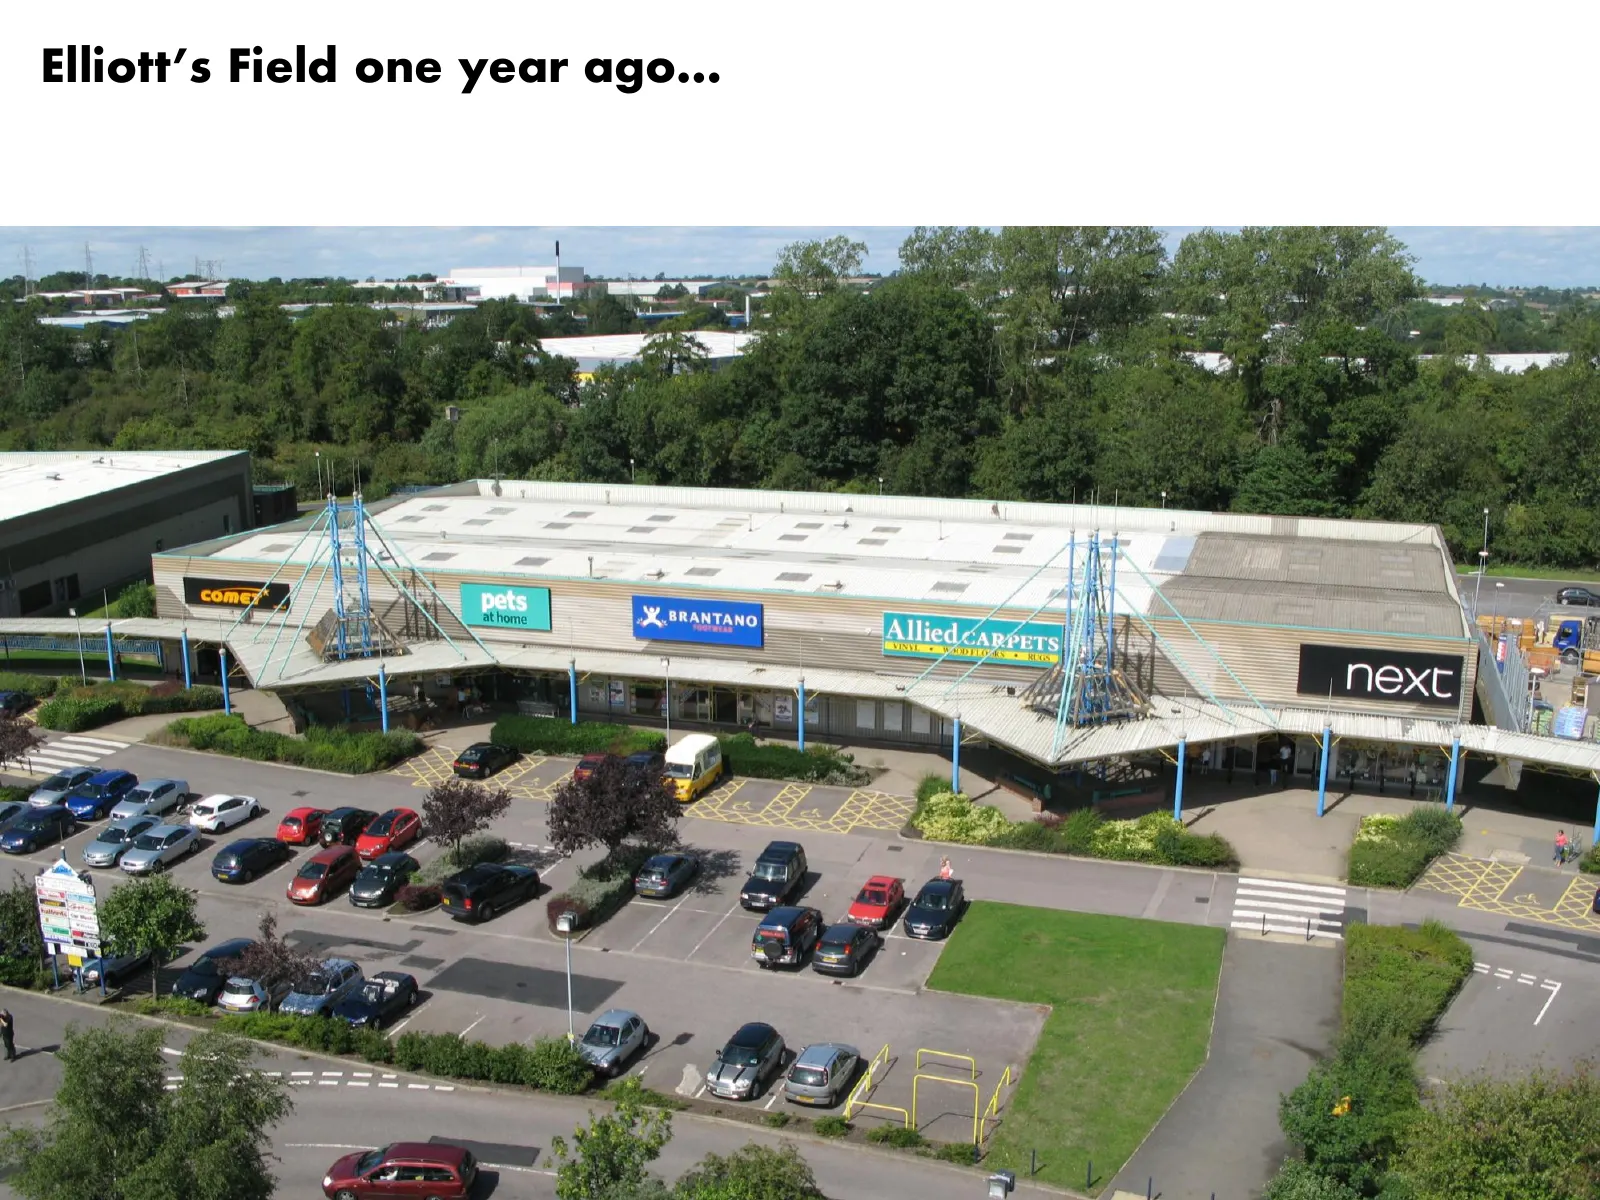
Elliott’s Field one year ago… 19
Slide 20: Elliott's Field Shopping Park: the vision
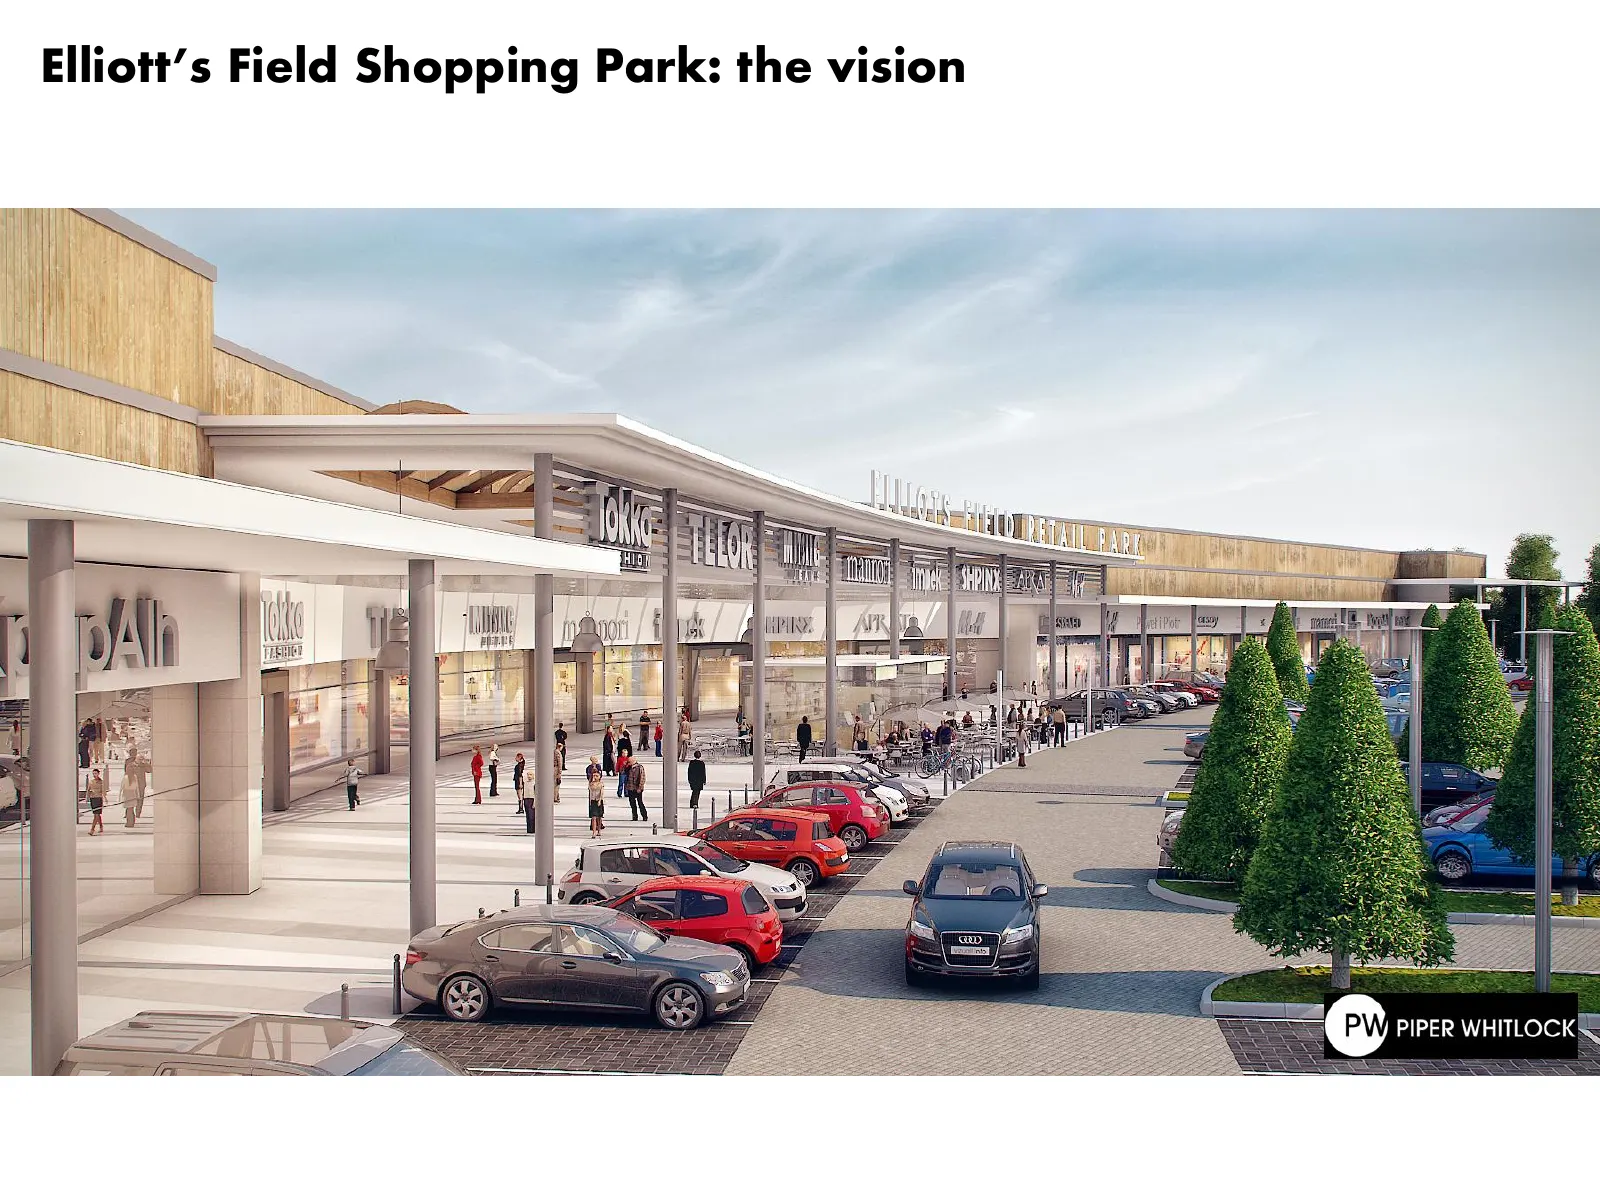
Elliott’s Field Shopping Park: the vision 20
Slide 21: Elliott's Field: scheme overview
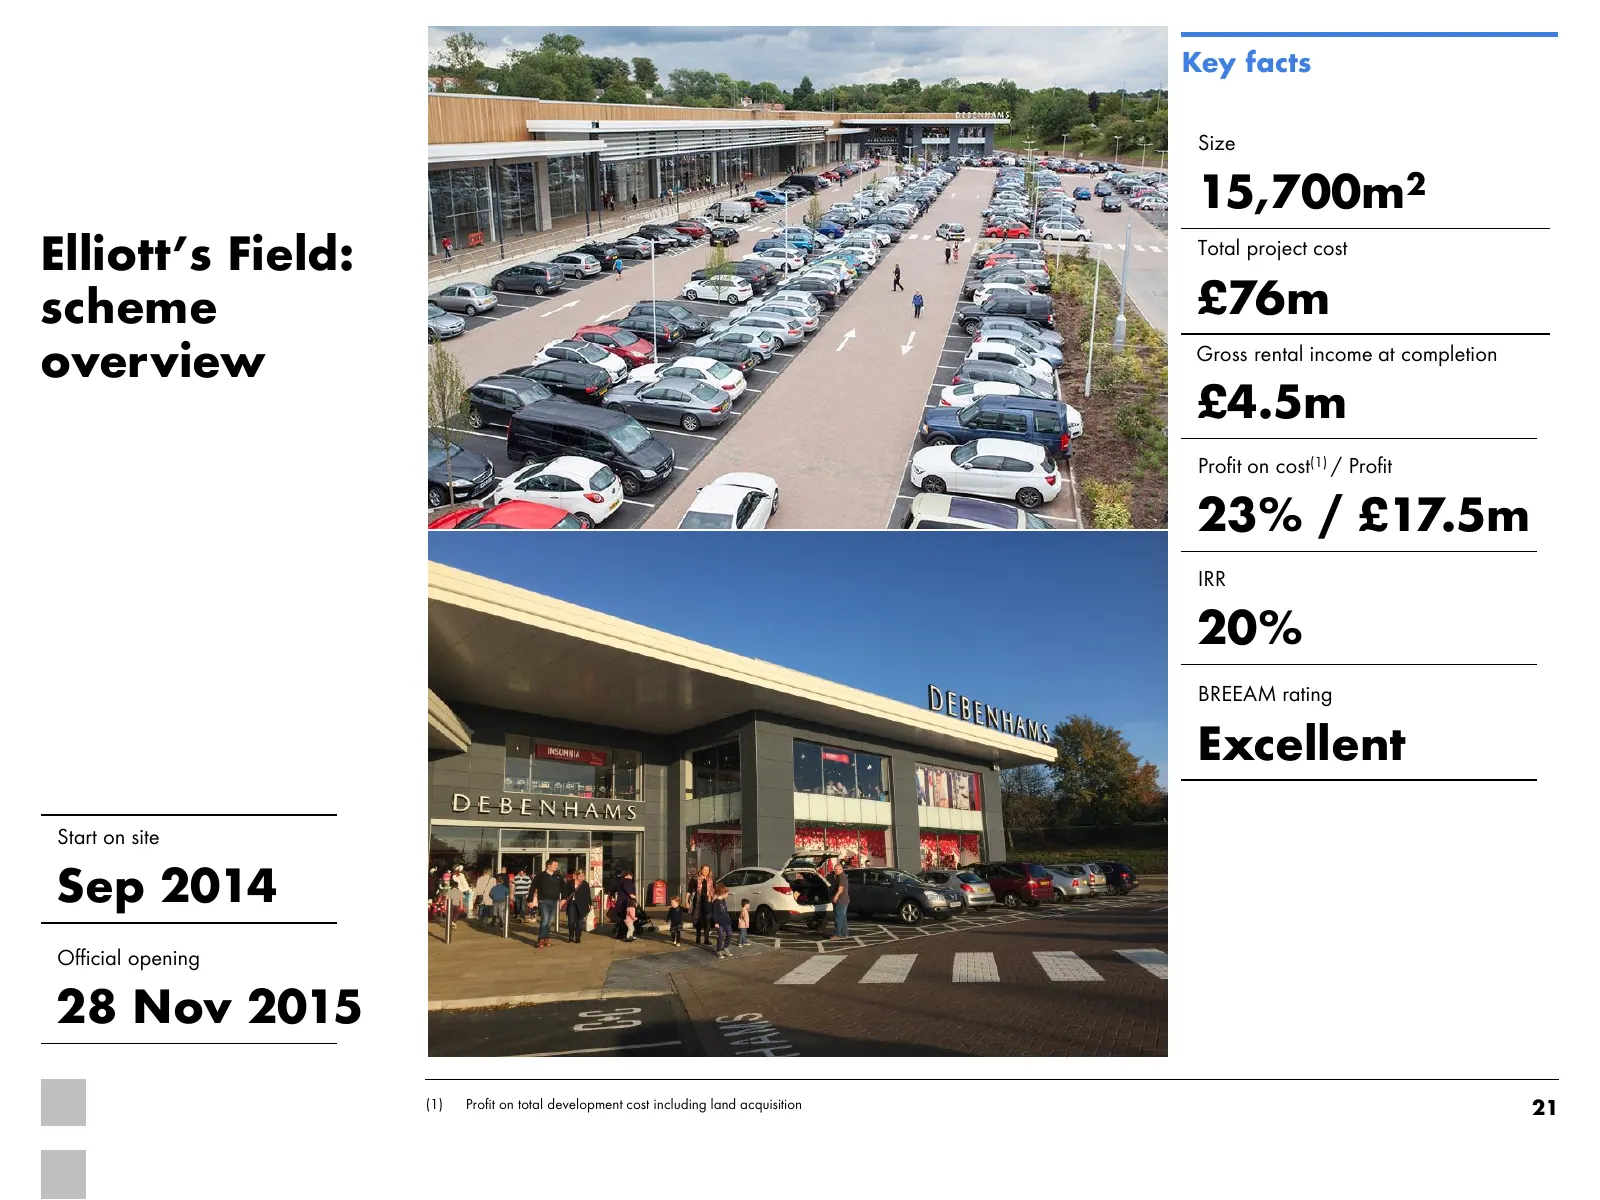
Key facts Size 15,700m2 Elliott’s Field: Total project cost scheme £76m overview Gross rental income at completion £4.5m Profit on cost(1) / Profit 23% / £17.5m IRR 20% BREEAM rating Excellent Start on site Sep 2014 Official opening 28 Nov 2015 (1) Profit on total development cost including land acq
Slide 22: Rugby offers an ideal 'in-fill' location for retailers
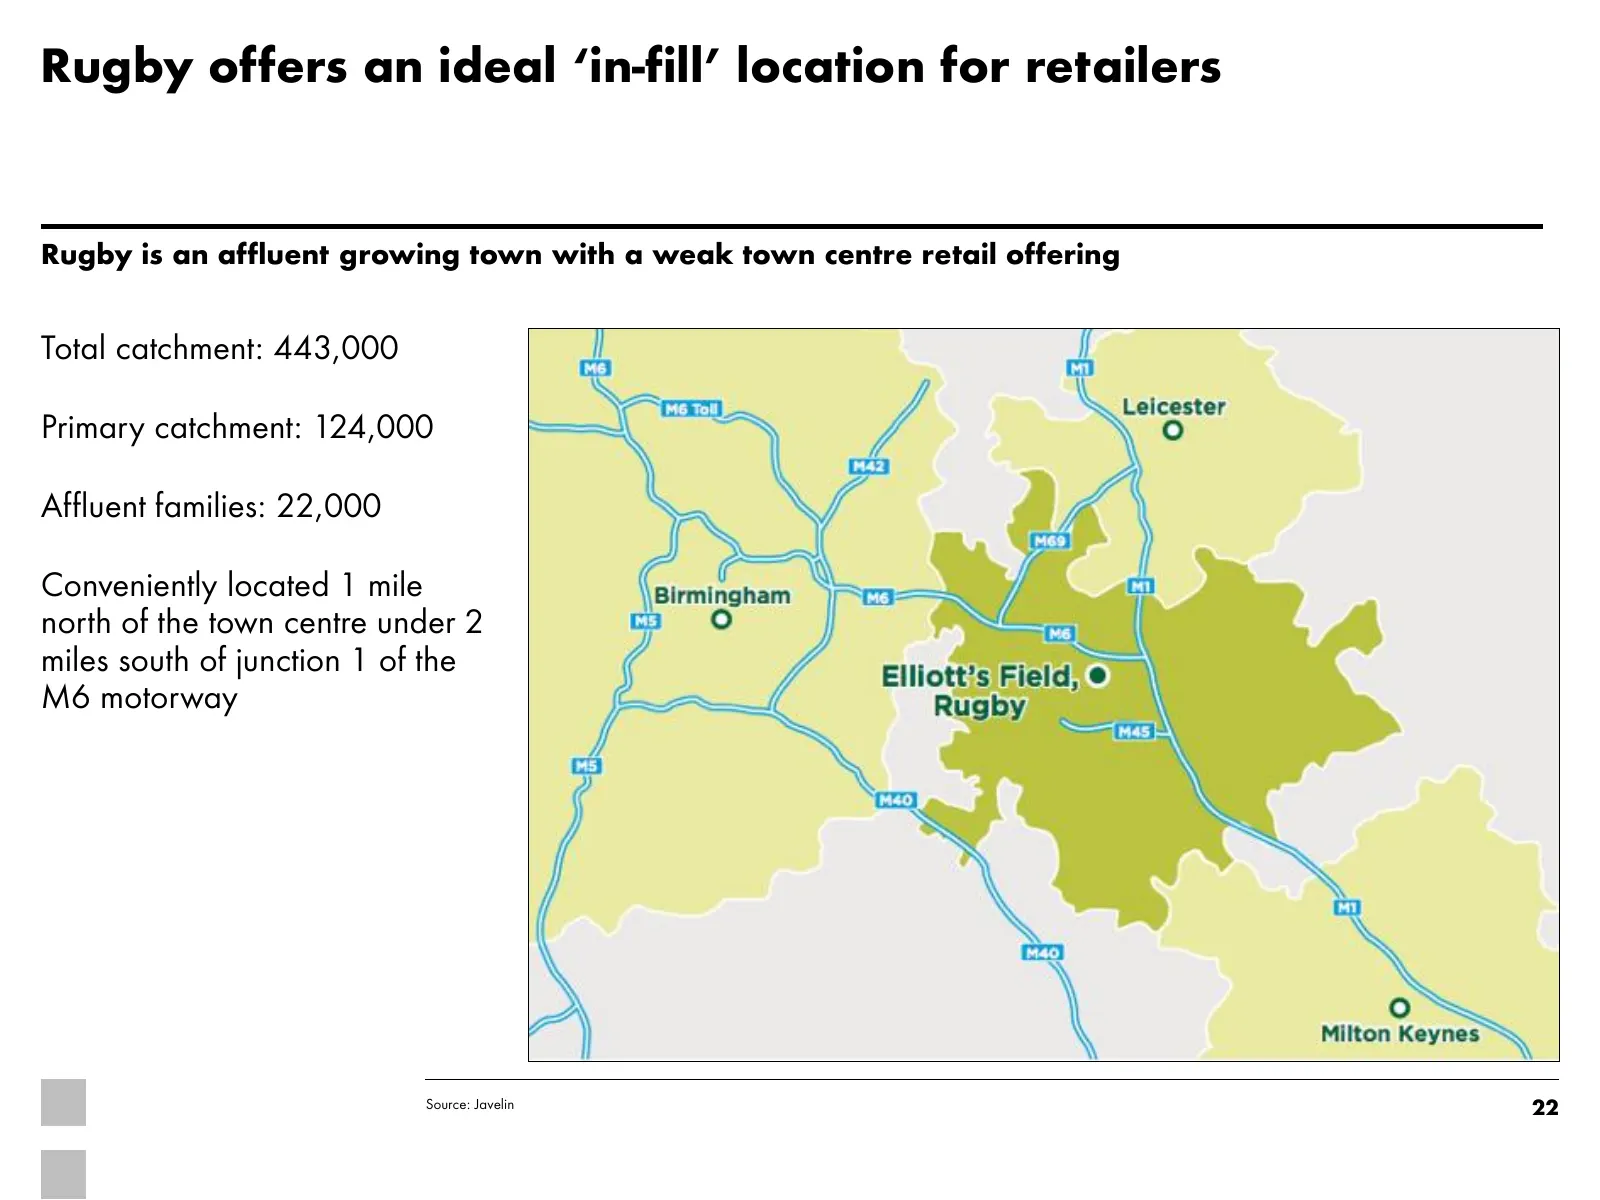
Rugby offers an ideal ‘in-fill’ location for retailers Rugby is an affluent growing town with a weak town centre retail offering Total catchment: 443,000 Primary catchment: 124,000 Affluent families: 22,000 Conveniently located 1 mile north of the town centre under 2 miles south of junction 1 of the
Slide 23: Working with retailers to deliver best in class service
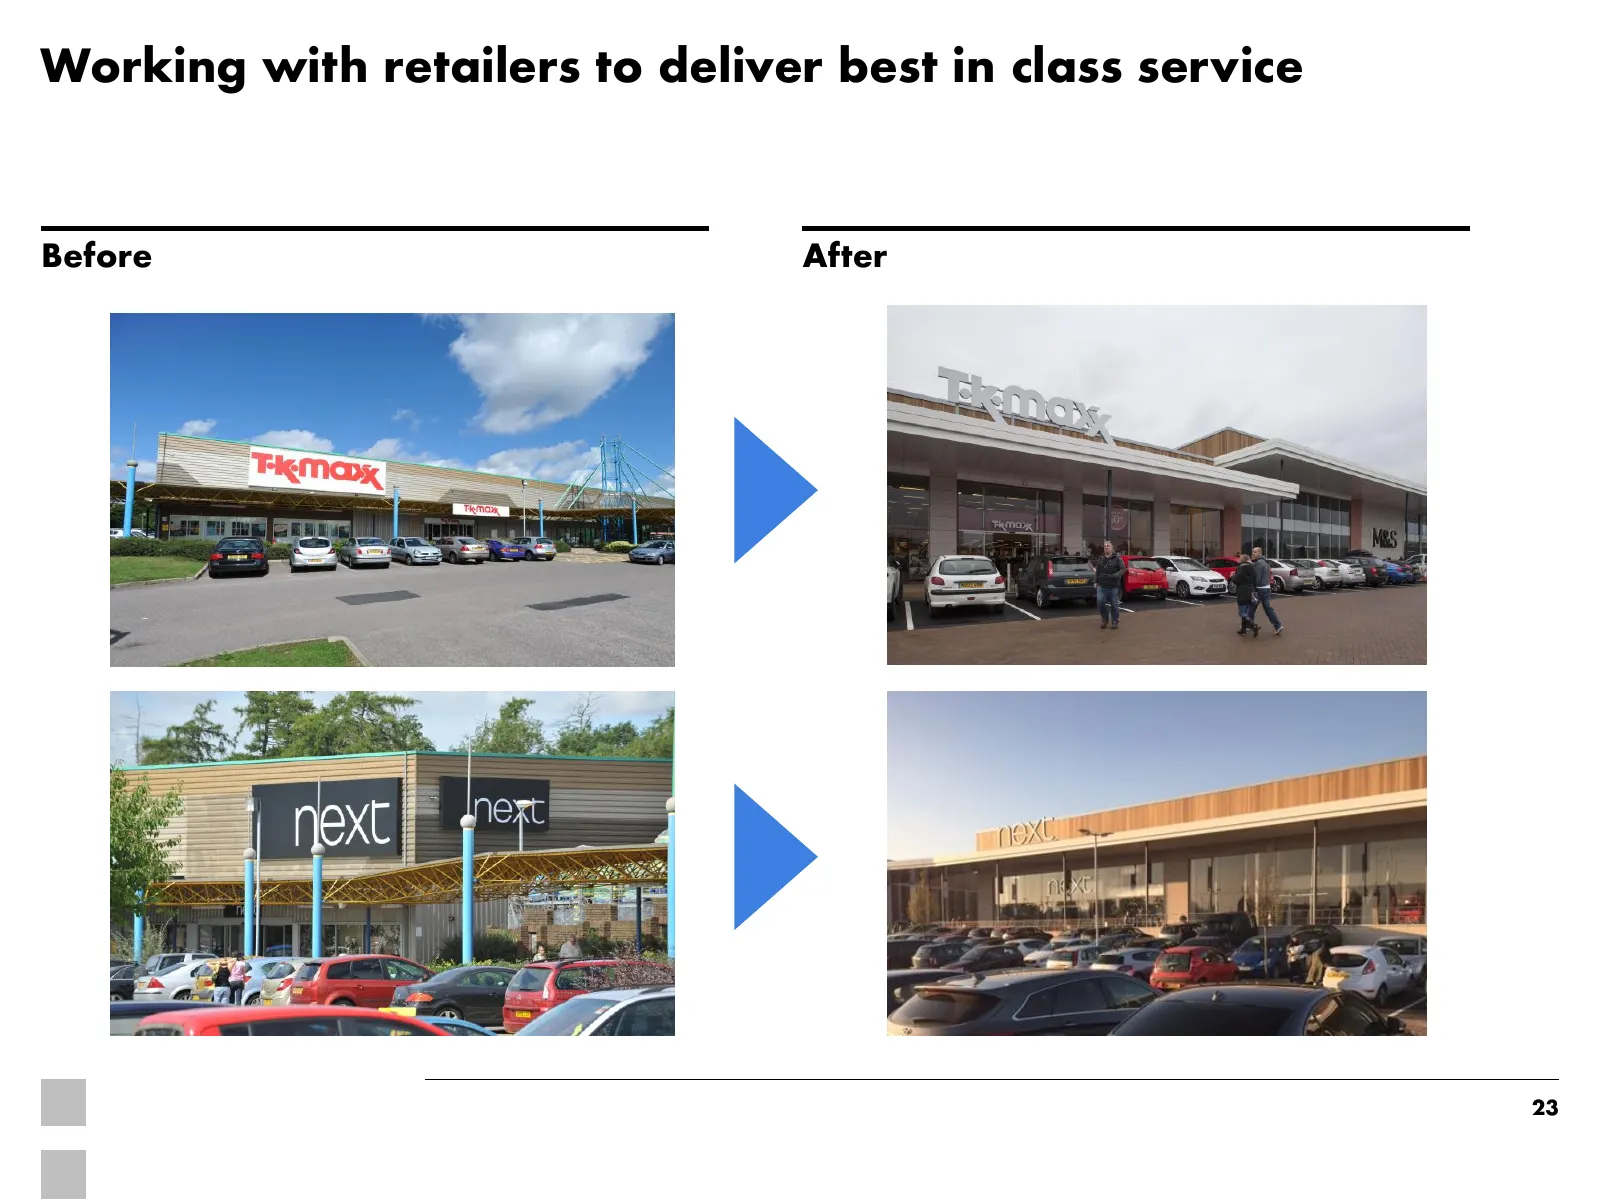
Working with retailers to deliver best in class service Before After 23
Slide 24: Fashion shopping on your doorstep
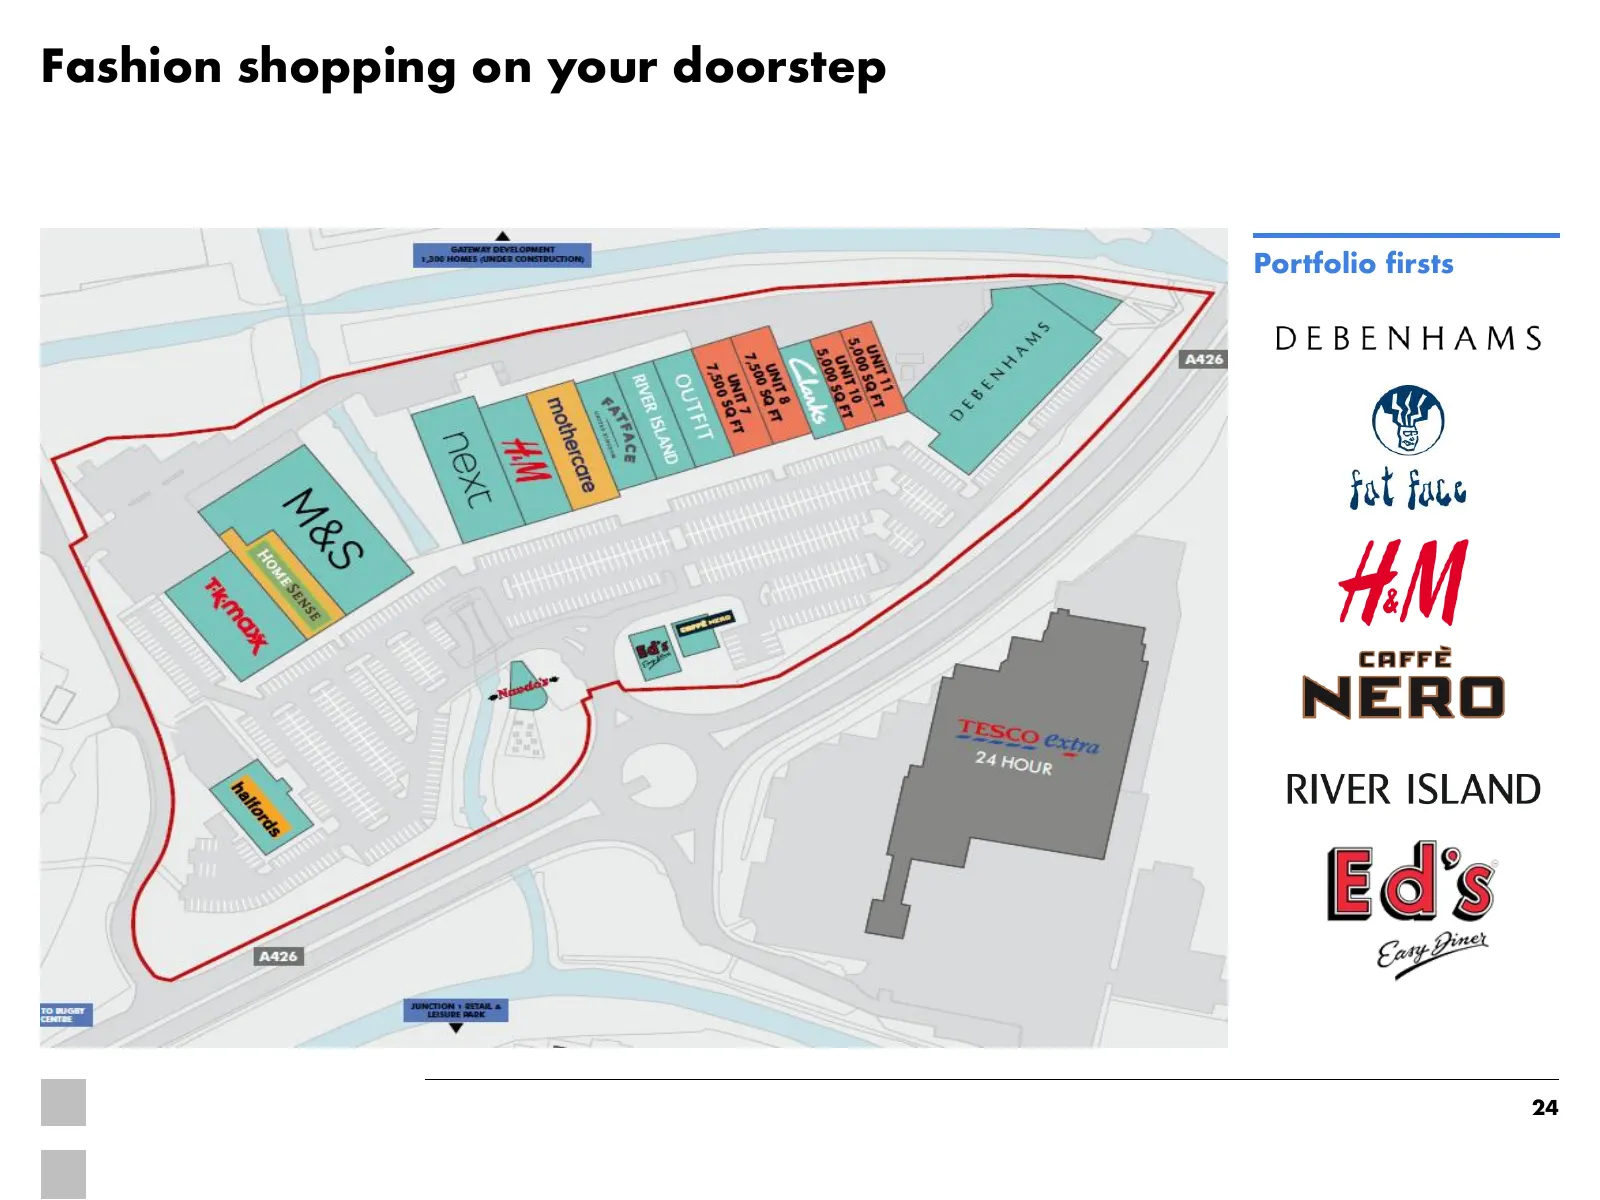
Fashion shopping on your doorstep Portfolio firsts 24
Slide 25: Shopping parks: the next generation parks
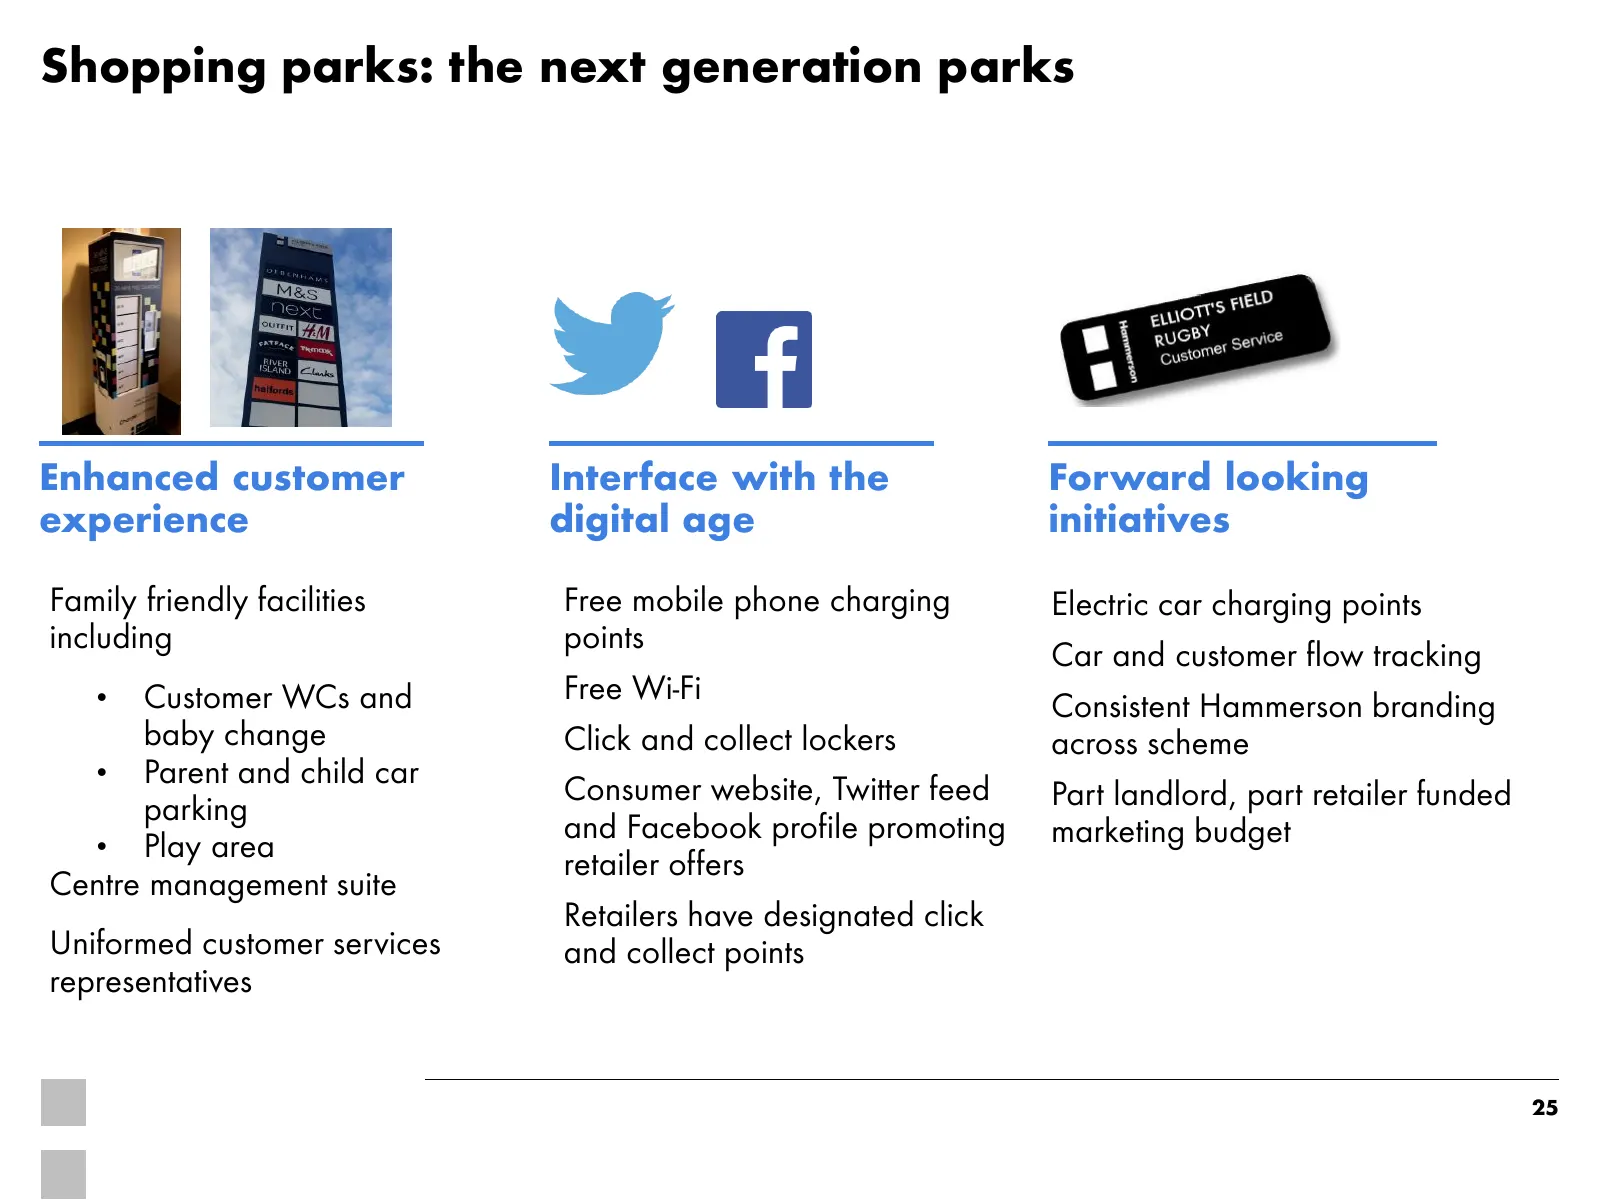
Shopping parks: the next generation parks Enhanced customer Interface with the Forward looking experience digital age initiatives Family friendly facilities Free mobile phone charging Electric car charging points including points Car and customer flow tracking • Customer WCs and Free Wi-Fi Consisten
Slide 26: Great returns, and more to come
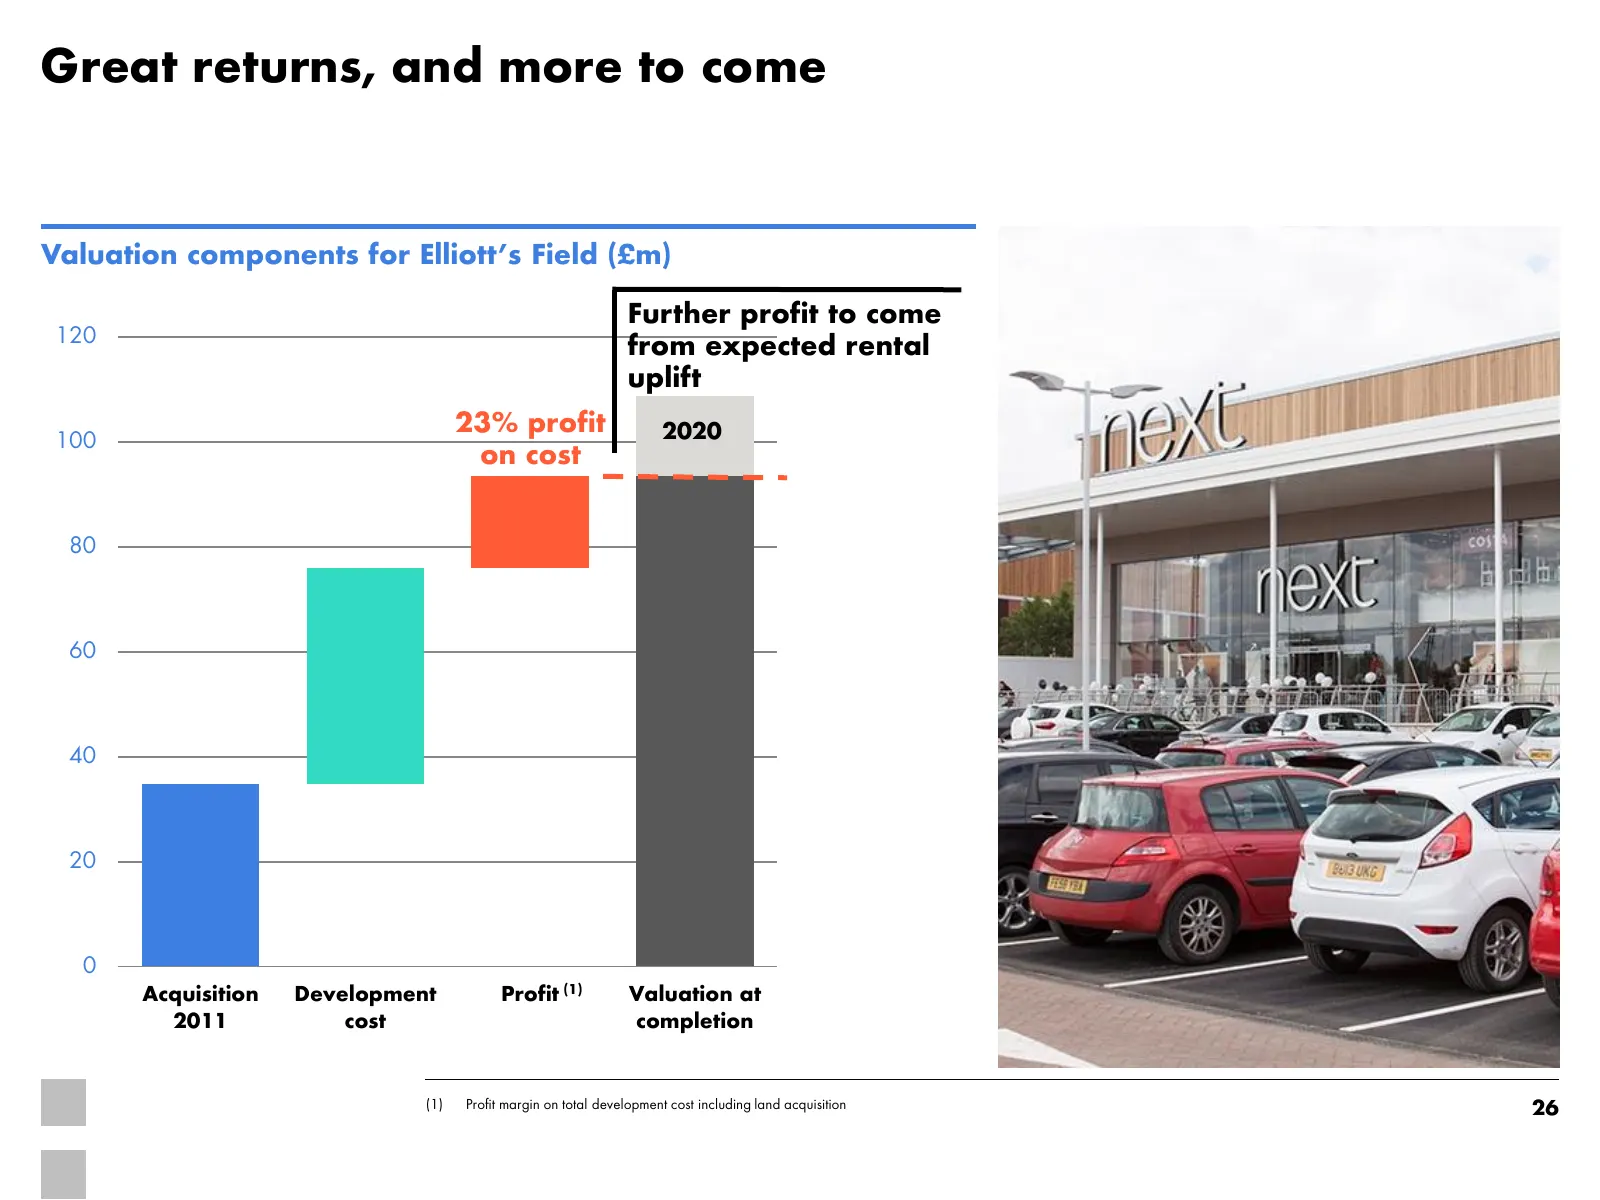
Great returns, and more to come Valuation components for Elliott’s Field (£m) Further profit to come 120 from expected rental uplift 23% profit 2020 100 on cost 80 60 40 20 0 Acquisition Development Profit (1) Valuation at 2011 cost completion (1) Profit margin on total development cost including la
Slide 27: Hammerson's next fashion park: Orchard Centre, Didcot
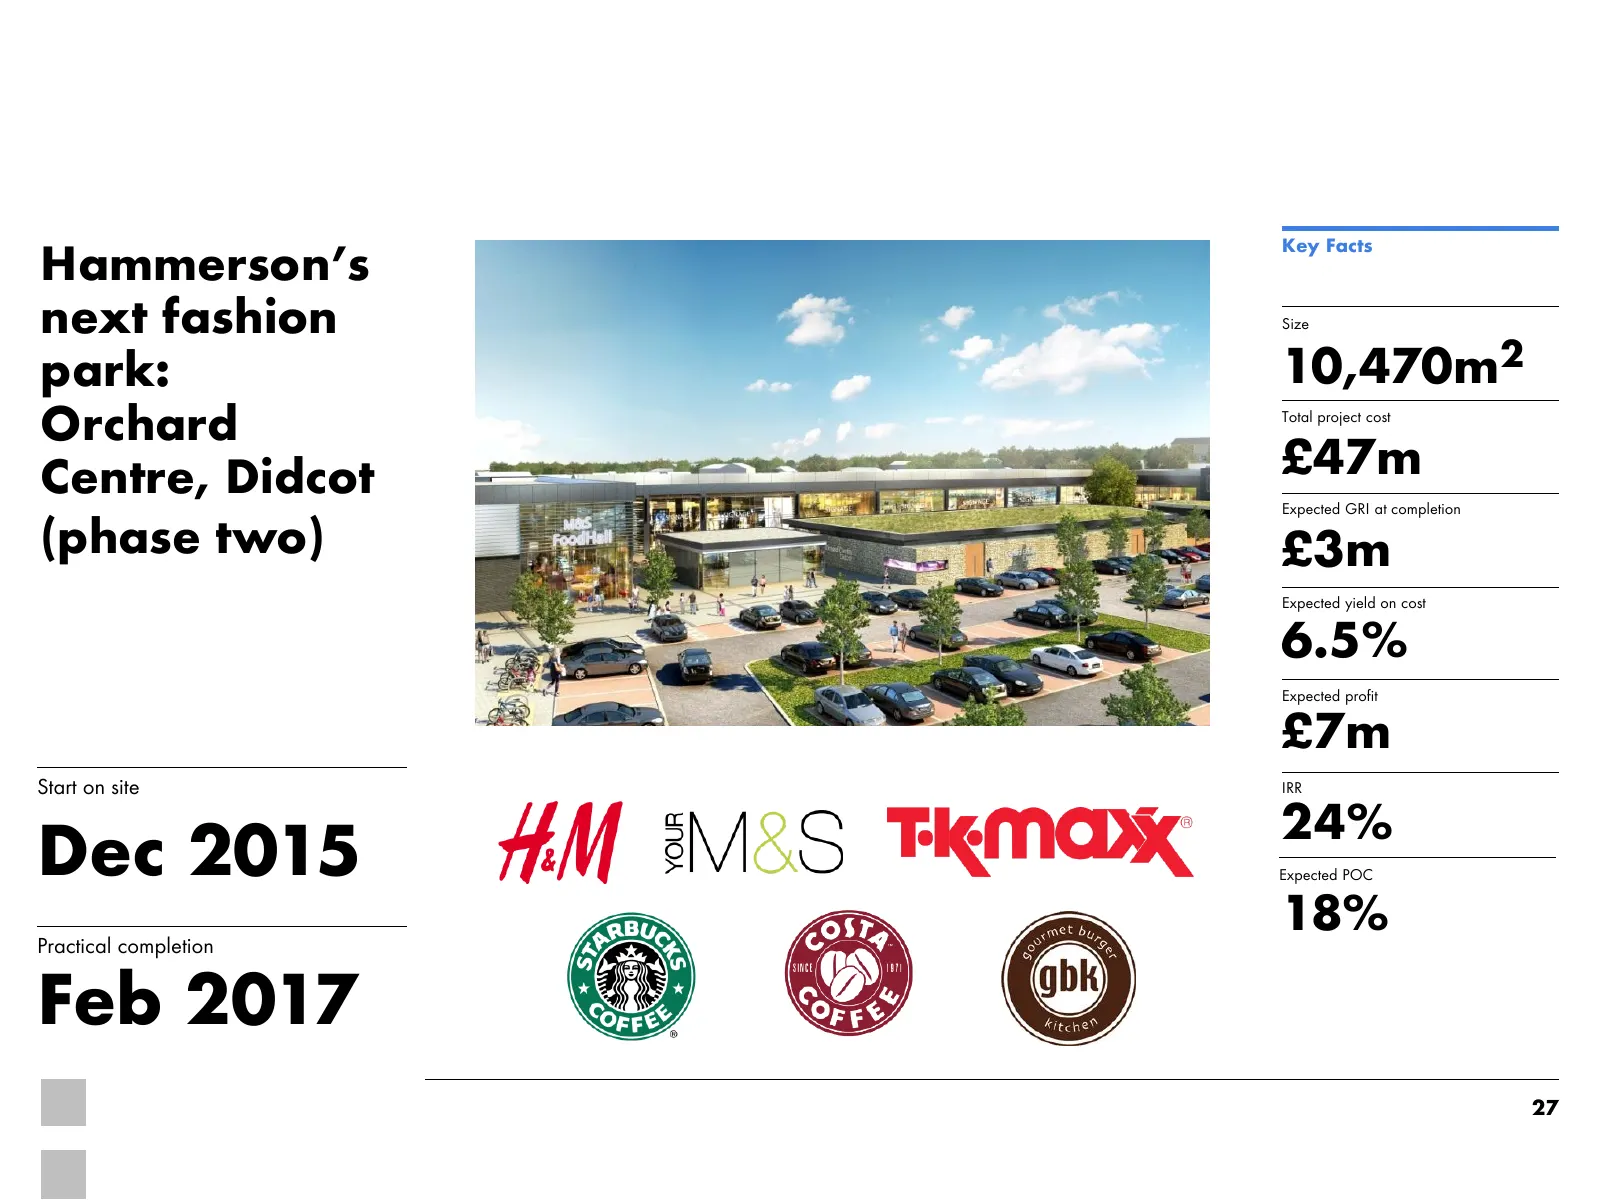
Hammerson’s Key Facts next fashion Size park: 10,470m2 Orchard Total project cost Centre, Didcot £47m Expected GRI at completion (phase two) £3m Expected yield on cost 6.5% Expected profit £7m Start on site IRR 24% Dec 2015 Expected POC Practical completion 18% Feb 2017 27

Slide 28: Questions
Questions

Slide 29: Our portfolio position today
03 Our portfolio position today David Atkins CEO 29
Slide 30: We create desirability
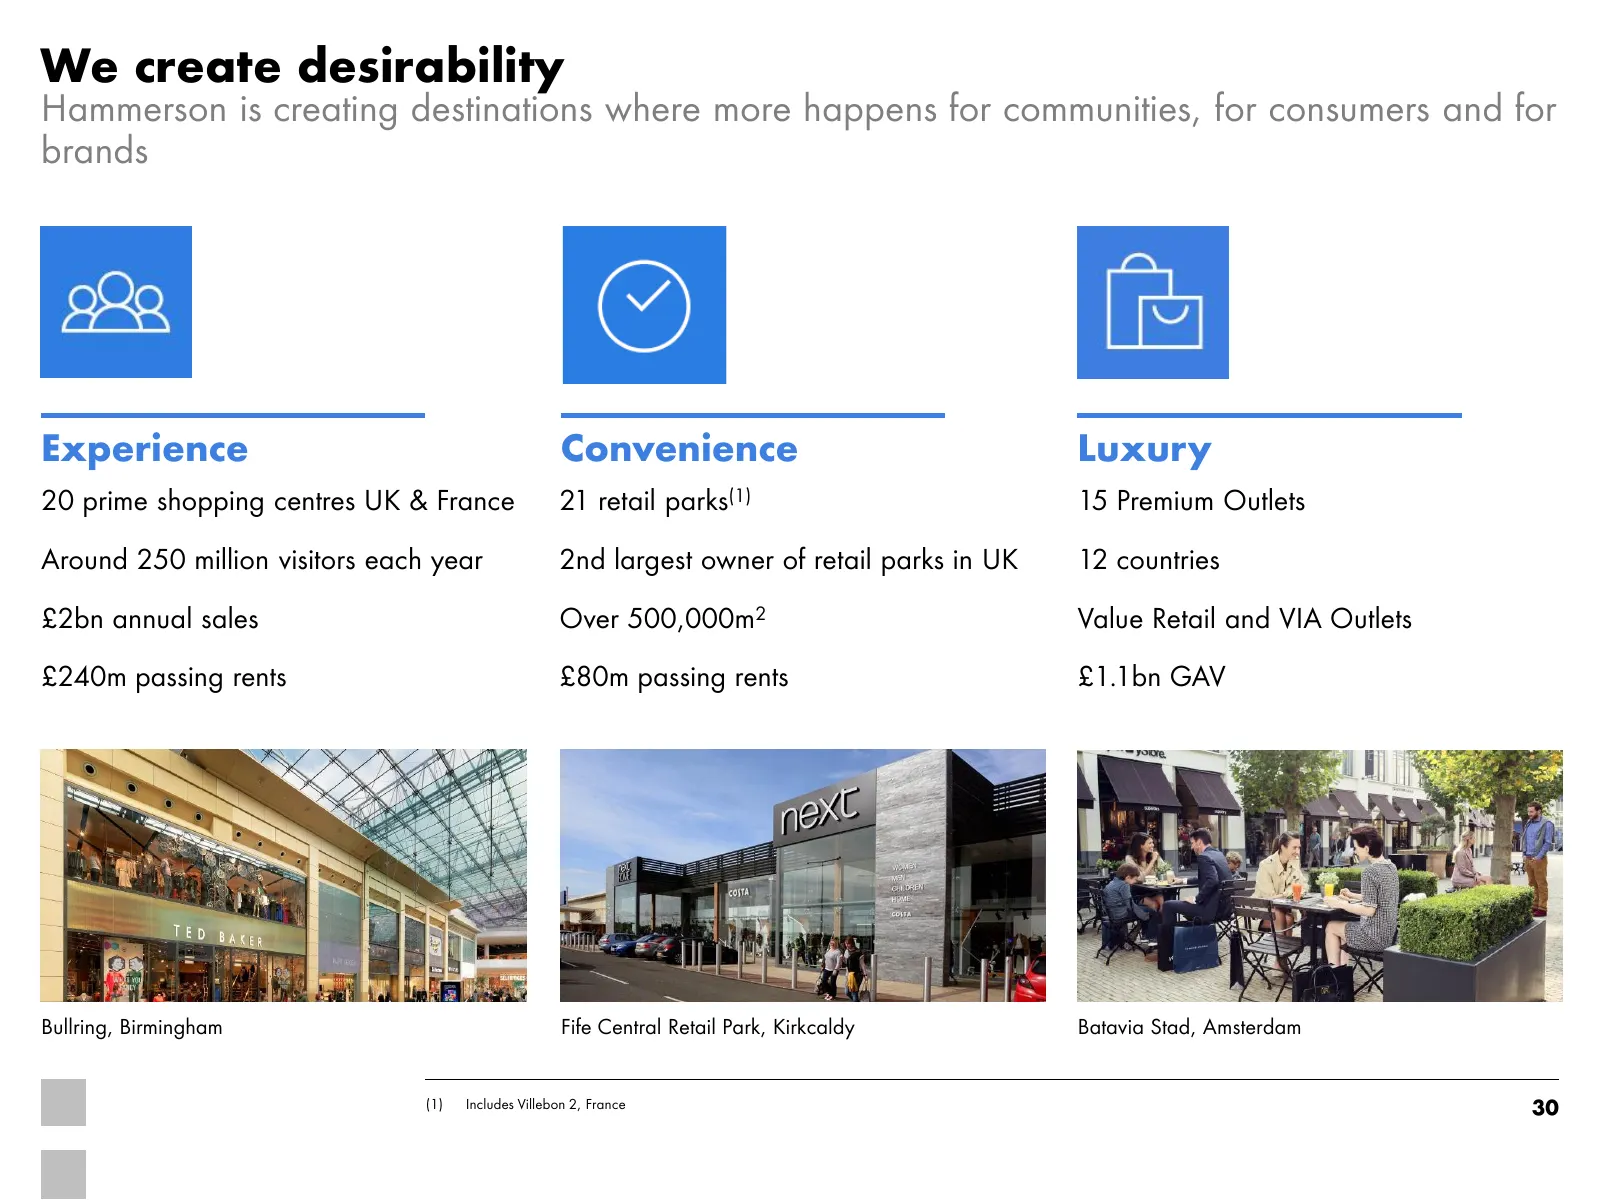
We create desirability Hammerson is creating destinations where more happens for communities, for consumers and for brands Experience Convenience Luxury 20 prime shopping centres UK & France 21 retail parks(1) 15 Premium Outlets Around 250 million visitors each year 2nd largest owner of retail parks
Slide 31: Guided by clear strategic priorities
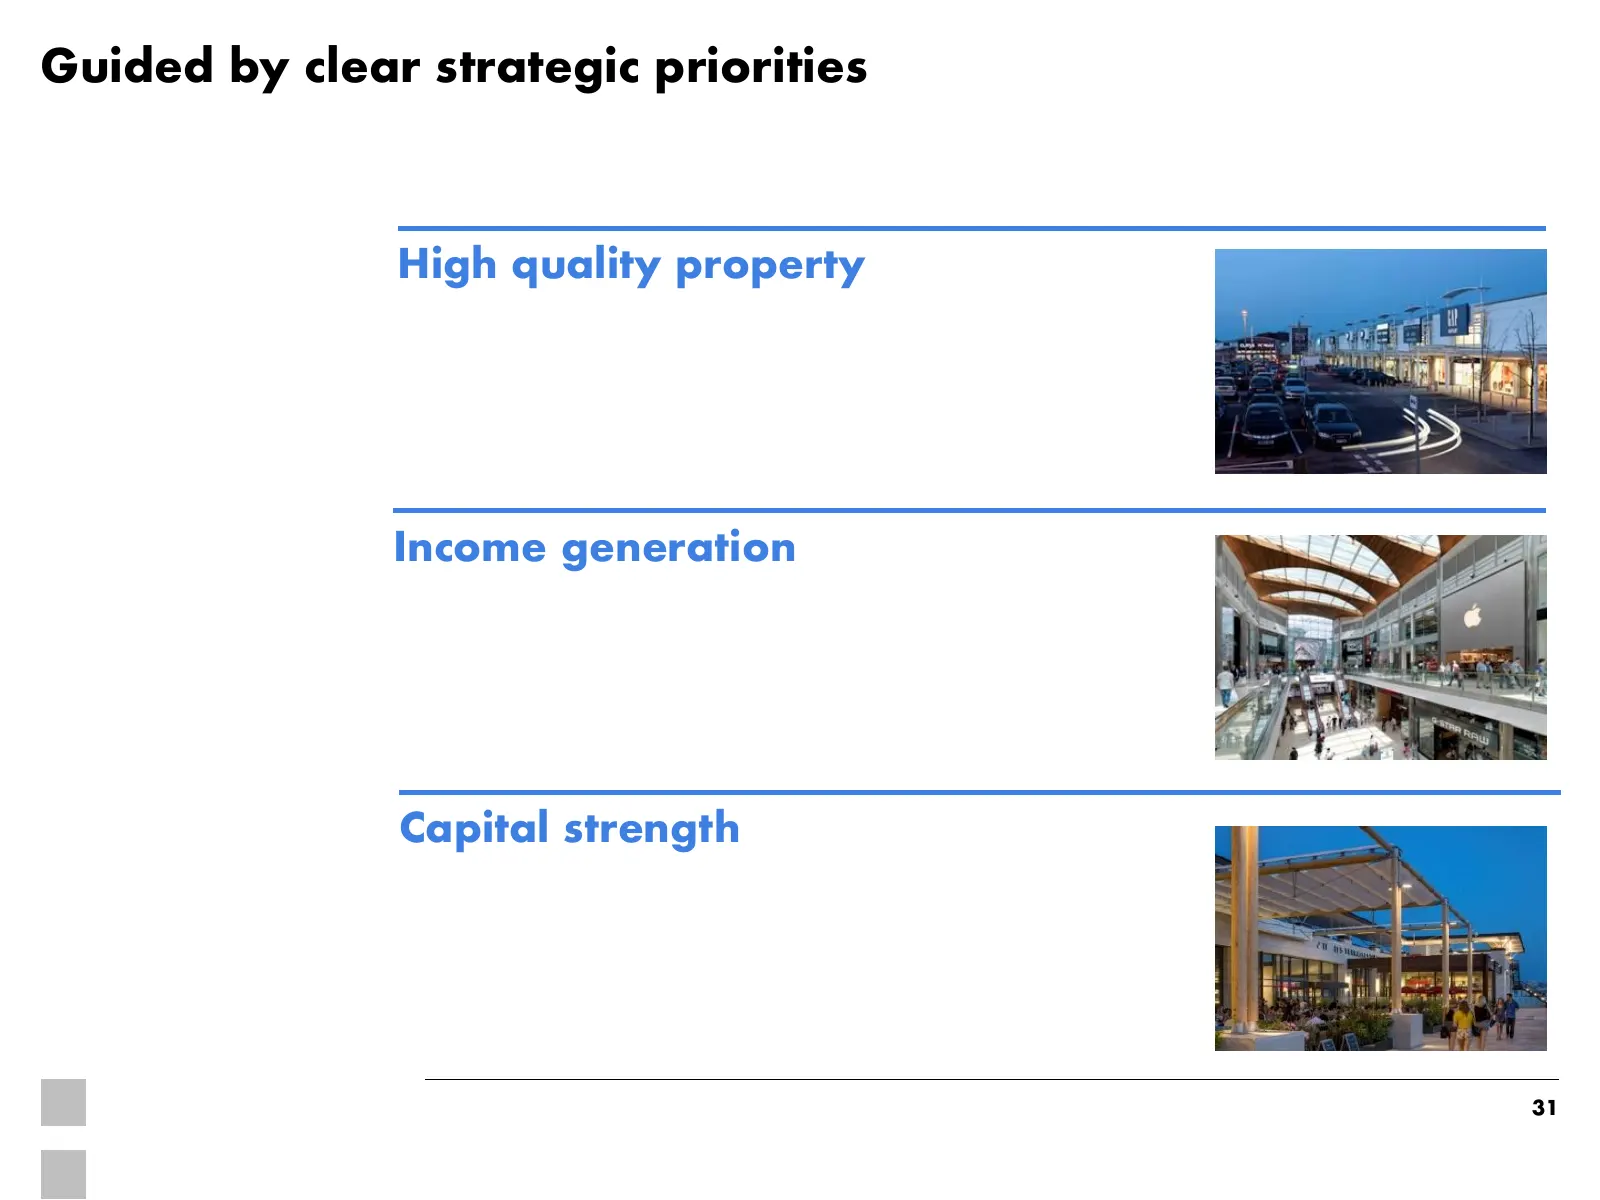
Guided by clear strategic priorities High quality property Income generation Capital strength 31
Slide 32: Our strategy to drive consistent earnings growth
Our strategy to drive consistent earnings growth 1. Strong and improving consumer backdrop 2. Applying our unique insight and skill to match latest retail trends 3. Investing incremental resources into fast-growing end markets 4. Focus on cost management and capital structure 5. Delivering a pipelin
Slide 33: Track-record of sector-beating earnings and dividend growth
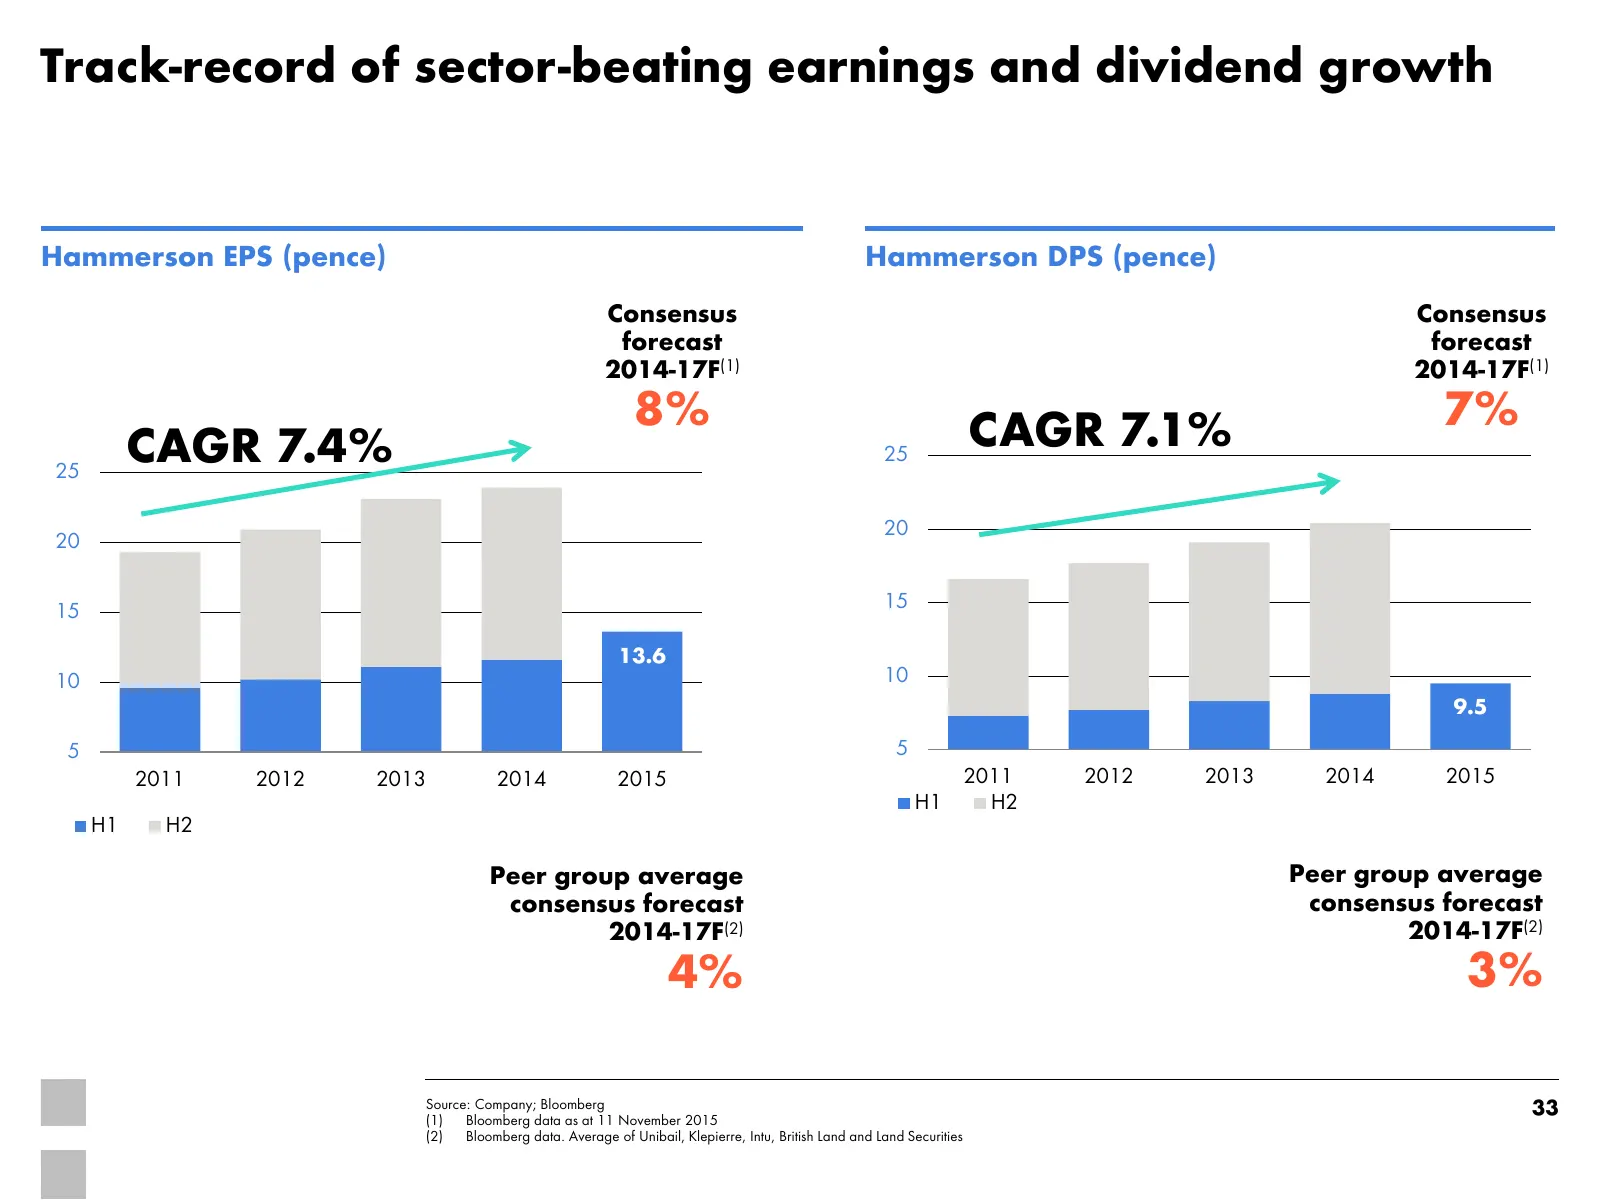
Track-record of sector-beating earnings and dividend growth Hammerson EPS (pence) Hammerson DPS (pence) Consensus Consensus forecast forecast 2014-17F(1) 2014-17F(1) 8% CAGR 7.1% 7% 25 CAGR 7.4% 25 20 20 15 15 13.6 10 10 9.5 5 5 2011 2012 2013 2014 2015 2011 2012 2013 2014 2015 H1 H2 H1 H2 Peer grou
Slide 34: A larger and enhanced European retail portfolio
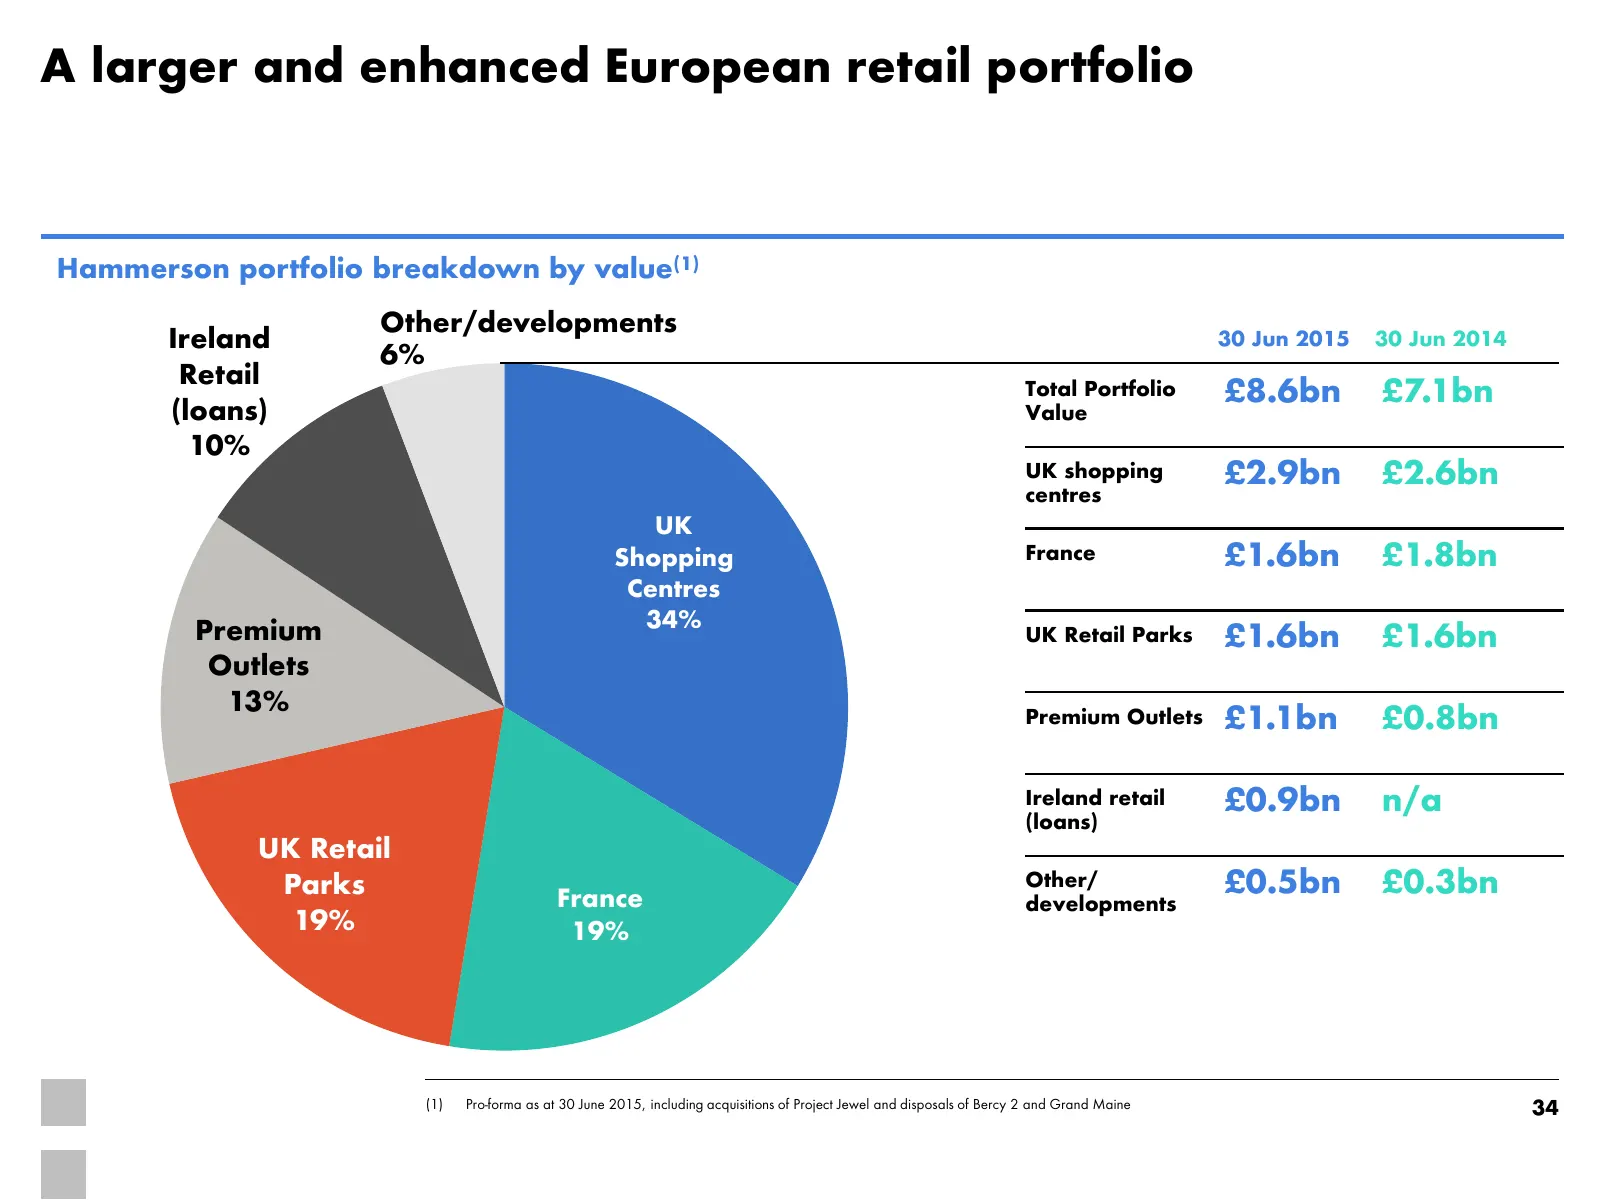
A larger and enhanced European retail portfolio Hammerson portfolio breakdown by value(1) Other/developments Ireland 30 Jun 2015 30 Jun 2014 6% Retail Total Portfolio £8.6bn £7.1bn (loans) Value 10% UK shopping £2.9bn £2.6bn centres UK Shopping France £1.6bn £1.8bn Centres Premium 34% UK Retail Park
Slide 35: Investing in fast-growing markets
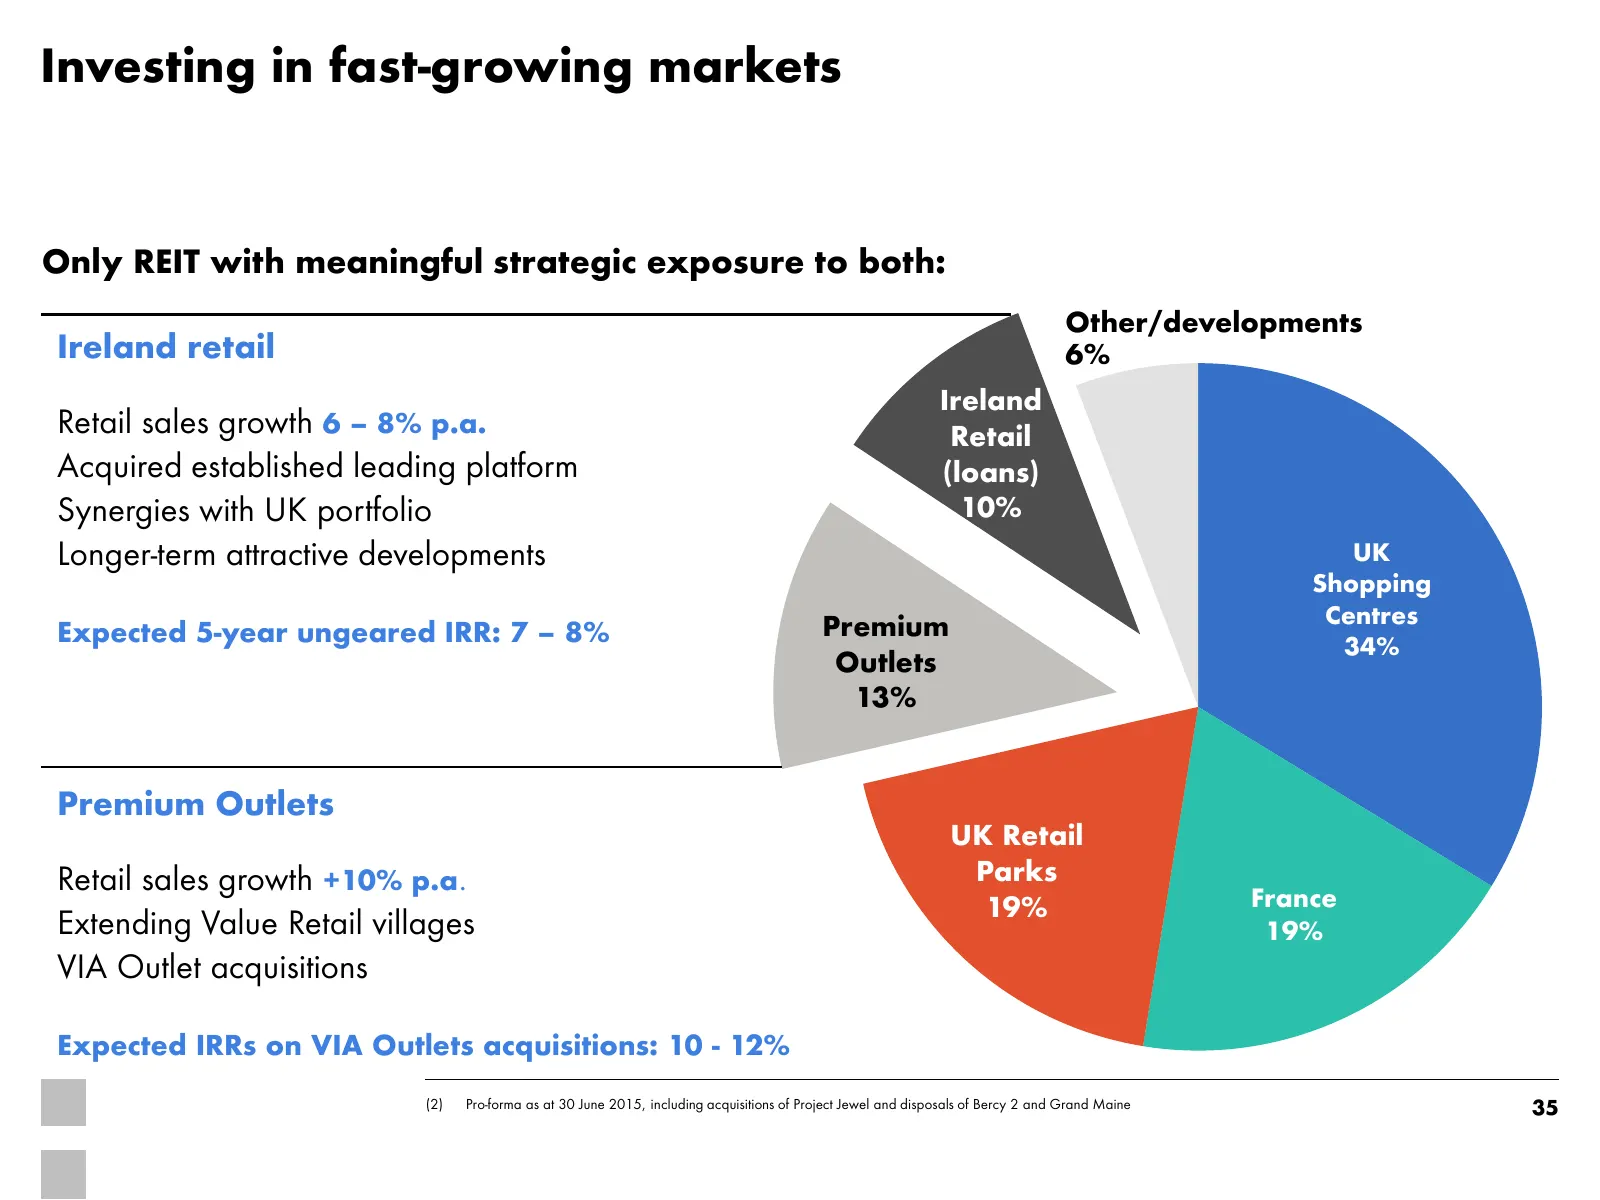
Investing in fast-growing markets Only REIT with meaningful strategic exposure to both: Other/developments Ireland retail 6% Ireland Retail sales growth 6 – 8% p.a. Retail Acquired established leading platform (loans) Synergies with UK portfolio 10% Longer-term attractive developments UK Shopping Ce
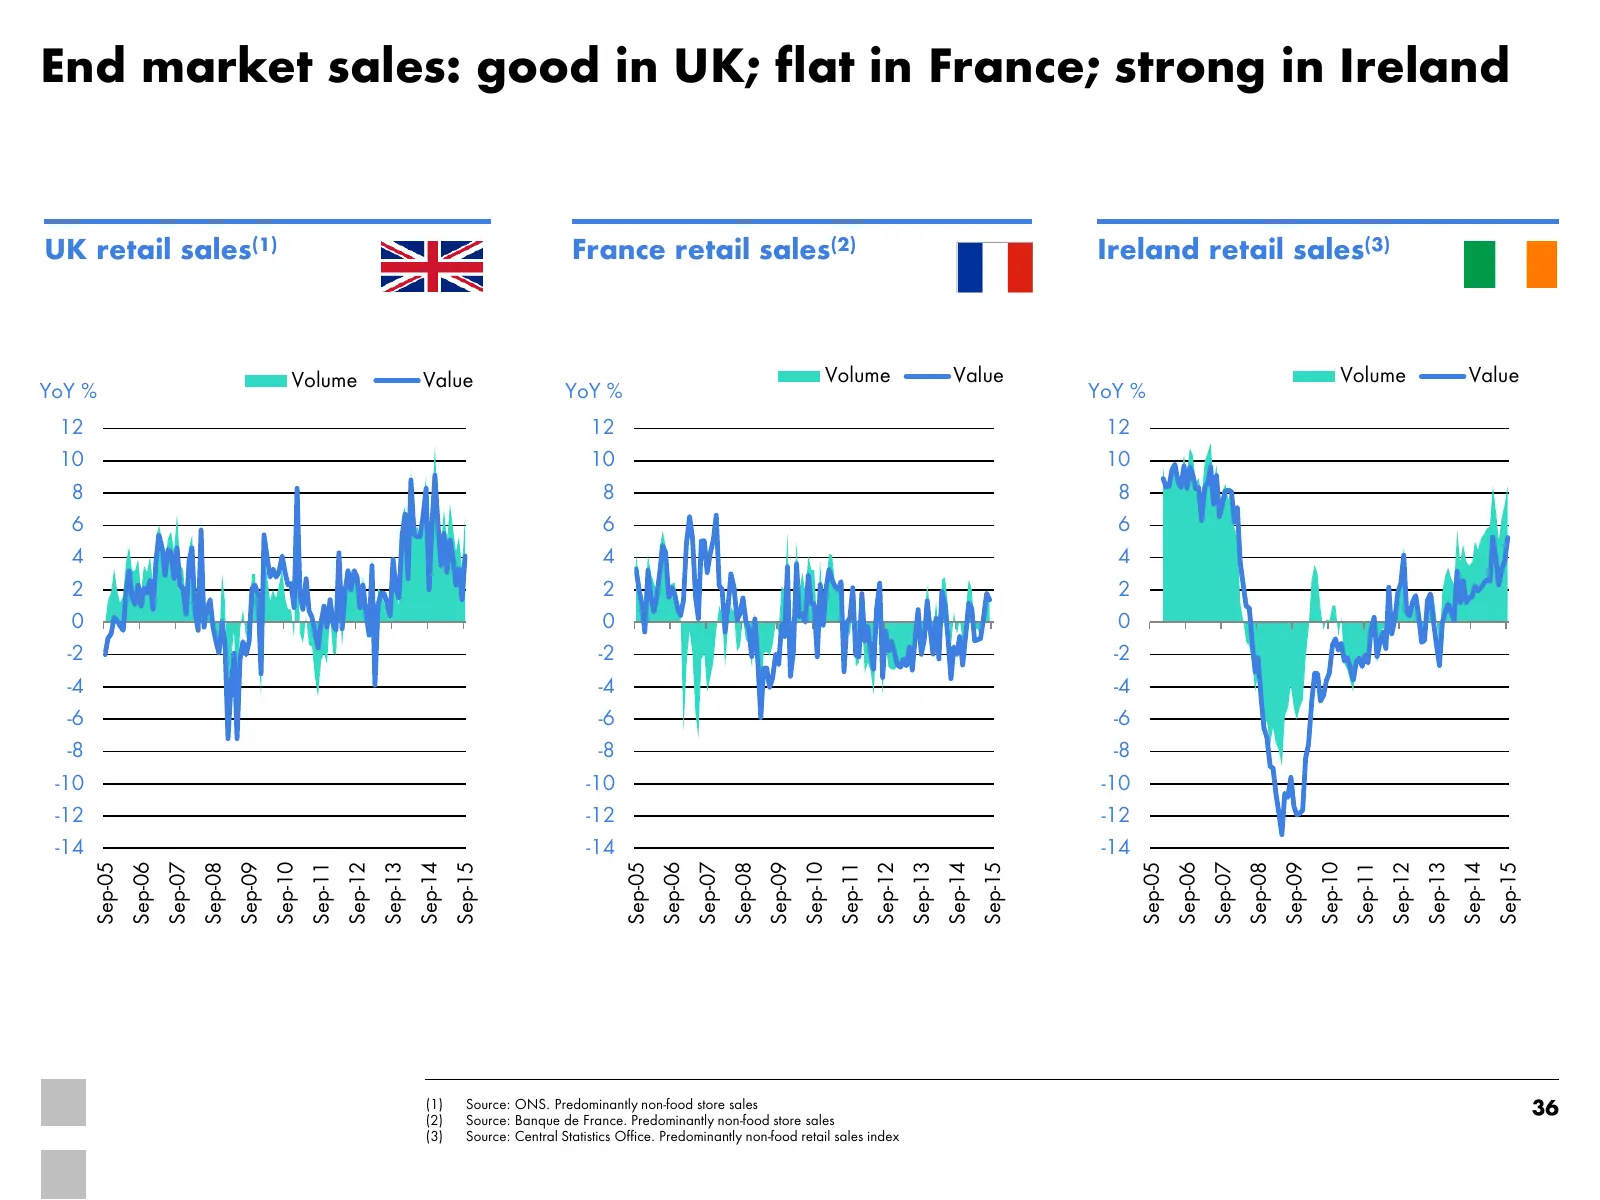
Slide 36: End market sales: good in UK; flat in France; strong in Ireland
End market sales: good in UK; flat in France; strong in Ireland UK retail sales(1) France retail sales(2) Ireland retail sales(3) Volume Value Volume Value Volume Value YoY % YoY % YoY % 12 12 12 10 10 10 8 8 8 6 6 6 4 4 4 2 2 2 0 0 0 -2 -2 -2 -4 -4 -4 -6 -6 -6 -8 -8 -8 -10 -10 -10 -12 -12 -12 -14 -
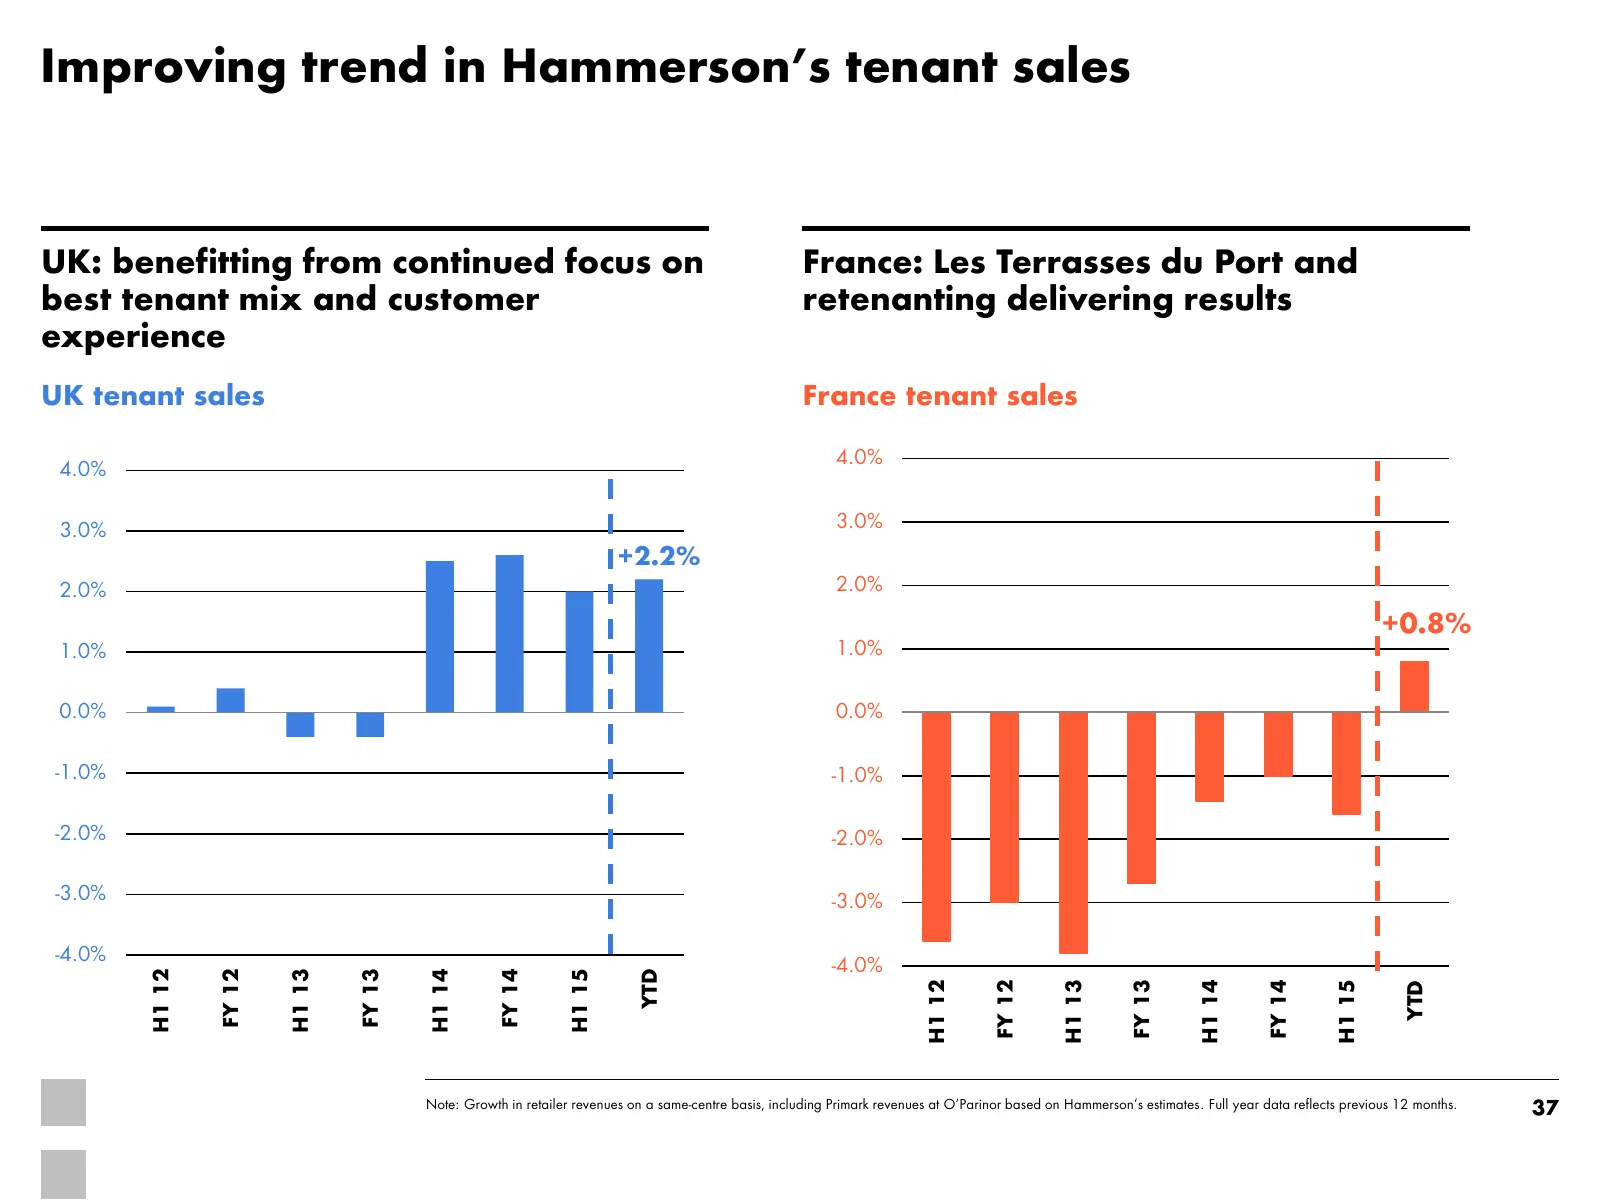
Slide 37: Improving trend in Hammerson's tenant sales
Improving trend in Hammerson’s tenant sales UK: benefitting from continued focus on France: Les Terrasses du Port and best tenant mix and customer retenanting delivering results experience UK tenant sales France tenant sales 4.0% 4.0% 3.0% 3.0% +2.2% 2.0% 2.0% +0.8% 1.0% 1.0% 0.0% 0.0% -1.0% -1.0% -
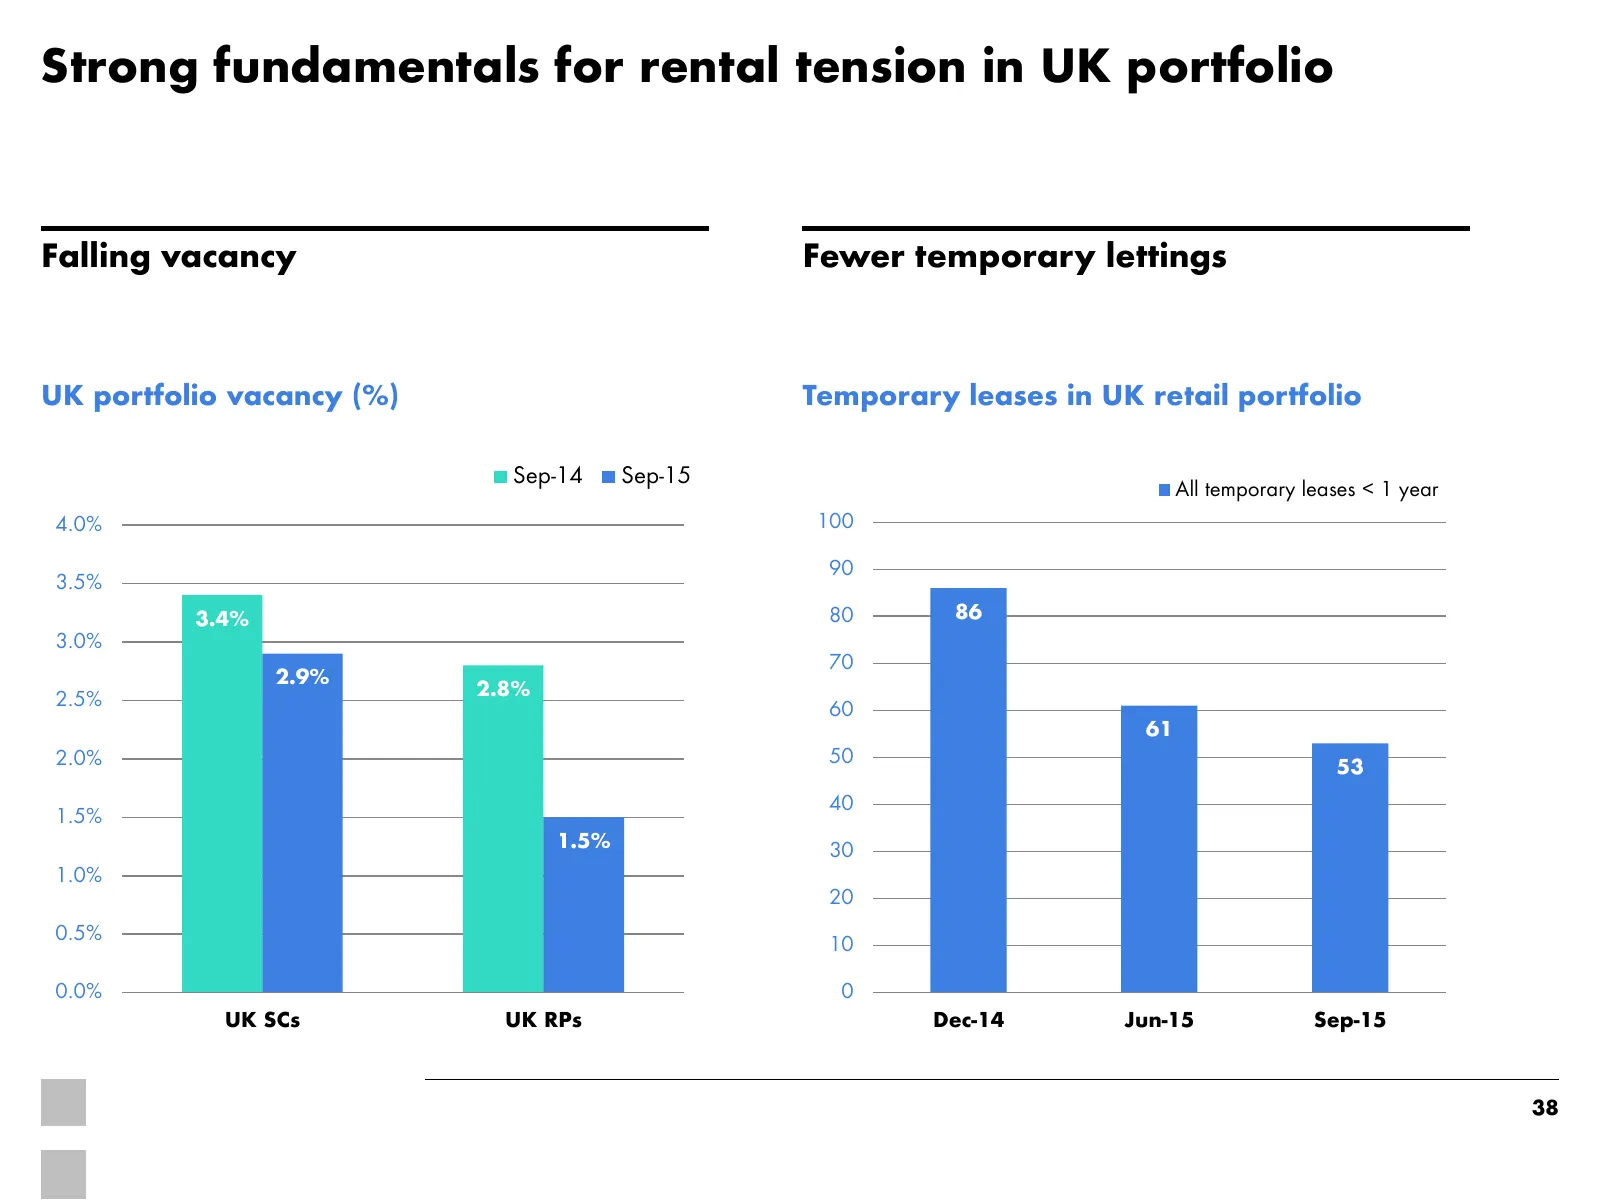
Slide 38: Strong fundamentals for rental tension in UK portfolio
Strong fundamentals for rental tension in UK portfolio Falling vacancy Fewer temporary lettings UK portfolio vacancy (%) Temporary leases in UK retail portfolio Sep-14 Sep-15 All temporary leases < 1 year 4.0% 100 90 3.5% 3.4% 80 86 3.0% 70 2.9% 2.8% 2.5% 60 61 2.0% 50 53 40 1.5% 1.5% 30 1.0% 20 0.5
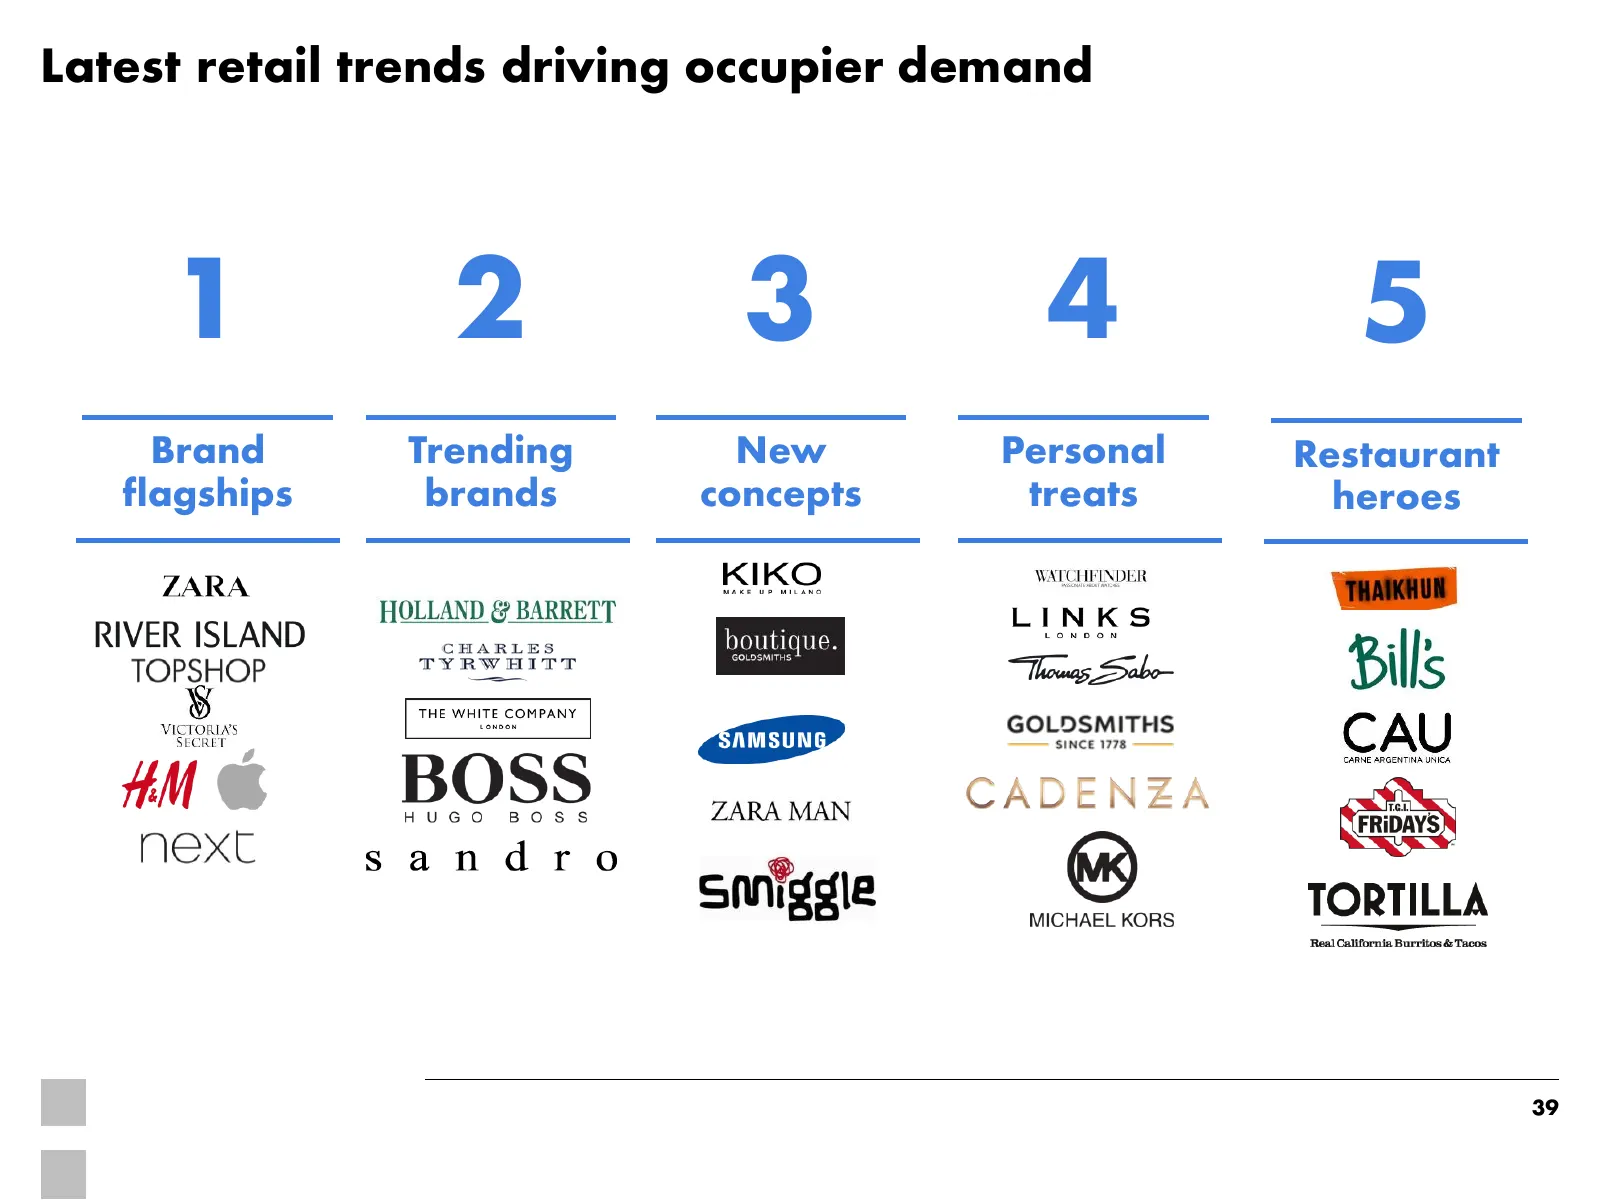
Slide 39: Latest retail trends driving occupier demand
Latest retail trends driving occupier demand 1 2 3 4 5 Brand Trending New Personal Restaurant flagships brands concepts treats heroes 39
Slide 40: Letting above / (below) ERV
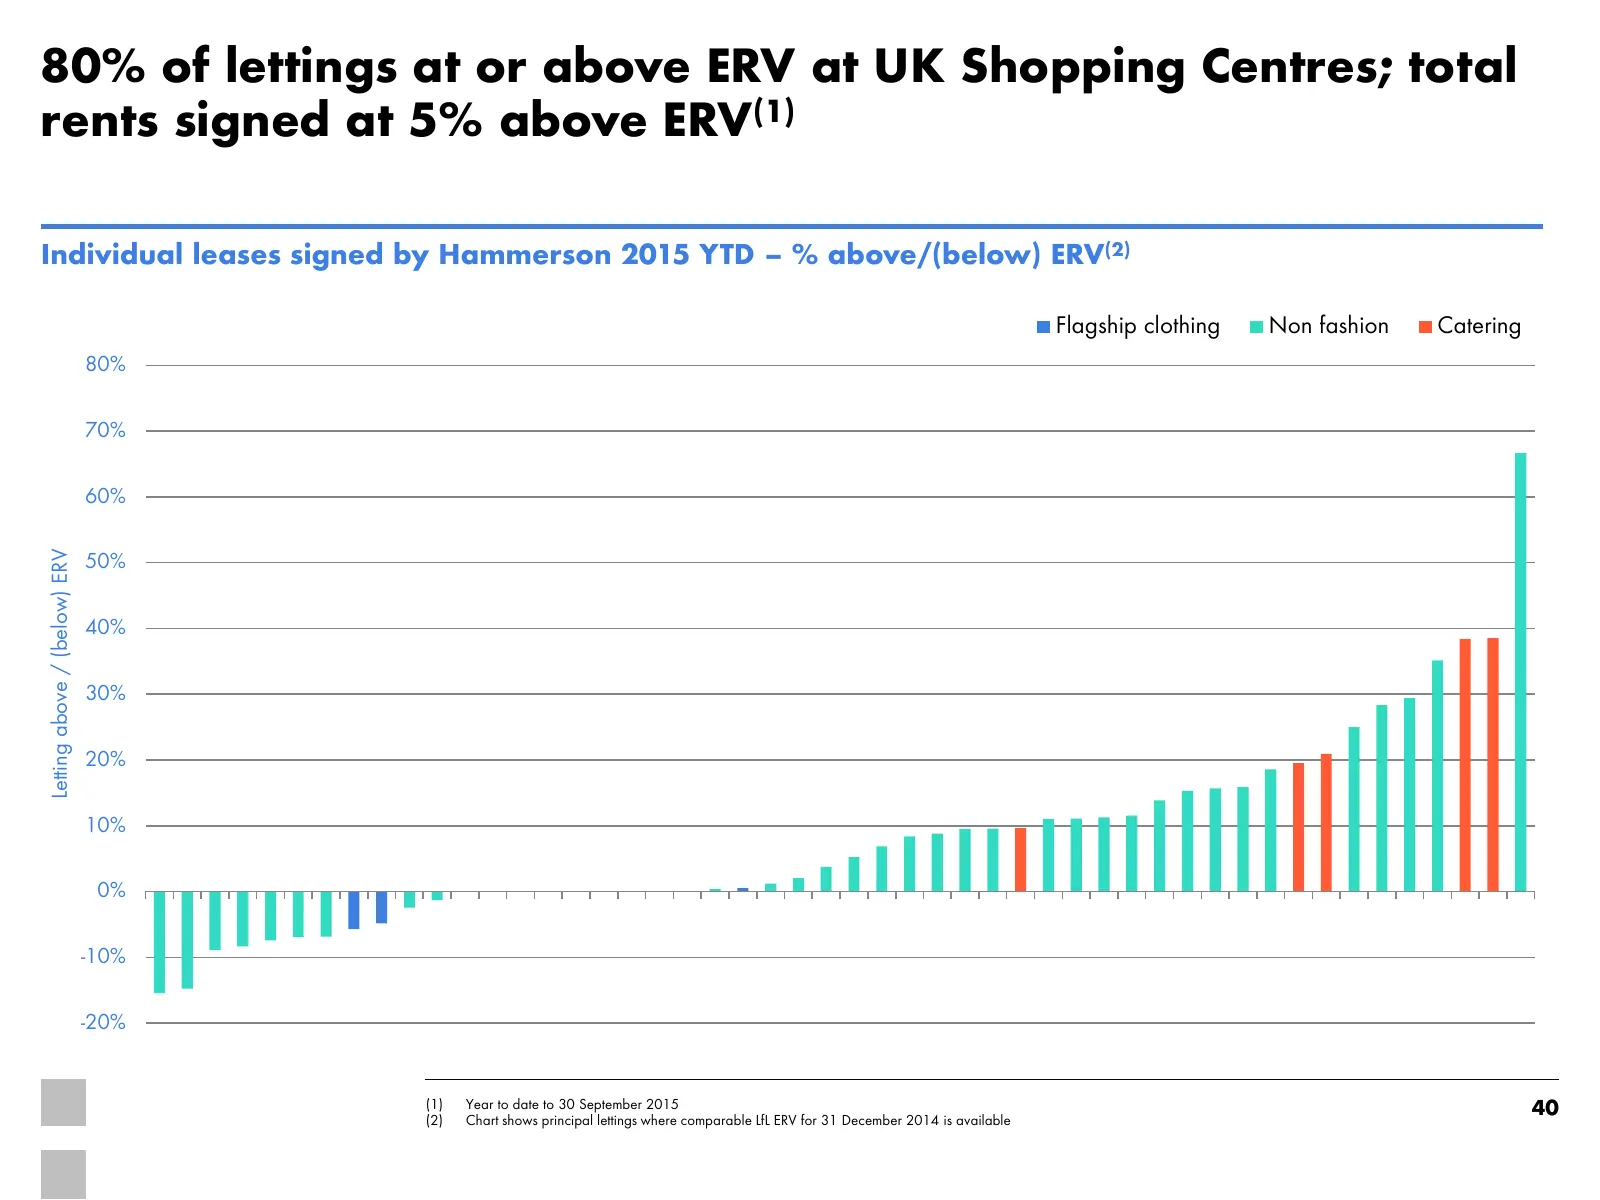
80% of lettings at or above ERV at UK Shopping Centres; total rents signed at 5% above ERV(1) Individual leases signed by Hammerson 2015 YTD – % above/(below) ERV(2) Flagship clothing Non fashion Catering 80% 70% 60% 50% Letting above / (below) ERV 40% 30% 20% 10% 0% -10% -20% (1) (2) Year to date t
Slide 41: Hammerson shopping centre rental growth – moving on ERVs centre by centre
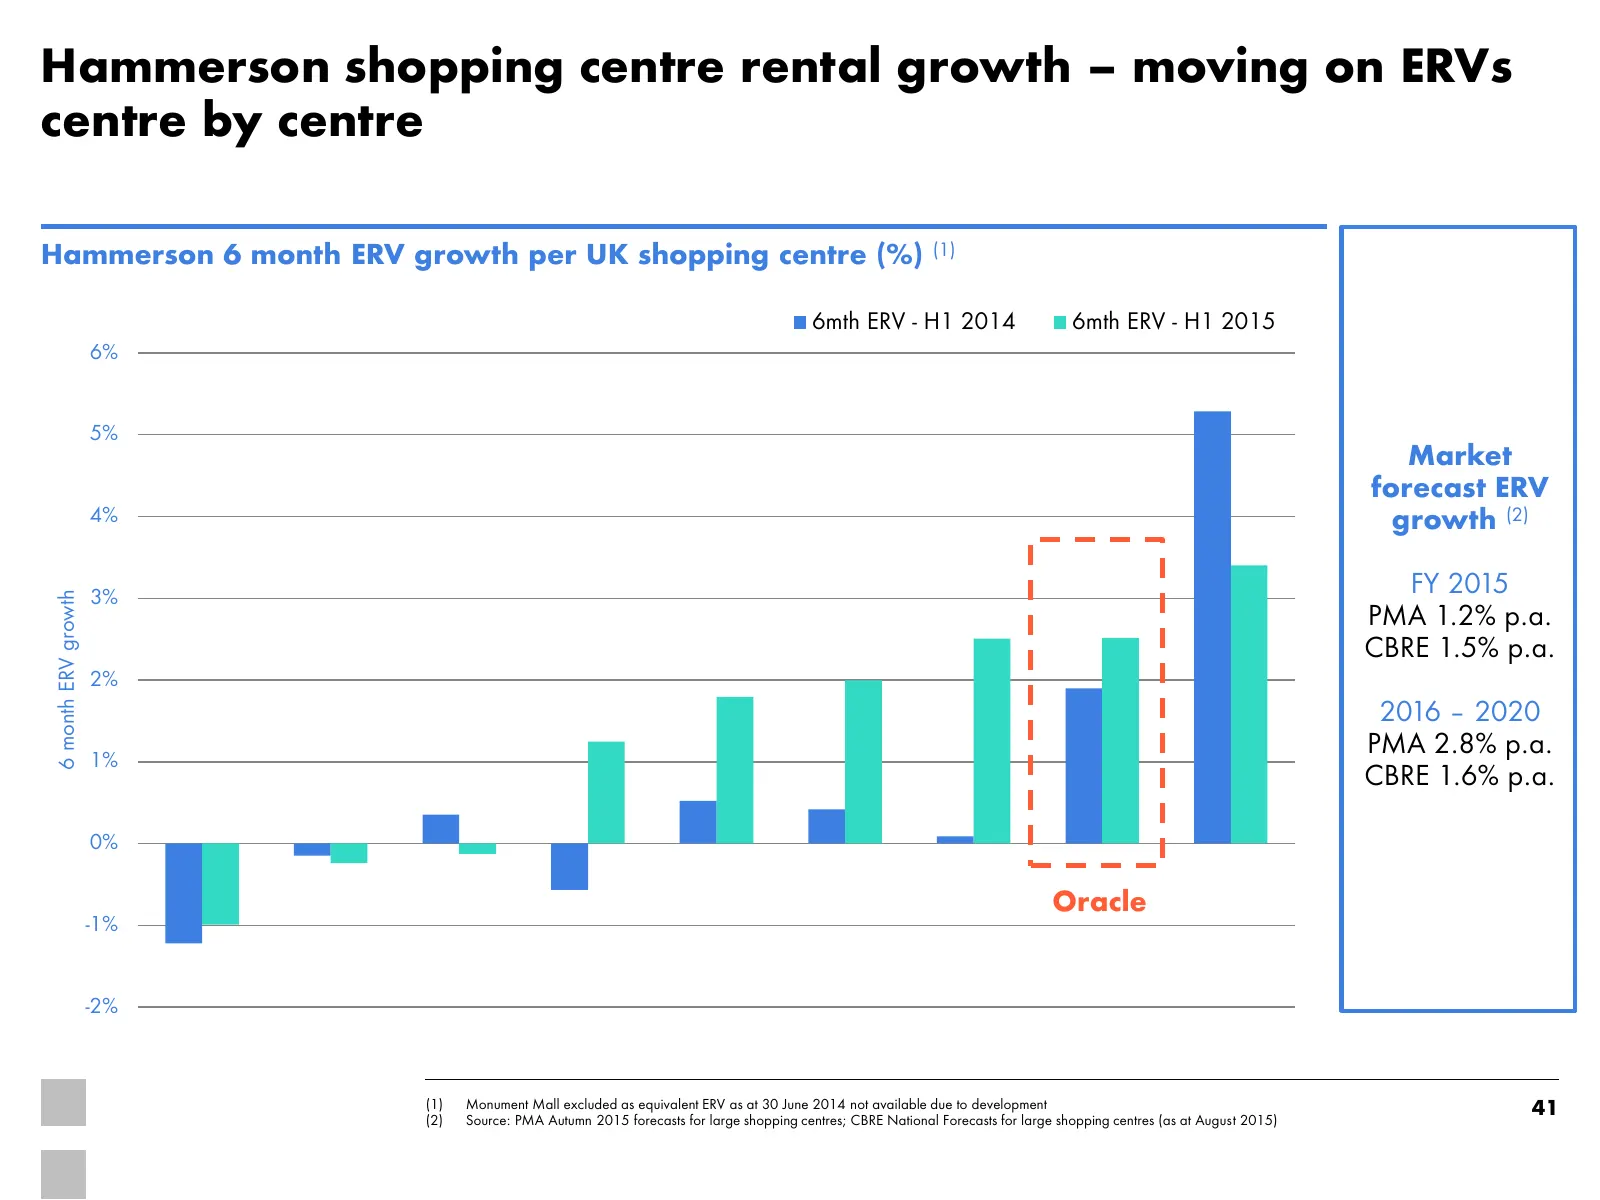
Hammerson shopping centre rental growth – moving on ERVs centre by centre Hammerson 6 month ERV growth per UK shopping centre (%) (1) 6mth ERV - H1 2014 6mth ERV - H1 2015 6% 5% Market forecast ERV 4% growth (2) 3% FY 2015 6 month ERV growth PMA 1.2% p.a. CBRE 1.5% p.a. 2% 2016 – 2020 PMA 2.8% p.a.
Slide 42: Driving ERV growth at the Oracle – We Create Desirability
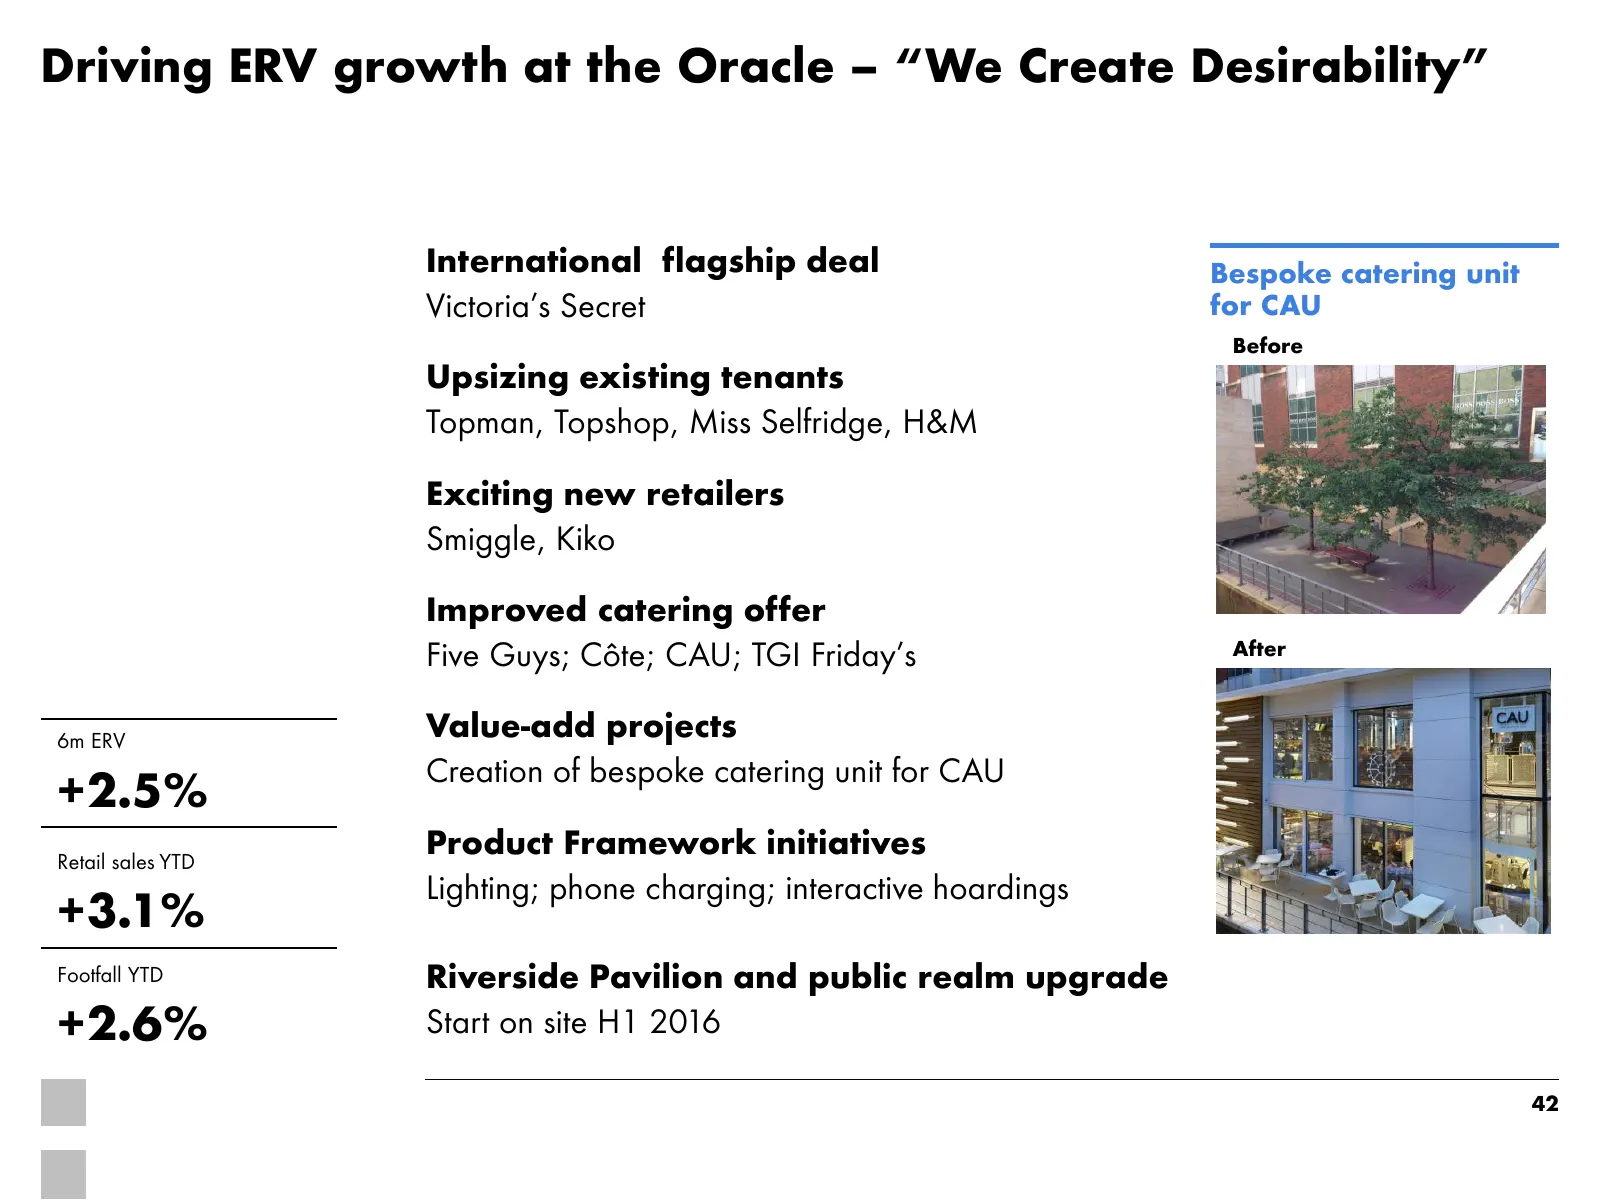
Driving ERV growth at the Oracle – “We Create Desirability” International flagship deal Bespoke catering unit Victoria’s Secret for CAU Before Upsizing existing tenants Topman, Topshop, Miss Selfridge, H&M Exciting new retailers Smiggle, Kiko Improved catering offer Five Guys; Côte; CAU; TGI Friday’
Slide 43: Growth in non-rental revenue
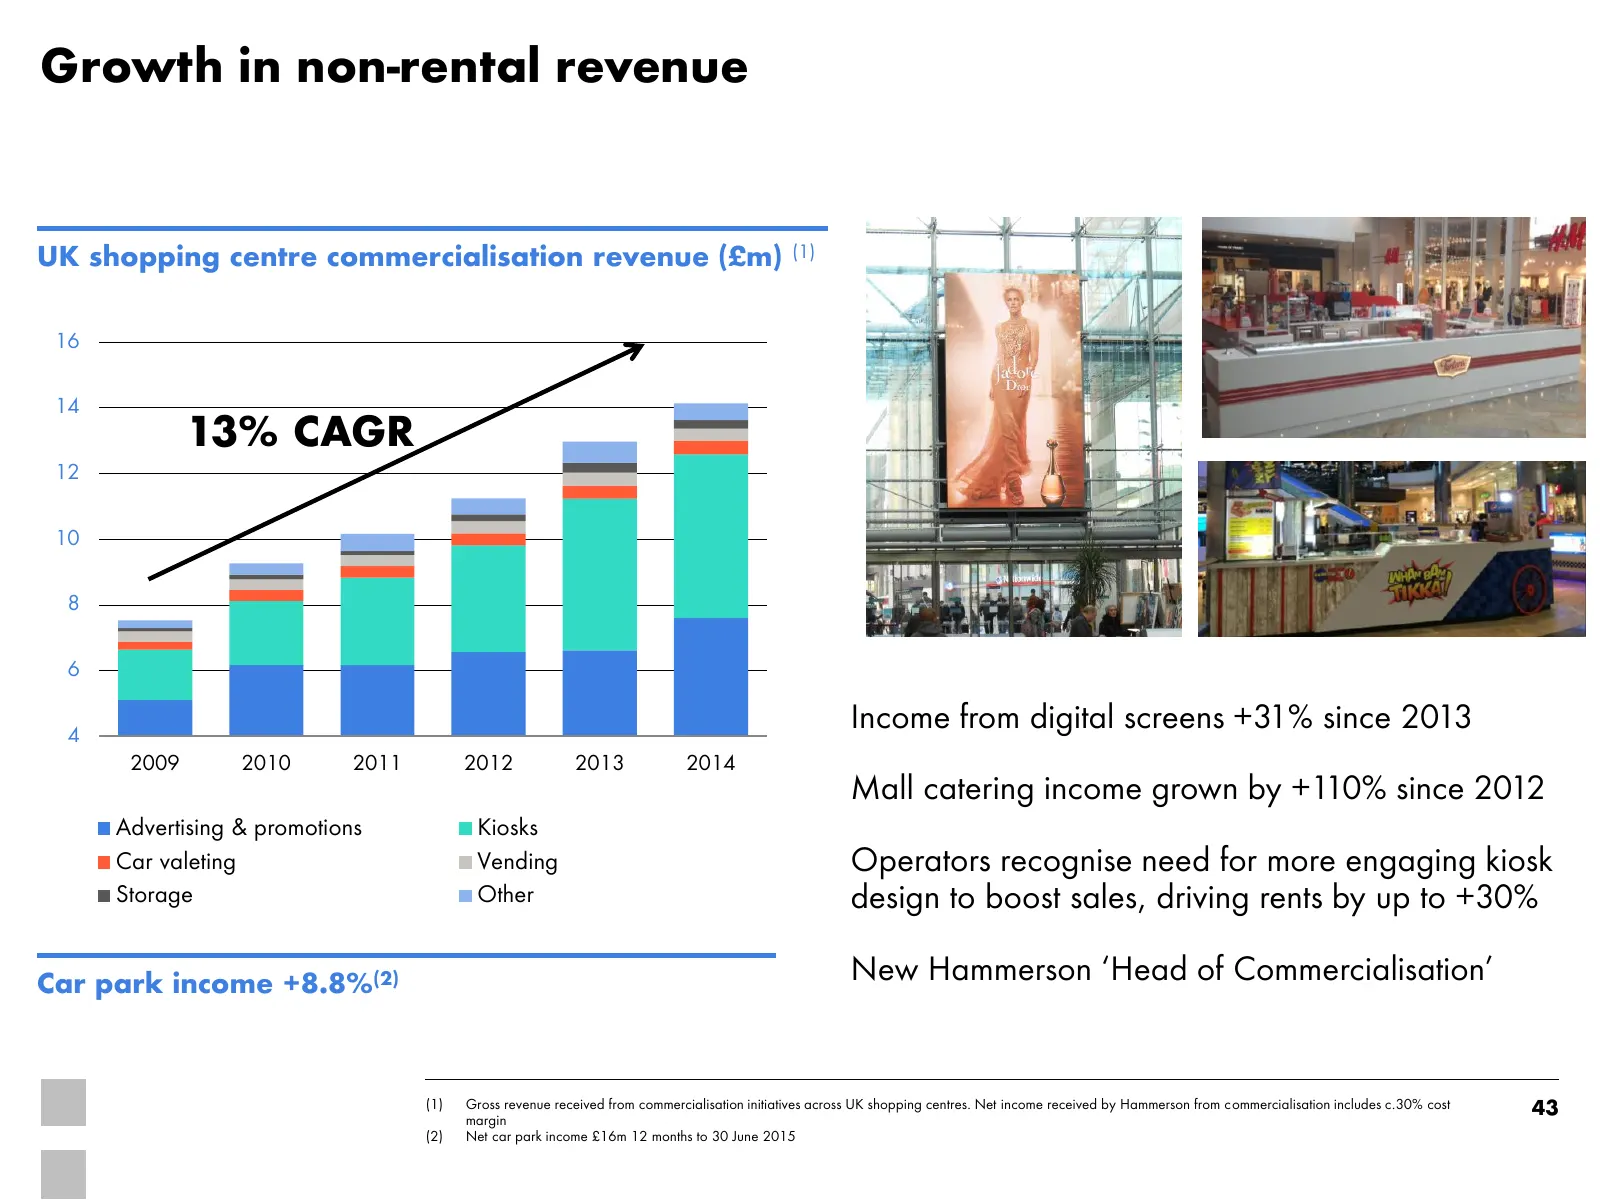
Growth in non-rental revenue UK shopping centre commercialisation revenue (£m) (1) 16 14 13% CAGR 12 10 8 6 4 Income from digital screens +31% since 2013 2009 2010 2011 2012 2013 2014 Mall catering income grown by +110% since 2012 Advertising & promotions Kiosks Car valeting Vending Operators recogn
Slide 44: Current catering trends
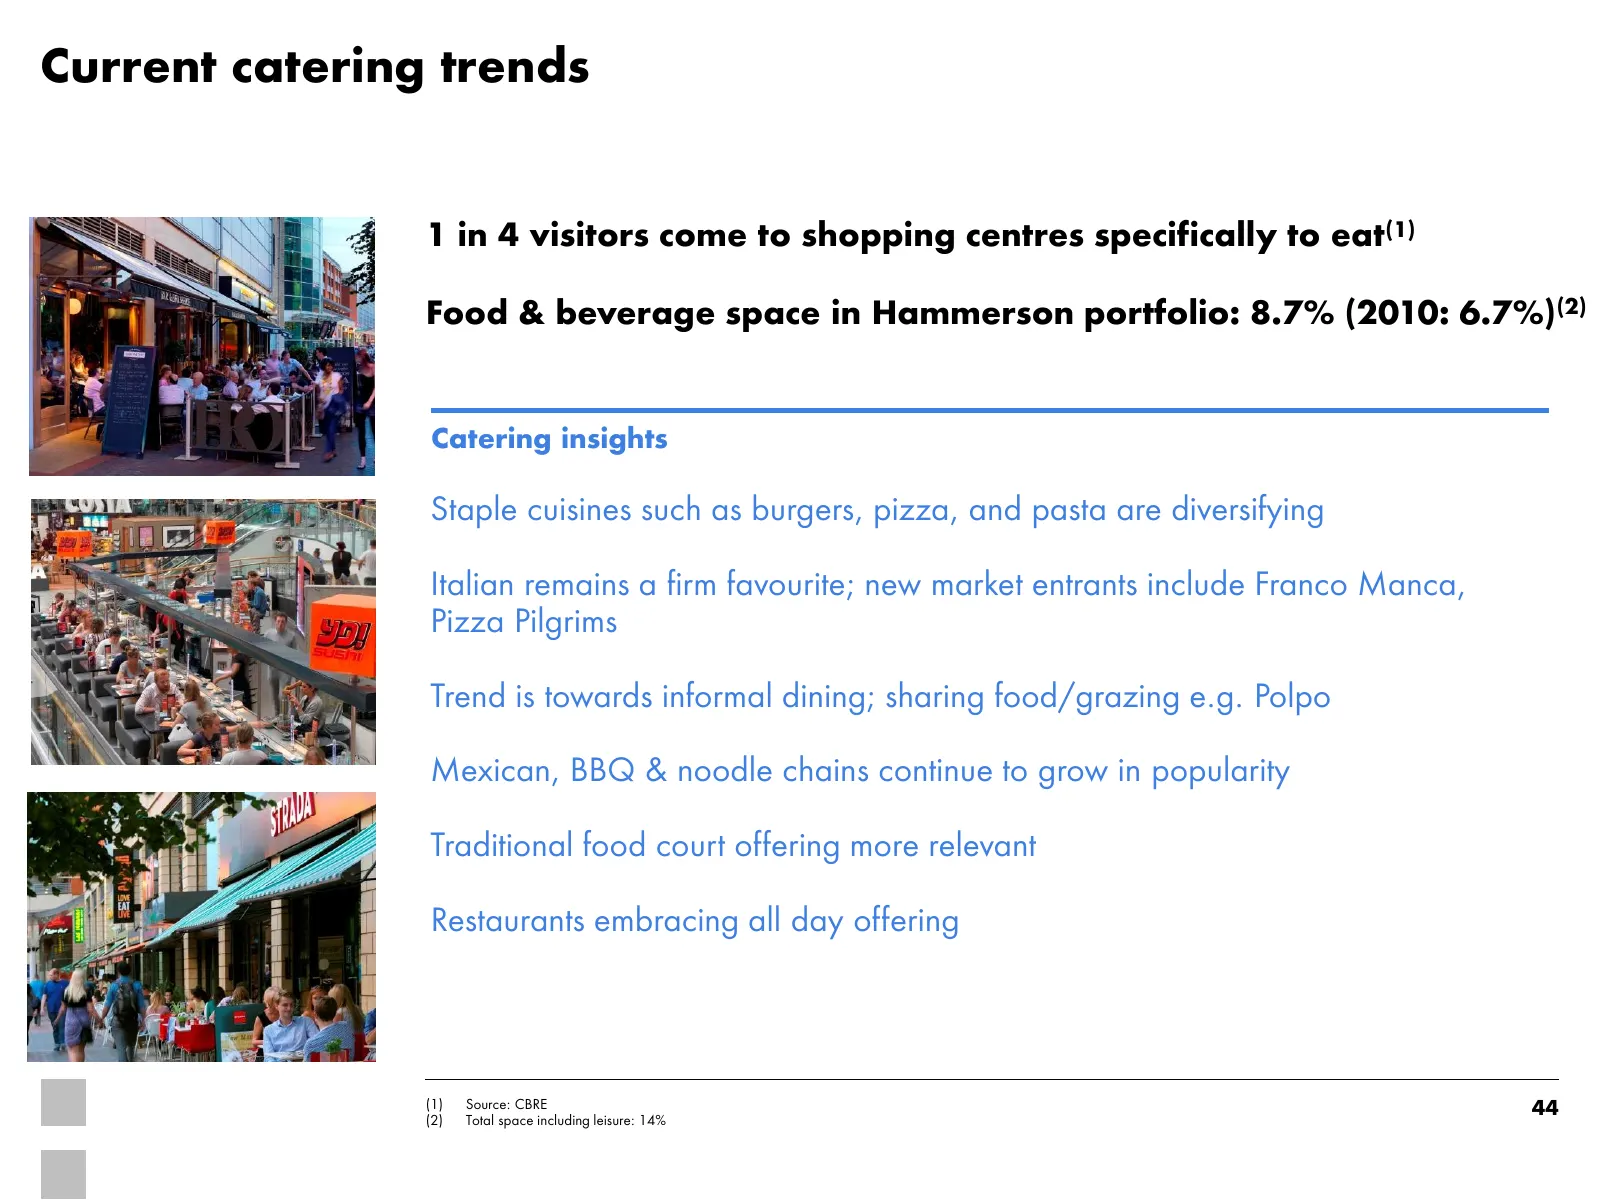
Current catering trends 1 in 4 visitors come to shopping centres specifically to eat(1) Food & beverage space in Hammerson portfolio: 8.7% (2010: 6.7%)(2) Catering insights Staple cuisines such as burgers, pizza, and pasta are diversifying Italian remains a firm favourite; new market entrants includ
Slide 45: Catering sales continue to be strong
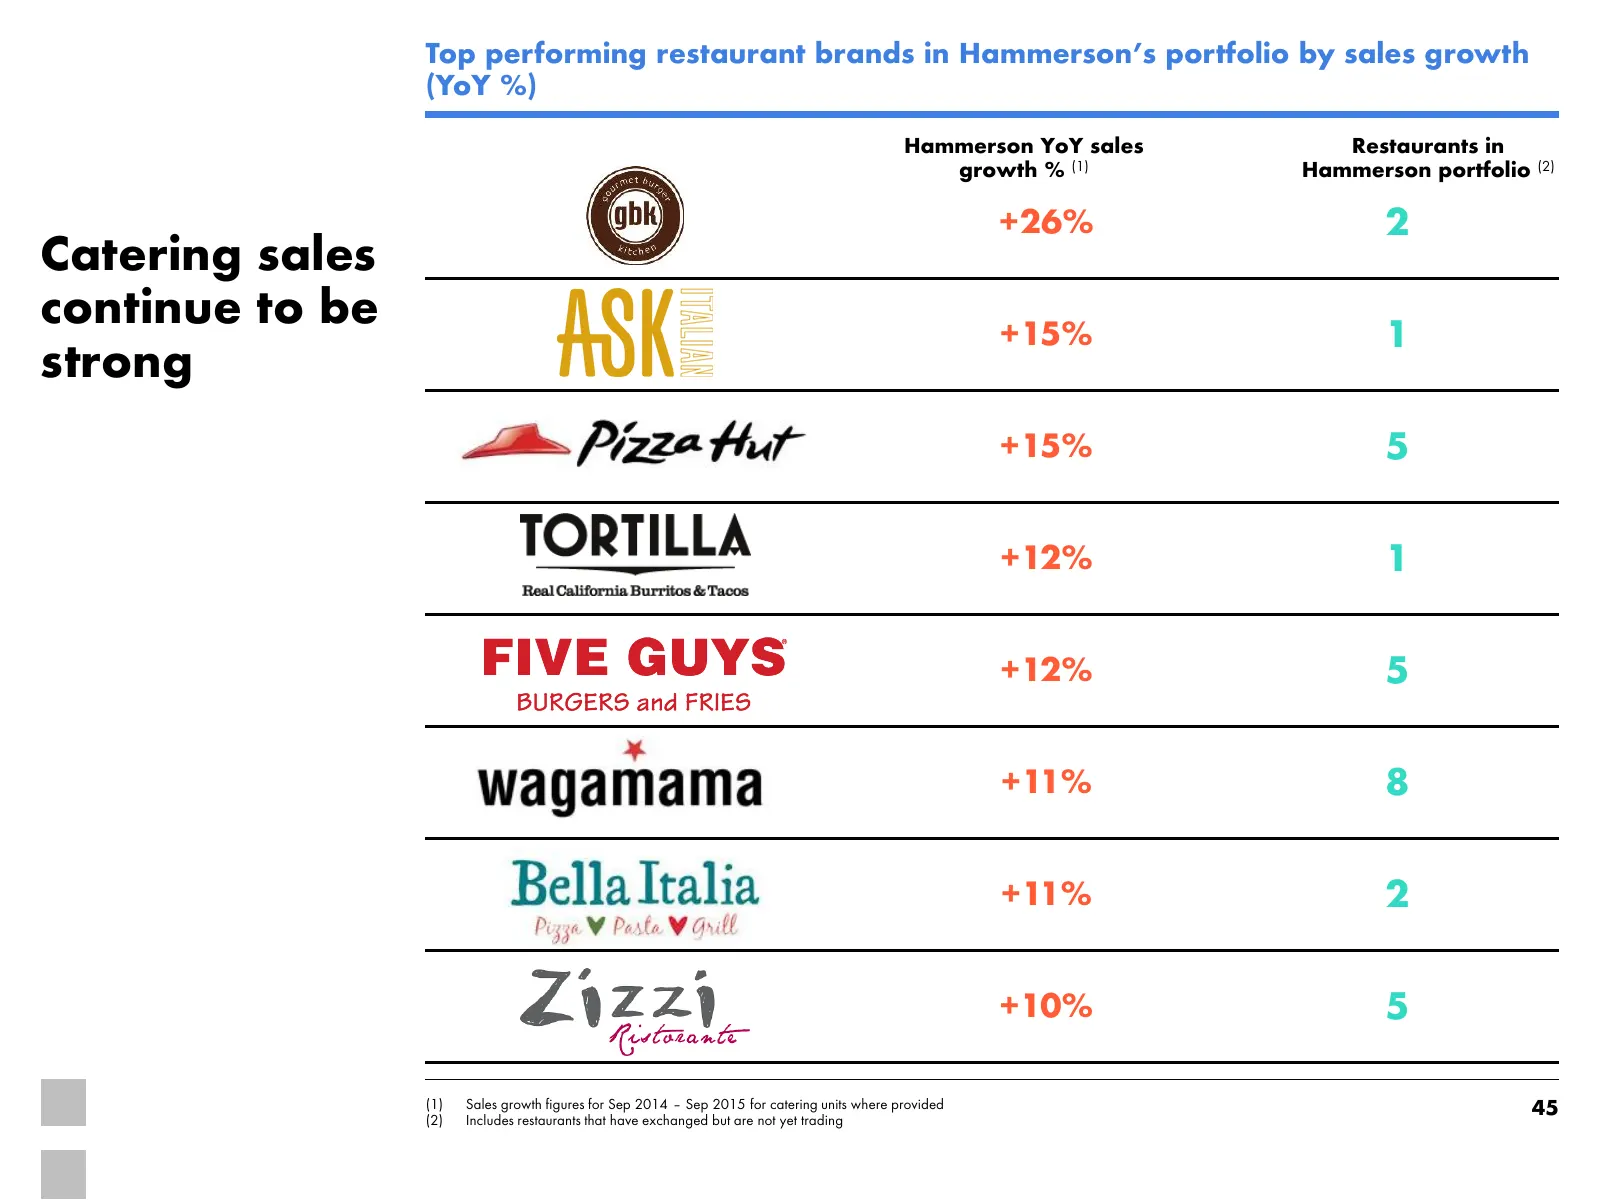
Top performing restaurant brands in Hammerson’s portfolio by sales growth (YoY %) Hammerson YoY sales Restaurants in growth % (1) Hammerson portfolio (2) +26% 2 Catering sales continue to be +15% 1 strong +15% 5 +12% 1 +12% 5 +11% 8 +11% 2 +10% 5 (1) (2) Sales growth figures for Sep 2014 – Sep 2015
Slide 46: What can an improved catering offer bring to a centre?
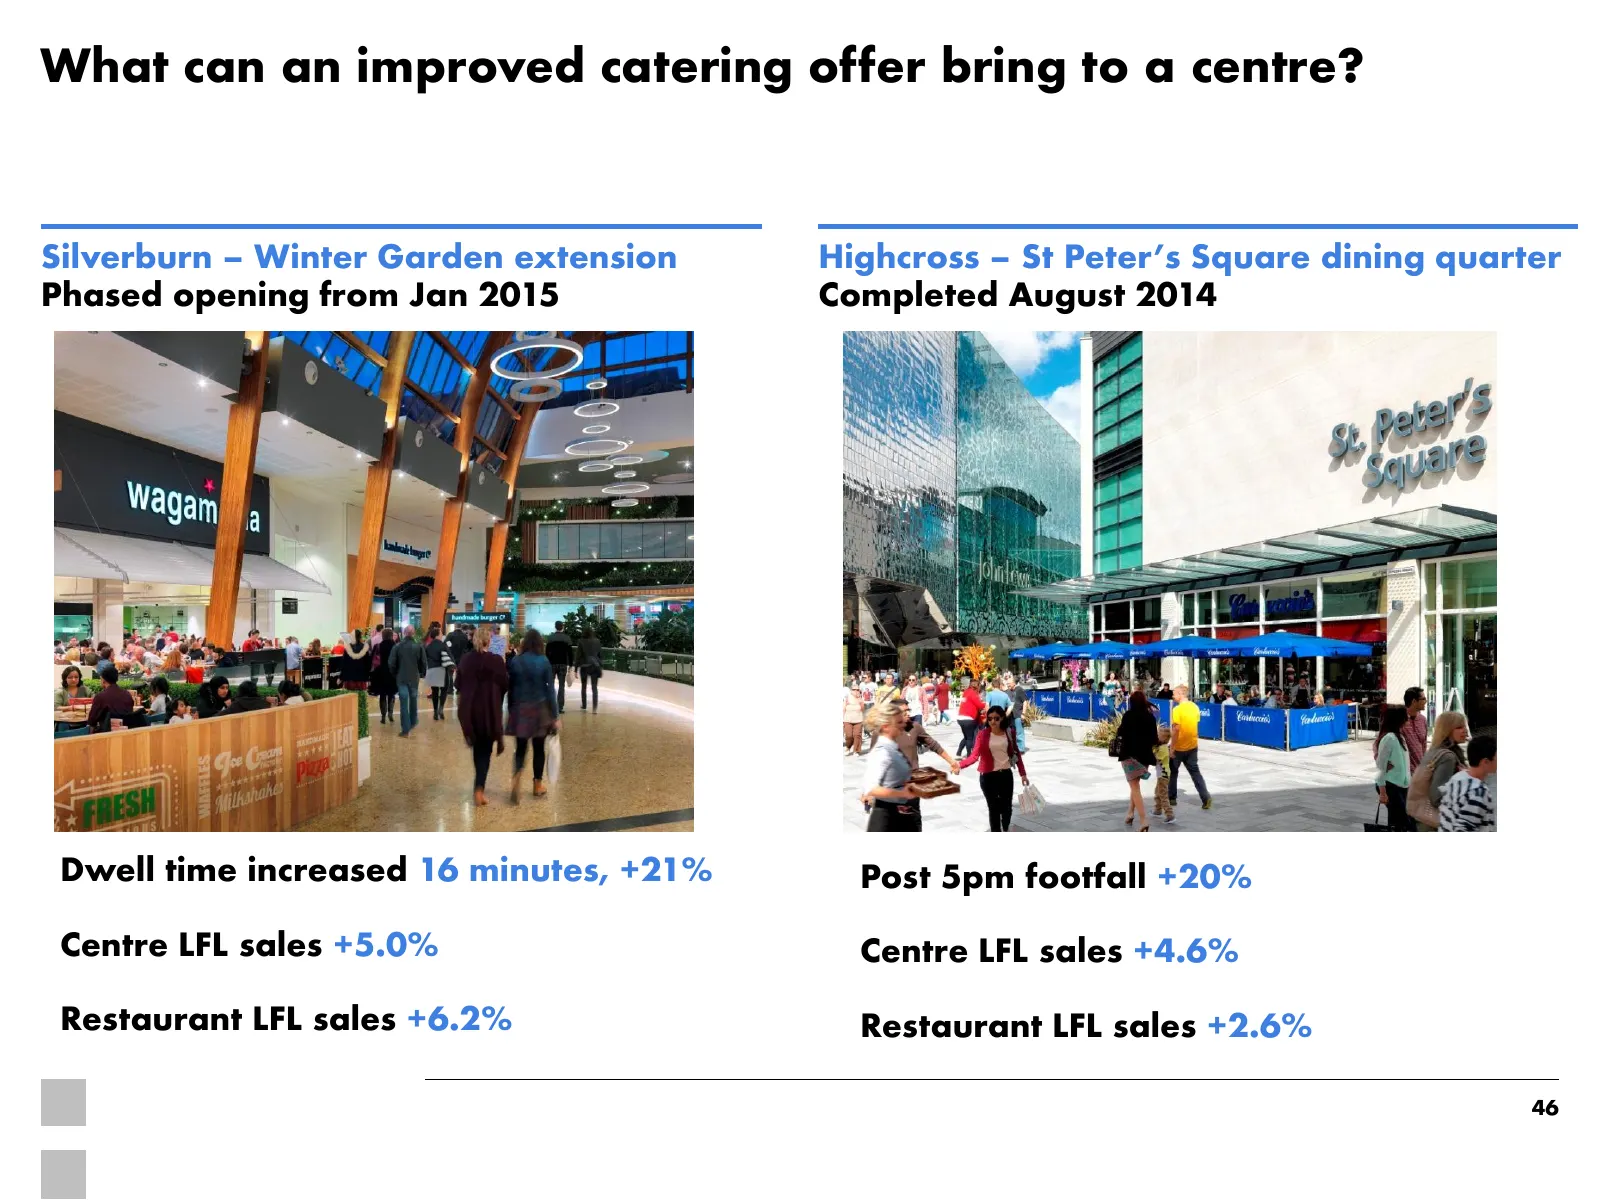
What can an improved catering offer bring to a centre? Silverburn – Winter Garden extension Highcross – St Peter’s Square dining quarter Phased opening from Jan 2015 Completed August 2014 Dwell time increased 16 minutes, +21% Post 5pm footfall +20% Centre LFL sales +5.0% Centre LFL sales +4.6% Resta
Slide 47: Digital engagement: driving positive behaviour from our shoppers
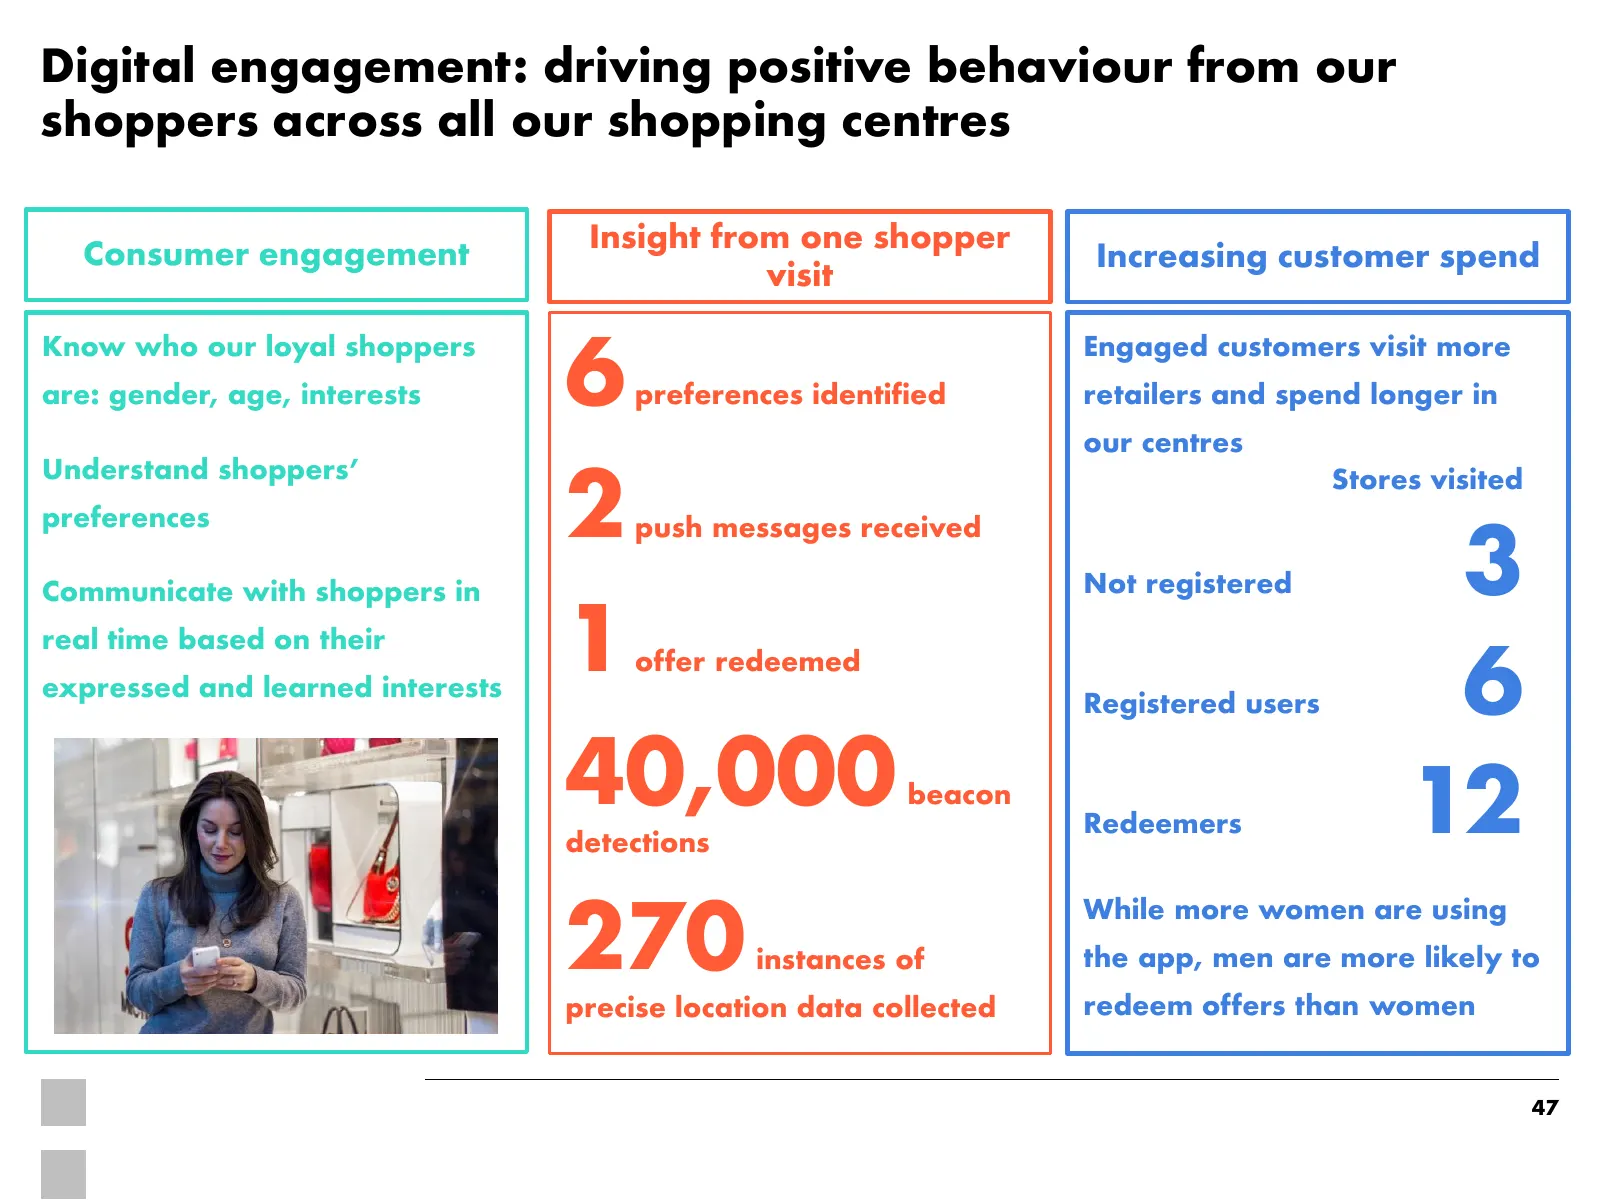
Digital engagement: driving positive behaviour from our shoppers across all our shopping centres Insight from one shopper Consumer engagement Increasing customer spend visit 6 Know who our loyal shoppers Engaged customers visit more are: gender, age, interests preferences identified retailers and sp
Slide 48: Product Framework 2015 initiatives delivered
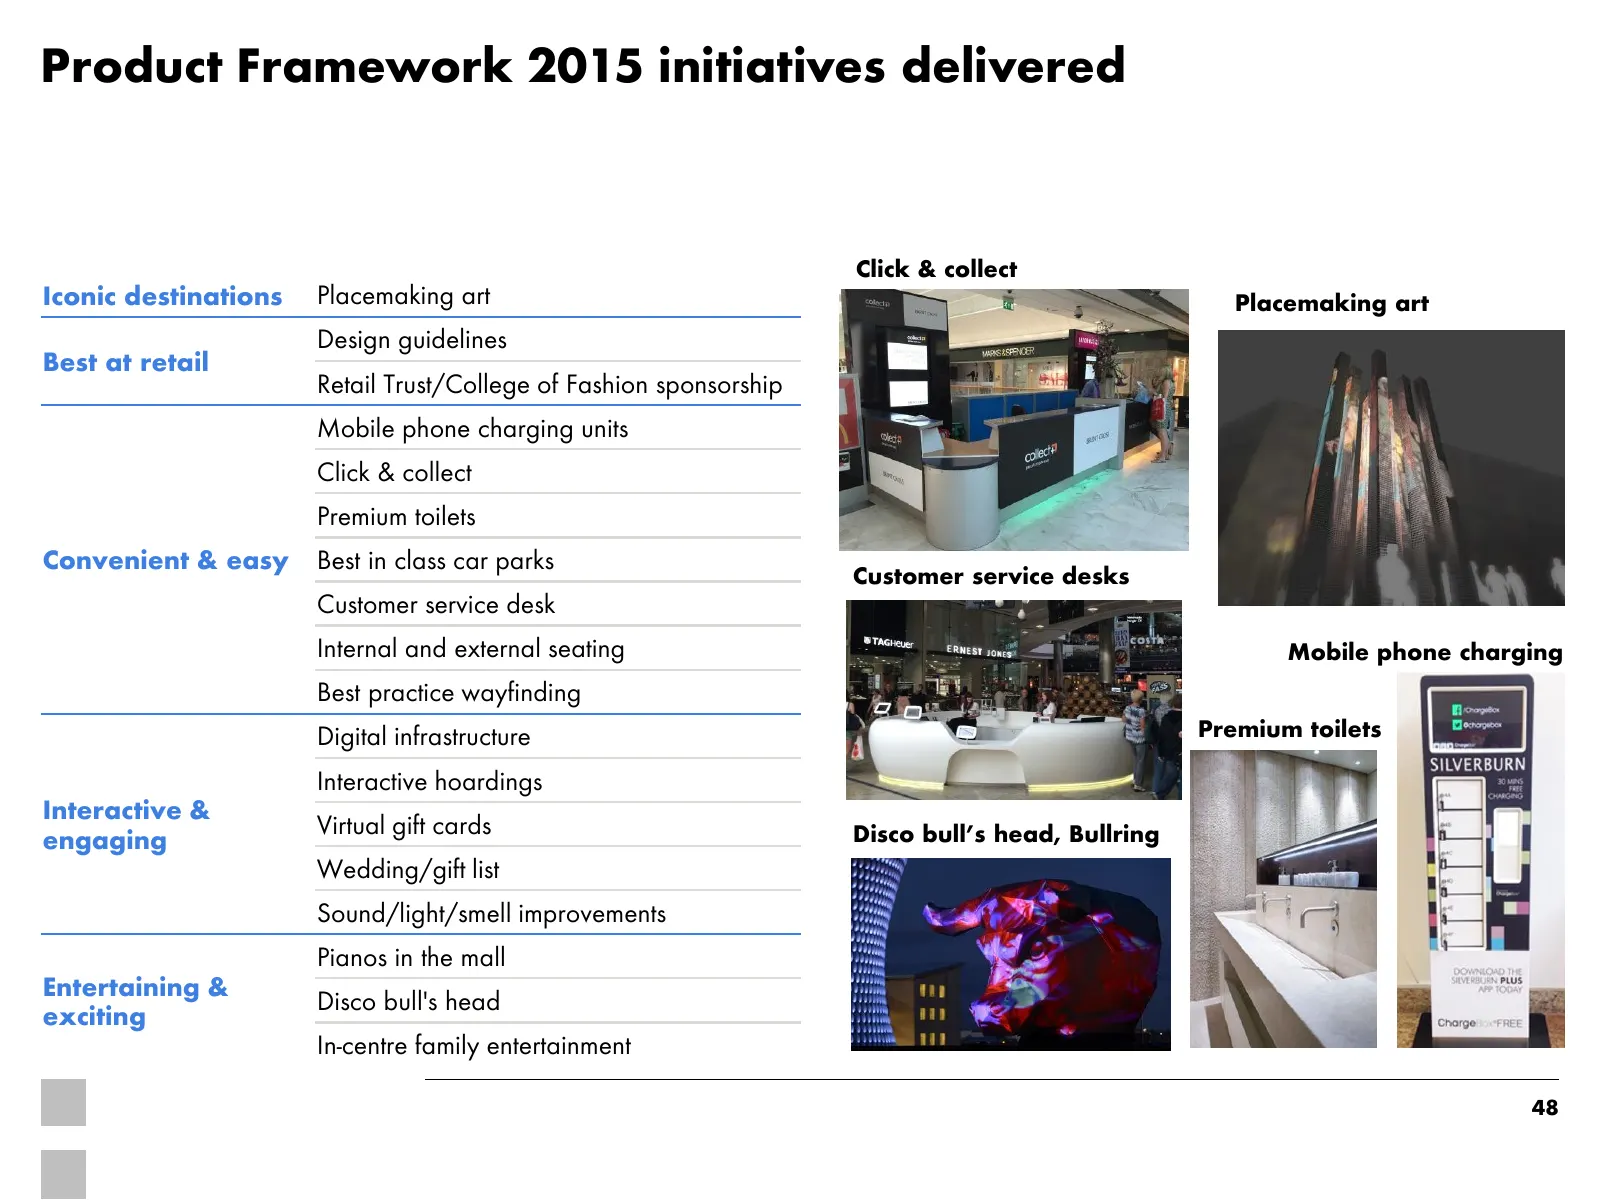
Product Framework 2015 initiatives delivered Click & collect Iconic destinations Placemaking art Placemaking art Design guidelines Best at retail Retail Trust/College of Fashion sponsorship Mobile phone charging units Click & collect Premium toilets Convenient & easy Best in class car parks Customer
Slide 49: Our Jewel portfolio assets
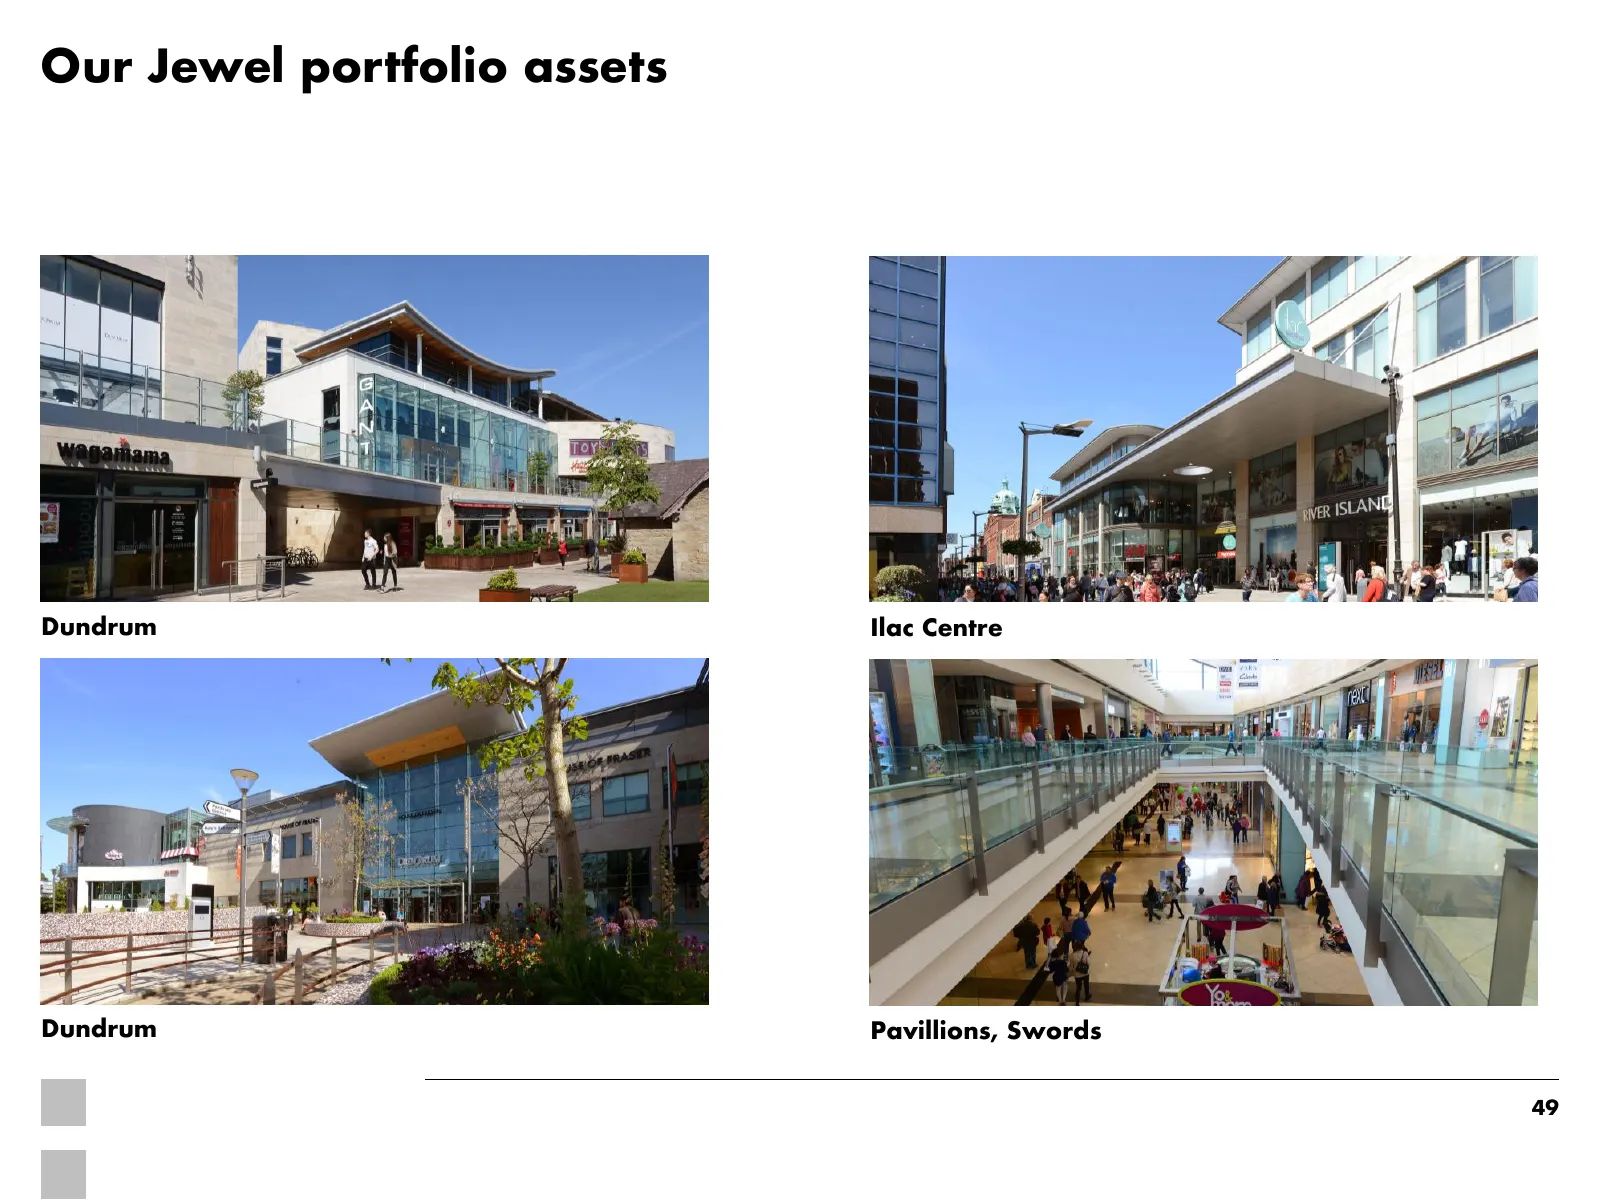
Our Jewel portfolio assets Dundrum Dundrum Ilac Centre Dundrum Pavillions, Swords 49
Slide 50: Ireland is the fastest growing European economy
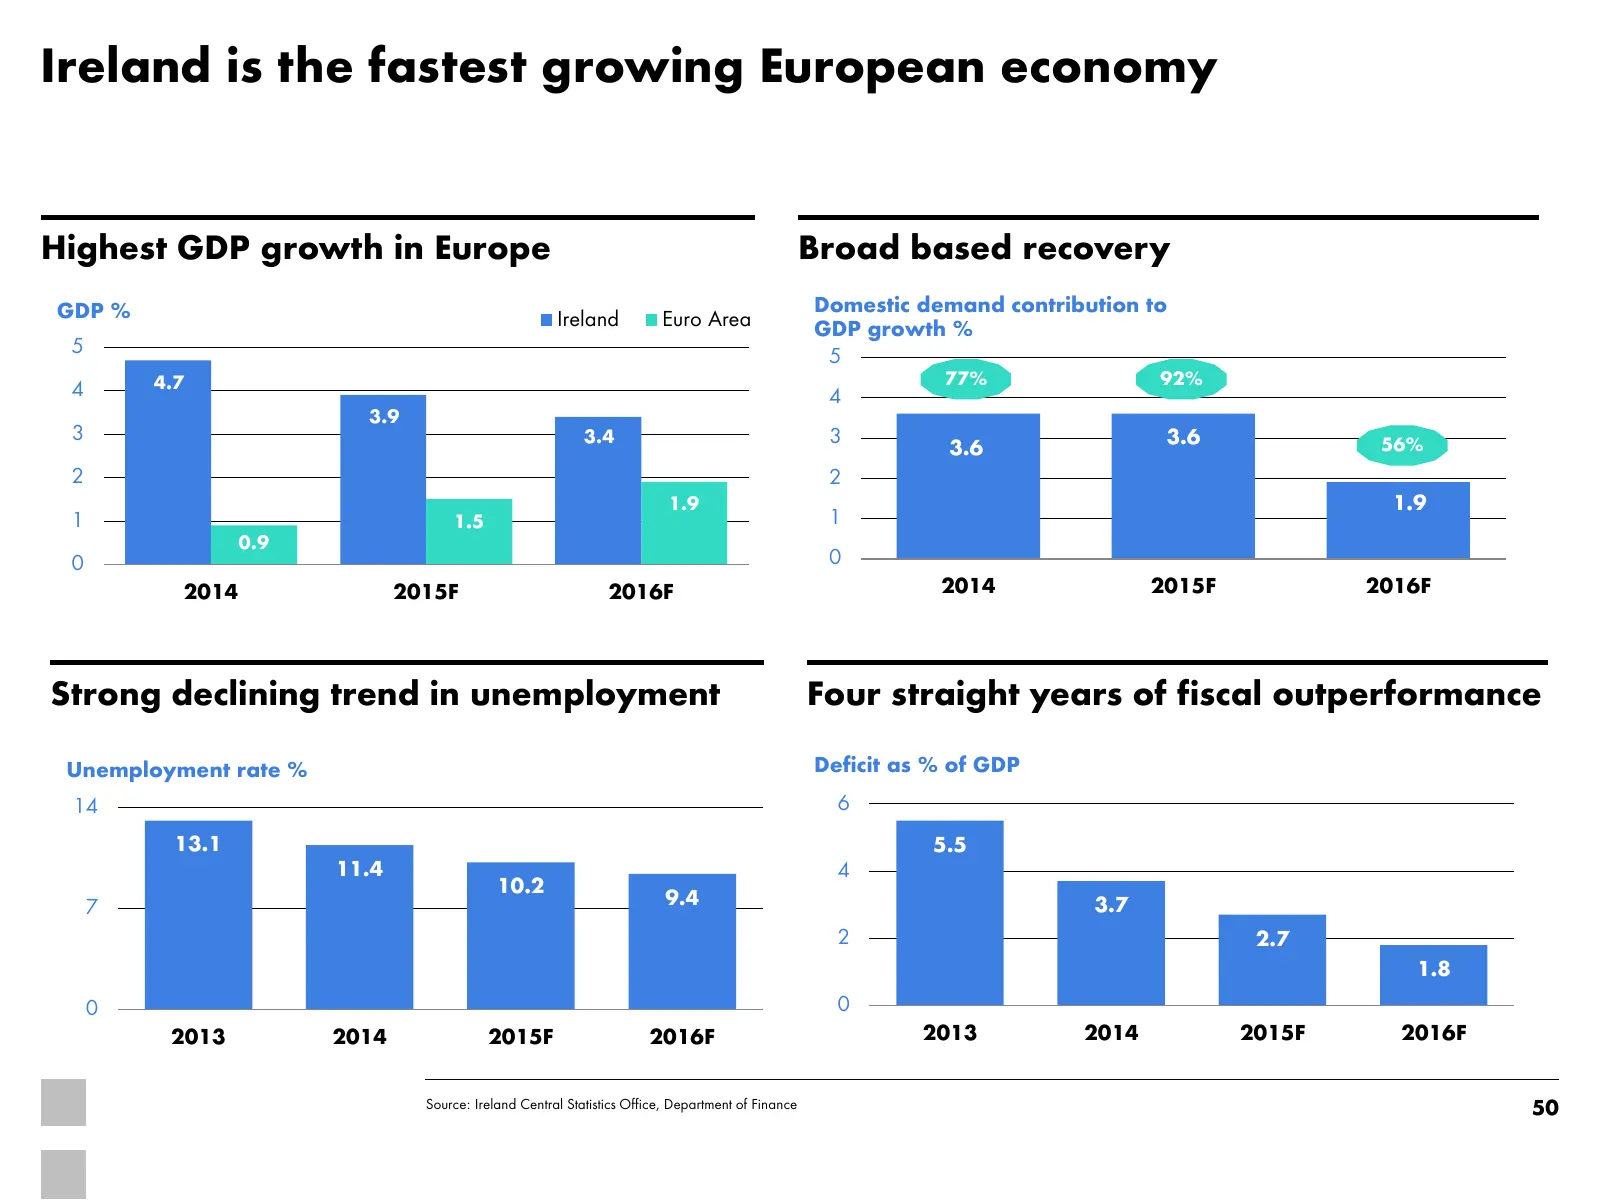
Ireland is the fastest growing European economy Highest GDP growth in Europe Broad based recovery GDP % Domestic demand contribution to Ireland Euro Area GDP growth % 5 5 4.7 77% 92% 4 4 3.9 3 3.4 3 3.6 3.6 56% 2 2 1.9 1.9 1 1.5 1 0.9 0 0 2014 2015F 2016F 2014 2015F 2016F Strong declining trend in u
Slide 51: Strong support for the Dublin retail rental market
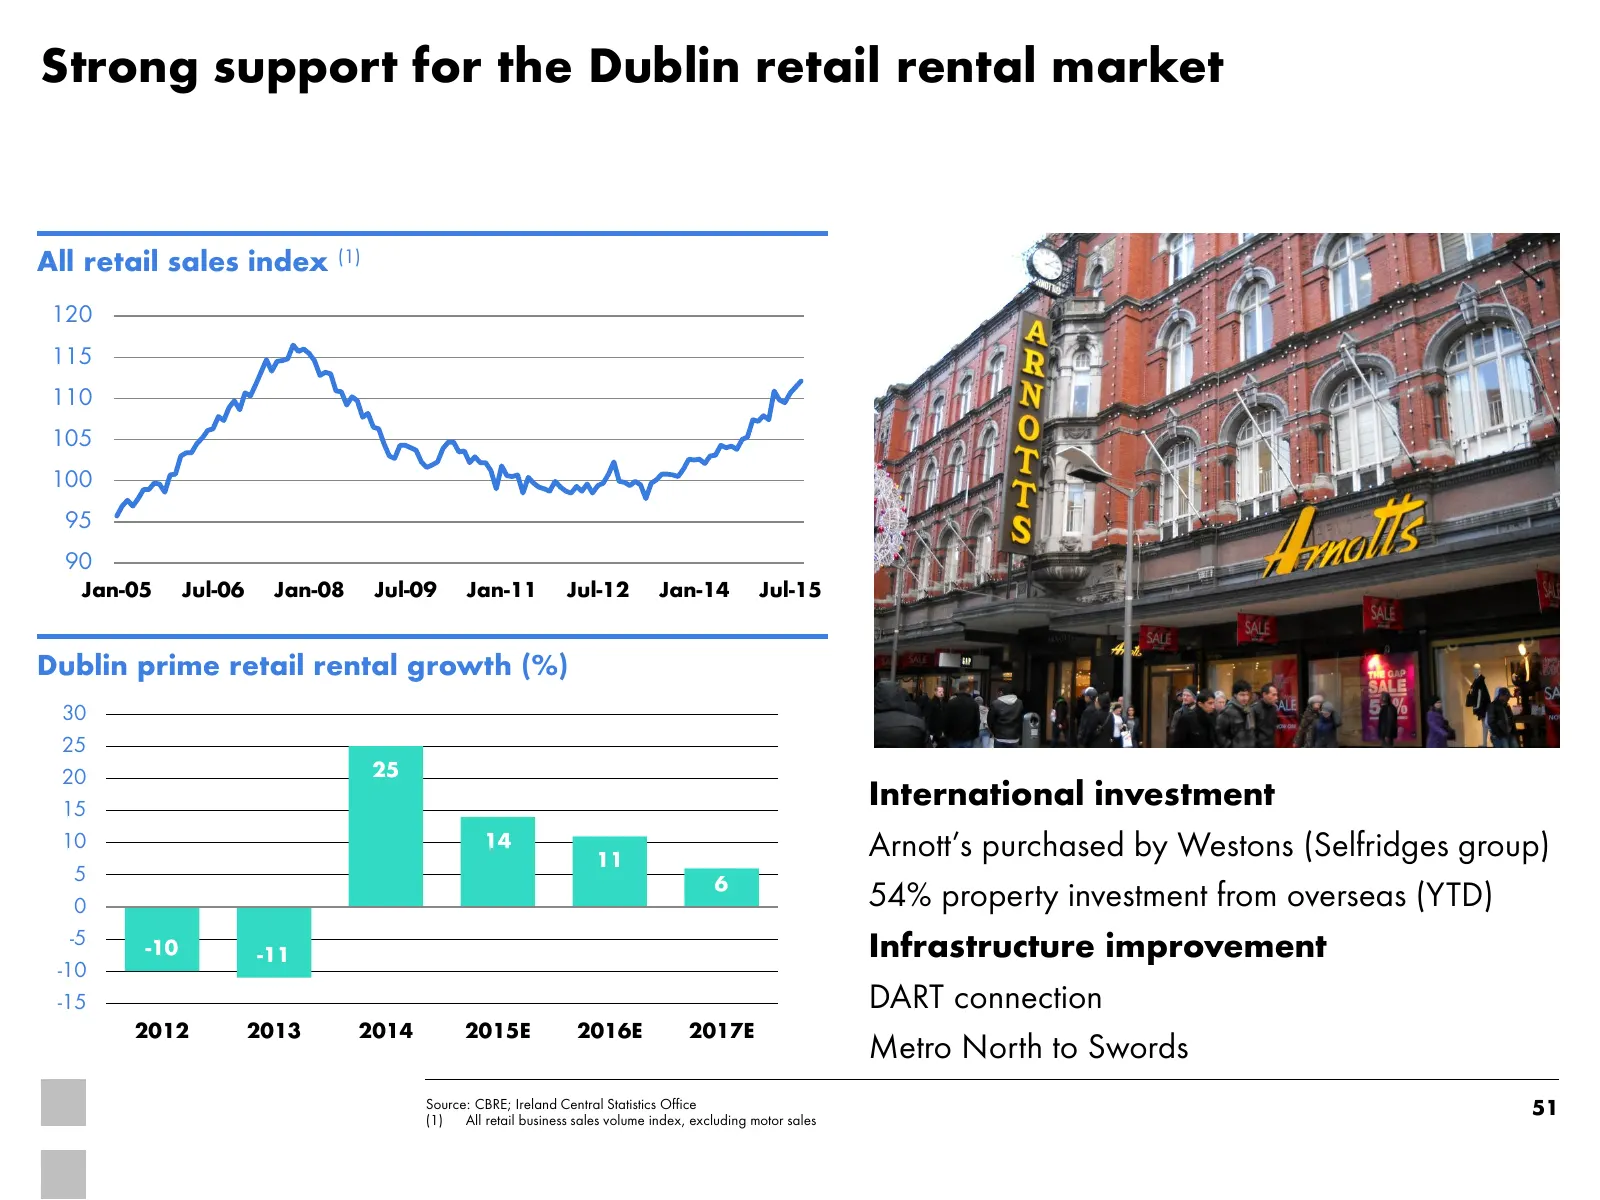
Strong support for the Dublin retail rental market All retail sales index (1) 120 115 110 105 100 95 90 Jan-05 Jul-06 Jan-08 Jul-09 Jan-11 Jul-12 Jan-14 Jul-15 Dublin prime retail rental growth (%) 30 25 20 25 15 International investment 10 14 11 Arnott’s purchased by Westons (Selfridges group) 5 6
Slide 52: Hammerson on the ground in Dublin
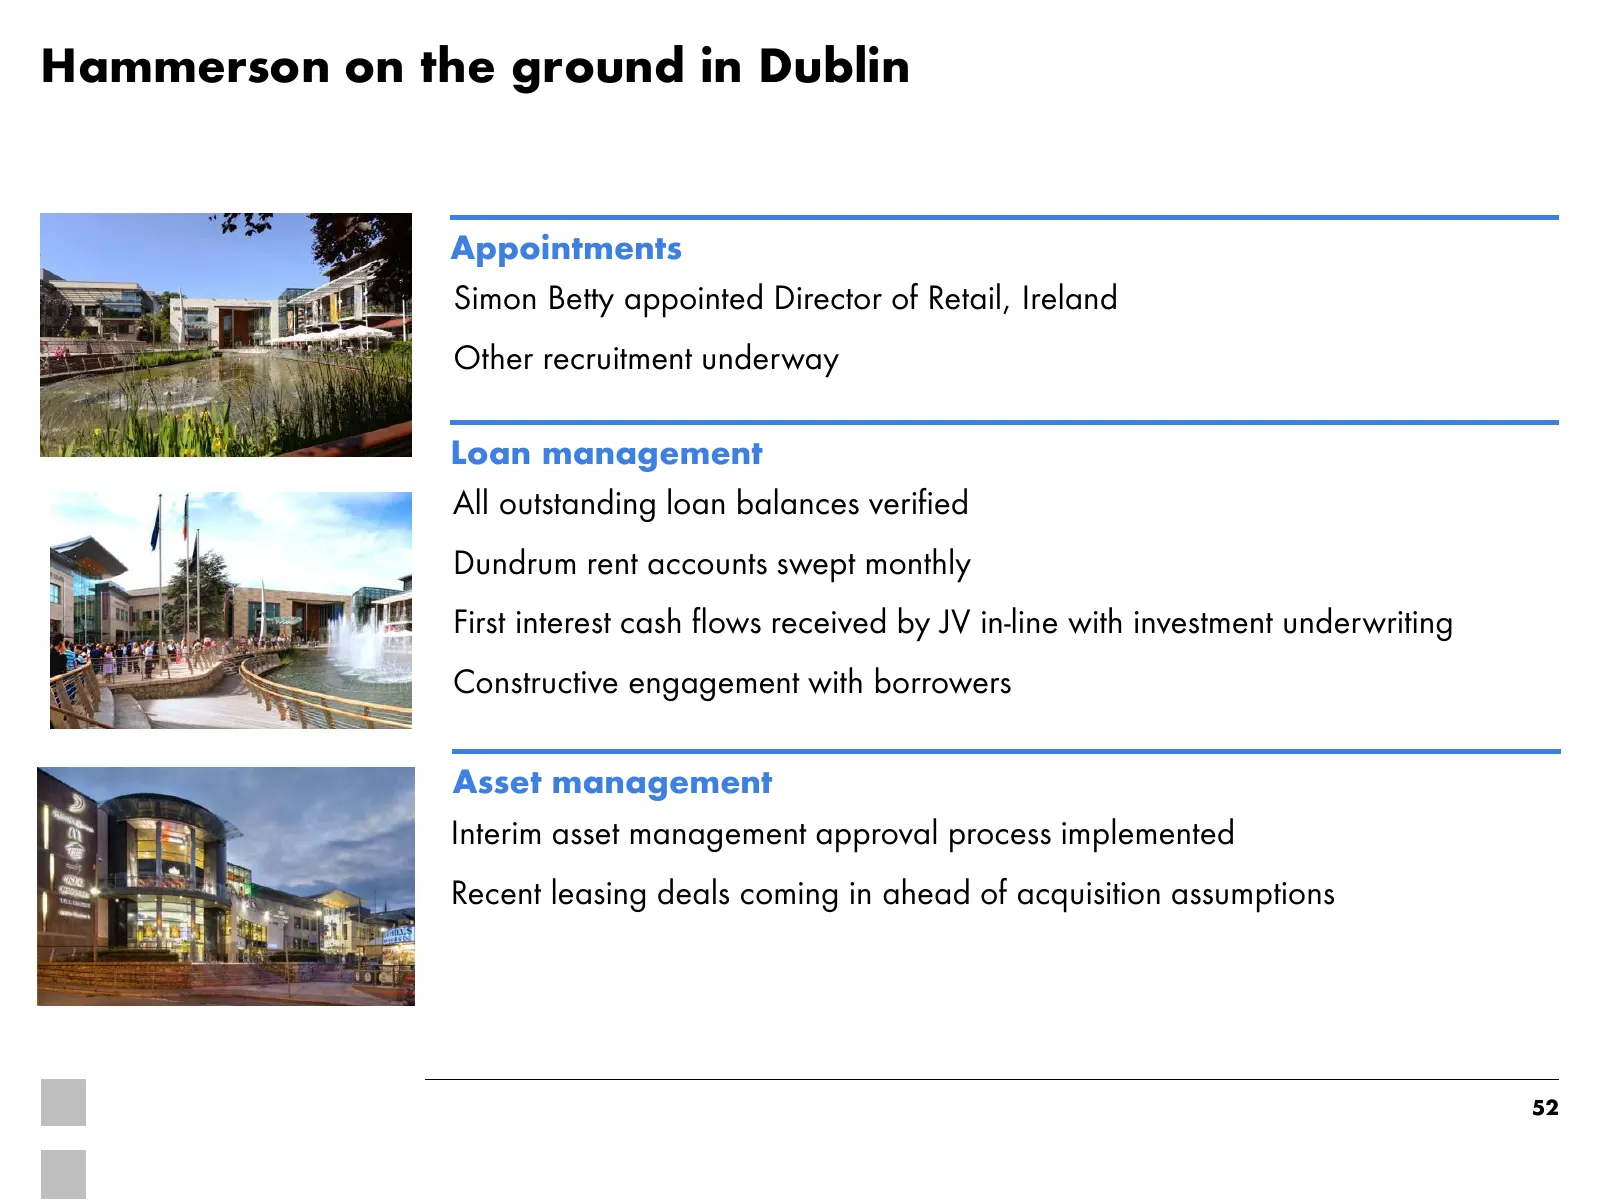
Hammerson on the ground in Dublin Appointments Simon Betty appointed Director of Retail, Ireland Other recruitment underway Loan management All outstanding loan balances verified Dundrum rent accounts swept monthly First interest cash flows received by JV in-line with investment underwriting Constru
Slide 53: Value Retail, Kildare: new extension opened in Dublin
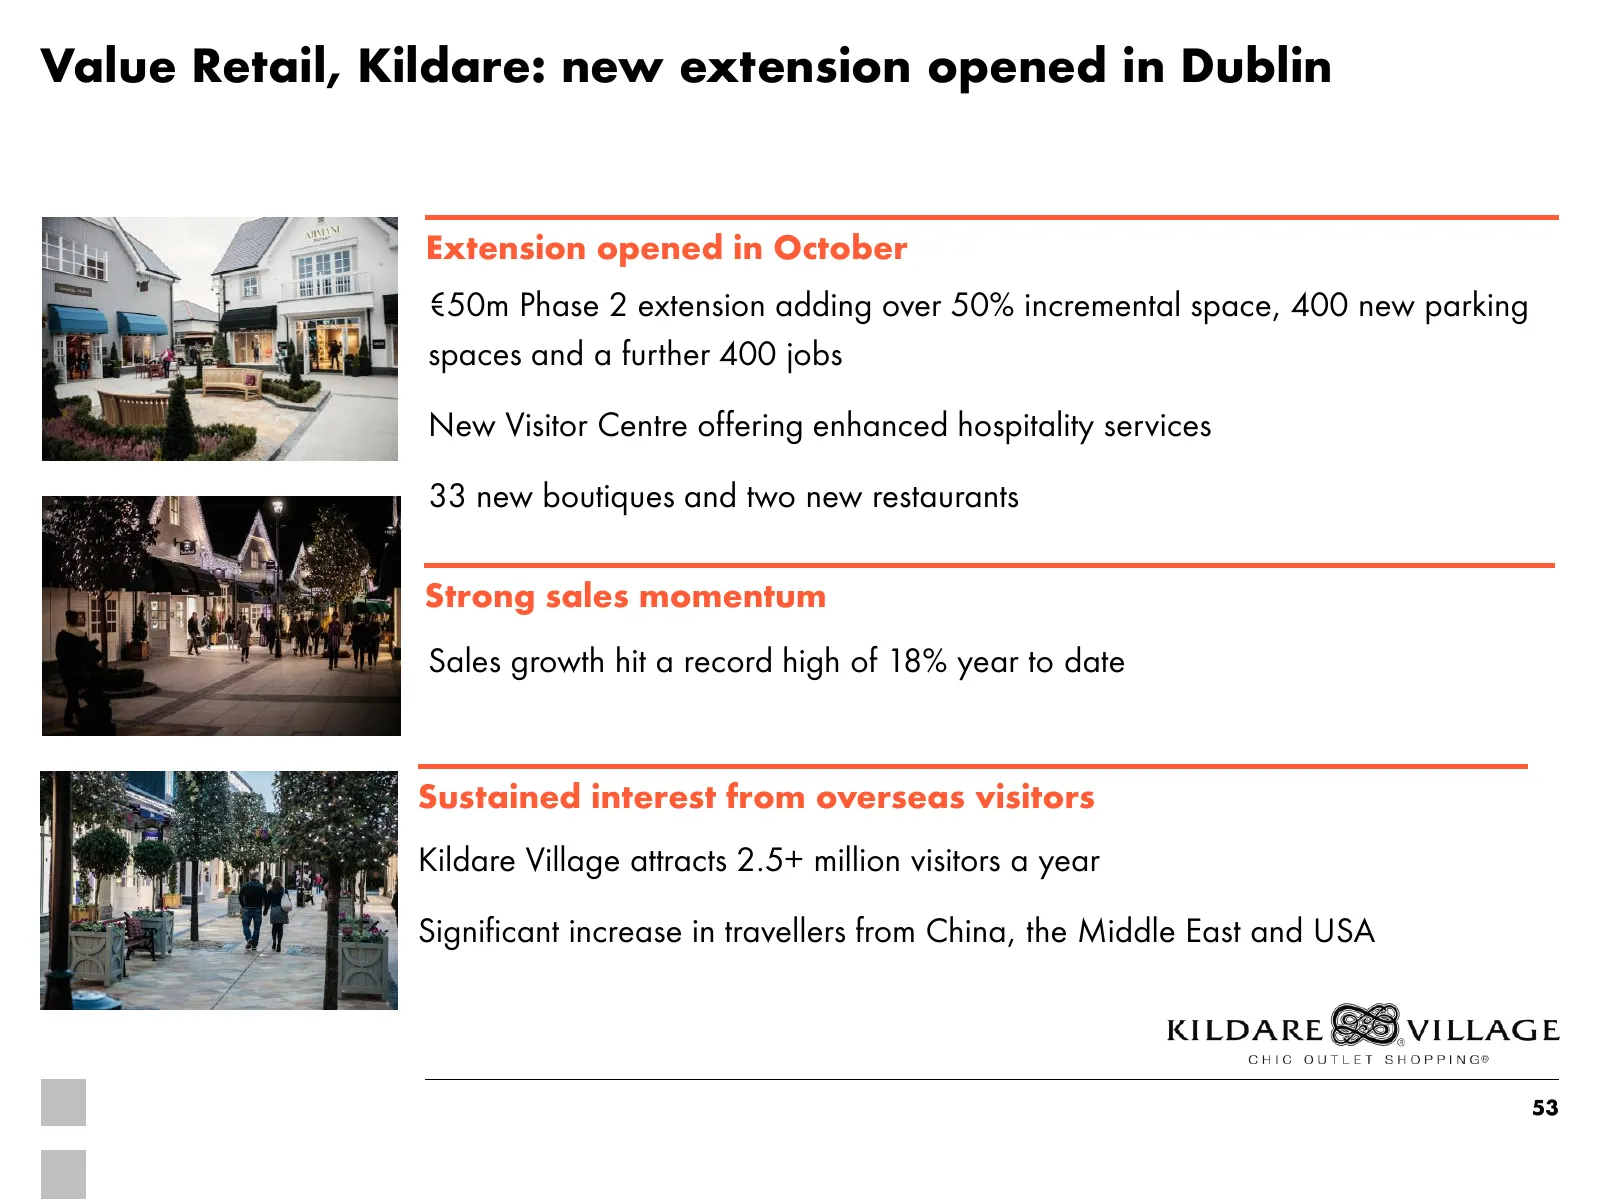
Value Retail, Kildare: new extension opened in Dublin Extension opened in October €50m Phase 2 extension adding over 50% incremental space, 400 new parking spaces and a further 400 jobs New Visitor Centre offering enhanced hospitality services 33 new boutiques and two new restaurants Strong sales mo
Slide 54: Our strategy to drive consistent earnings growth
Our strategy to drive consistent earnings growth 1. Strong and improving consumer backdrop 2. Applying our unique insight and skill to match latest retail trends 3. Investing incremental resources into fast-growing end markets 4. Focus on cost management and capital structure 5. Delivering a pipelin
Slide 55: In summary, a proven strategy delivering consistent shareholder returns
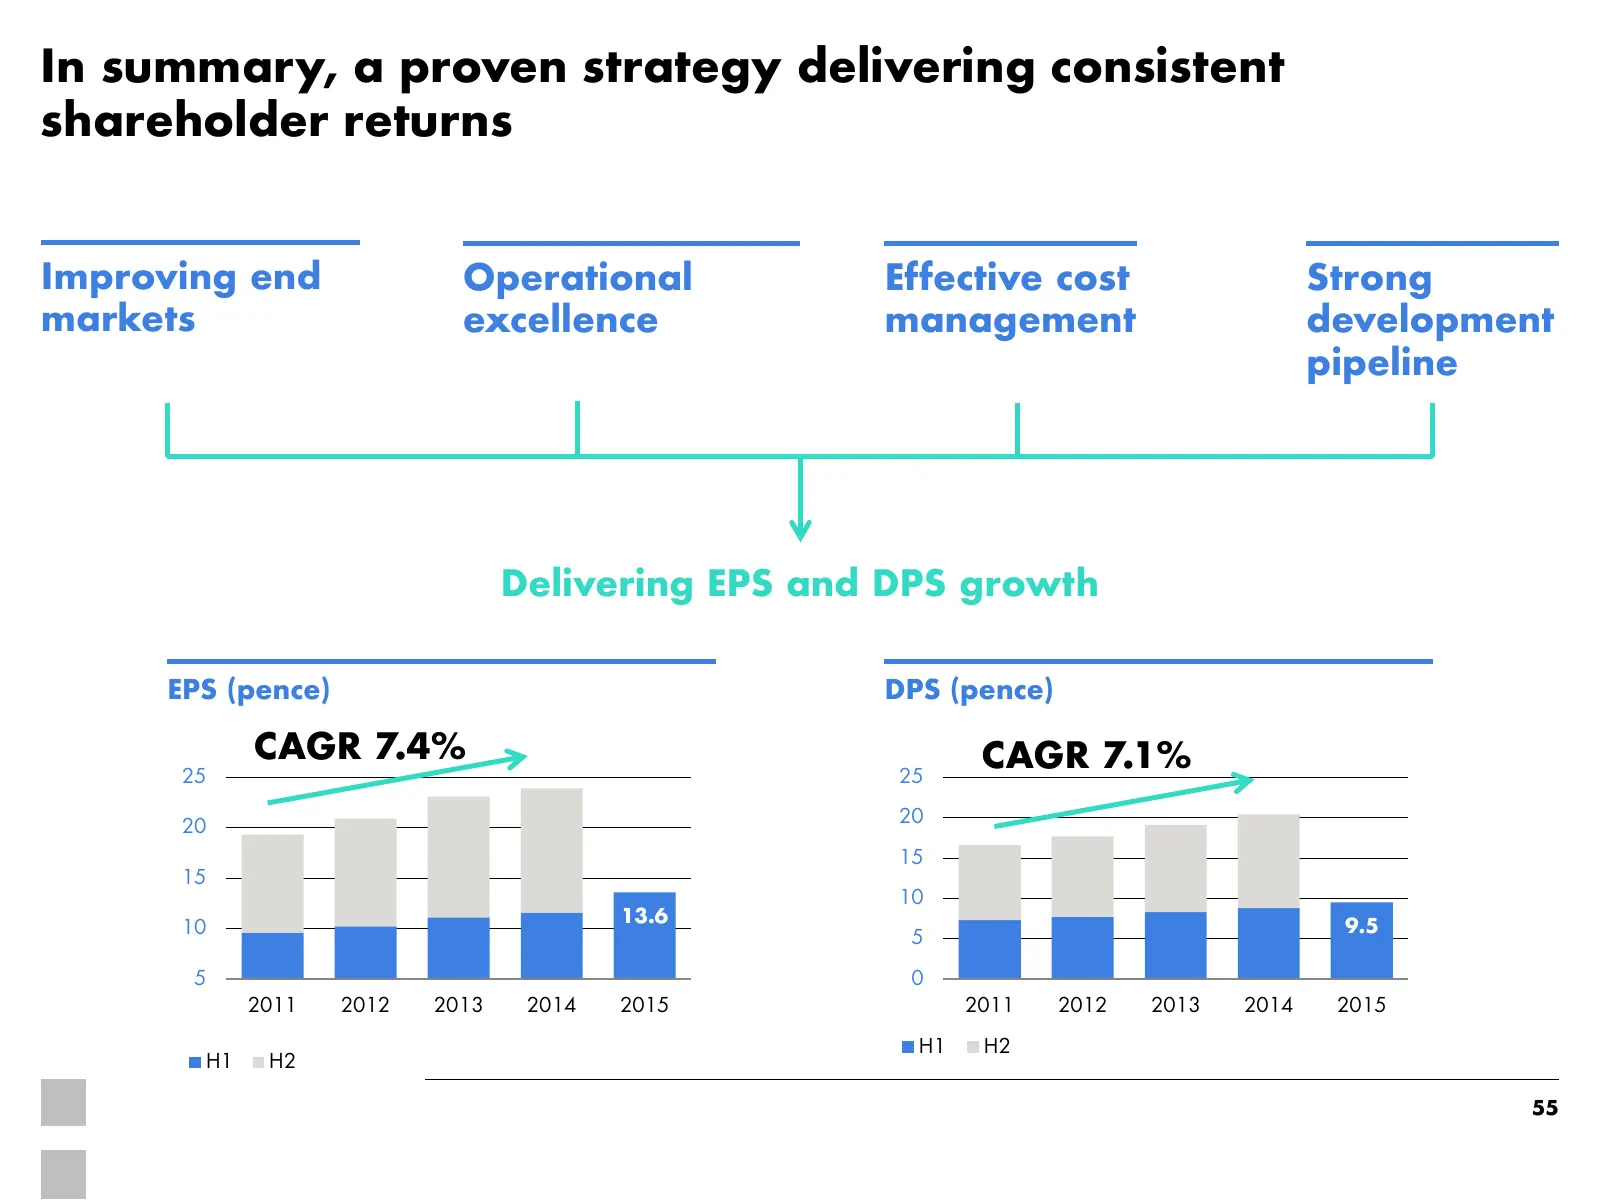
In summary, a proven strategy delivering consistent shareholder returns Improving end Operational Effective cost Strong markets excellence management development pipeline Delivering EPS and DPS growth EPS (pence) DPS (pence) CAGR 7.4% CAGR 7.1% 25 25 20 20 15 15 10 13.6 10 9.5 5 5 0 2011 2012 2013 2

Slide 56: Questions
Questions

Slide 57: Leeds Victoria
04 Leeds Victoria
Slide 58: Leeds: a major northern city with an affluent catchment
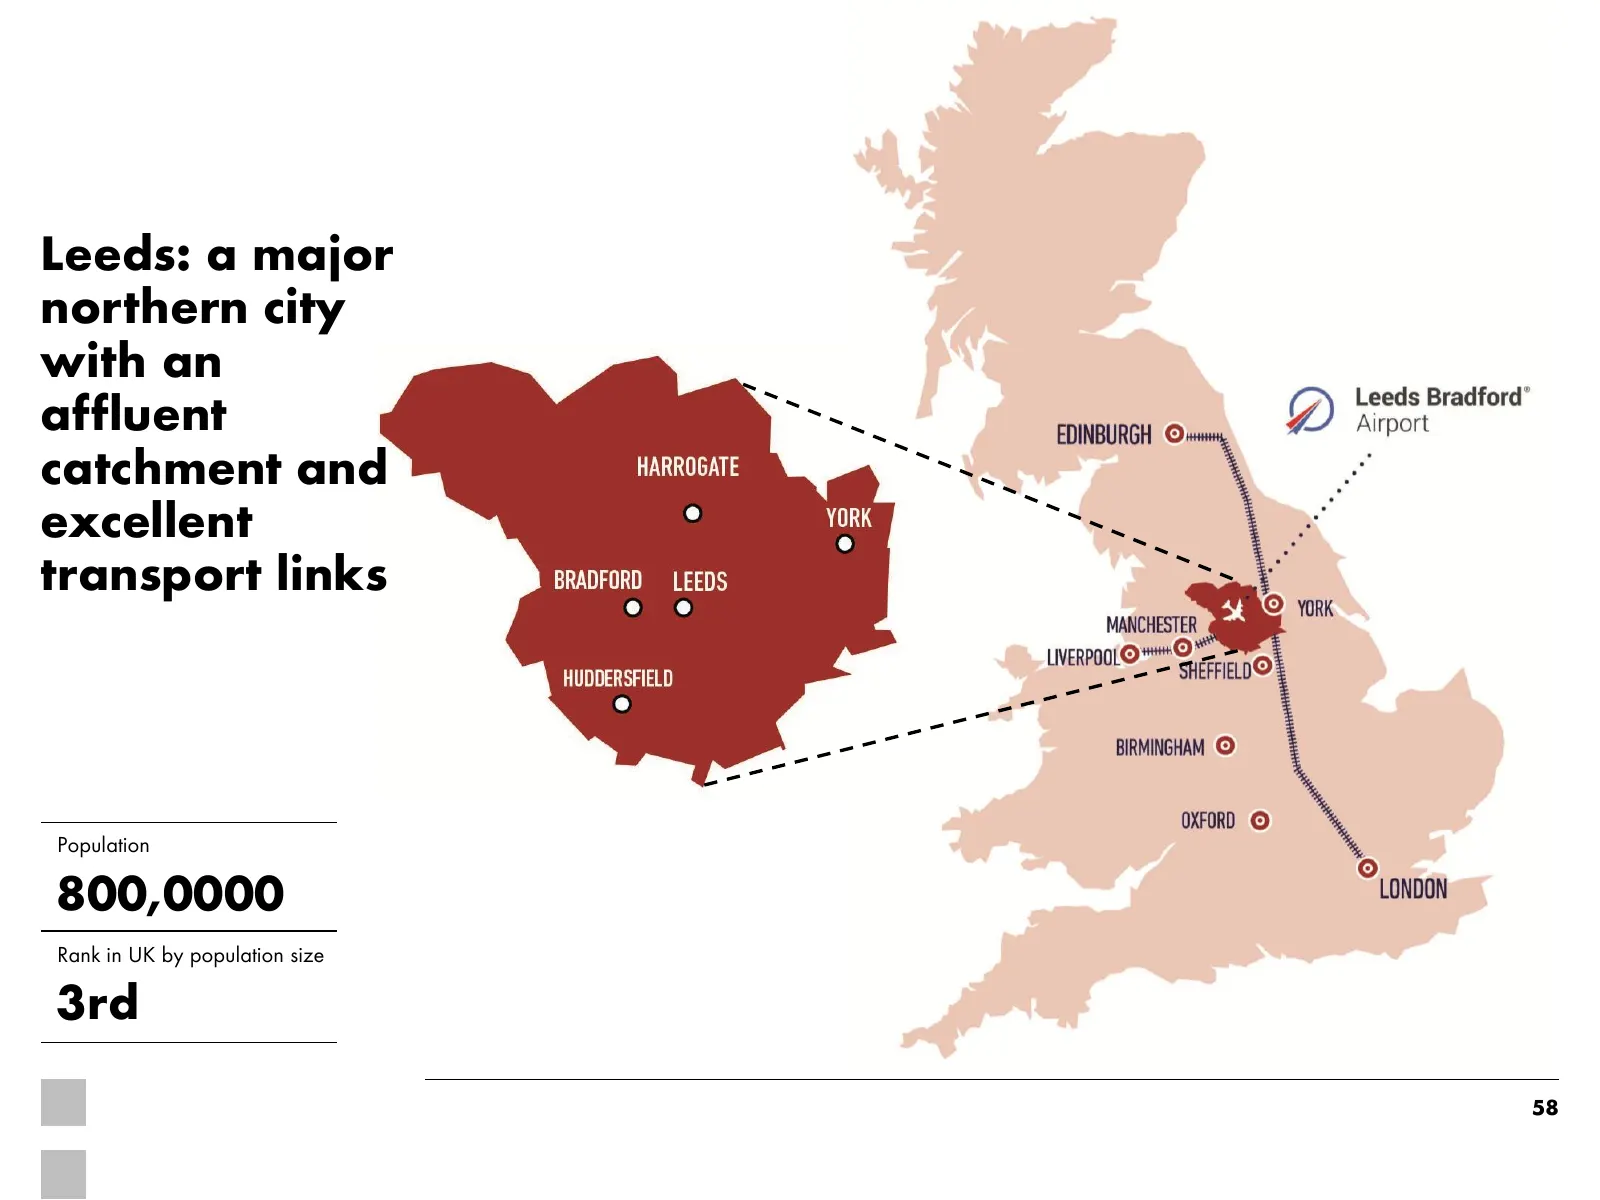
Leeds: a major northern city with an affluent catchment and excellent transport links Population 800,0000 Rank in UK by population size 3rd 58
Slide 59: Leeds city centre's retail core
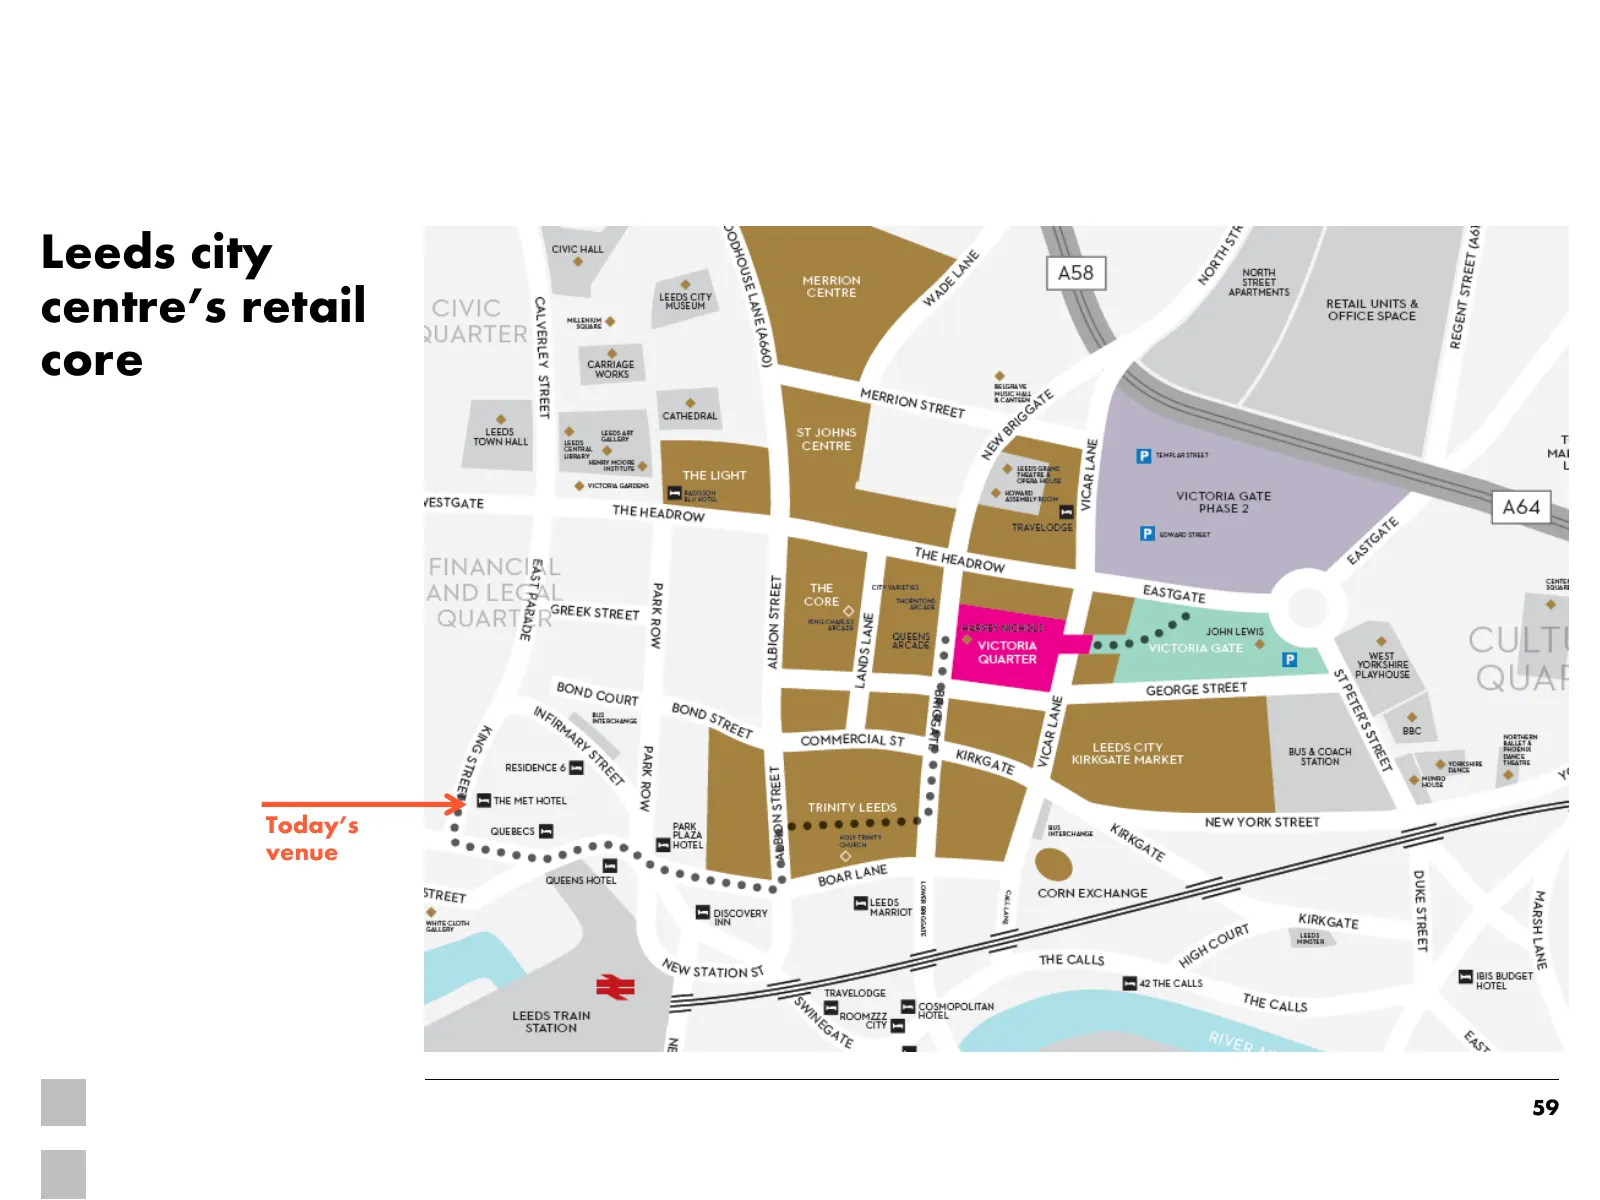
Leeds city centre’s retail core Today’s venue 59
Slide 60: A strong local economy
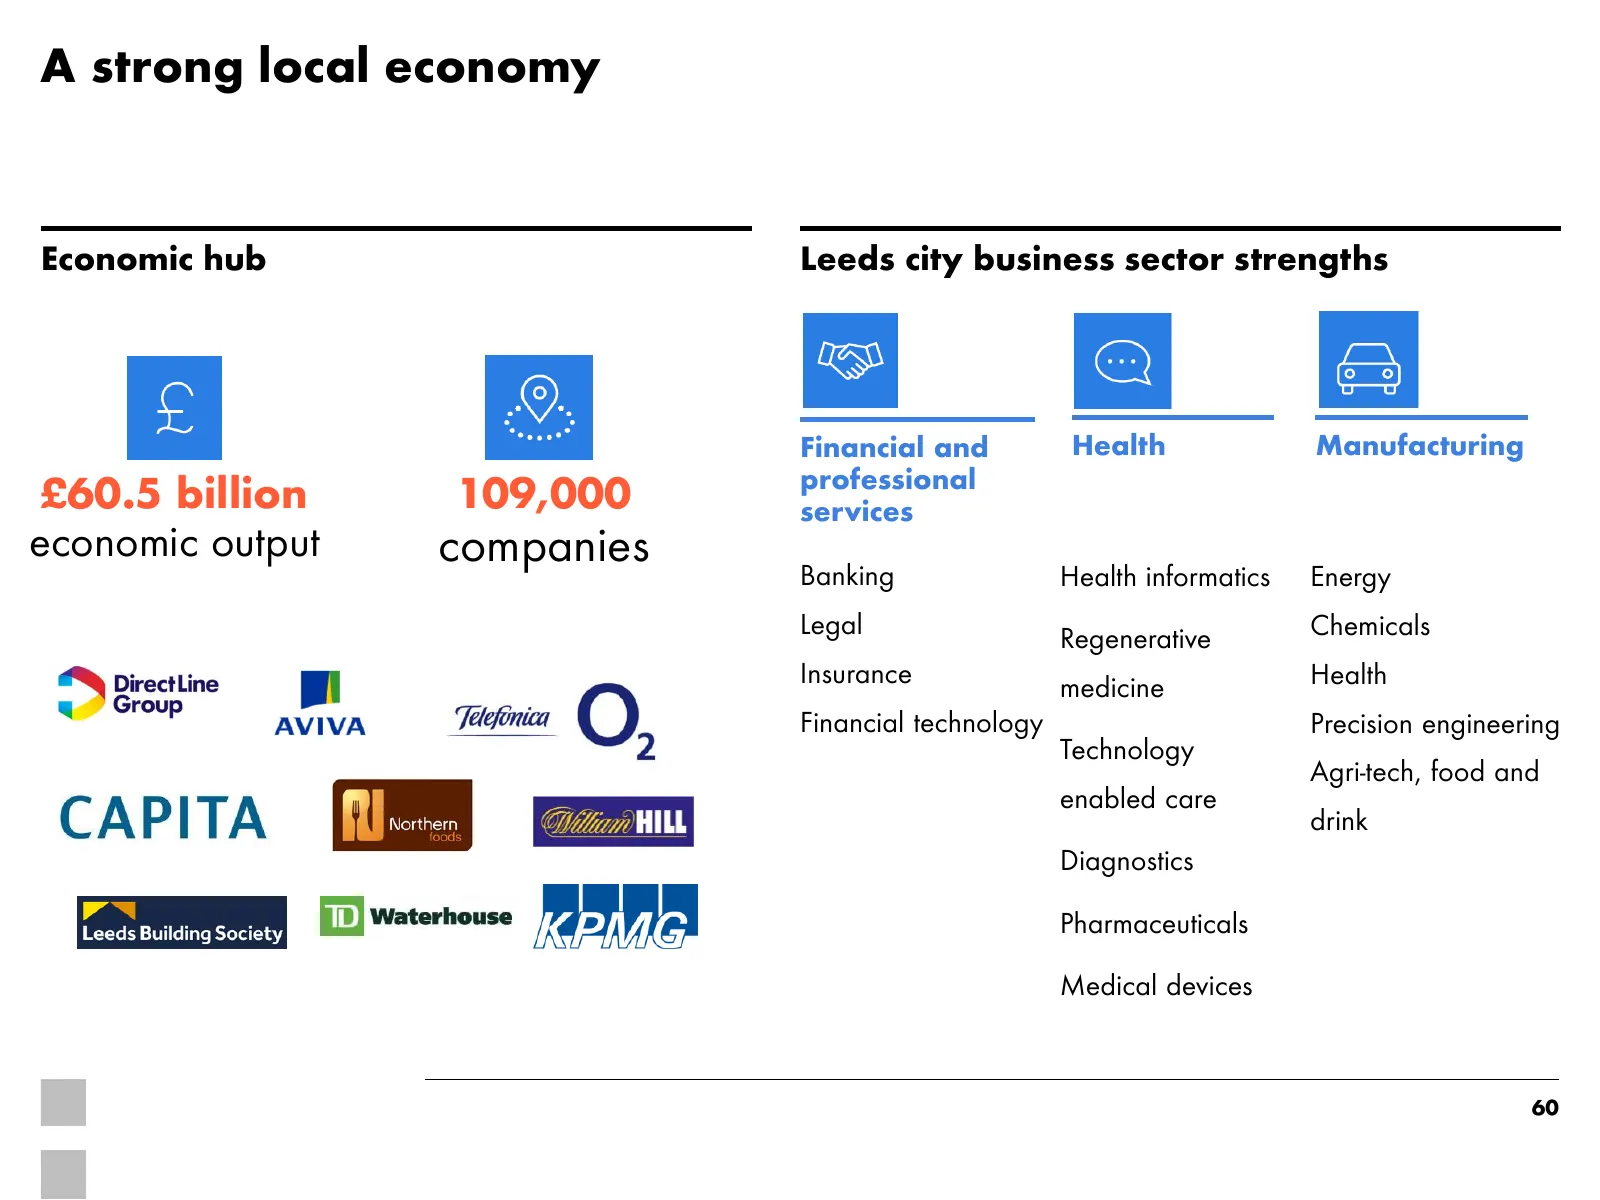
A strong local economy Economic hub Leeds city business sector strengths Financial and Health Manufacturing professional £60.5 billion 109,000 services economic output companies Banking Health informatics Energy Legal Chemicals Regenerative Insurance Health medicine Financial technology Precision en
Slide 61: Recent inward investment into Leeds' cultural space, infrastructure and manufacturing
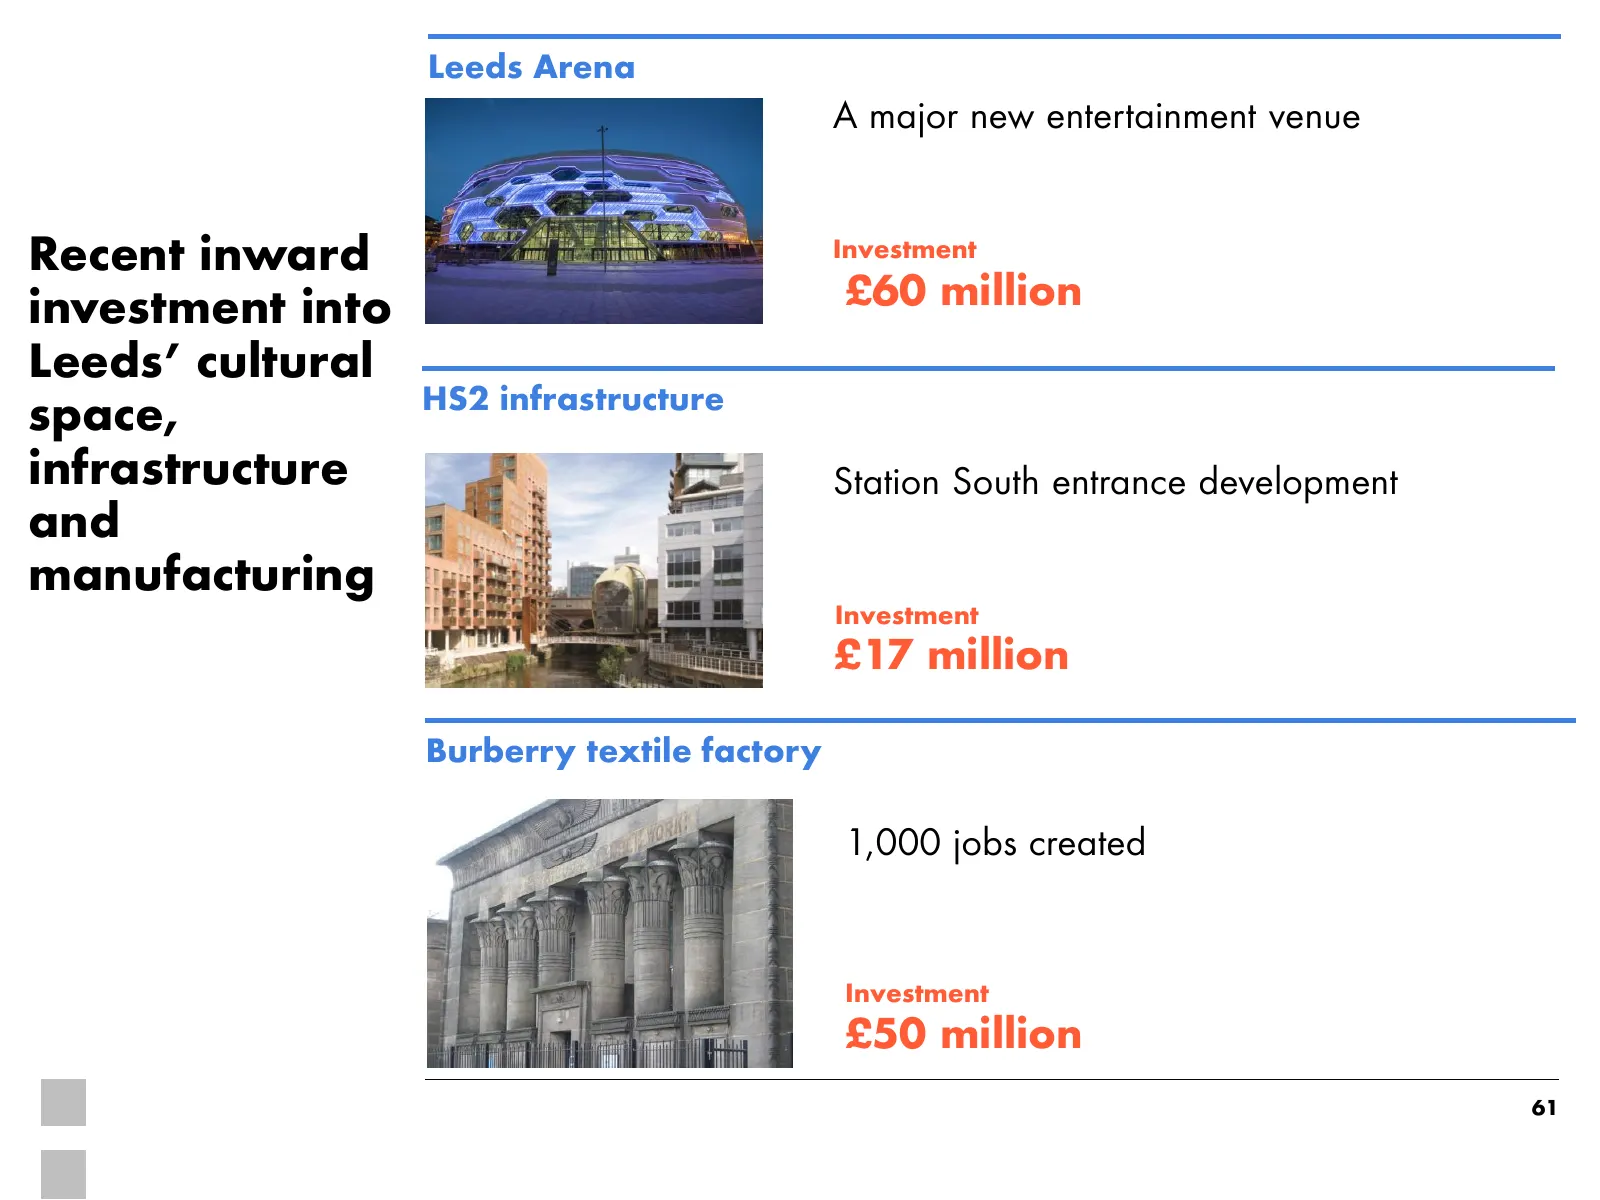
Leeds Arena A major new entertainment venue Recent inward Investment investment into £60 million Leeds’ cultural HS2 infrastructure space, infrastructure Station South entrance development and manufacturing Investment £17 million Burberry textile factory 1,000 jobs created Investment £50 million 61
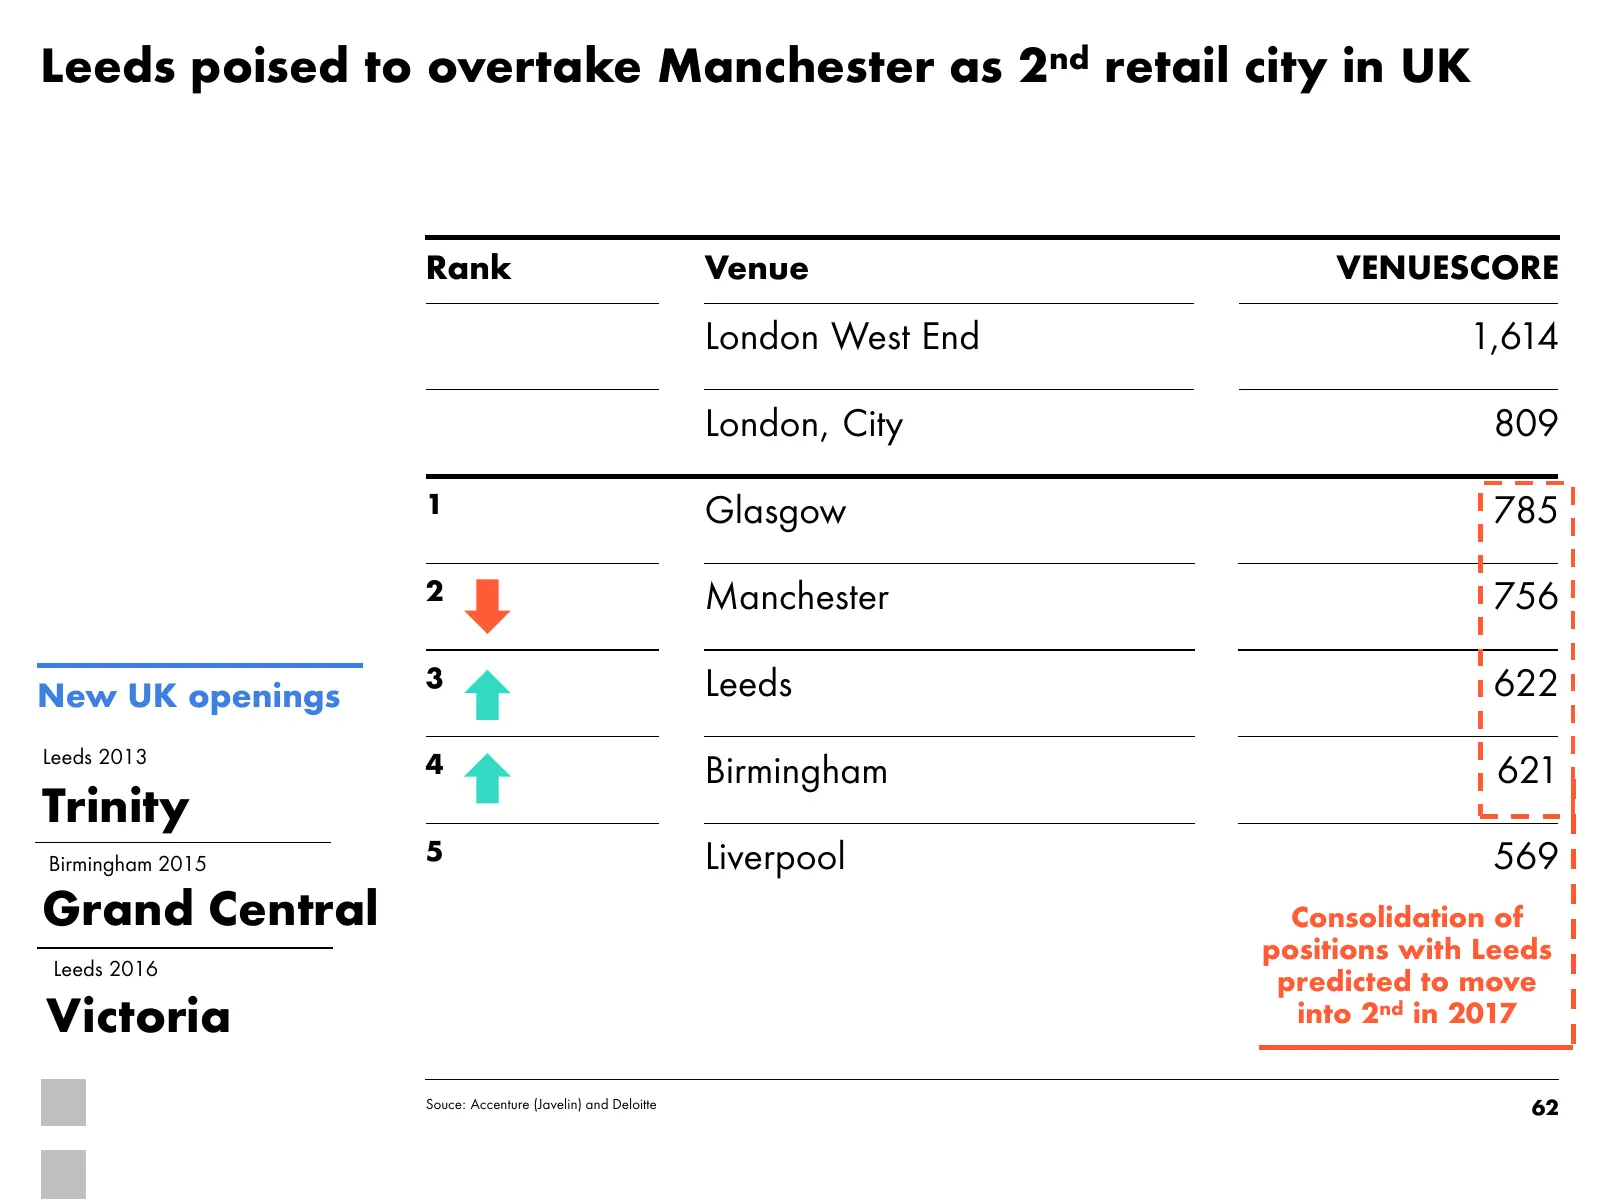
Slide 62: Leeds poised to overtake Manchester as 2nd retail city in UK
Leeds poised to overtake Manchester as 2nd retail city in UK Rank Venue VENUESCORE London West End 1,614 London, City 809 1 Glasgow 785 2 Manchester 756 3 Leeds 622 New UK openings Leeds 2013 4 Birmingham 621 Trinity Birmingham 2015 5 Liverpool 569 Grand Central Consolidation of positions with Leeds
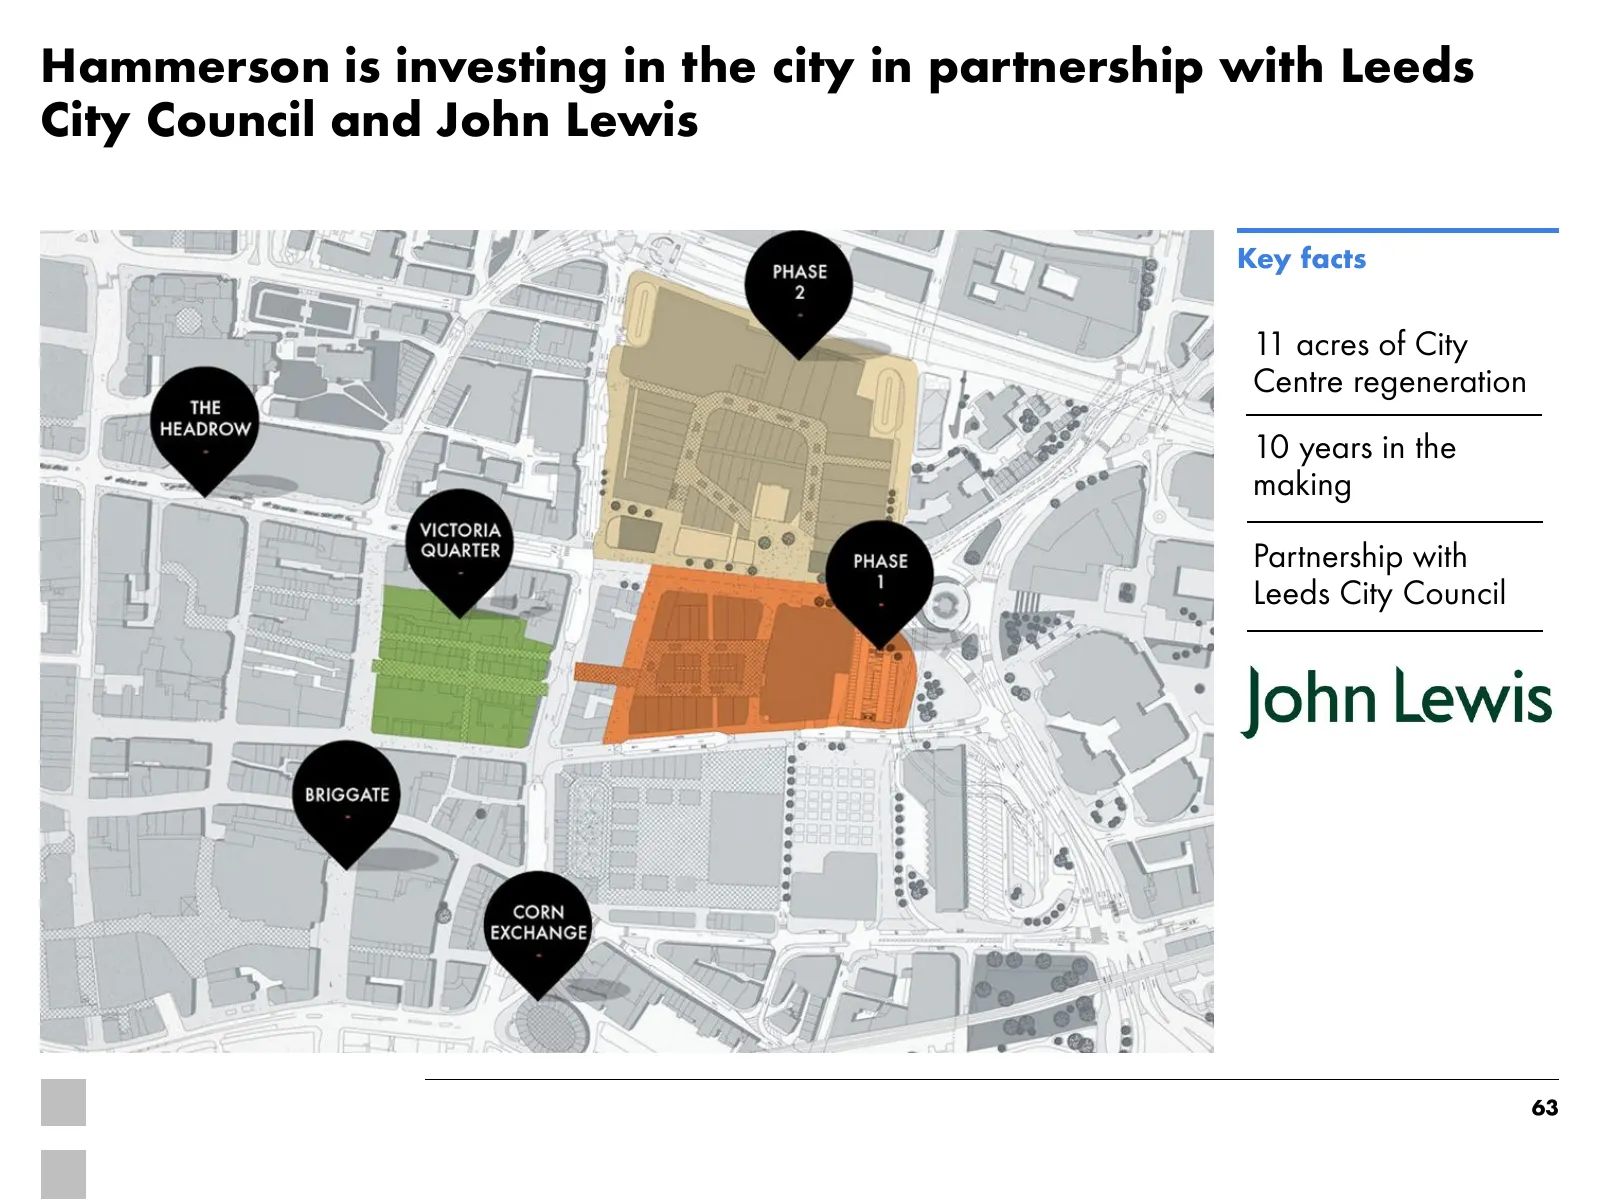
Slide 63: Hammerson is investing in the city in partnership with Leeds City Council and John Lewis
Hammerson is investing in the city in partnership with Leeds City Council and John Lewis Key facts 11 acres of City Centre regeneration 10 years in the making Partnership with Leeds City Council 63
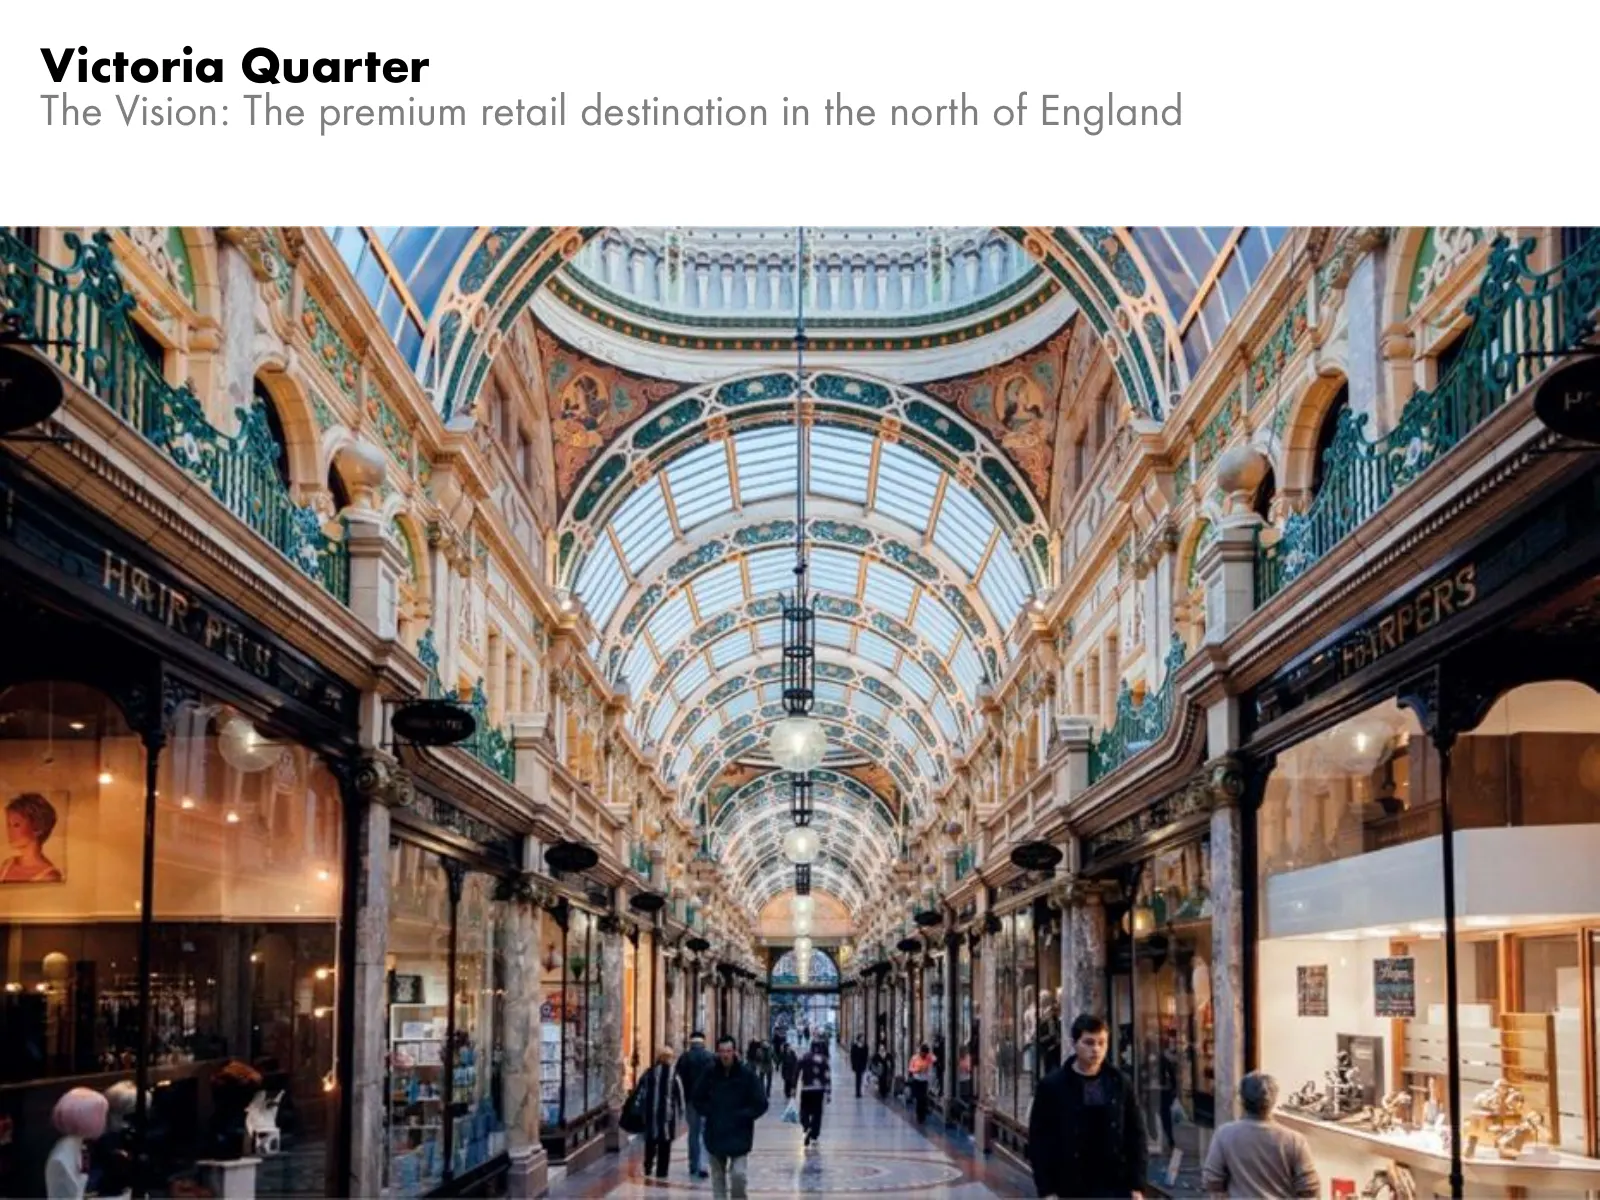
Slide 64: Victoria Quarter
Victoria Quarter The Vision: The premium retail destination in the north of England
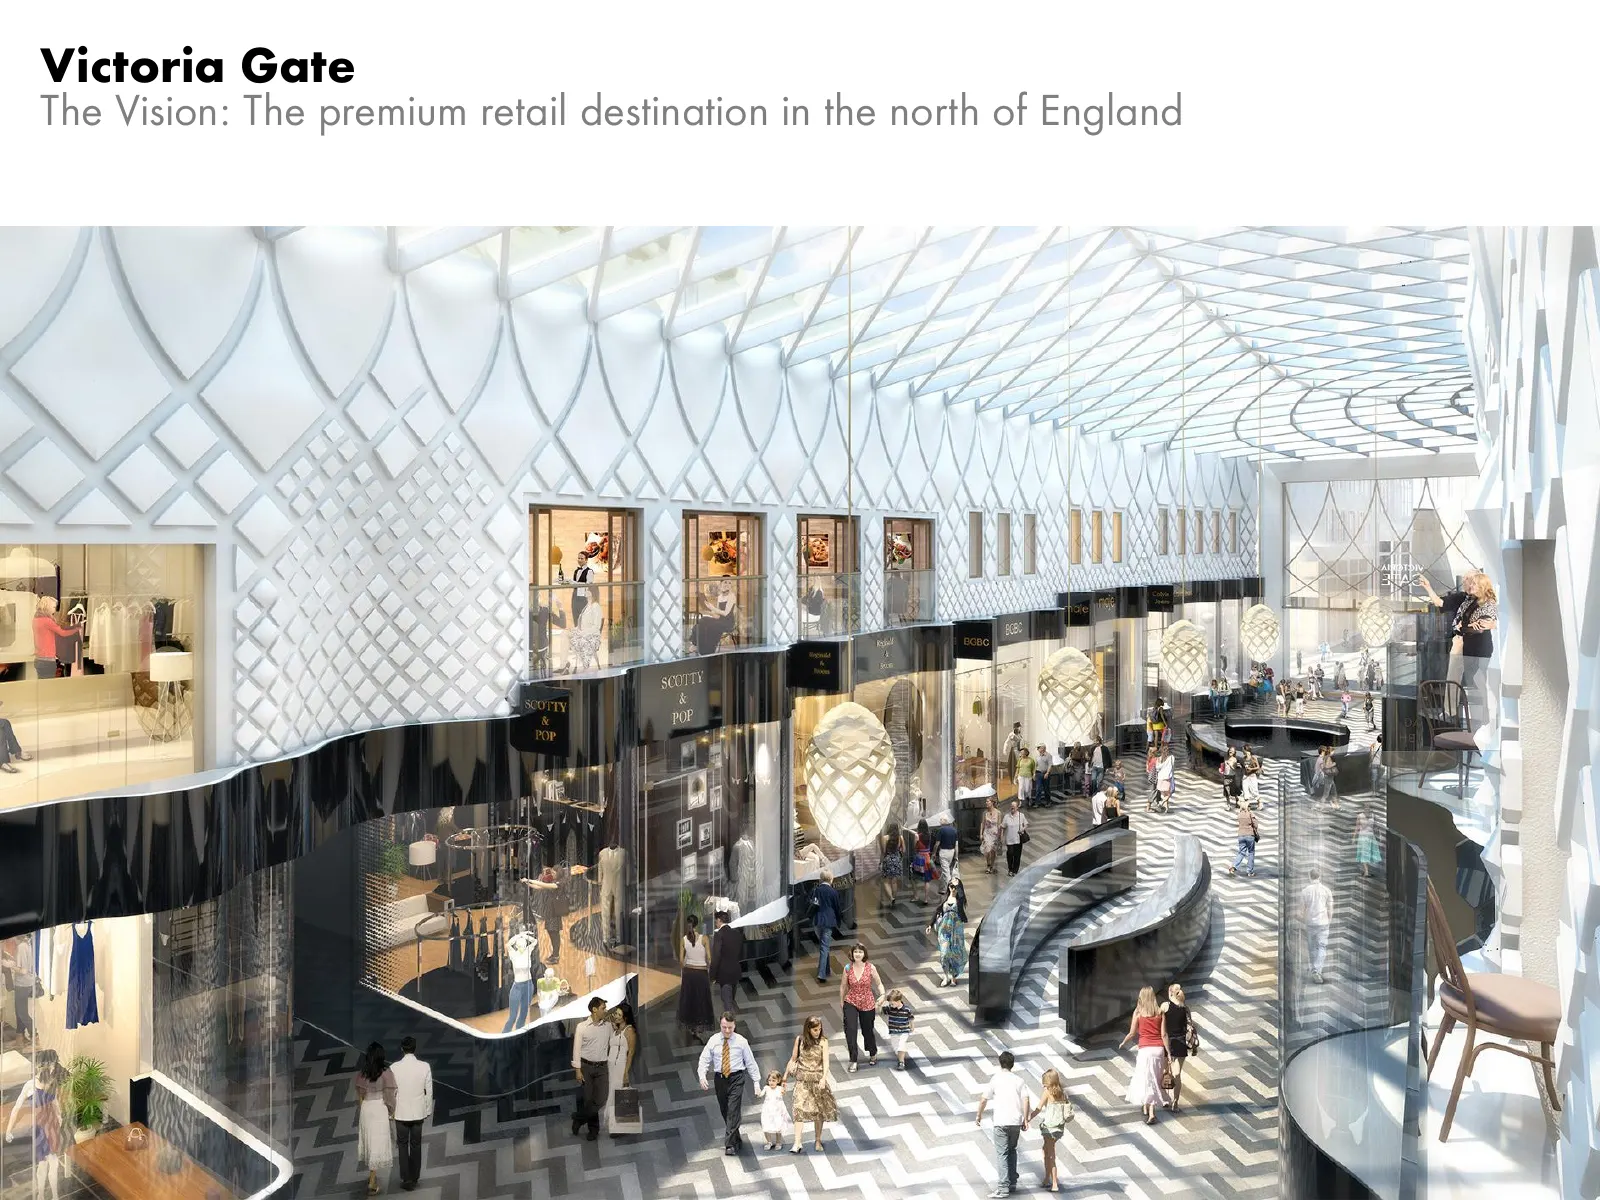
Slide 65: Victoria Gate
Victoria Gate The Vision: The premium retail destination in the north of England
Slide 66: The Victoria vision
The Victoria vision Brand positioning To secure the ‘Victoria’ brand as the destination for premium and aspirational shopping in the north of England 66
Slide 67: The Victoria opportunity
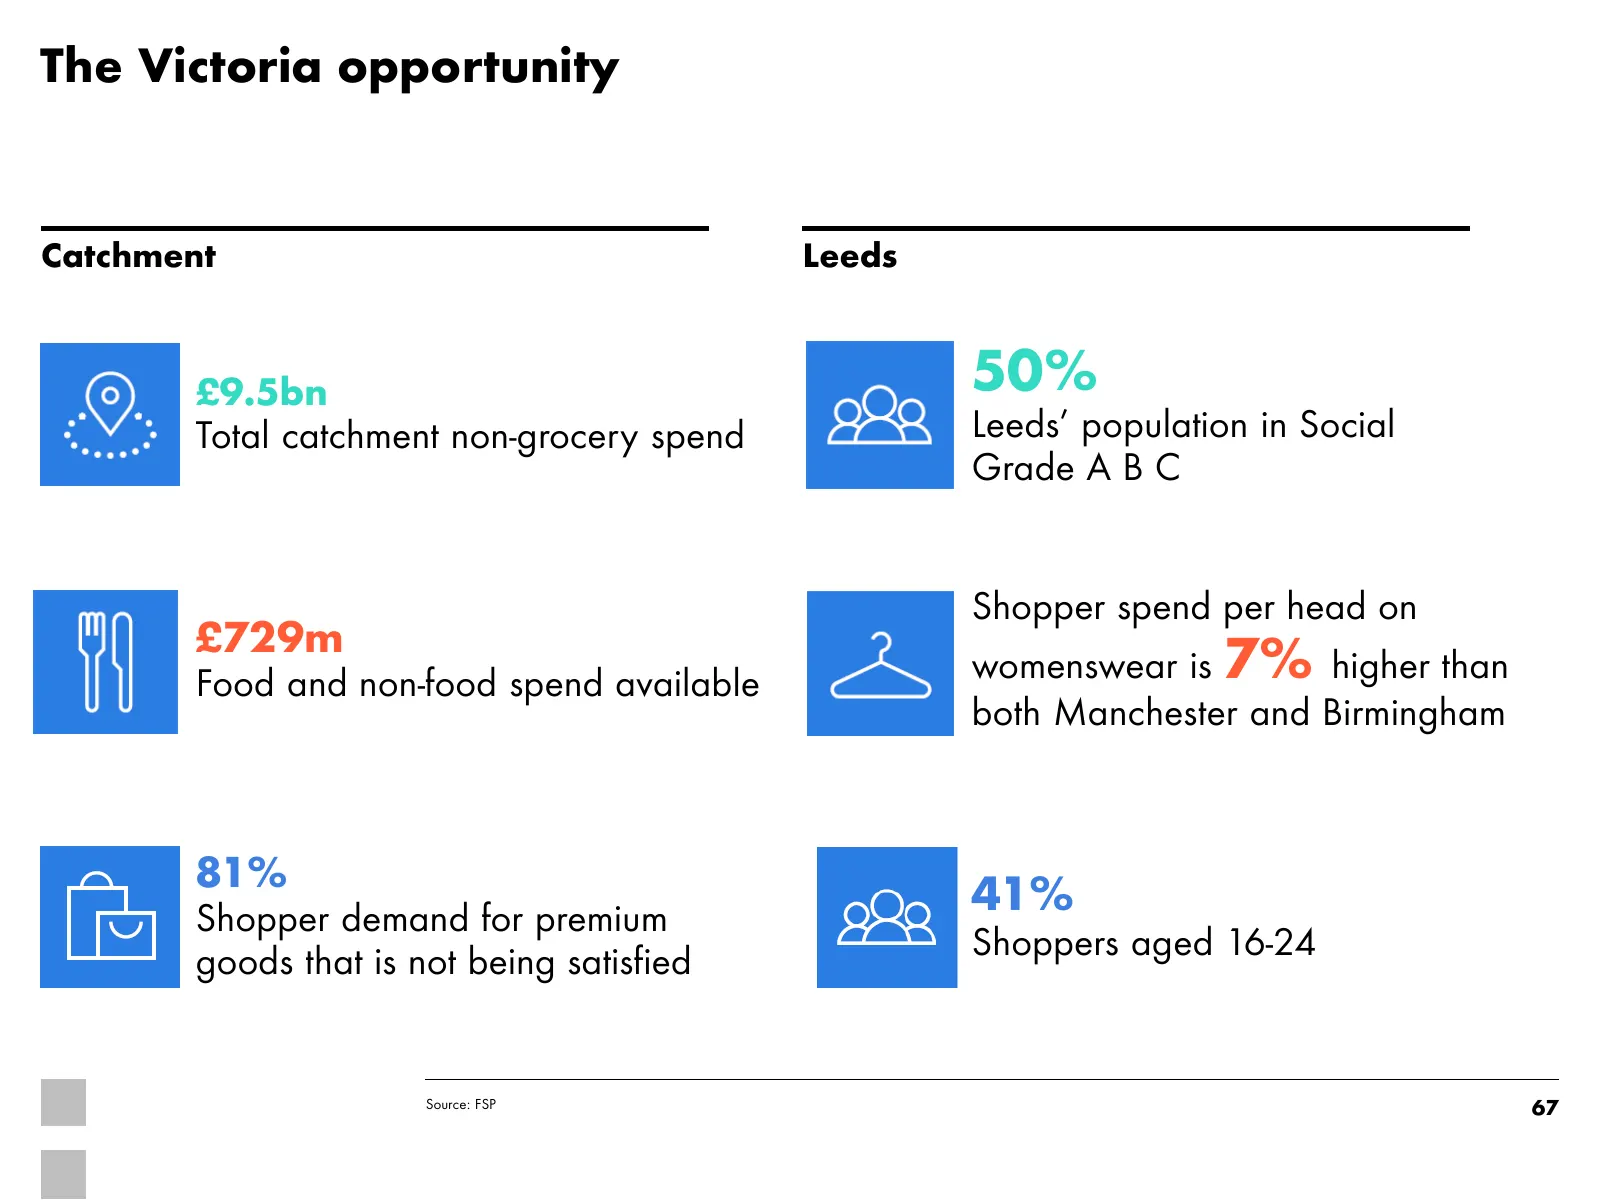
The Victoria opportunity Catchment Leeds £9.5bn 50% Total catchment non-grocery spend Leeds’ population in Social Grade A B C Shopper spend per head on £729m womenswear is 7% higher than Food and non-food spend available both Manchester and Birmingham 81% Shopper demand for premium 41% Shoppers aged
Slide 68: Positioning Victoria amongst the leading premium retail destinations
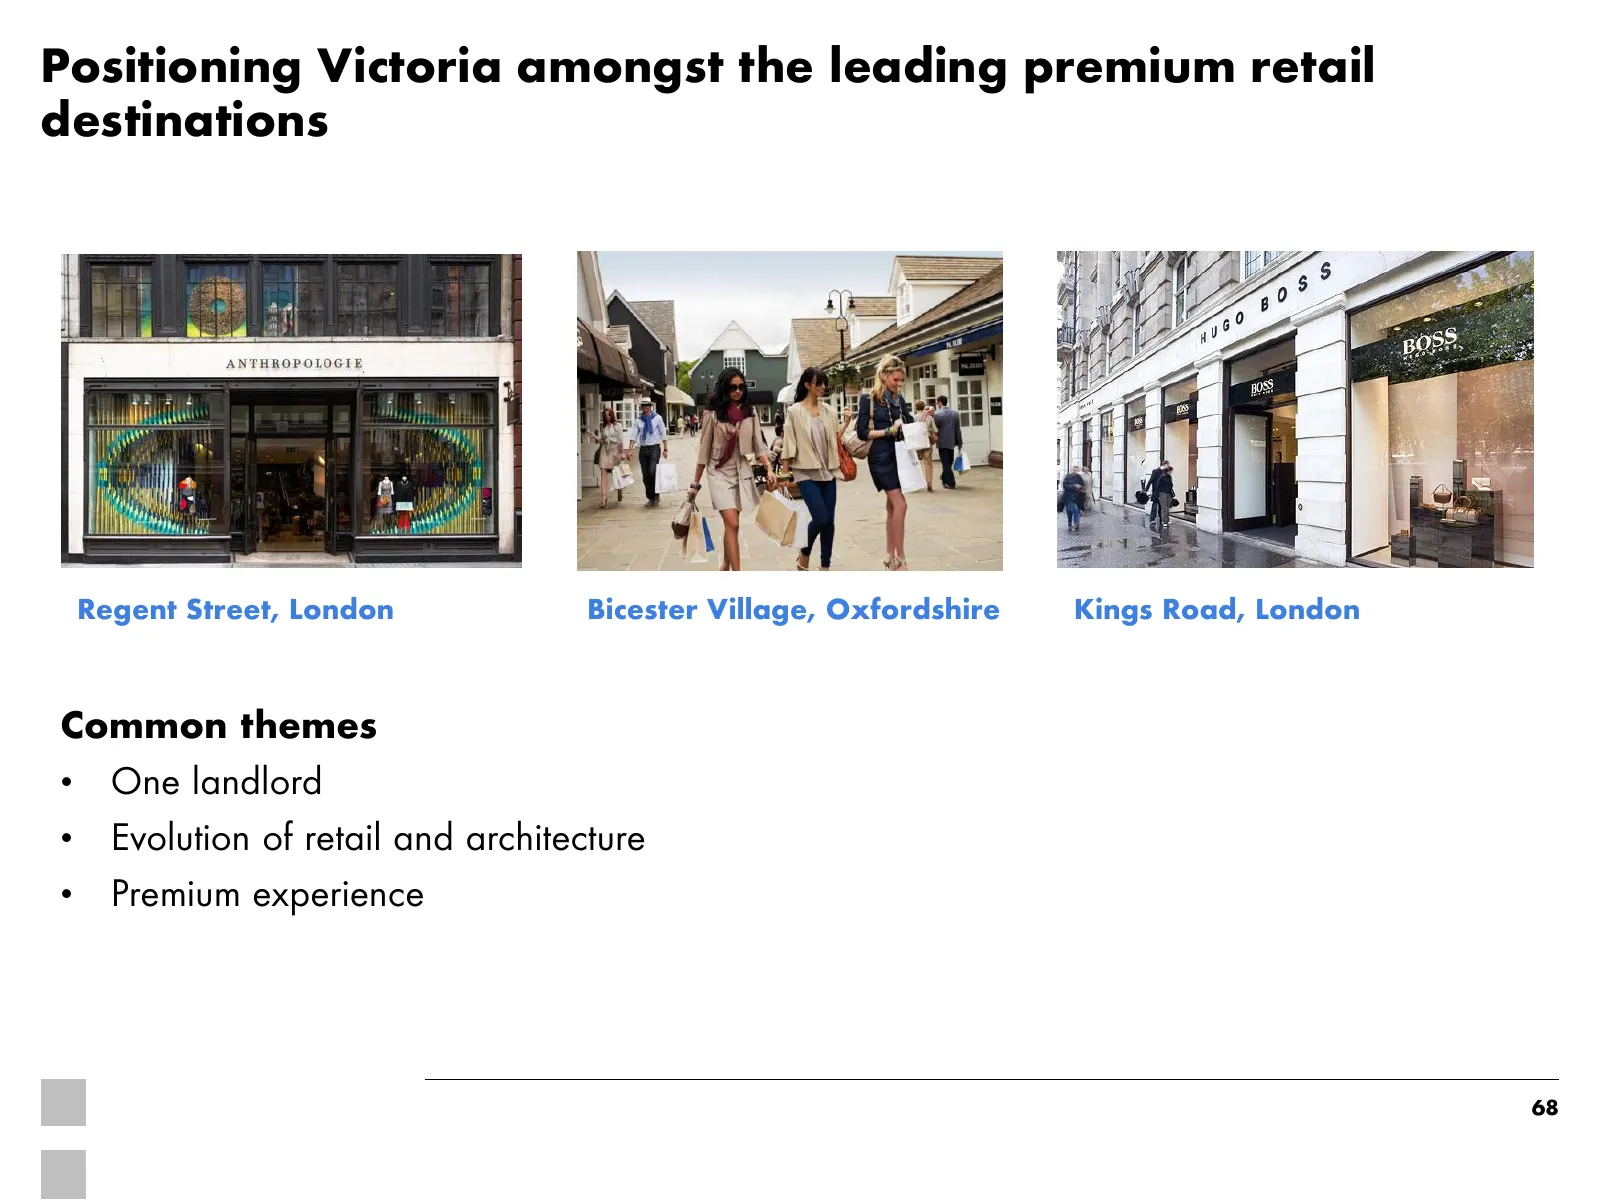
Positioning Victoria amongst the leading premium retail destinations Regent Street, London Bicester Village, Oxfordshire Kings Road, London Common themes • One landlord • Evolution of retail and architecture • Premium experience 68
Slide 69: Historical architecture creates a unique retail setting
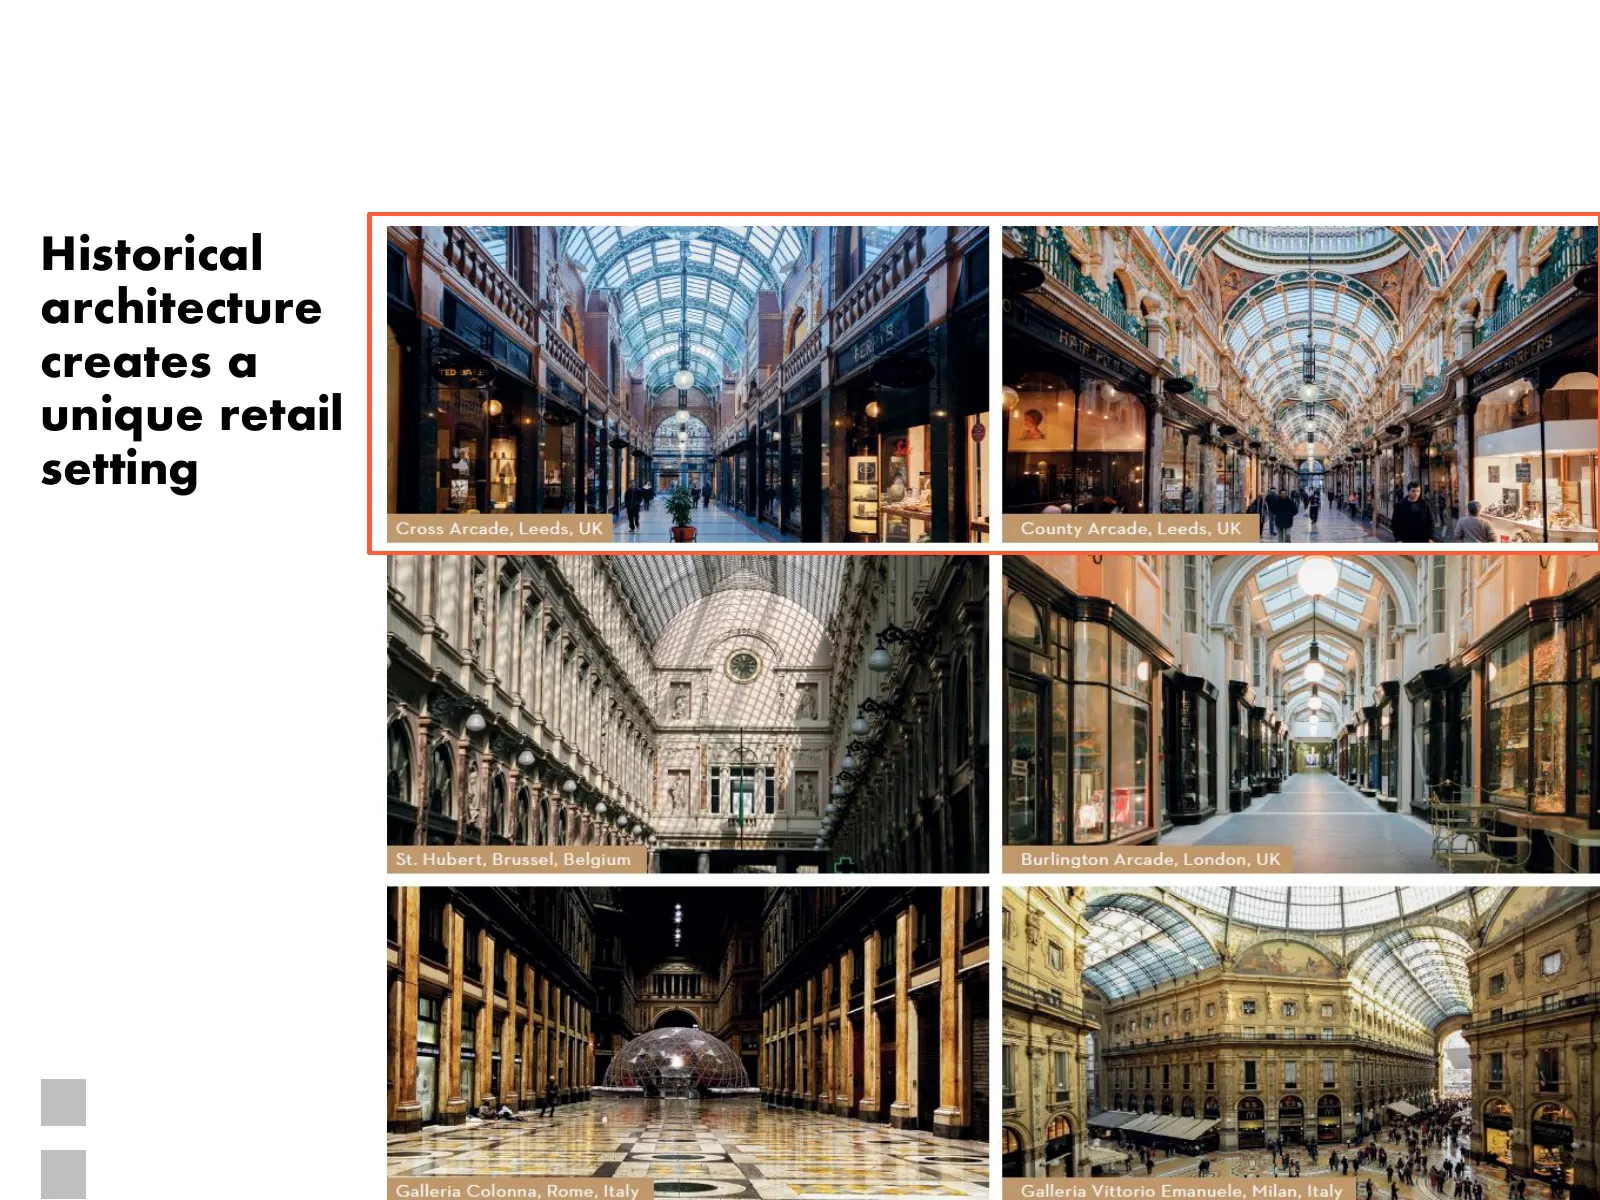
Historical architecture creates a unique retail setting 69
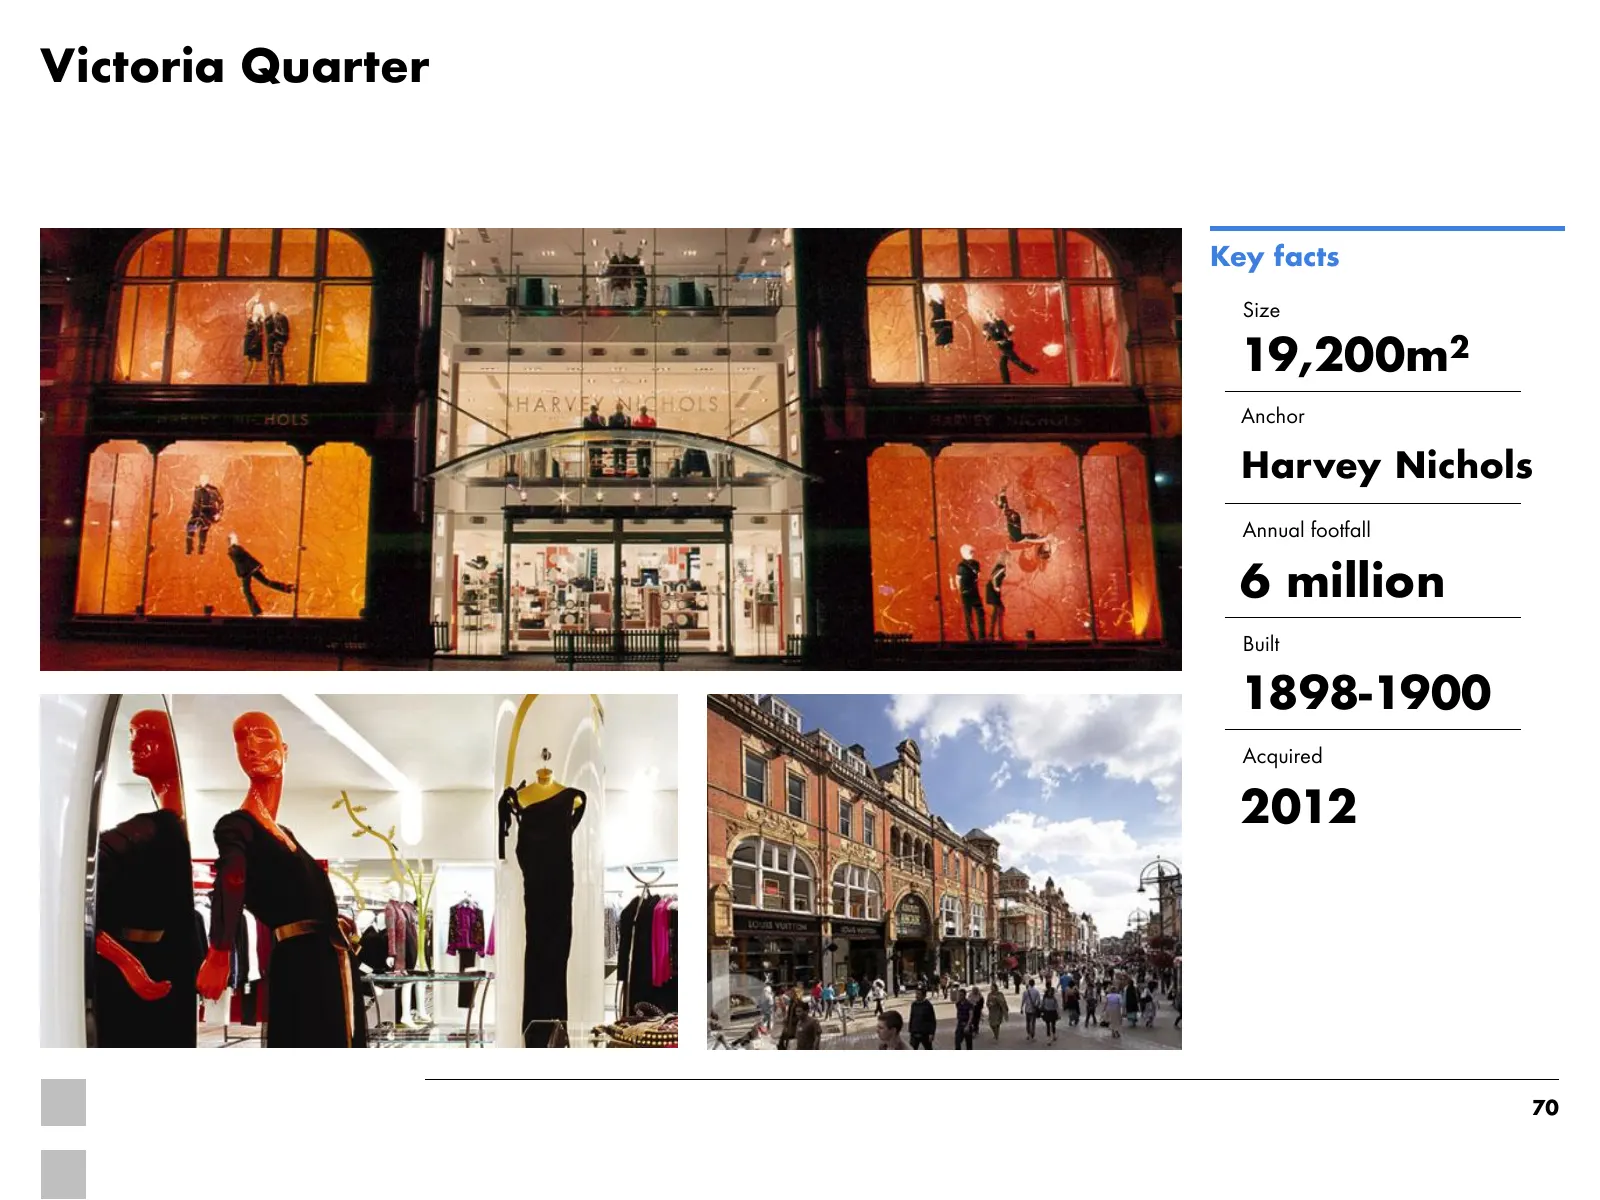
Slide 70: Victoria Quarter
Victoria Quarter Key facts Size 19,200m2 Anchor Harvey Nichols Annual footfall 6 million Built 1898-1900 Acquired 2012 70
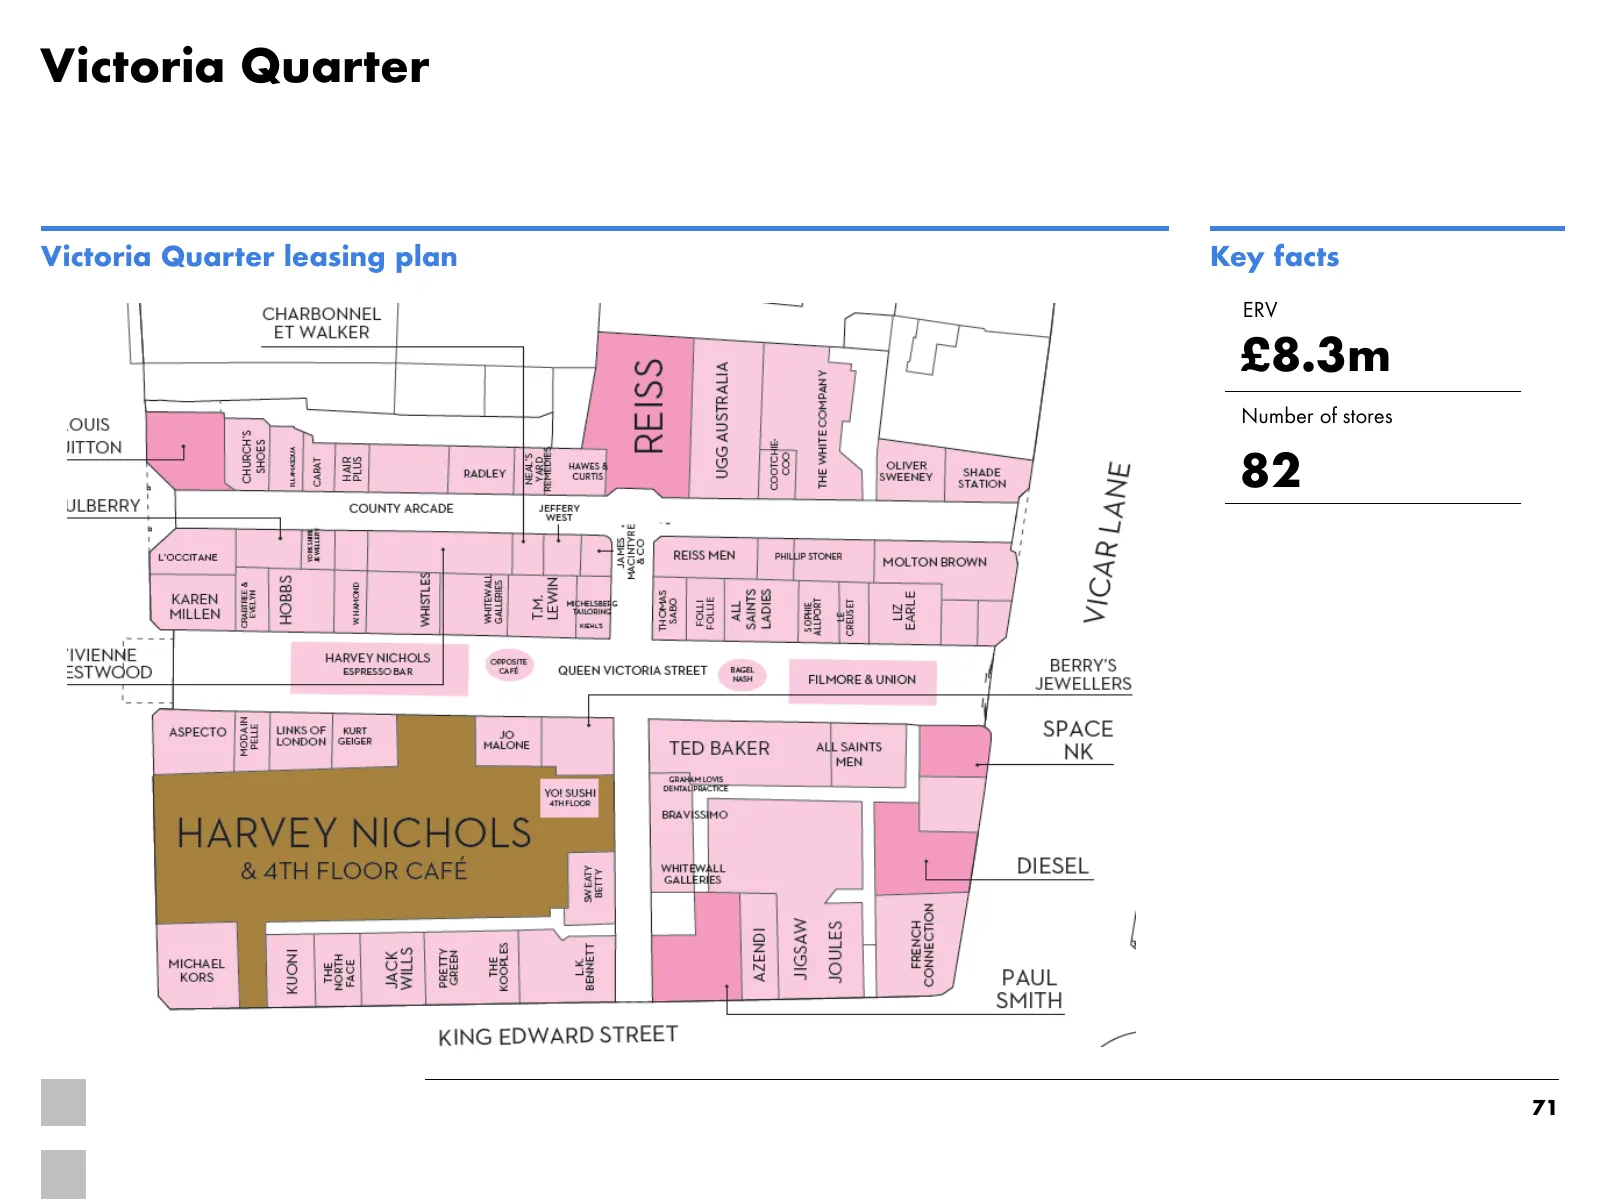
Slide 71: Victoria Quarter
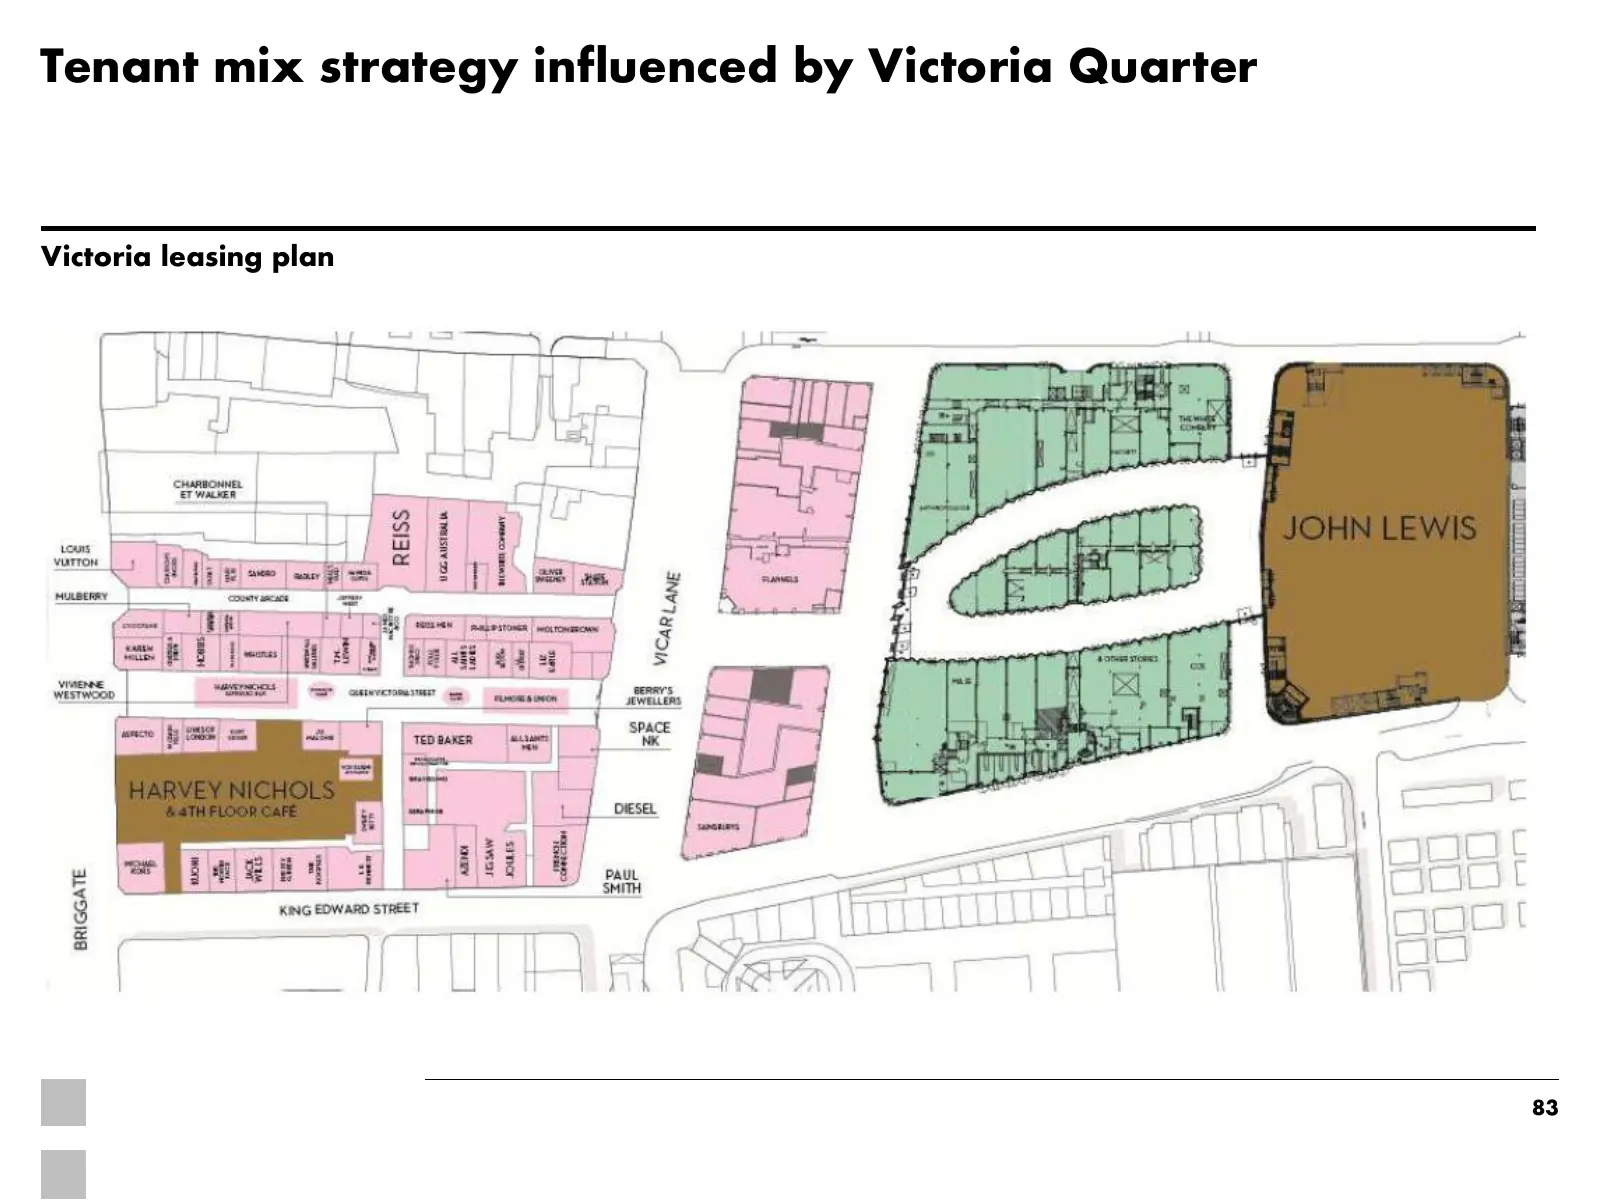
Victoria Quarter Victoria Quarter leasing plan Key facts ERV £8.3m Number of stores 82 71
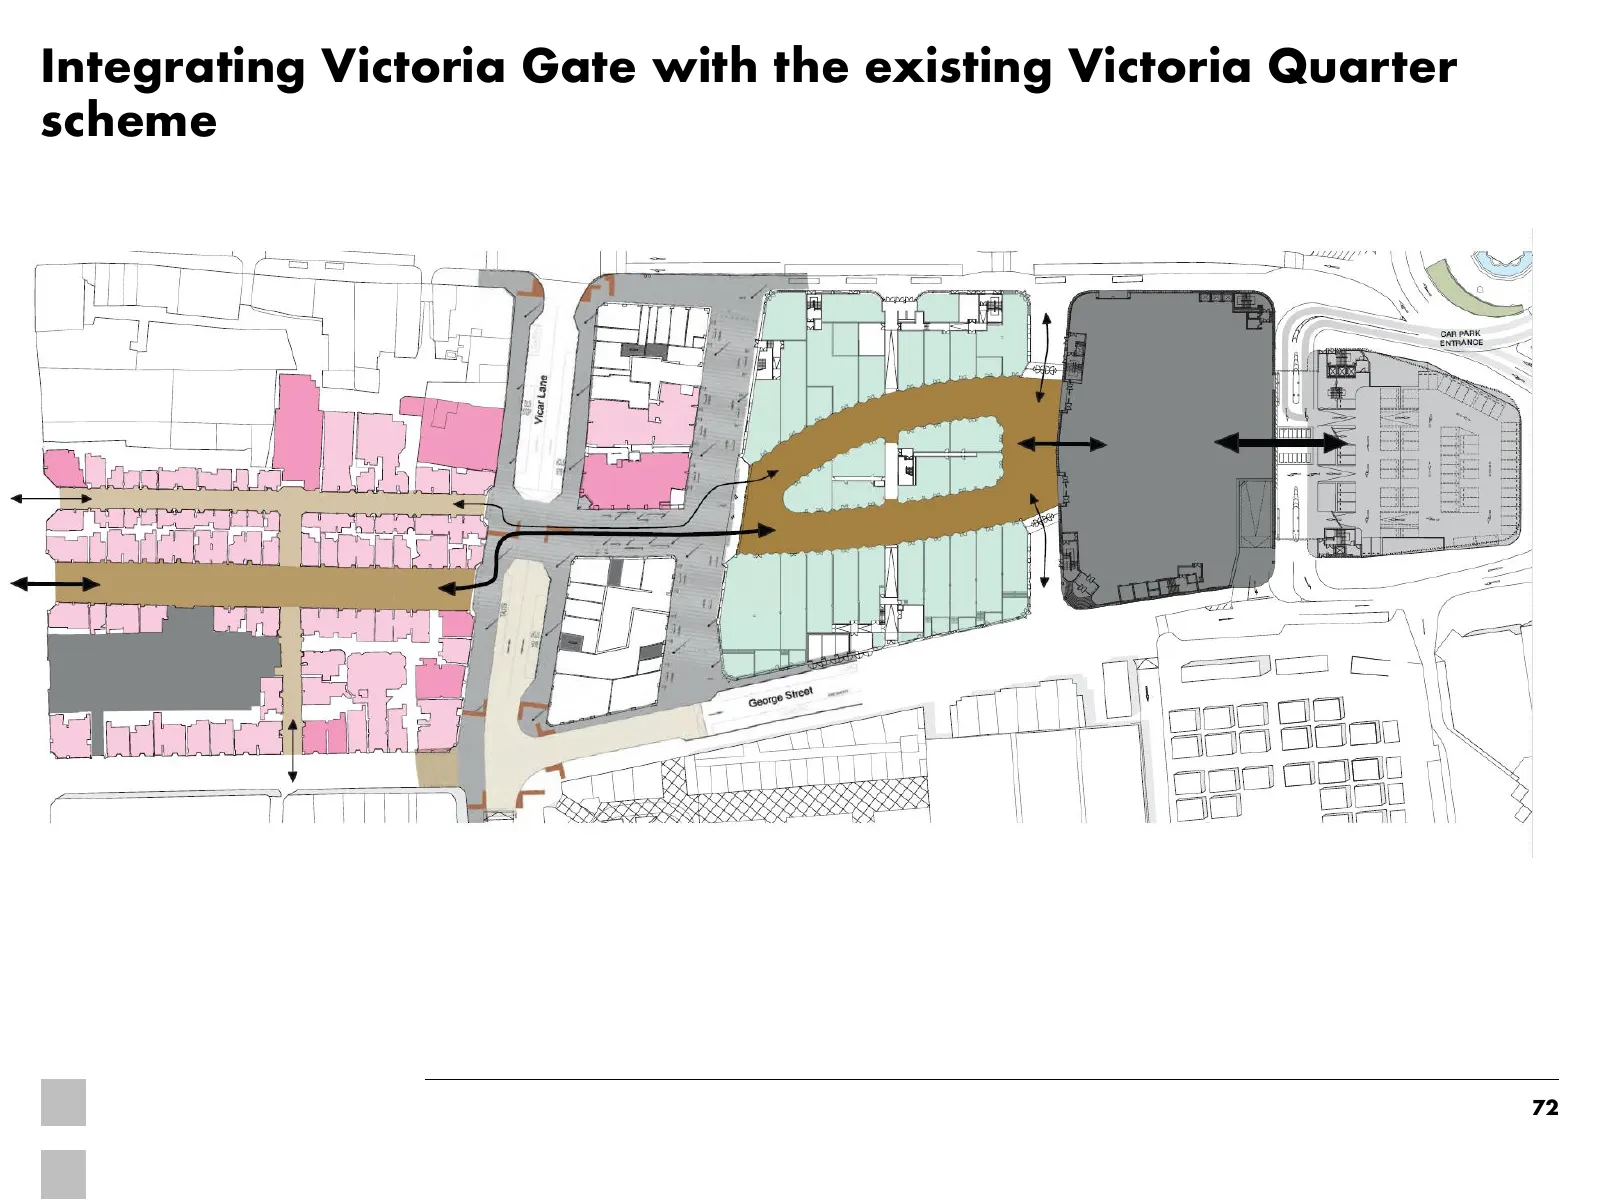
Slide 72: Integrating Victoria Gate with the existing Victoria Quarter scheme
Integrating Victoria Gate with the existing Victoria Quarter scheme 72
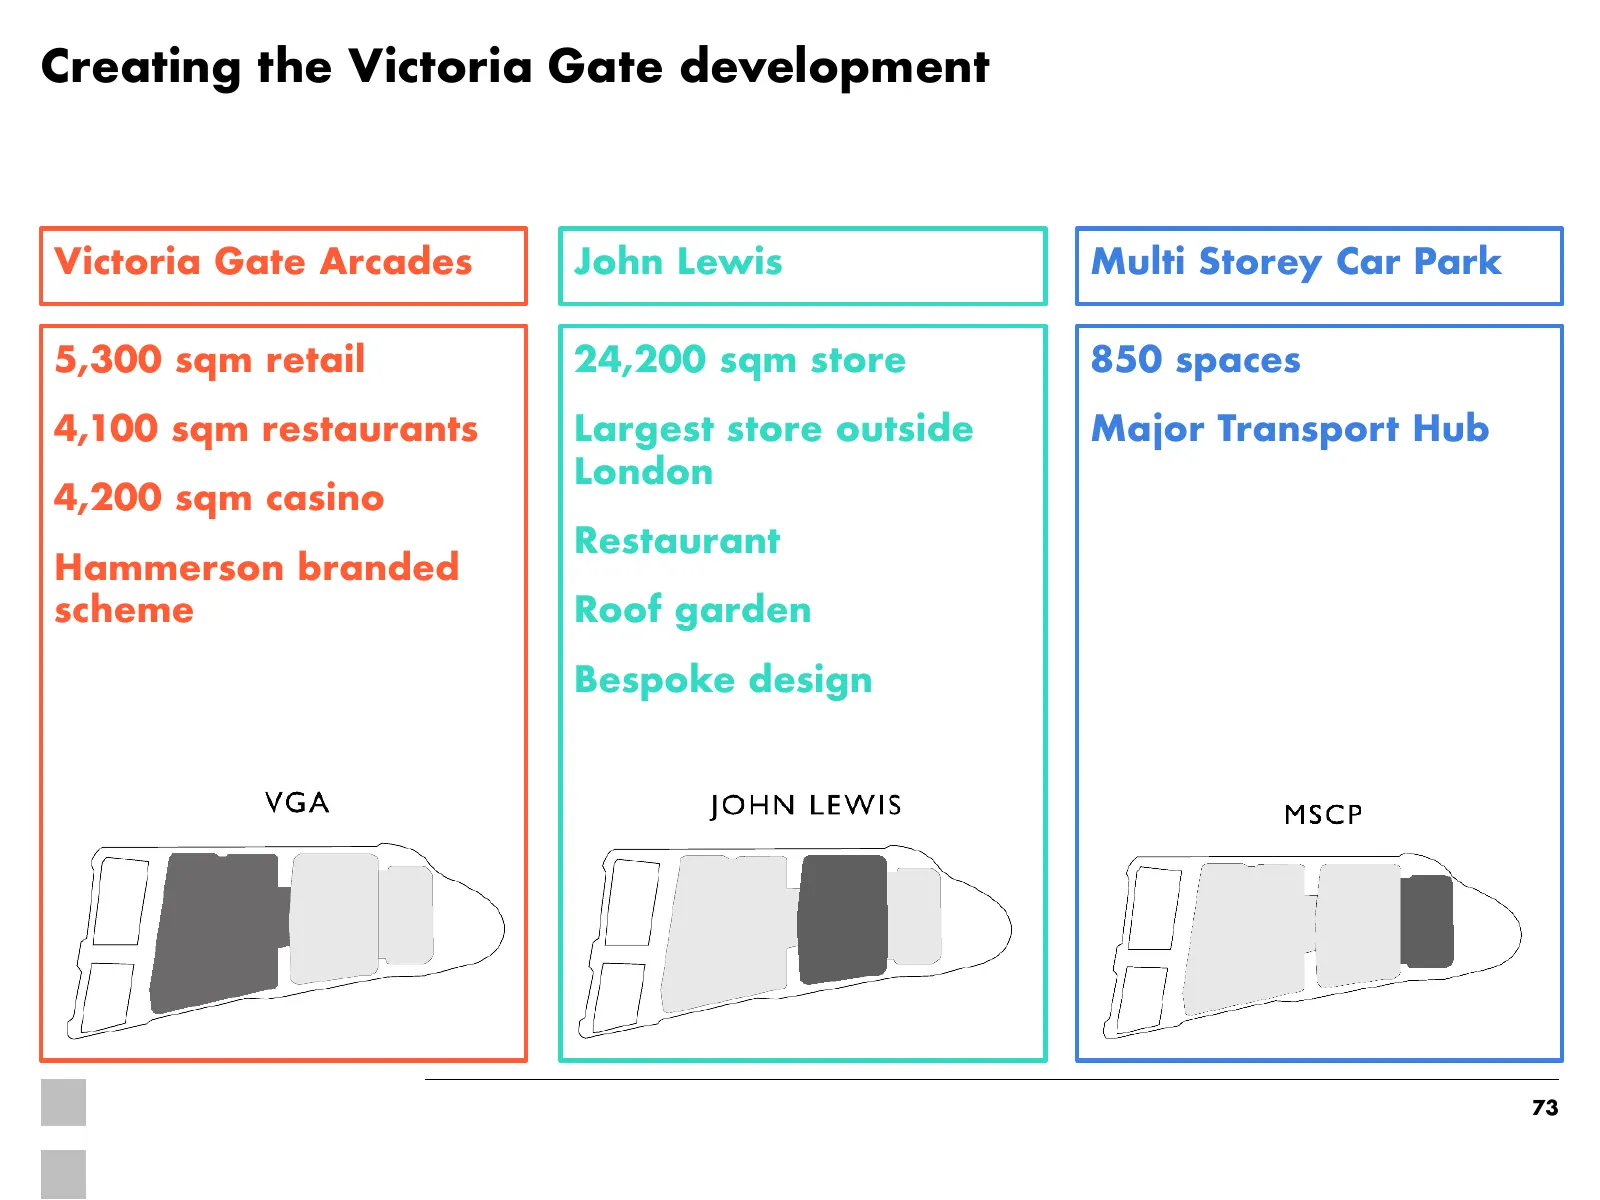
Slide 73: Creating the Victoria Gate development
Creating the Victoria Gate development Victoria Gate Arcades John Lewis Multi Storey Car Park 5,300 sqm retail 24,200 sqm store 850 spaces 4,100 sqm restaurants Largest store outside Major Transport Hub London 4,200 sqm casino Restaurant Hammerson branded scheme Roof garden Bespoke design 73
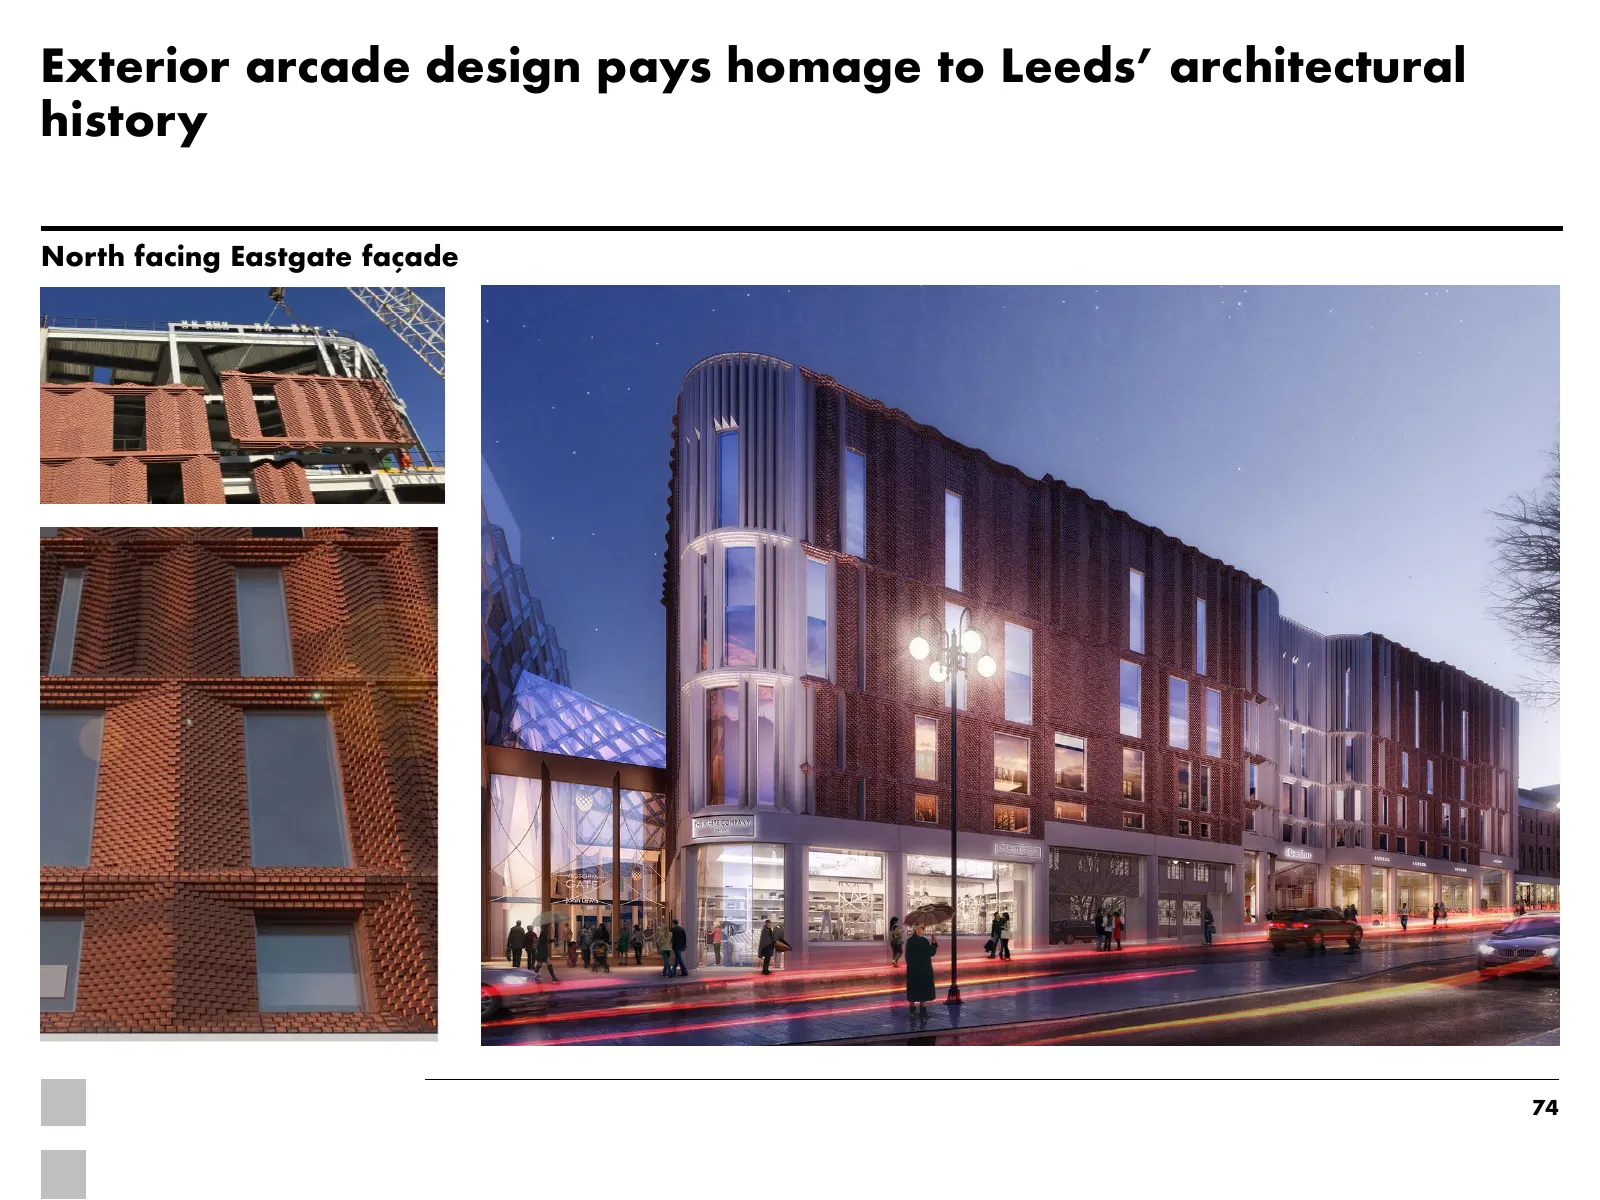
Slide 74: Exterior arcade design pays homage to Leeds' architectural history
Exterior arcade design pays homage to Leeds’ architectural history North facing Eastgate façade 74
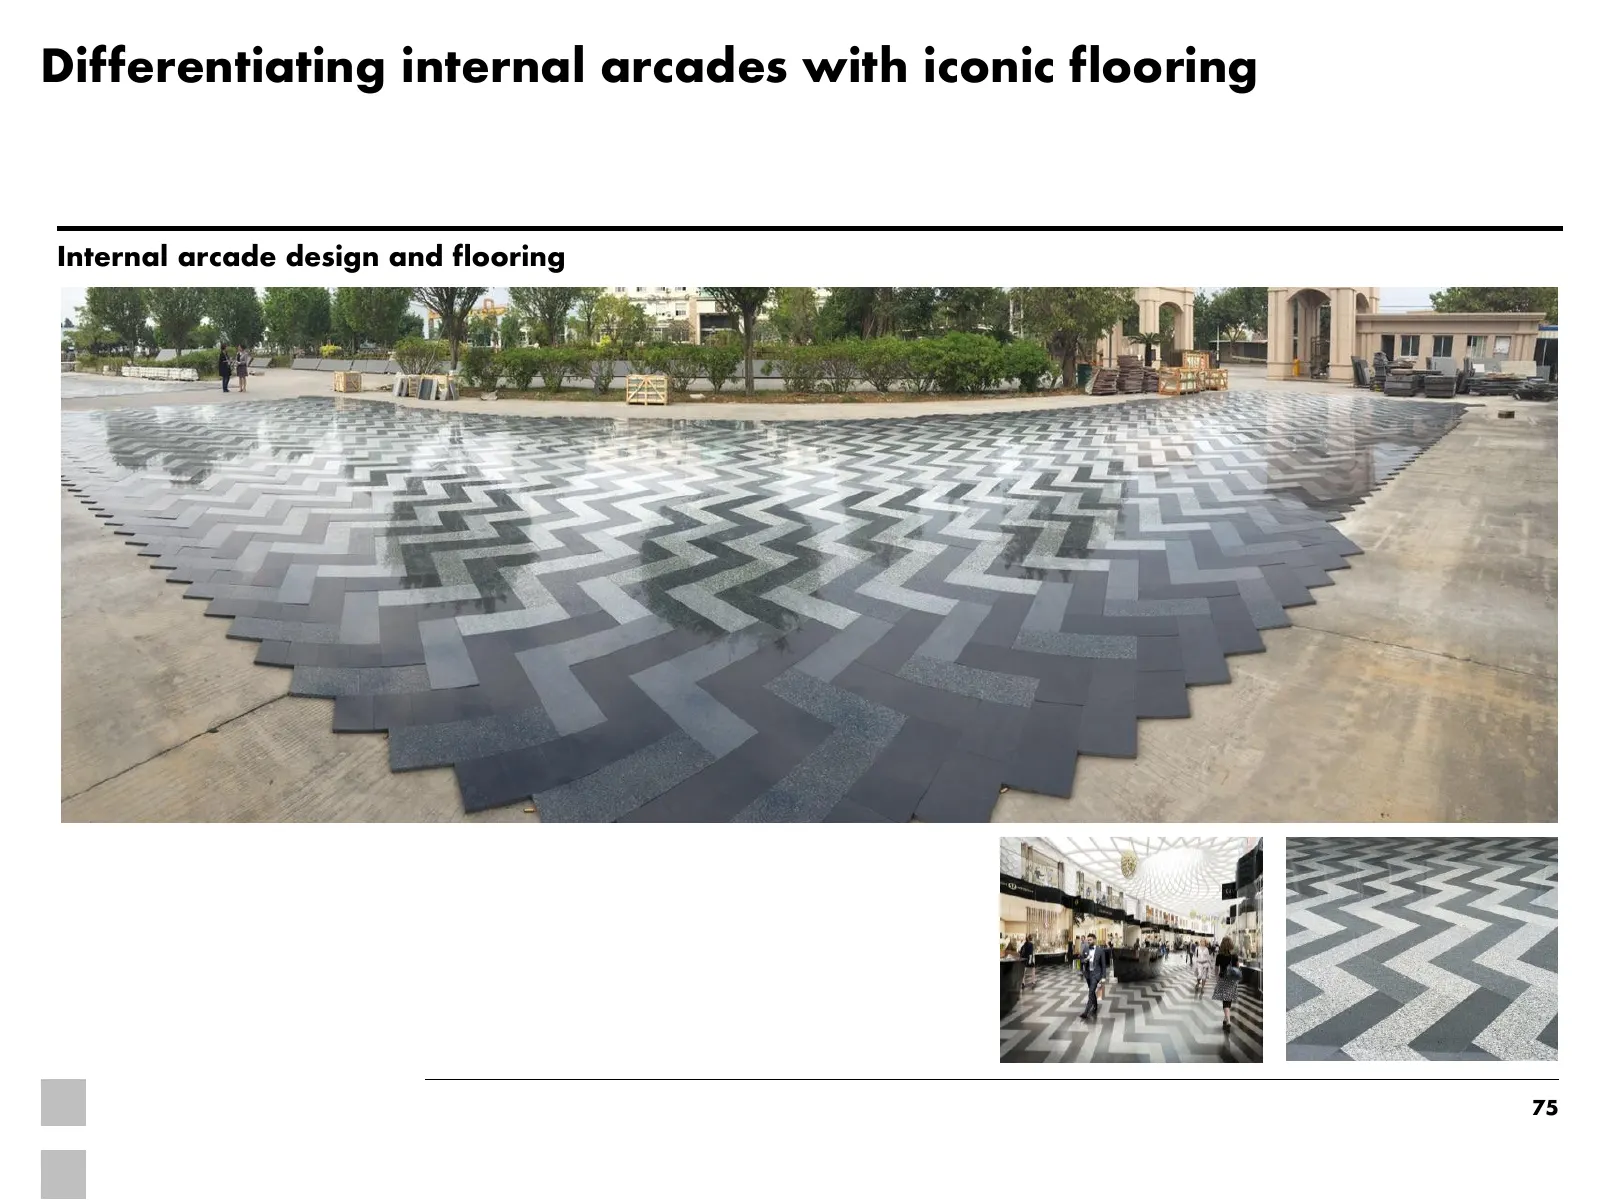
Slide 75: Differentiating internal arcades with iconic flooring
Differentiating internal arcades with iconic flooring Internal arcade design and flooring 75
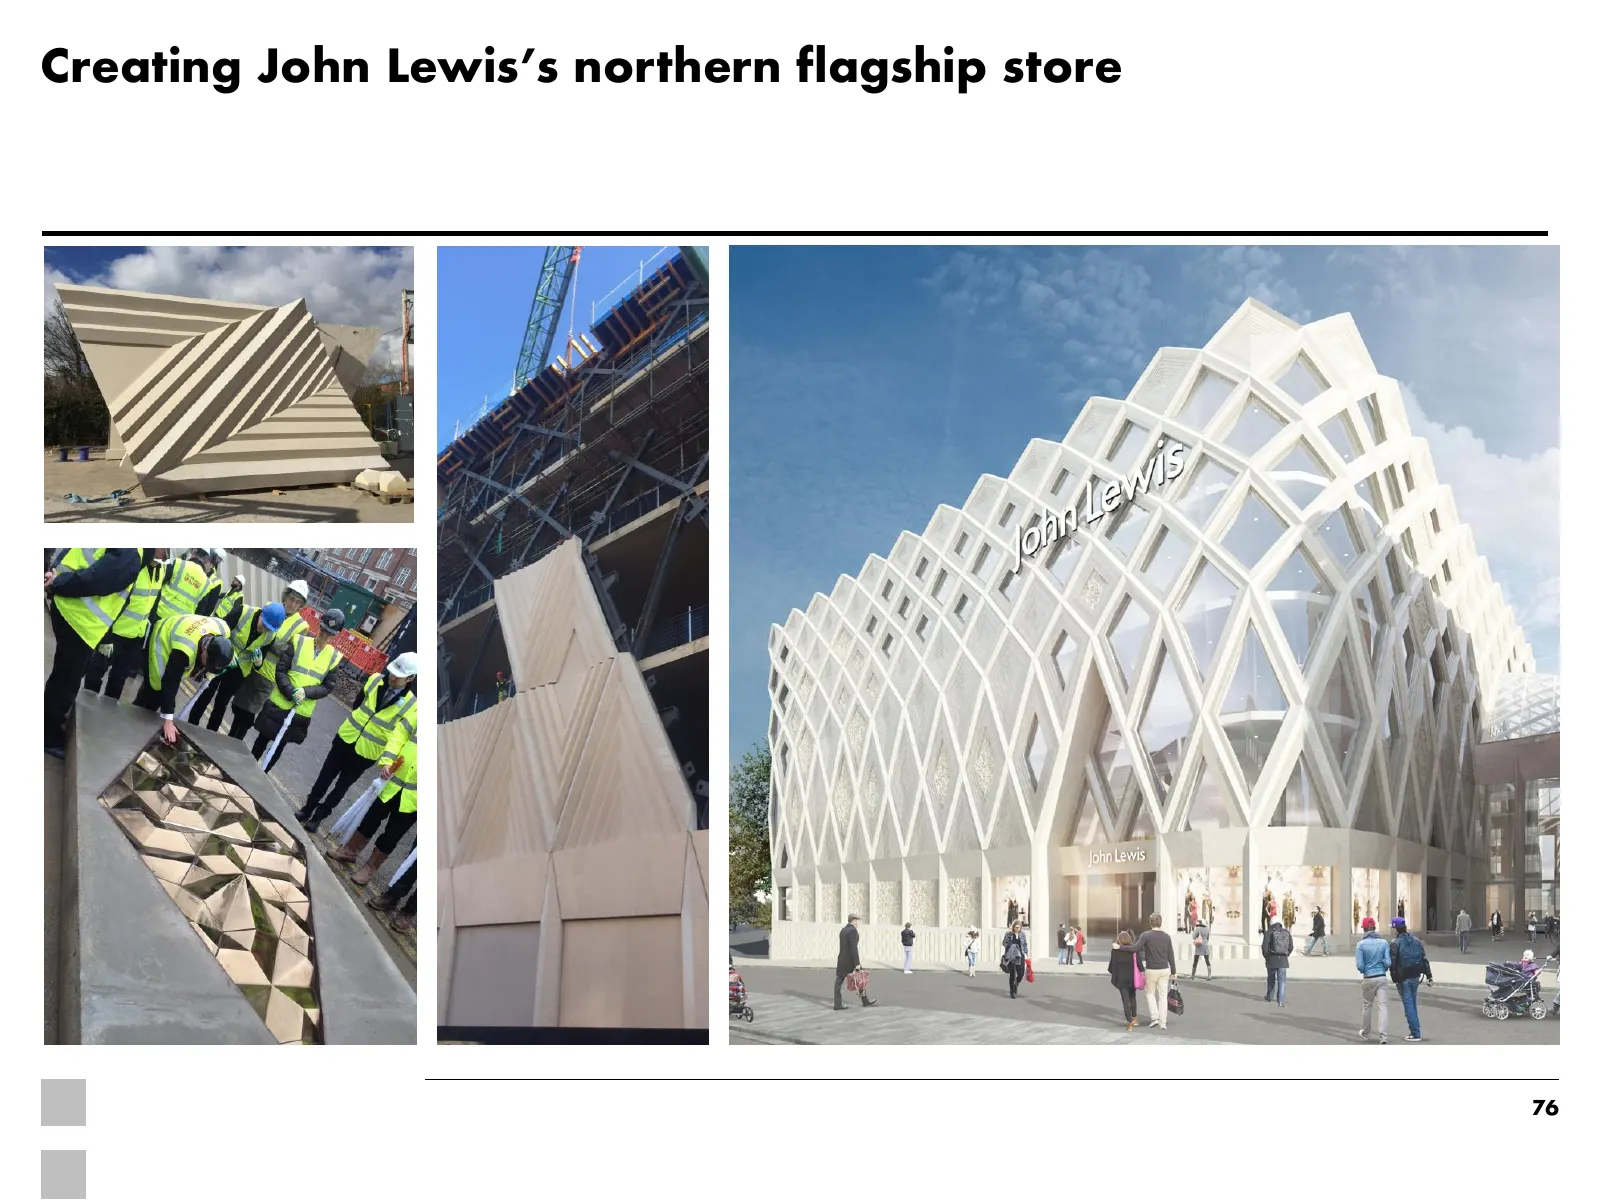
Slide 76: Creating John Lewis's northern flagship store
Creating John Lewis’s northern flagship store 76
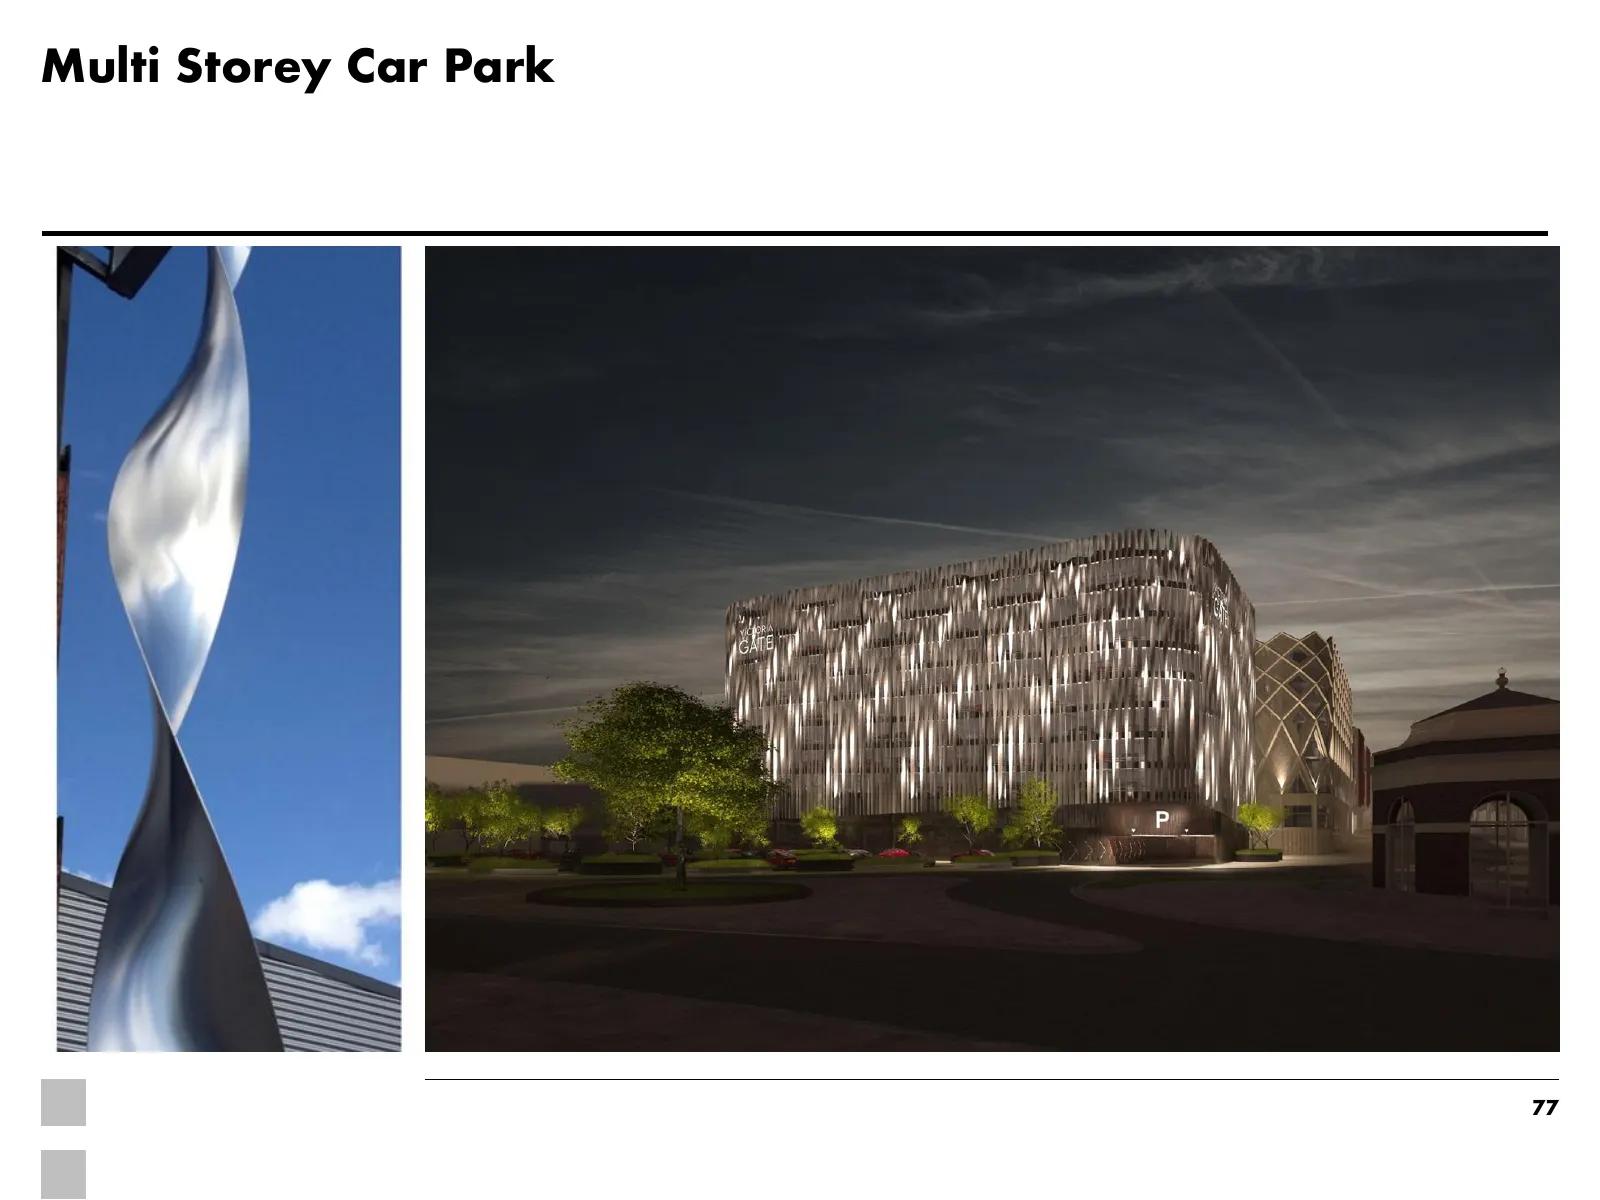
Slide 77: Multi Storey Car Park
Multi Storey Car Park TT A ty Wa i ih abt, ‘| ge Fw { i} 1 Pal it ai fit f if ii! Il ill itt a if" i \ "i Wn i il Mi WN \. ia Wt) (" ia Ni ae i
Slide 78: Victoria Gate financials
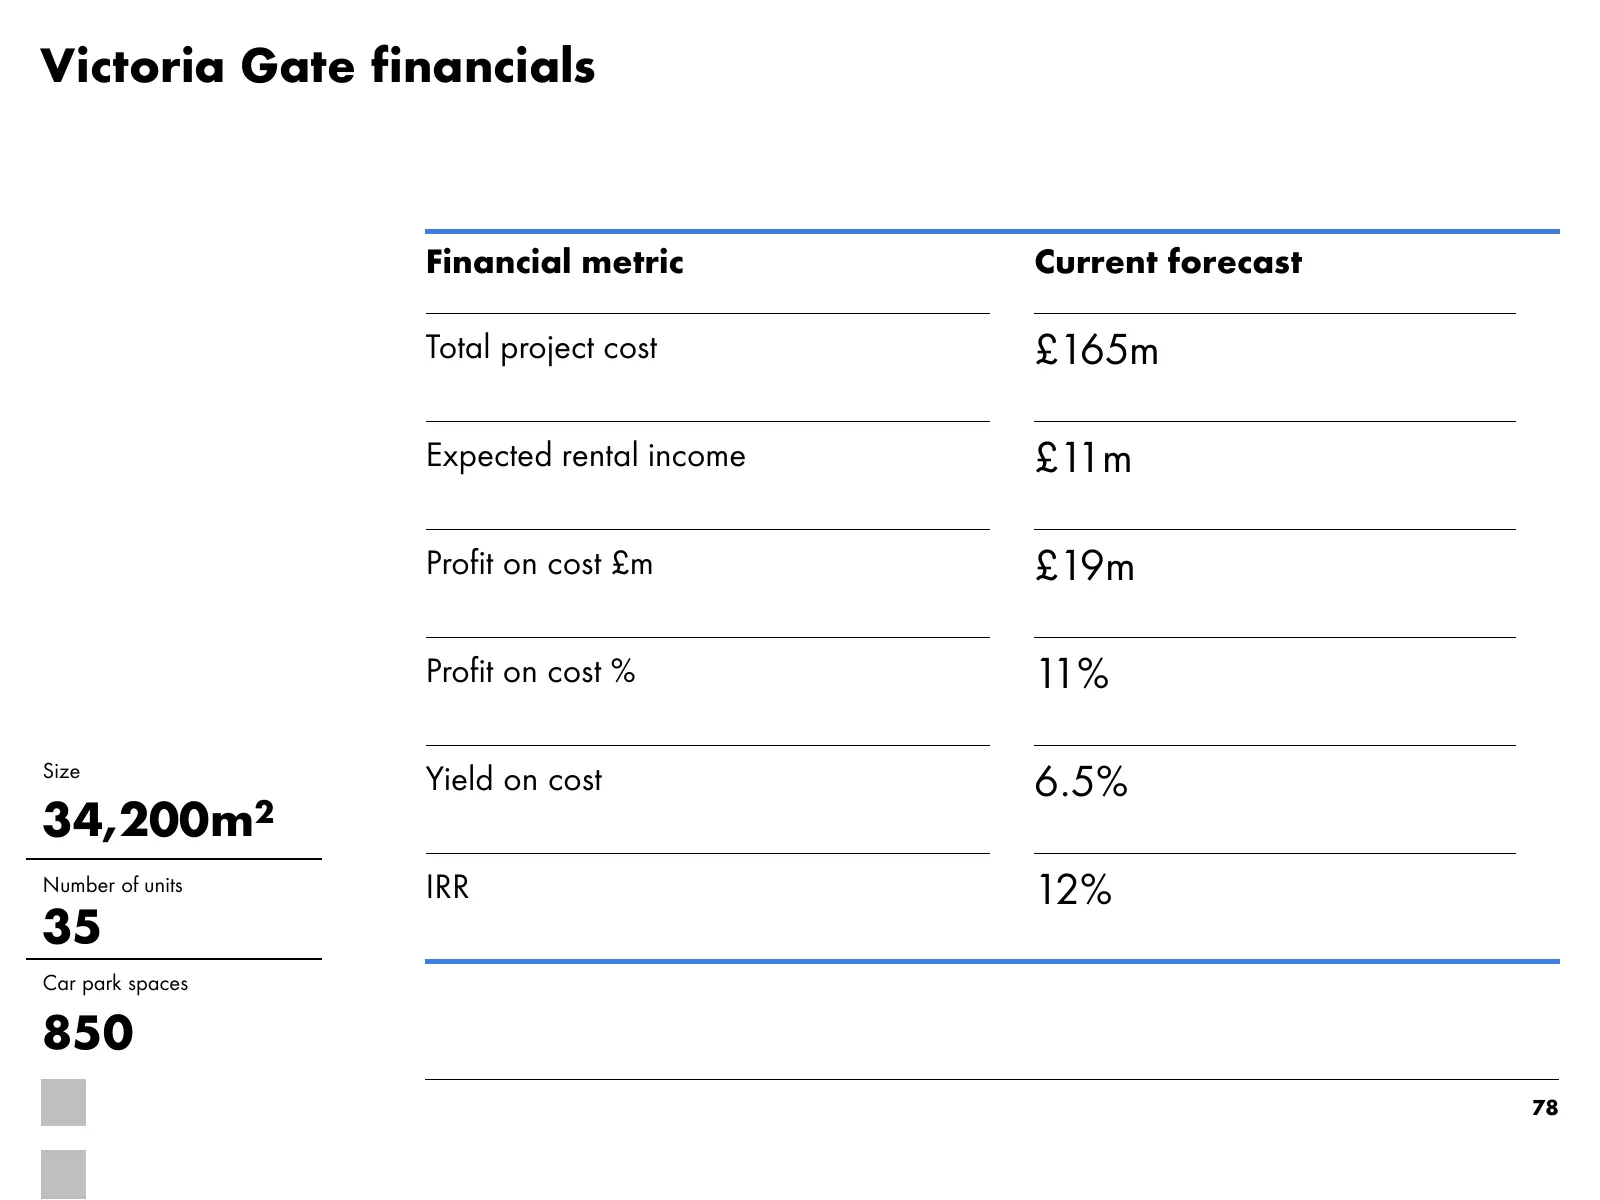
Victoria Gate financials Financial metric Current forecast Total project cost £165m Expected rental income £11m Profit on cost £m £19m Profit on cost % 11% Size Yield on cost 6.5% 34,200m2 Number of units IRR 12% 35 Car park spaces 850 78
Slide 79: On track with construction programme
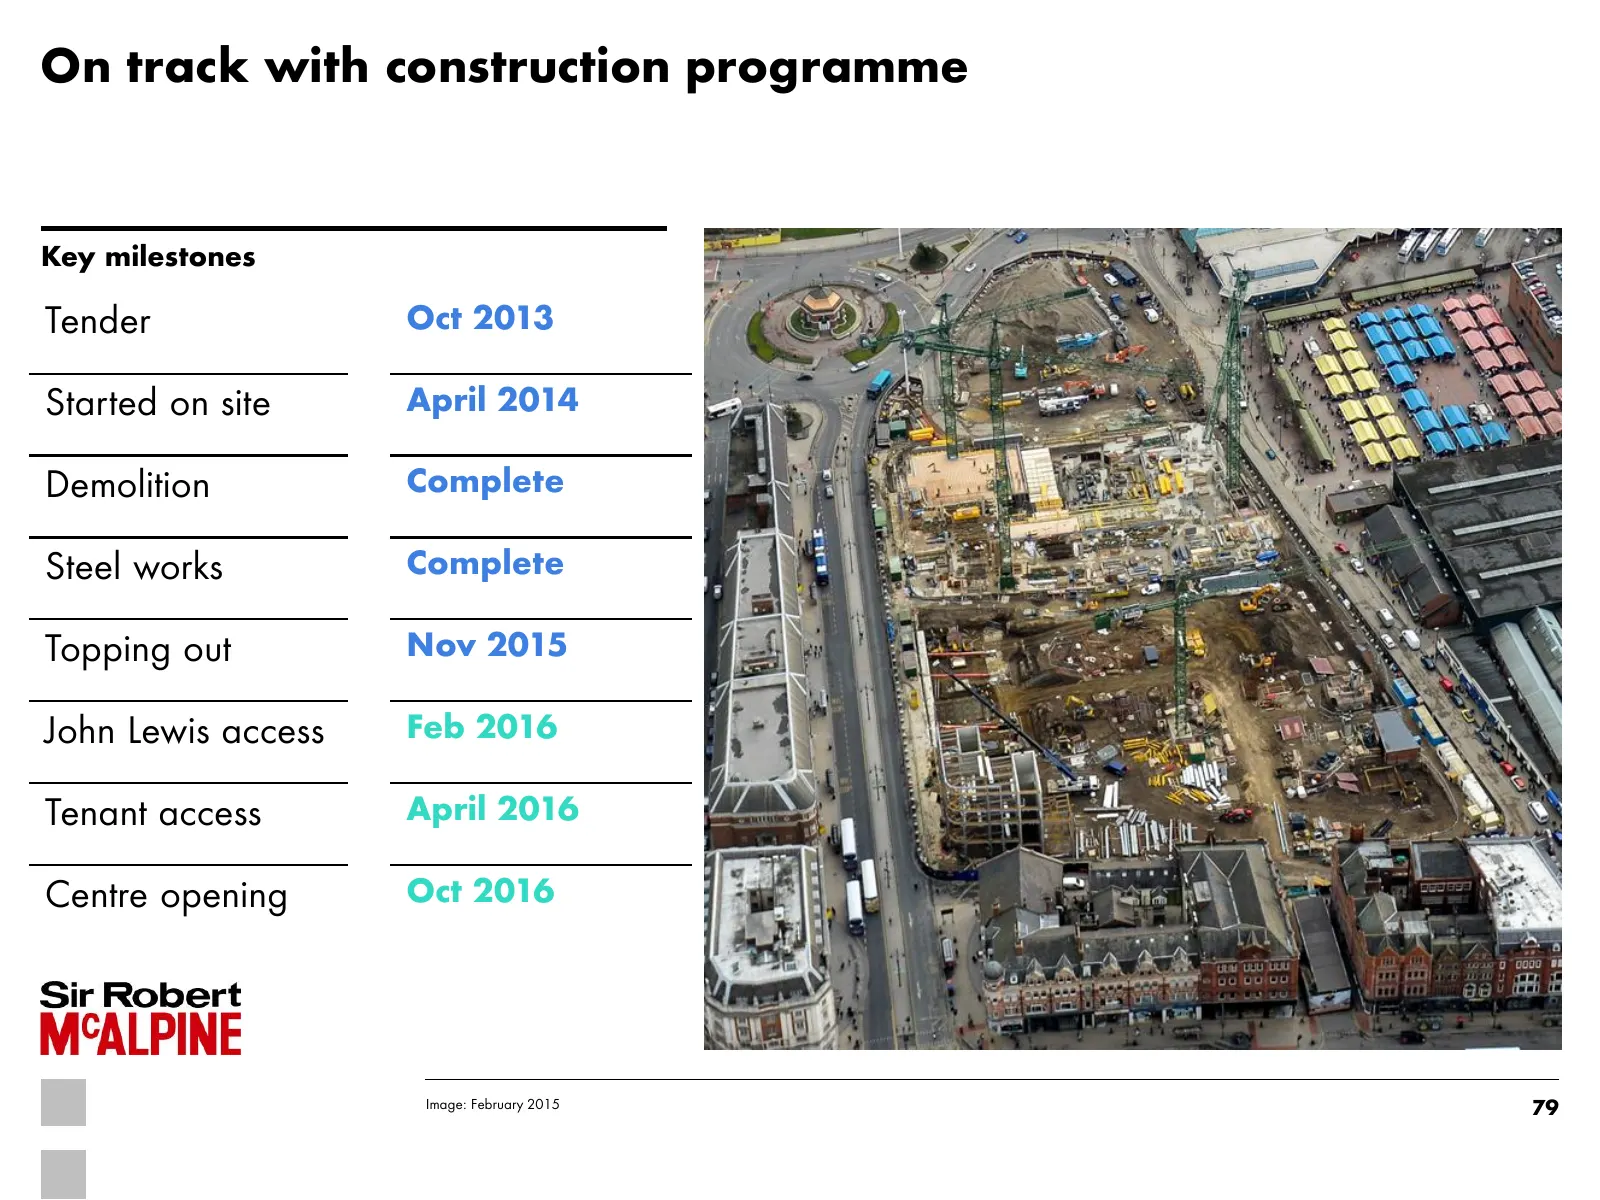
On track with construction programme Key milestones Tender Oct 2013 Started on site April 2014 Demolition Complete Steel works Complete Topping out Nov 2015 John Lewis access Feb 2016 Tenant access April 2016 Centre opening Oct 2016 Image: February 2015 79
Slide 80: Modern design management: BIM 3D modelling
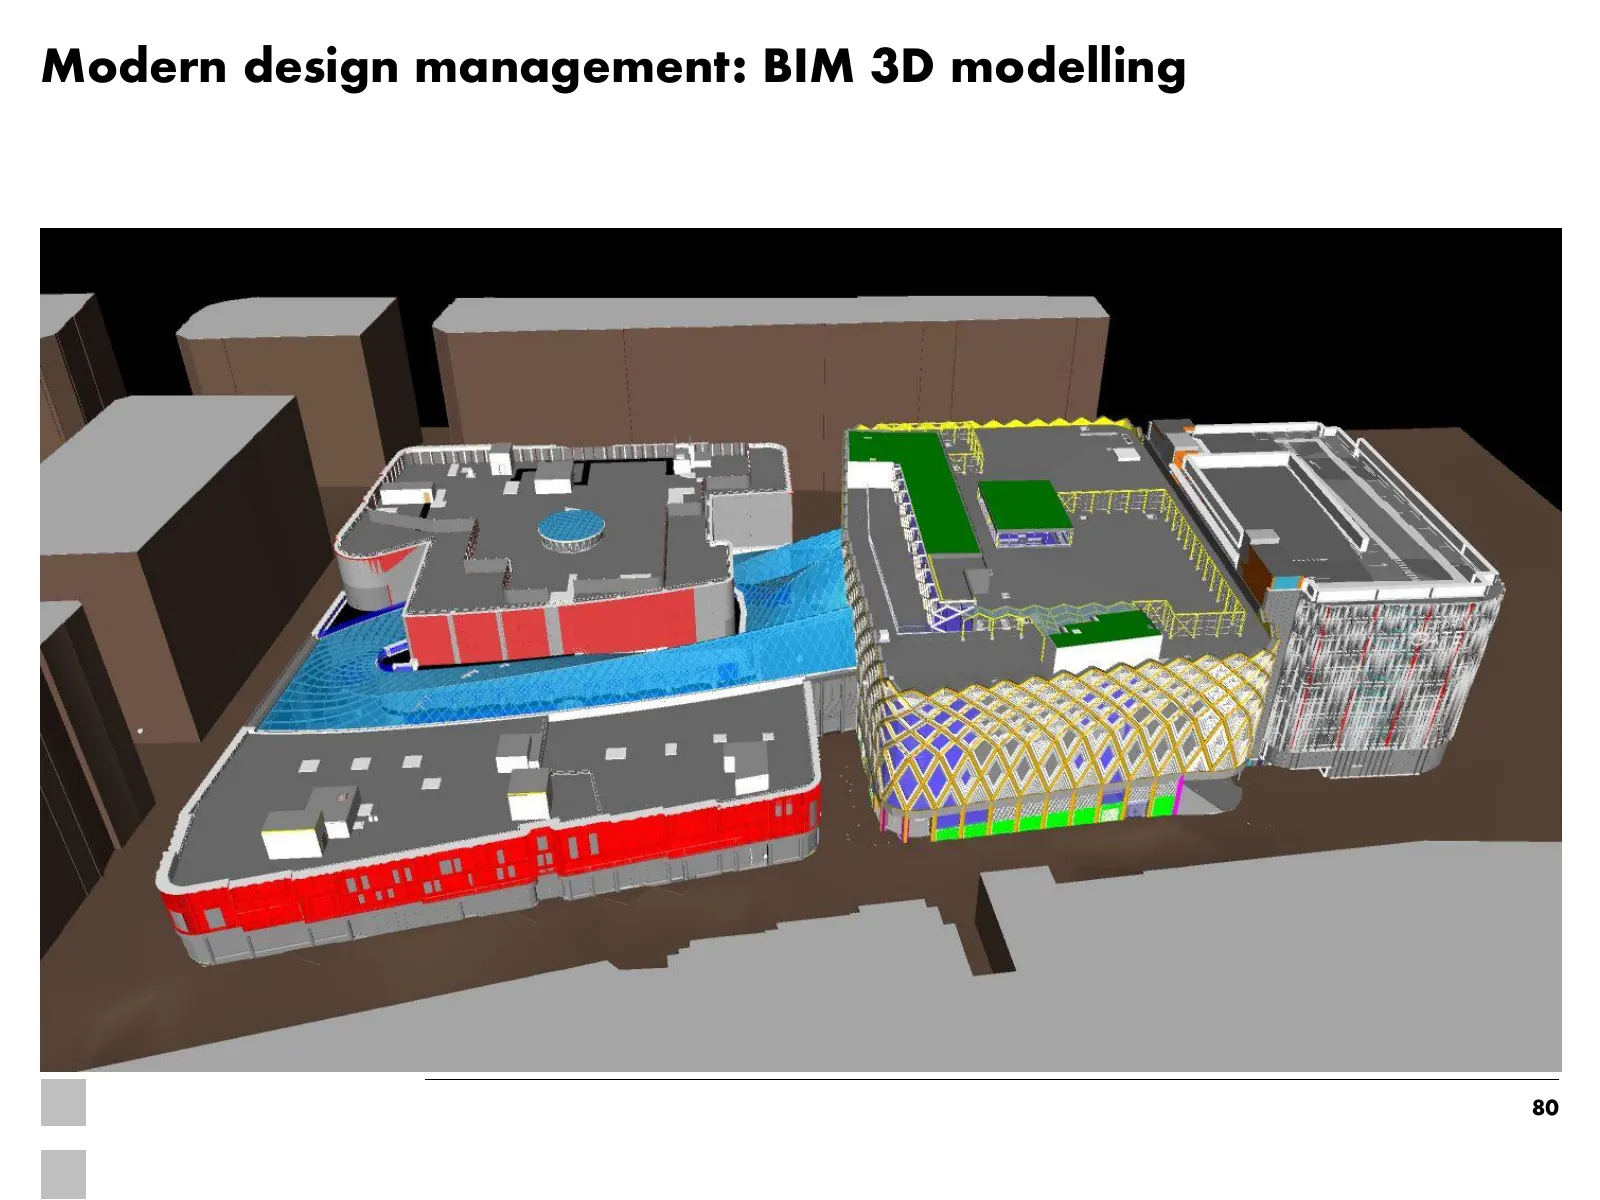
Modern design management: BIM 3D modelling 80
Slide 81: Progress on site: precast facades
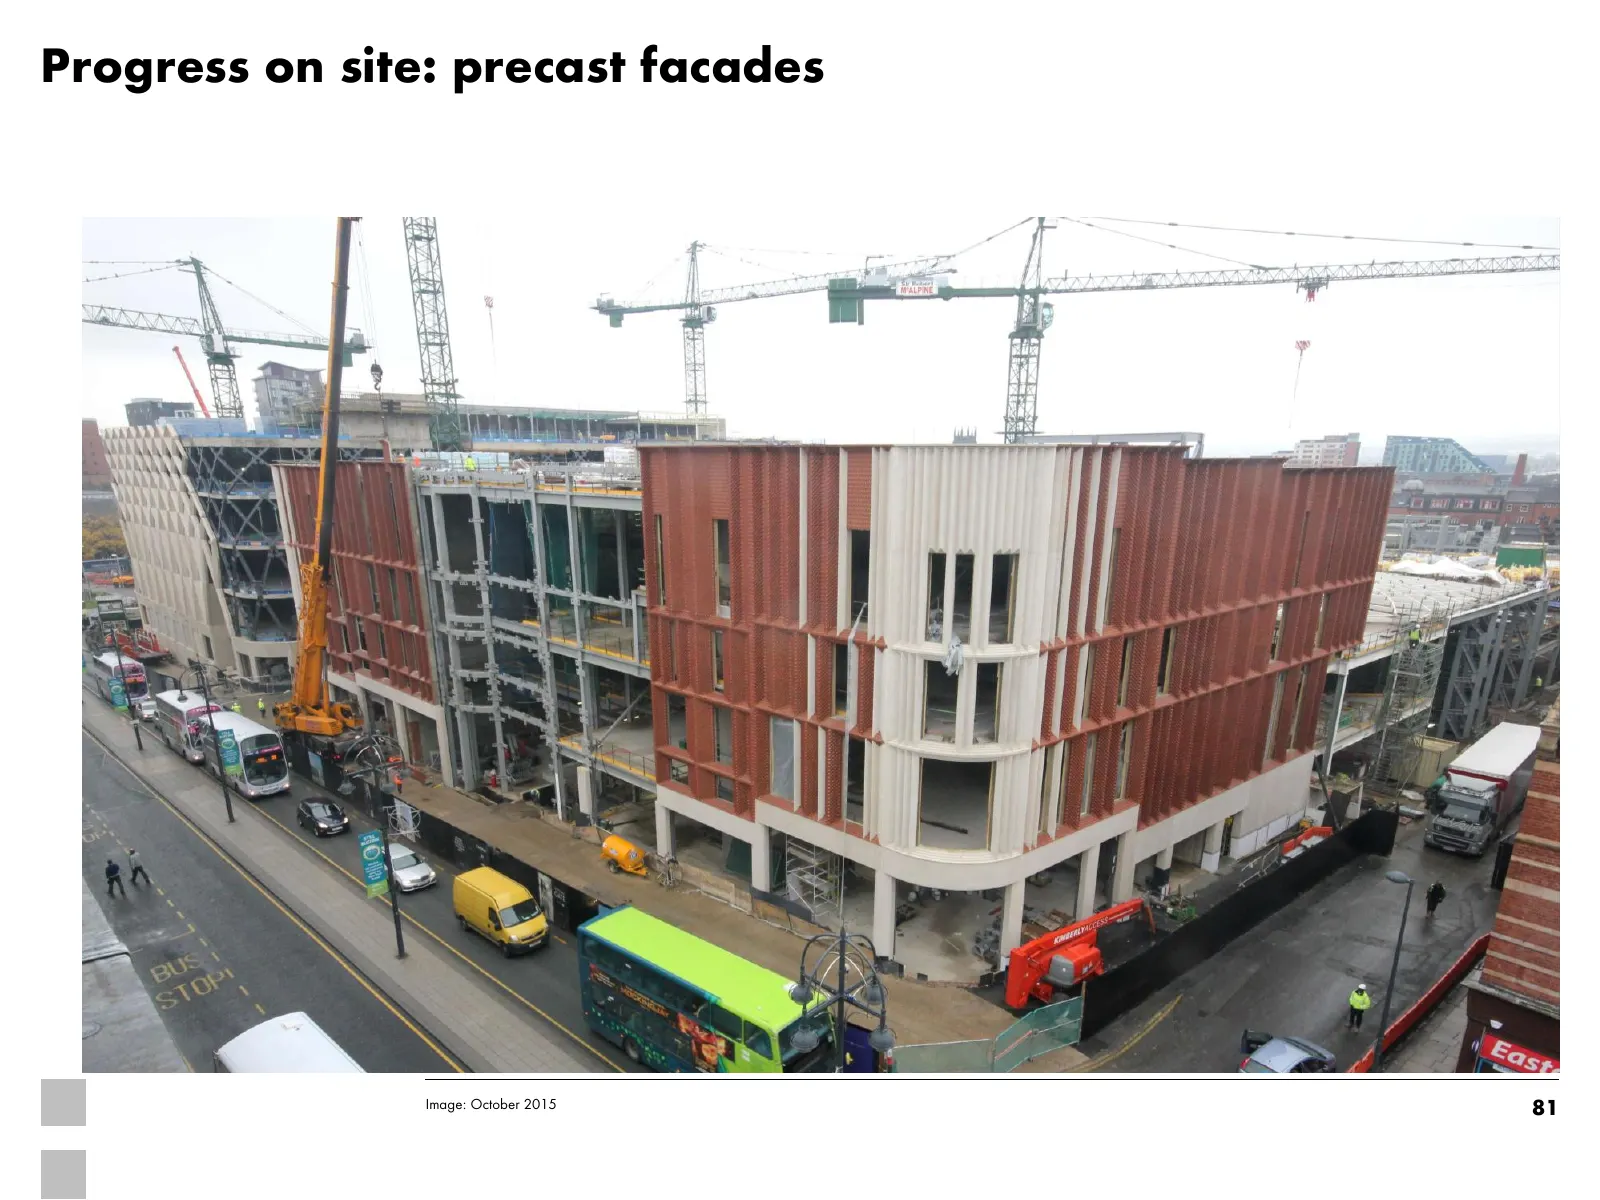
Progress on site: precast facades Image: October 2015 81
Slide 82: On track to achieve BREEAM 'Excellent'
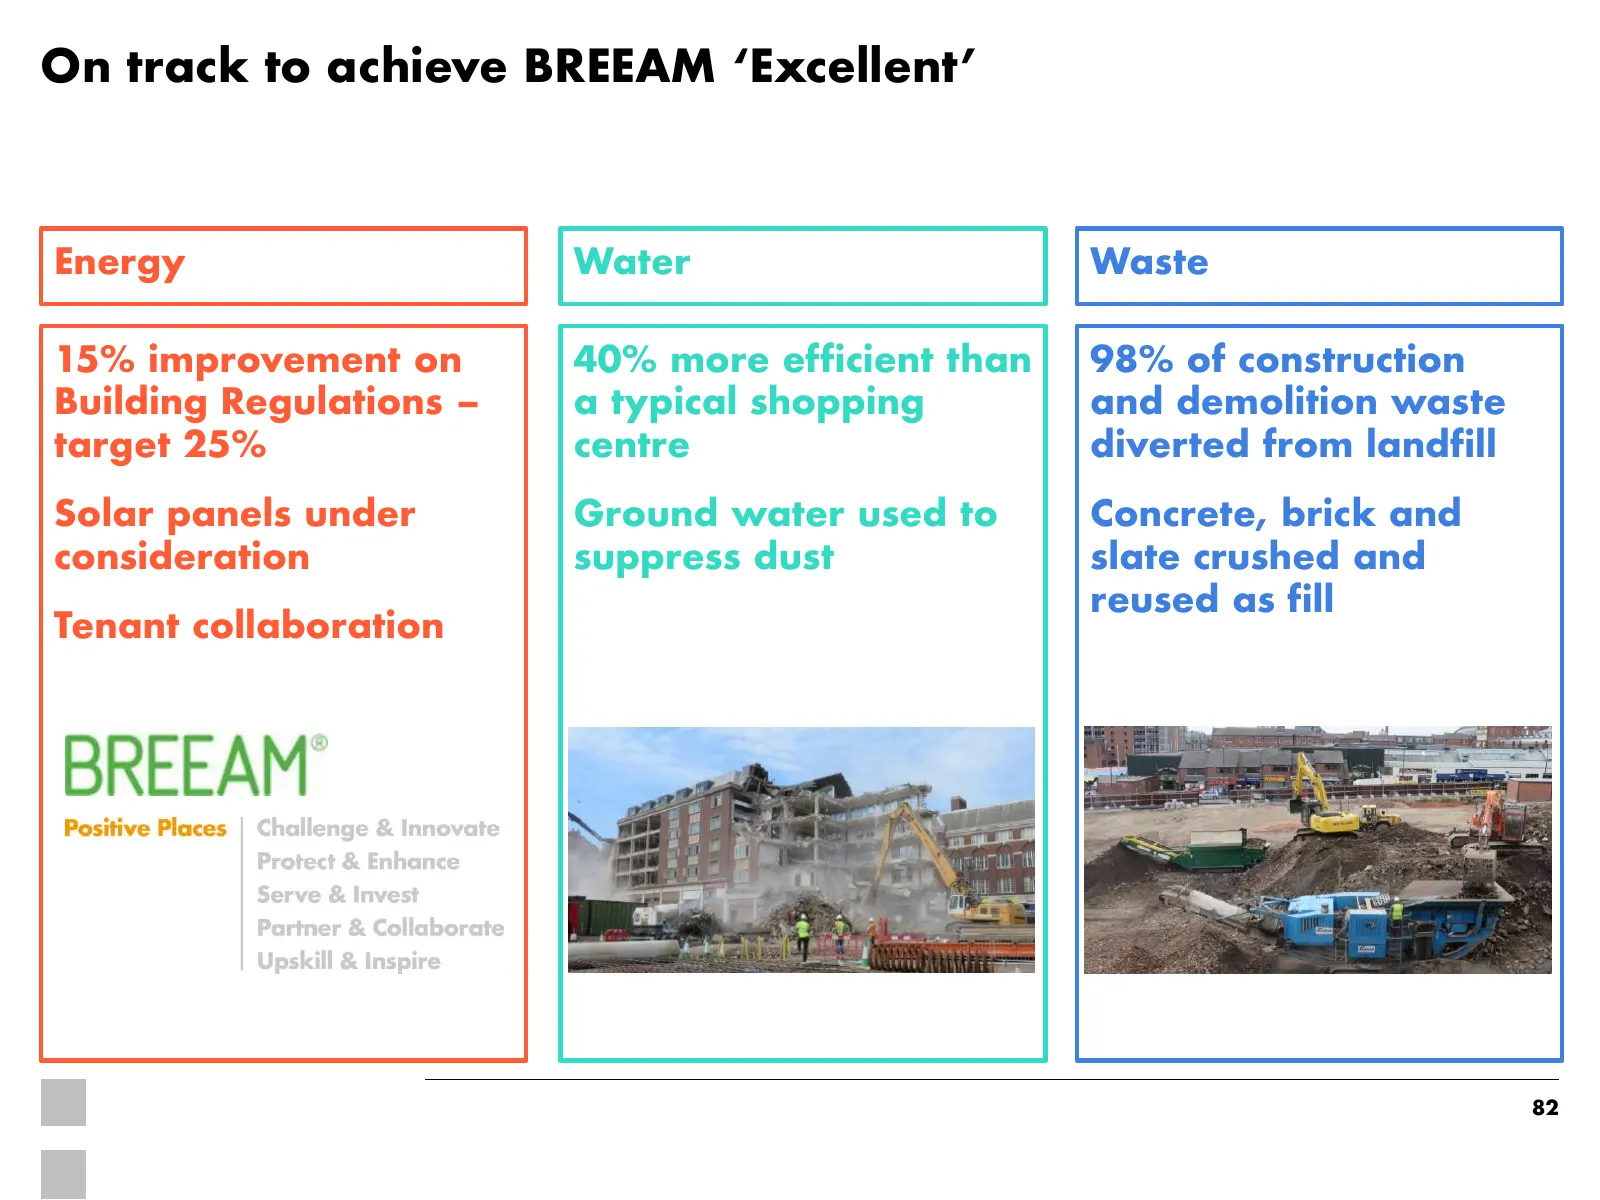
On track to achieve BREEAM ‘Excellent’ Energy Water Waste 15% improvement on 40% more efficient than 98% of construction Building Regulations – a typical shopping and demolition waste target 25% centre diverted from landfill Solar panels under Ground water used to Concrete, brick and consideration s
Slide 83: Tenant mix strategy influenced by Victoria Quarter
Tenant mix strategy influenced by Victoria Quarter Victoria leasing plan 83
Slide 84: Introducing new international and premium brands to Leeds
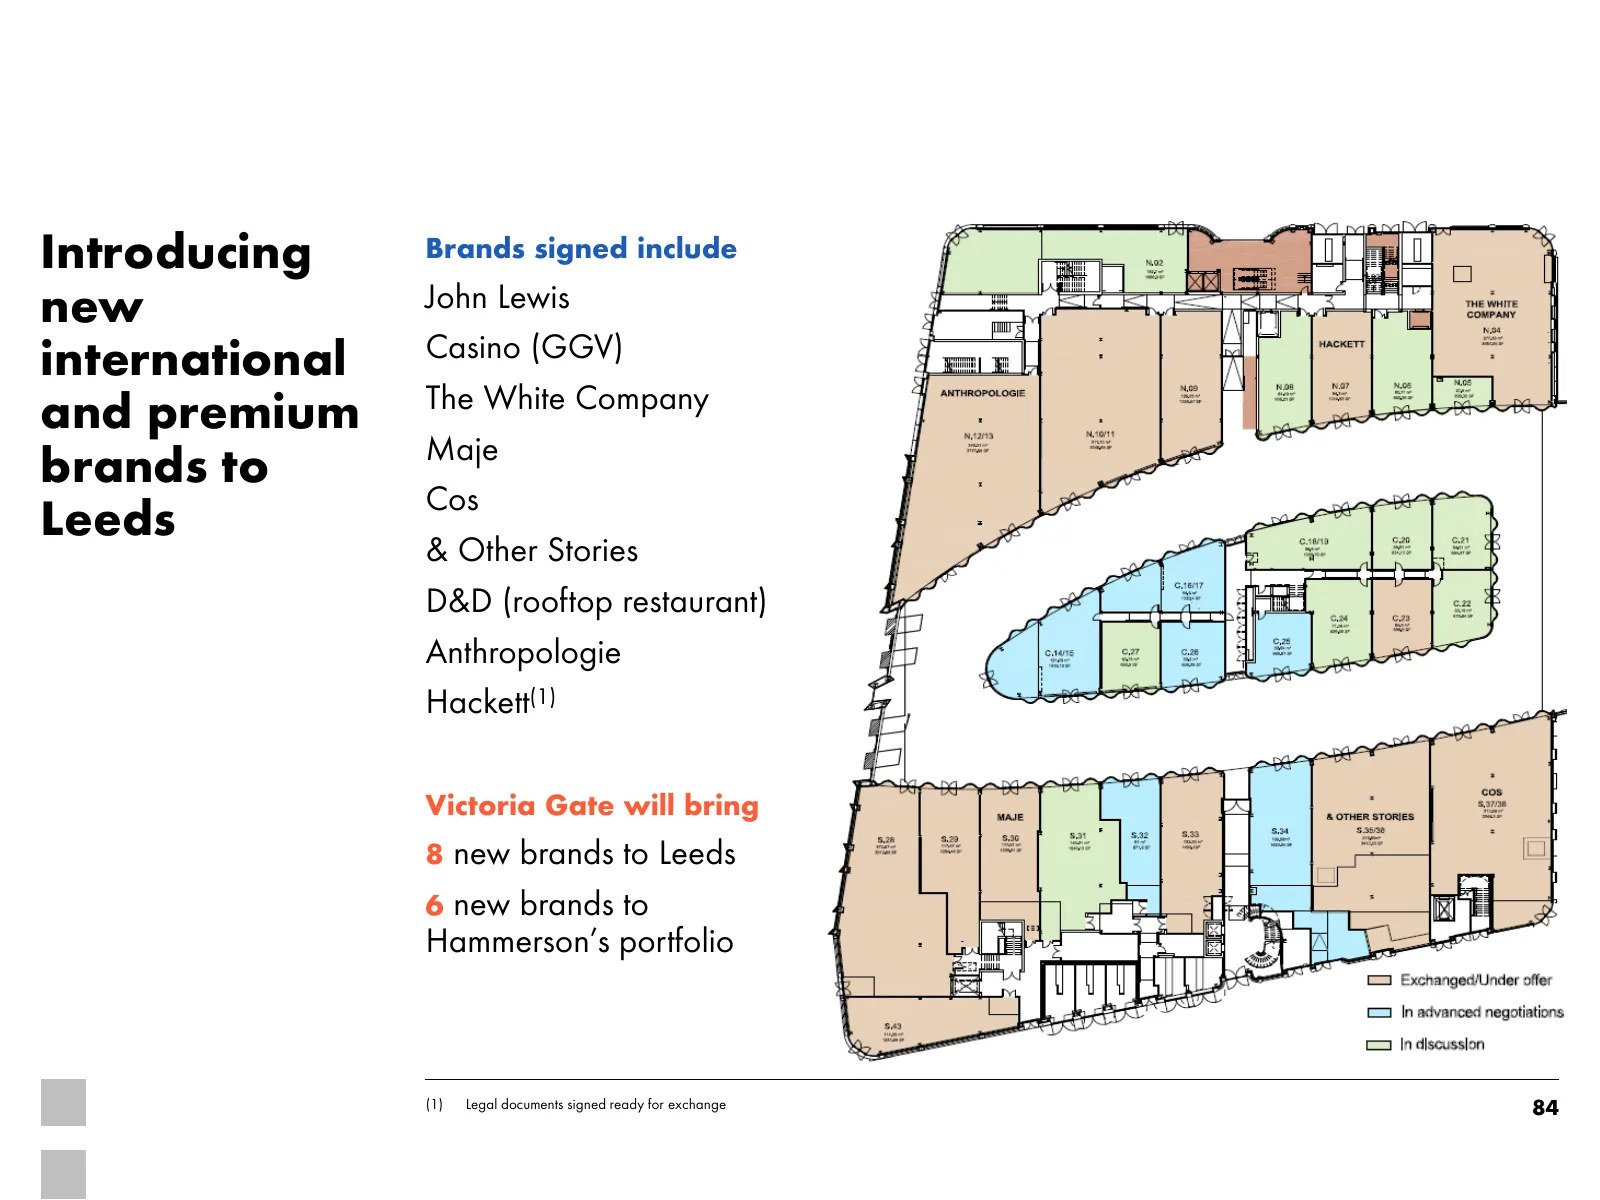
Introducing Brands signed include new John Lewis Casino (GGV) international The White Company and premium Maje brands to Cos Leeds & Other Stories D&D (rooftop restaurant) Anthropologie Hackett(1) Victoria Gate will bring 8 new brands to Leeds 6 new brands to Hammerson’s portfolio (1) Legal document
Slide 85: Encouraging leasing progress to date
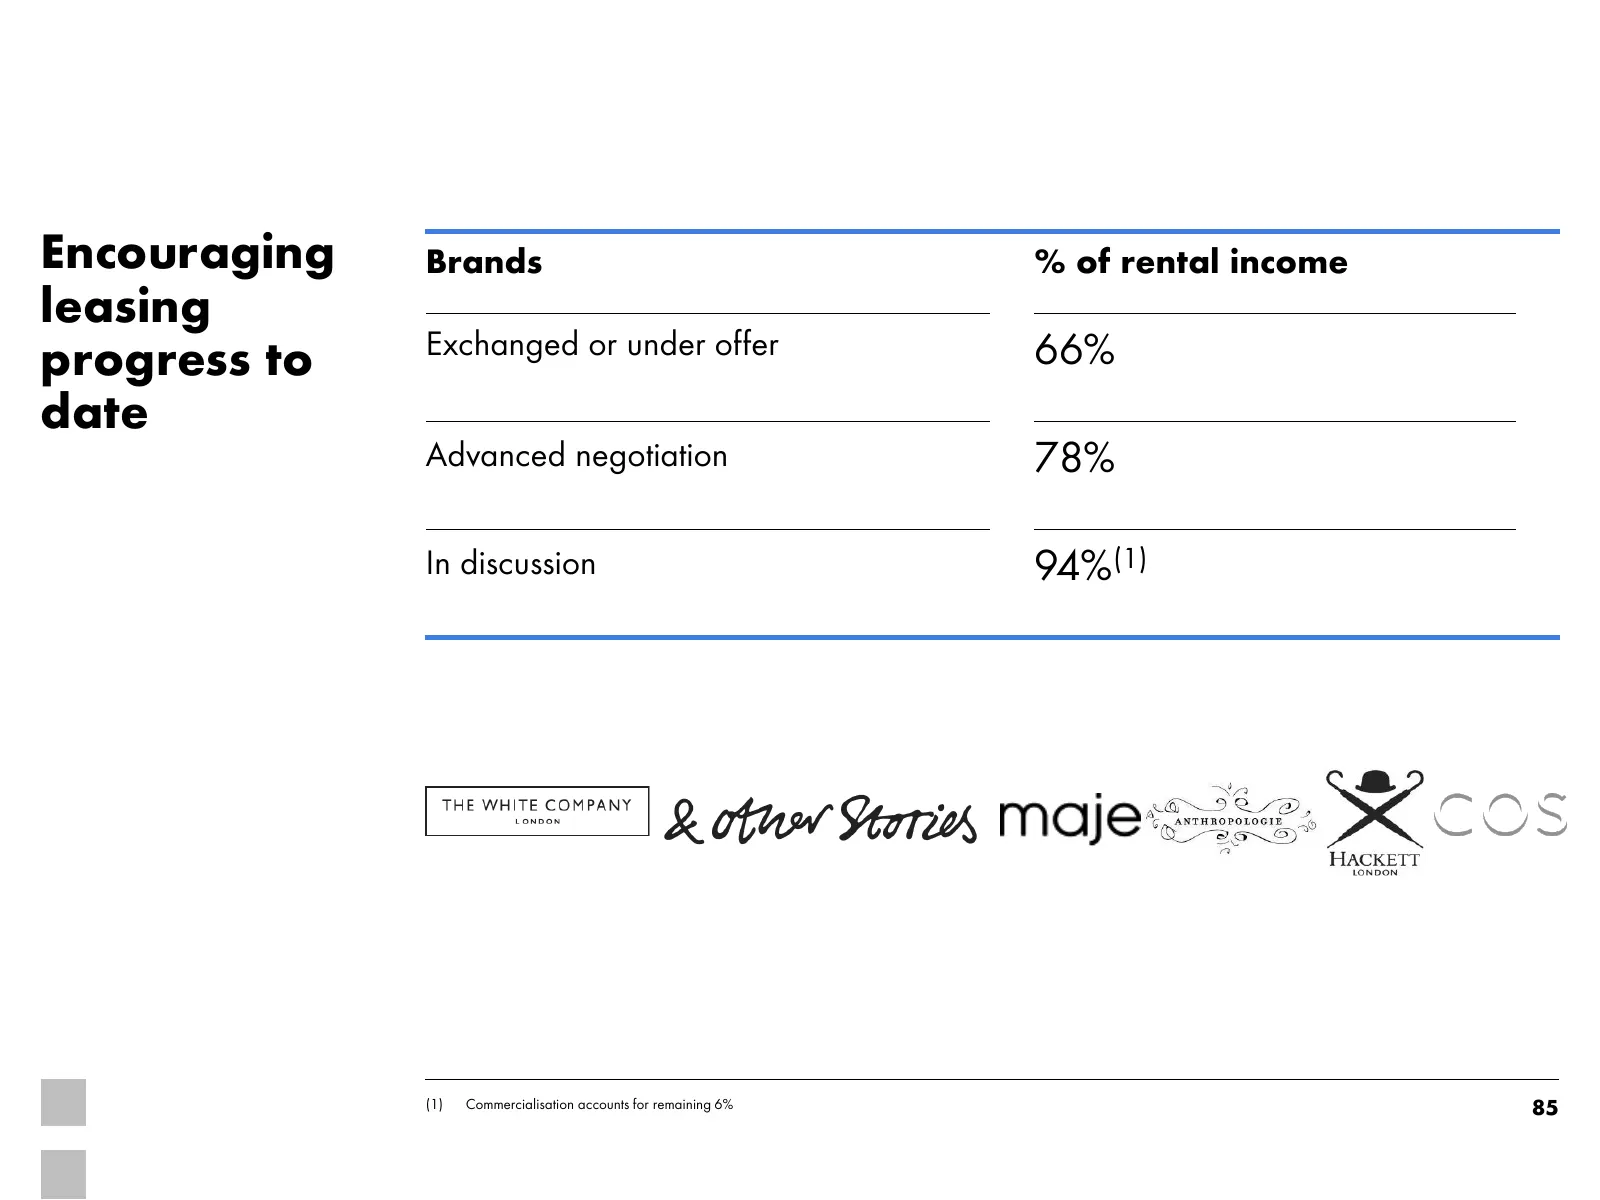
Encouraging Brands % of rental income leasing progress to Exchanged or under offer 66% date Advanced negotiation 78% In discussion 94%(1) (1) Commercialisation accounts for remaining 6% 85
Slide 86: A selection of target retailers
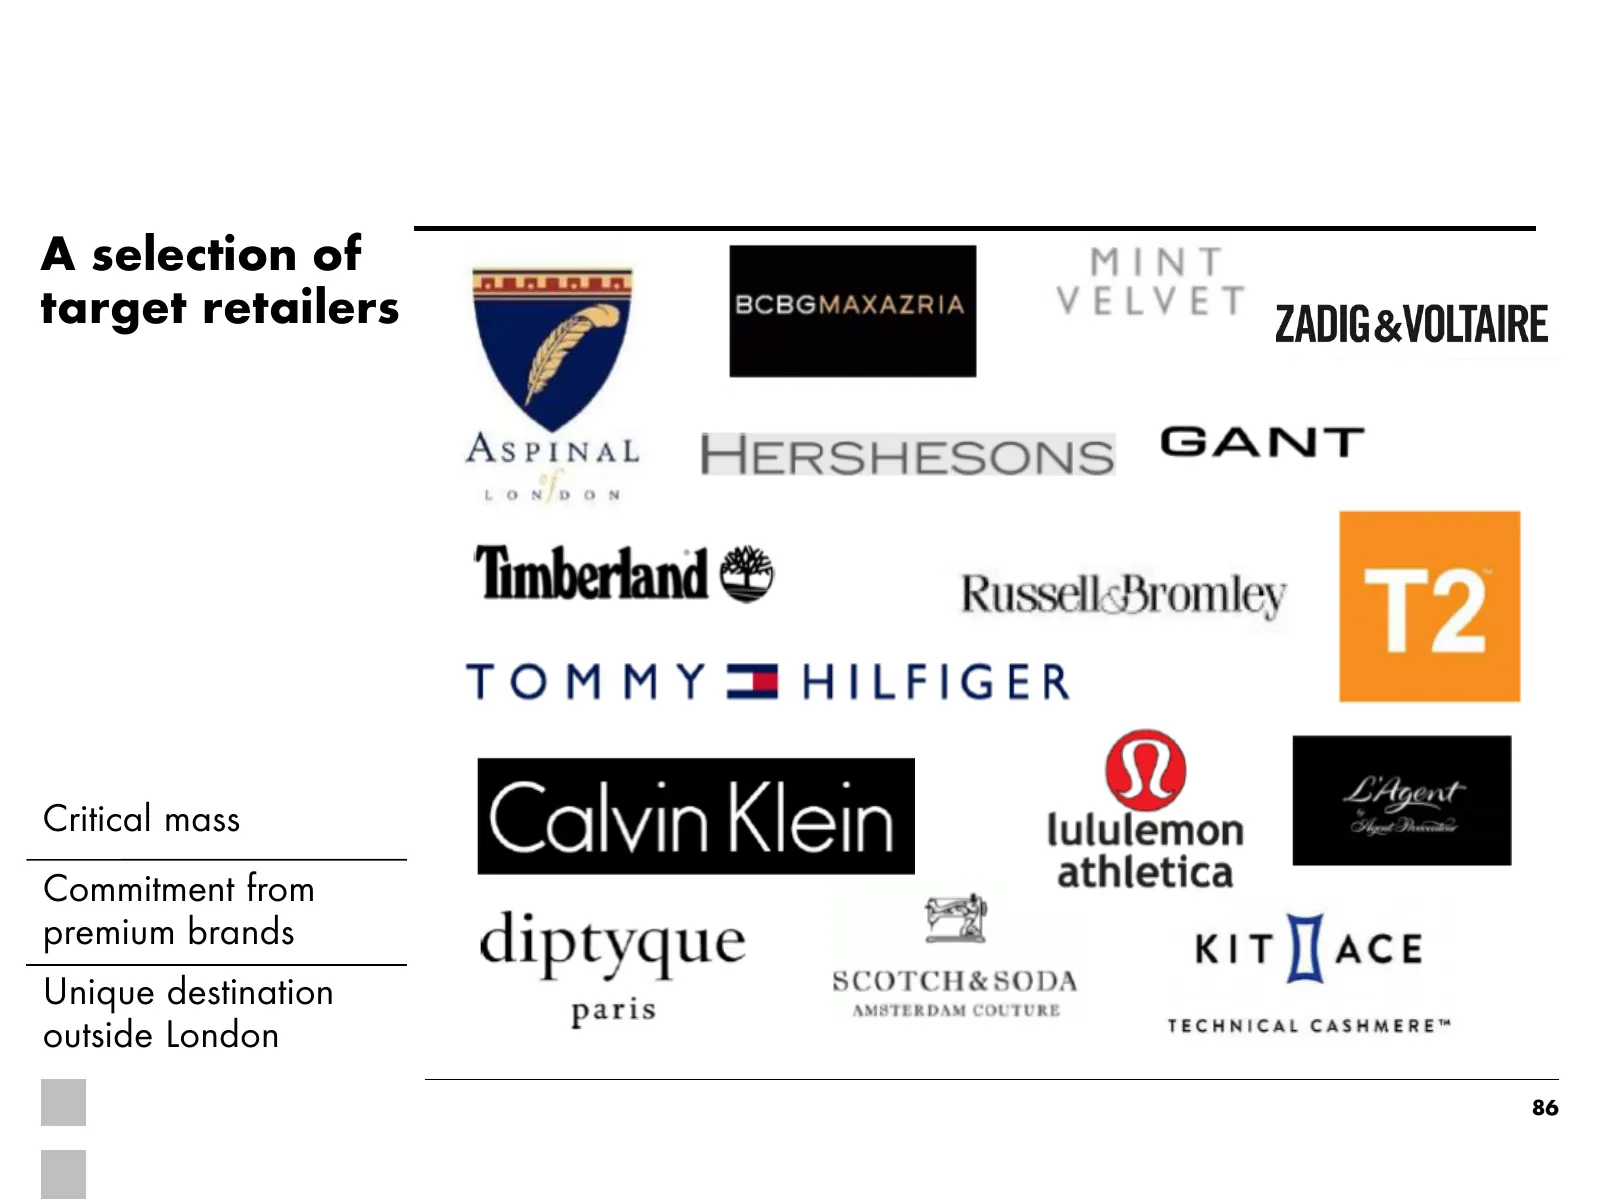
A selection of target retailers Critical mass Commitment from premium brands Unique destination outside London 86
Slide 87: Target restaurant operators
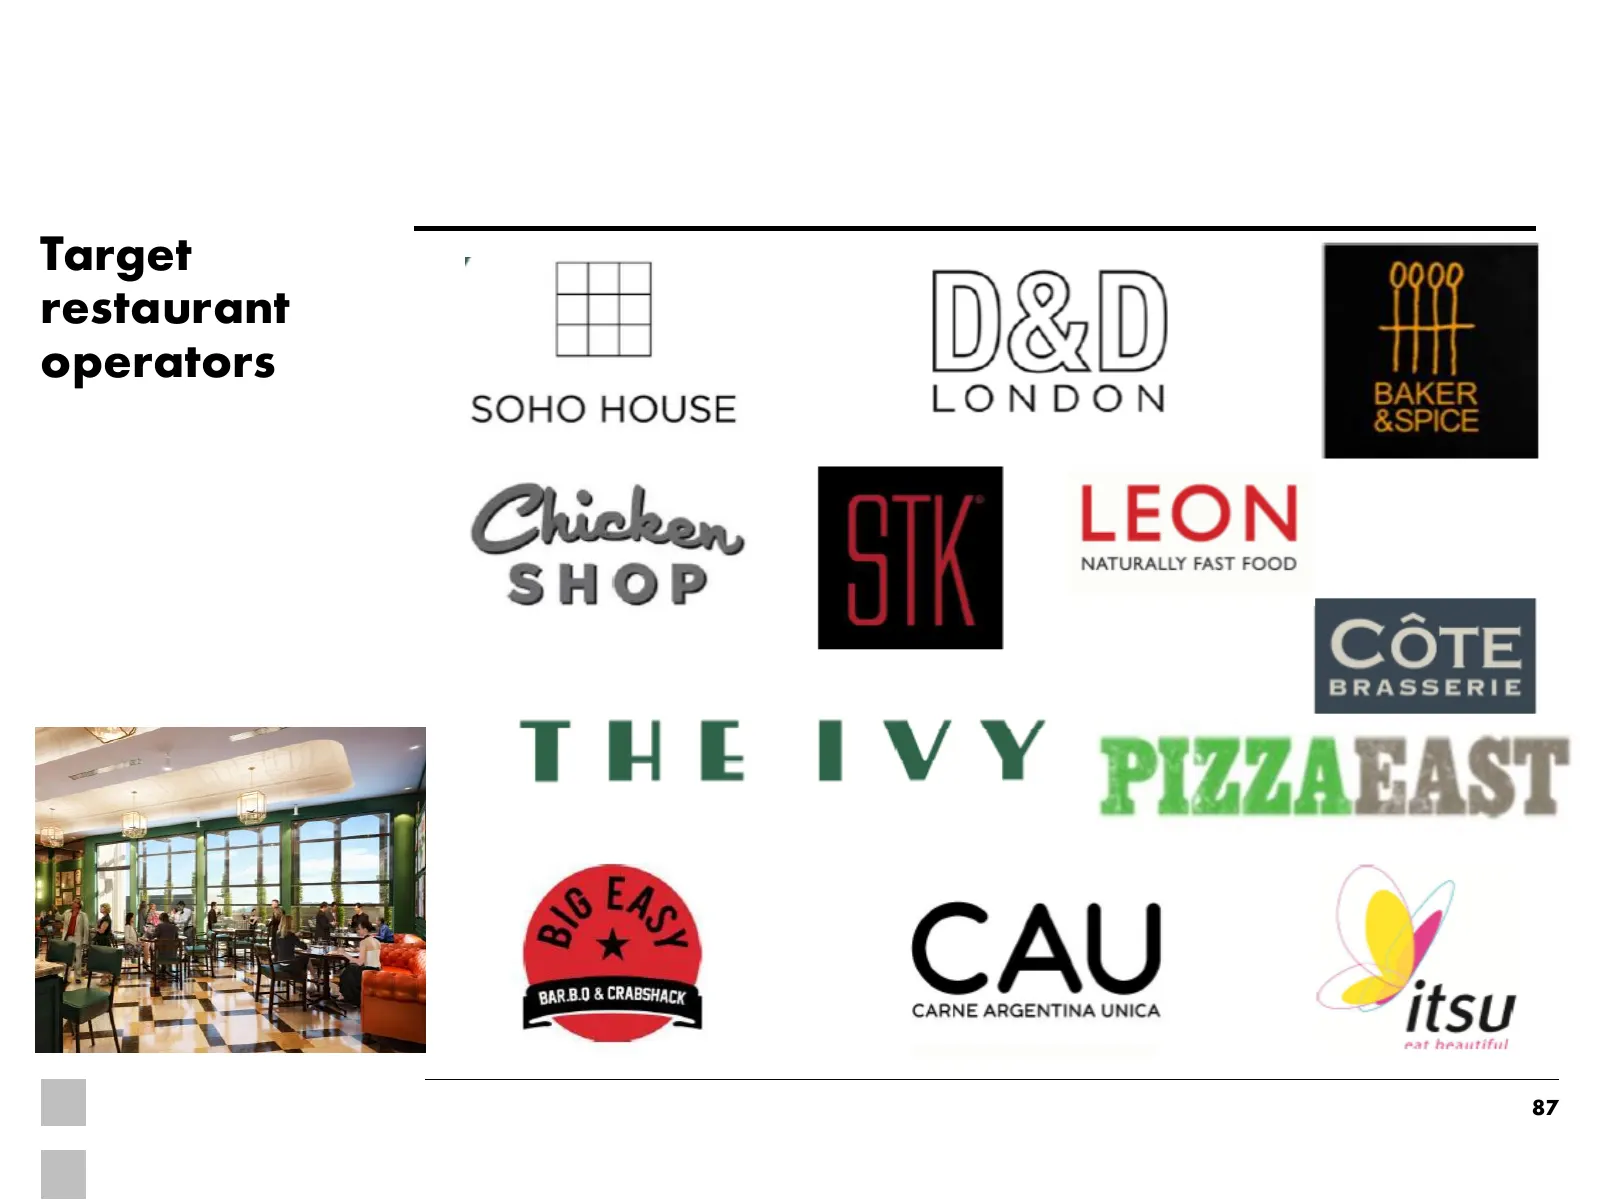
Target restaurant operators 87
Slide 88: Integration of Victoria Estate
Integration of Victoria Estate Re-branding: Victoria Public realm Interior design Customer service Digital Way finding 88
Slide 89: Victoria Gate: phase two
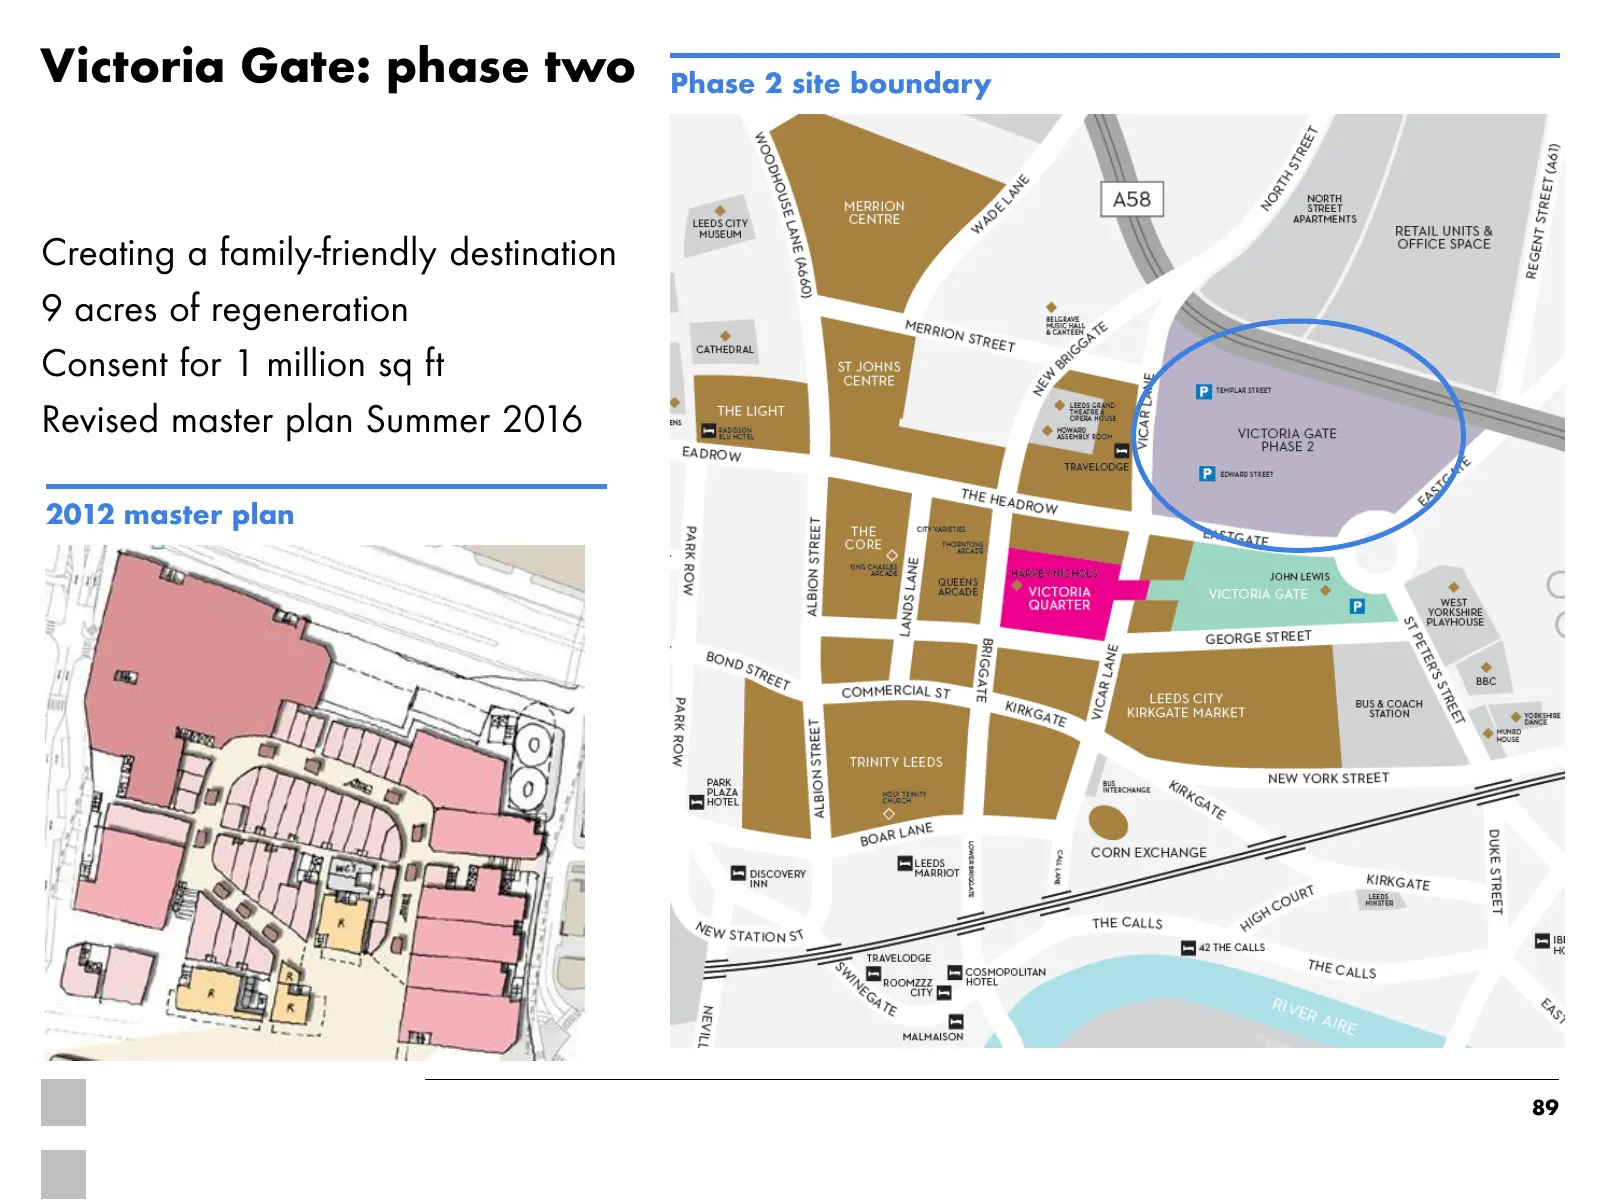
Victoria Gate: phase two Phase 2 site boundary Creating a family-friendly destination 9 acres of regeneration Consent for 1 million sq ft Revised master plan Summer 2016 2012 master plan 89
Slide 90: Victoria: a home for superbrands
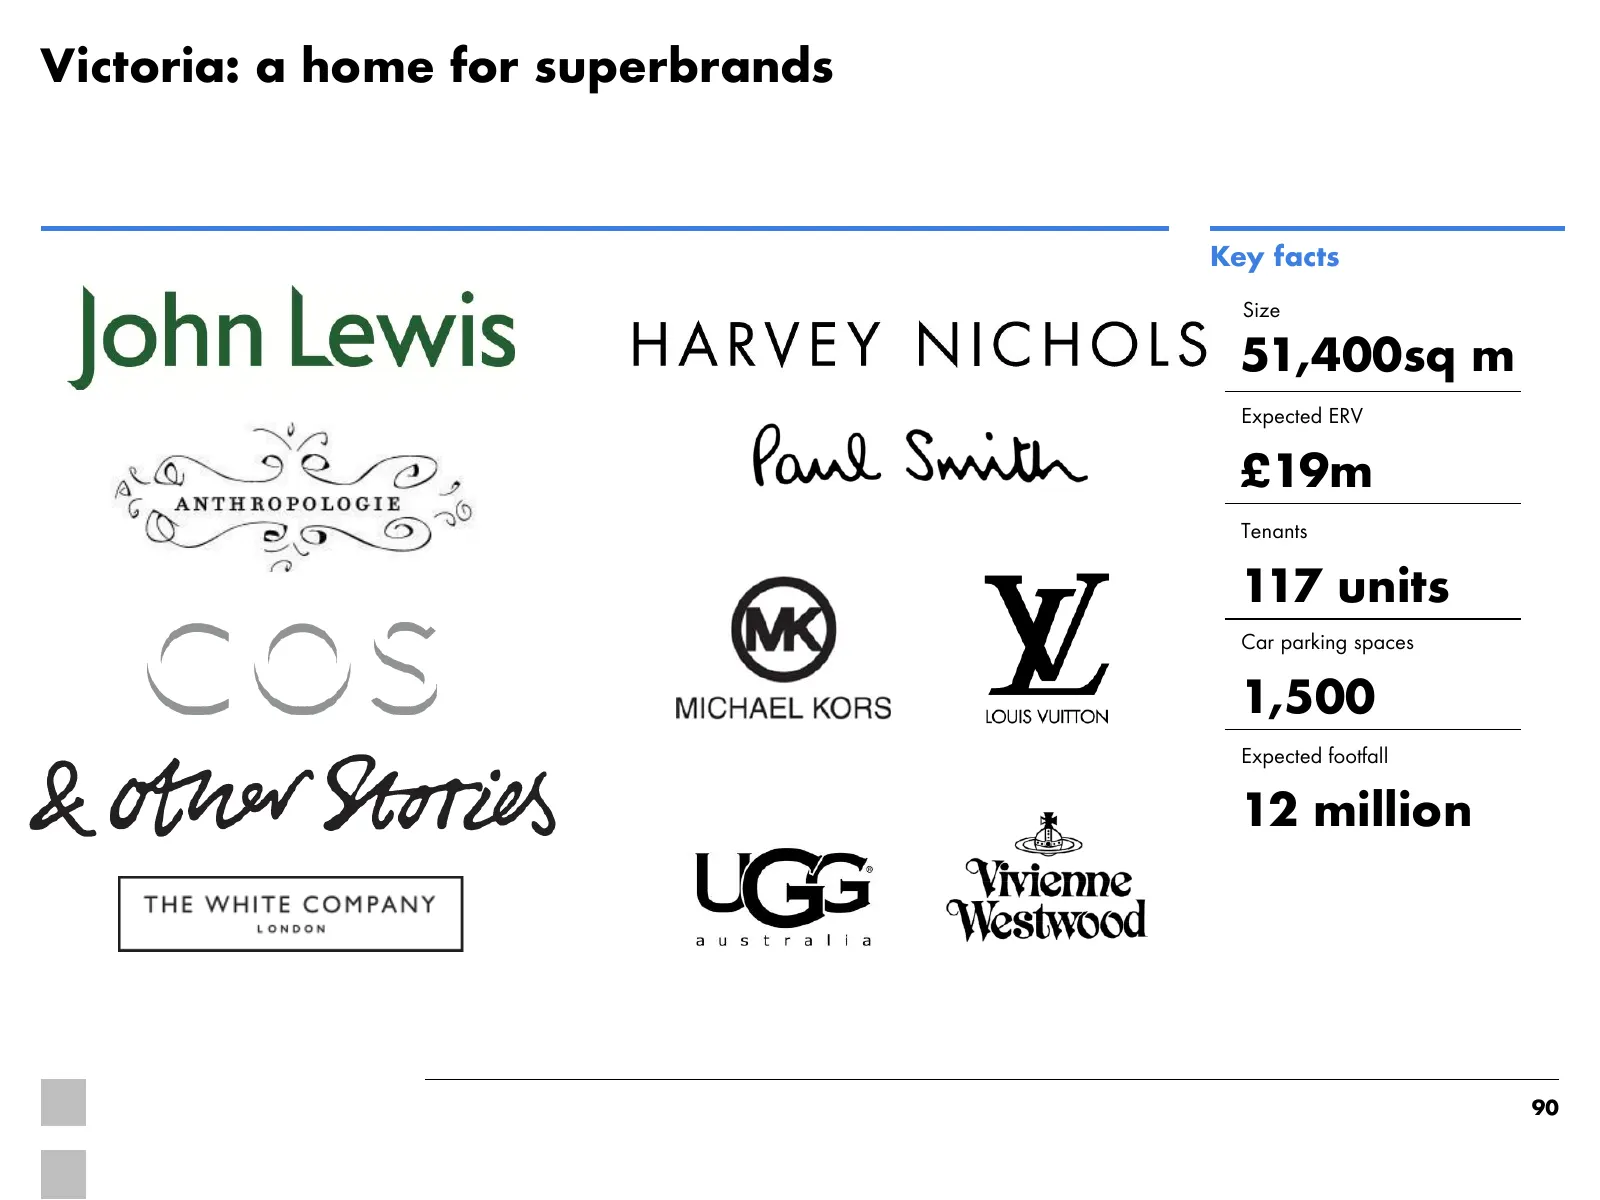
Victoria: a home for superbrands Key facts Size 51,400sq m Expected ERV £19m Tenants 117 units Car parking spaces 1,500 Expected footfall 12 million 90

Slide 91: Victoria Gate timelapse
Victoria Gate timelapse 91

Slide 92: Questions
Questions

Slide 93: Appendix
Appendix 93
Slide 94: Our retail parks portfolio is focused on selective market sub-segments
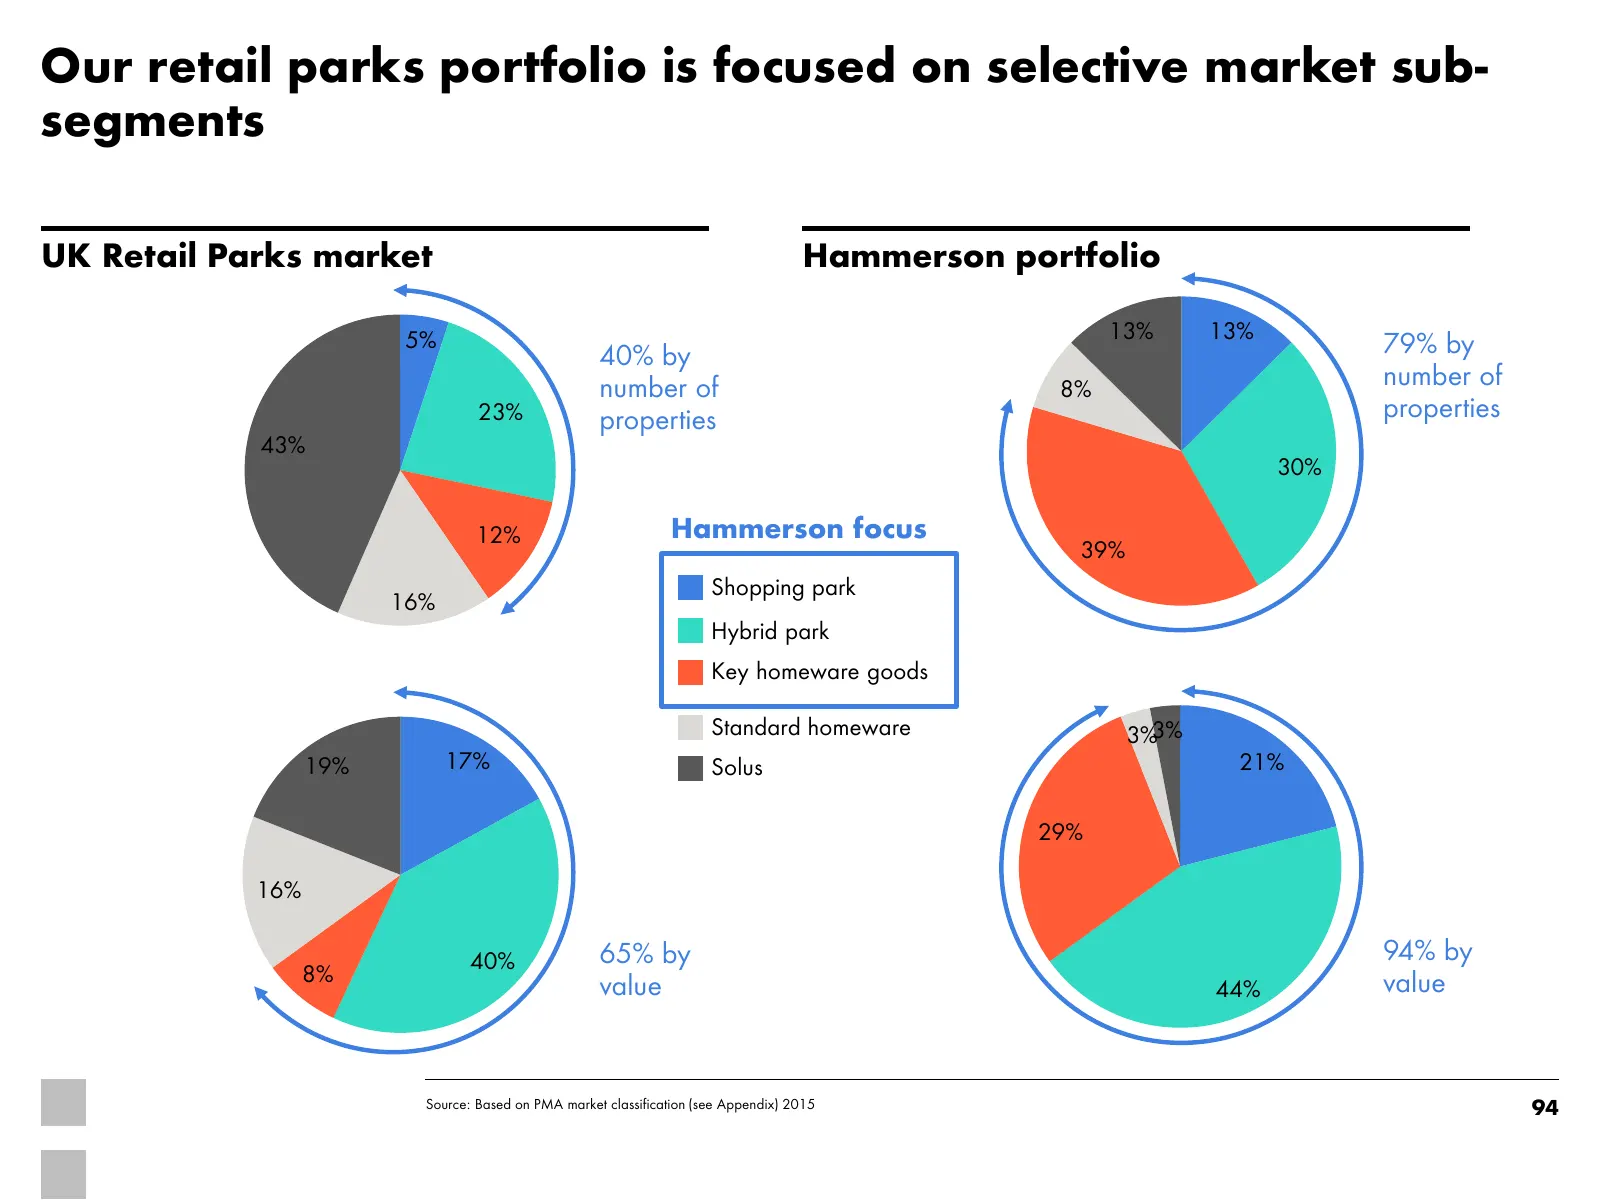
Our retail parks portfolio is focused on selective market sub- segments UK Retail Parks market Hammerson portfolio 5% 13% 13% 40% by 79% by number of 8% number of 23% properties properties 43% 30% 12% Hammerson focus 39% Shopping park 16% Hybrid park Key homeware goods Standard homeware 3%3% 19% 17%
Slide 95: The retail parks market is segmented
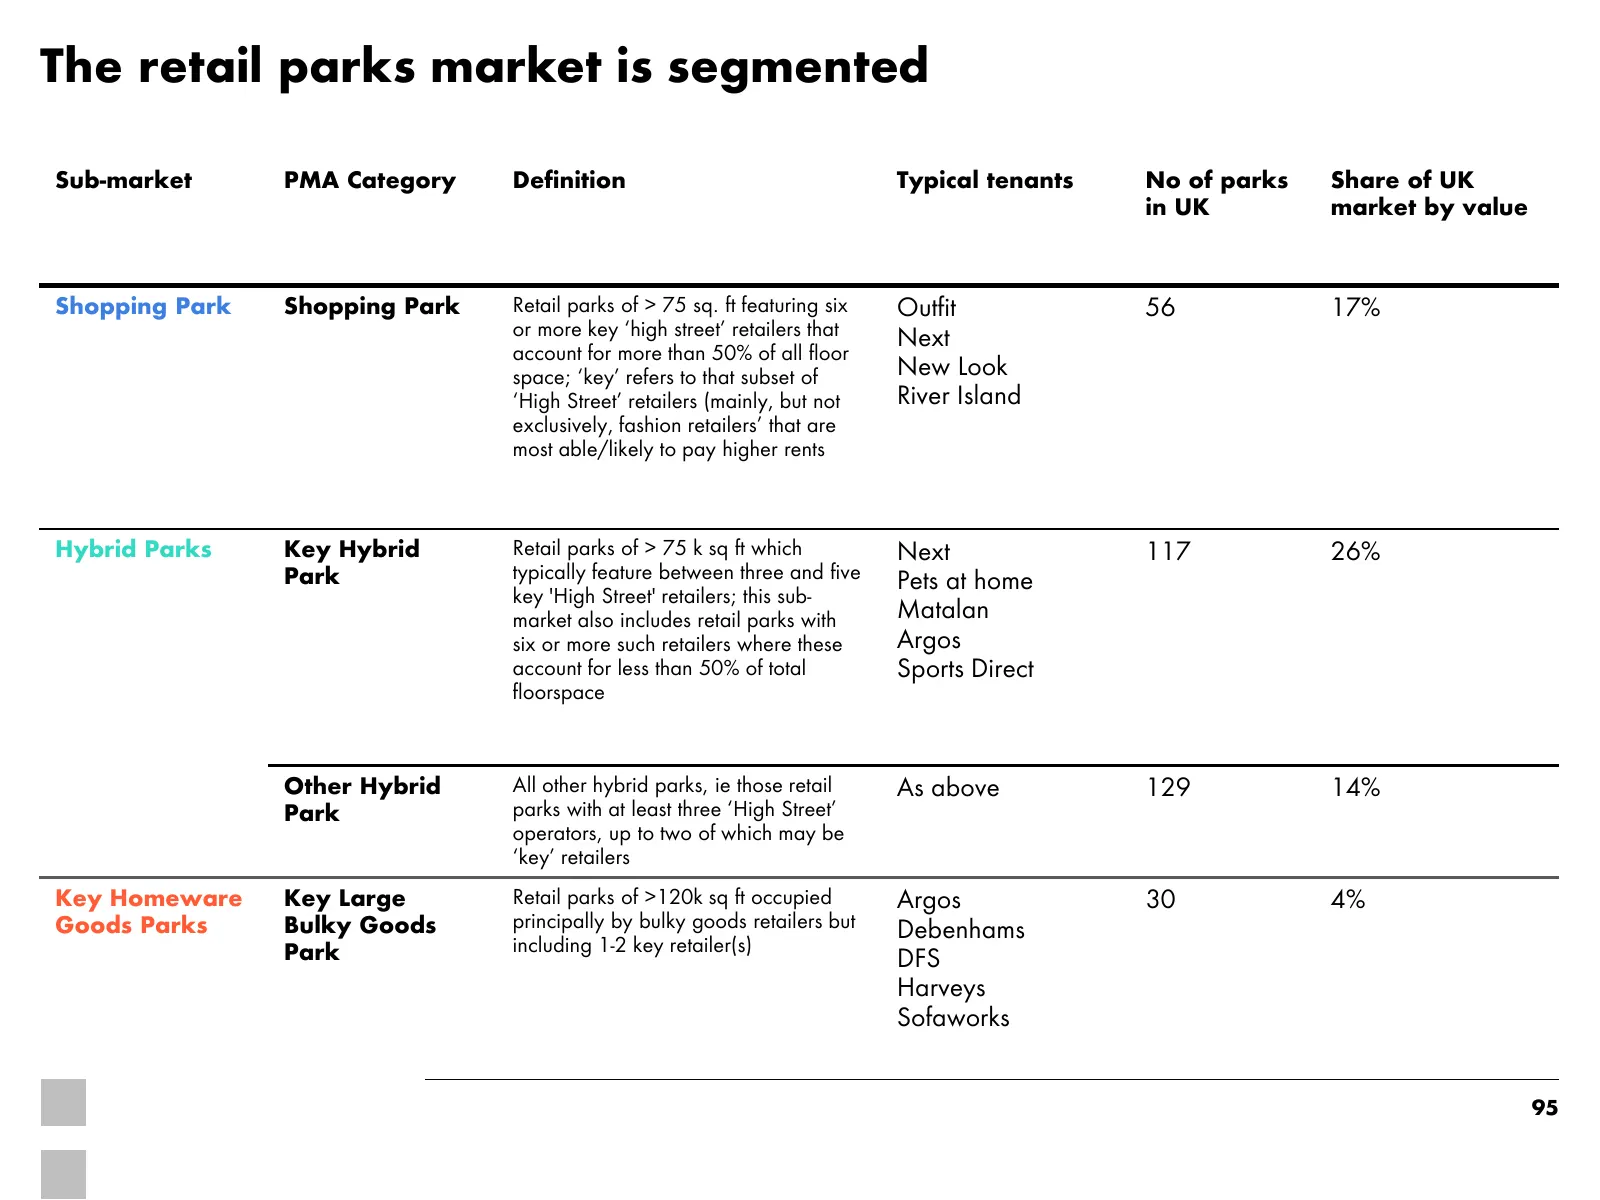
The retail parks market is segmented Sub-market PMA Category Definition Typical tenants No of parks Share of UK in UK market by value Shopping Park Shopping Park Retail parks of > 75 sq. ft featuring six Outfit 56 17% or more key ‘high street’ retailers that Next account for more than 50% of all flo
Slide 96: The retail parks market is segmented
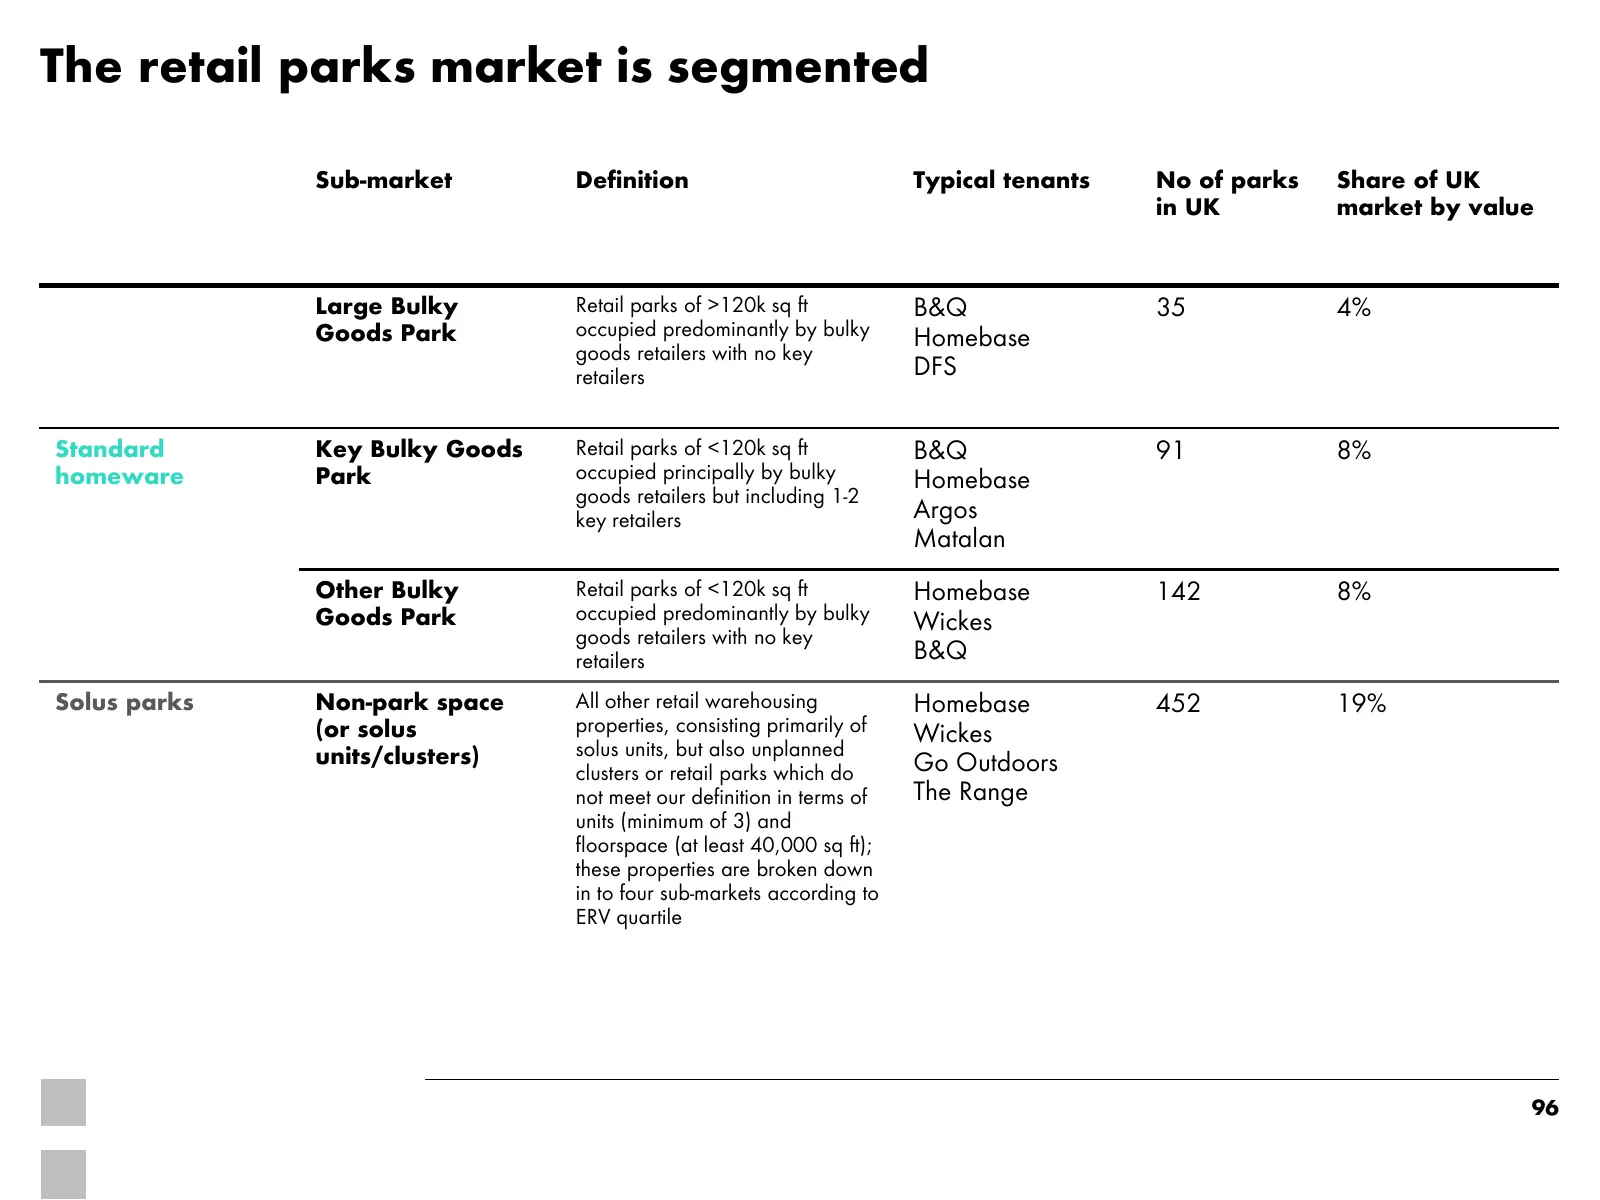
The retail parks market is segmented Sub-market Definition Typical tenants No of parks Share of UK in UK market by value Large Bulky Retail parks of >120k sq ft B&Q 35 4% Goods Park occupied predominantly by bulky Homebase goods retailers with no key retailers DFS Standard Key Bulky Goods Retail par
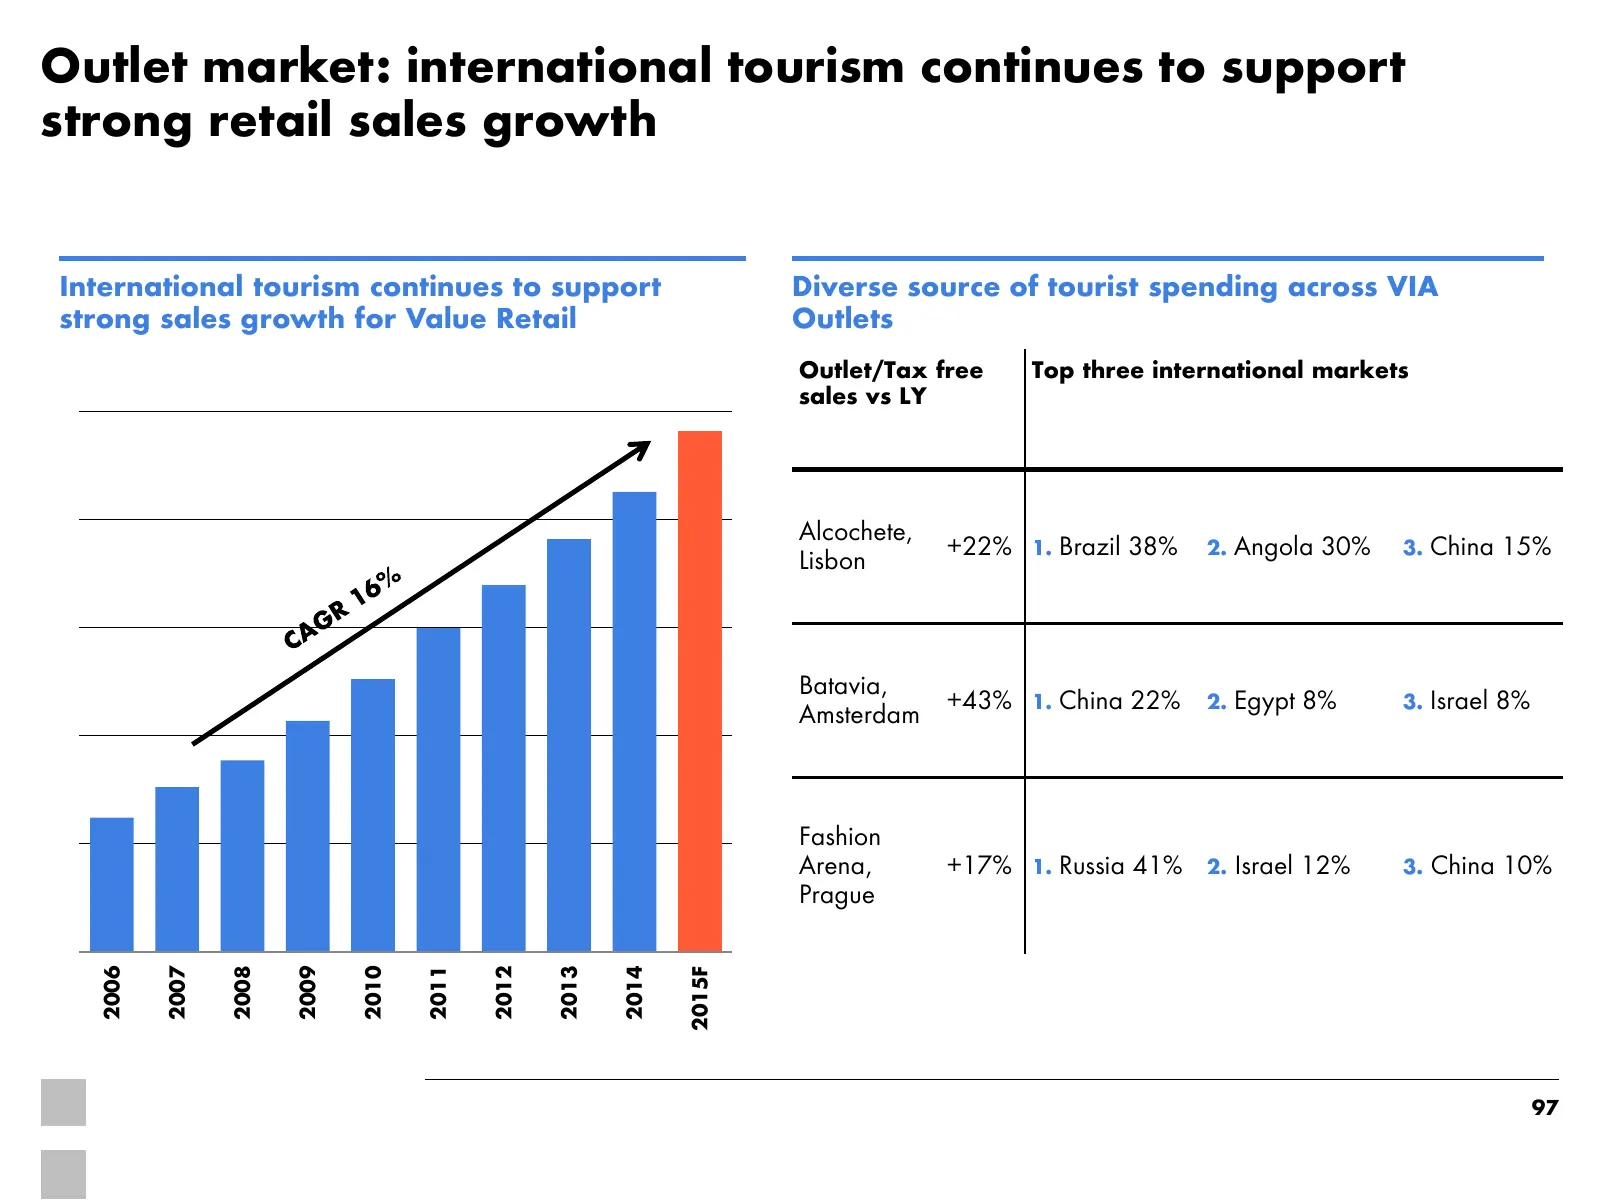
Slide 97: Outlet market: international tourism continues to support strong retail sales growth
Outlet market: international tourism continues to support strong retail sales growth International tourism continues to support Diverse source of tourist spending across VIA strong sales growth for Value Retail Outlets Outlet/Tax free Top three international markets sales vs LY Alcochete, +22% 1. Br
Source: Internet Archive copy of hammerson.com
More decks from Hammerson plc
 H1 2026 Earnings Presentation35 slides · Jul 30, 2026
 FY2025 Earnings Presentation37 slides · Feb 25, 2026
 H1 2025 Earnings Presentation37 slides · Jul 31, 2025
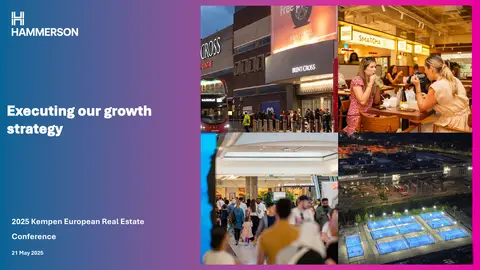 2025 Kempen European Real Estate Conference20 slides · May 21, 2025
 FY2024 Earnings Presentation38 slides · Feb 26, 2025
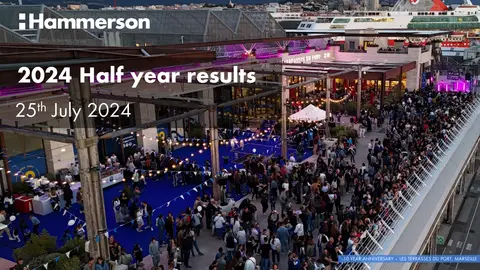 H1 2024 Earnings Presentation37 slides · Jul 25, 2024