South Financial — KBW Community Bank Conference 2009
32 slides from South Financial's conference presentation, Jul 27, 2009
Slide 1: Presentation to KBW Community Bank Conference
Presentation to KBW Community Bank Conference July 28, 2009
Slide 2: Forward-Looking Statements and Non-GAAP Financial Information
Forward-Looking Statements and Non-GAAP Financial Information We caution you that this presentation contains certain forward-looking statements within the meaning of Section 27A of the Securities Act of 1933, as amended, and Section 21E of the Securities Exchange Act of 1934, as amended, including c
Slide 3: TSFG Overview
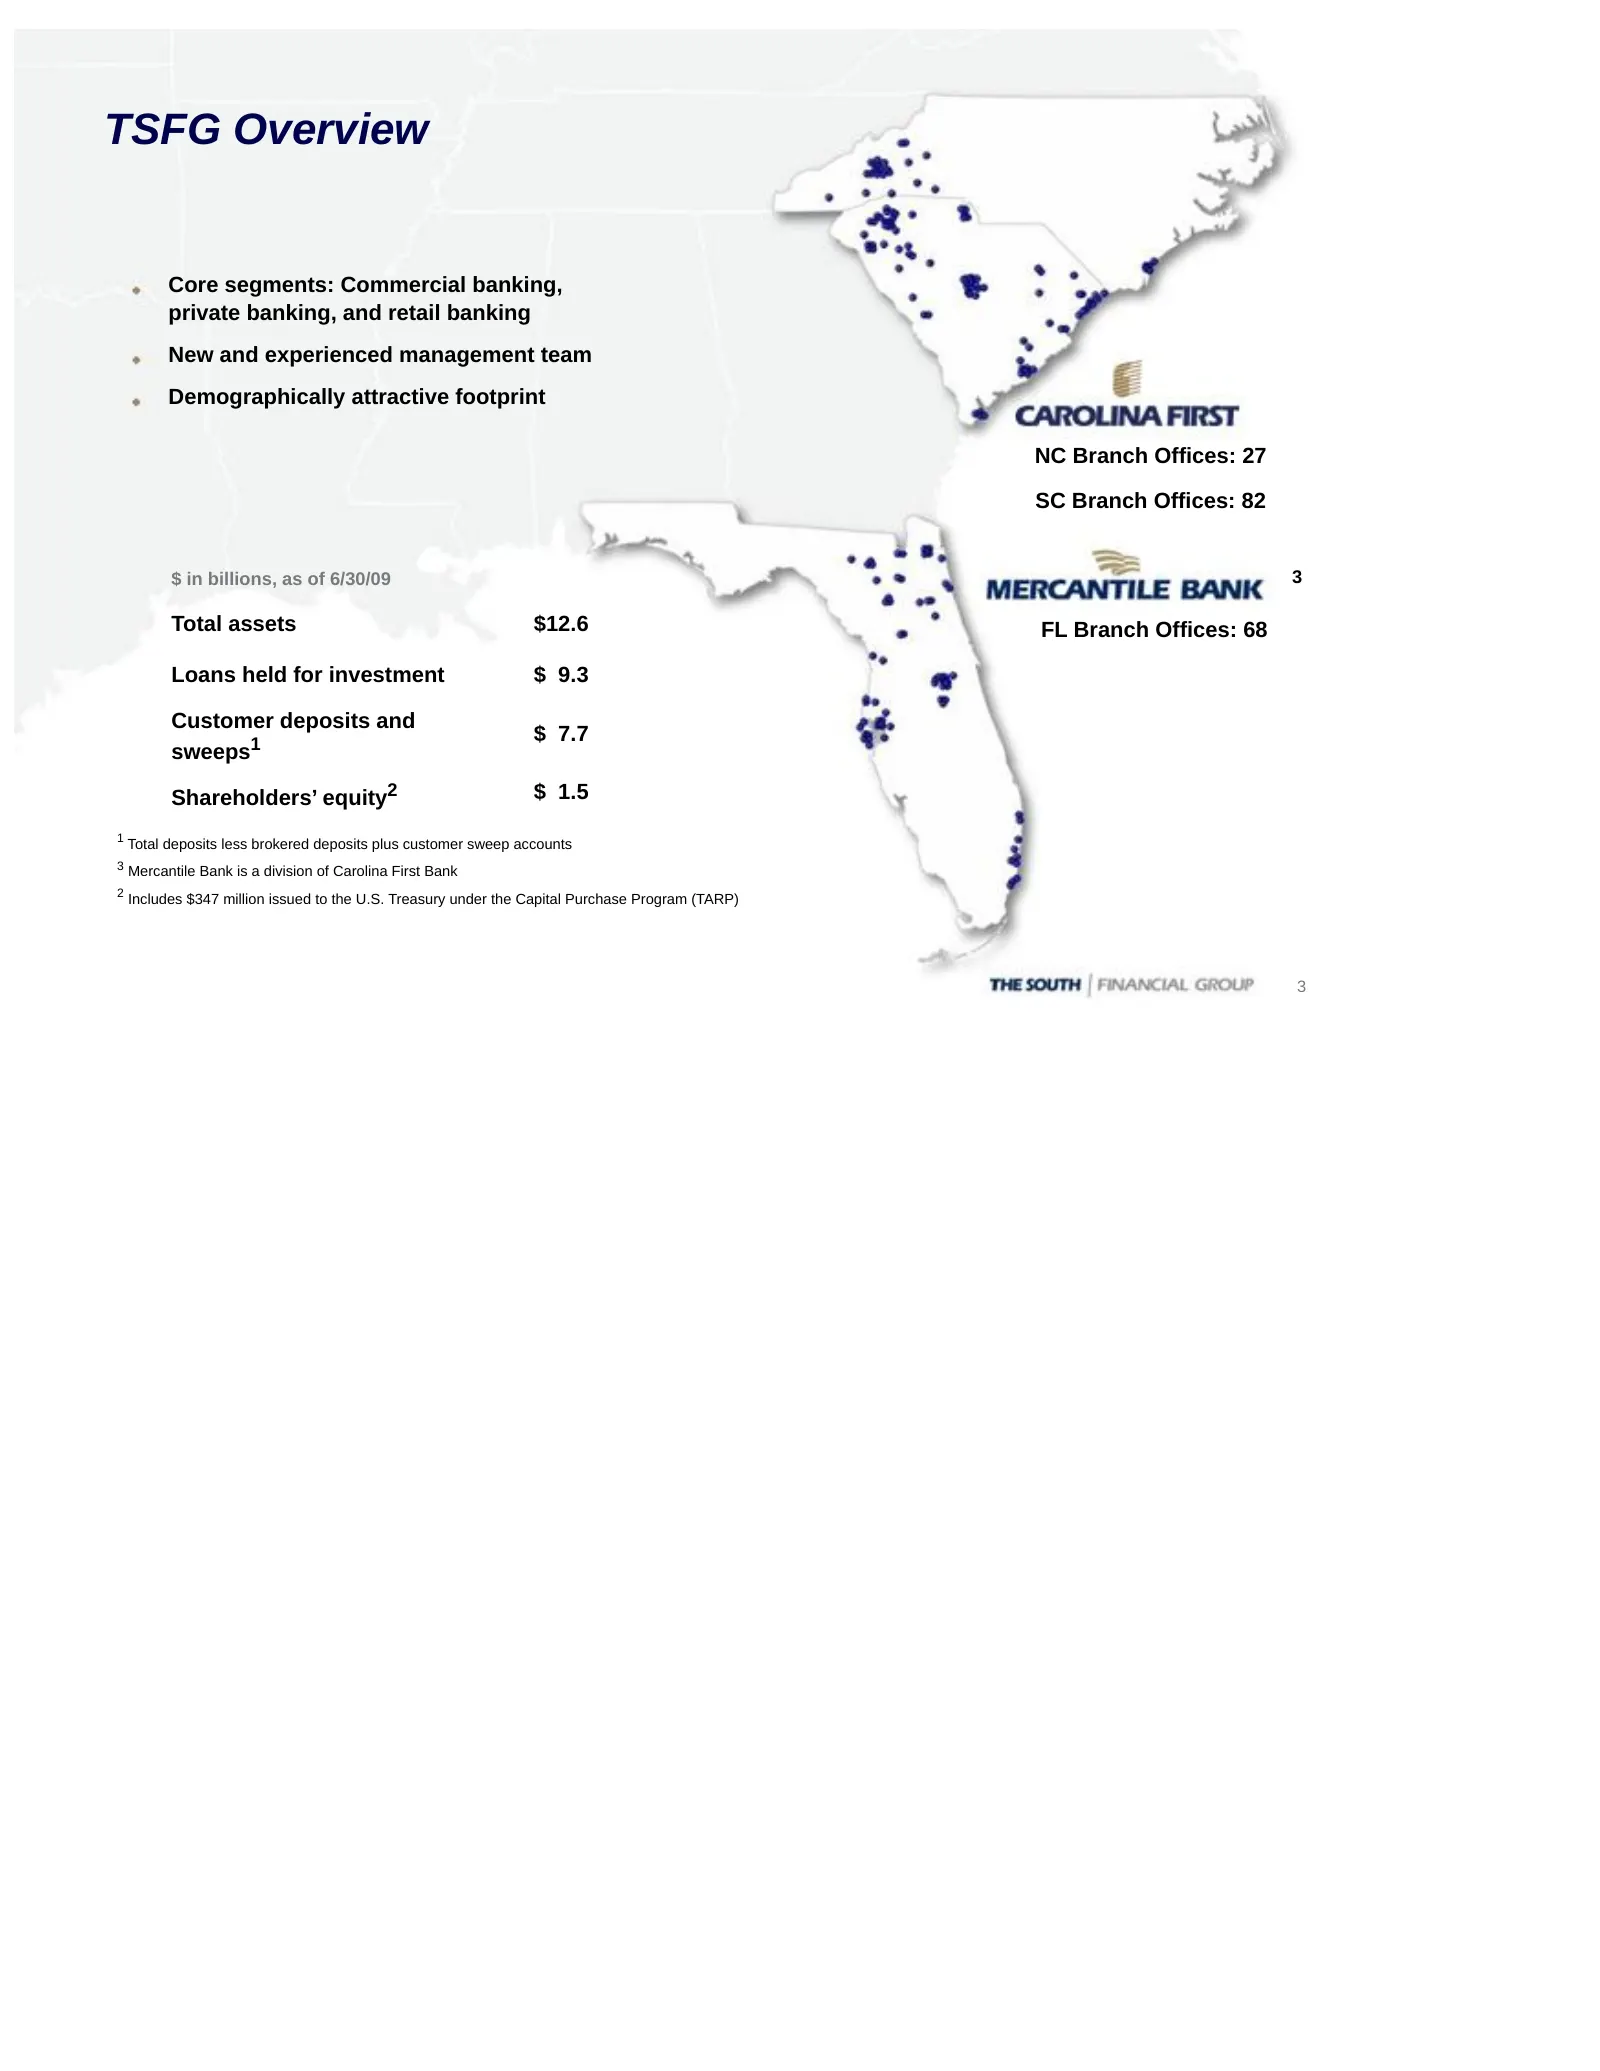
TSFG Overview Core segments: Commercial banking, private banking, and retail banking New and experienced management team Demographically attractive footprint NC Branch Offices: 27 SC Branch Offices: 82 $ in billions, as of 6/30/09 3 Total assets $12.6 FL Branch Offices: 68 Loans held for investment
Slide 4: 2Q09 Execution of Strategic Actions
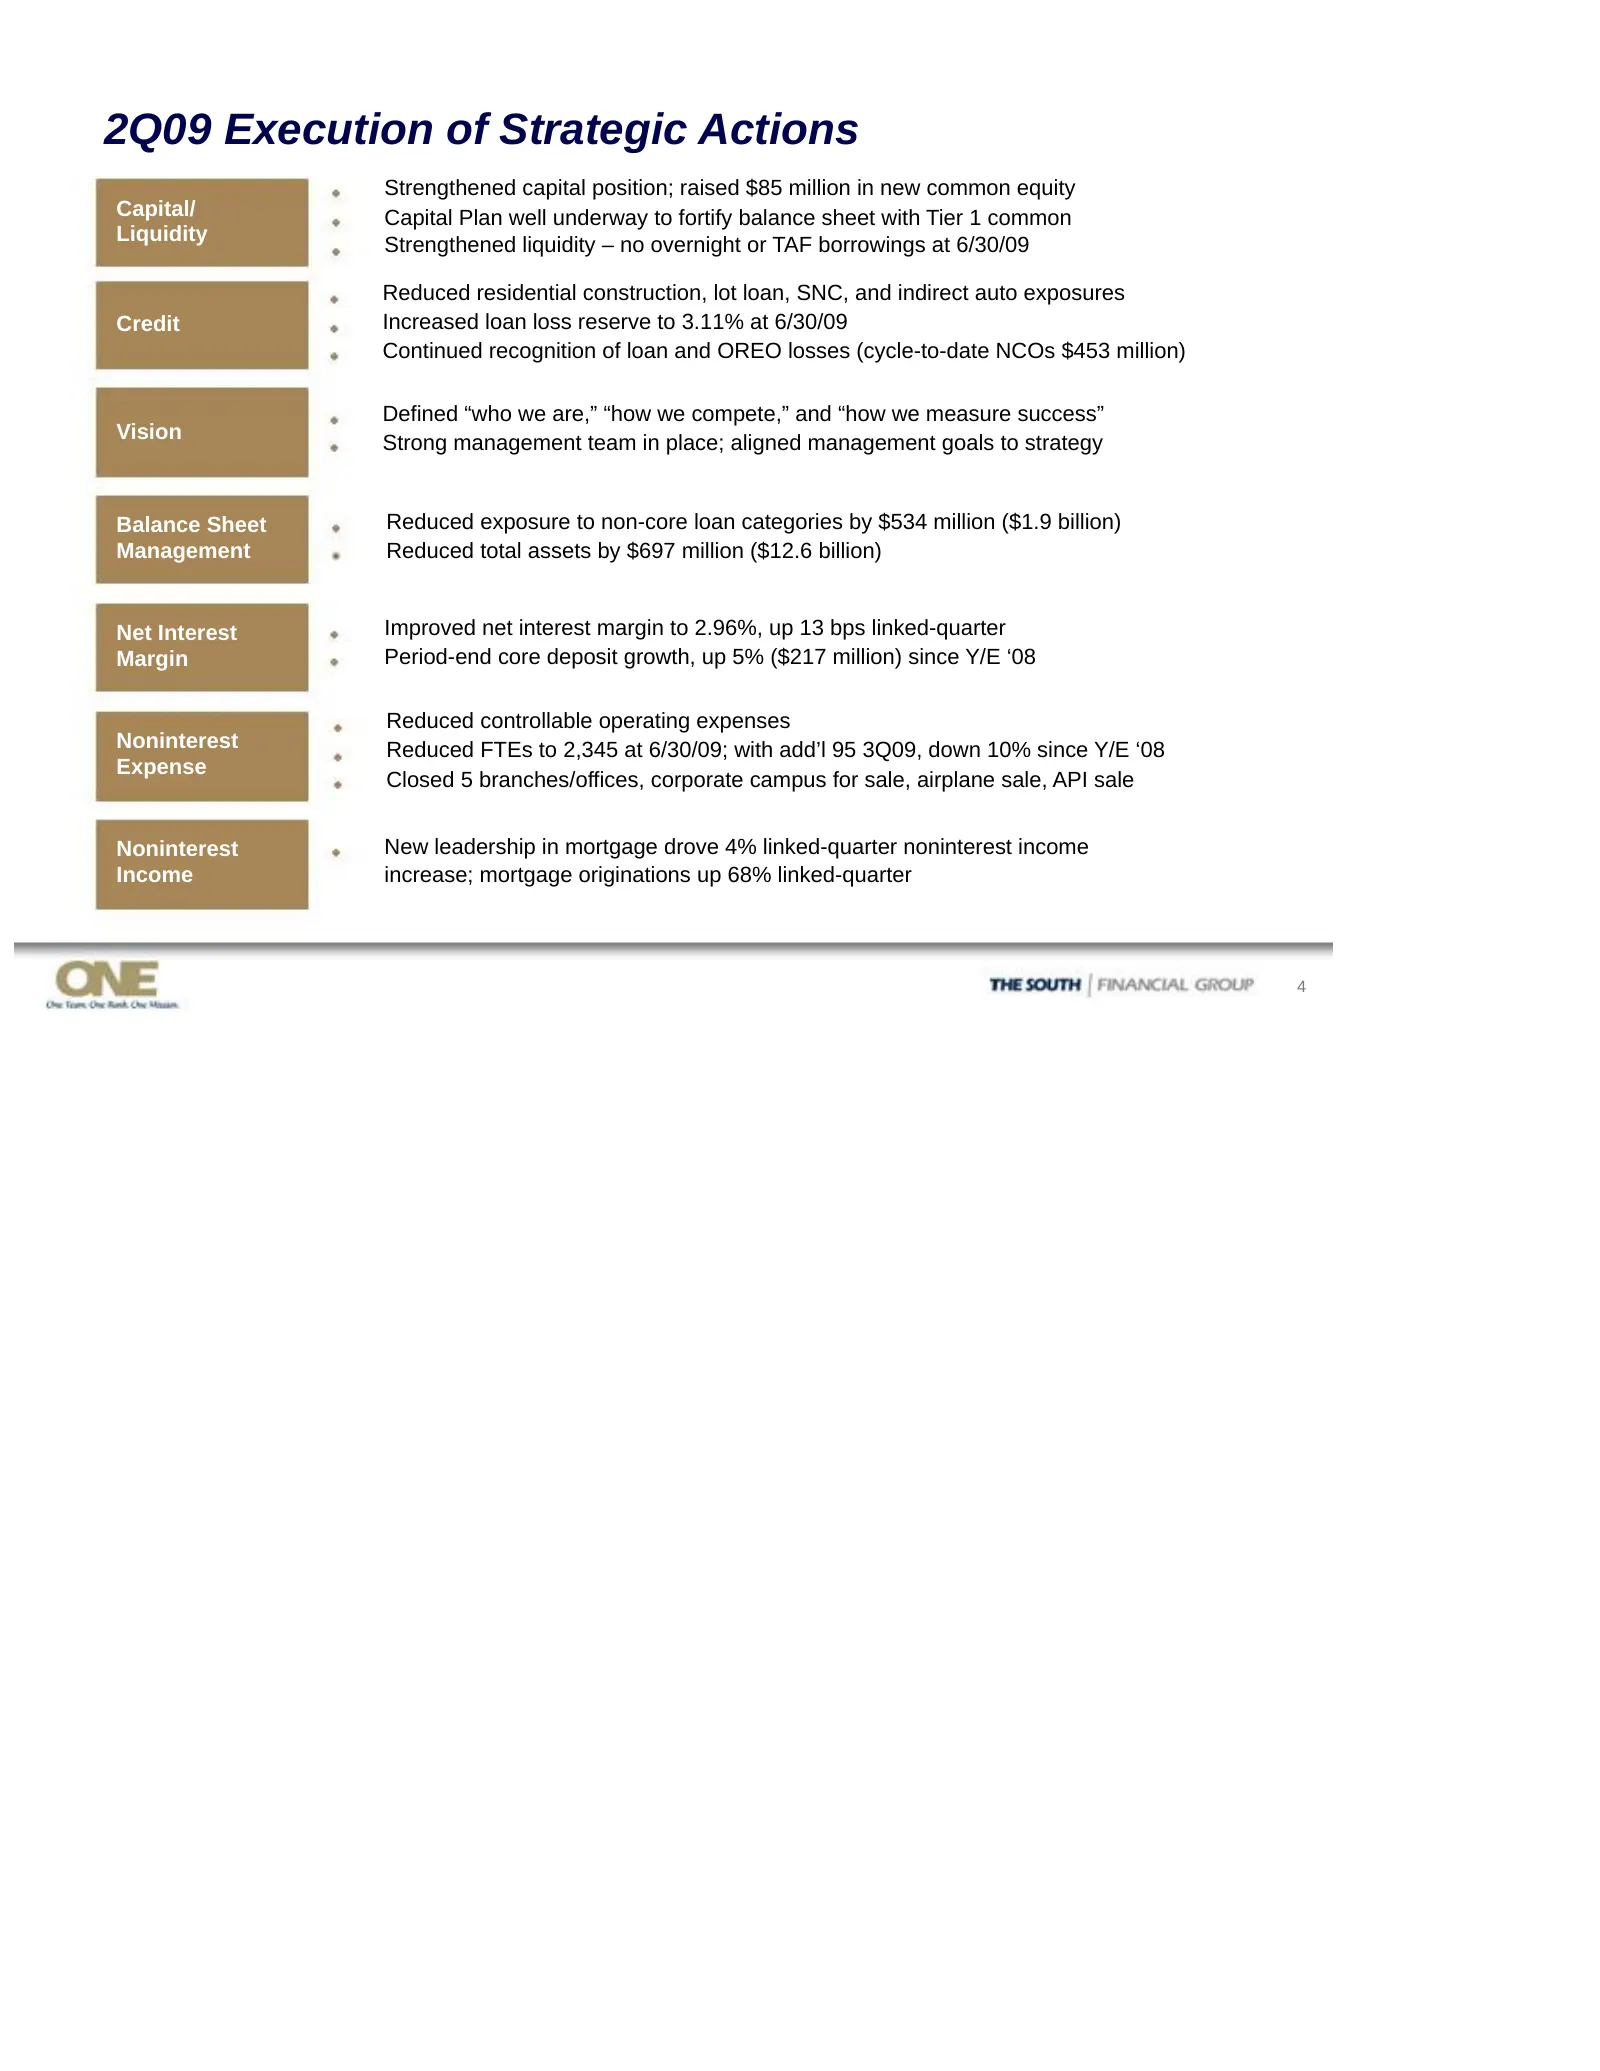
2Q09 Execution of Strategic Actions Strengthened capital position; raised $85 million in new common equity Capital/ Capital Plan well underway to fortify balance sheet with Tier 1 common Liquidity Strengthened liquidity – no overnight or TAF borrowings at 6/30/09 Reduced residential construction, lo
Slide 5: Capital Plan: Update
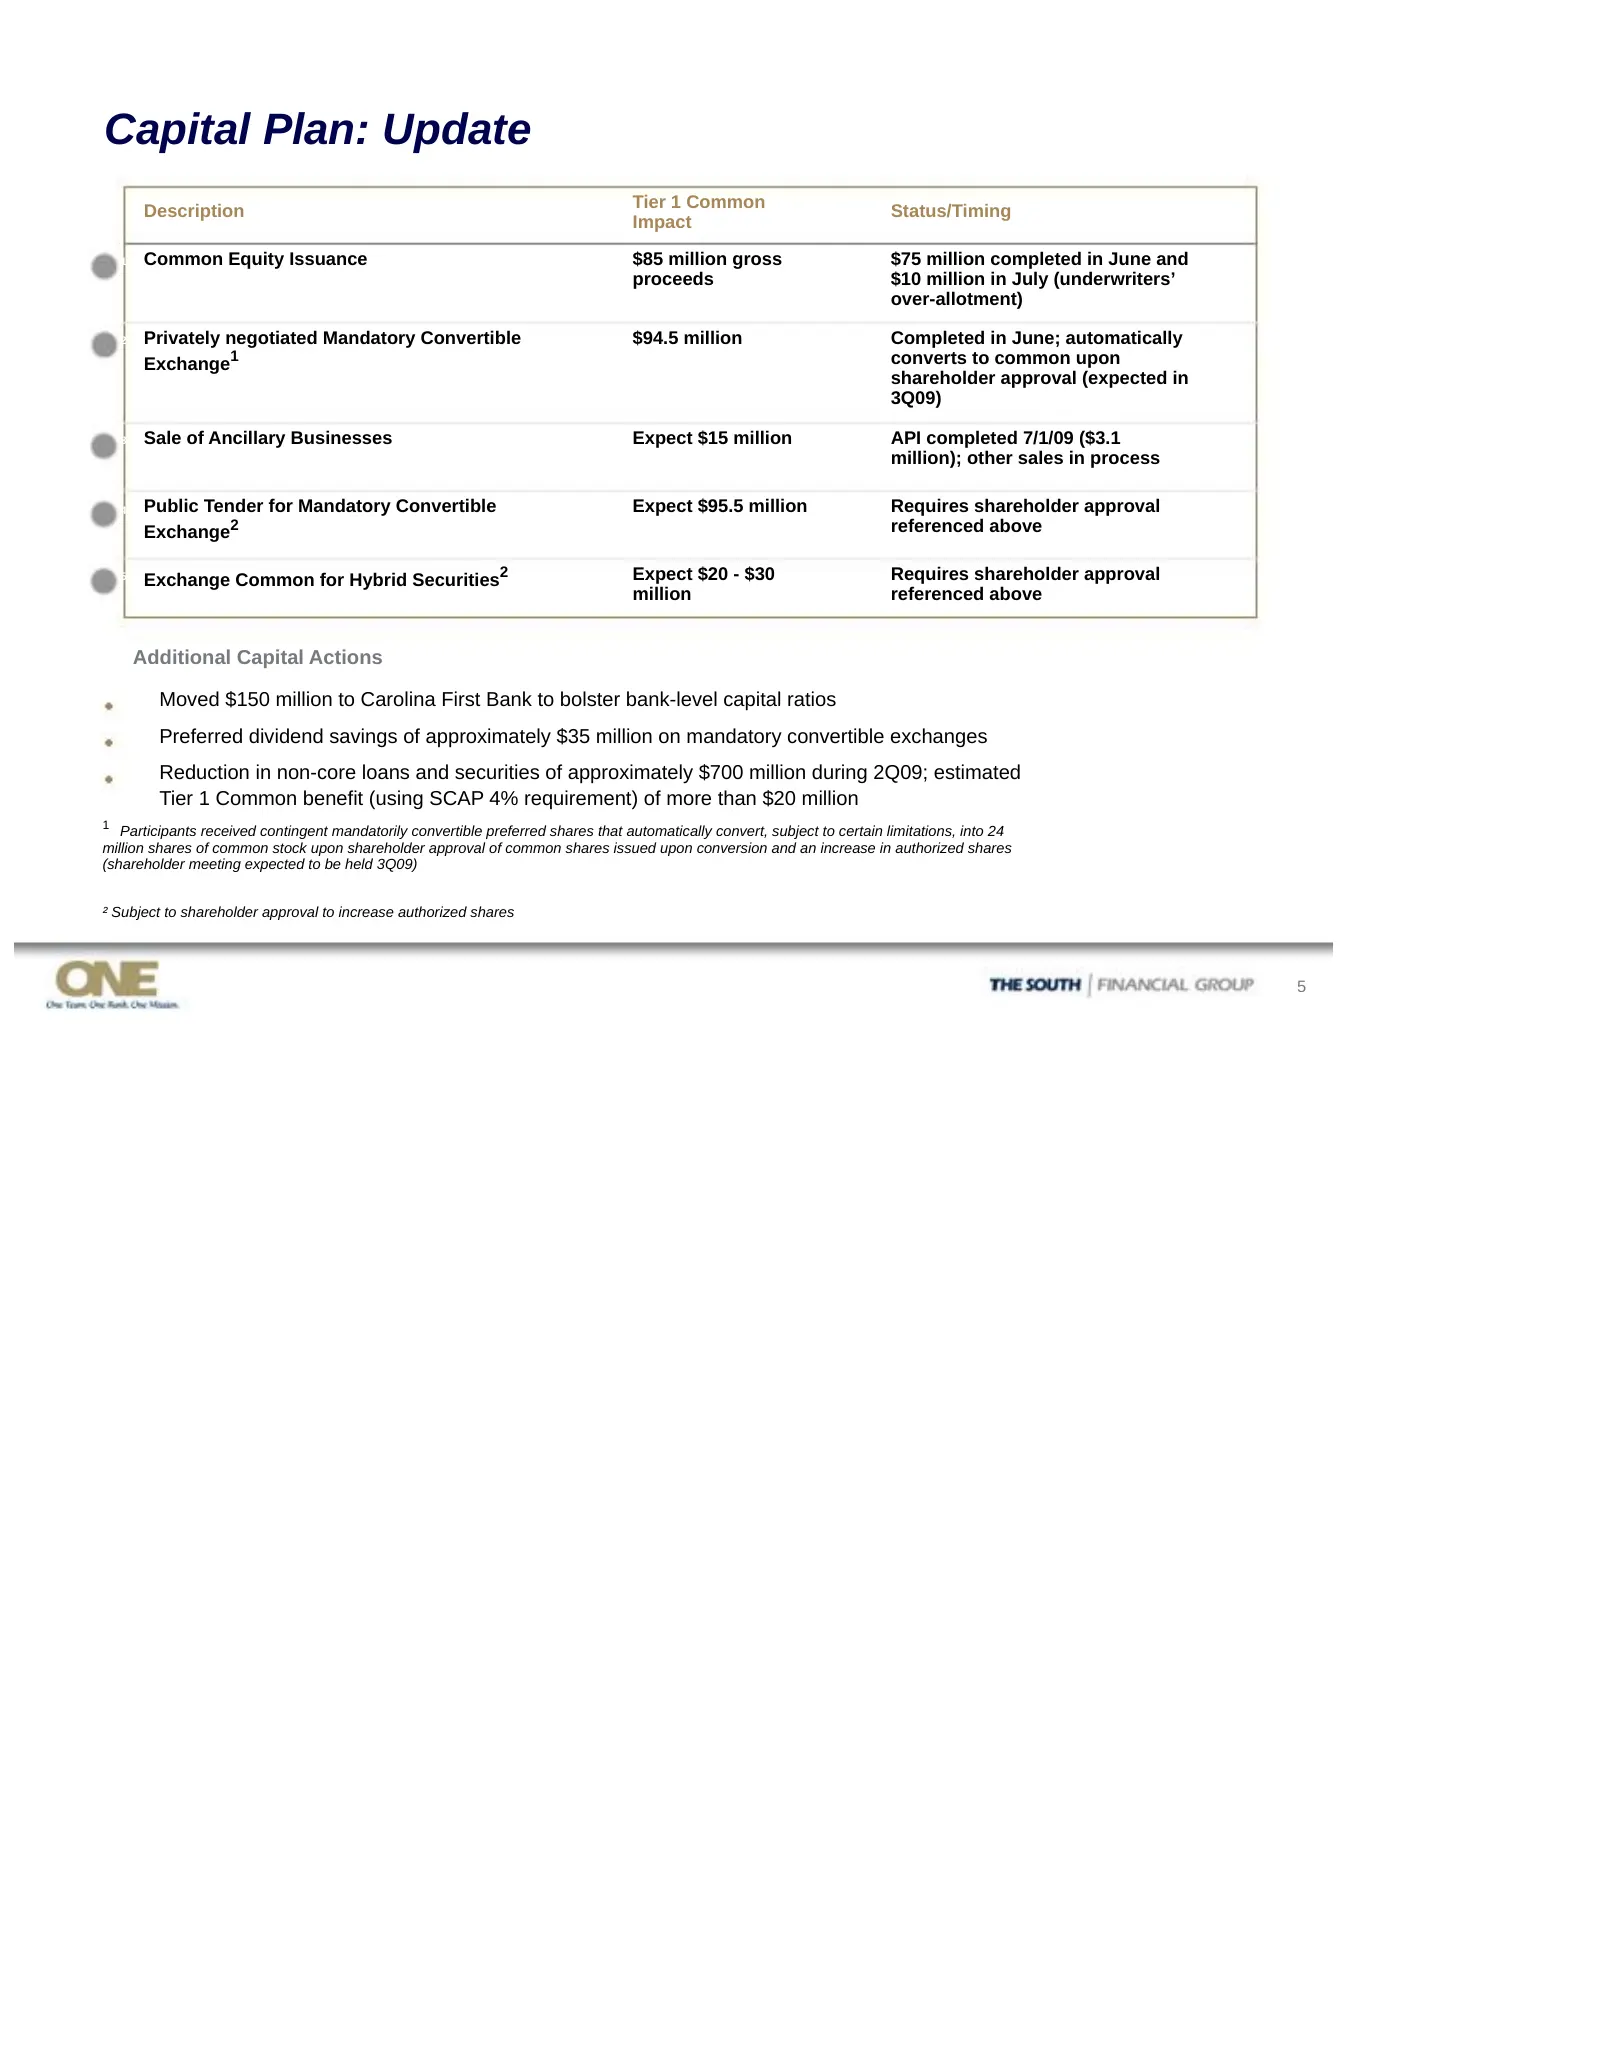
Capital Plan: Update Description Tier 1 Common Status/Timing Impact 1 Common Equity Issuance $85 million gross $75 million completed in June and proceeds $10 million in July (underwriters’ over-allotment) 2 Privately negotiated Mandatory Convertible $94.5 million Completed in June; automatically Exc
Slide 6: Capital Position
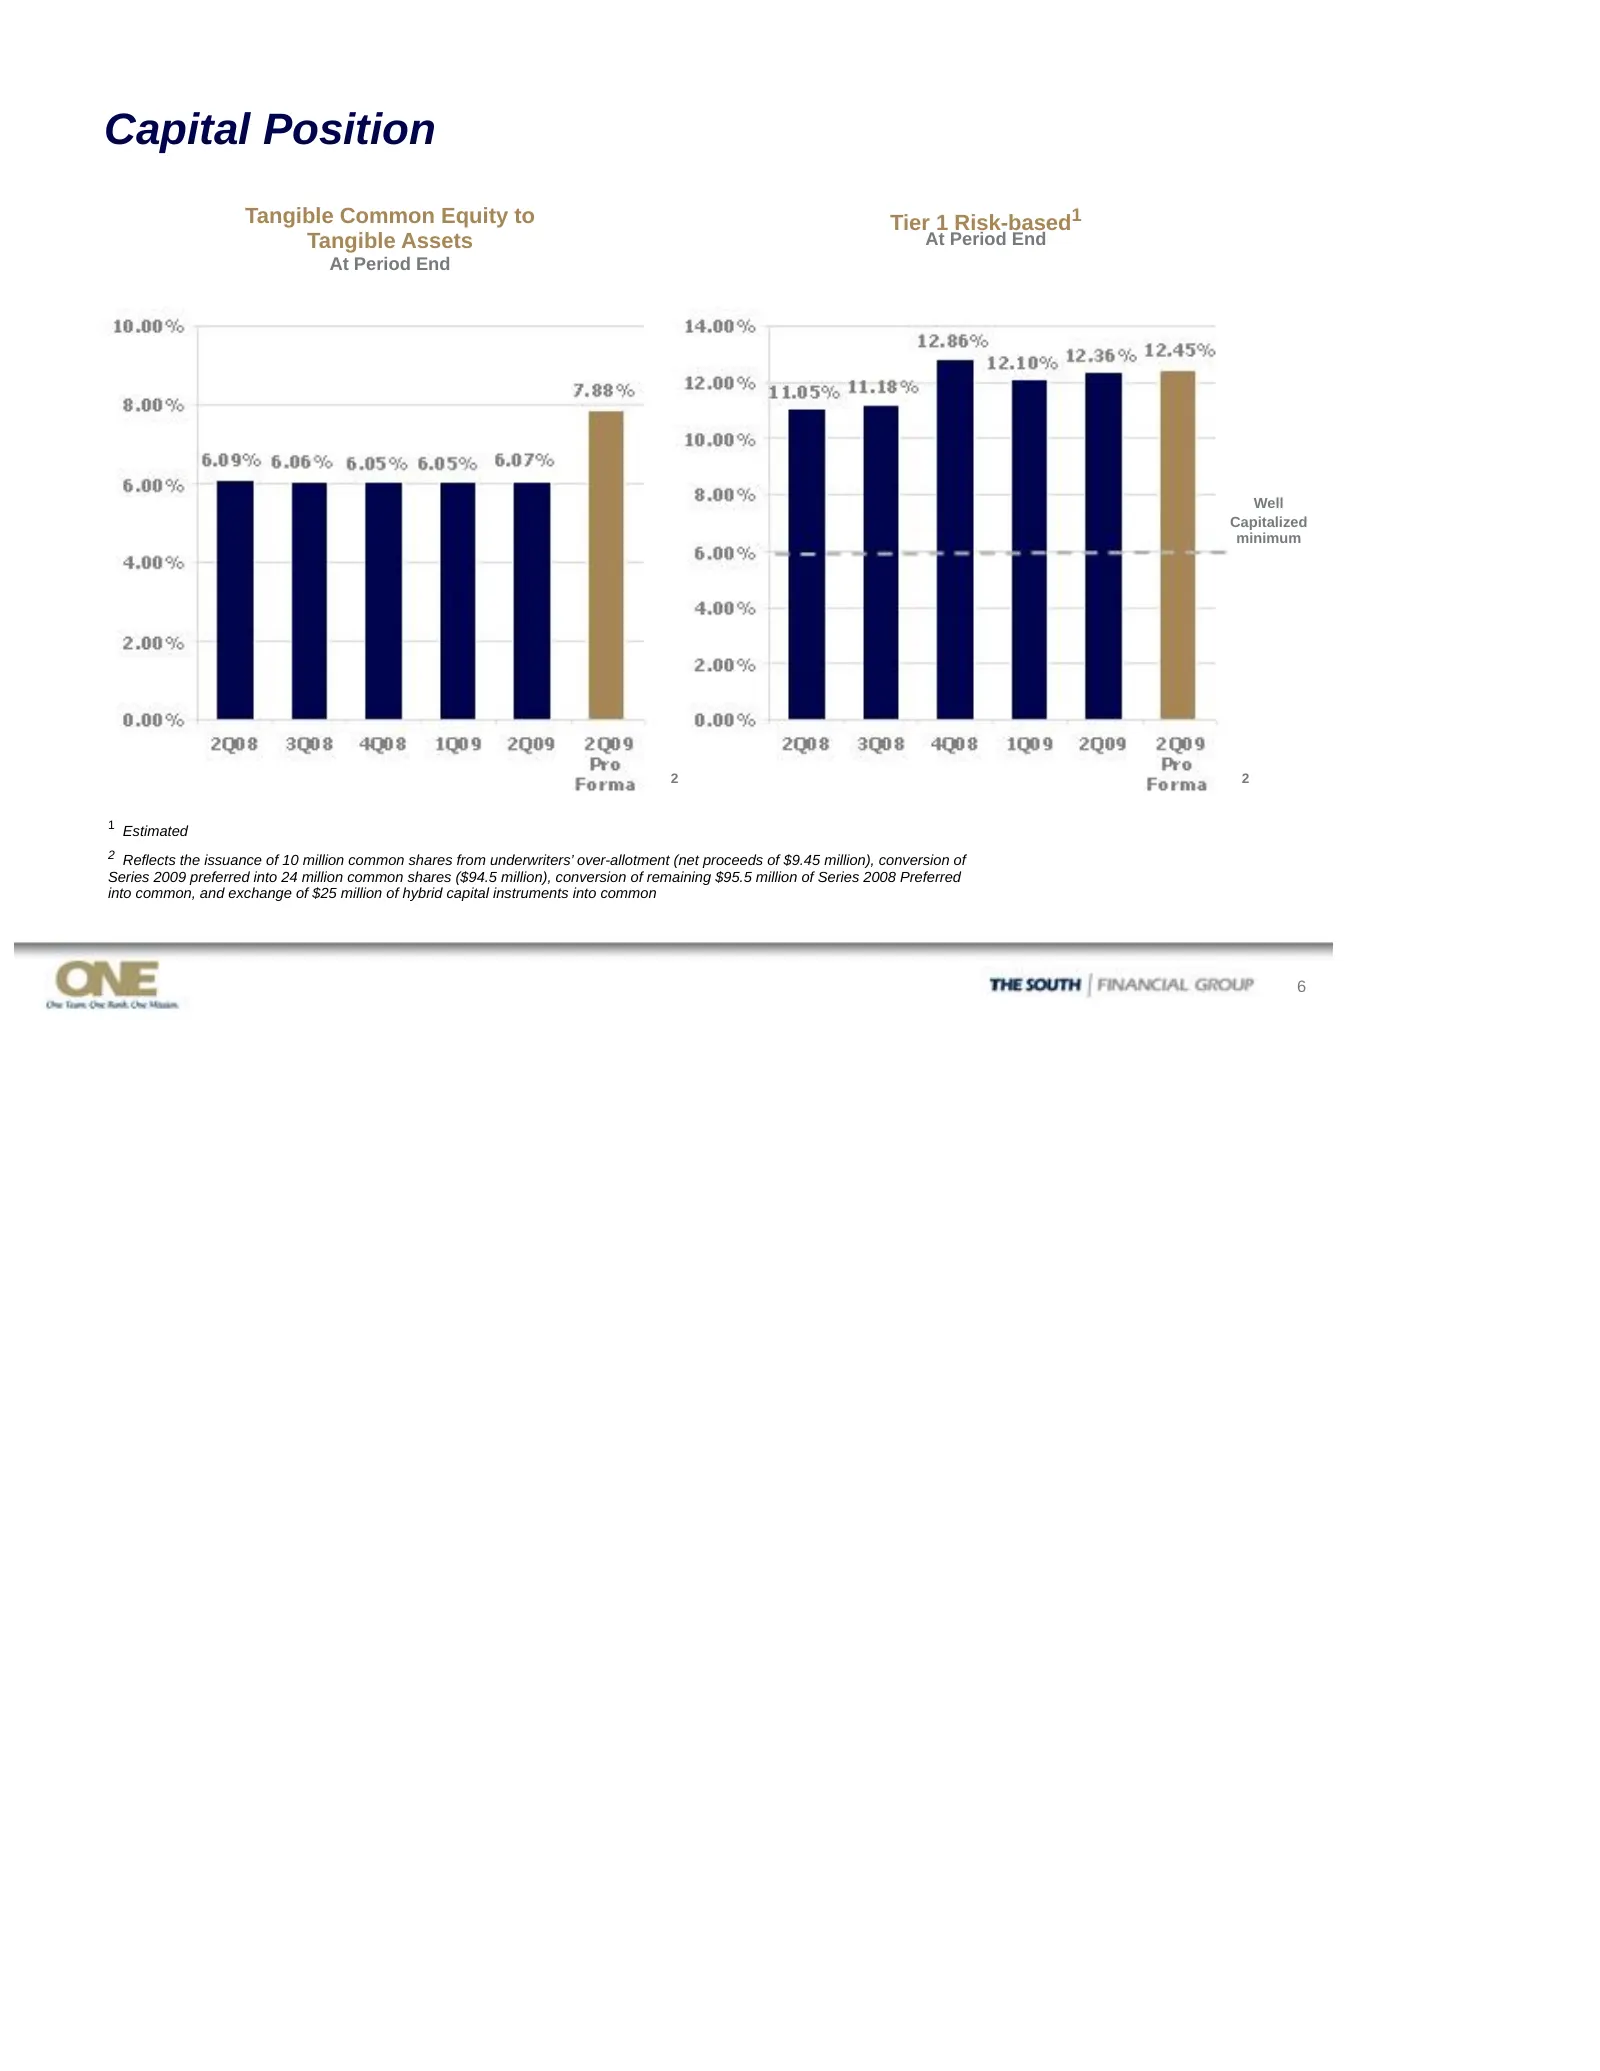
Capital Position Tangible Common Equity to Tier 1 Risk-based1 Tangible Assets At Period End At Period End Well Capitalized minimum 2 2 1 Estimated 2 Reflects the issuance of 10 million common shares from underwriters’ over-allotment (net proceeds of $9.45 million), conversion of Series 2009 preferre
Slide 7: Liquidity
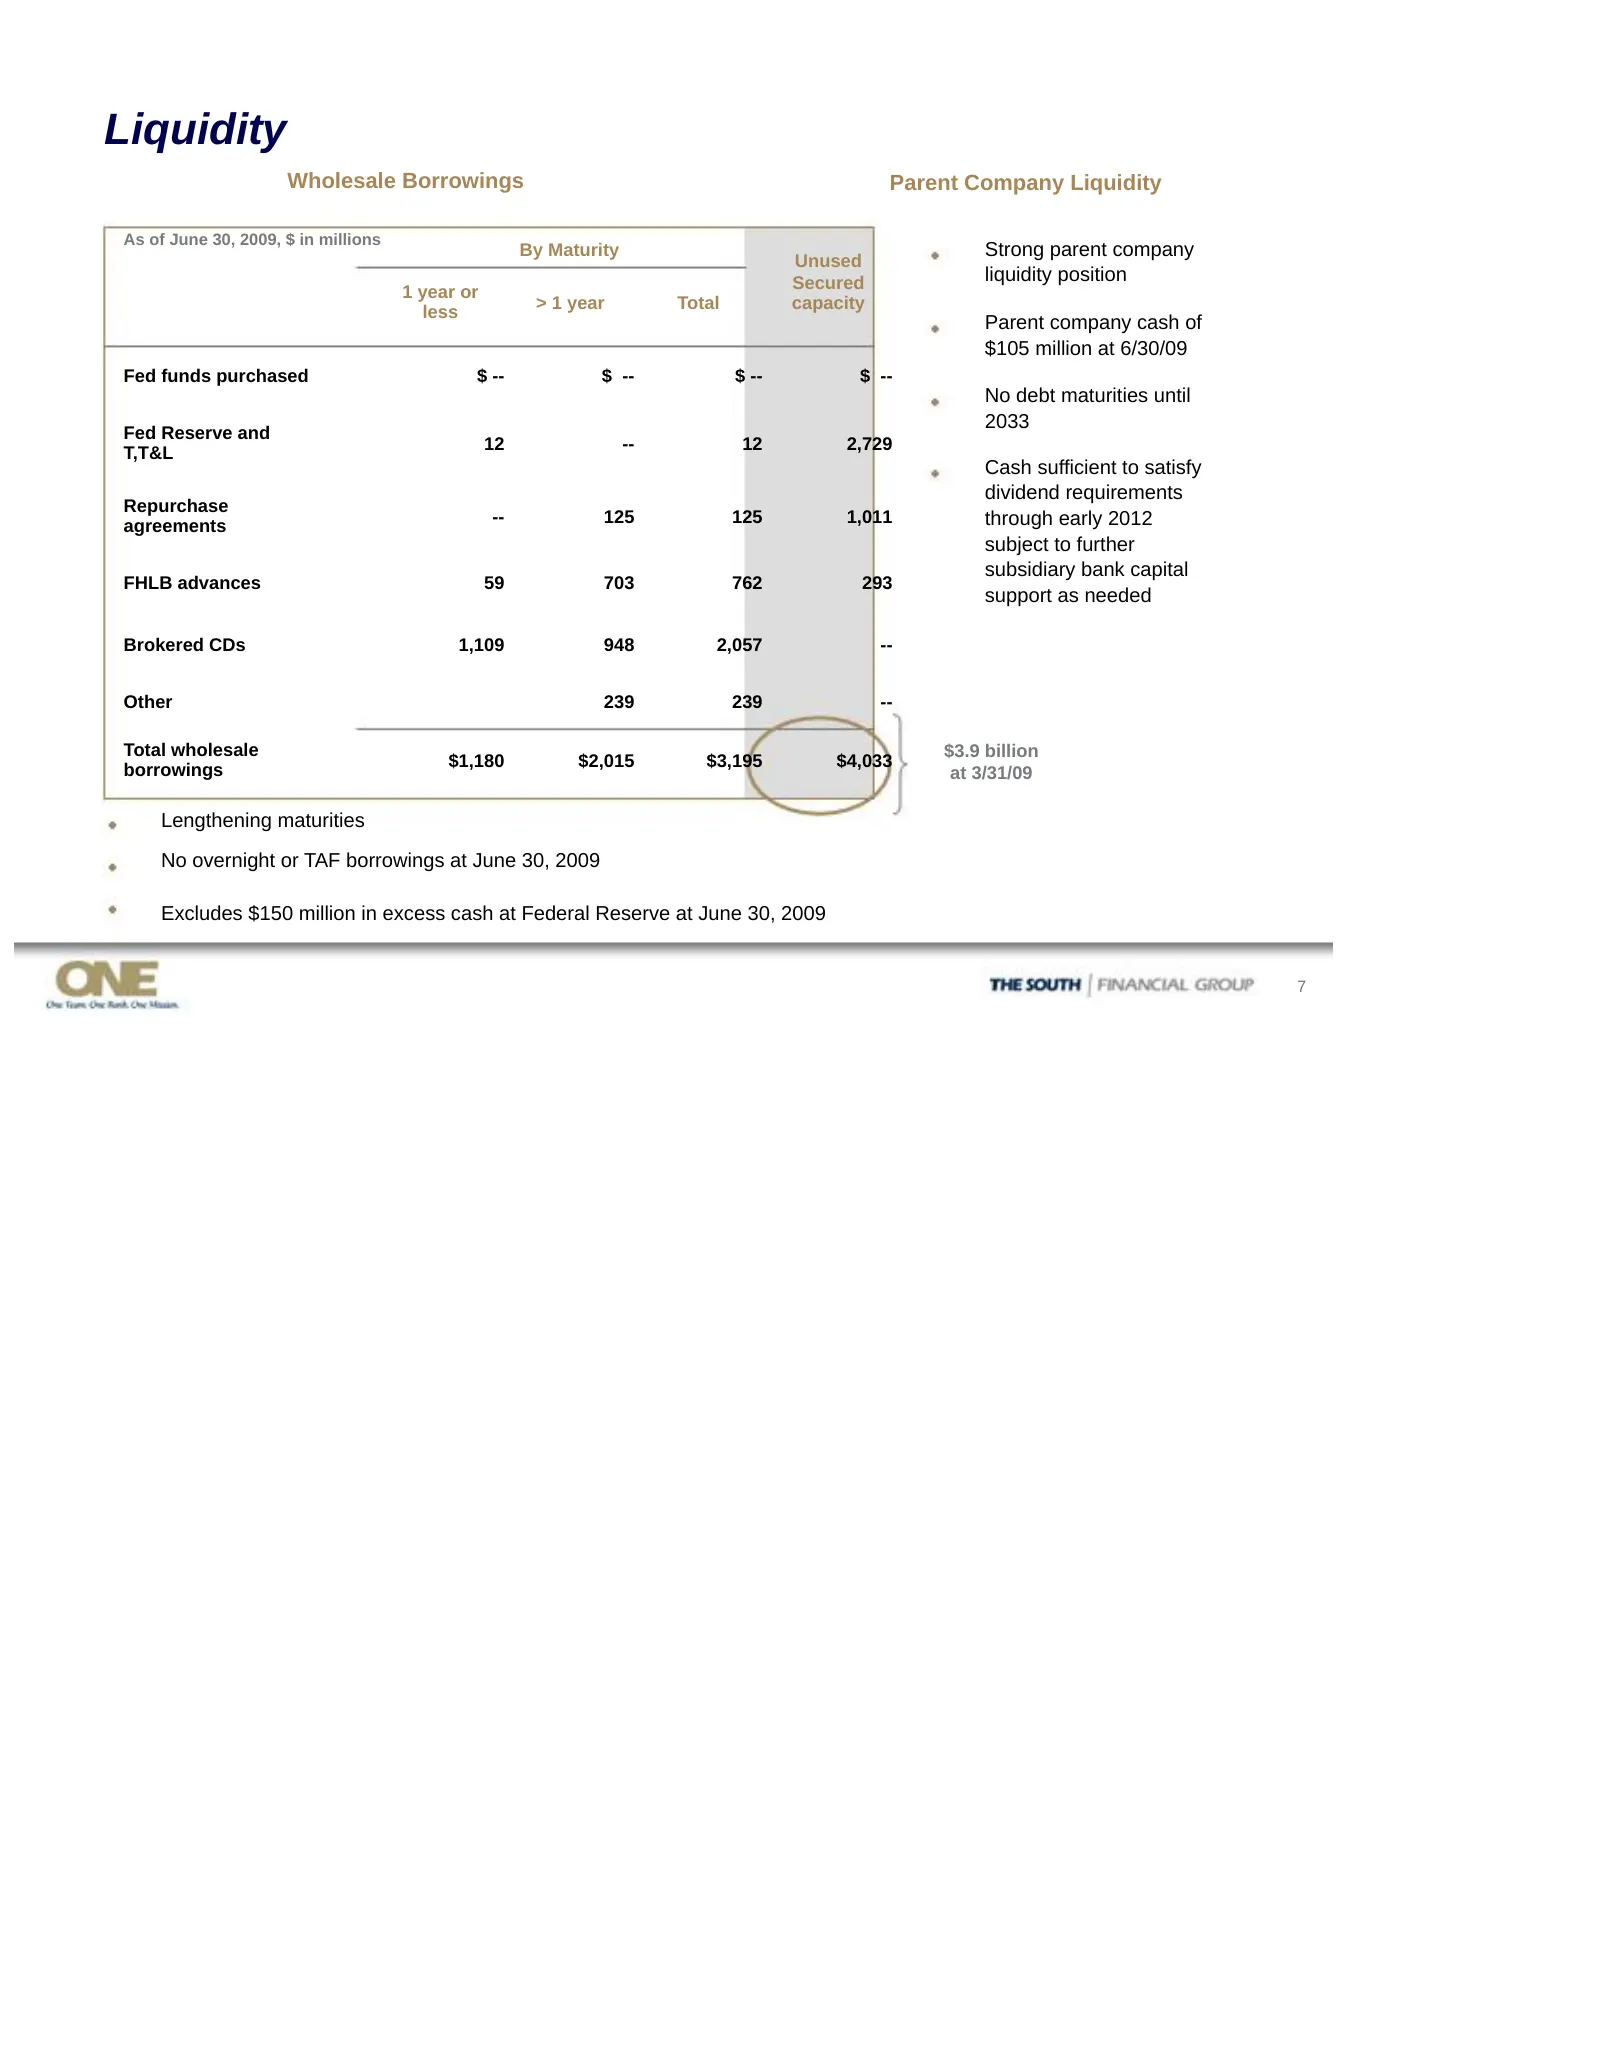
Liquidity Wholesale Borrowings Parent Company Liquidity As of June 30, 2009, $ in millions By Maturity Strong parent company Unused Secured liquidity position 1 year or less > 1 year Total capacity Parent company cash of $105 million at 6/30/09 Fed funds purchased $ -- $ -- $ -- $ -- No debt maturit
Slide 8: Asset Quality Overview
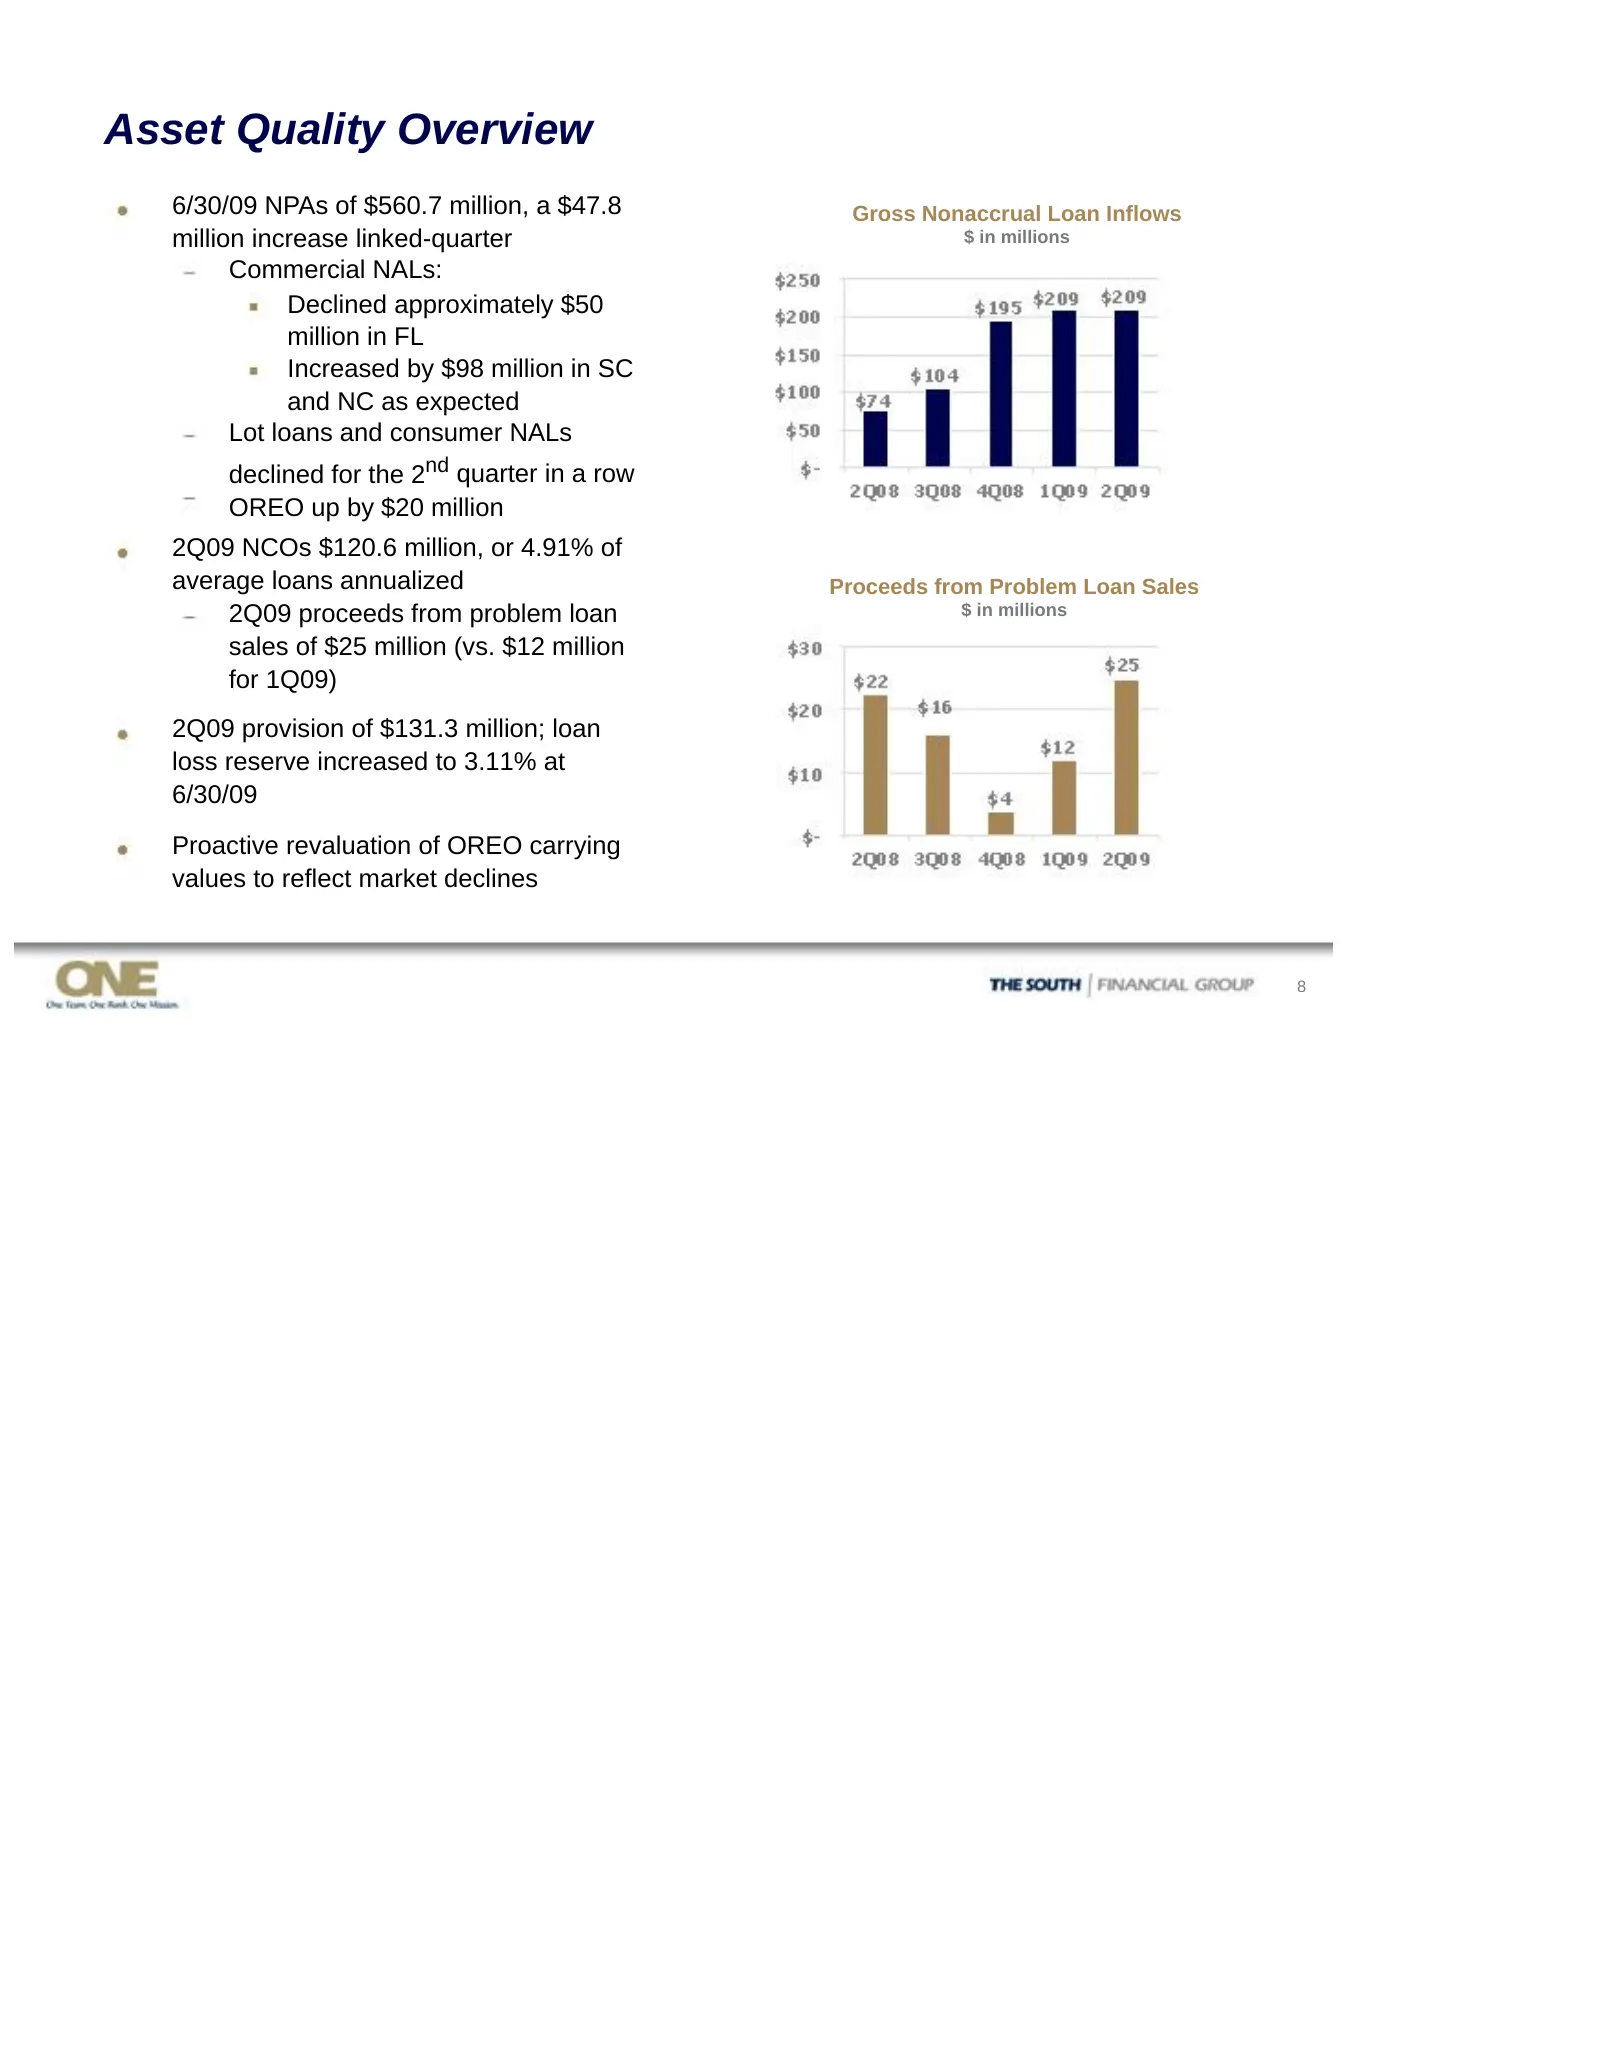
Asset Quality Overview 6/30/09 NPAs of $560.7 million, a $47.8 Gross Nonaccrual Loan Inflows million increase linked-quarter $ in millions Commercial NALs: Declined approximately $50 million in FL Increased by $98 million in SC and NC as expected Lot loans and consumer NALs declined for the 2nd quar
Slide 9: New Strategic Vision: Driving Culture Change
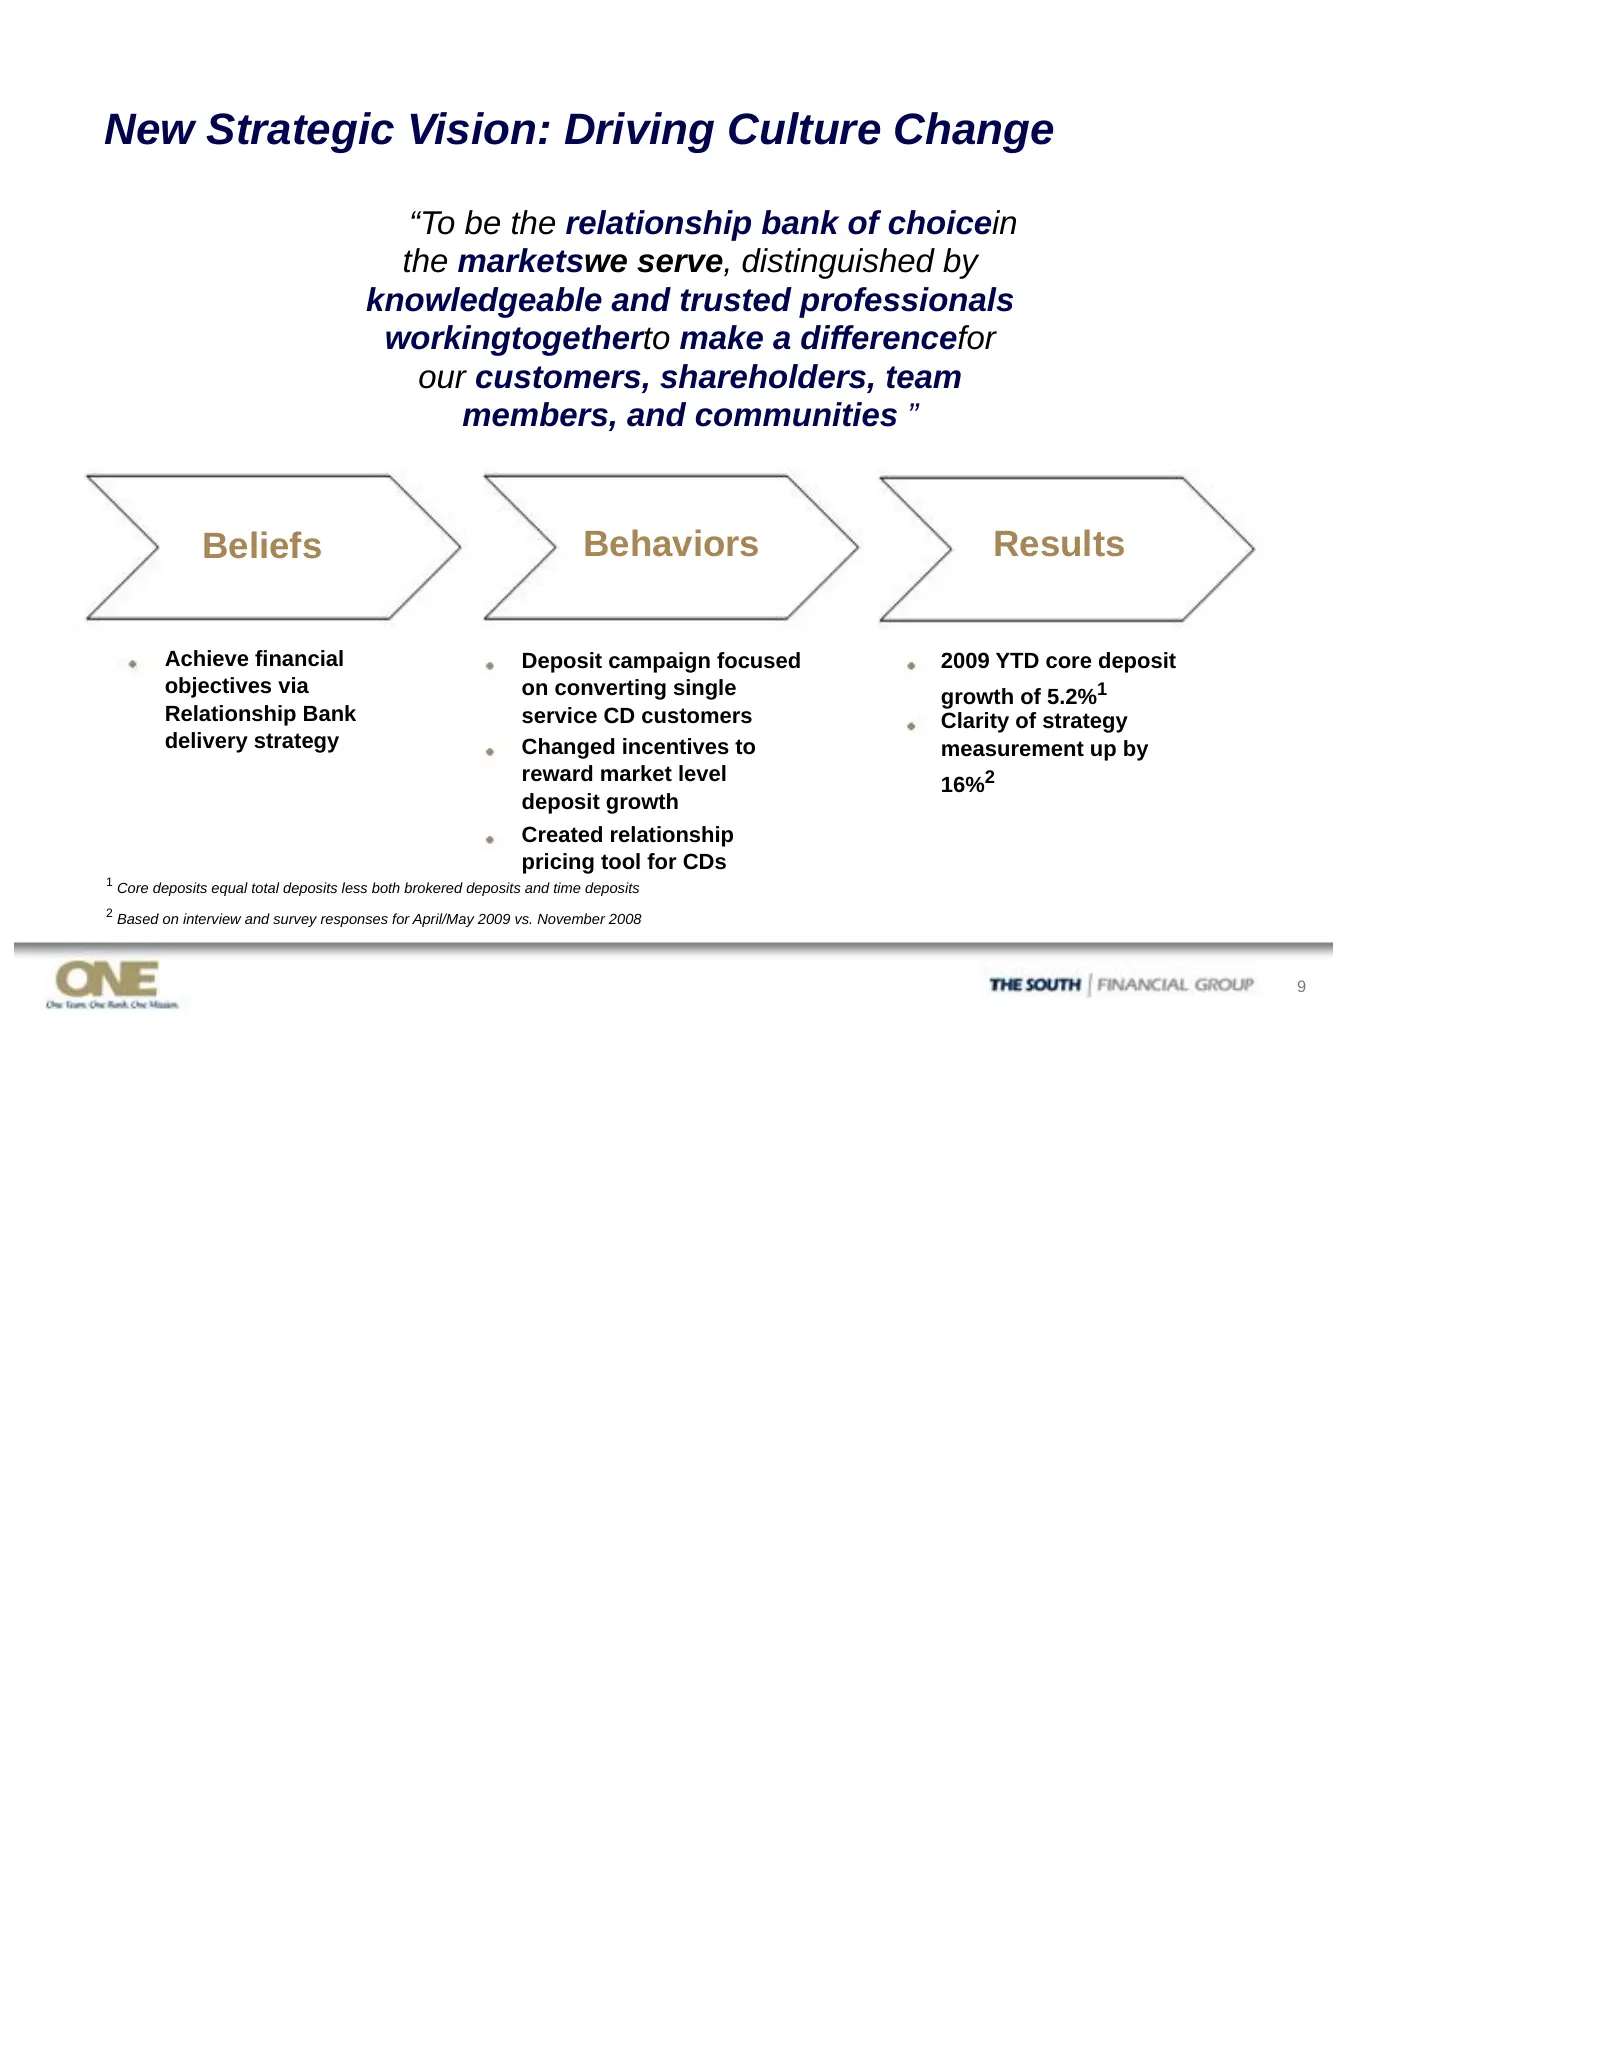
New Strategic Vision: Driving Culture Change “To be the relationship bank of choicein the marketswe serve, distinguished by knowledgeable and trusted professionals workingtogetherto make a differencefor our customers, shareholders, team members, and communities ” Beliefs Behaviors Results Achieve fi
Slide 10: Focus on Core Customer/Businesses
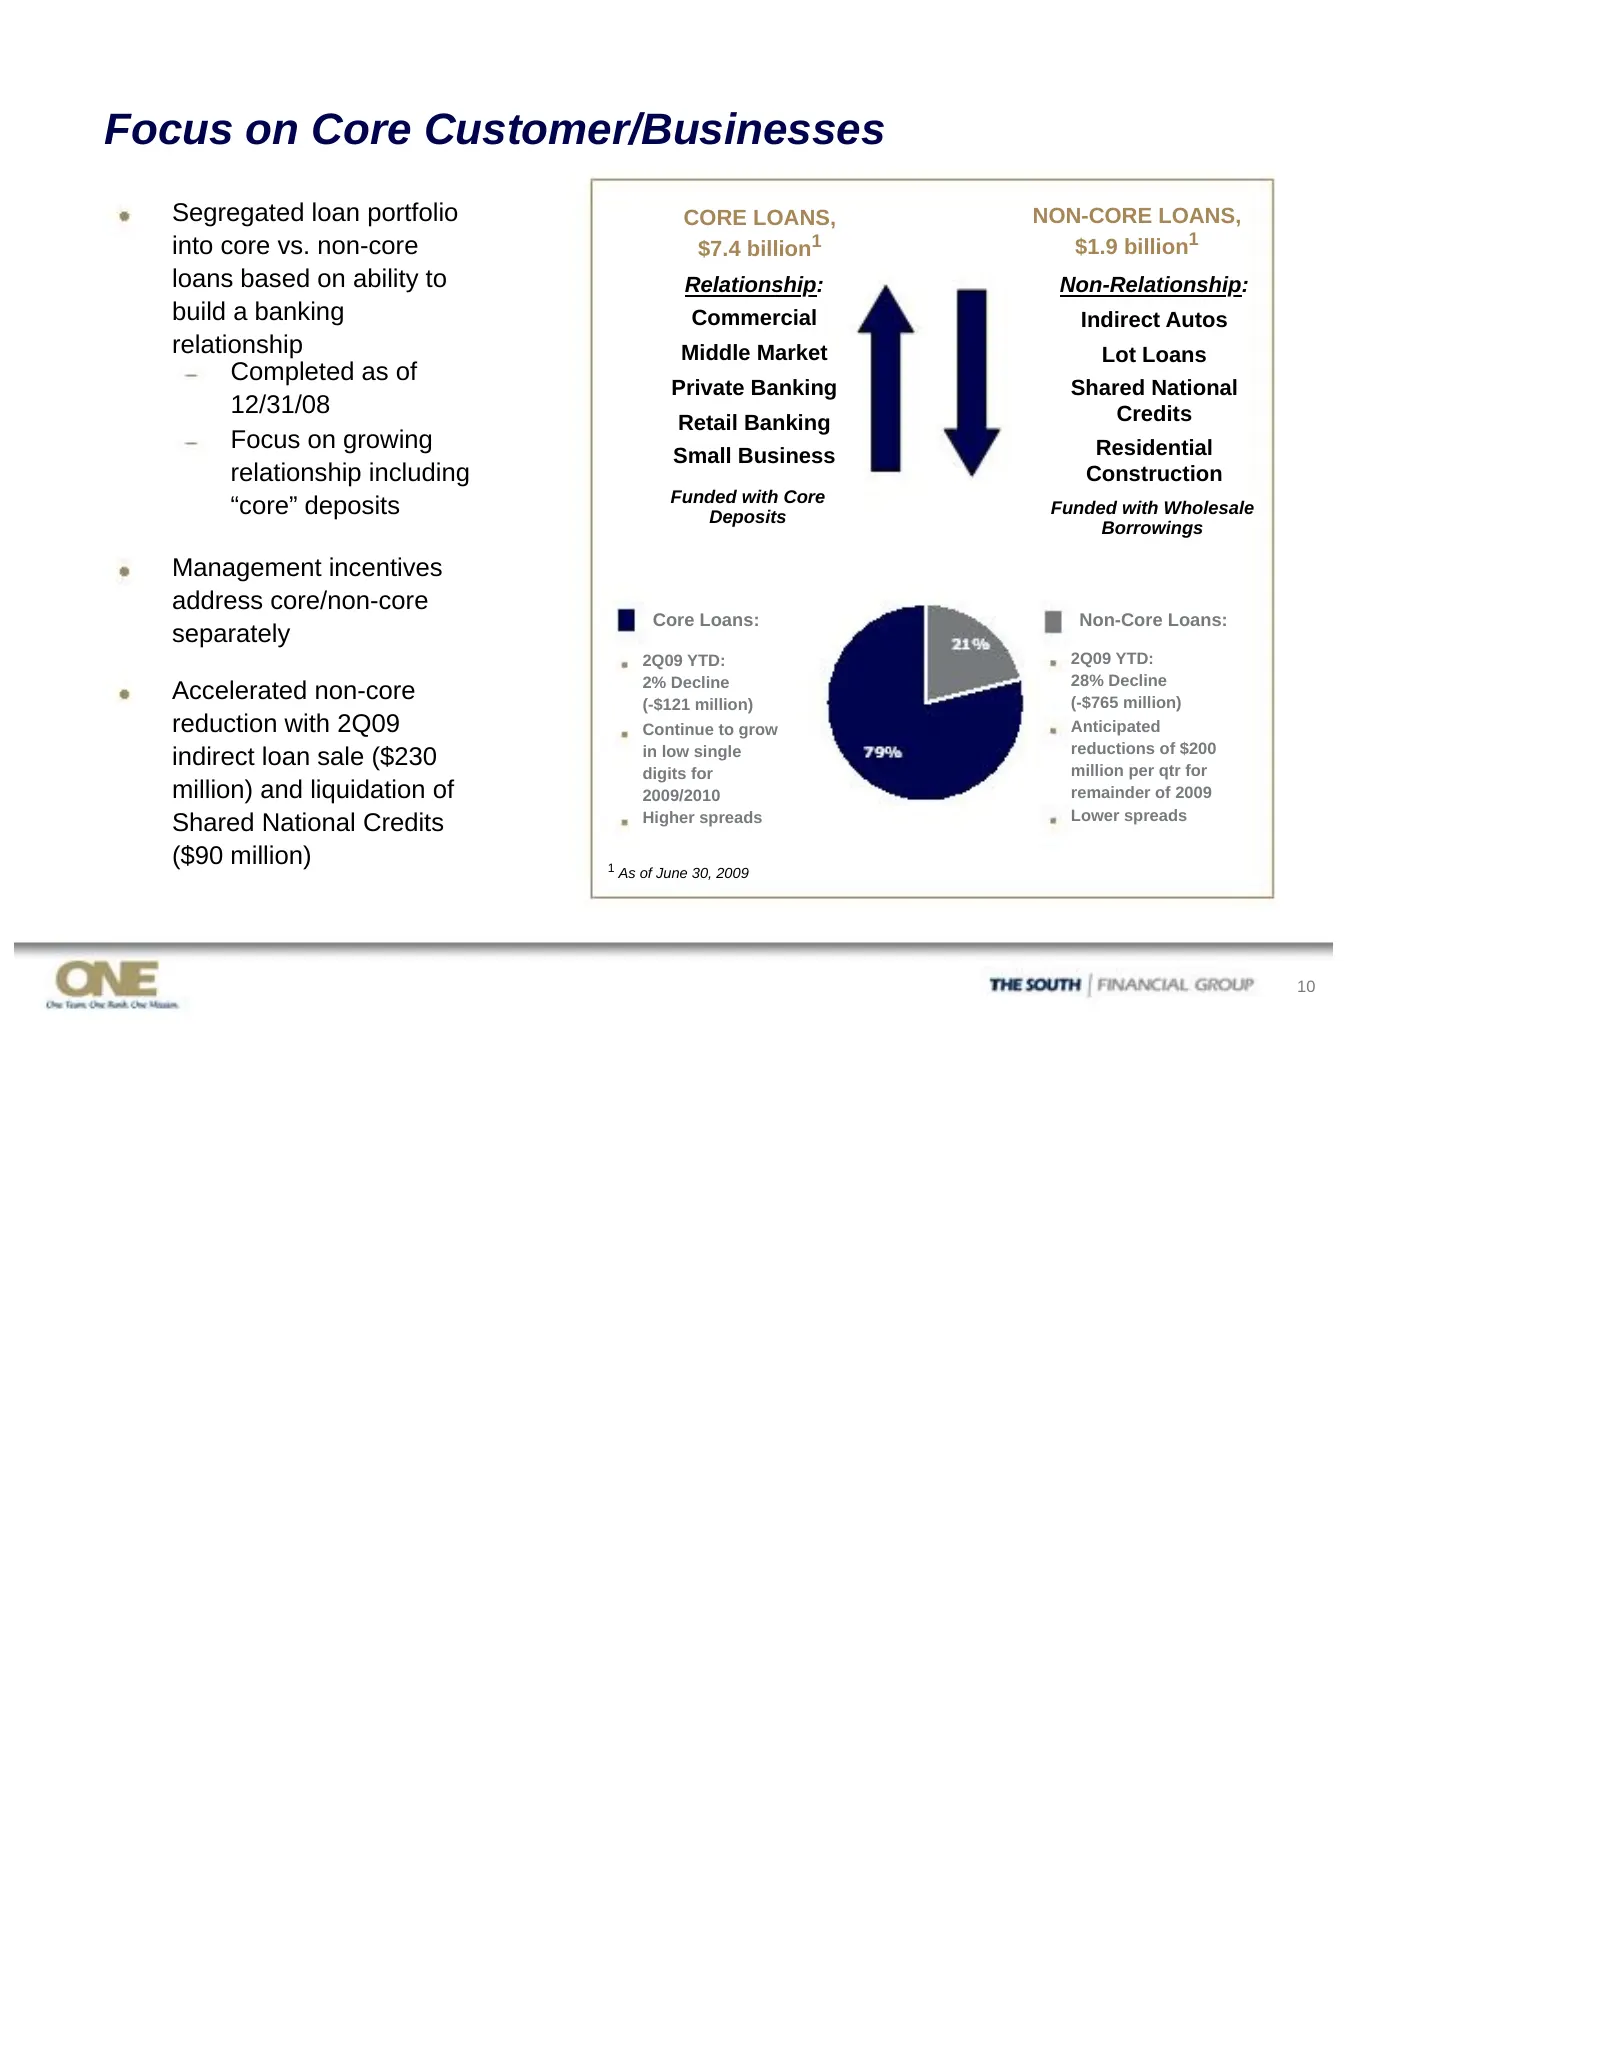
Focus on Core Customer/Businesses Segregated loan portfolio CORE LOANS, NON-CORE LOANS, into core vs. non-core $7.4 billion1 $1.9 billion1 loans based on ability to Relationship: Non-Relationship: build a banking Commercial Indirect Autos relationship Middle Market Lot Loans Completed as of Private
Slide 11: Net Interest Margin Opportunities
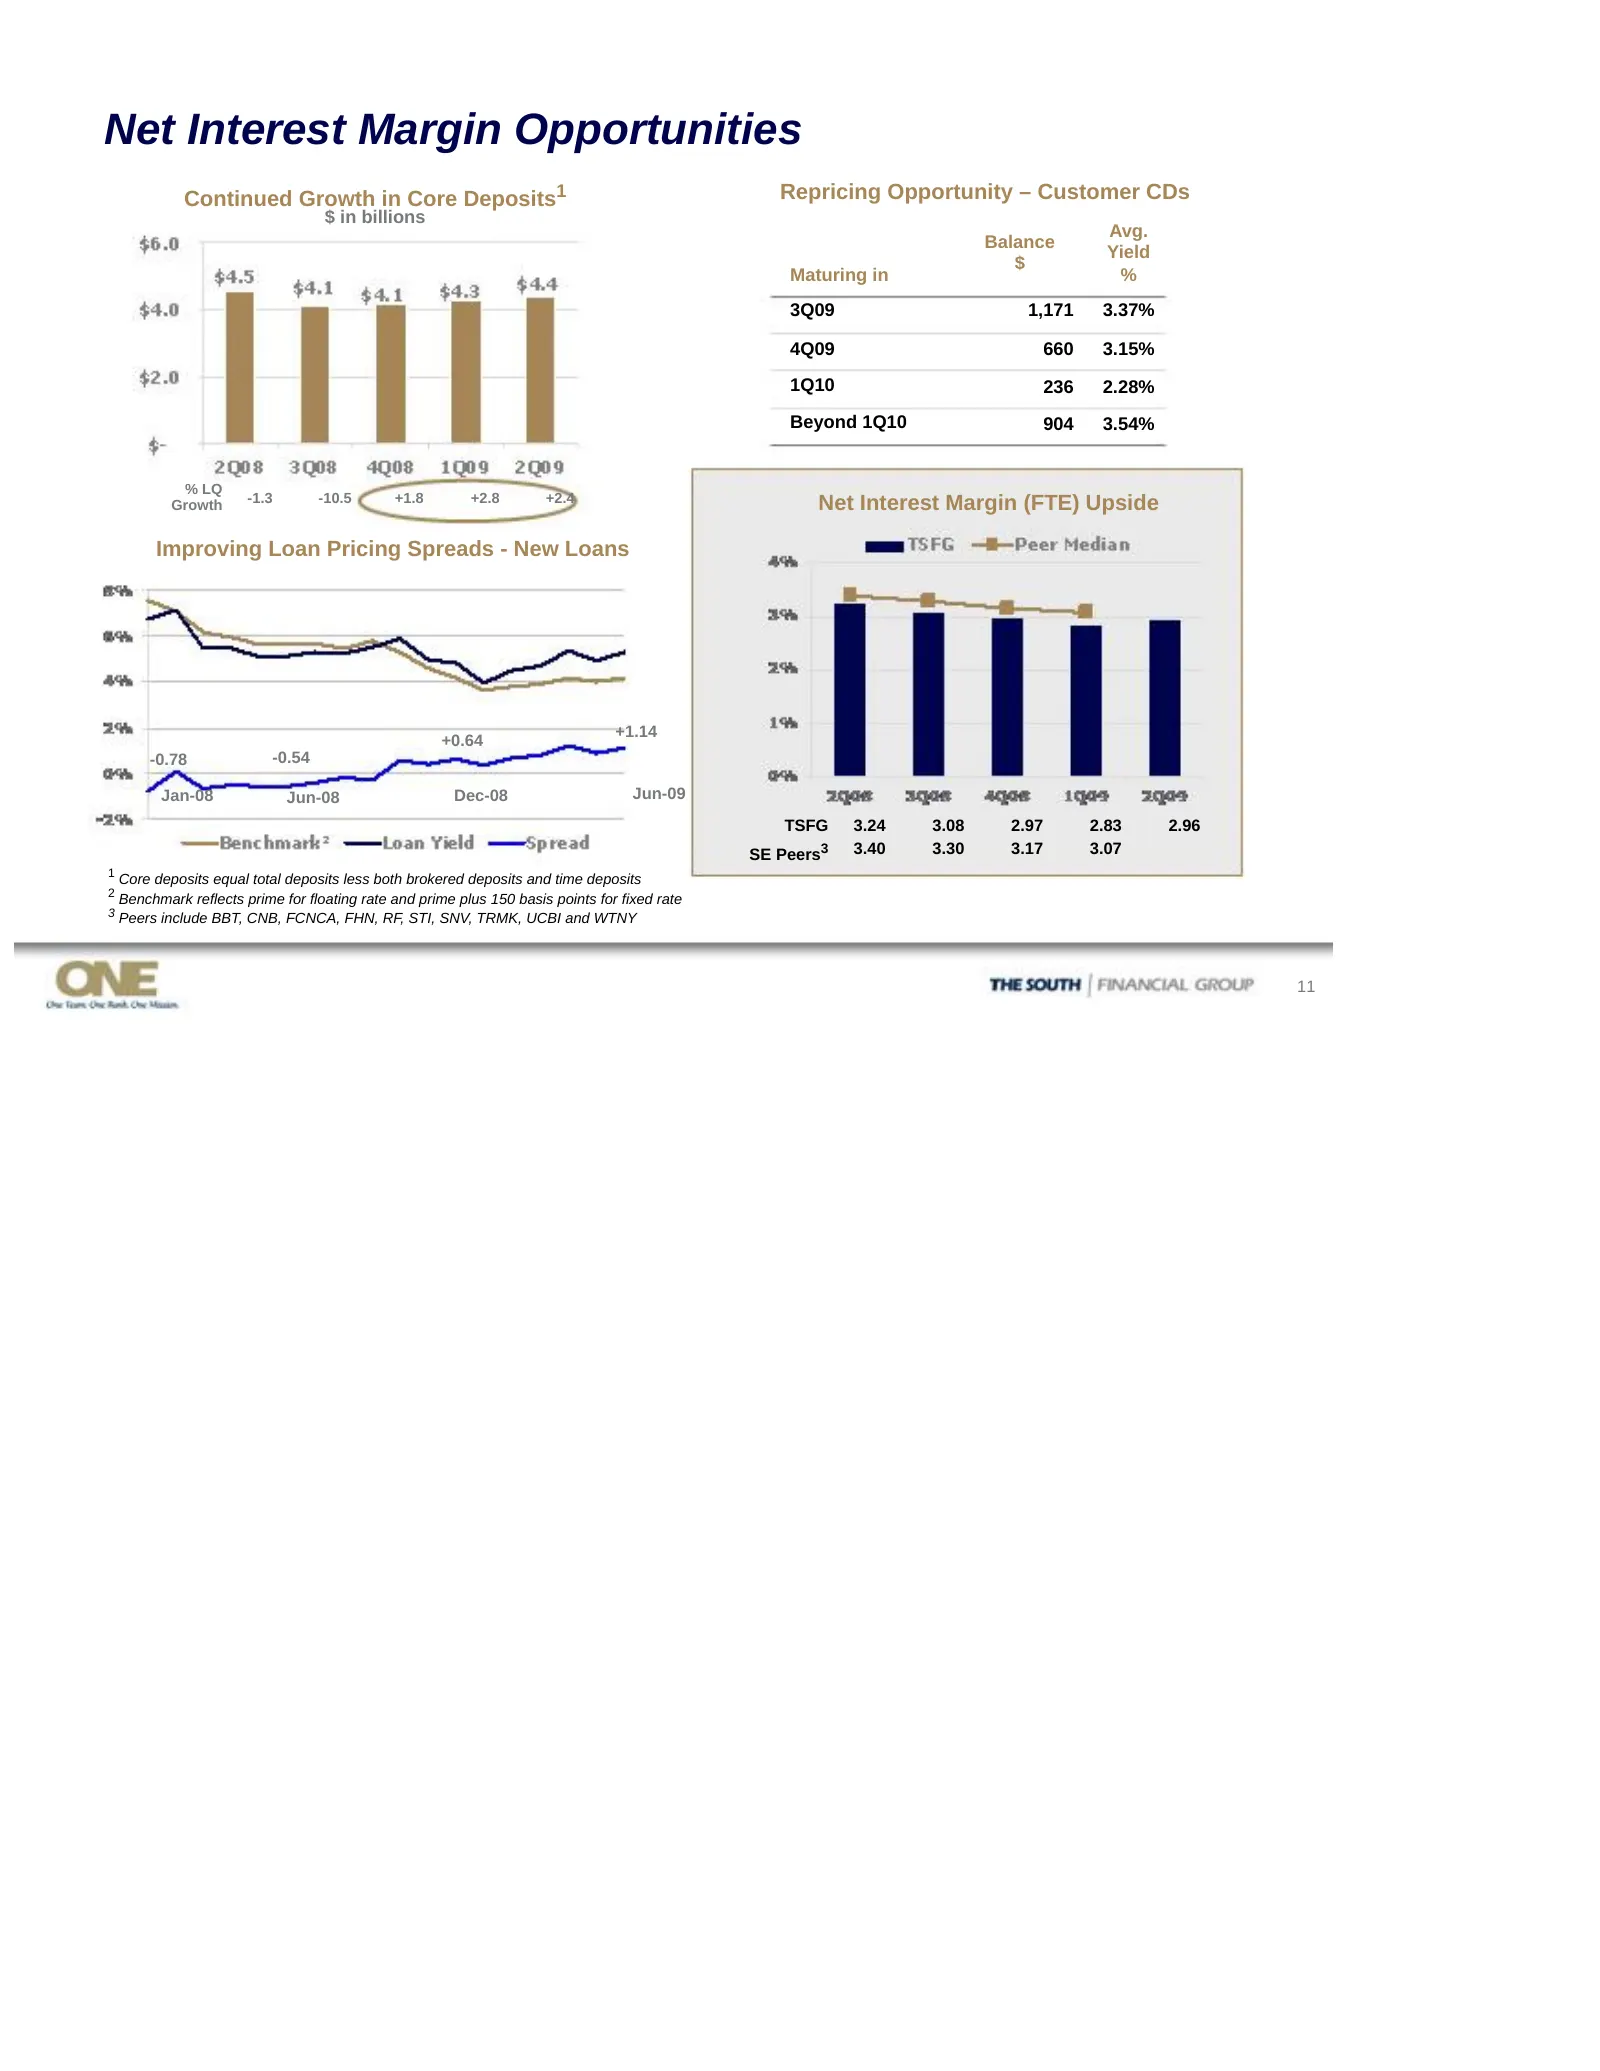
Net Interest Margin Opportunities Continued Growth in Core Deposits1 Repricing Opportunity – Customer CDs $ in billions Avg. Balance Yield $ Maturing in % 3Q09 1,171 3.37% 4Q09 660 3.15% 1Q10 236 2.28% Beyond 1Q10 904 3.54% % LQ -1.3 -10.5 +1.8 +2.8 +2.4 Growth Net Interest Margin (FTE) Upside Impro
Slide 12: Noninterest Expense Control
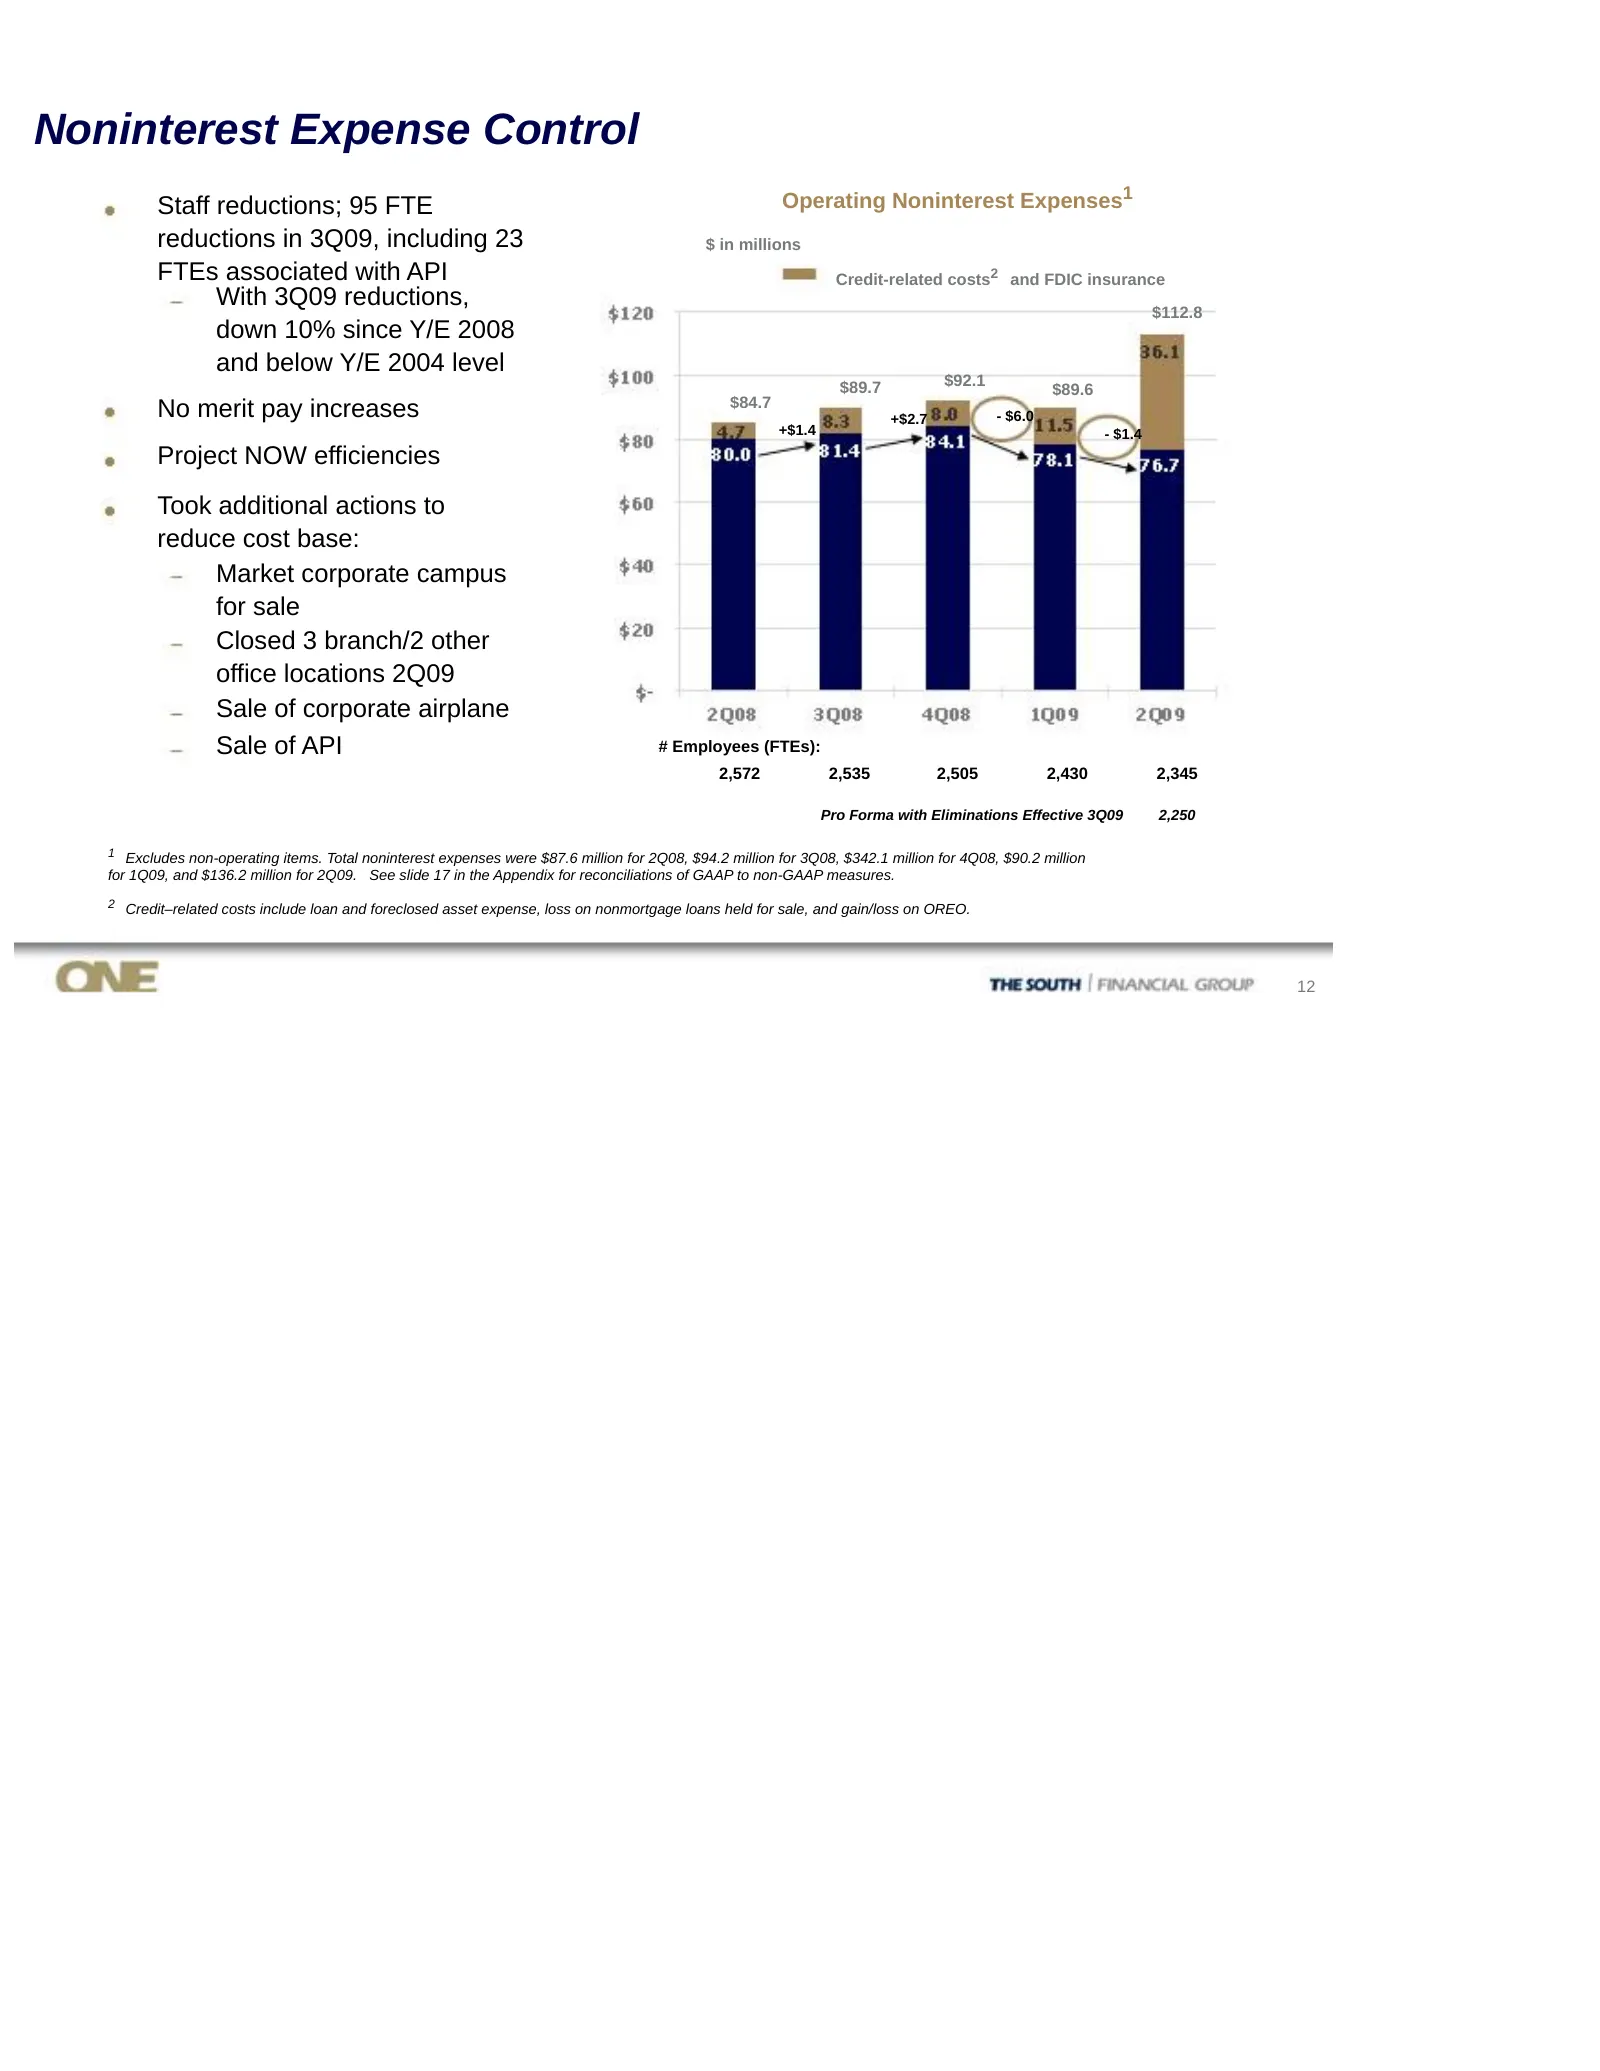
Noninterest Expense Control Staff reductions; 95 FTE Operating Noninterest Expenses1 reductions in 3Q09, including 23 $ in millions FTEs associated with API Credit-related costs2 and FDIC insurance With 3Q09 reductions, $112.8 down 10% since Y/E 2008 and below Y/E 2004 level $89.7 $92.1 $89.6 $84.7
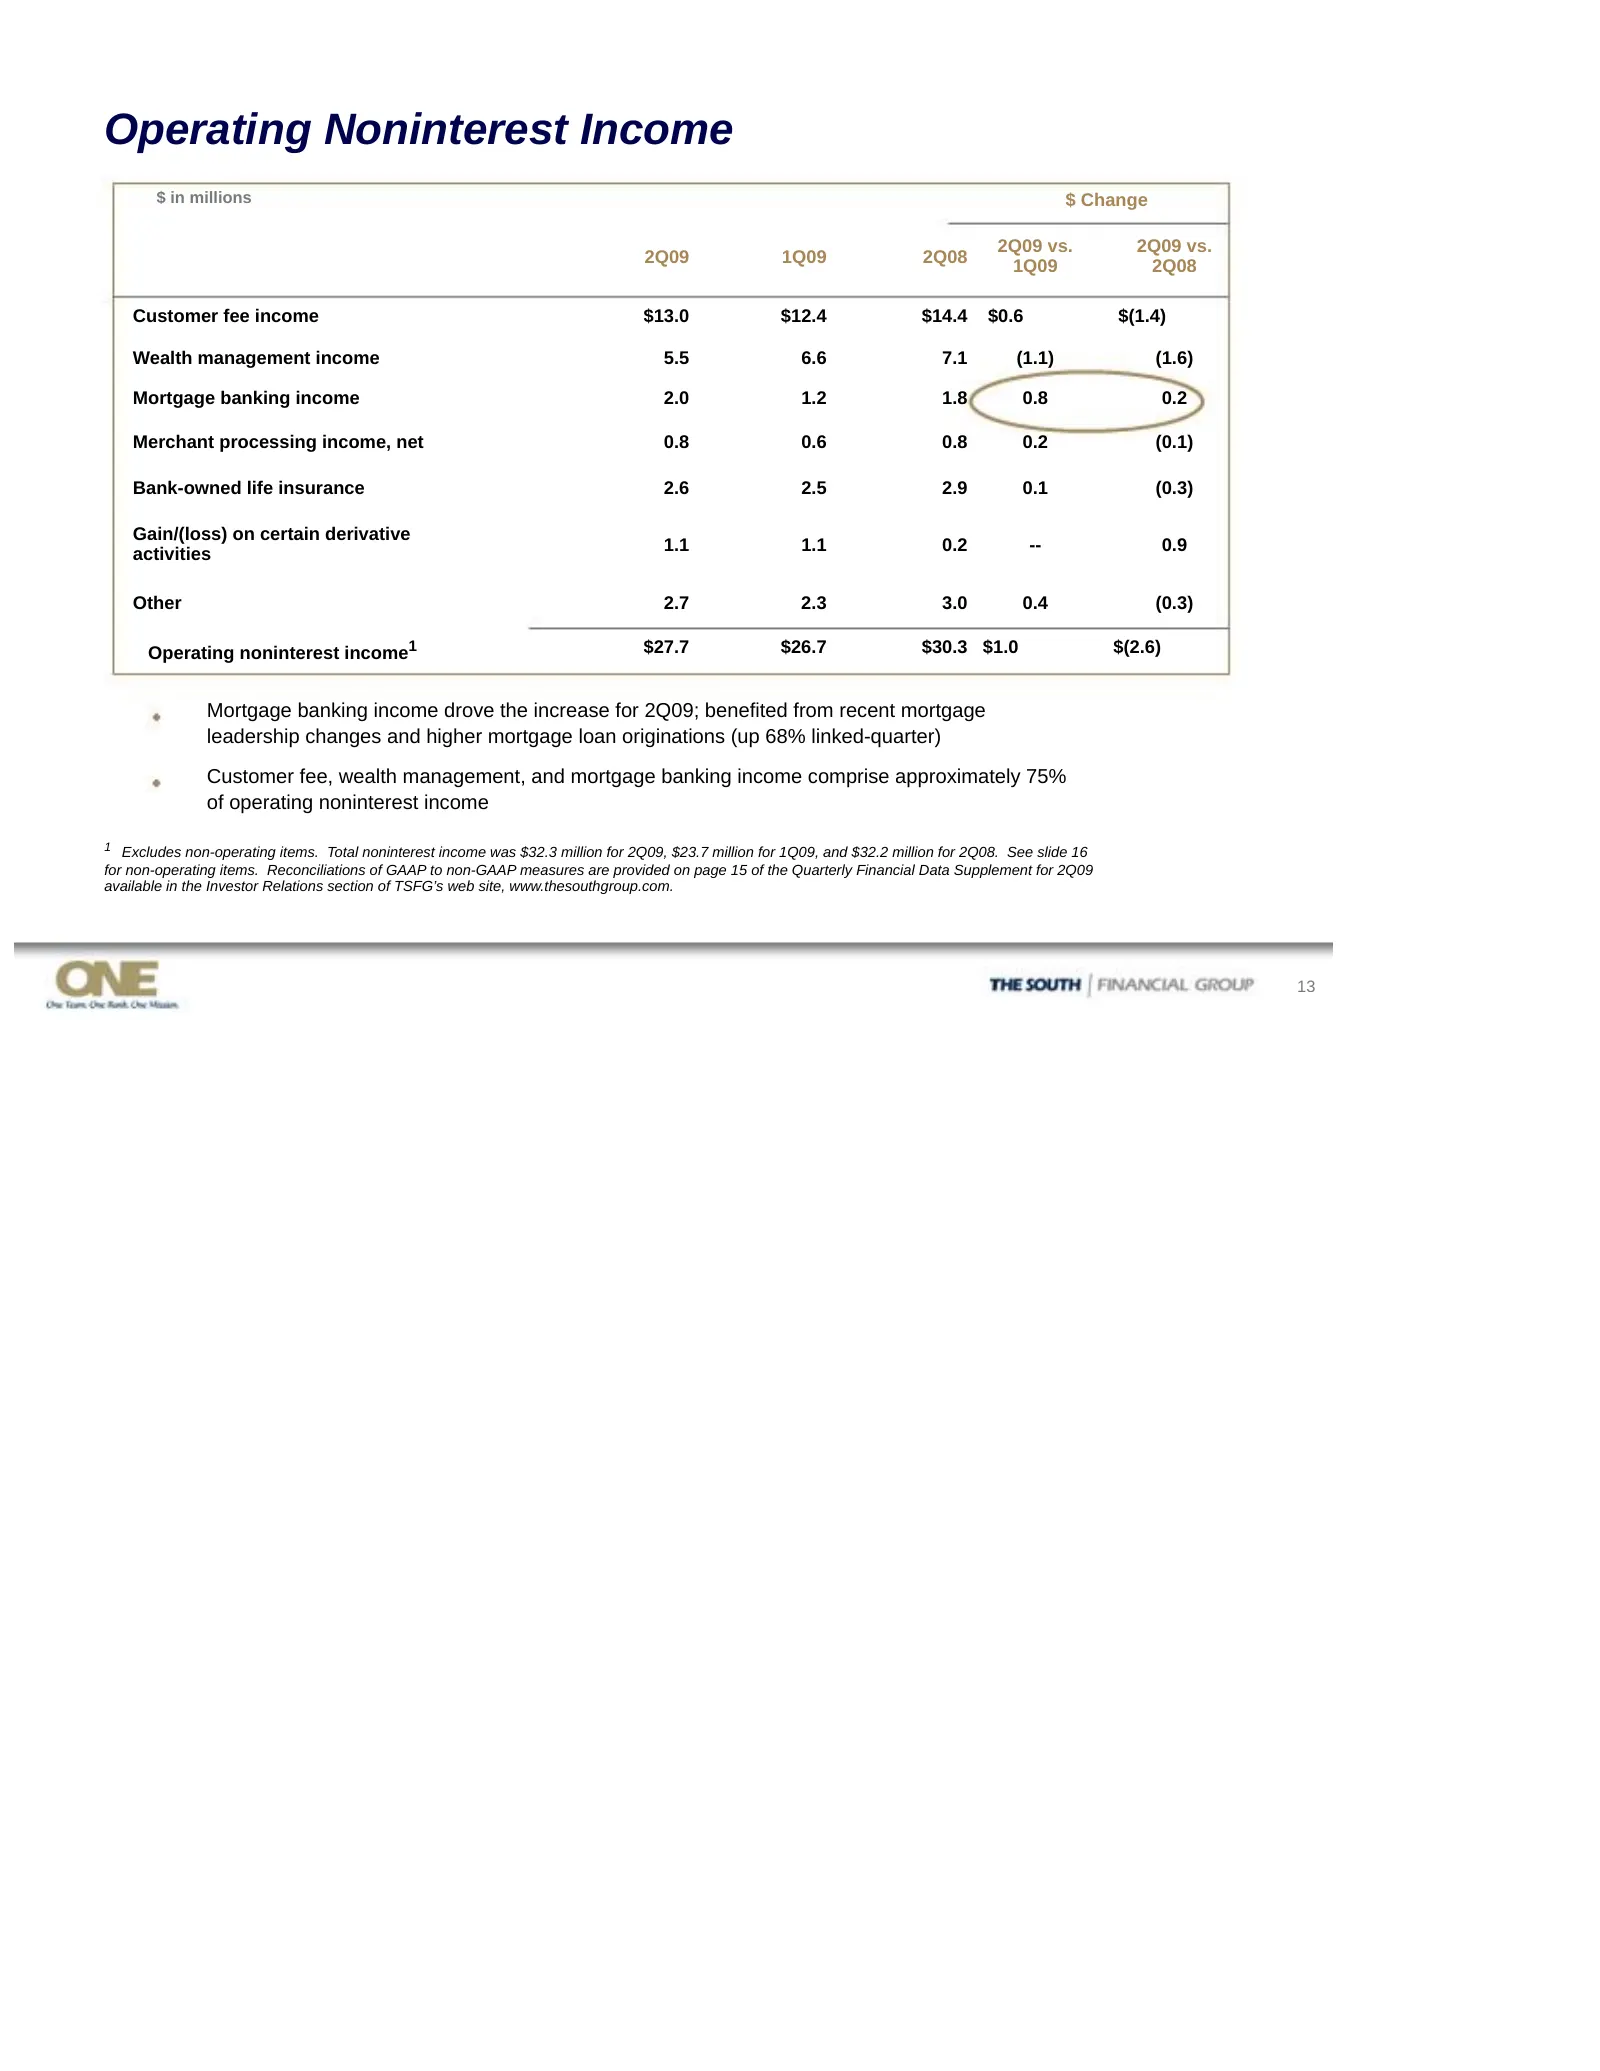
Slide 13: Operating Noninterest Income
Operating Noninterest Income $ in millions $ Change 2Q09 vs. 2Q09 vs. 2Q09 1Q09 2Q08 1Q09 2Q08 Customer fee income $13.0 $12.4 $14.4 $0.6 $(1.4) Wealth management income 5.5 6.6 7.1 (1.1) (1.6) Mortgage banking income 2.0 1.2 1.8 0.8 0.2 Merchant processing income, net 0.8 0.6 0.8 0.2 (0.1) Bank-own
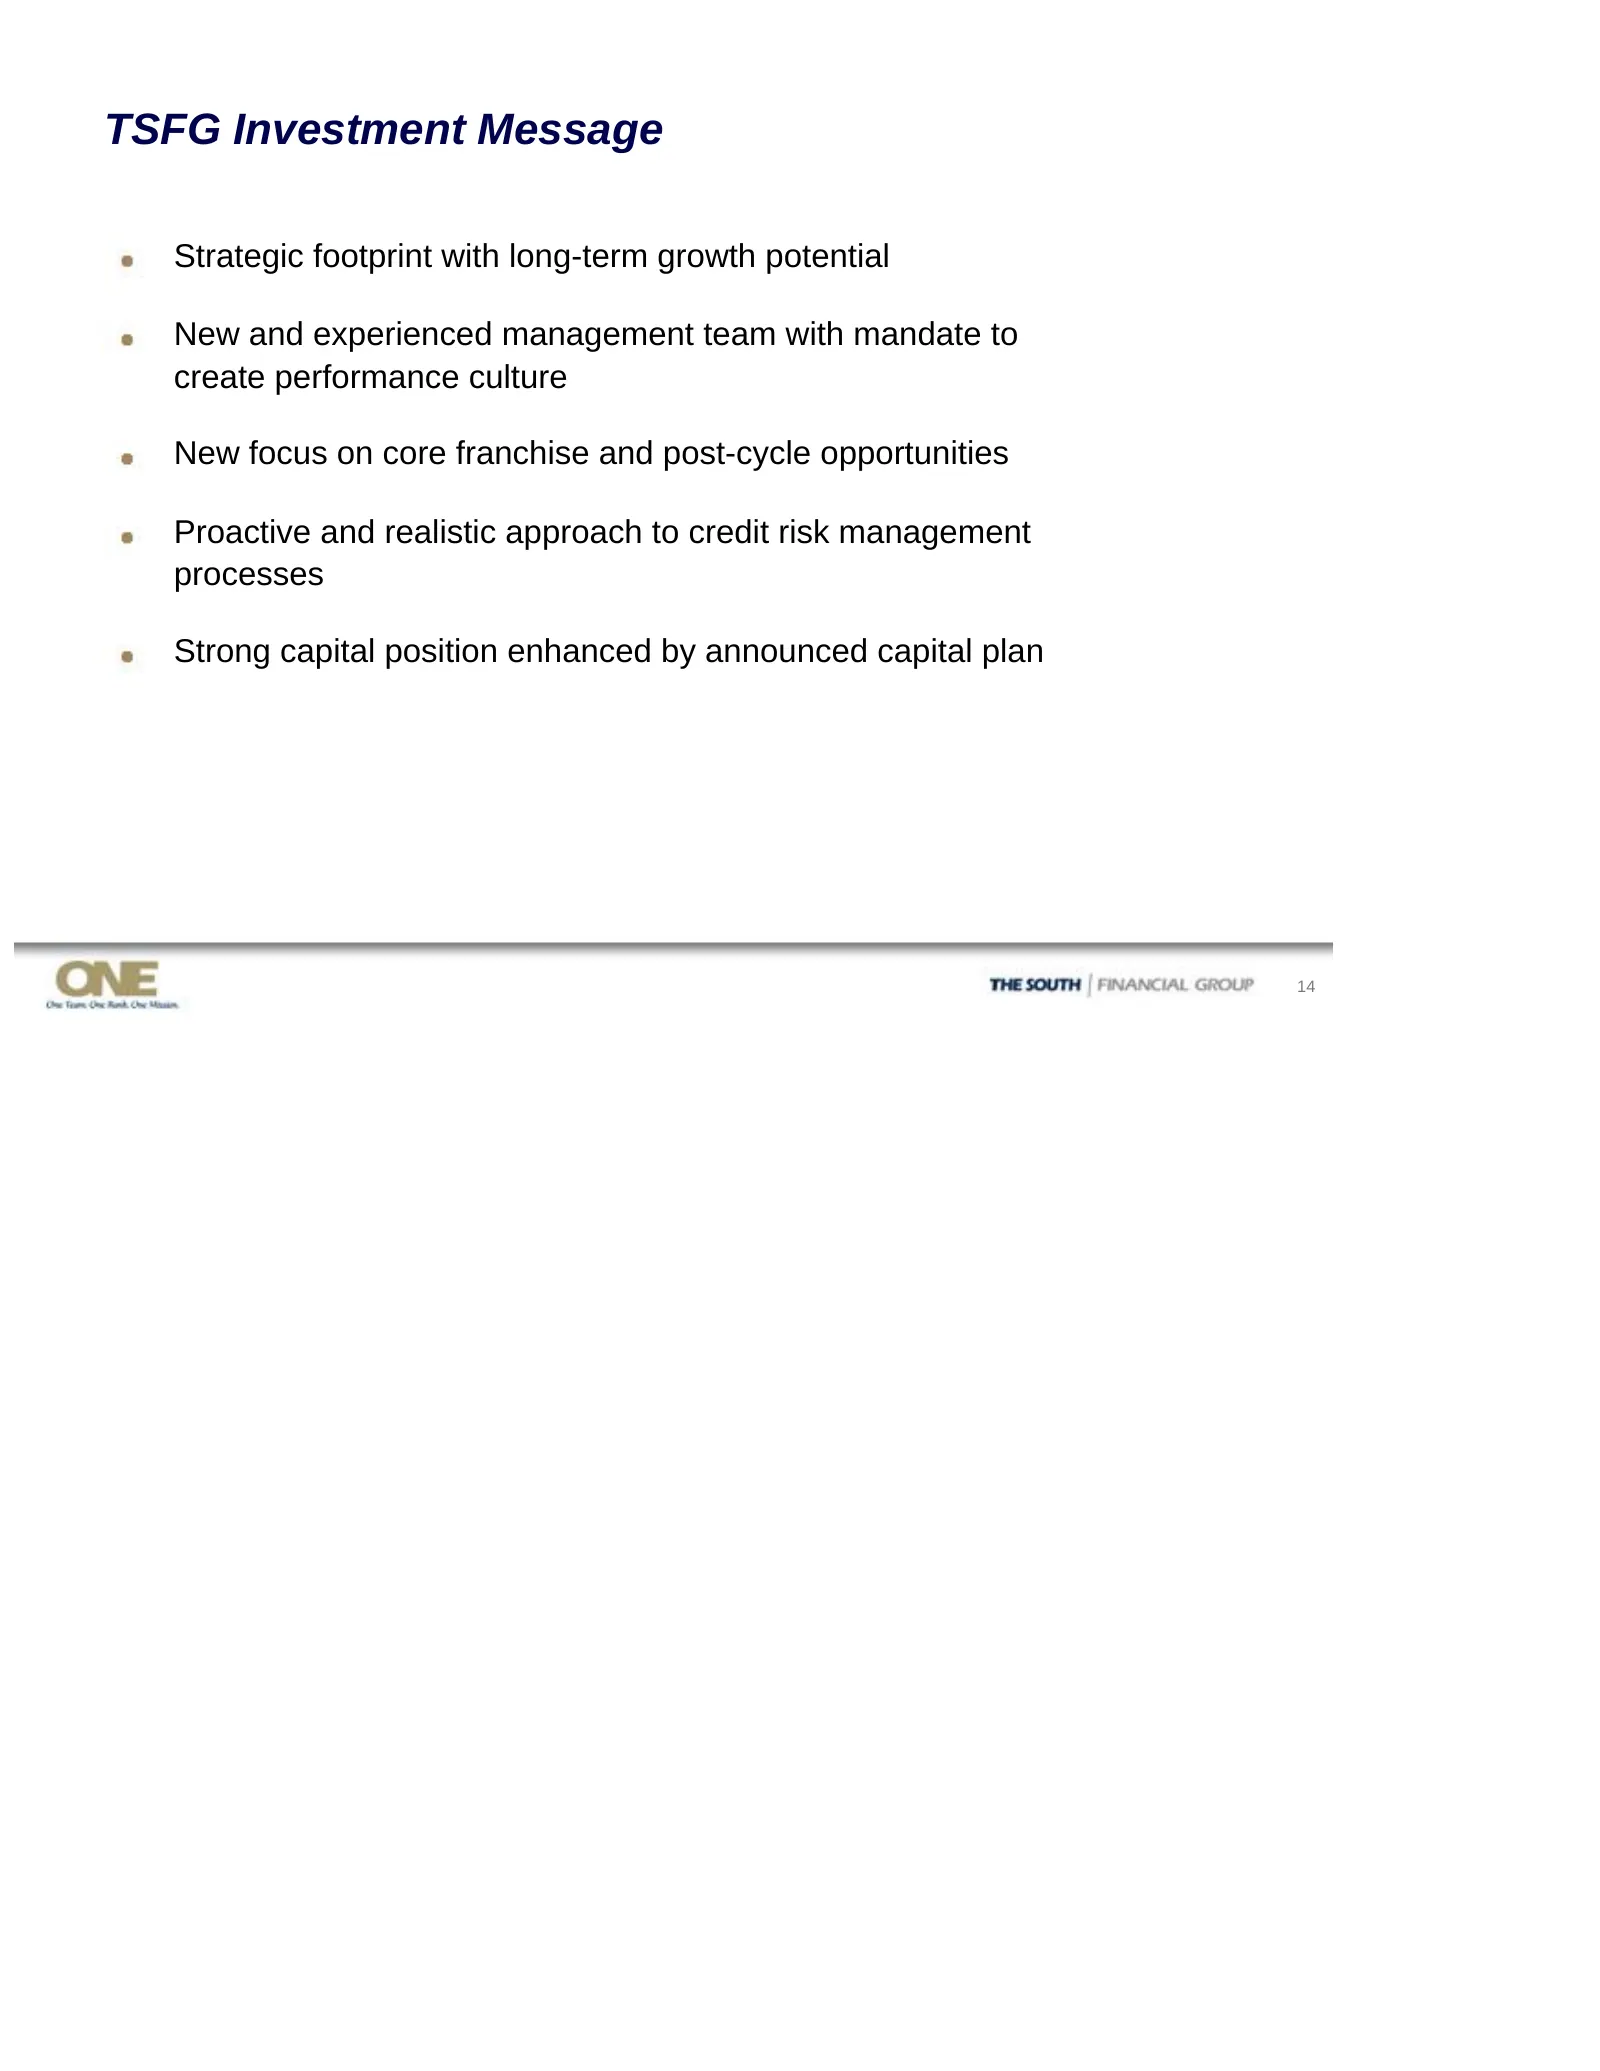
Slide 14: TSFG Investment Message
TSFG Investment Message Strategic footprint with long-term growth potential New and experienced management team with mandate to create performance culture New focus on core franchise and post-cycle opportunities Proactive and realistic approach to credit risk management processes Strong capital posi
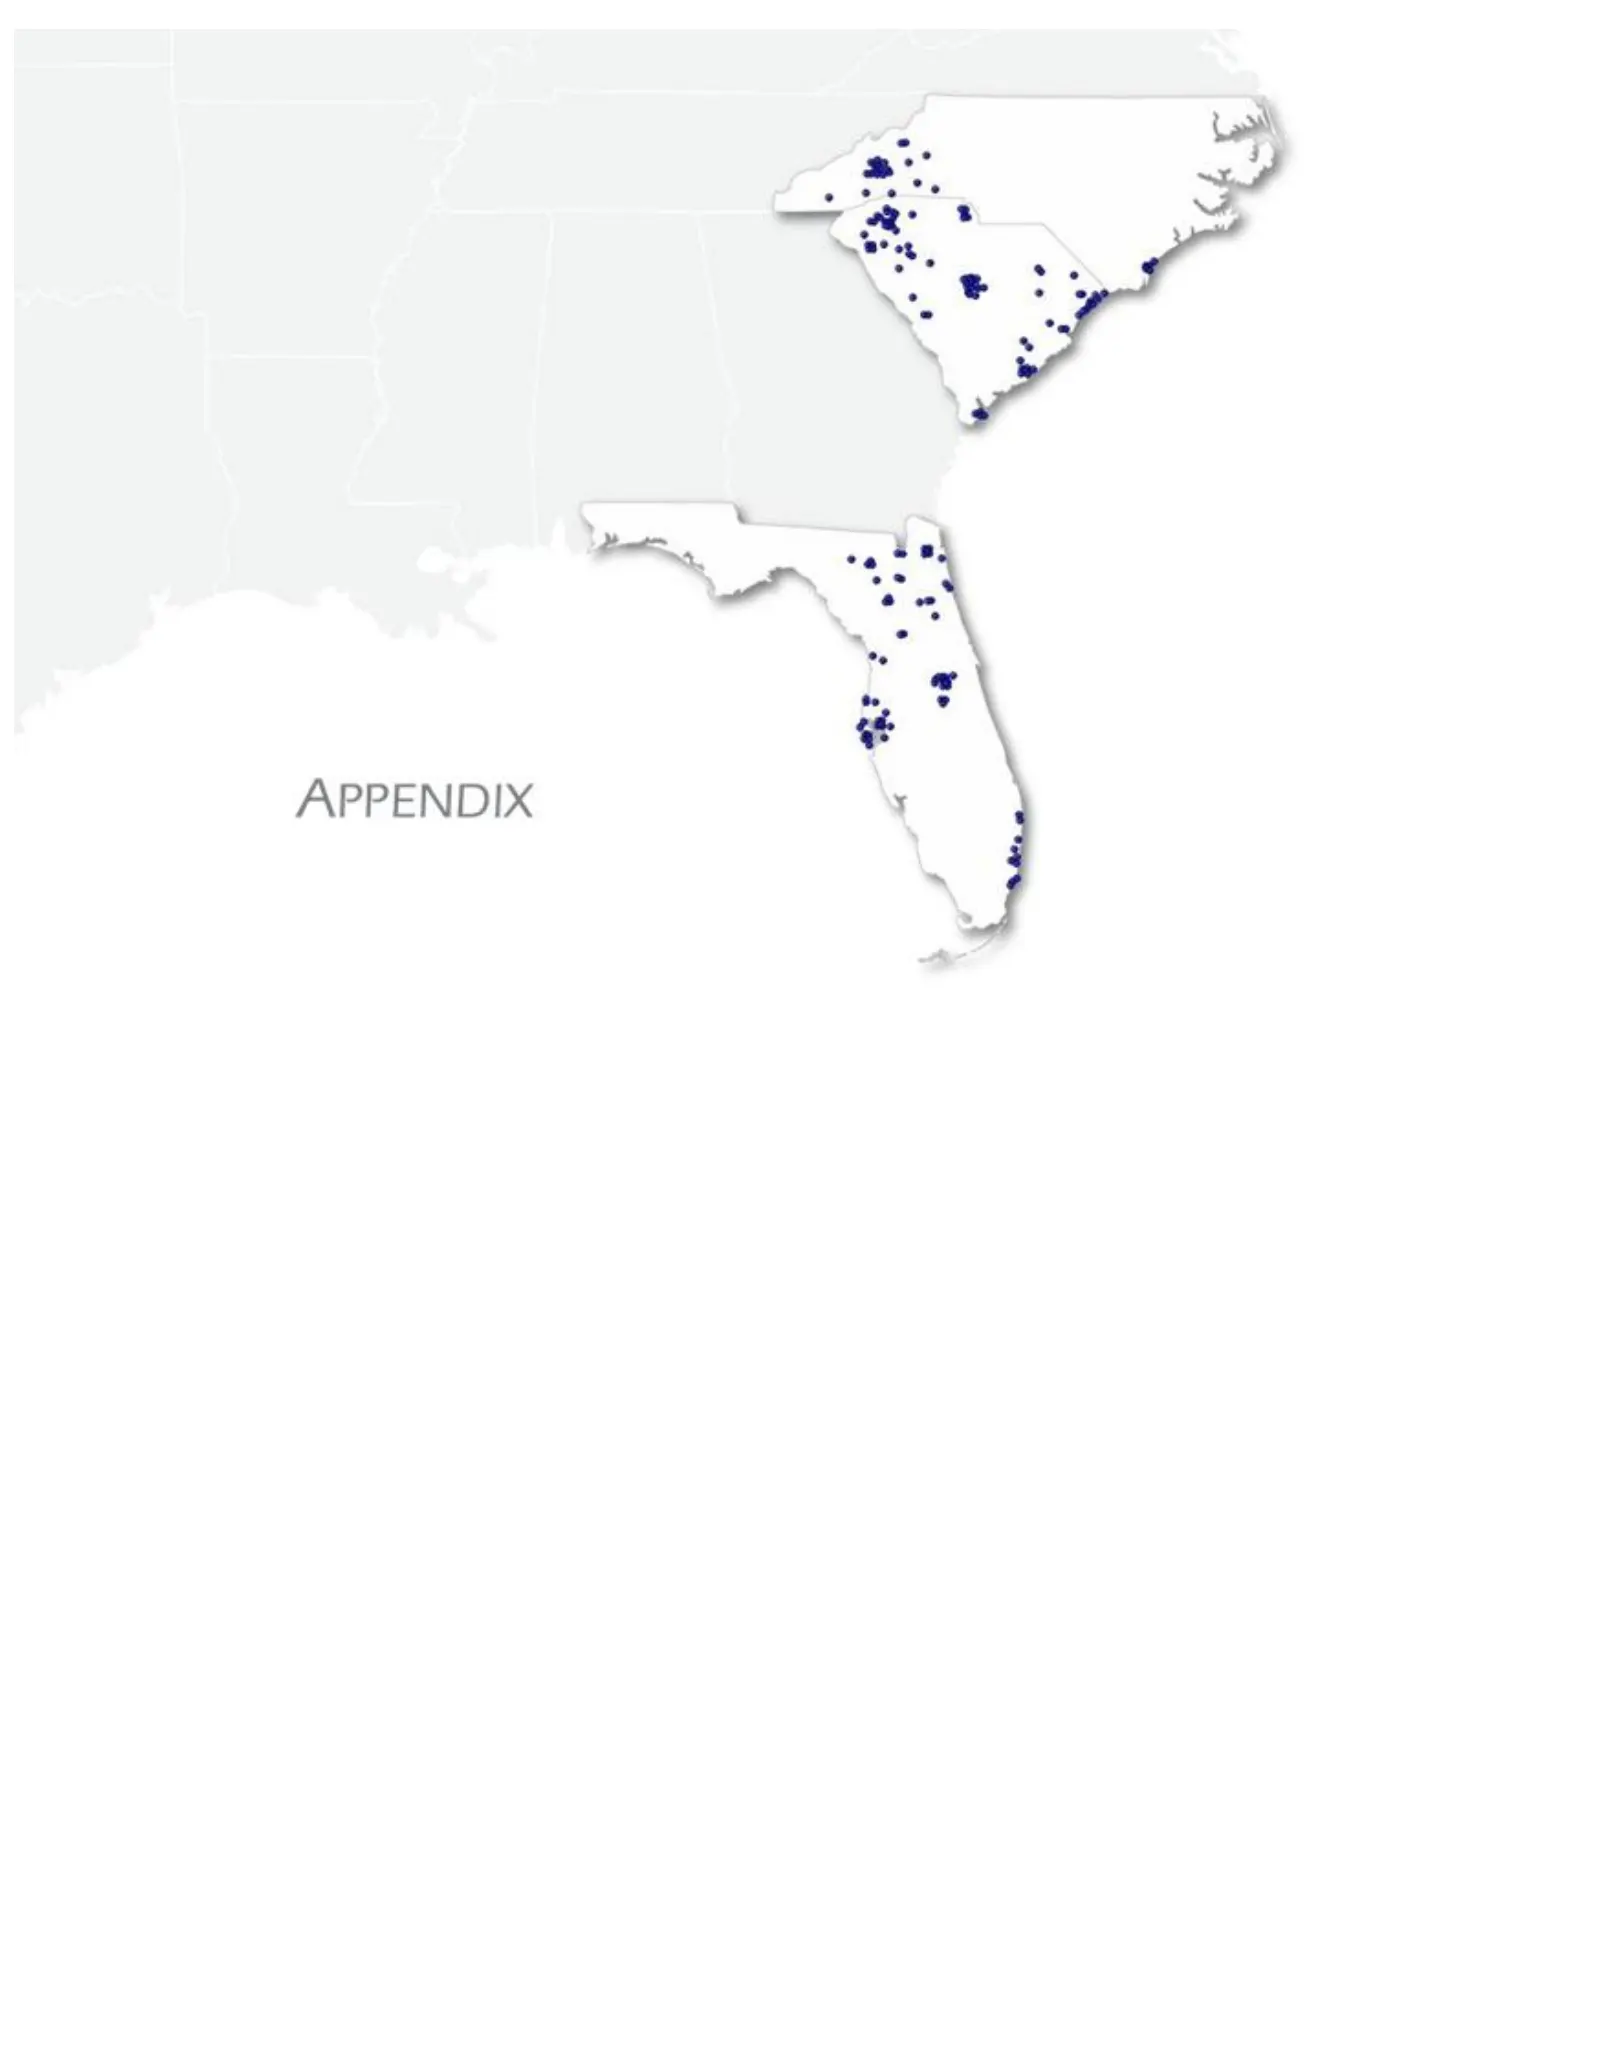
Slide 15: Appendix
APPENDIX 7
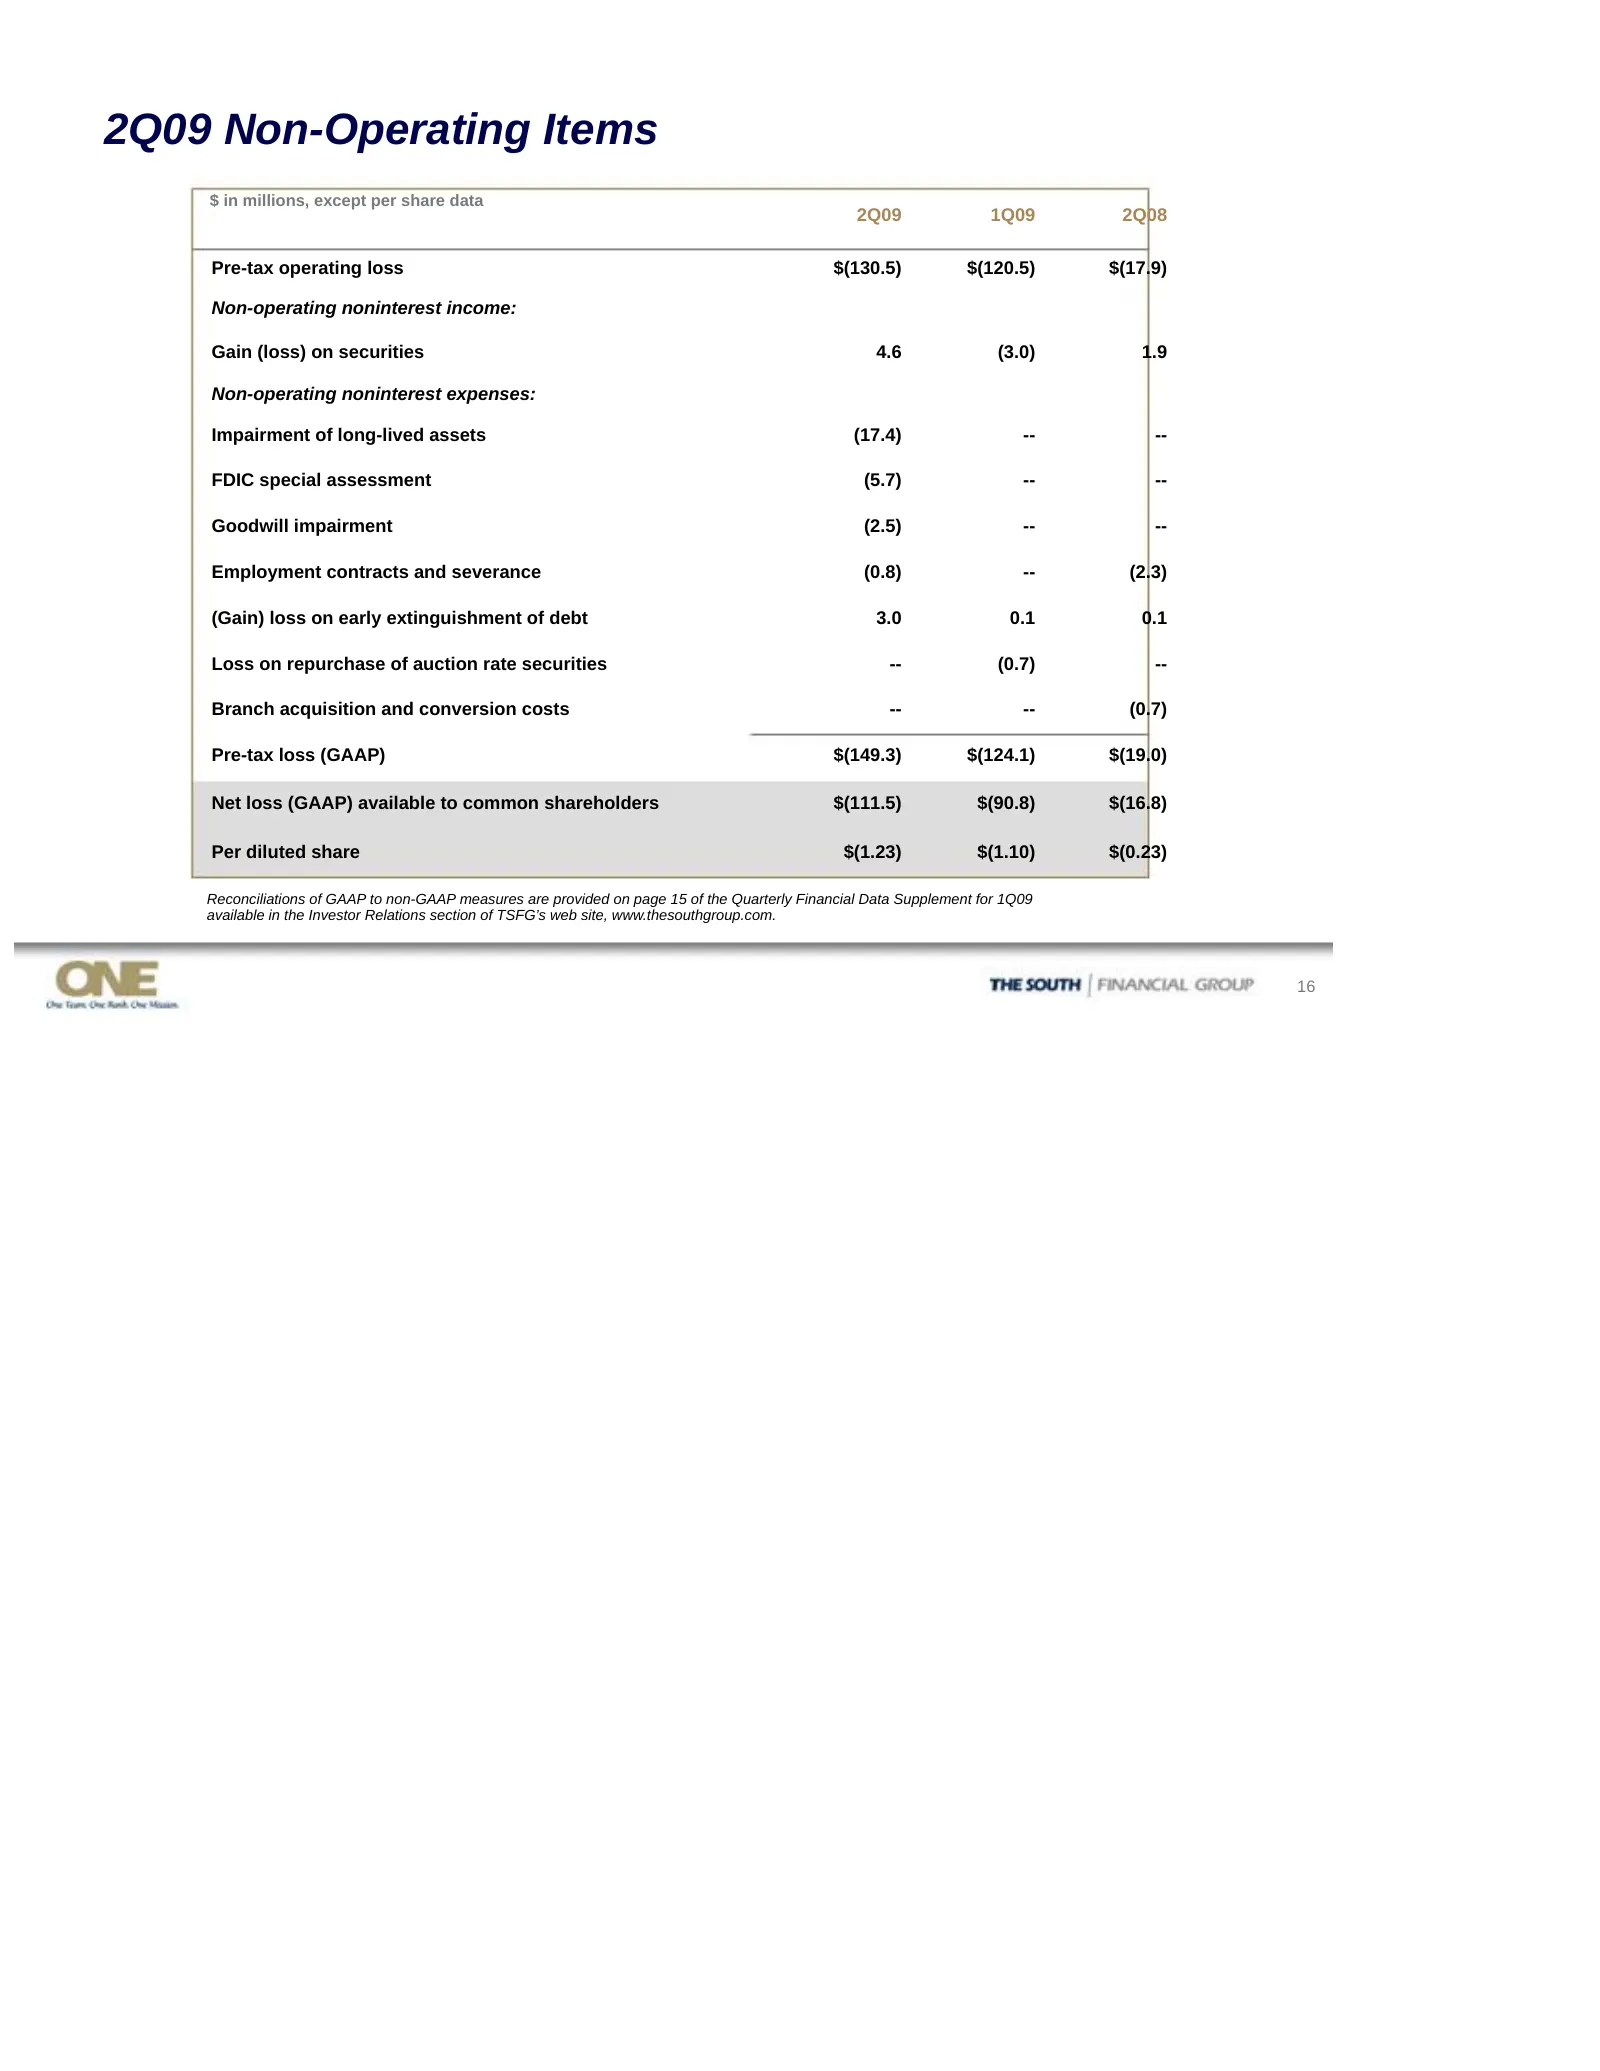
Slide 16: 2Q09 Non-Operating Items
2Q09 Non-Operating Items $ in millions, except per share data 2Q09 1Q09 2Q08 Pre-tax operating loss $(130.5) $(120.5) $(17.9) Non-operating noninterest income: Gain (loss) on securities 4.6 (3.0) 1.9 Non-operating noninterest expenses: Impairment of long-lived assets (17.4) -- -- FDIC special assess
Slide 17: Reconciliations of GAAP to Non-GAAP Measures
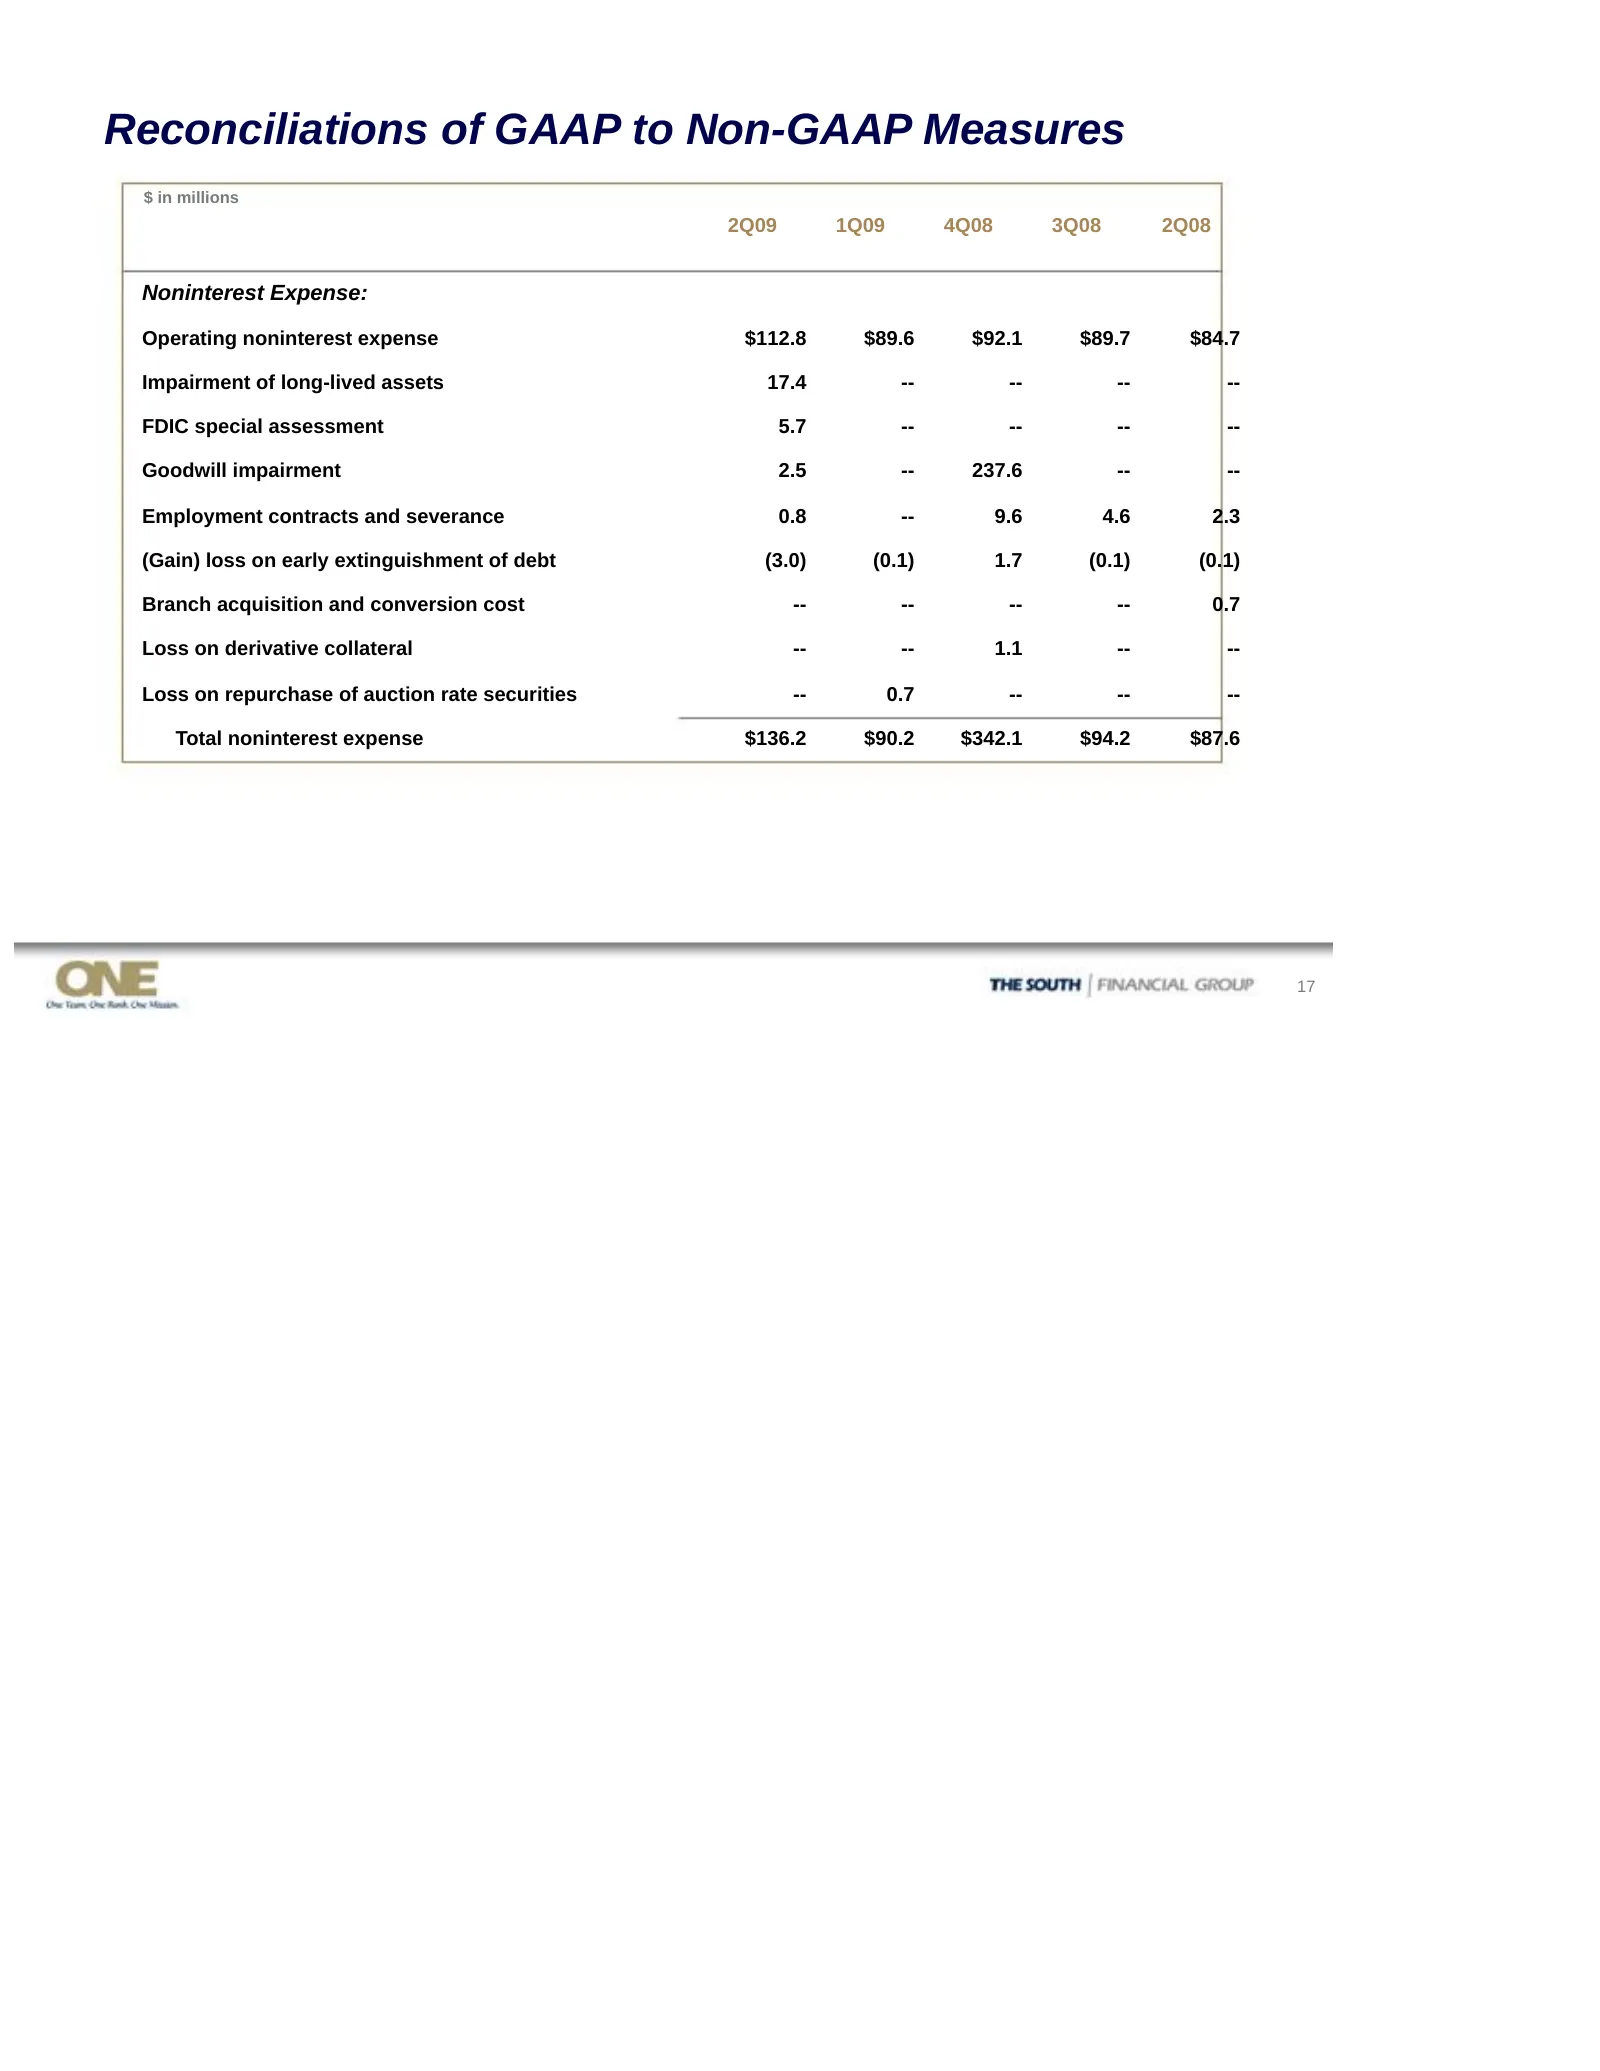
Reconciliations of GAAP to Non-GAAP Measures $ in millions 2Q09 1Q09 4Q08 3Q08 2Q08 Noninterest Expense: Operating noninterest expense $112.8 $89.6 $92.1 $89.7 $84.7 Impairment of long-lived assets 17.4 -- -- -- -- FDIC special assessment 5.7 -- -- -- -- Goodwill impairment 2.5 -- 237.6 -- -- Employ
Slide 18: Capital Position
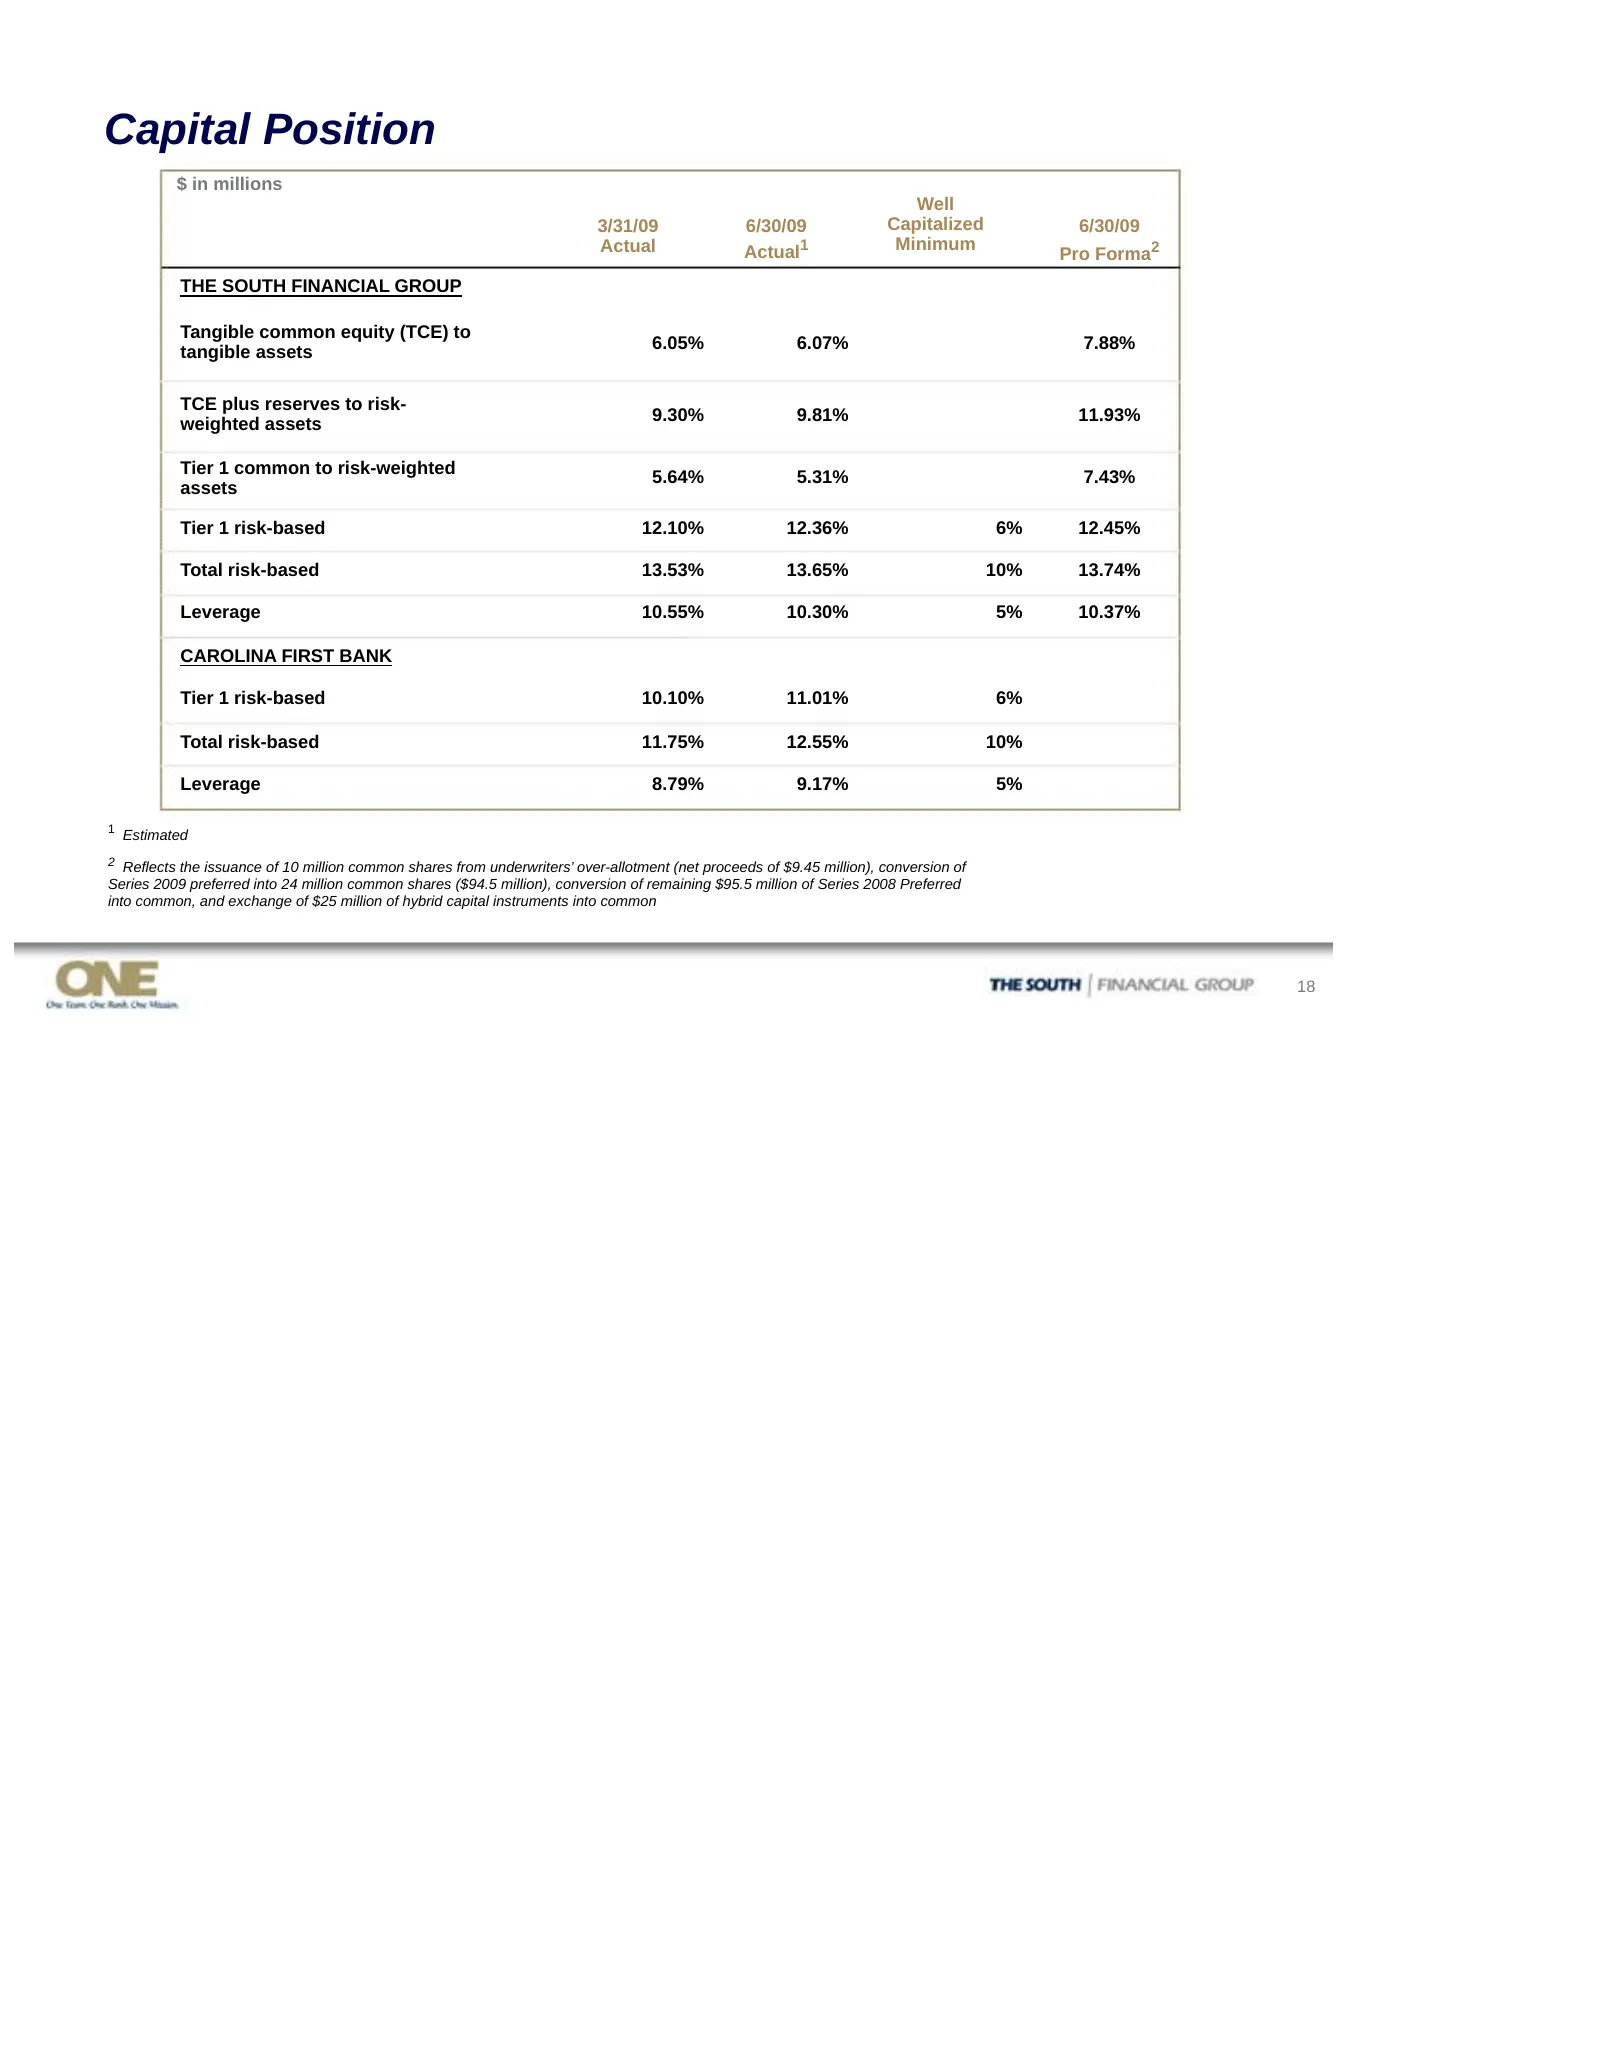
Capital Position $ in millions Well 3/31/09 6/30/09 Capitalized 6/30/09 Actual Actual1 Minimum Pro Forma2 THE SOUTH FINANCIAL GROUP Tangible common equity (TCE) to 6.05% 6.07% 7.88% tangible assets TCE plus reserves to risk- 9.30% 9.81% 11.93% weighted assets Tier 1 common to risk-weighted 5.64% 5.3
Slide 19: Loan and Credit Quality Composition
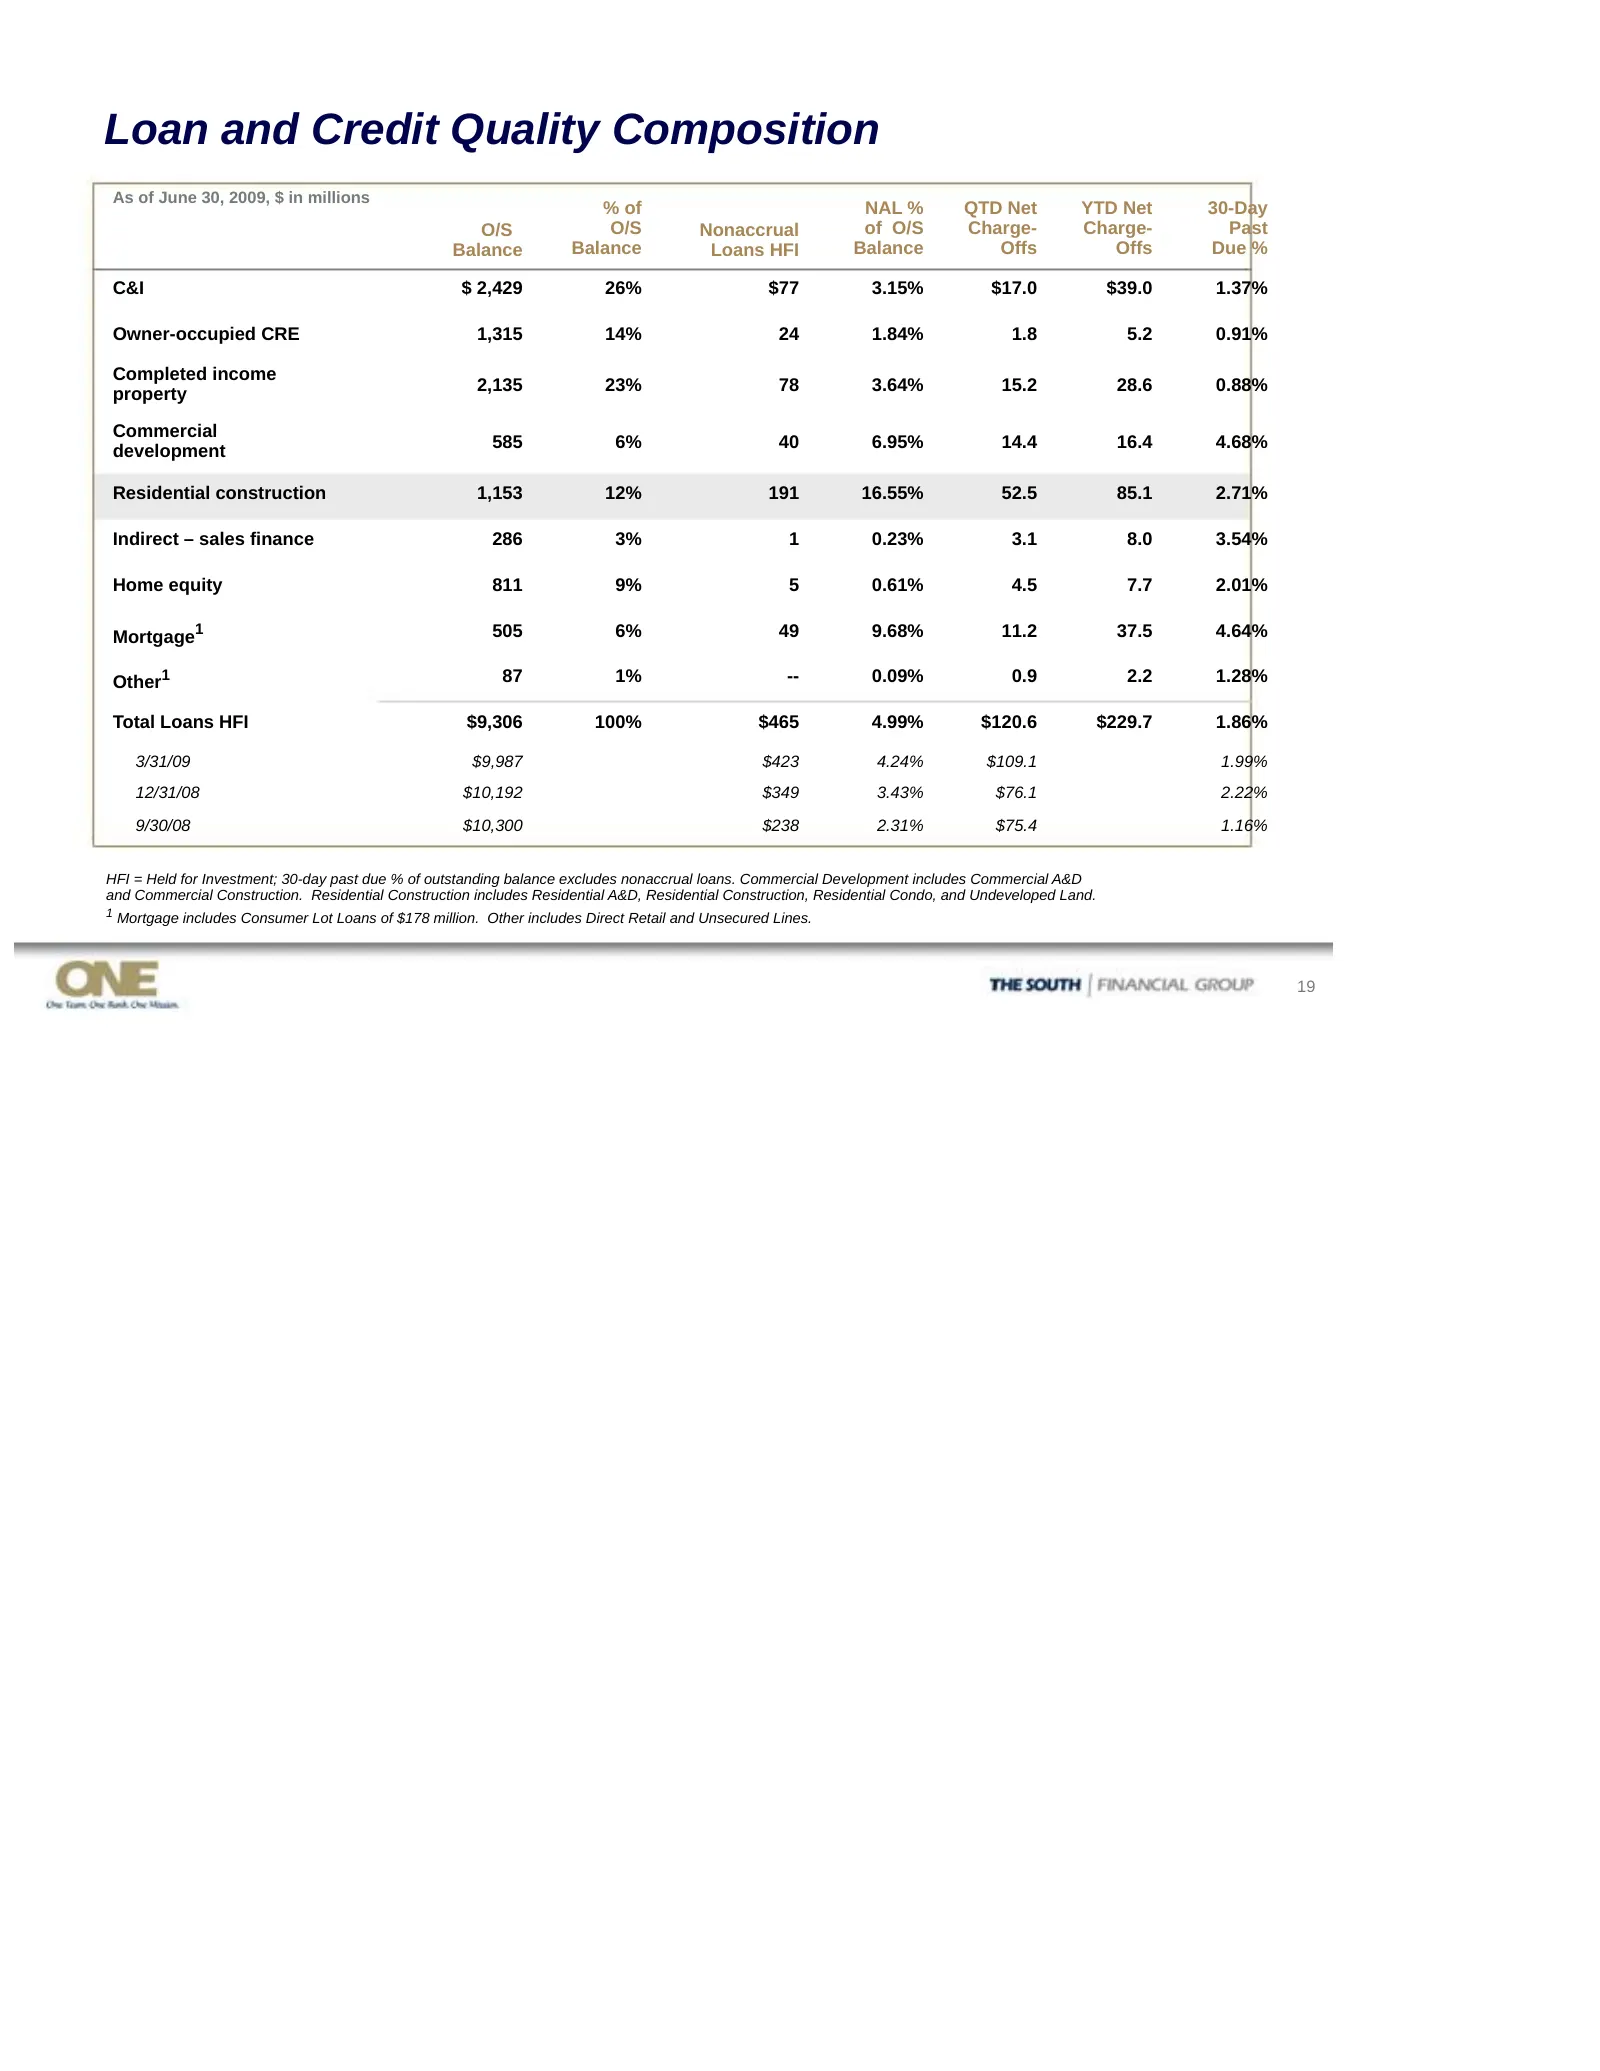
Loan and Credit Quality Composition As of June 30, 2009, $ in millions % of NAL % QTD Net YTD Net 30-Day O/S O/S Nonaccrual of O/S Charge- Charge- Past Balance Balance Loans HFI Balance Offs Offs Due % C&I $ 2,429 26% $77 3.15% $17.0 $39.0 1.37% Owner-occupied CRE 1,315 14% 24 1.84% 1.8 5.2 0.91% Co
Slide 20: Credit Quality Trends - Commercial
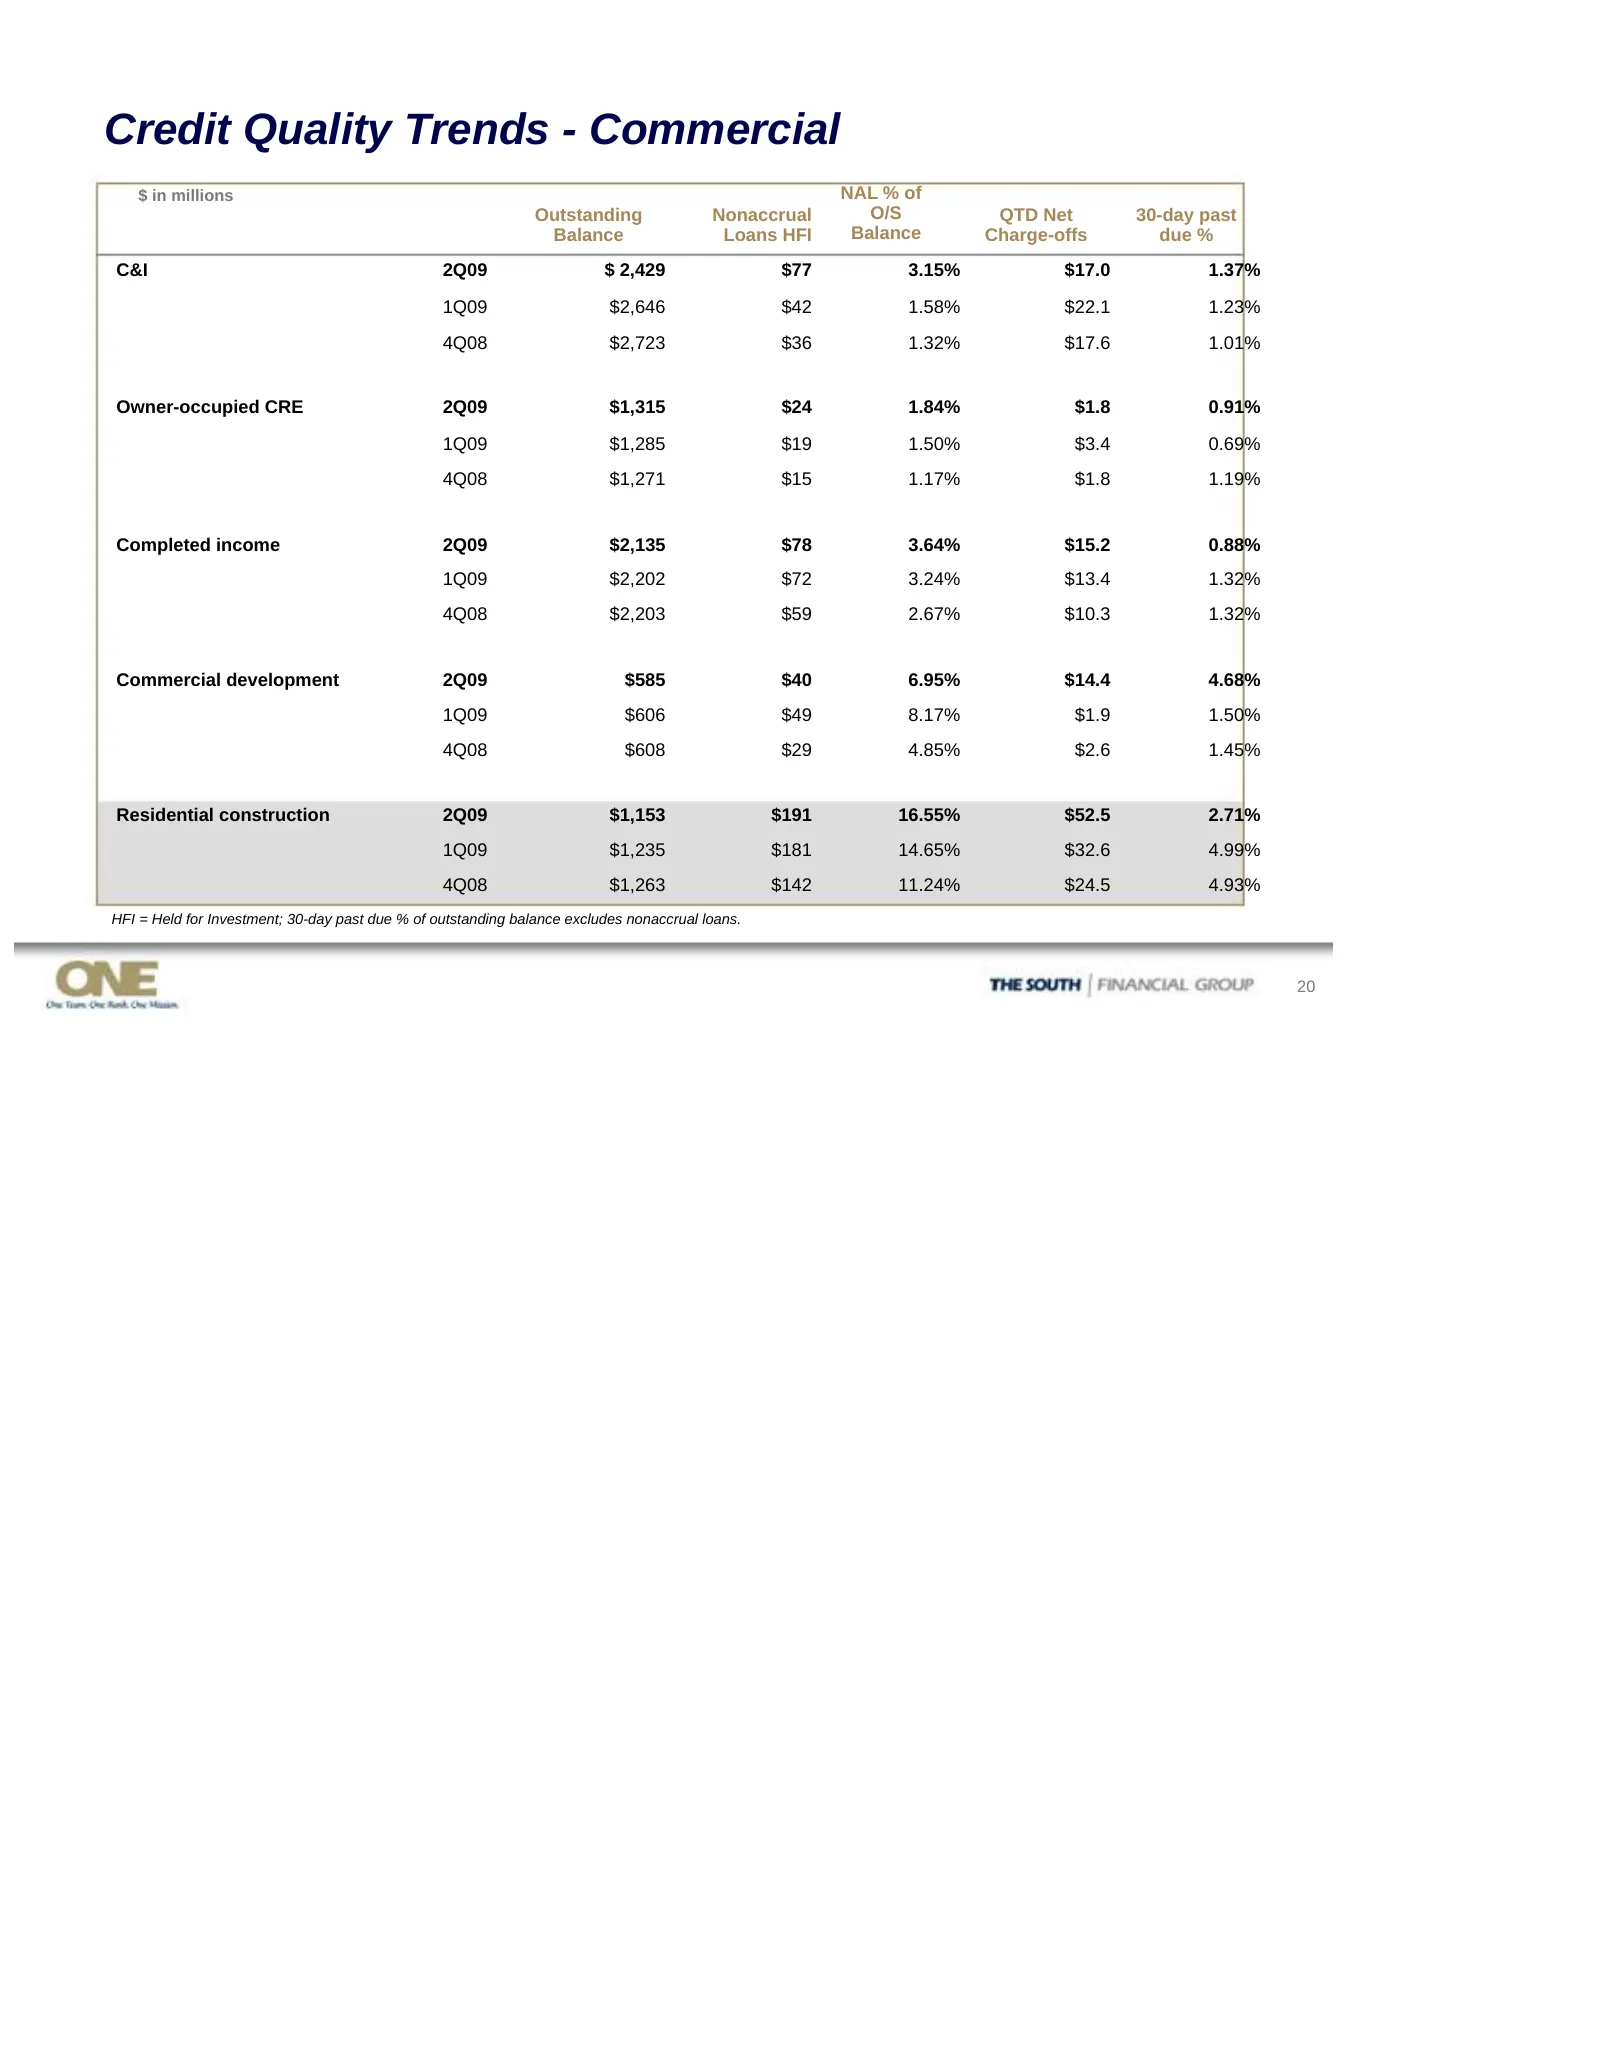
Credit Quality Trends - Commercial $ in millions NAL % of Outstanding Nonaccrual O/S QTD Net 30-day past Balance Loans HFI Balance Charge-offs due % C&I 2Q09 $ 2,429 $77 3.15% $17.0 1.37% 1Q09 $2,646 $42 1.58% $22.1 1.23% 4Q08 $2,723 $36 1.32% $17.6 1.01% Owner-occupied CRE 2Q09 $1,315 $24 1.84% $1.
Slide 21: Credit Quality Trends - Consumer
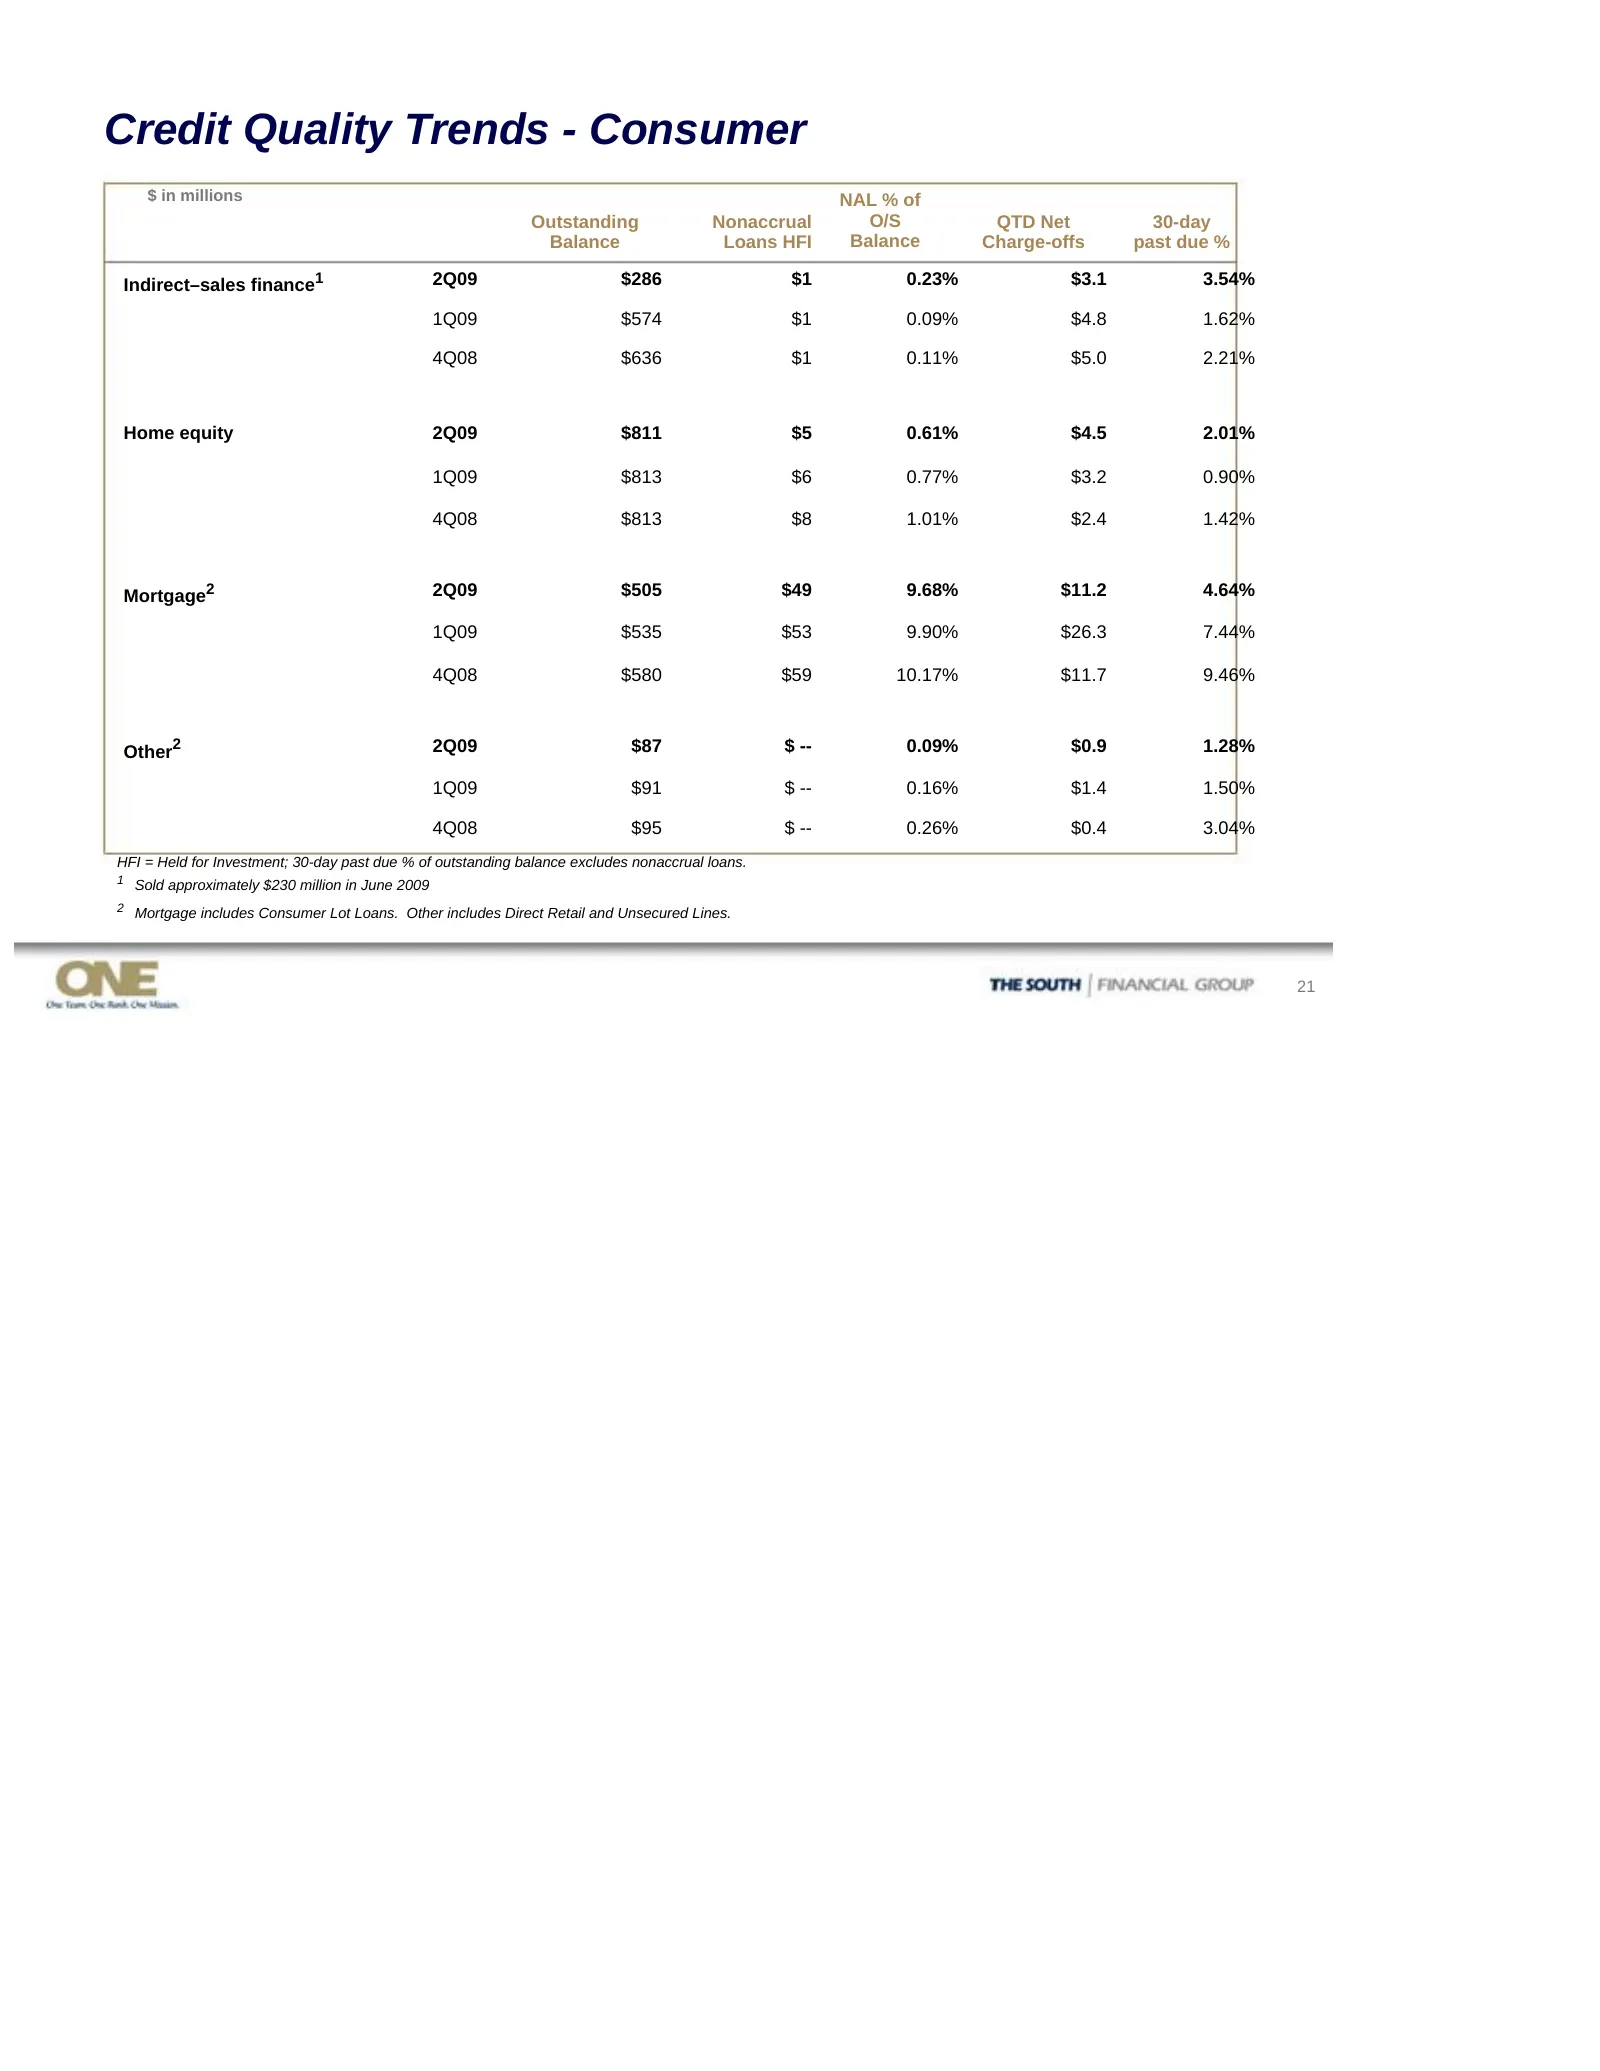
Credit Quality Trends - Consumer $ in millions NAL % of Outstanding Nonaccrual O/S QTD Net 30-day Balance Loans HFI Balance Charge-offs past due % Indirect–sales finance1 2Q09 $286 $1 0.23% $3.1 3.54% 1Q09 $574 $1 0.09% $4.8 1.62% 4Q08 $636 $1 0.11% $5.0 2.21% Home equity 2Q09 $811 $5 0.61% $4.5 2.0
Slide 22: Residential Construction by Geography
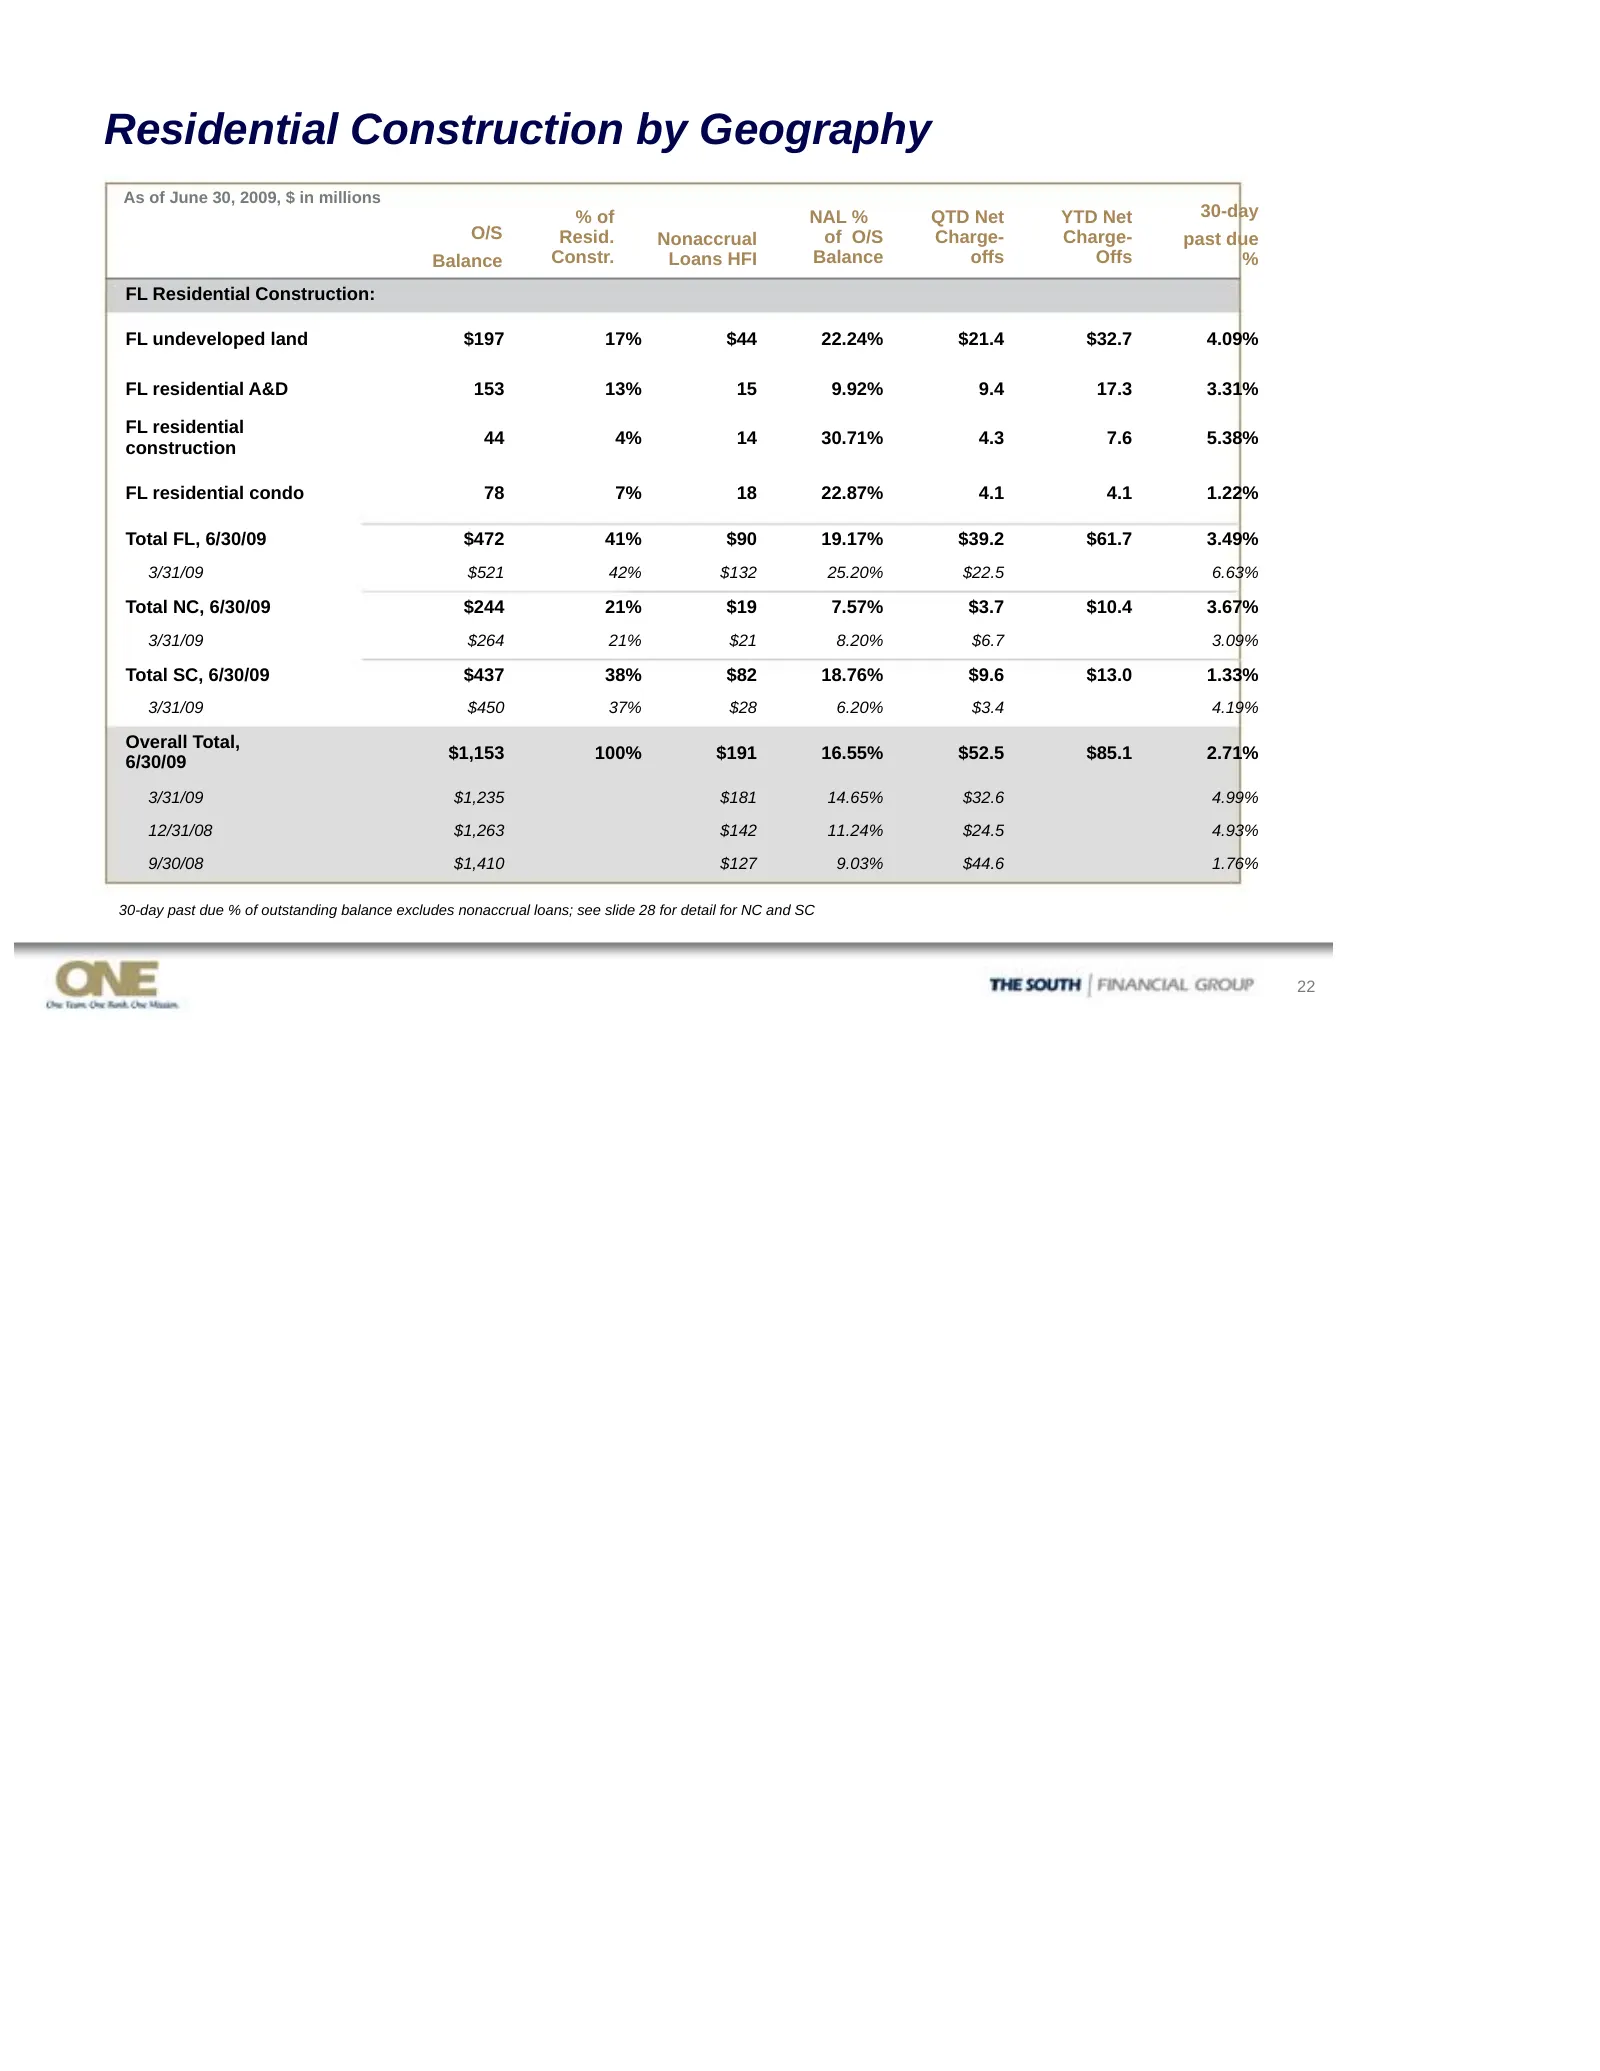
Residential Construction by Geography As of June 30, 2009, $ in millions % of NAL % QTD Net YTD Net 30-day O/S Resid. Nonaccrual of O/S Charge- Charge- past due Balance Constr. Loans HFI Balance offs Offs % FL Residential Construction: FL undeveloped land $197 17% $44 22.24% $21.4 $32.7 4.09% FL res
Slide 23: Residential Construction by Geography
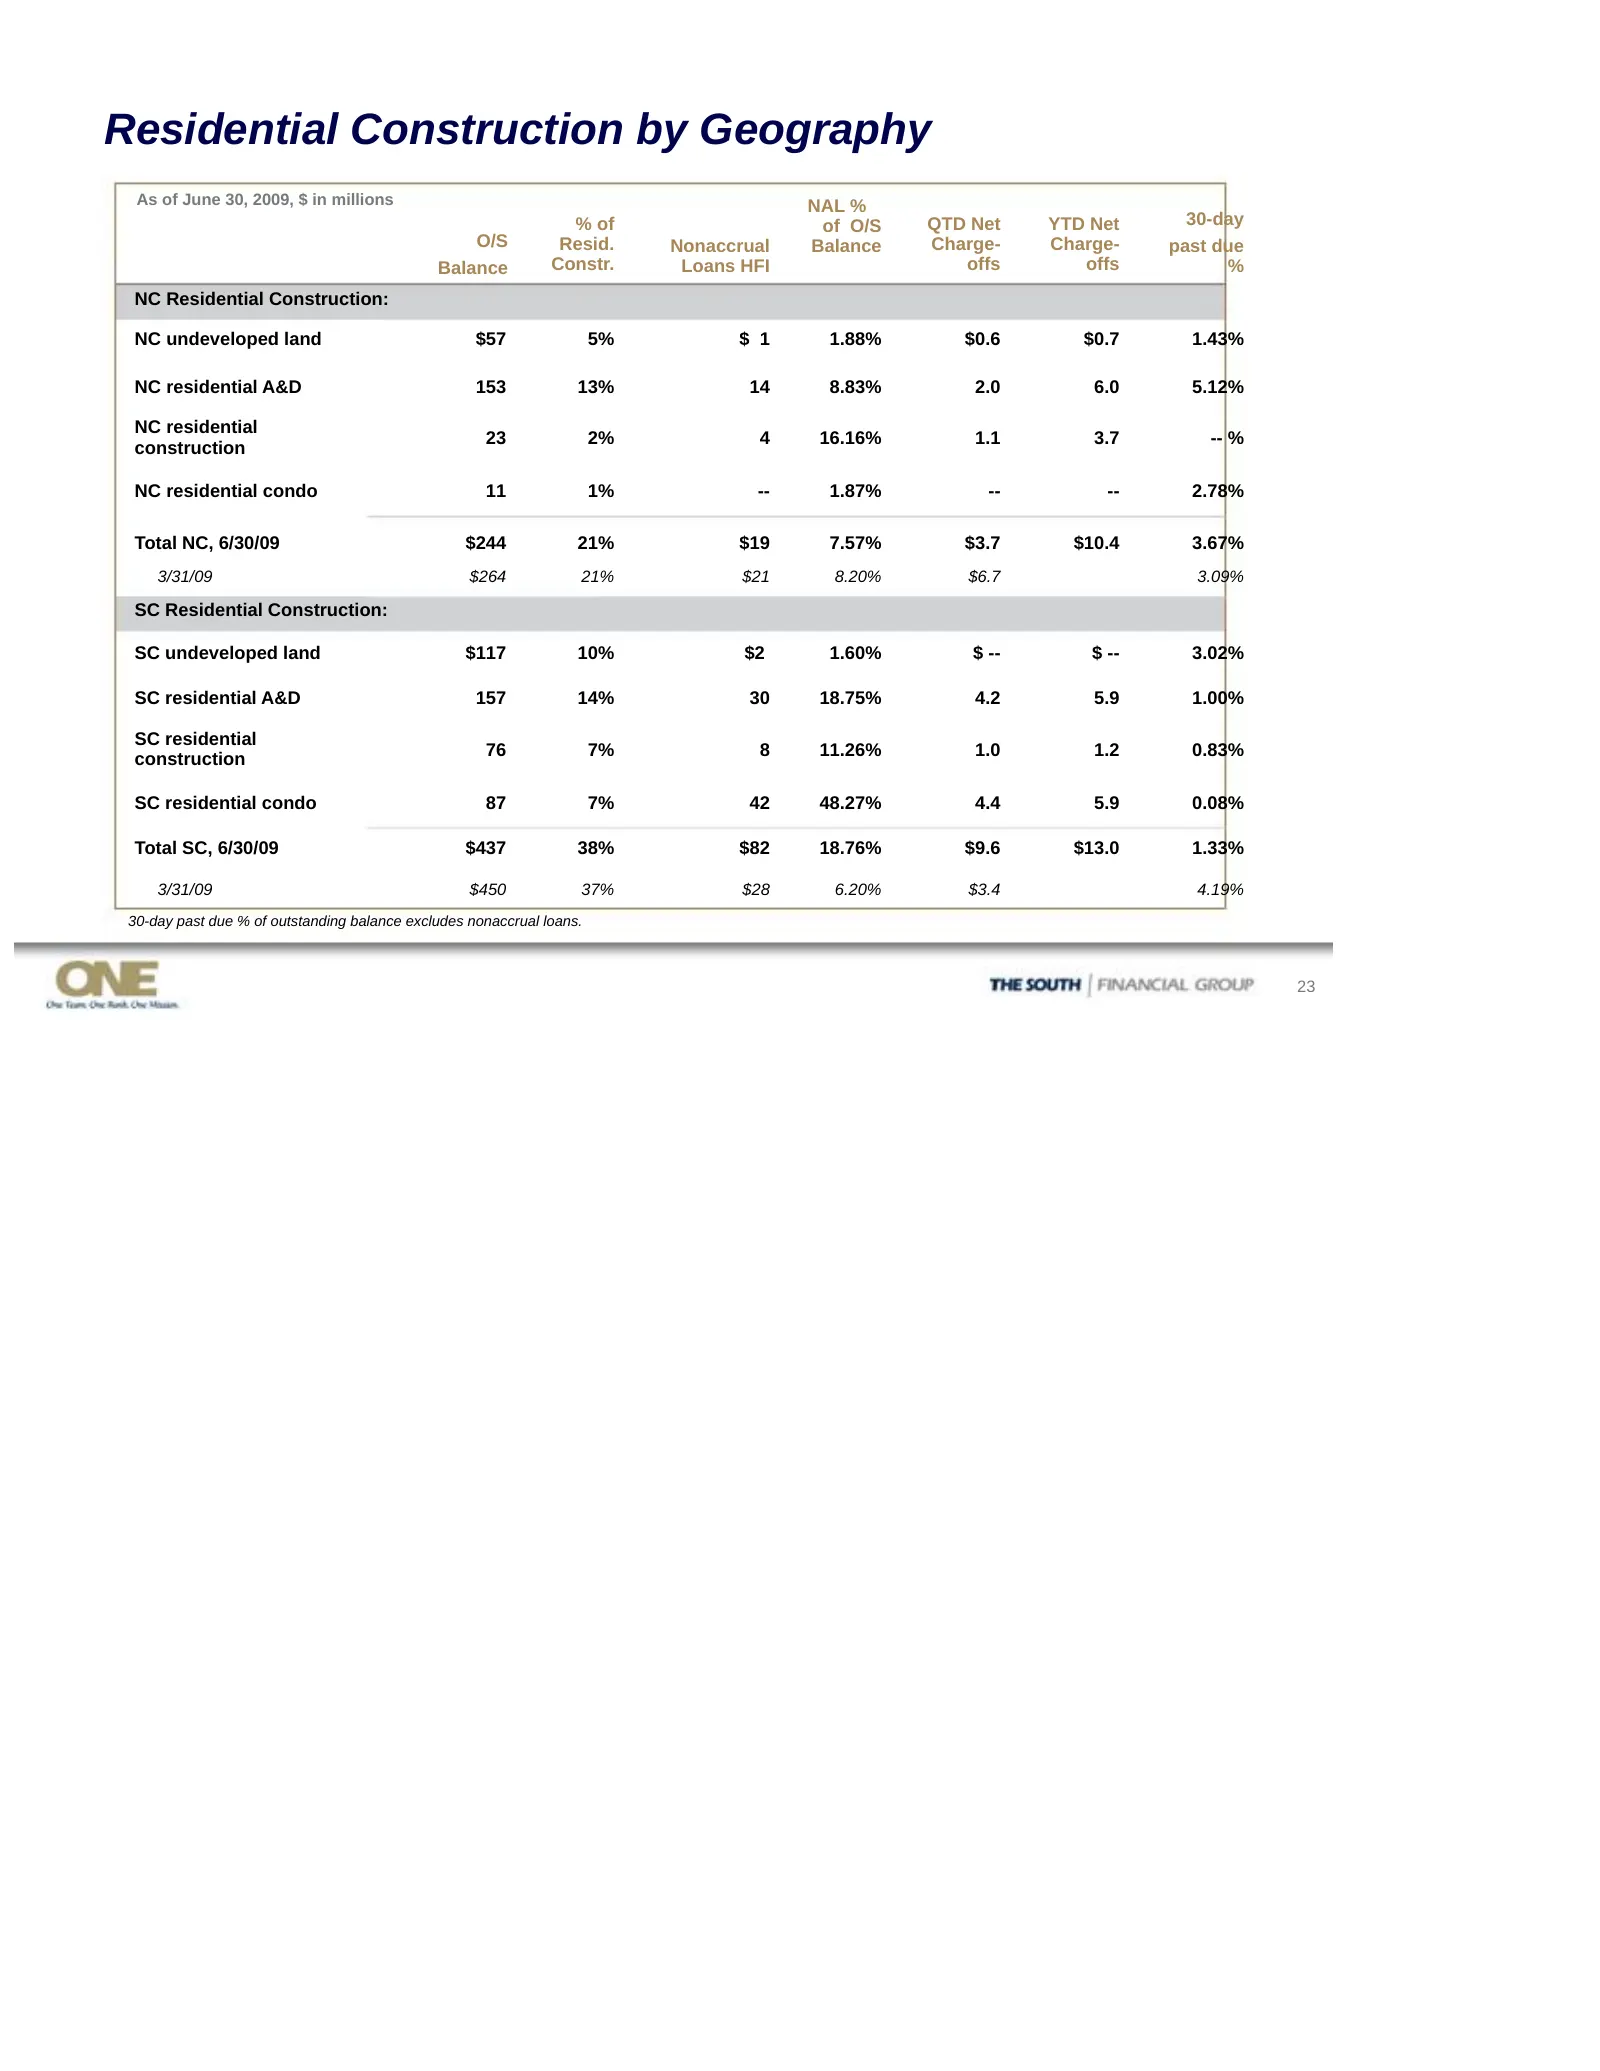
Residential Construction by Geography As of June 30, 2009, $ in millions NAL % % of of O/S QTD Net YTD Net 30-day O/S Resid. Nonaccrual Balance Charge- Charge- past due Balance Constr. Loans HFI offs offs % NC Residential Construction: NC undeveloped land $57 5% $ 1 1.88% $0.6 $0.7 1.43% NC resident
Slide 24: Commercial Nonaccruals – Net Balance
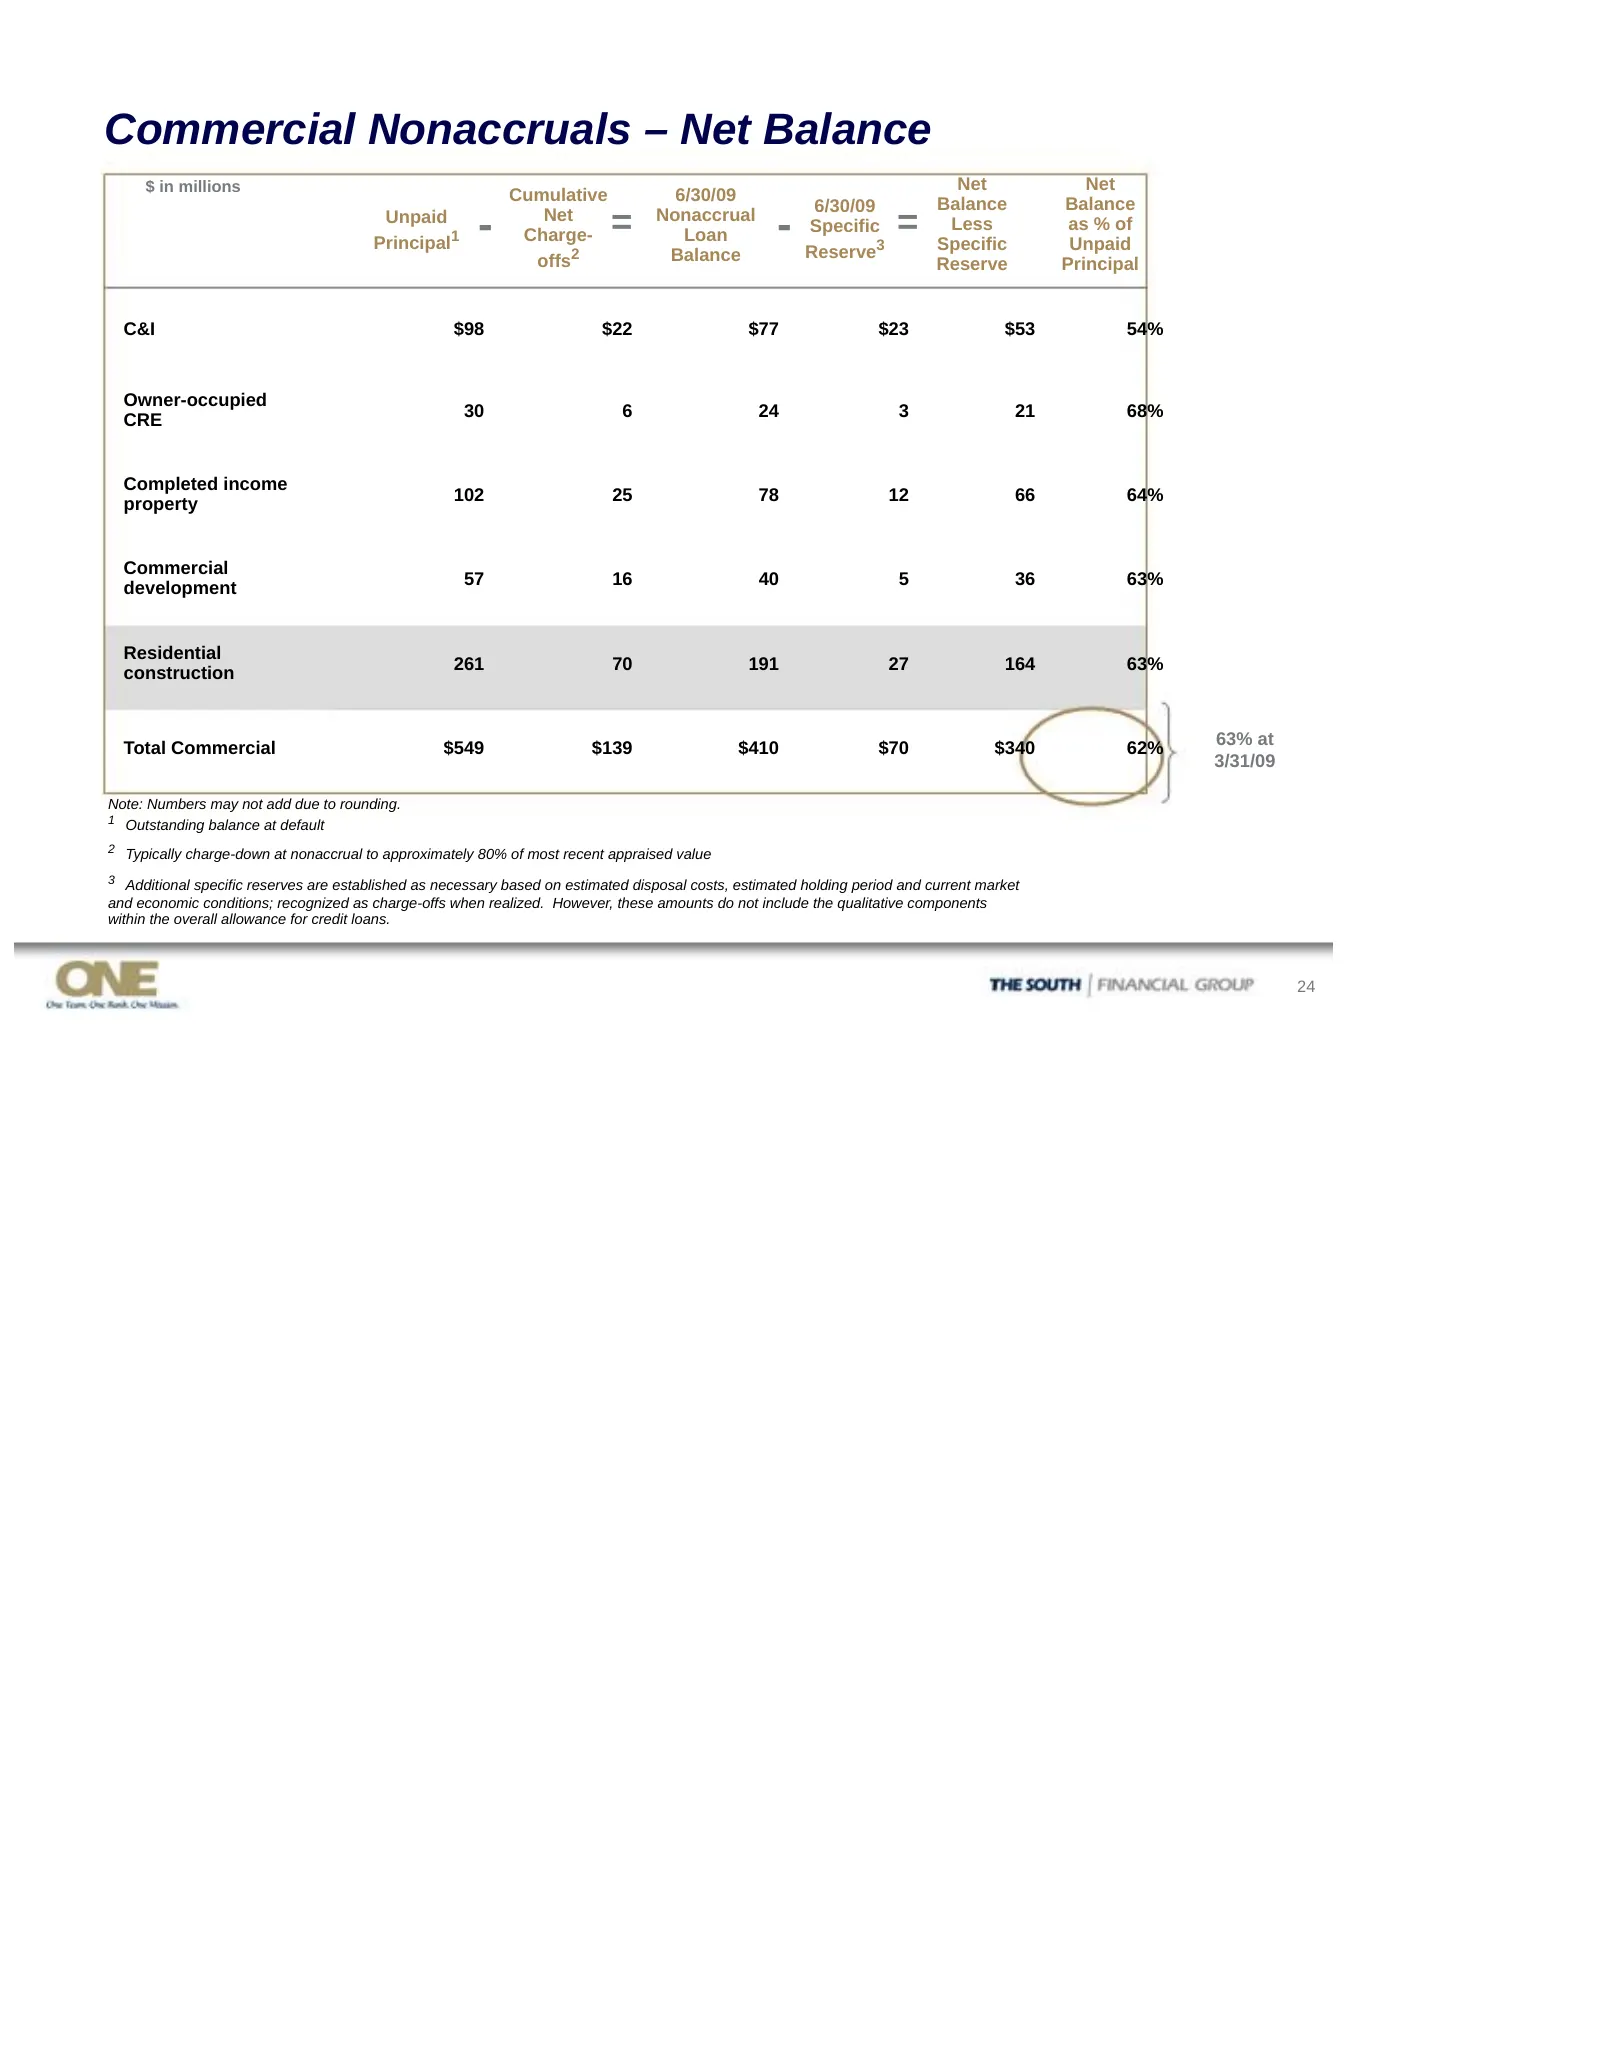
Commercial Nonaccruals – Net Balance $ in millions Net Net Cumulative 6/30/09 6/30/09 Balance Balance Unpaid Principal1 - Net Charge- = Nonaccrual Loan - Specific Reserve3 = Less Specific as % of Unpaid offs2 Balance Reserve Principal C&I $98 $22 $77 $23 $53 54% Owner-occupied CRE 30 6 24 3 21 68% C
Slide 25: Mortgage Banking Portfolio
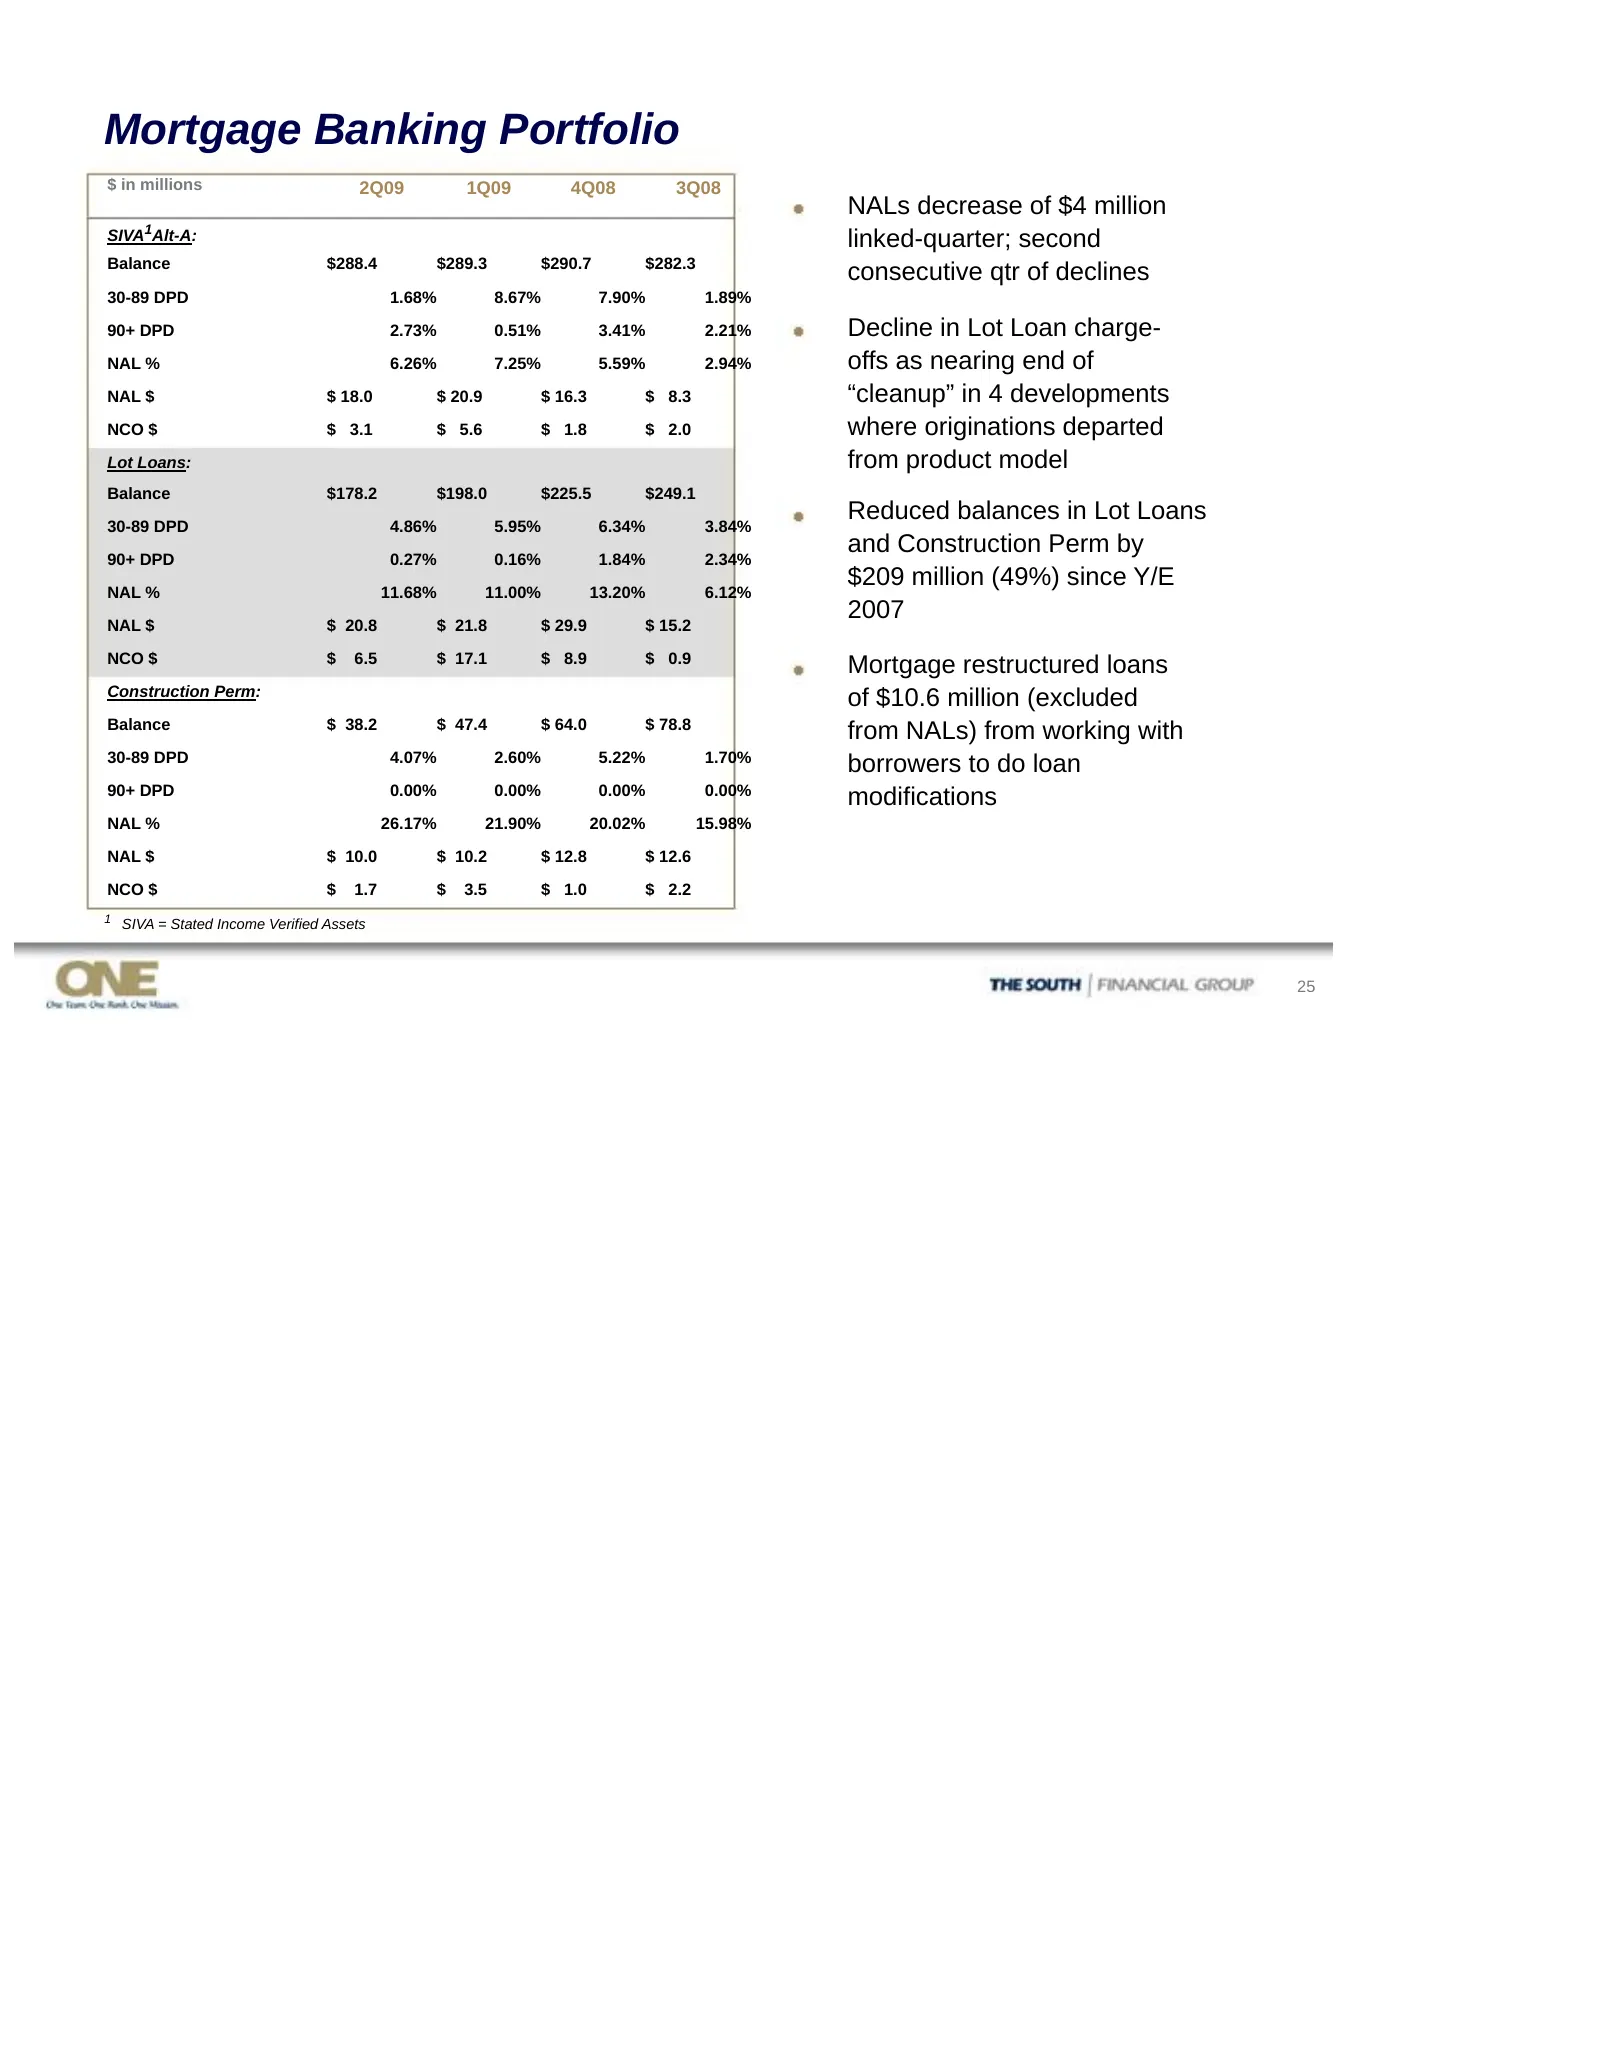
Mortgage Banking Portfolio $ in millions 2Q09 1Q09 4Q08 3Q08 NALs decrease of $4 million SIVA1Alt-A: linked-quarter; second Balance $288.4 $289.3 $290.7 $282.3 consecutive qtr of declines 30-89 DPD 1.68% 8.67% 7.90% 1.89% 90+ DPD 2.73% 0.51% 3.41% 2.21% Decline in Lot Loan charge- NAL % 6.26% 7.25%
Slide 26: Completed Income Property Portfolio
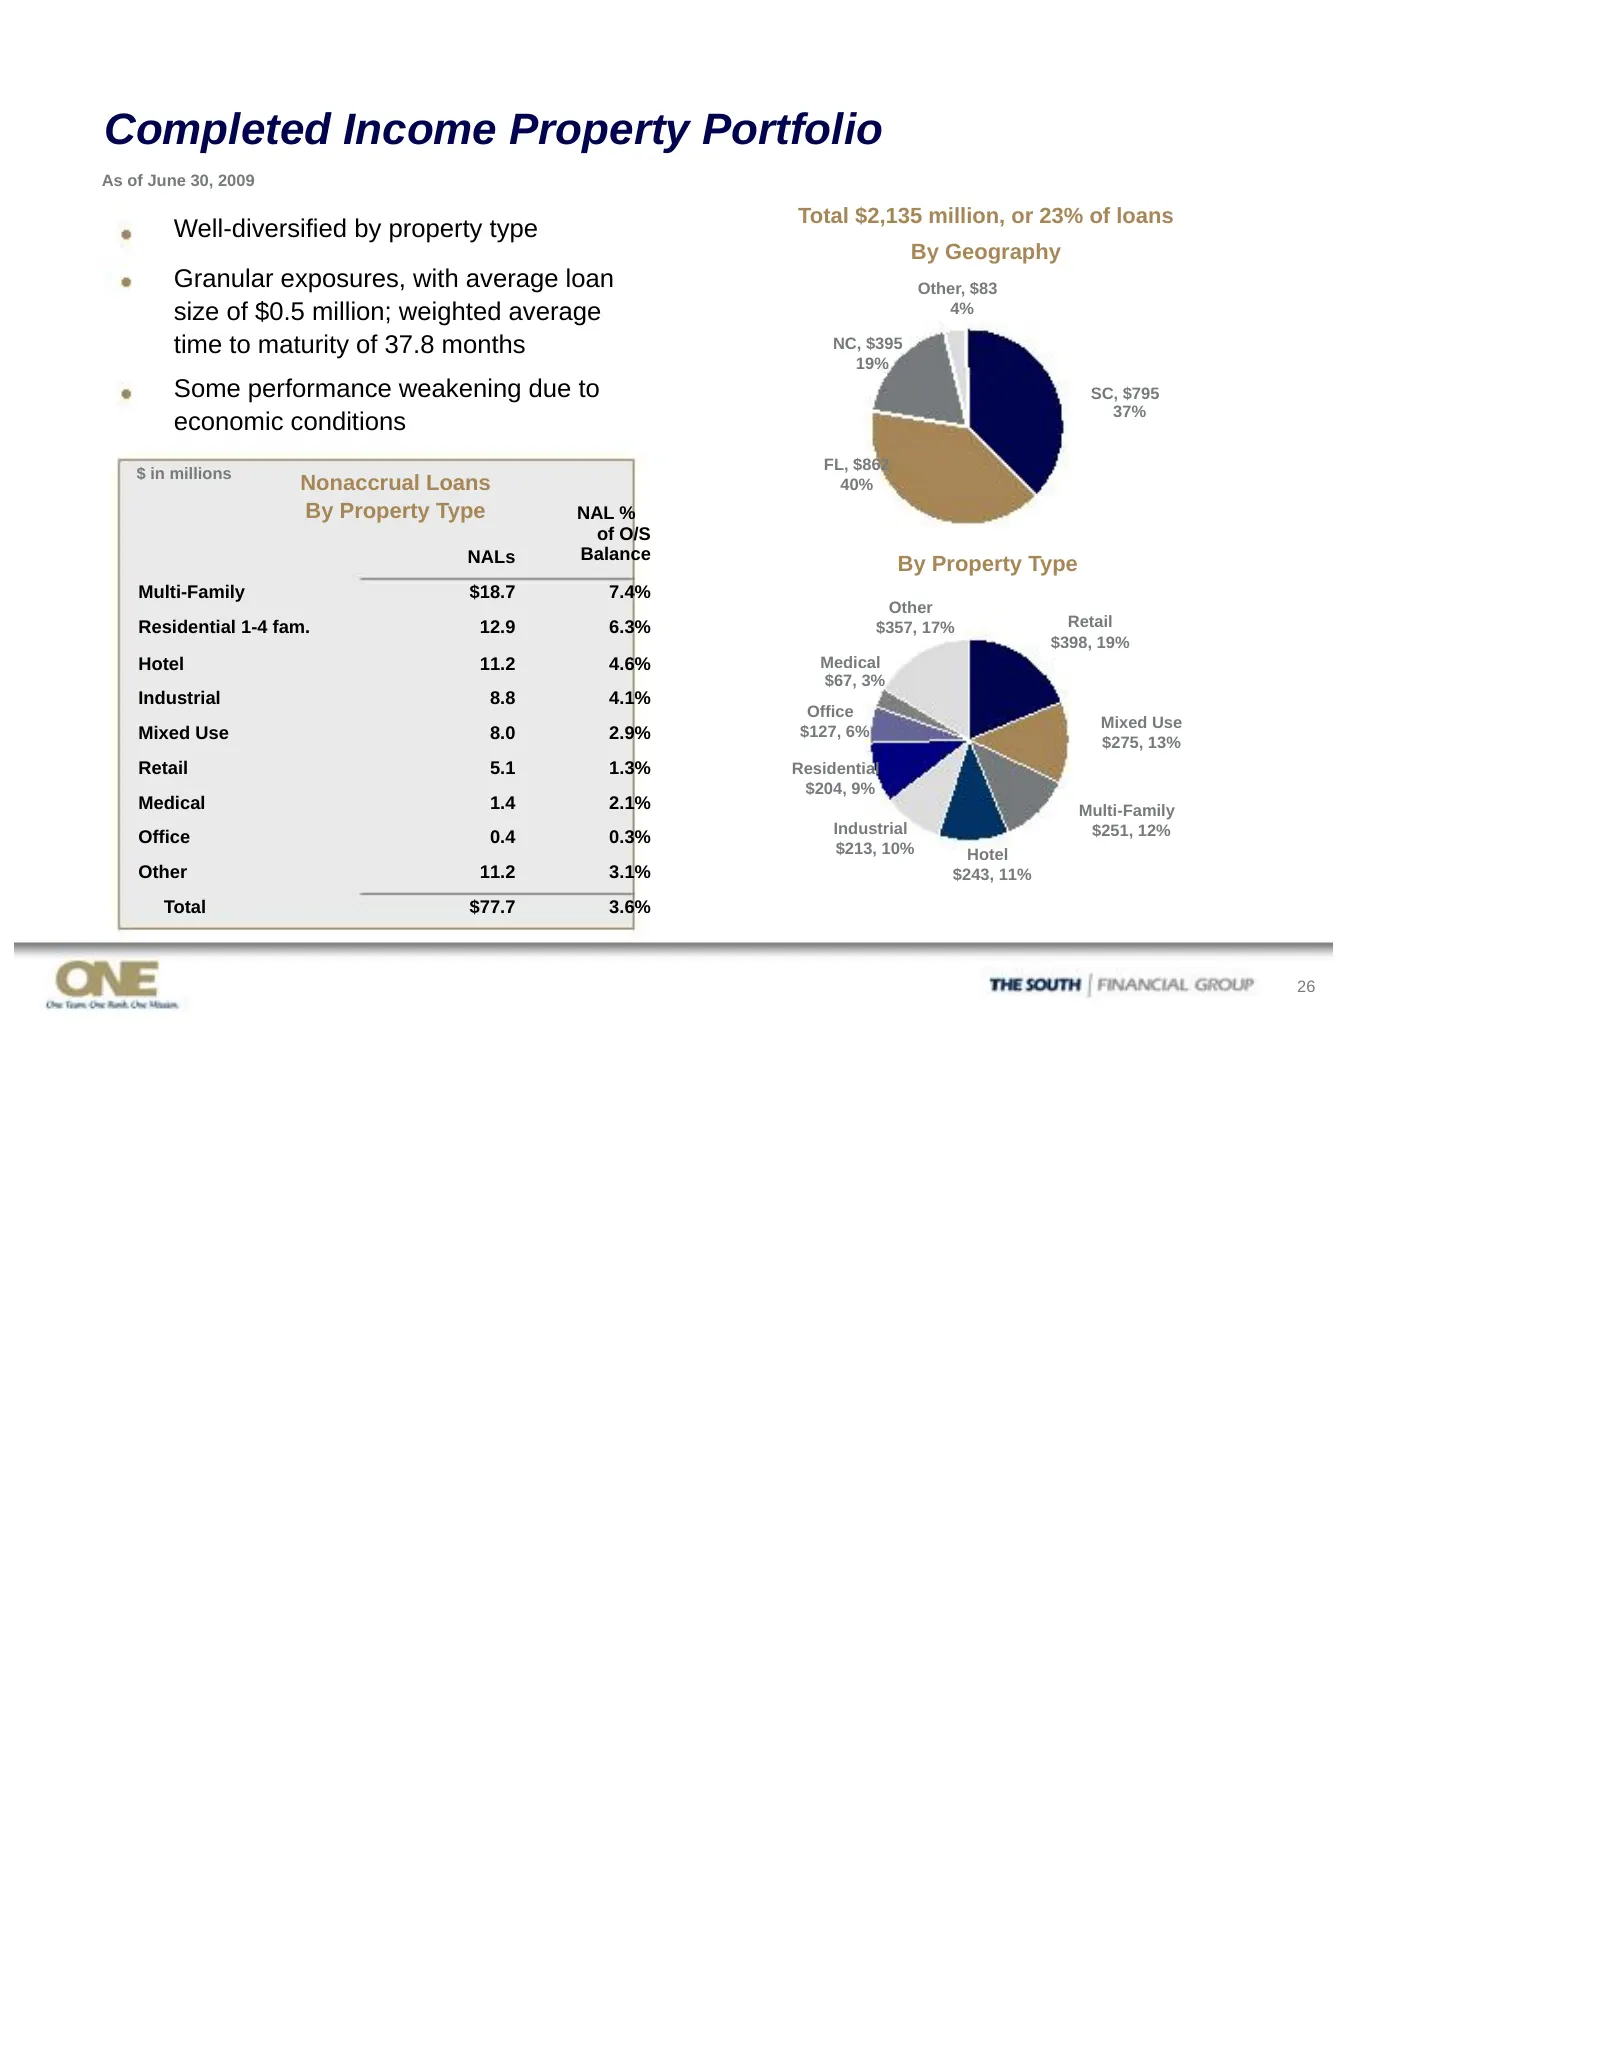
Completed Income Property Portfolio As of June 30, 2009 Total $2,135 million, or 23% of loans Well-diversified by property type By Geography Granular exposures, with average loan Other, $83 size of $0.5 million; weighted average 4% time to maturity of 37.8 months NC, $395 19% Some performance weaken
Slide 27: Shared National Credits
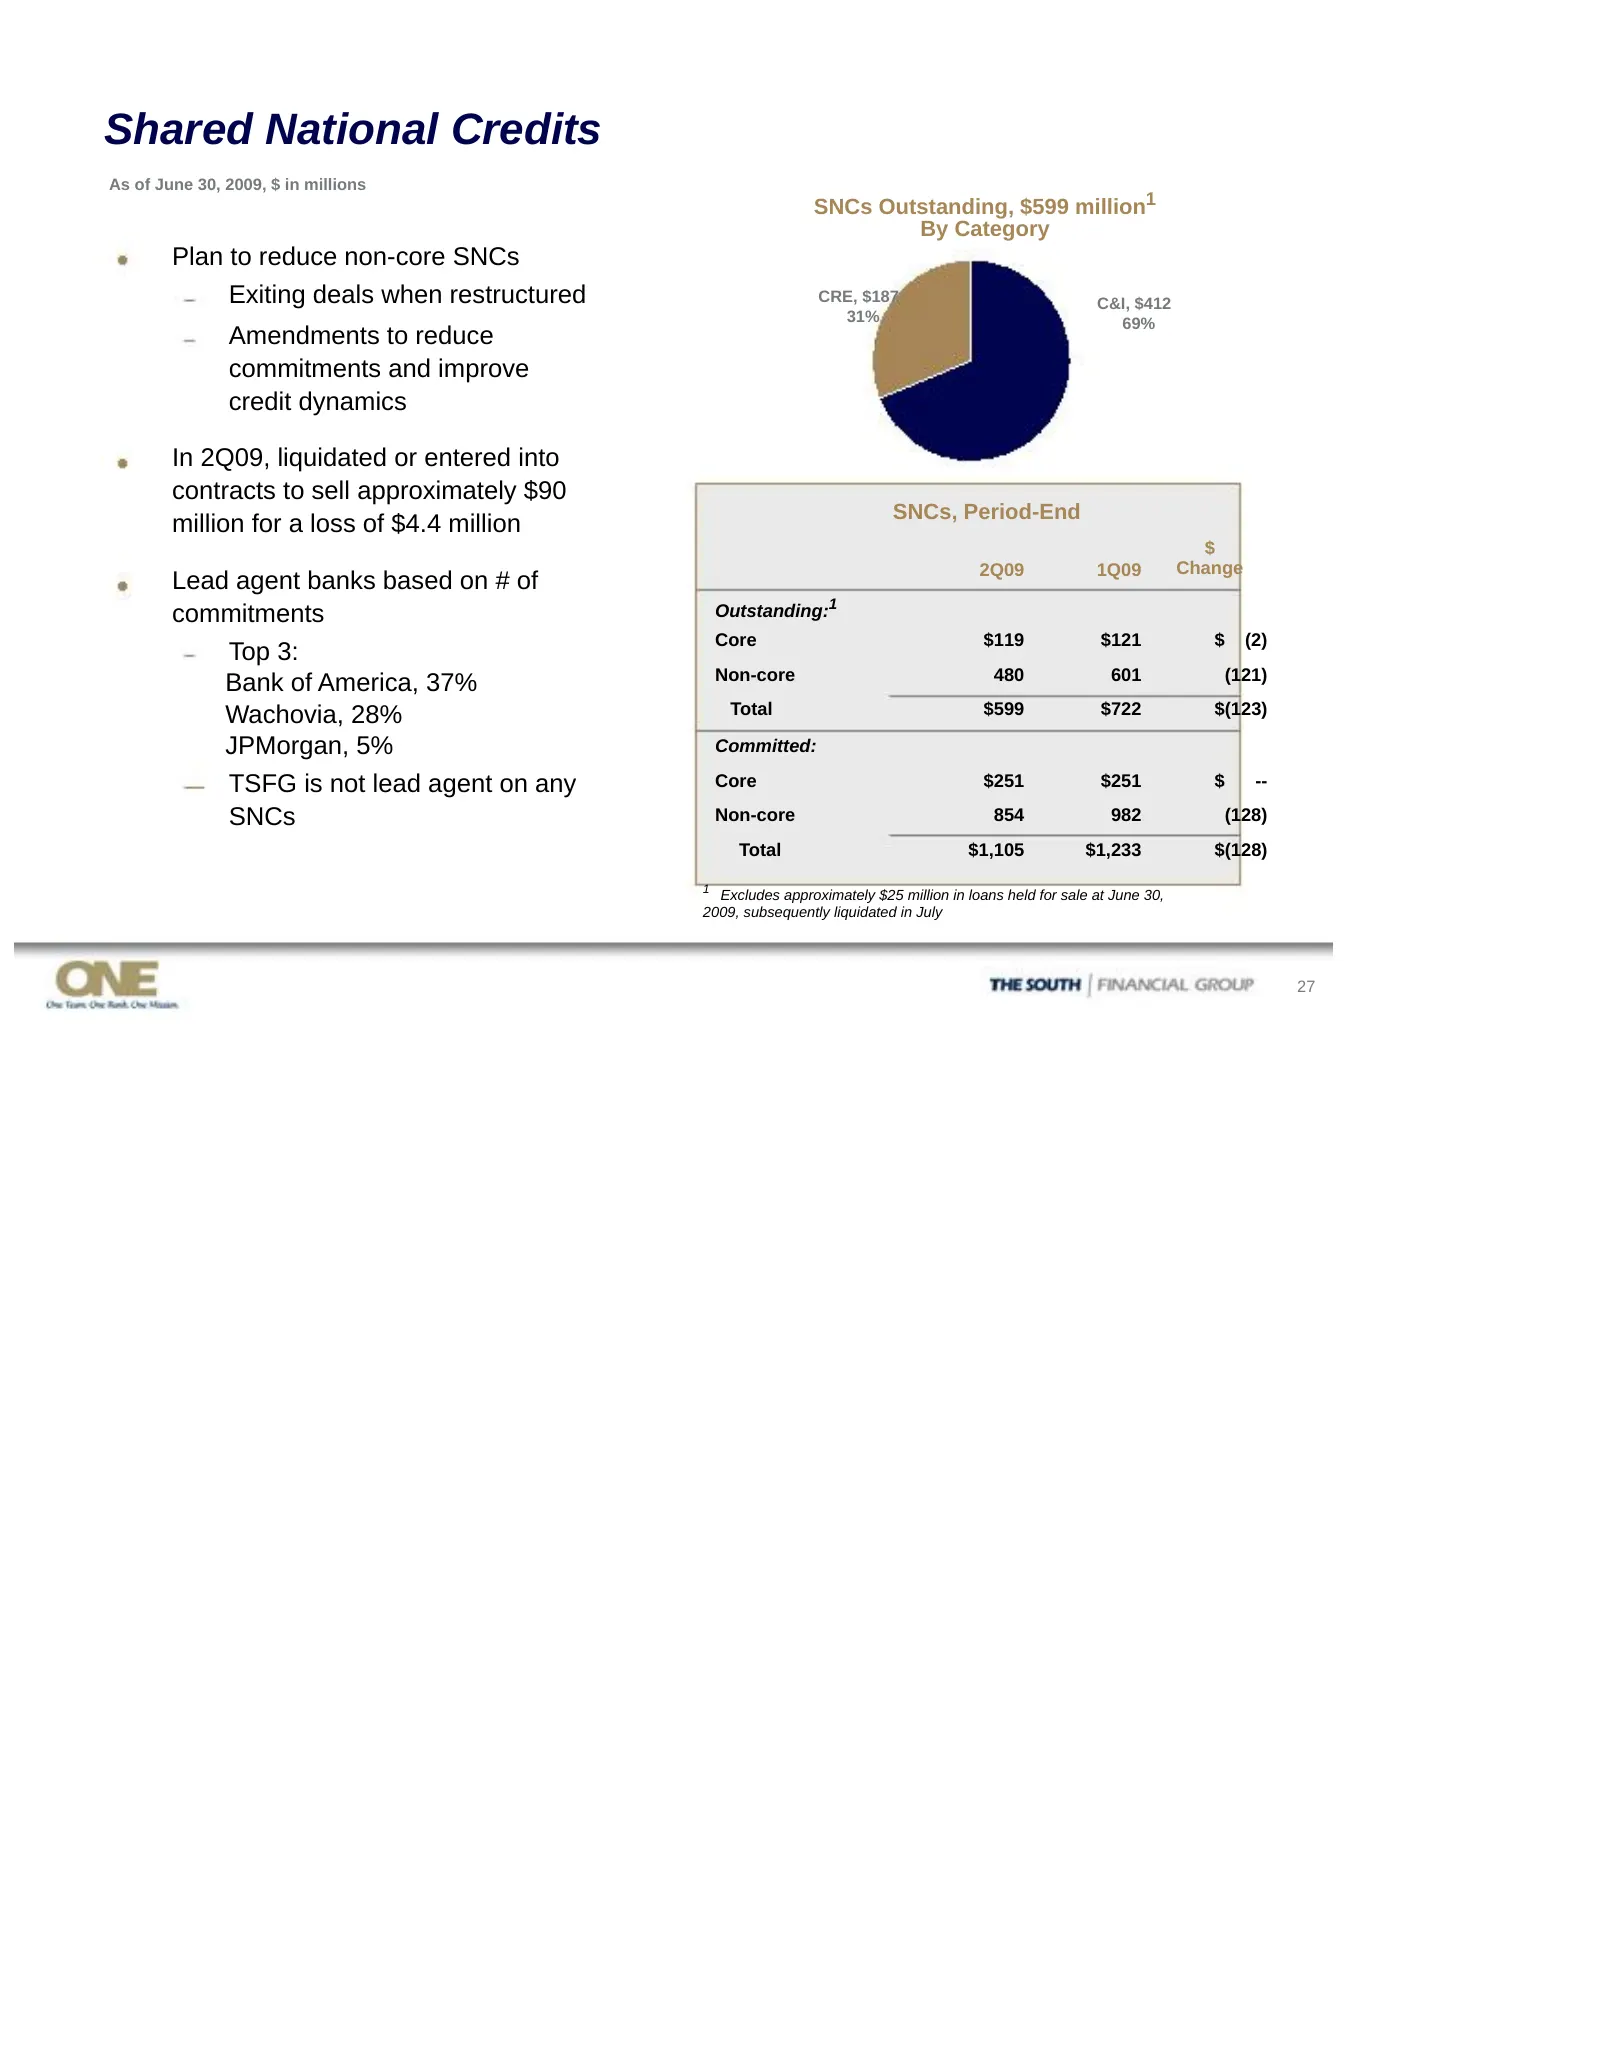
Shared National Credits As of June 30, 2009, $ in millions SNCs Outstanding, $599 million1 By Category Plan to reduce non-core SNCs Exiting deals when restructured CRE, $187 C&I, $412 31% 69% Amendments to reduce commitments and improve credit dynamics In 2Q09, liquidated or entered into contracts t
Slide 28: Indirect – Sales Finance Portfolio
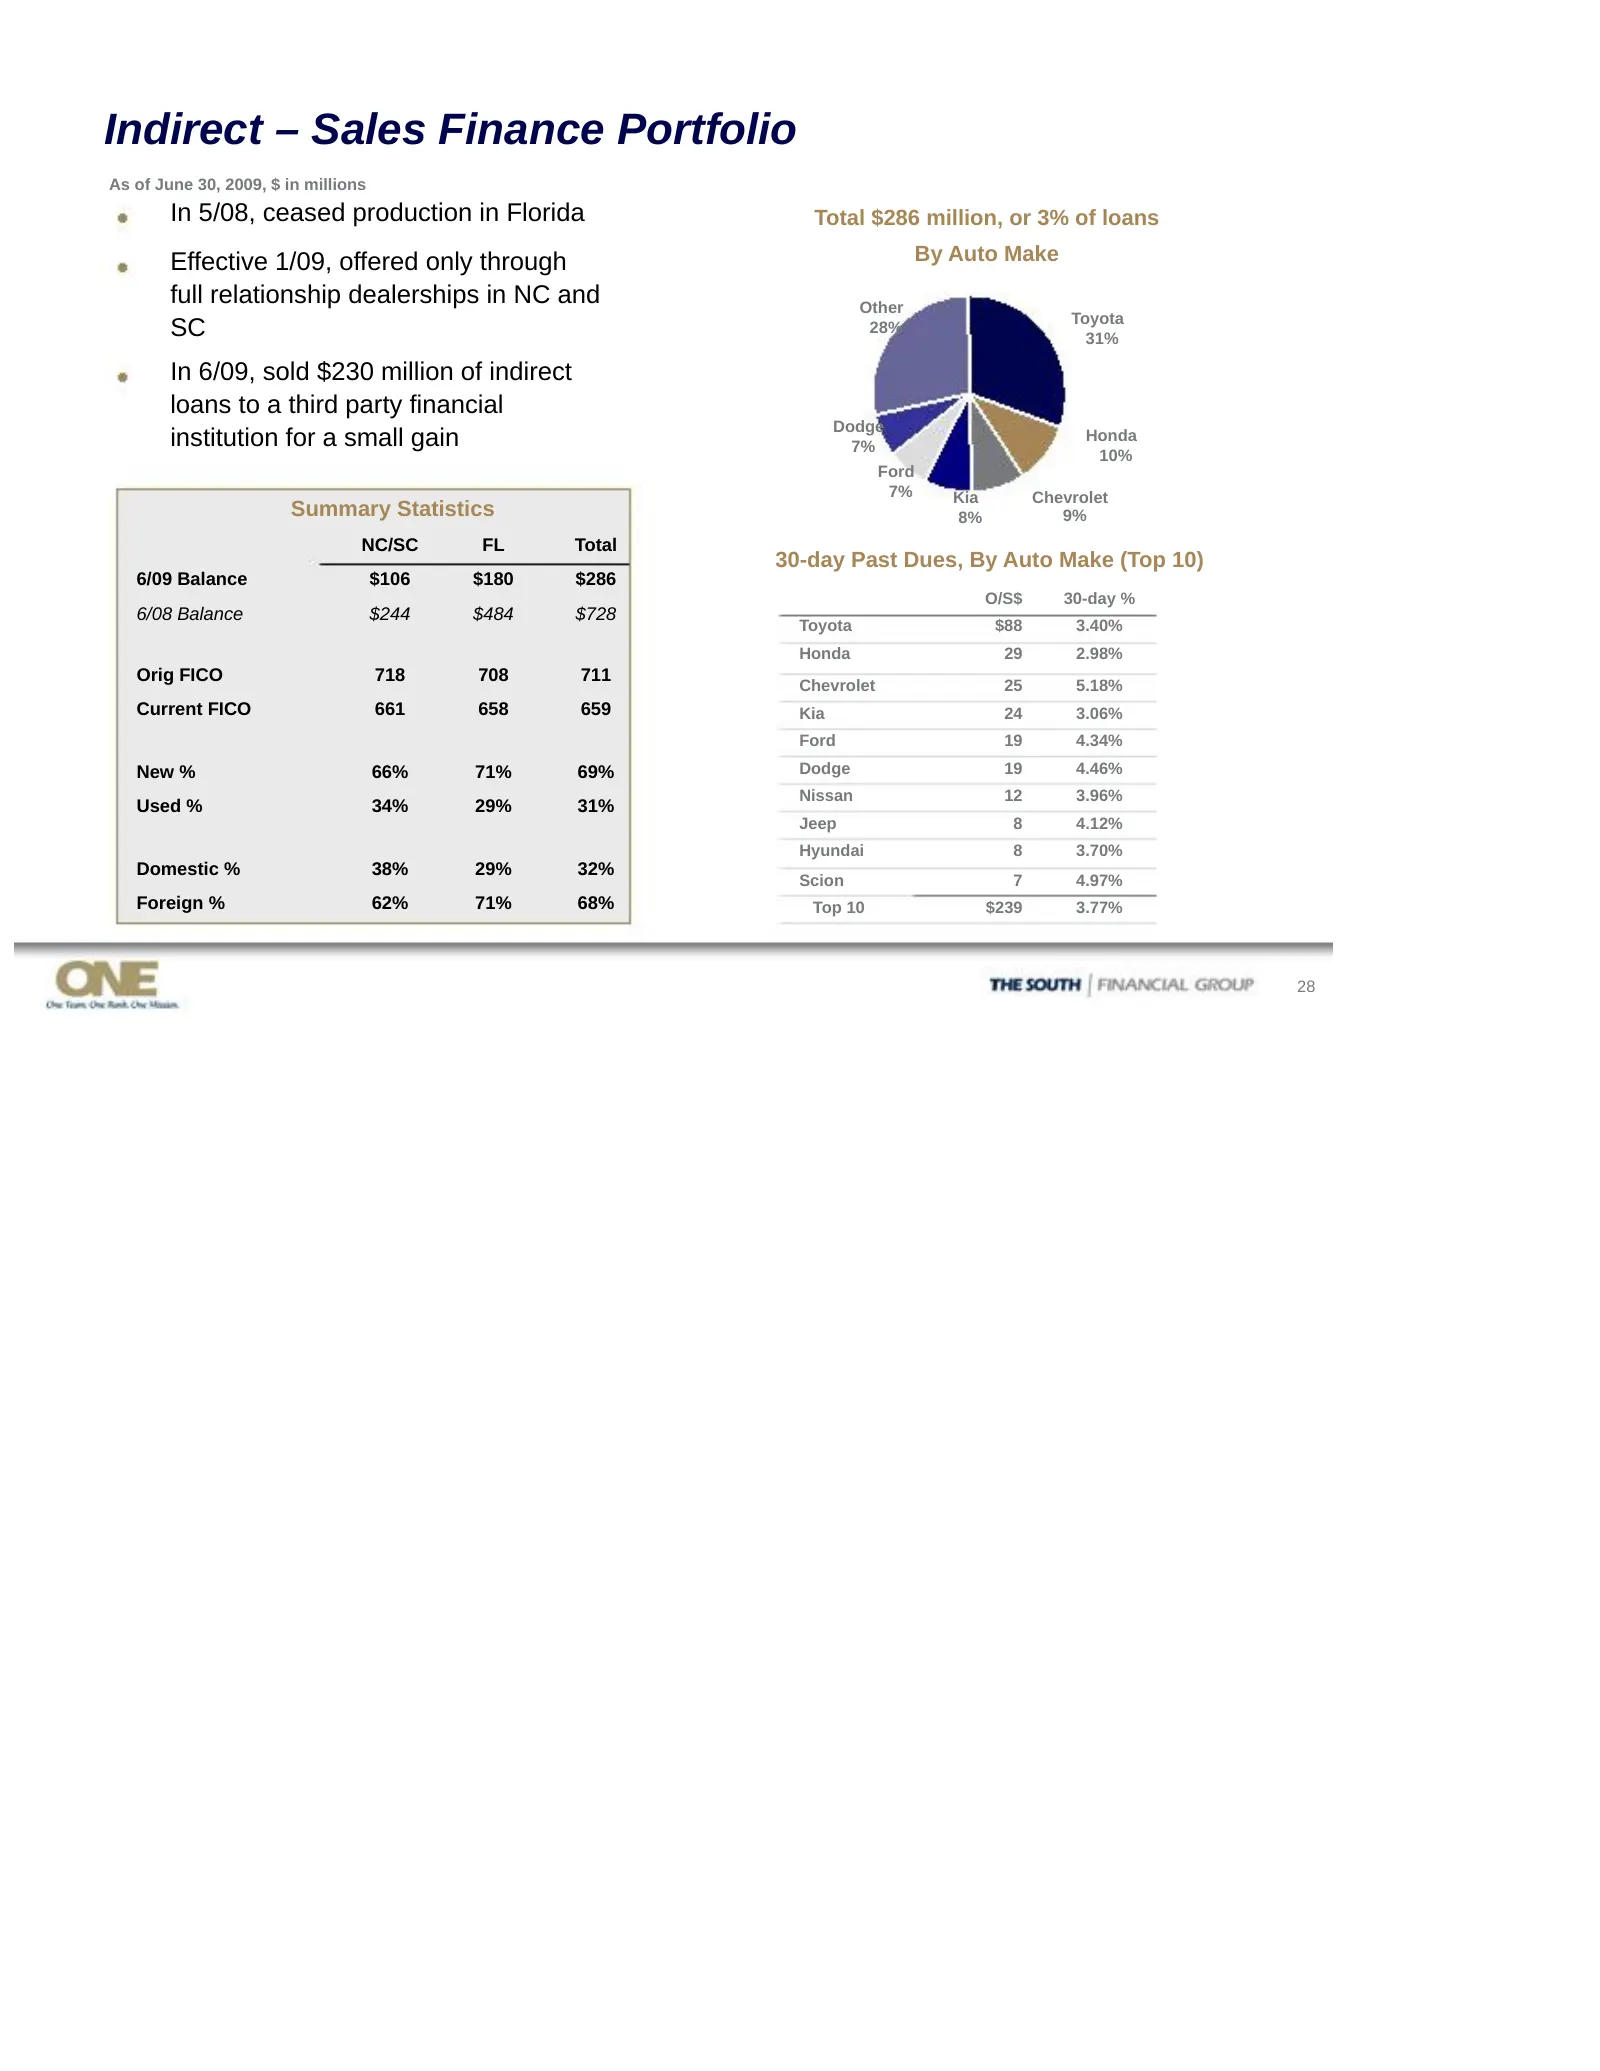
Indirect – Sales Finance Portfolio As of June 30, 2009, $ in millions In 5/08, ceased production in Florida Total $286 million, or 3% of loans Effective 1/09, offered only through By Auto Make full relationship dealerships in NC and Other Toyota SC 28% 31% In 6/09, sold $230 million of indirect loan
Slide 29: Home Equity Lines/Loans Portfolio
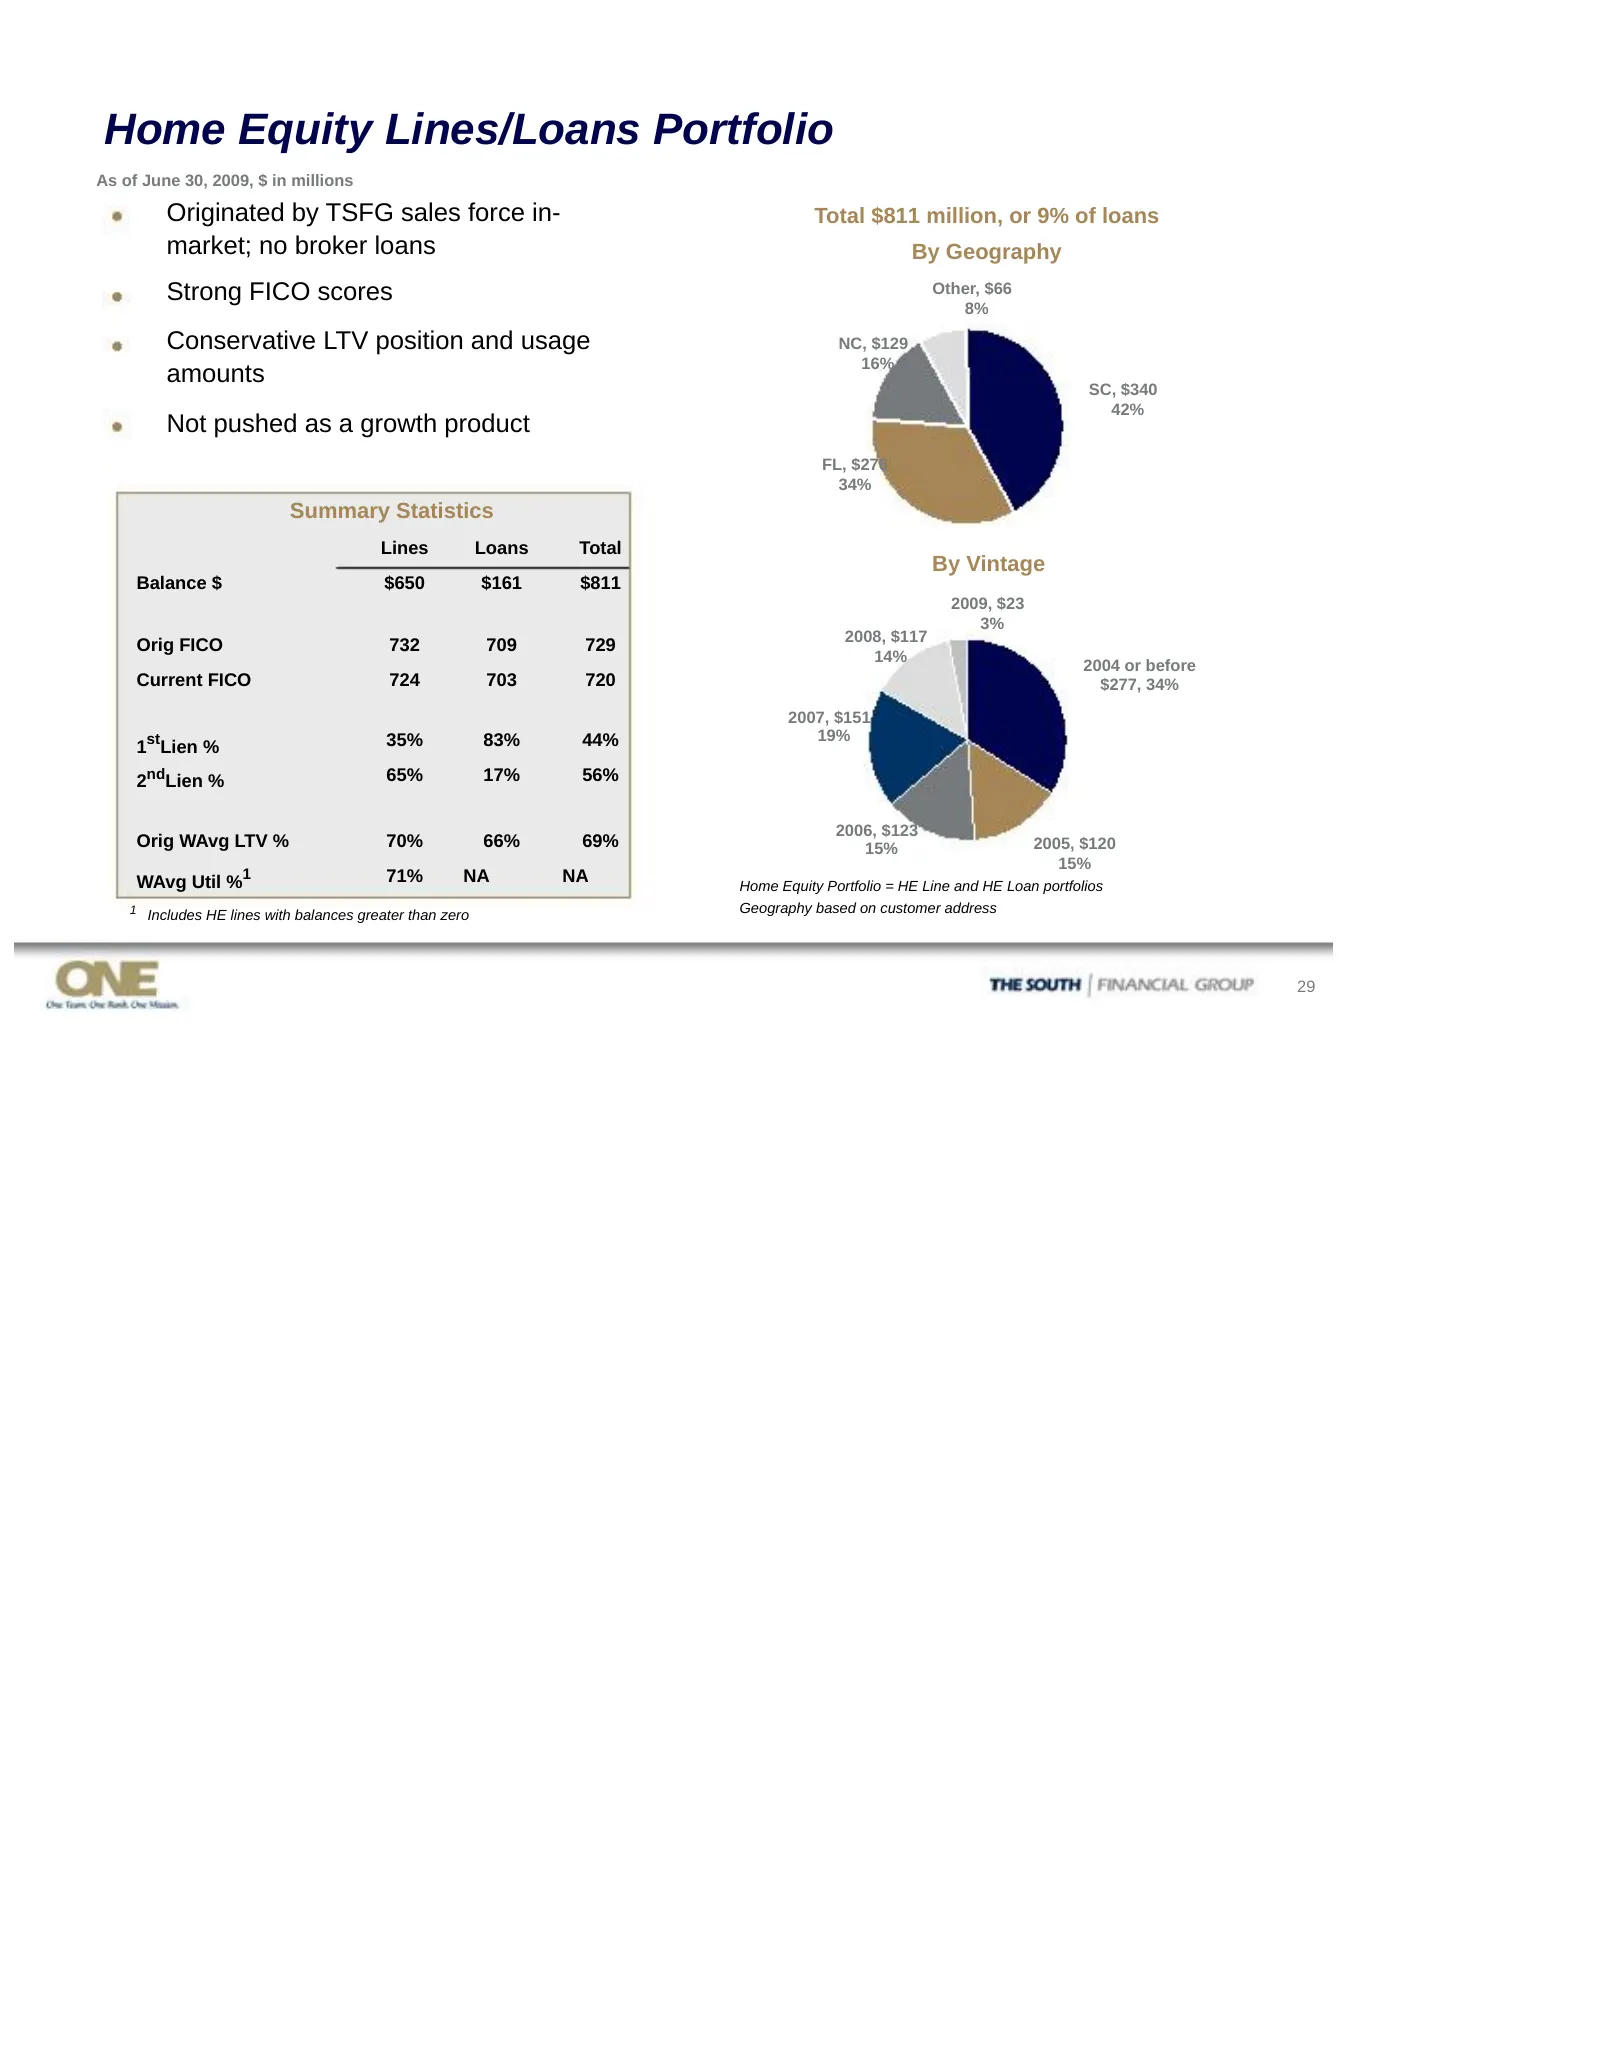
Home Equity Lines/Loans Portfolio As of June 30, 2009, $ in millions Originated by TSFG sales force in- Total $811 million, or 9% of loans market; no broker loans By Geography Strong FICO scores Other, $66 8% Conservative LTV position and usage NC, $129 16% amounts SC, $340 42% Not pushed as a growt
Slide 30: Other Real Estate Owned
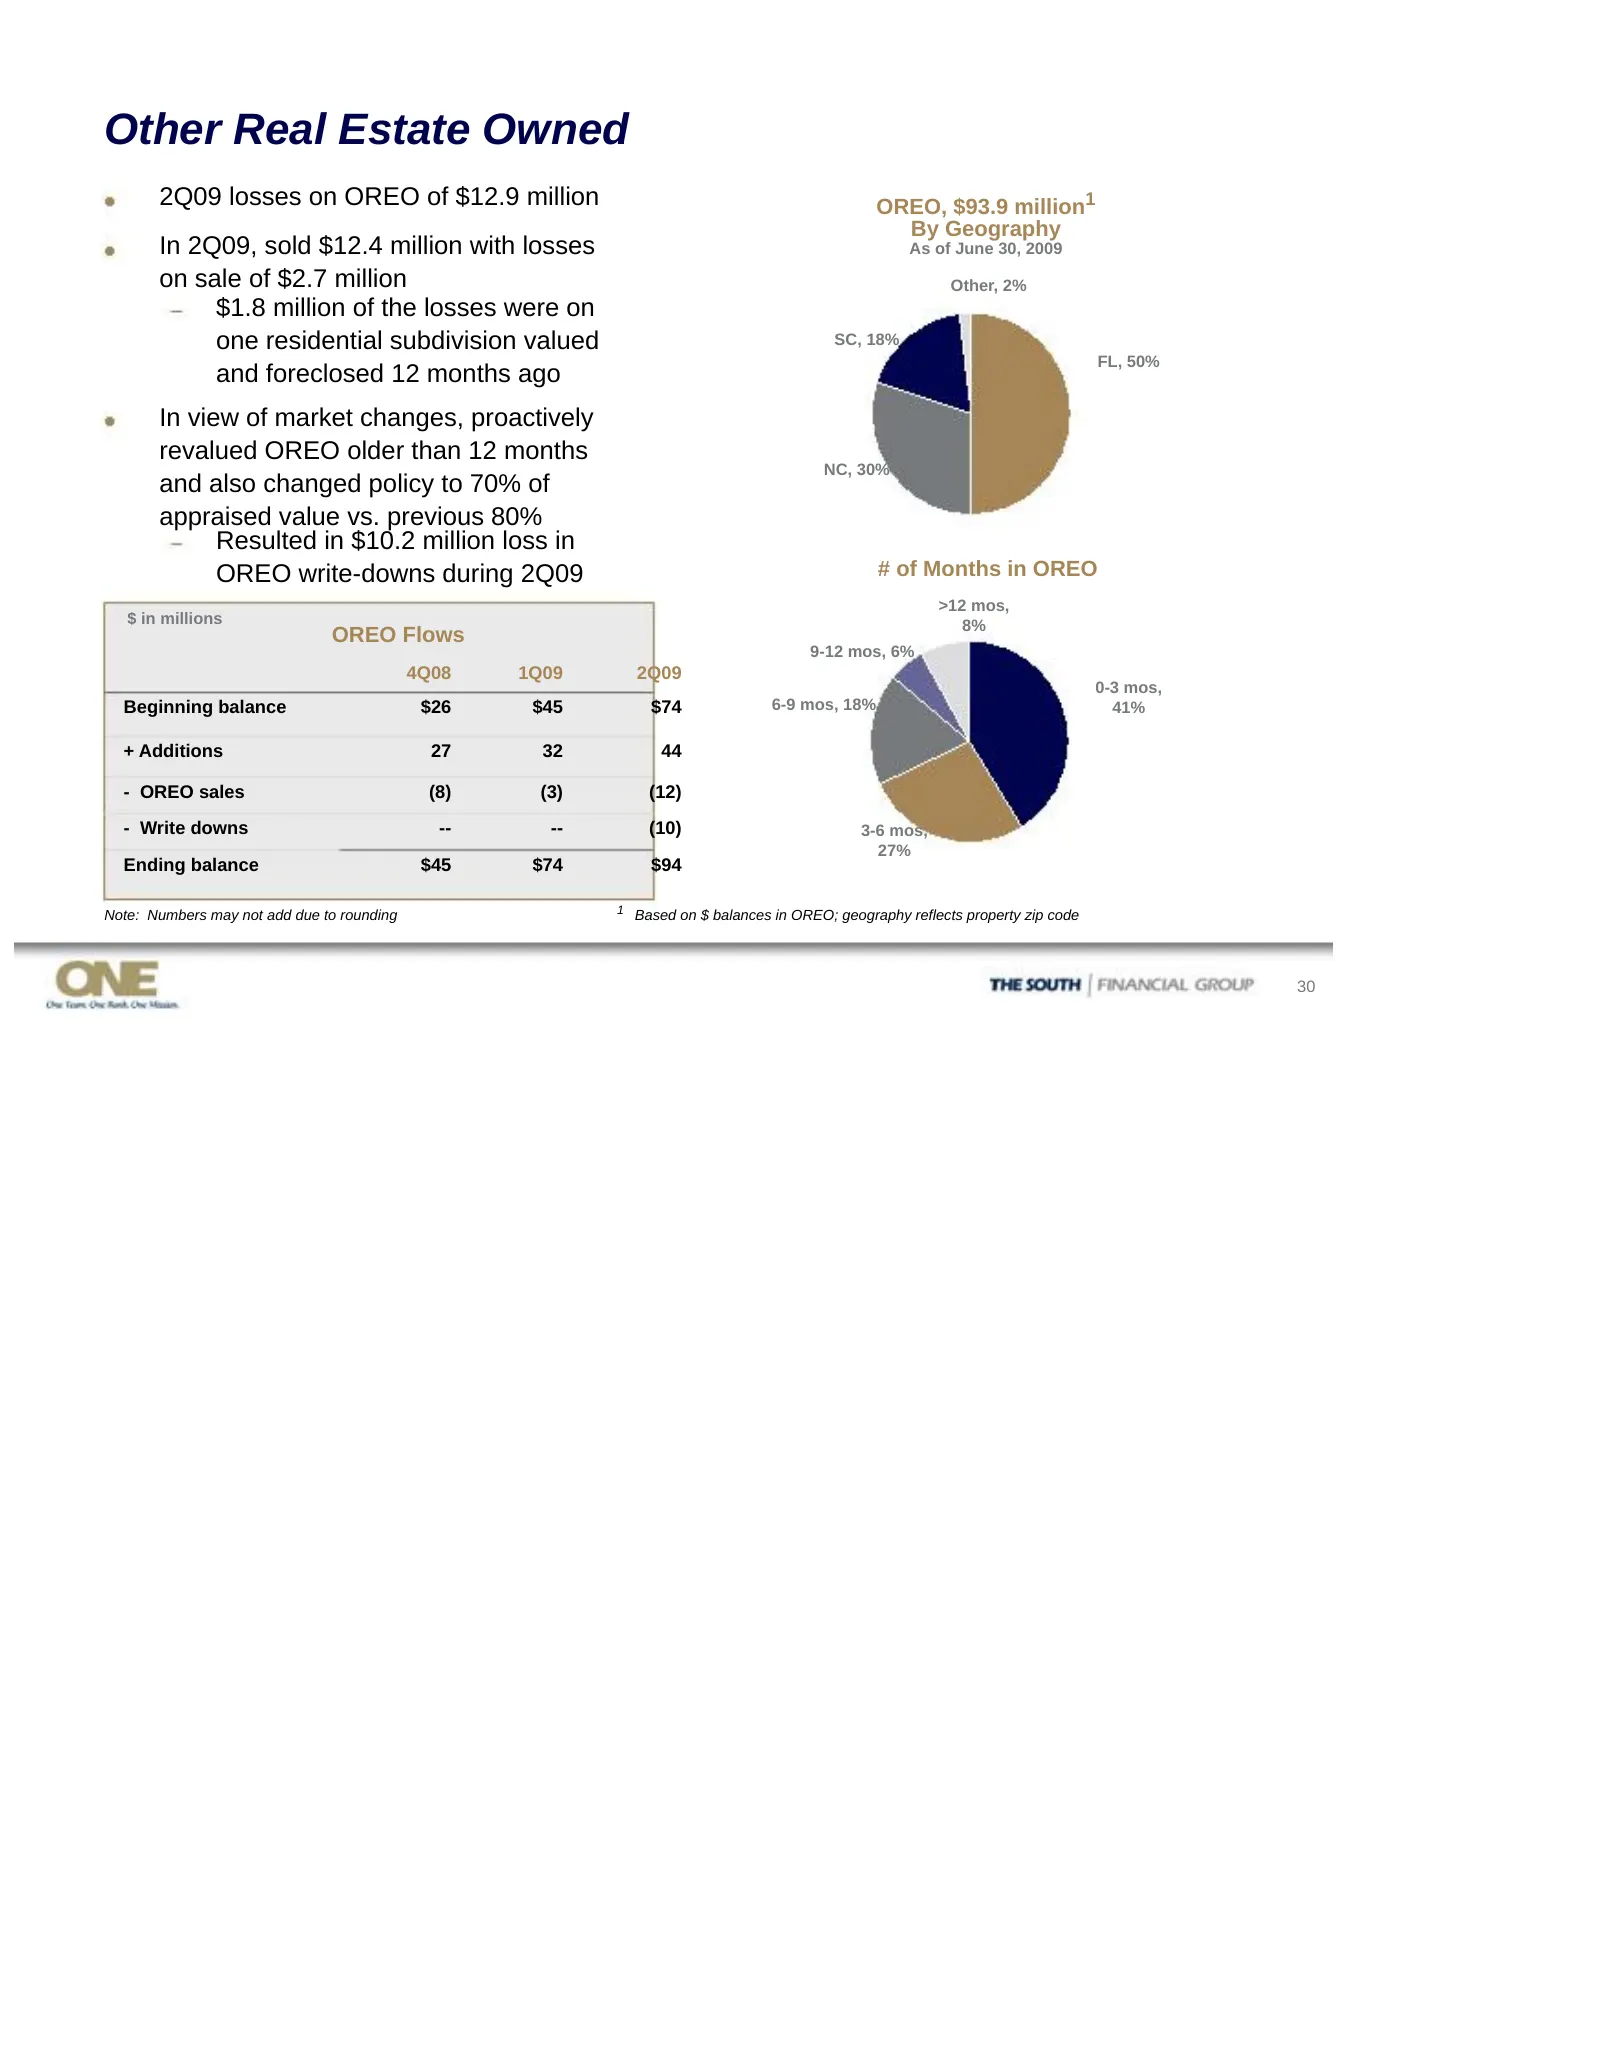
Other Real Estate Owned 2Q09 losses on OREO of $12.9 million OREO, $93.9 million1 By Geography In 2Q09, sold $12.4 million with losses As of June 30, 2009 on sale of $2.7 million Other, 2% $1.8 million of the losses were on one residential subdivision valued SC, 18% FL, 50% and foreclosed 12 months
Slide 31: Footprint: Long-term Growth Potential
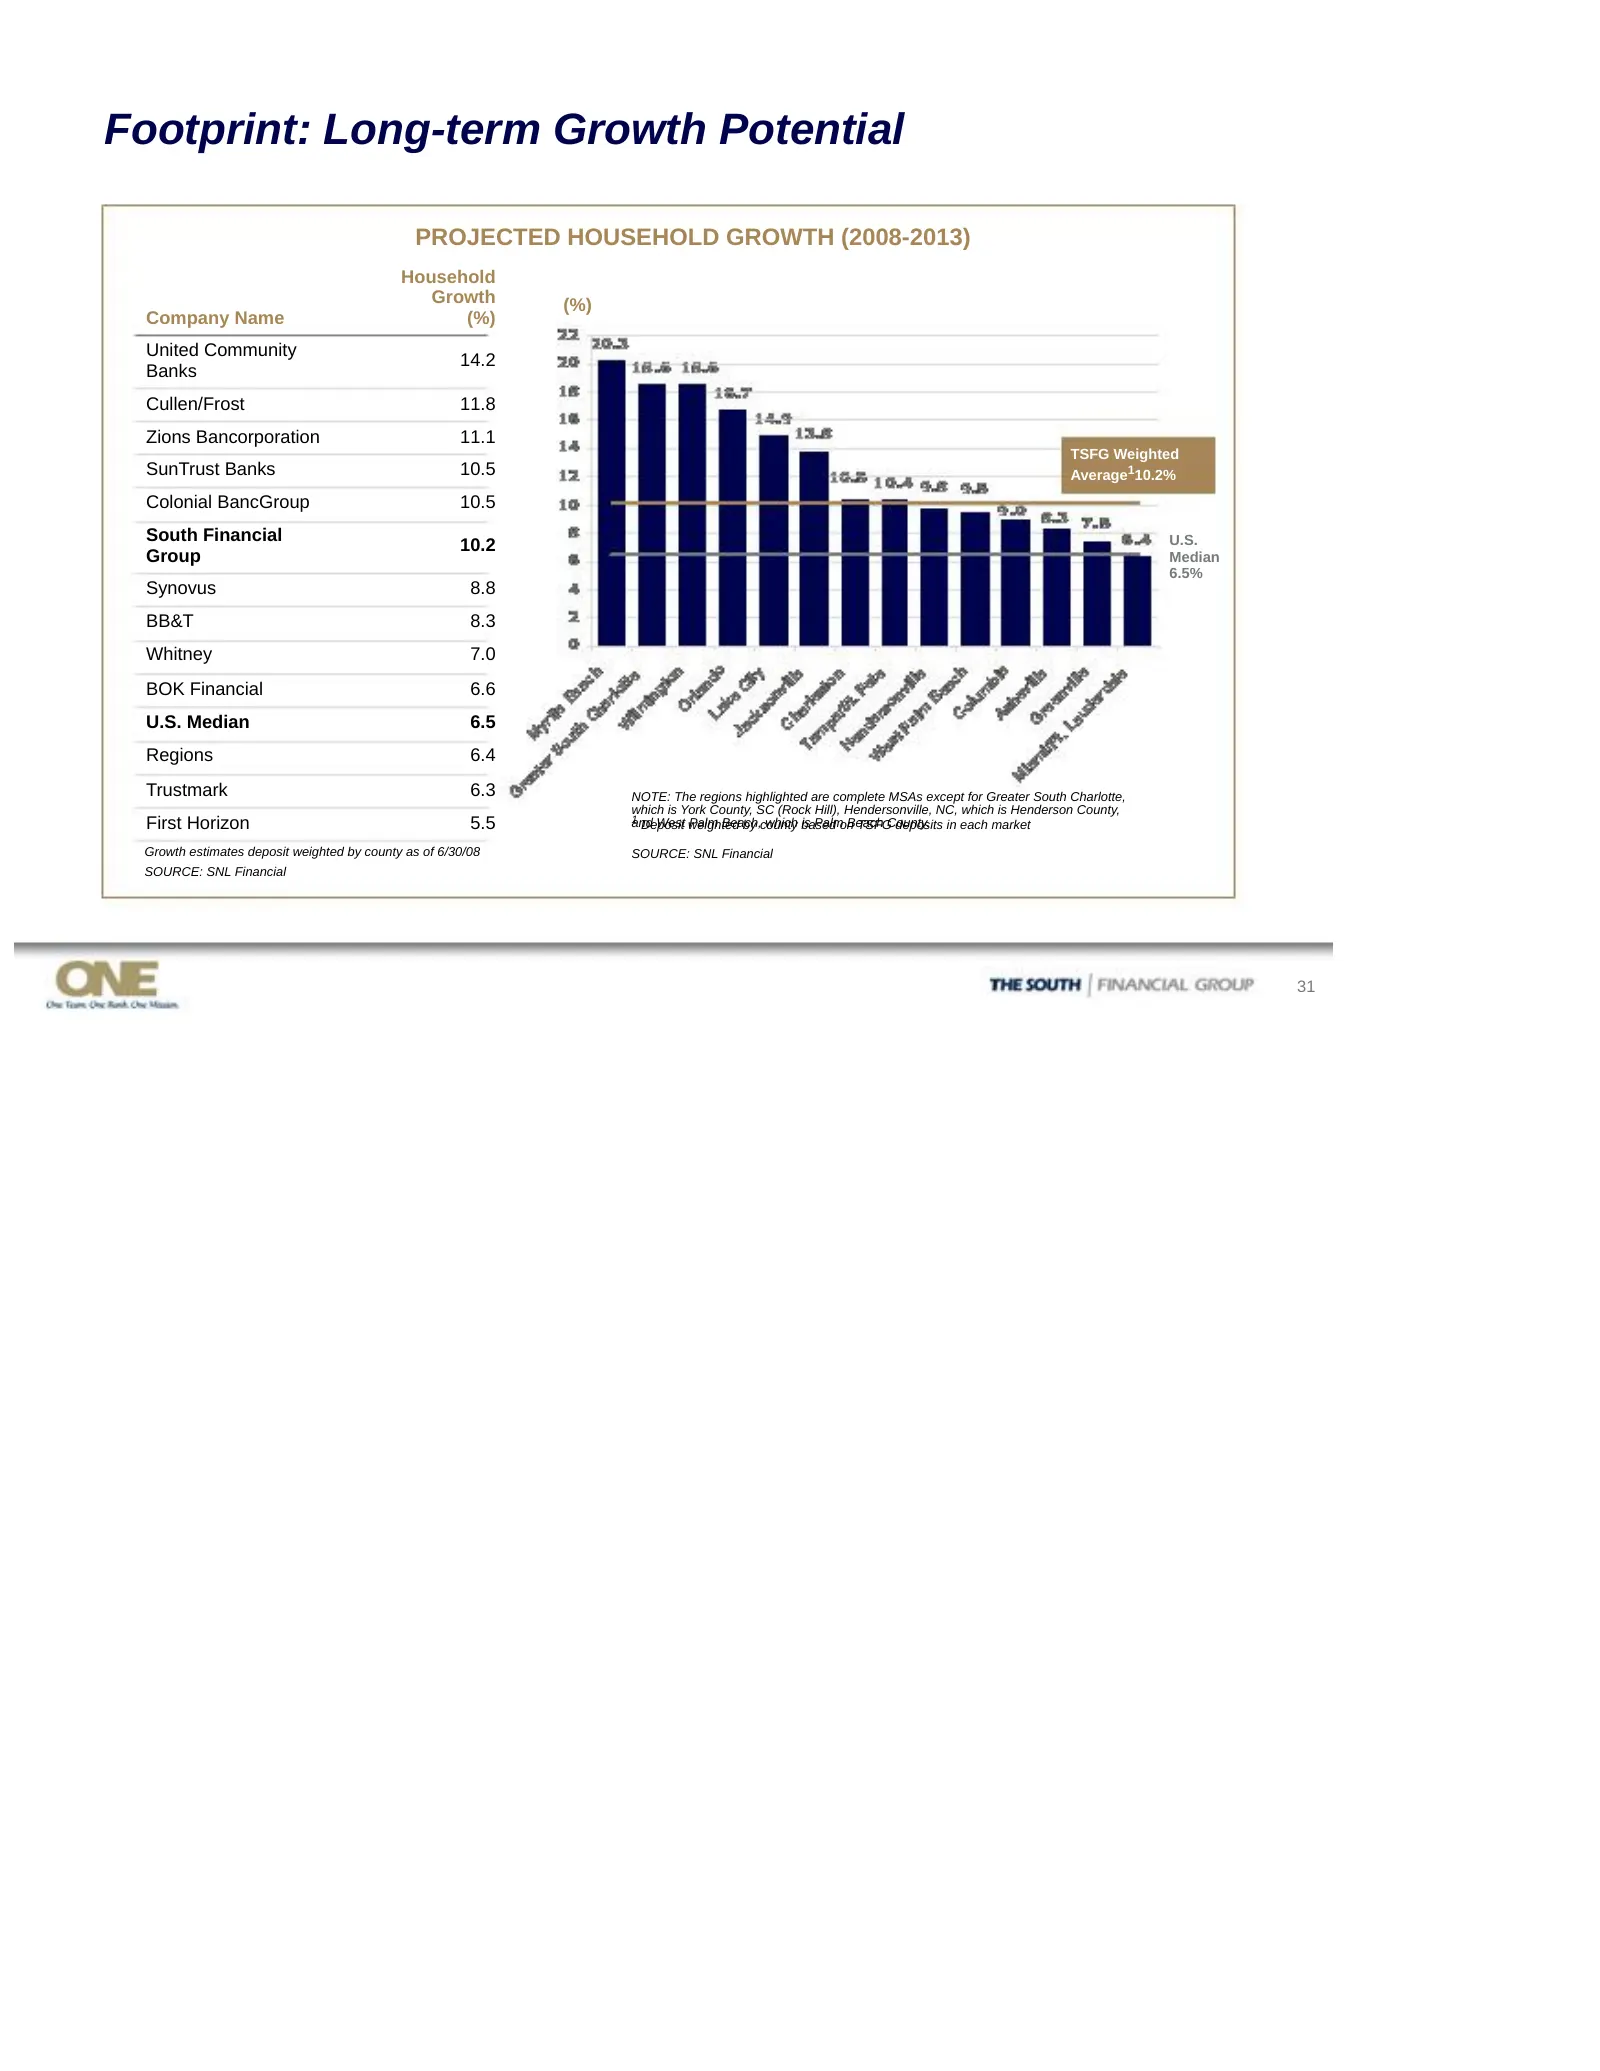
Footprint: Long-term Growth Potential PROJECTED HOUSEHOLD GROWTH (2008-2013) Household Growth (%) Company Name (%) United Community 14.2 Banks Cullen/Frost 11.8 Zions Bancorporation 11.1 TSFG Weighted SunTrust Banks 10.5 Average110.2% Colonial BancGroup 10.5 South Financial 10.2 U.S. Group Median 6.
Slide 32: For more information: Investor Relations
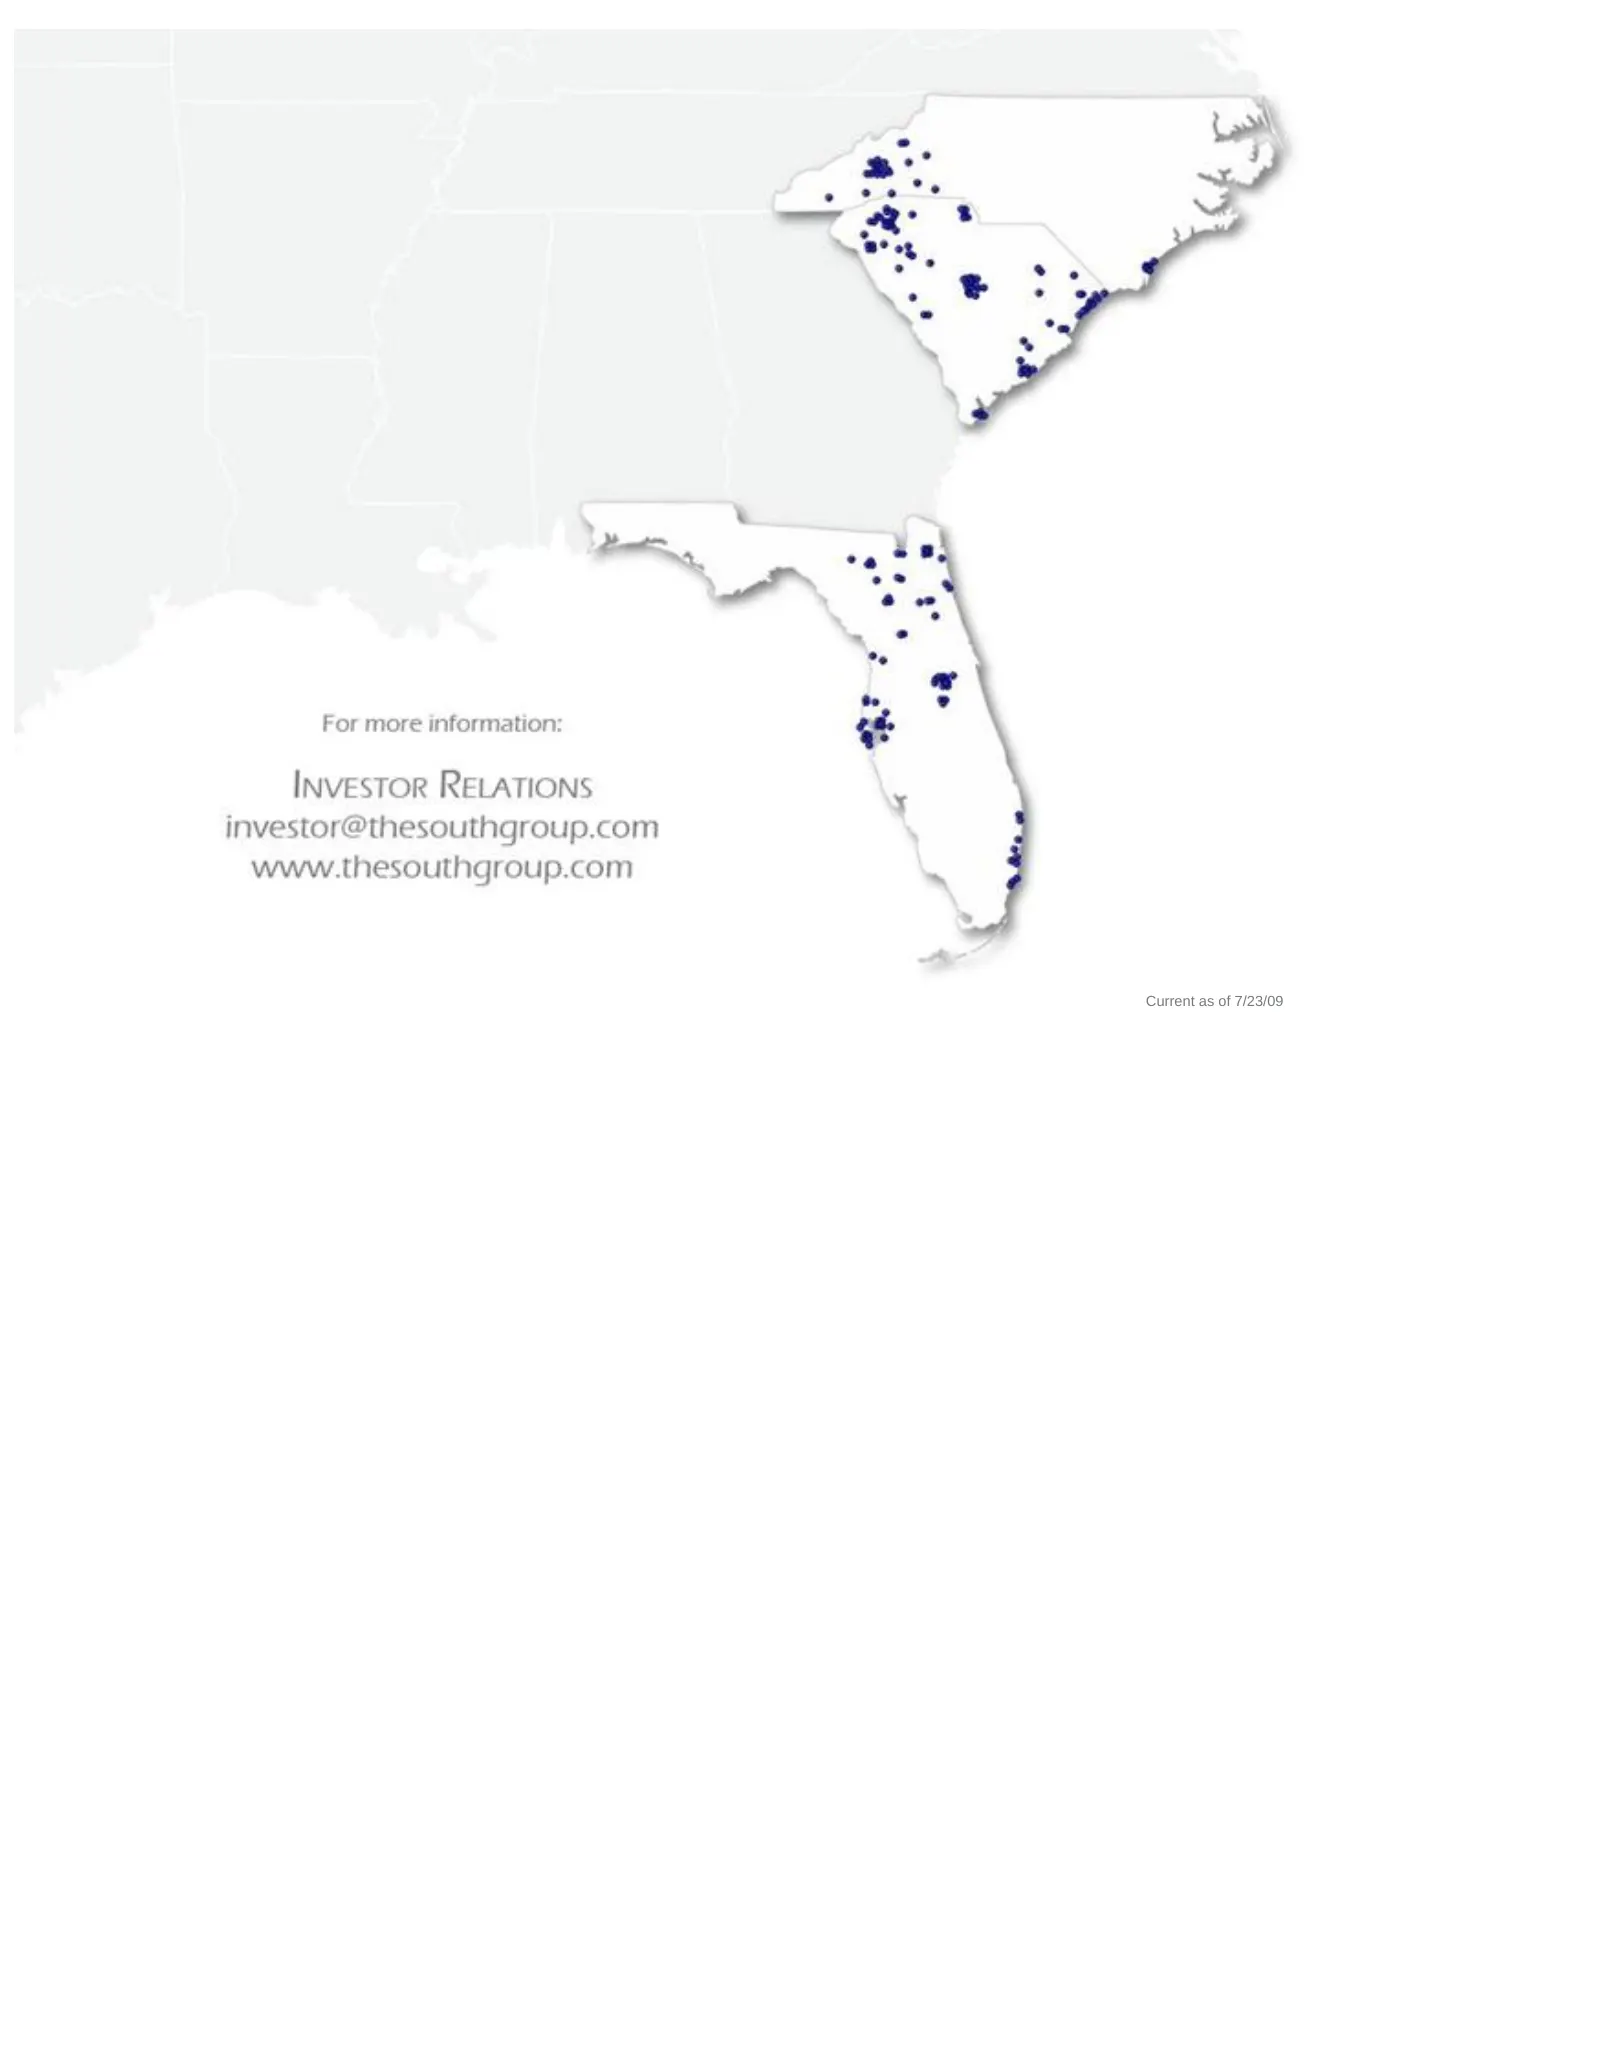
For more information: INVESTOR RELATIONS investor@thesouthgroup.com www.thesouthgroup.com Current as of 7/23/09
Source: SEC EDGAR · 8-K filed Jul 27, 2009
More decks from South Financial Group Inc
 Merger or Acquisition (June 2010)15 slides · Jun 29, 2010
 Debt Investor Presentation (June 2010)84 slides · Jun 18, 2010
 Merger or Acquisition (June 2010)43 slides · Jun 4, 2010
 Merger or Acquisition (May 2010)15 slides · May 17, 2010
 Q1 2010 Earnings Presentation30 slides · Apr 20, 2010
 Q4 2009 Earnings Presentation30 slides · Jan 26, 2010