Scatec ASA · OSL:SCATC
Scatec ASA — Scatec Solar — Investor Presentation (May 2016)
29 slides from Scatec ASA's investor presentation, May 2016
Slide 1: Investor presentation May 2016
Investor presentation May 2016 Our values • Predictable • Driving results • Changemakers • Working together
Slide 2: Disclaimer
Disclaimer The following presentation is being made only to, and is only directed at, persons to whom such presentation may lawfully be communicated (’relevant persons’). Any person who is not a relevant person should not rely, act or make assessment on the basis of this presentation or anything inc
Slide 3: Introduction to Scatec Solar ASA
Introduction to Scatec Solar ASA
Slide 4: Scatec Solar - an independent solar power producer
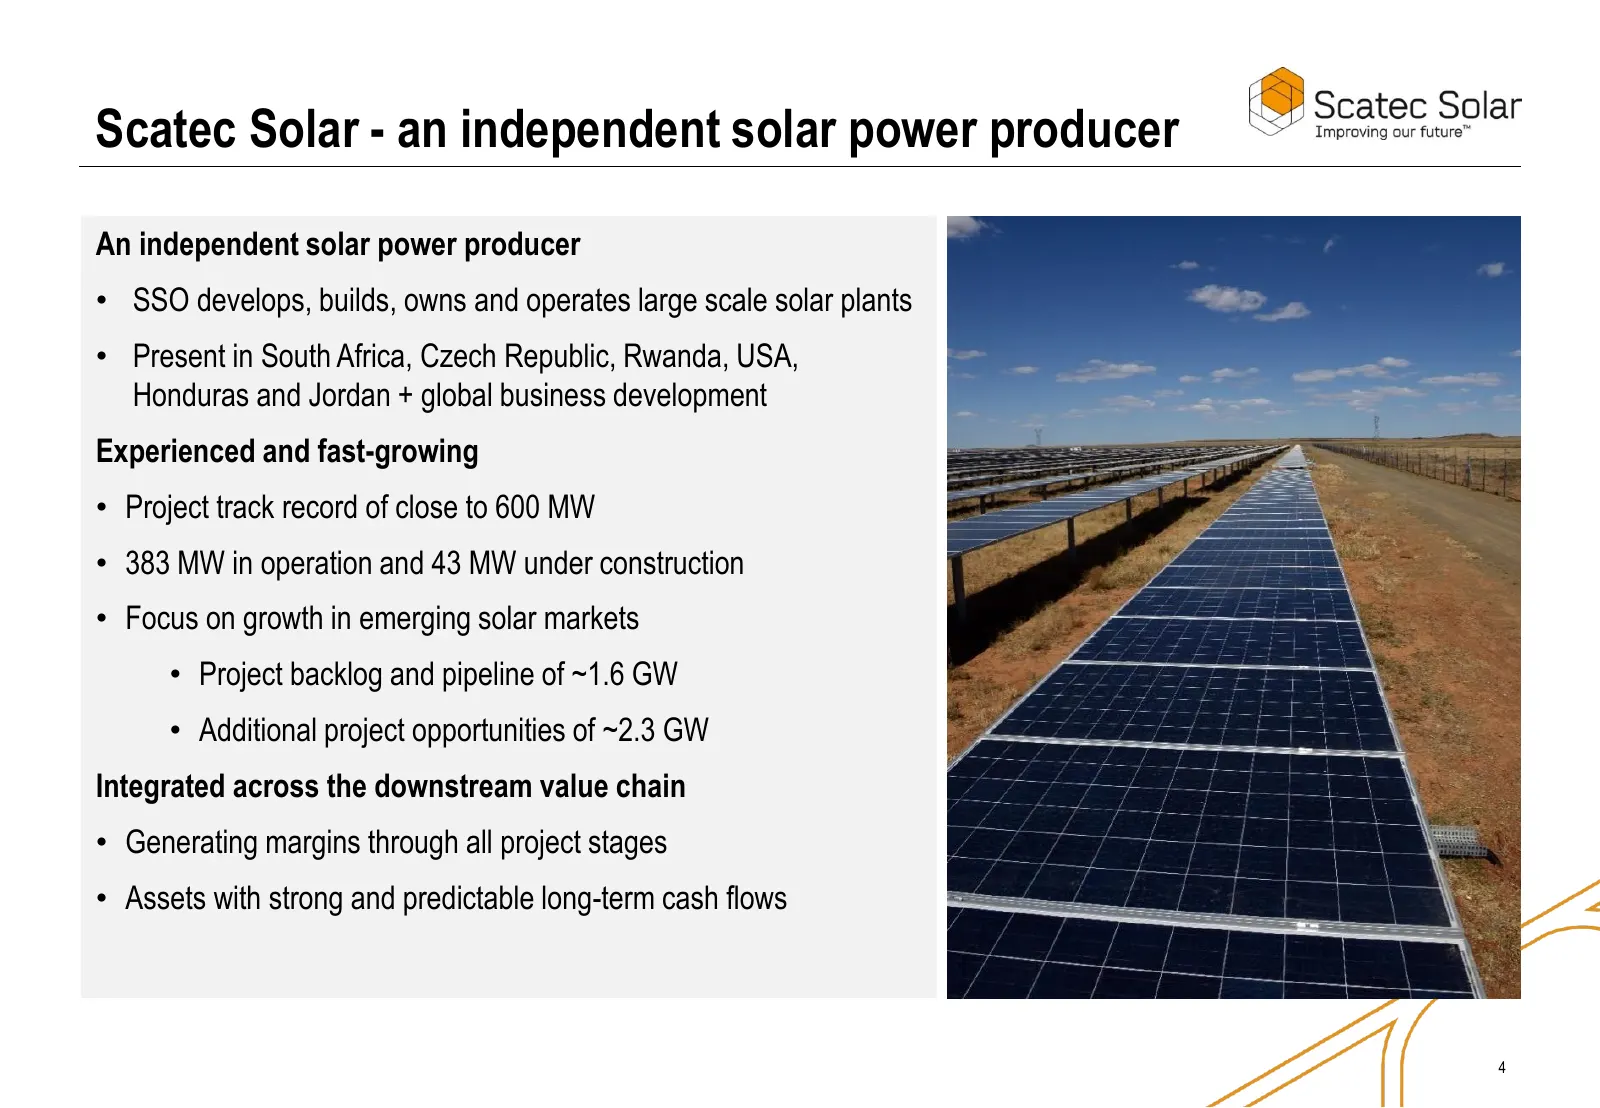
Scatec Solar - an independent solar power producer An independent solar power producer • SSO develops, builds, owns and operates large scale solar plants • Present in South Africa, Czech Republic, Rwanda, USA, Honduras and Jordan + global business development Experienced and fast-growing • Project t
Slide 5: SSO: An Integrated Independent Power Producer
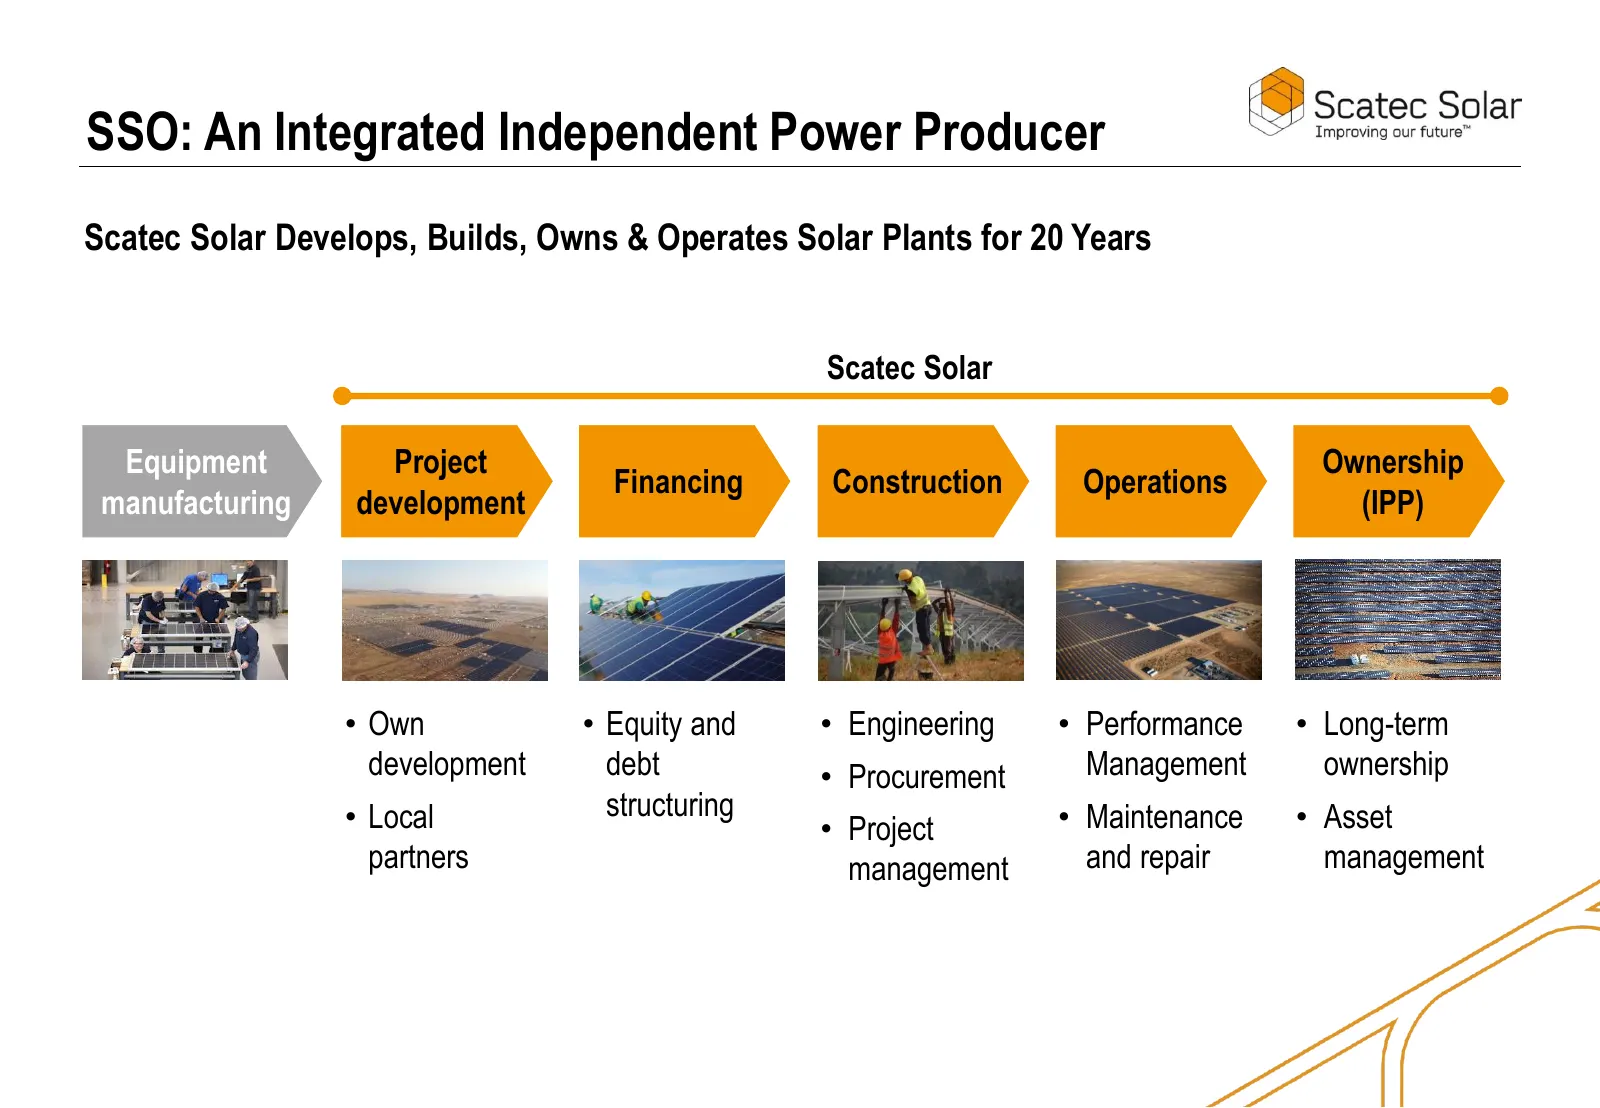
SSO: An Integrated Independent Power Producer Scatec Solar Develops, Builds, Owns & Operates Solar Plants for 20 Years Scatec Solar Equipment Project Ownership Financing Construction Operations manufacturing development (IPP) • Own • Equity and • Engineering • Performance • Long-term development deb
Slide 6: Scatec Solar asset portfolio – 848 MW
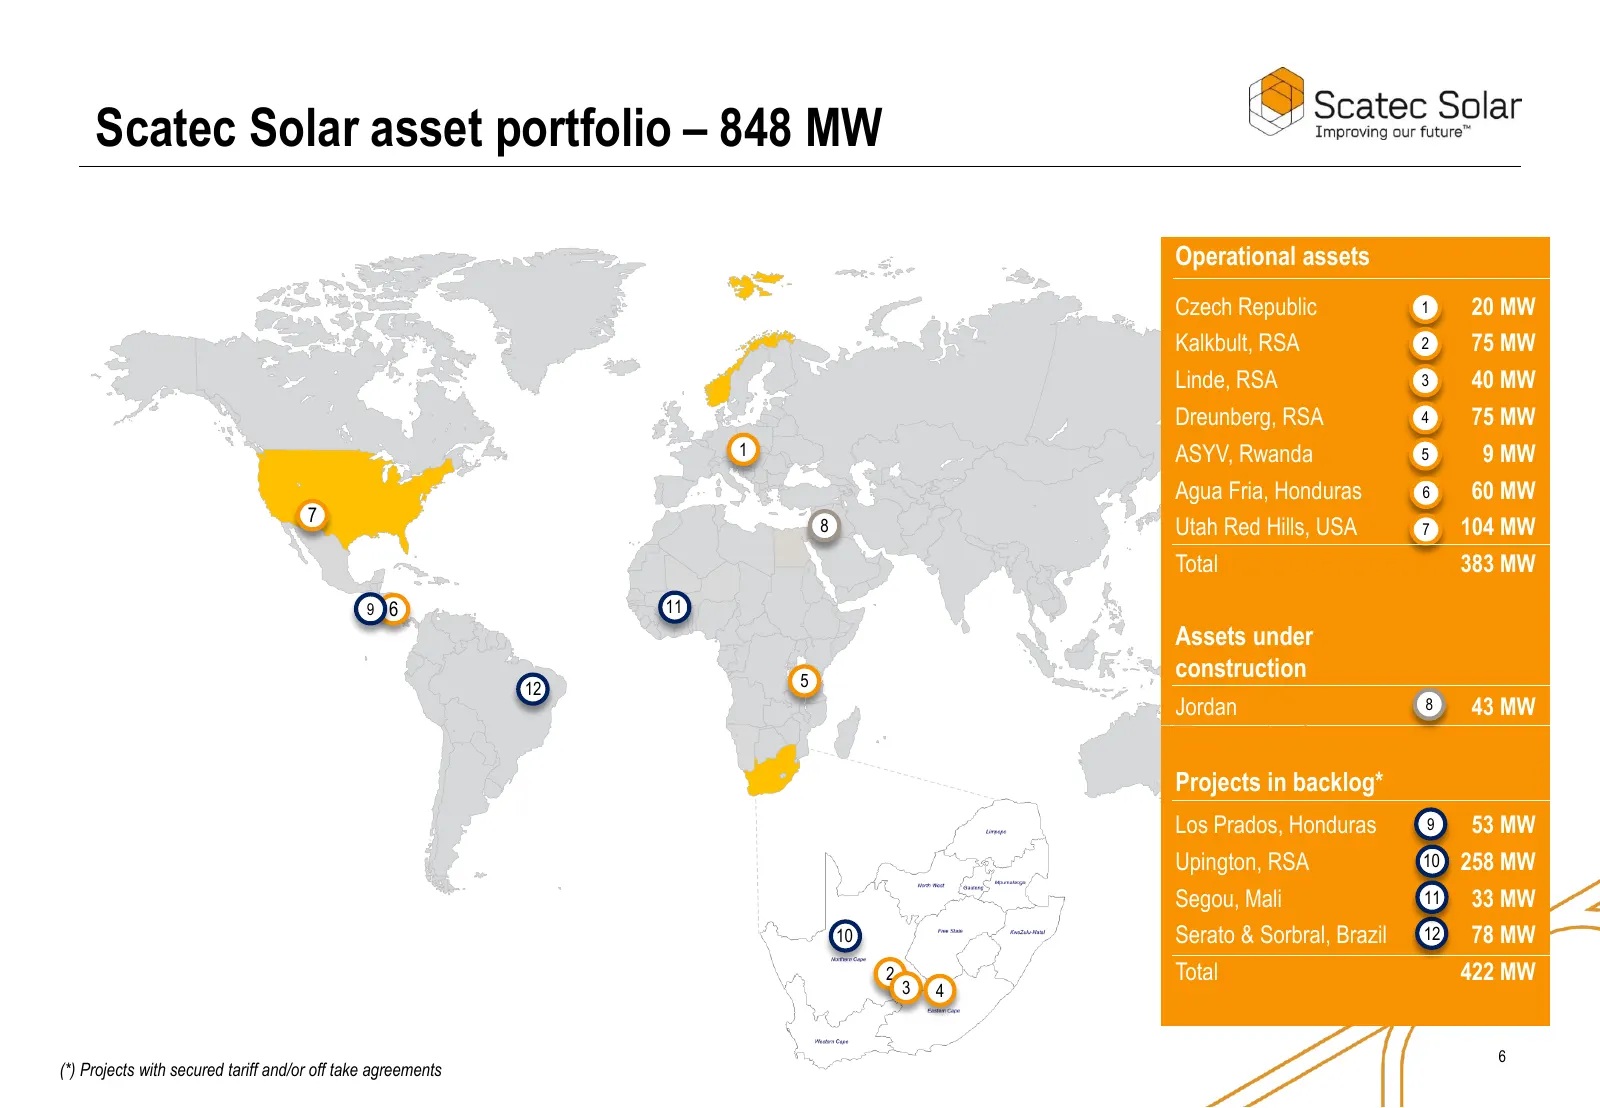
Scatec Solar asset portfolio – 848 MW Operational assets Czech Republic 1 20 MW Kalkbult, RSA 2 75 MW Linde, RSA 3 40 MW Dreunberg, RSA 4 75 MW 1 ASYV, Rwanda 5 9 MW Agua Fria, Honduras 6 60 MW 7 8 Utah Red Hills, USA 7 104 MW Total 383 MW 9 6 11 Assets under 5 construction 12 Jordan 8 43 MW Project
Slide 7: The 10 MW Oryx solar power plant in Jordan
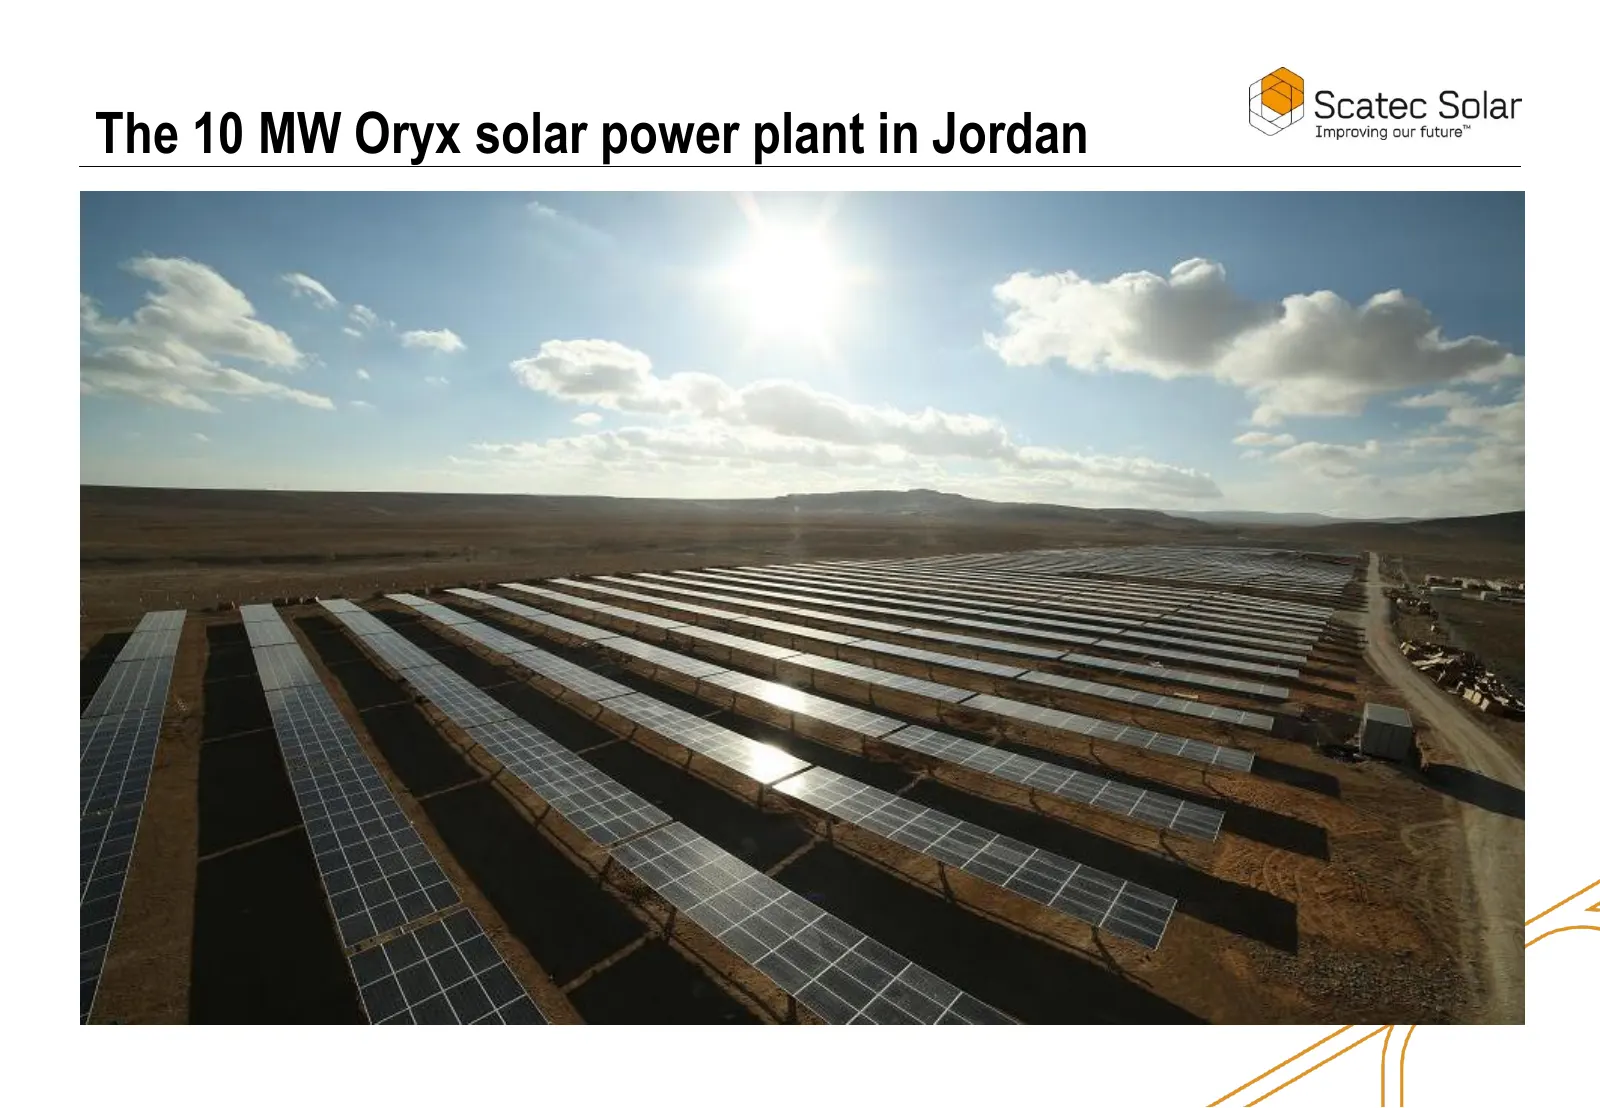
The 10 MW Oryx solar power plant in Jordan
Slide 8: Project development: a solid project funnel
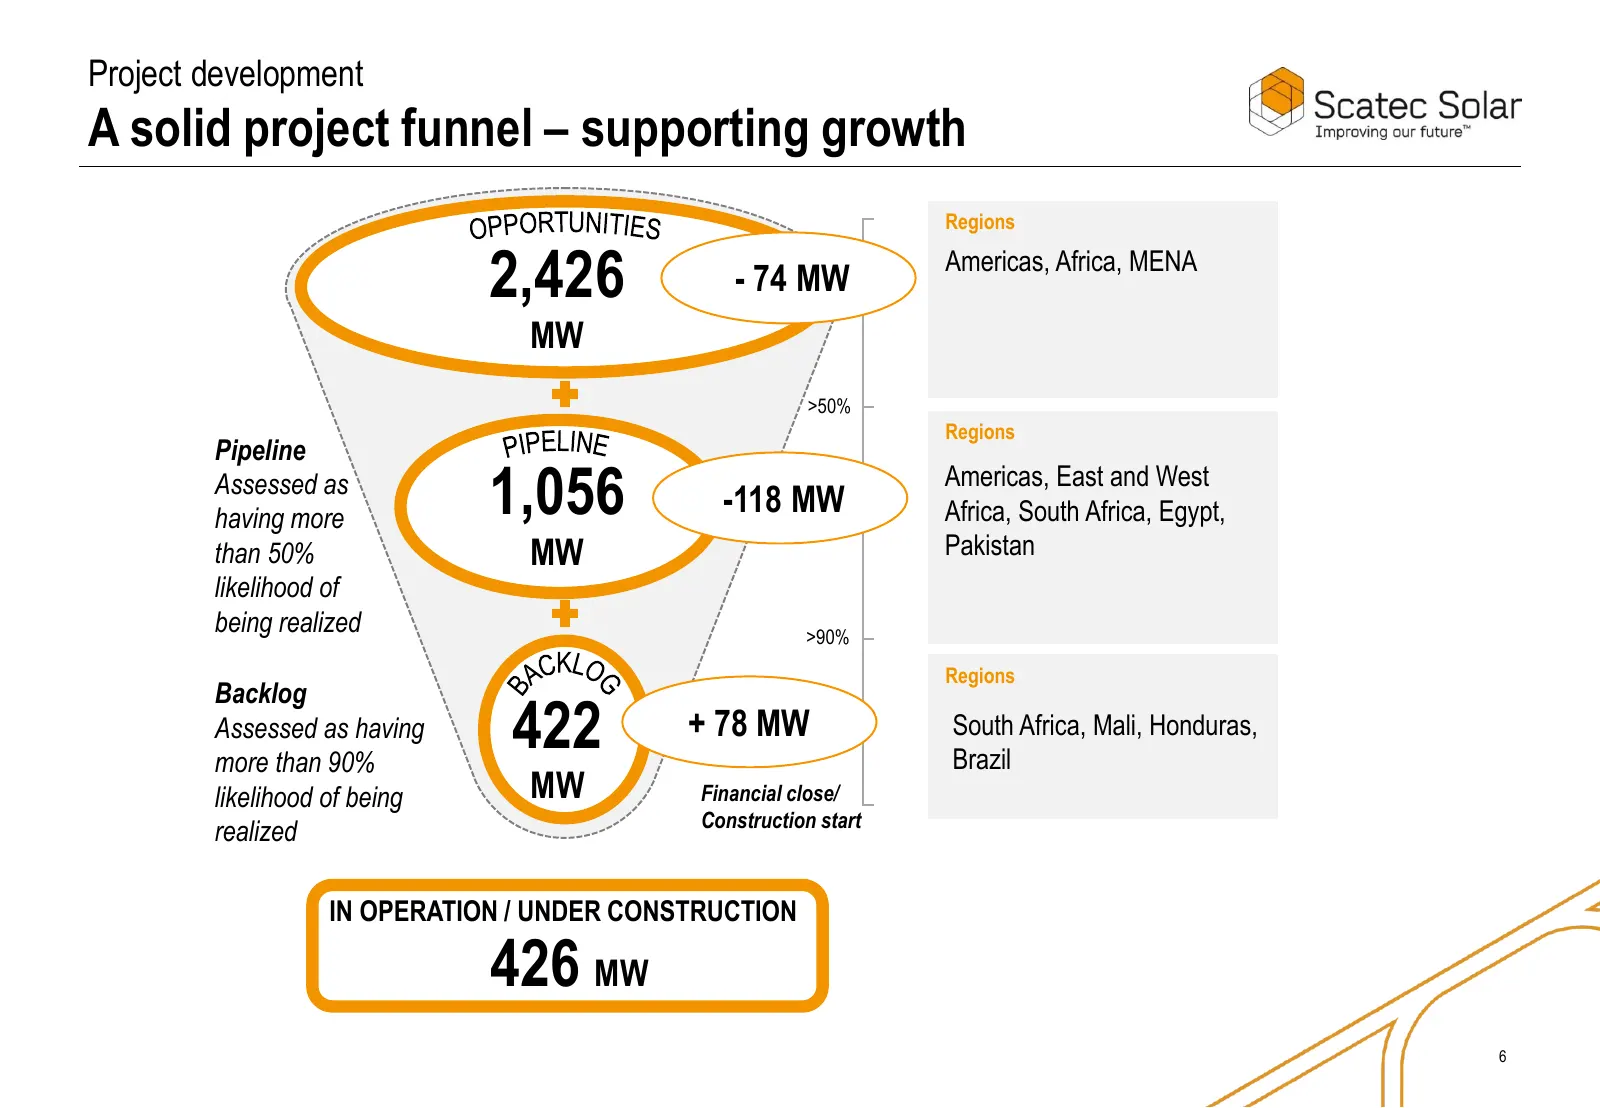
Project development A solid project funnel – supporting growth Regions 2,426 - 74 MW Americas, Africa, MENA MW >50% Regions Pipeline Assessed as having more 1,056 -118 MW Americas, East and West Africa, South Africa, Egypt, than 50% MW Pakistan likelihood of being realized >90% Regions Backlog Asses
Slide 9: A comprehensive project structuring phase
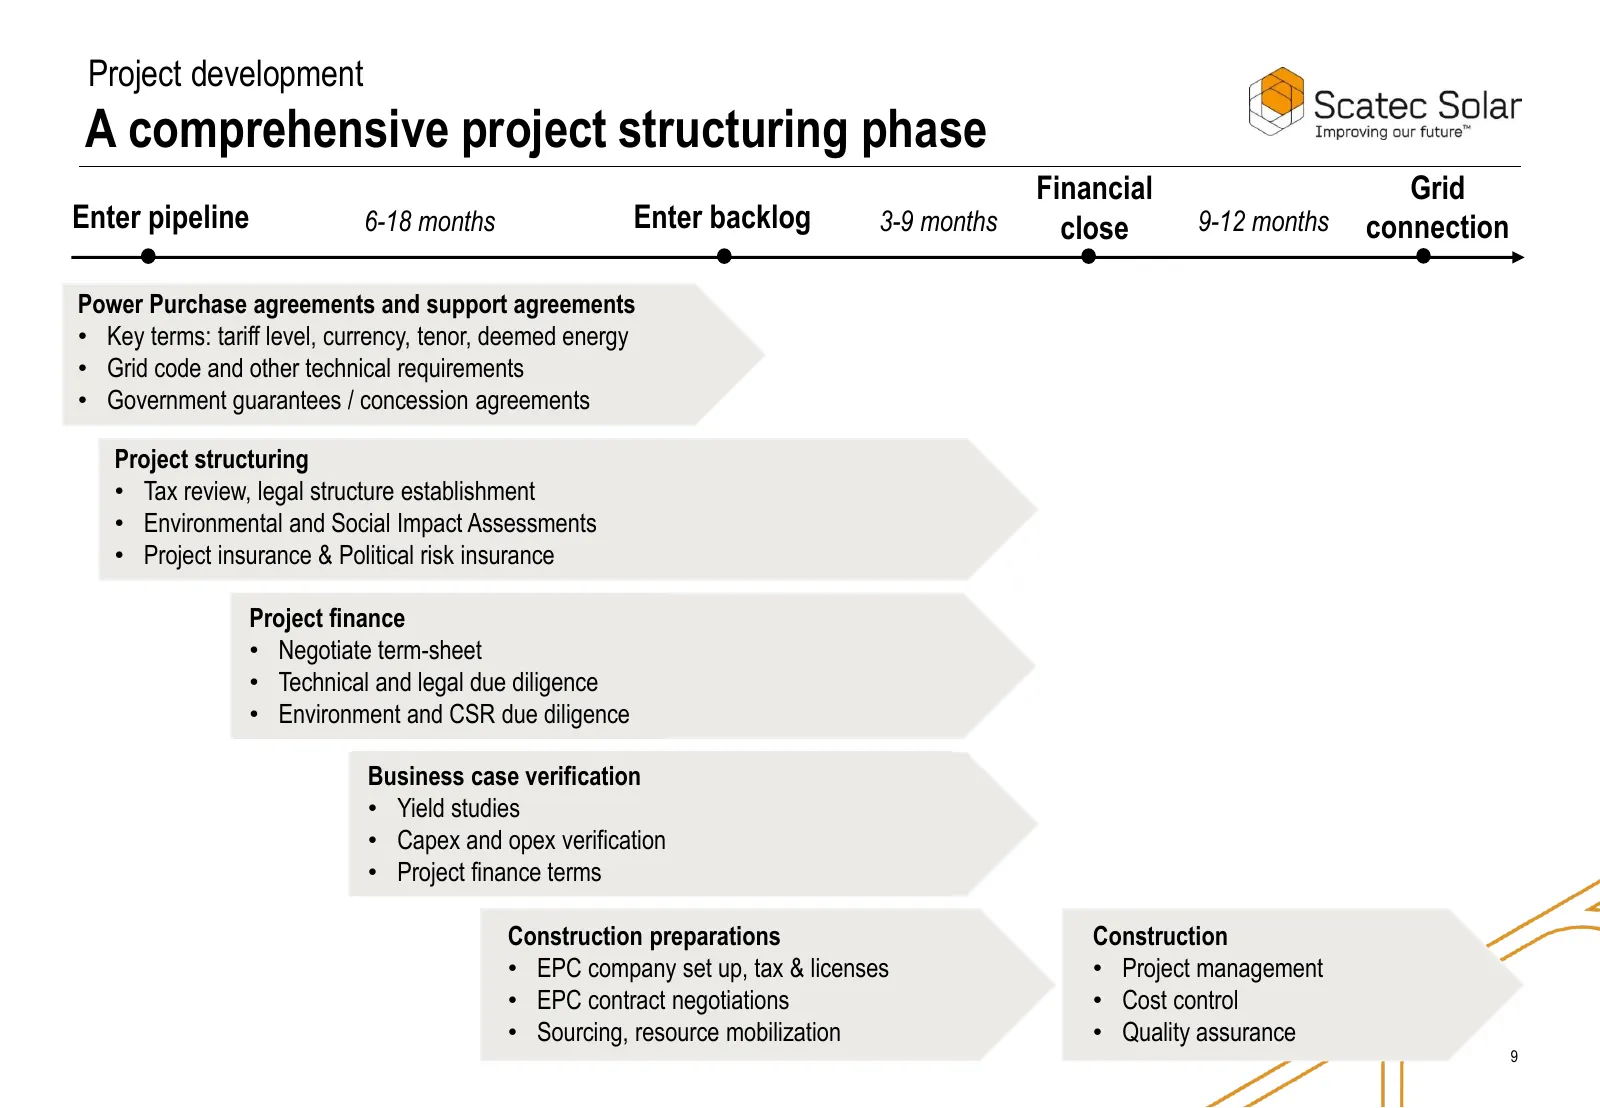
Project development A comprehensive project structuring phase Financial Grid Enter pipeline 6-18 months Enter backlog 3-9 months close 9-12 months connection Power Purchase agreements and support agreements • Key terms: tariff level, currency, tenor, deemed energy • Grid code and other technical req
Slide 10: 78 MW added to backlog since Q4'15 reporting
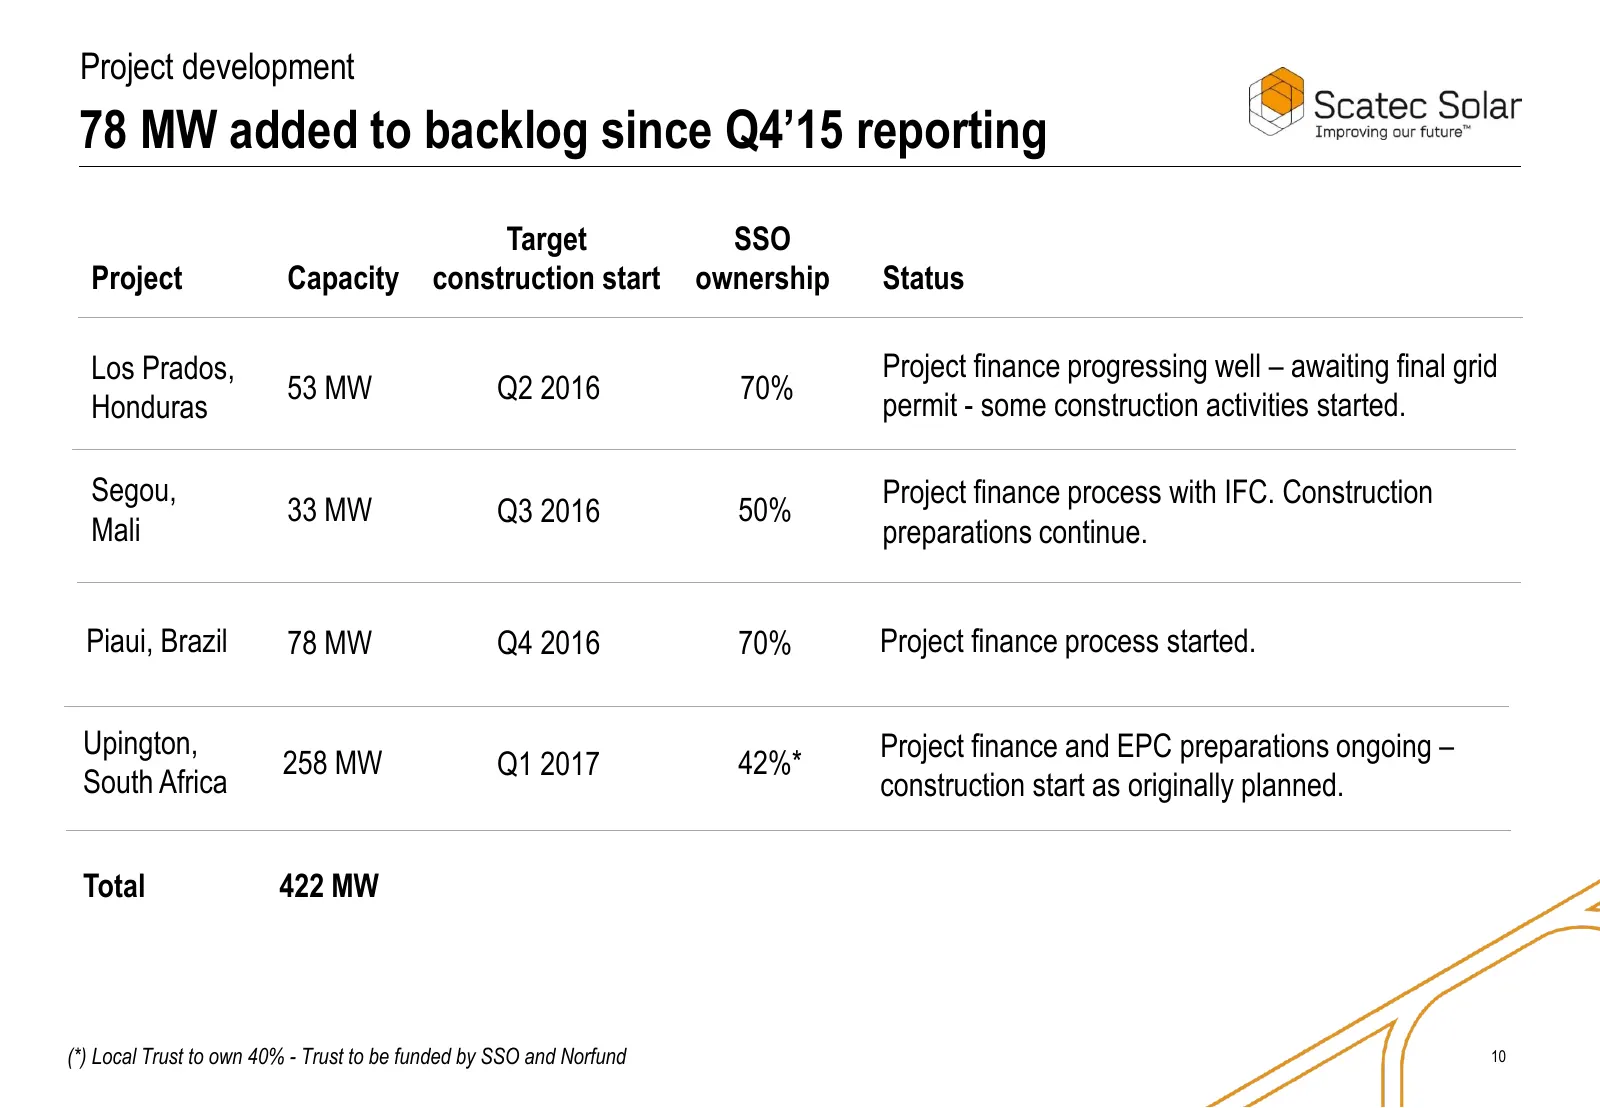
Project development 78 MW added to backlog since Q4’15 reporting Target SSO Project Capacity construction start ownership Status Los Prados, Project finance progressing well – awaiting final grid 53 MW Q2 2016 70% Honduras permit - some construction activities started. Segou, Project finance process
Slide 11: High project development activity across the pipeline
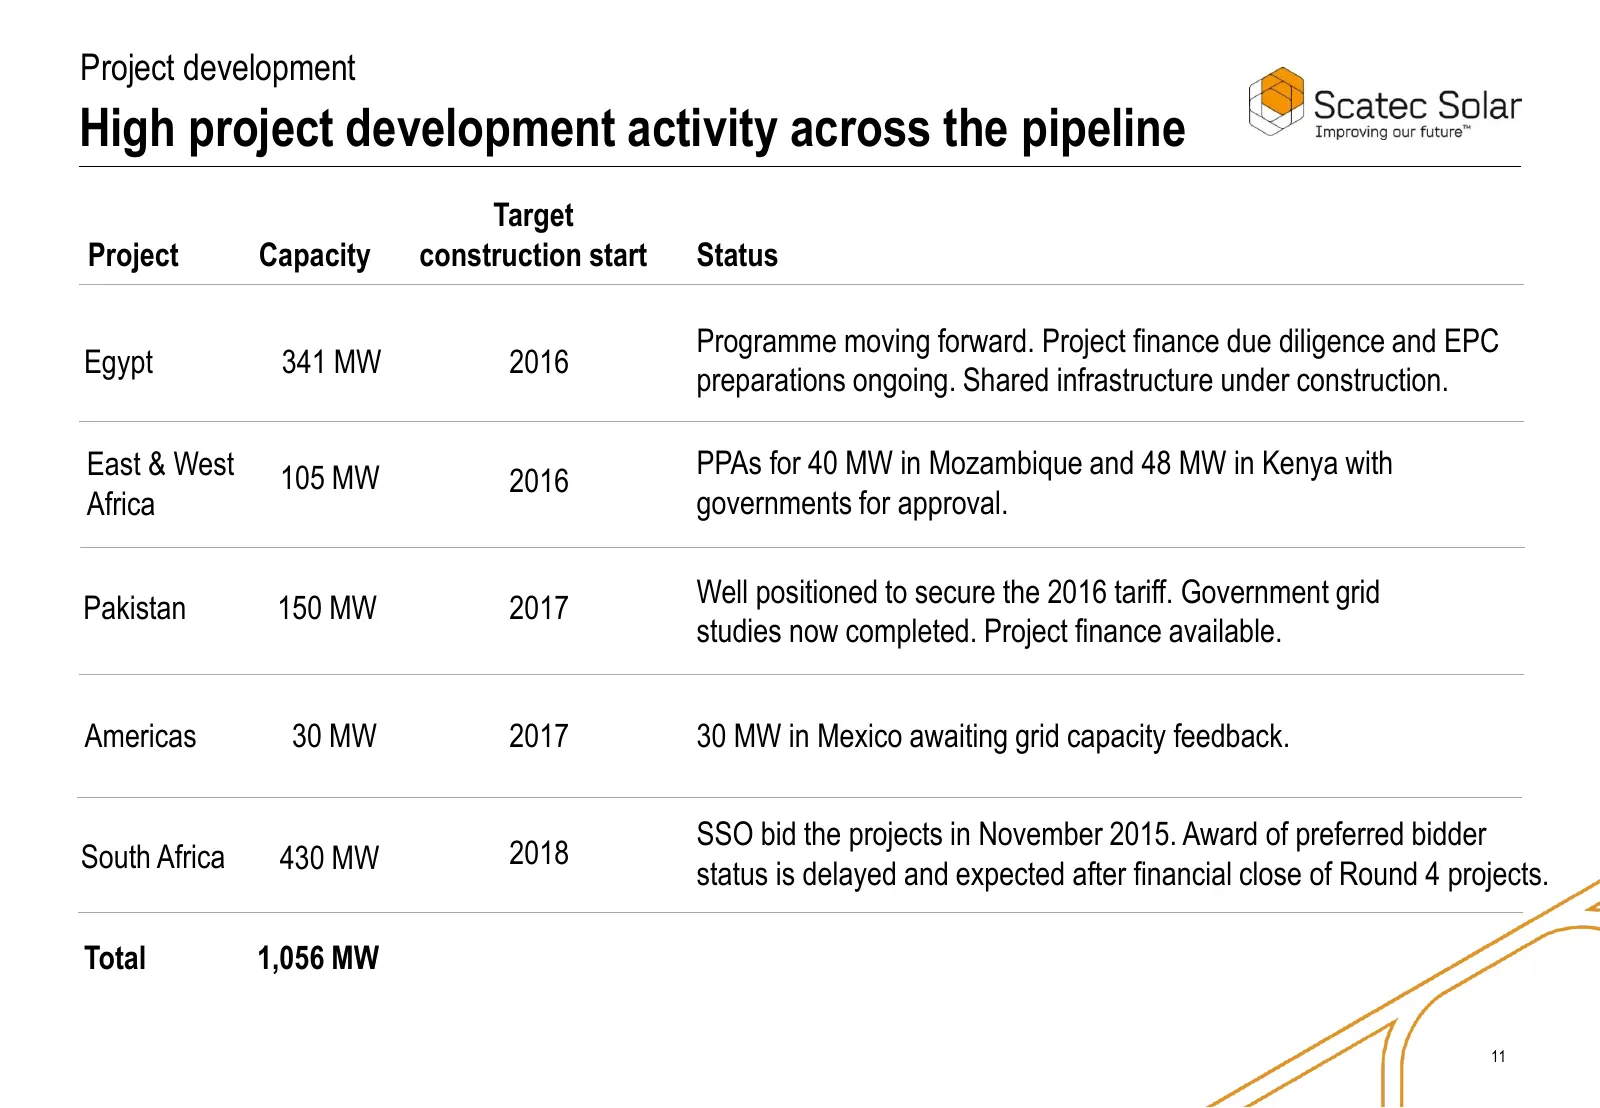
Project development High project development activity across the pipeline Target Project Capacity construction start Status Programme moving forward. Project finance due diligence and EPC Egypt 341 MW 2016 preparations ongoing. Shared infrastructure under construction. East & West 105 MW PPAs for 40
Slide 12: Access to financing: Norfund, IFC and other partnerships
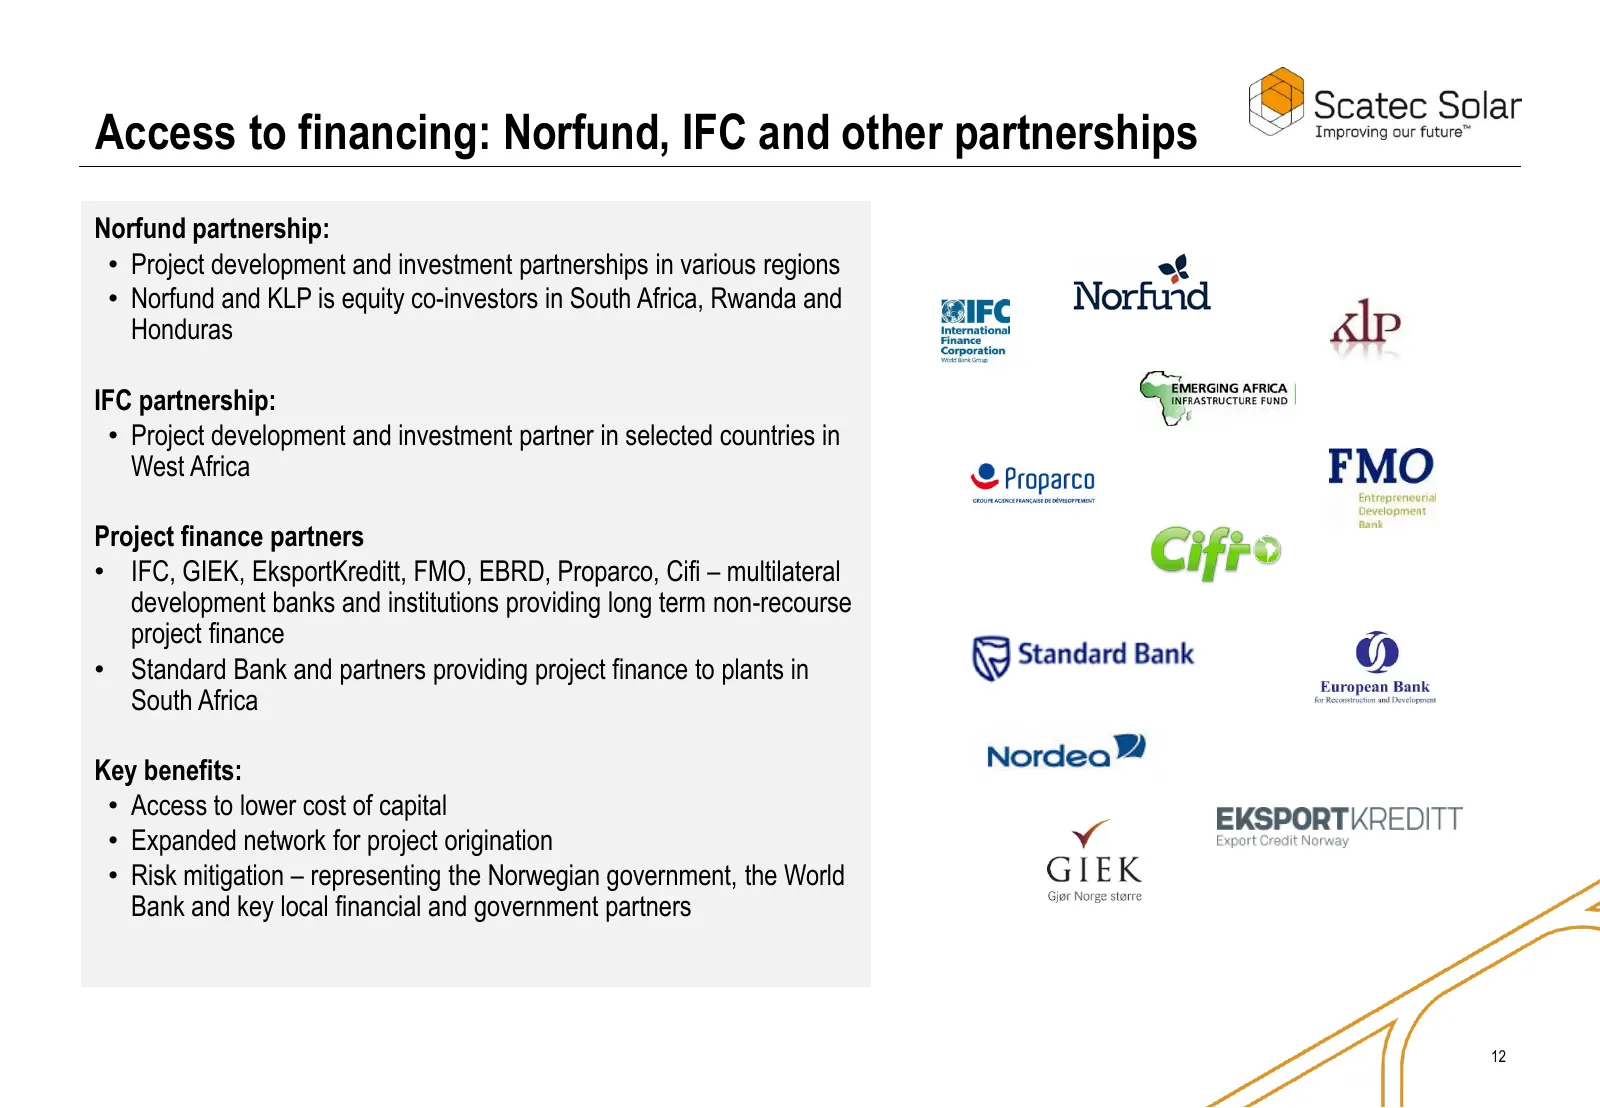
Access to financing: Norfund, IFC and other partnerships Norfund partnership: • Project development and investment partnerships in various regions • Norfund and KLP is equity co-investors in South Africa, Rwanda and Honduras IFC partnership: • Project development and investment partner in selected c
Slide 13: Our business model and typical legal structure
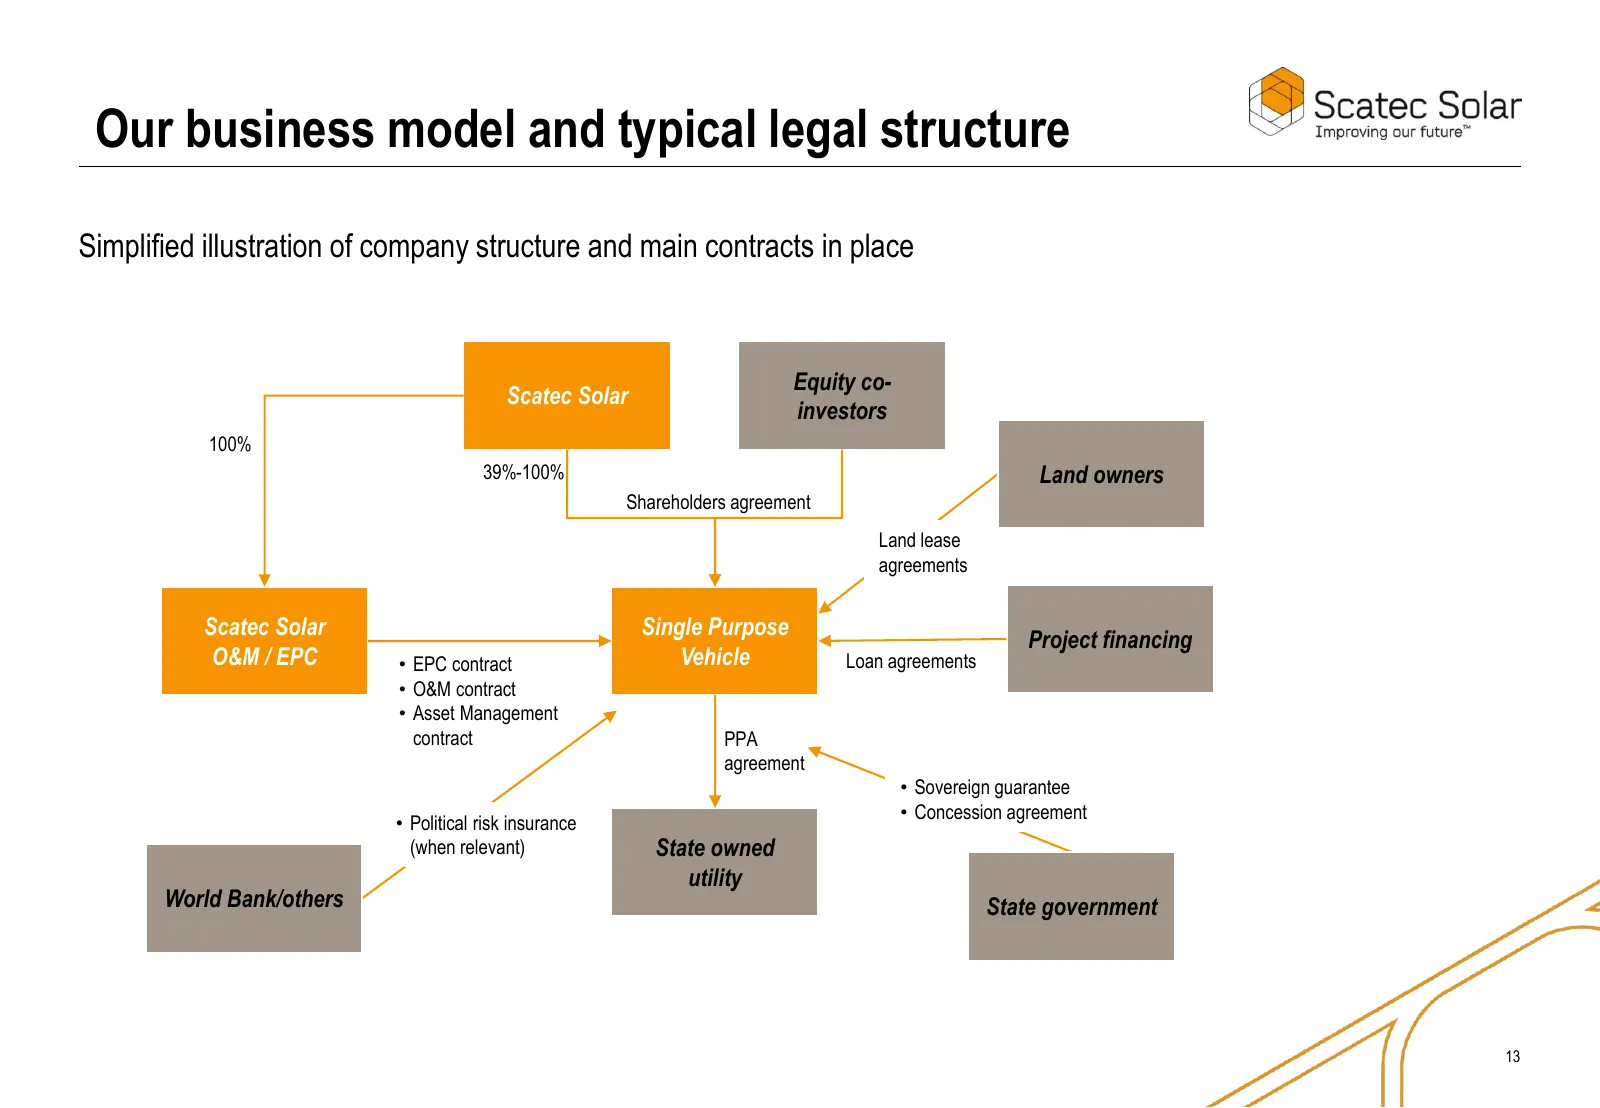
Our business model and typical legal structure Simplified illustration of company structure and main contracts in place Equity co- Scatec Solar investors 100% 39%-100% Land owners Shareholders agreement Land lease agreements Scatec Solar Single Purpose Project financing O&M / EPC • EPC contract Vehi
Slide 14: Financials
o Scatec Solar Improving our future™ Financials
Slide 15: Continued strong growth
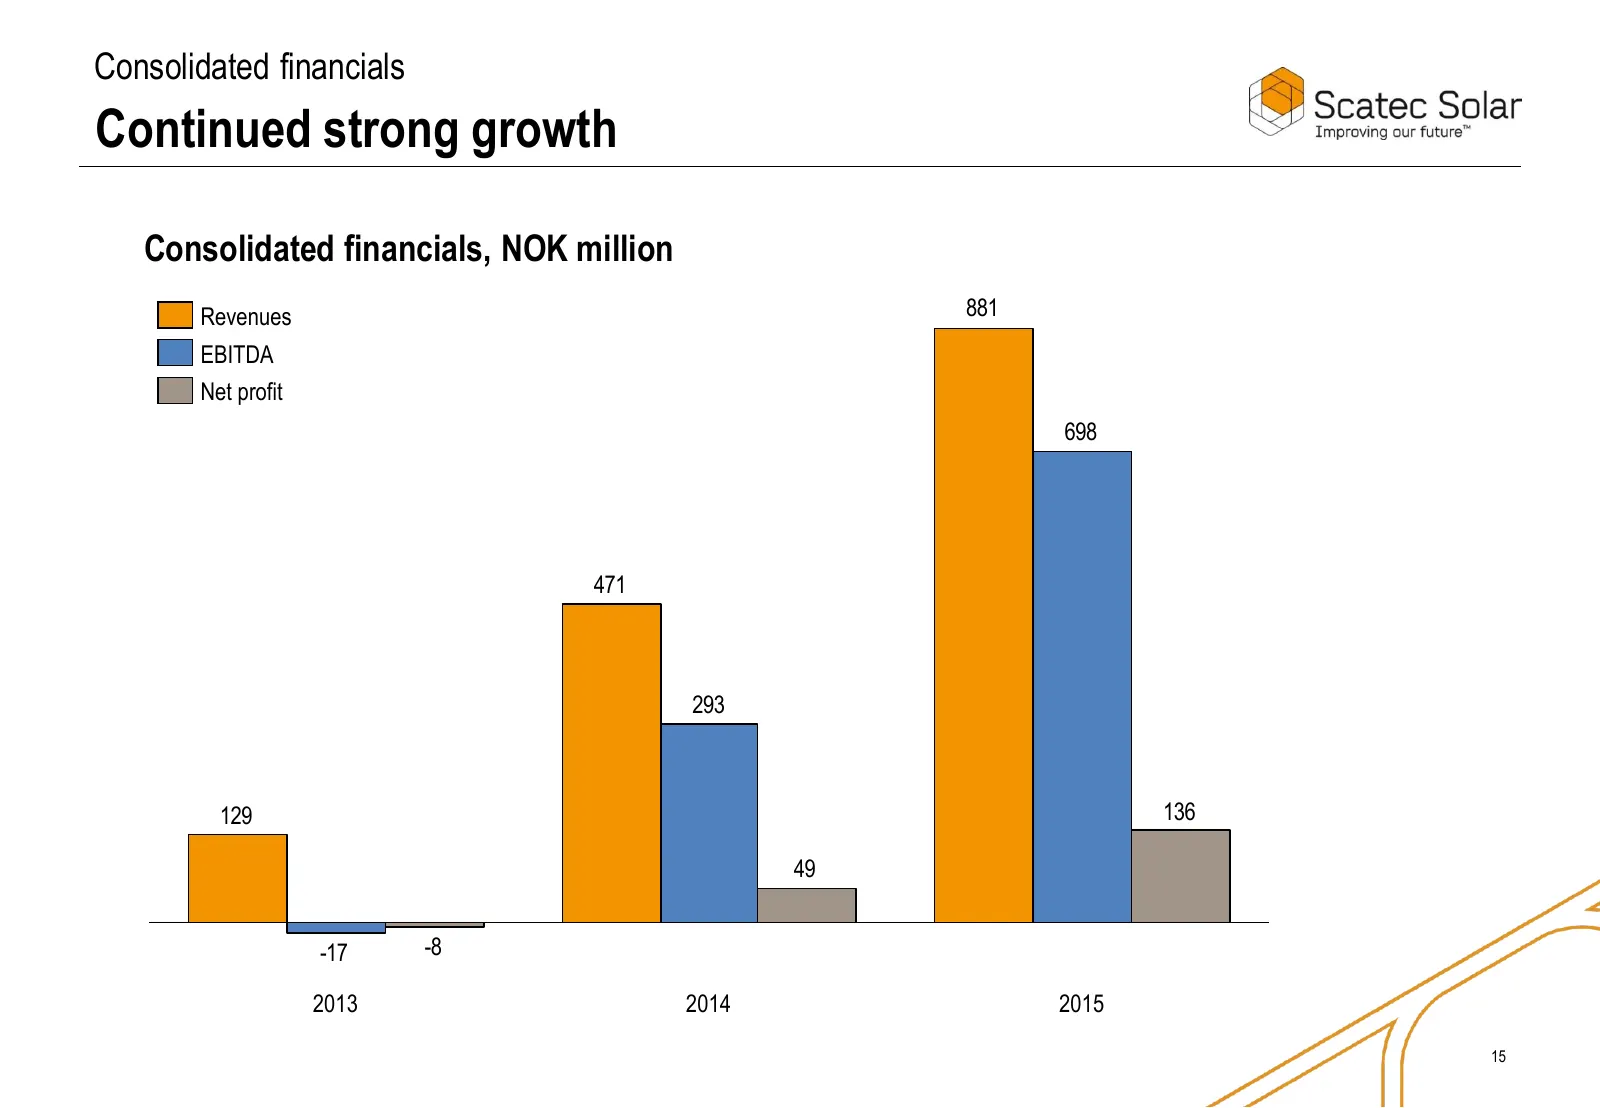
Consolidated financials Continued strong growth Consolidated financials, NOK million Revenues 881 EBITDA Net profit 698 471 293 129 136 49 -17 -8 2013 2014 2015 15
Slide 16: Consolidated financials
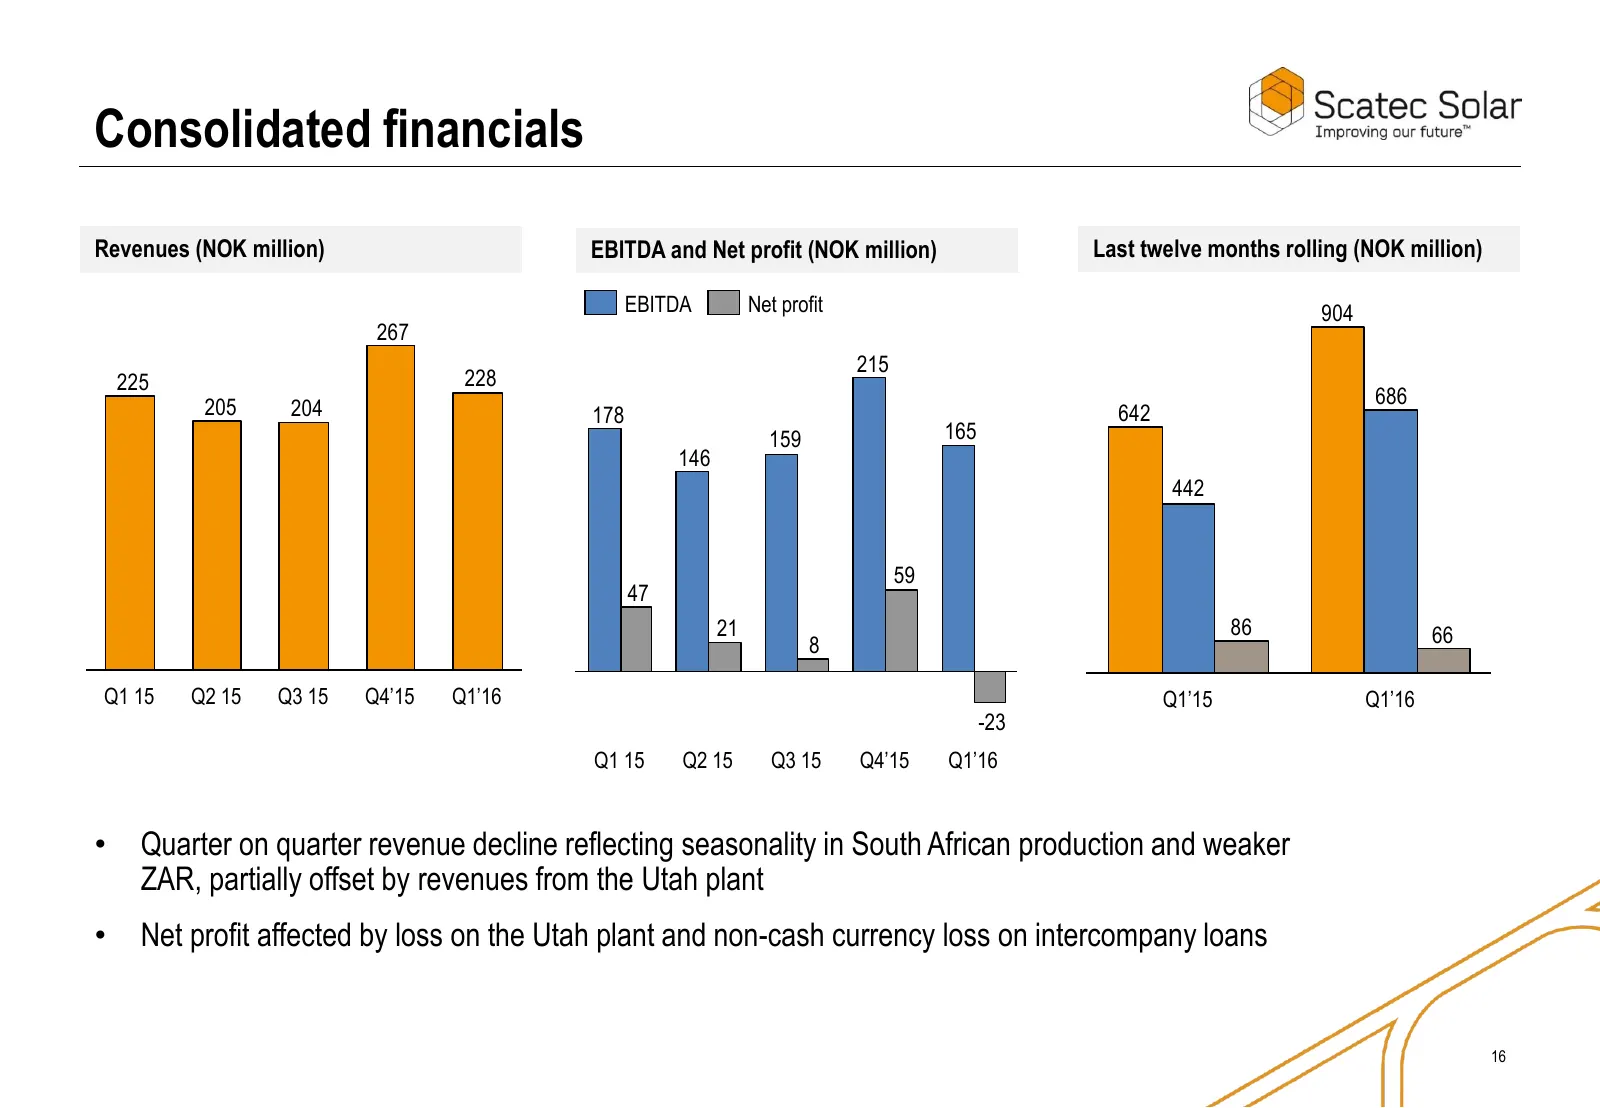
Consolidated financials Revenues (NOK million) EBITDA and Net profit (NOK million) Last twelve months rolling (NOK million) EBITDA Net profit 904 267 215 225 228 205 686 204 178 642 159 165 146 442 59 47 21 86 66 8 Q1 15 Q2 15 Q3 15 Q4’15 Q1’16 Q1’15 Q1’16 -23 Q1 15 Q2 15 Q3 15 Q4’15 Q1’16 • Quarter
Slide 17: The 104 MW Utah plant in full production
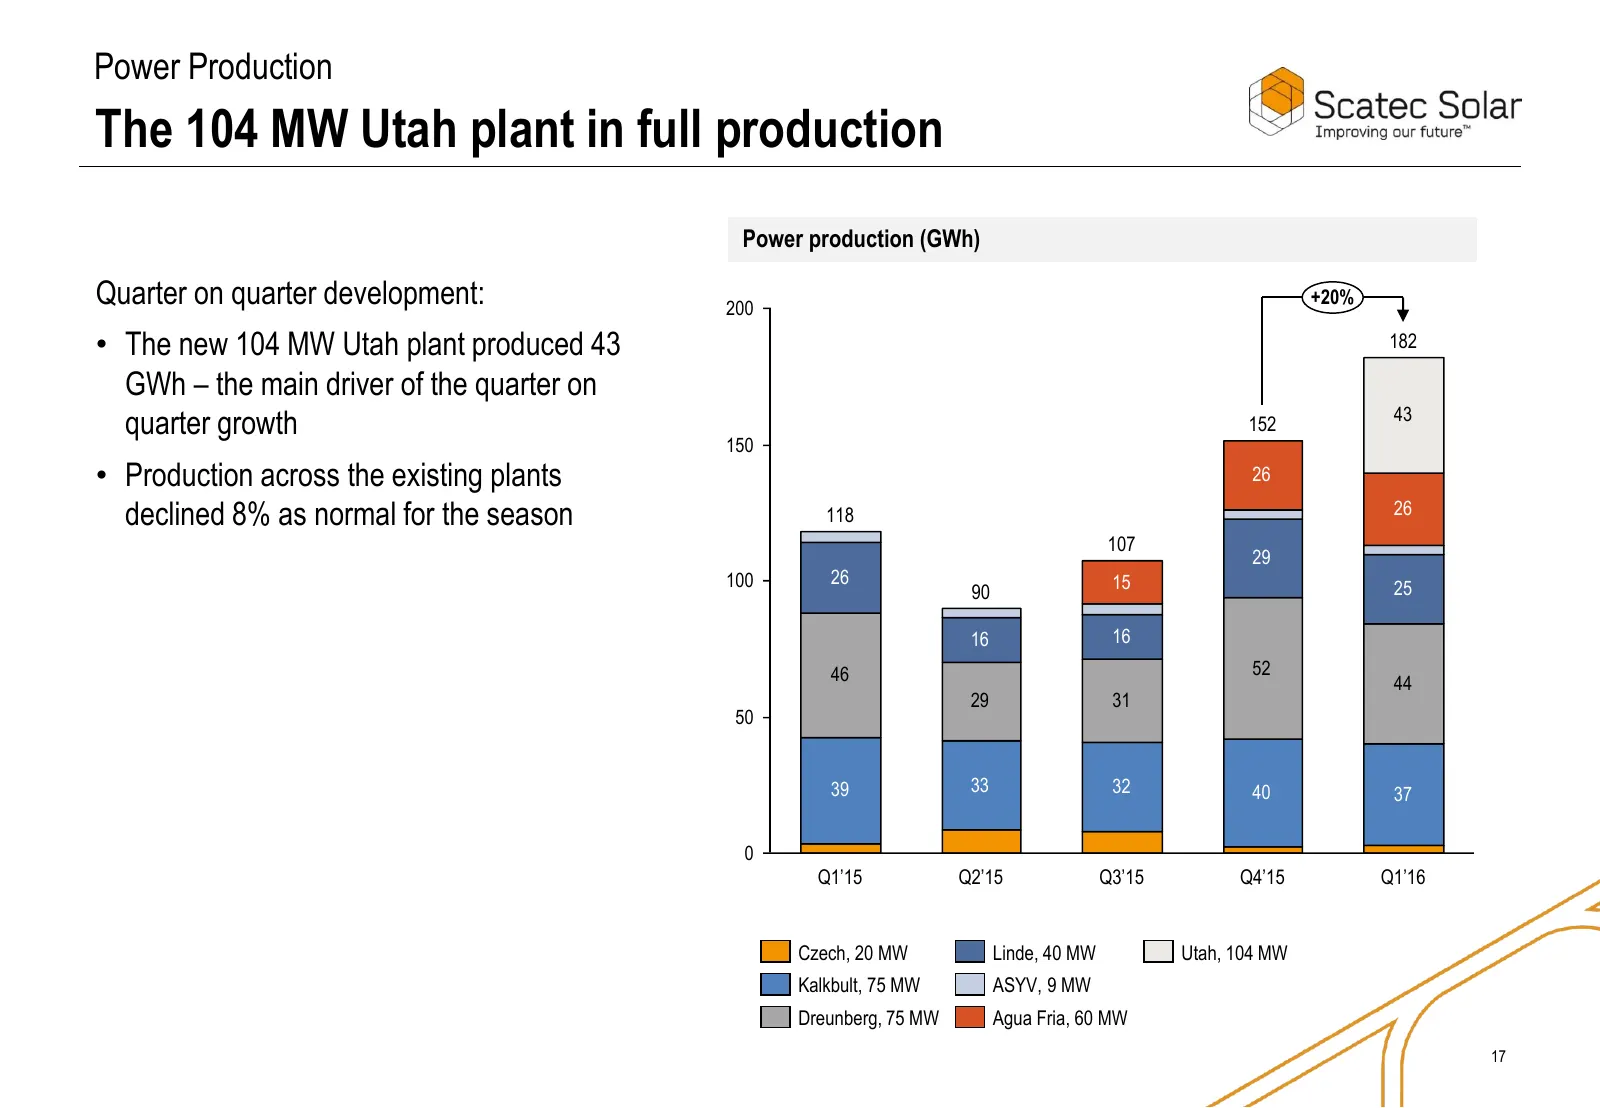
Power Production The 104 MW Utah plant in full production Power production (GWh) Quarter on quarter development: 200 +20% • The new 104 MW Utah plant produced 43 182 GWh – the main driver of the quarter on 43 quarter growth 152 150 • Production across the existing plants 26 declined 8% as normal for
Slide 18: A 20 year PPA with fixed power price from 2017
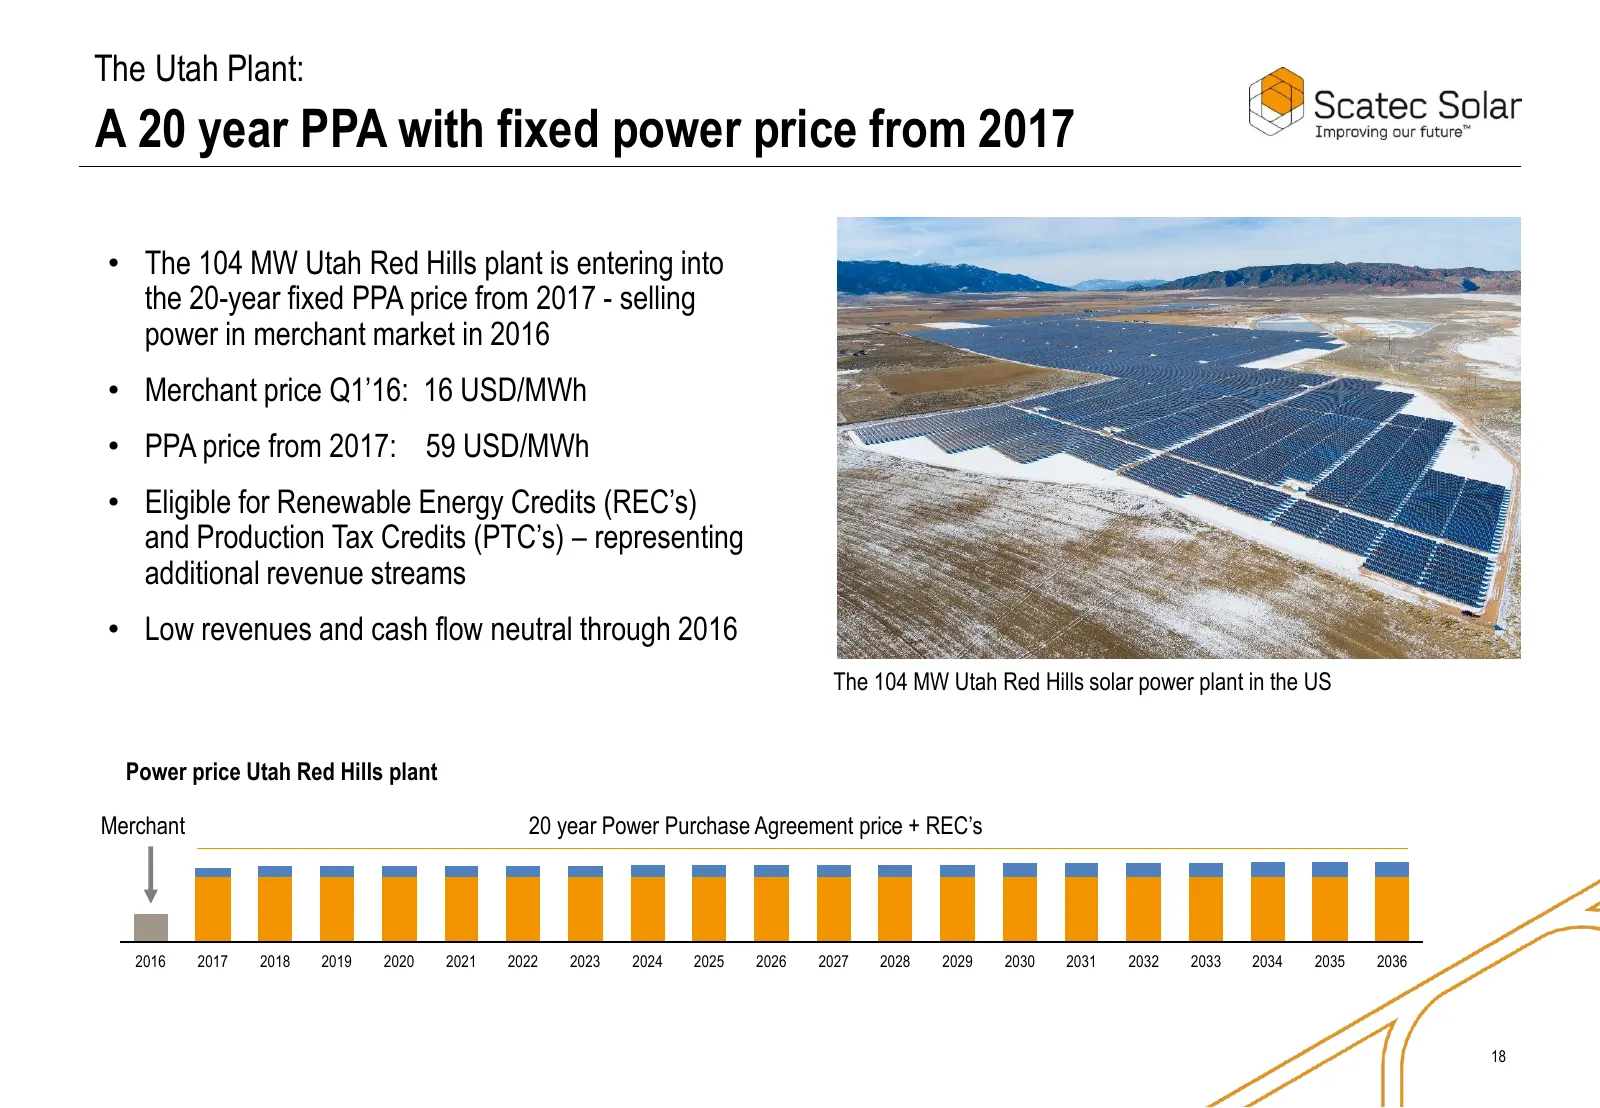
The Utah Plant: A 20 year PPA with fixed power price from 2017 • The 104 MW Utah Red Hills plant is entering into the 20-year fixed PPA price from 2017 - selling power in merchant market in 2016 • Merchant price Q1’16: 16 USD/MWh • PPA price from 2017: 59 USD/MWh • Eligible for Renewable Energy Cred
Slide 19: Utah and seasonality impact financials
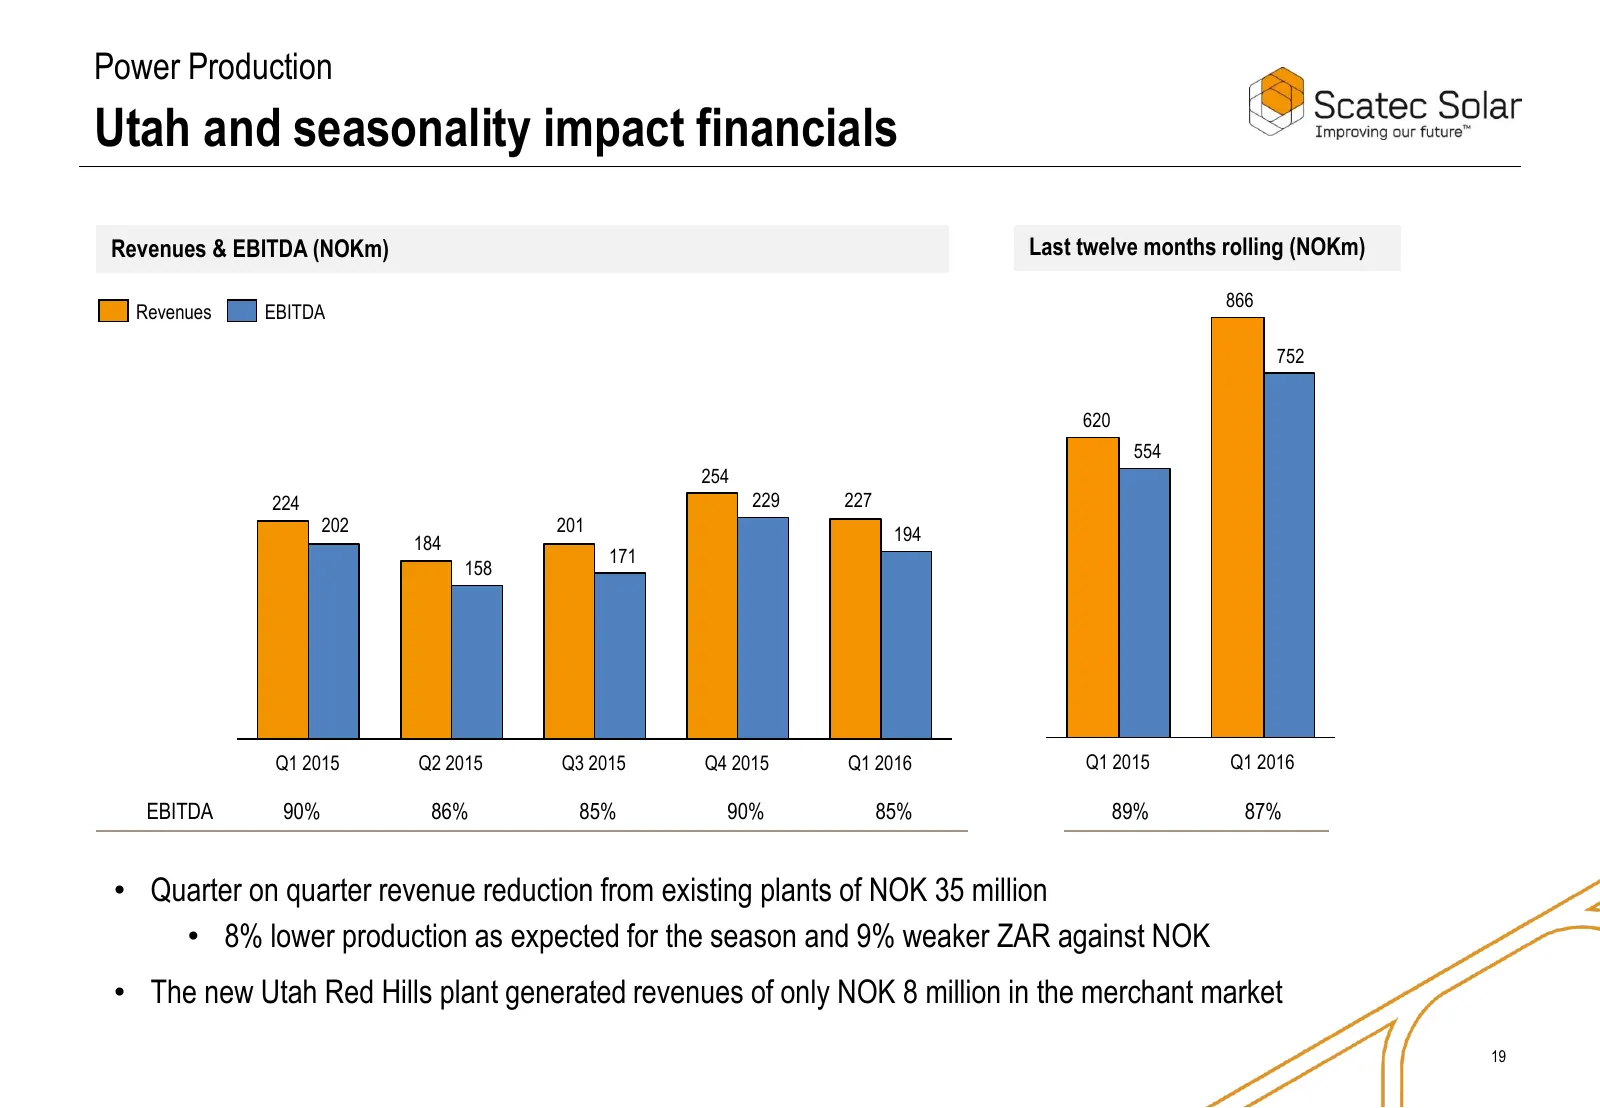
Power Production Utah and seasonality impact financials Revenues & EBITDA (NOKm) Last twelve months rolling (NOKm) 866 Revenues EBITDA 752 620 554 254 224 229 227 202 201 194 184 171 158 Q1 2015 Q2 2015 Q3 2015 Q4 2015 Q1 2016 Q1 2015 Q1 2016 EBITDA 90% 86% 85% 90% 85% 89% 87% • Quarter on quarter r
Slide 20: The O&M business grows as asset base expands
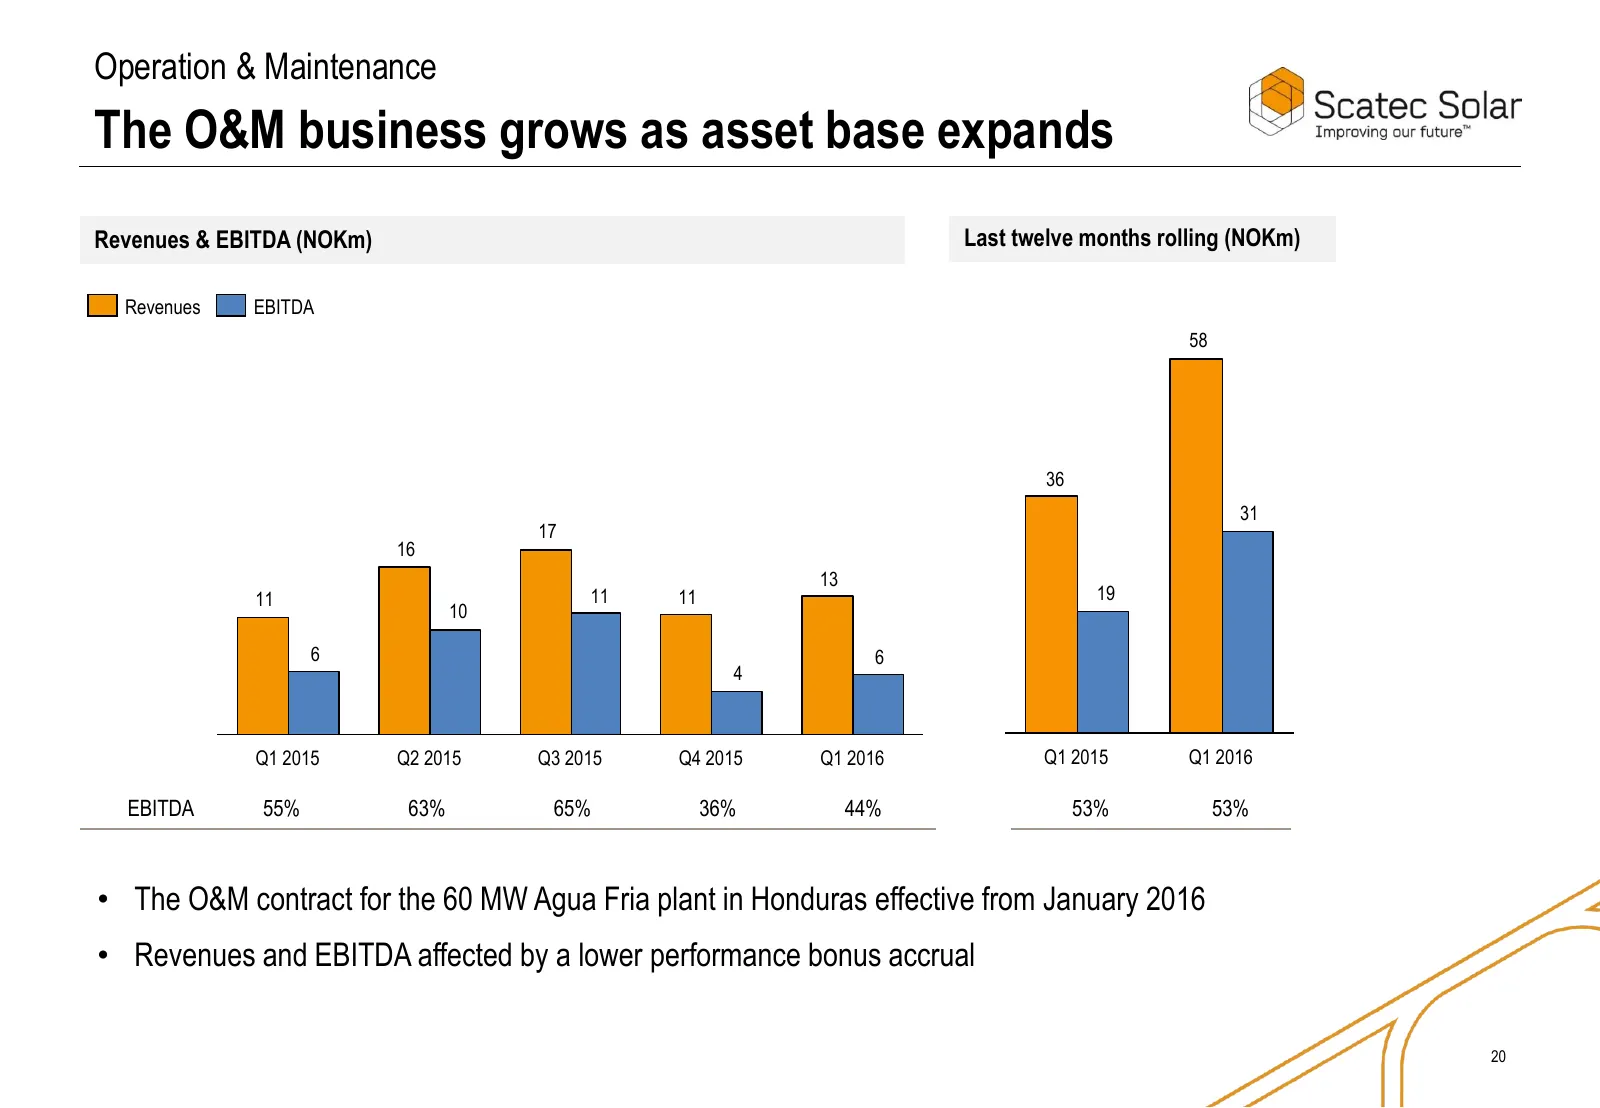
Operation & Maintenance The O&M business grows as asset base expands Revenues & EBITDA (NOKm) Last twelve months rolling (NOKm) Revenues EBITDA 58 36 31 17 16 13 11 11 11 19 10 6 6 4 Q1 2015 Q2 2015 Q3 2015 Q4 2015 Q1 2016 Q1 2015 Q1 2016 EBITDA 55% 63% 65% 36% 44% 53% 53% • The O&M contract for the
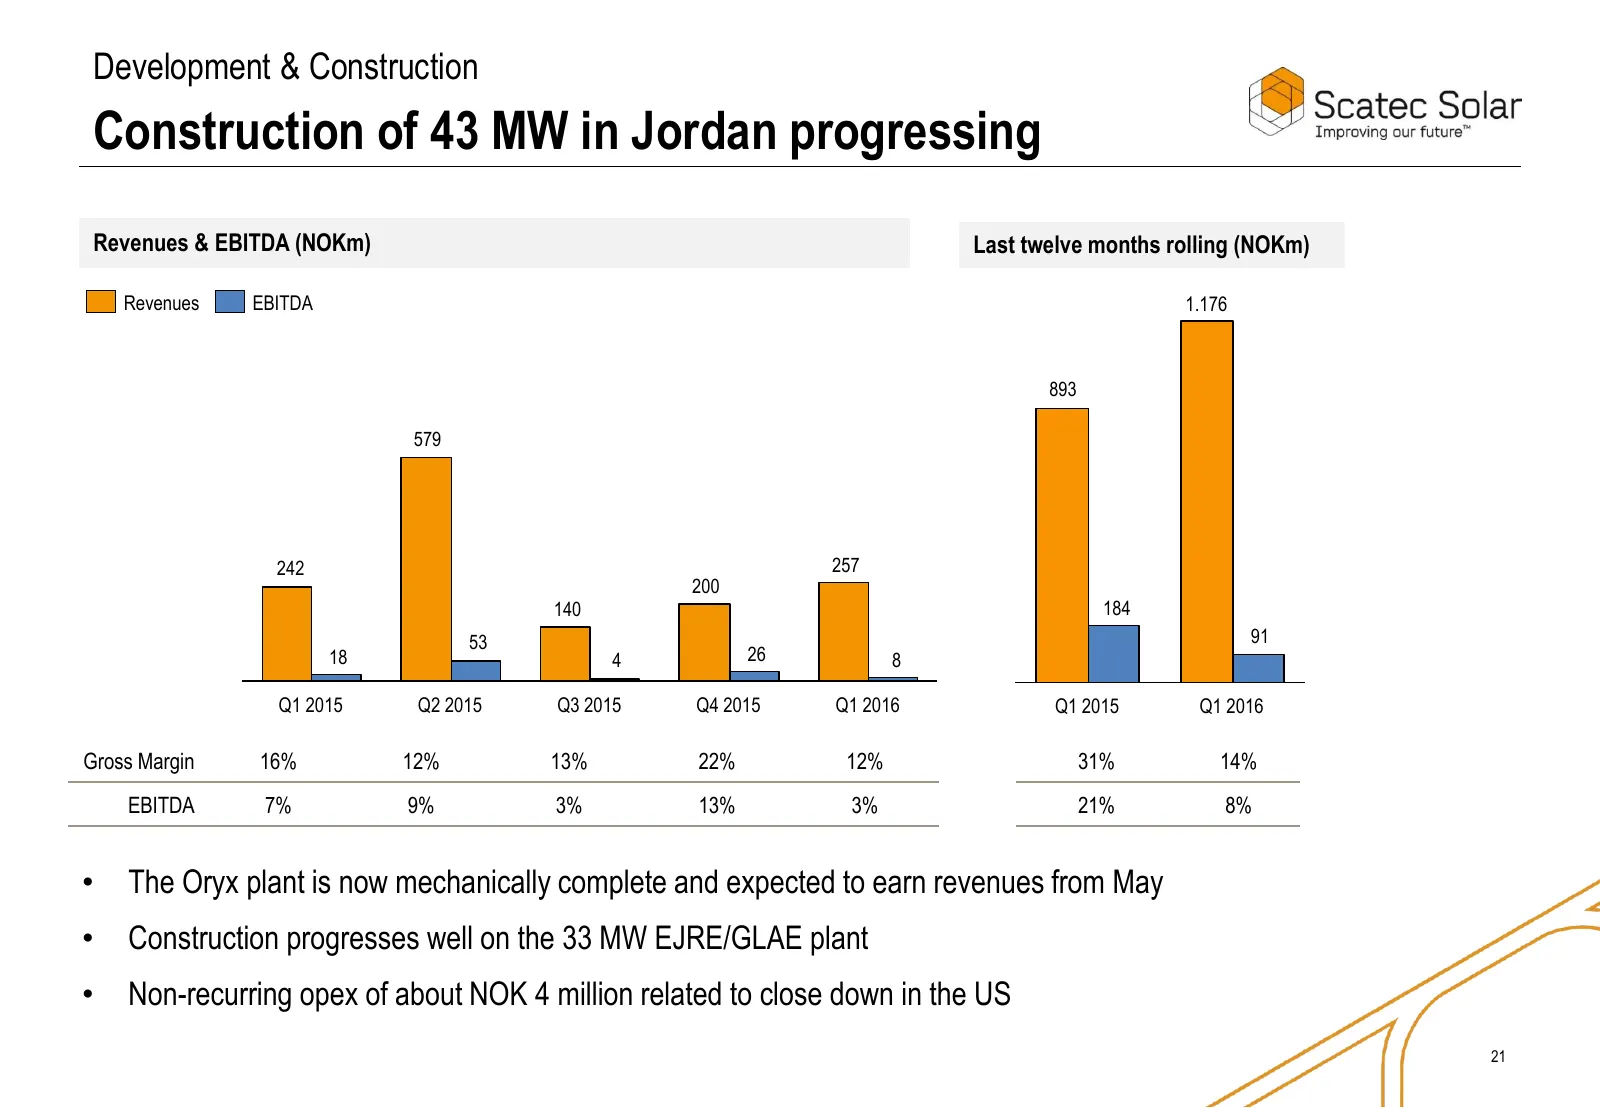
Slide 21: Construction of 43 MW in Jordan progressing
Development & Construction Construction of 43 MW in Jordan progressing Revenues & EBITDA (NOKm) Last twelve months rolling (NOKm) Revenues EBITDA 1.176 893 579 242 257 200 140 184 53 91 18 4 26 8 Q1 2015 Q2 2015 Q3 2015 Q4 2015 Q1 2016 Q1 2015 Q1 2016 Gross Margin 16% 12% 13% 22% 12% 31% 14% EBITDA
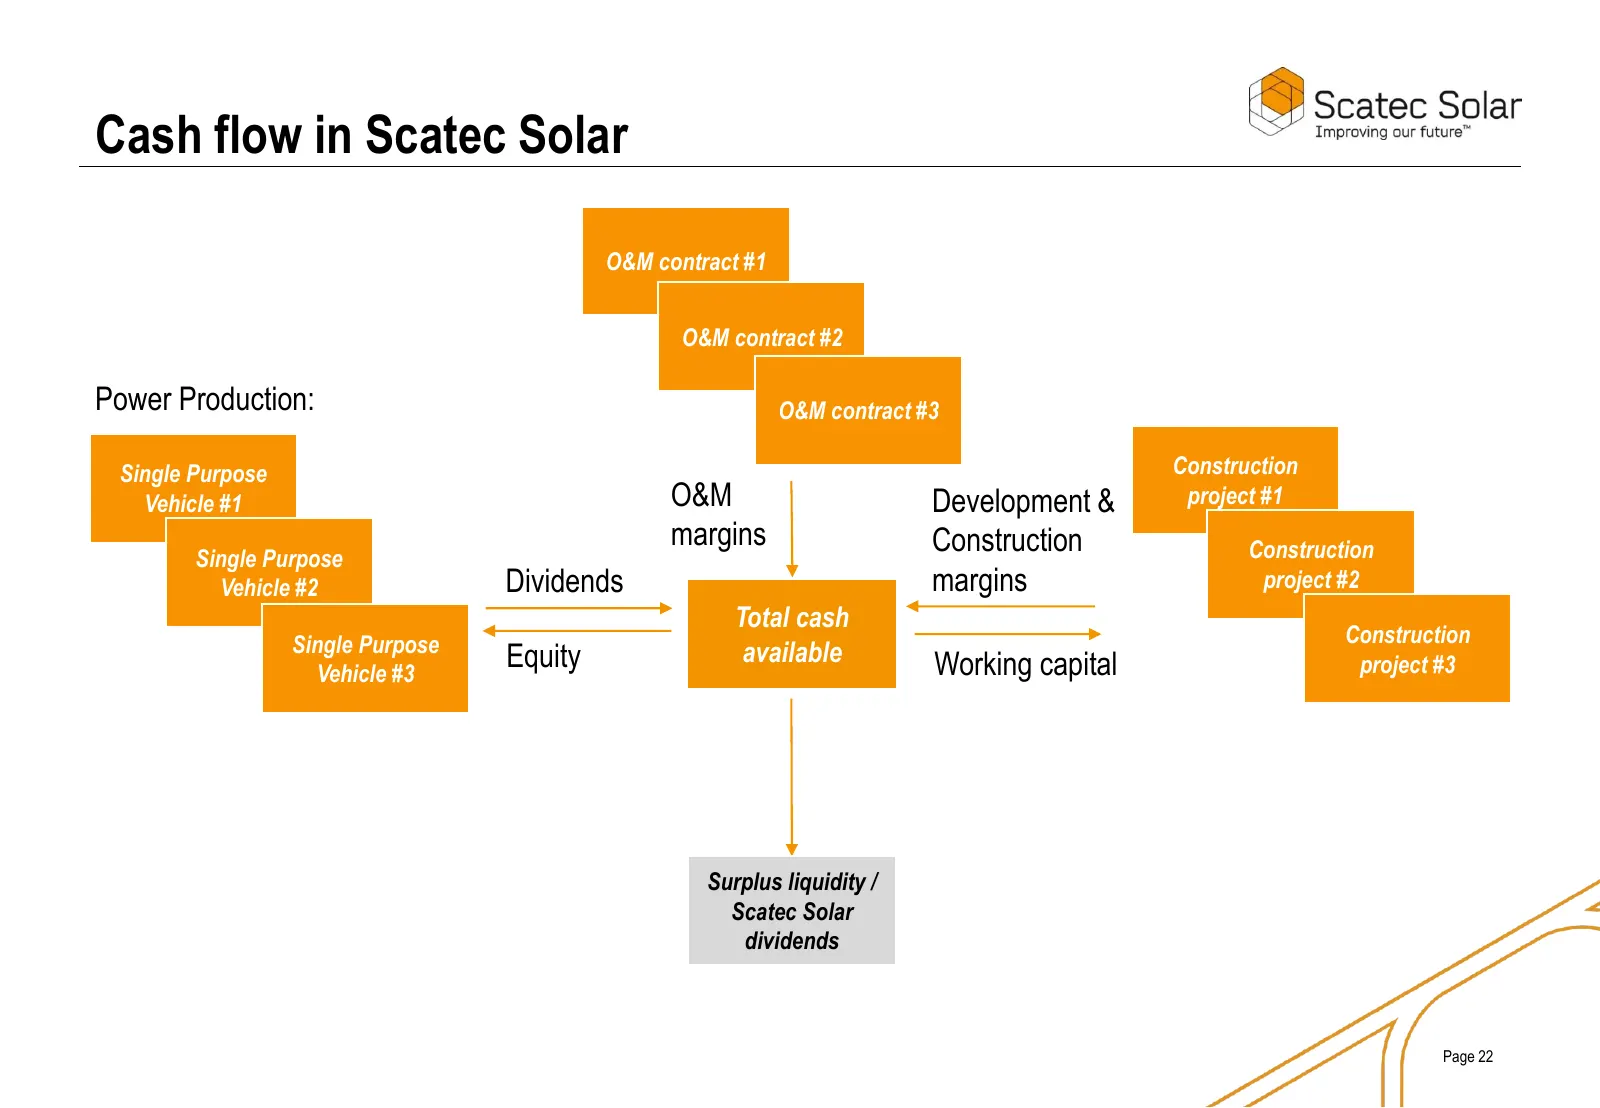
Slide 22: Cash flow in Scatec Solar
Cash flow in Scatec Solar O&M contract #1 O&M contract #2 Power Production: O&M contract #3 Single Purpose Construction Vehicle #1 O&M Development & project #1 margins Construction Construction Single Purpose Vehicle #2 Dividends margins project #2 Total cash Single Purpose Construction Equity avail
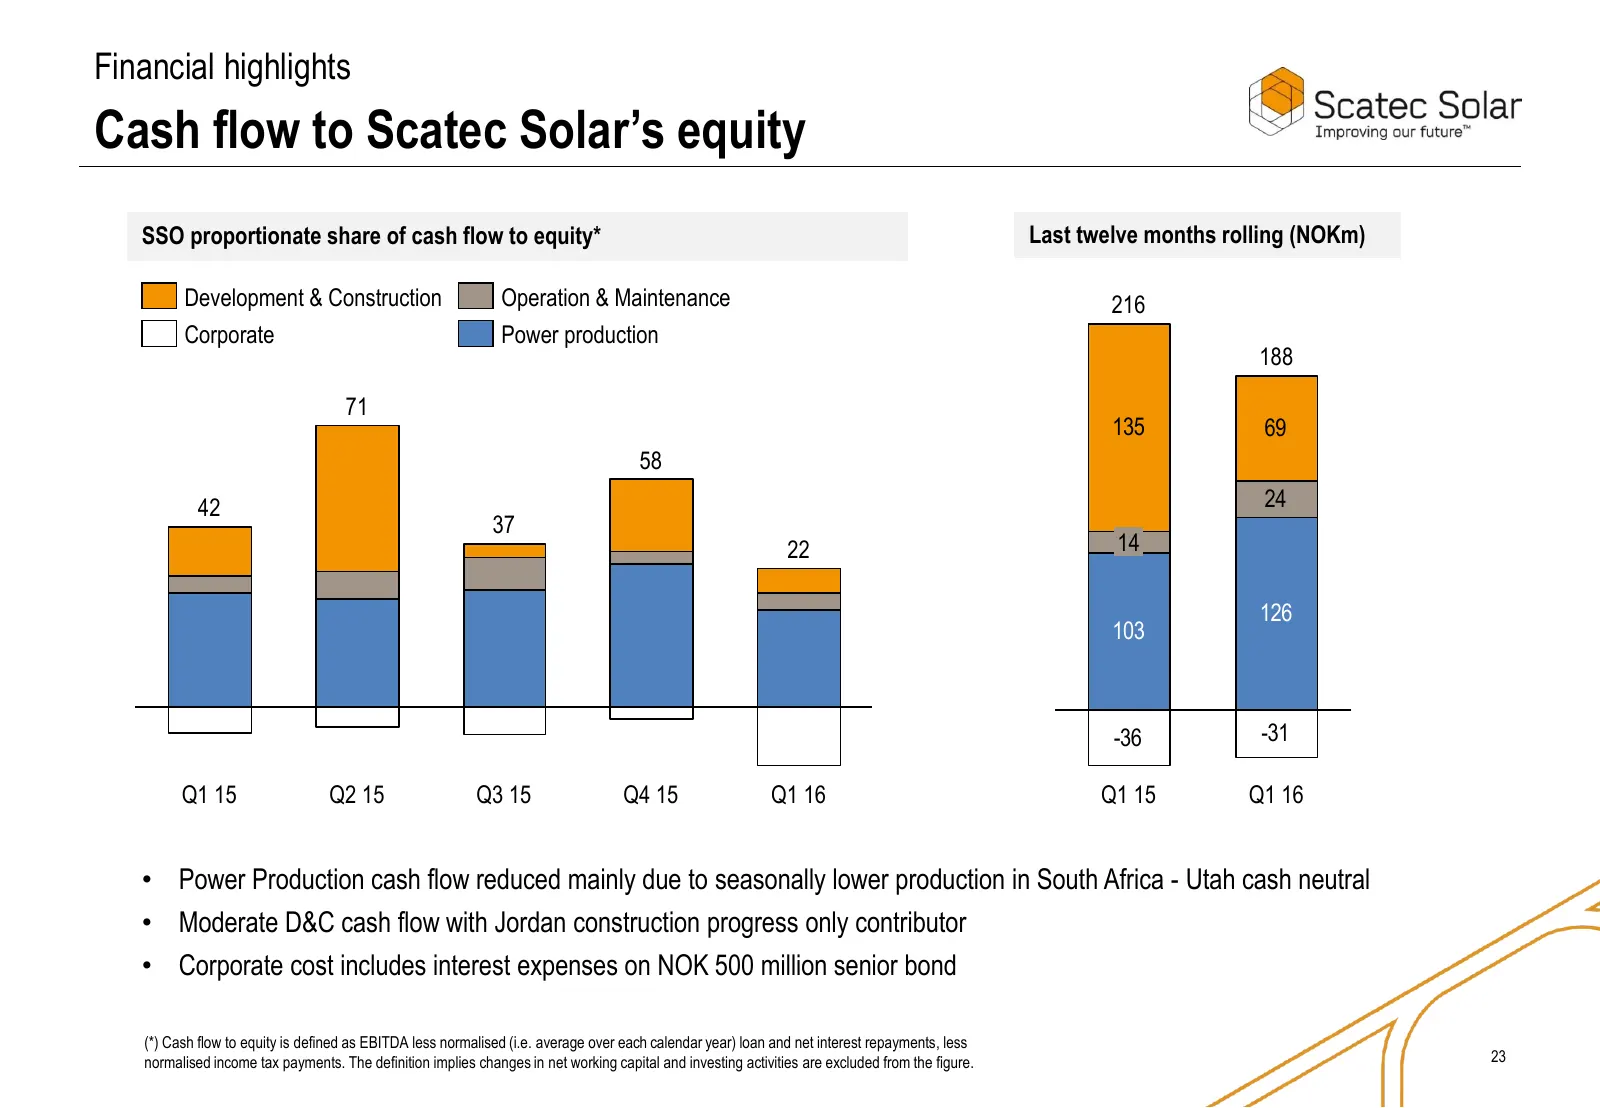
Slide 23: Cash flow to Scatec Solar's equity
Financial highlights Cash flow to Scatec Solar’s equity SSO proportionate share of cash flow to equity* Last twelve months rolling (NOKm) Development & Construction Operation & Maintenance 216 Corporate Power production 188 71 135 69 58 42 24 37 22 14 126 103 -36 -31 Q1 15 Q2 15 Q3 15 Q4 15 Q1 16 Q1
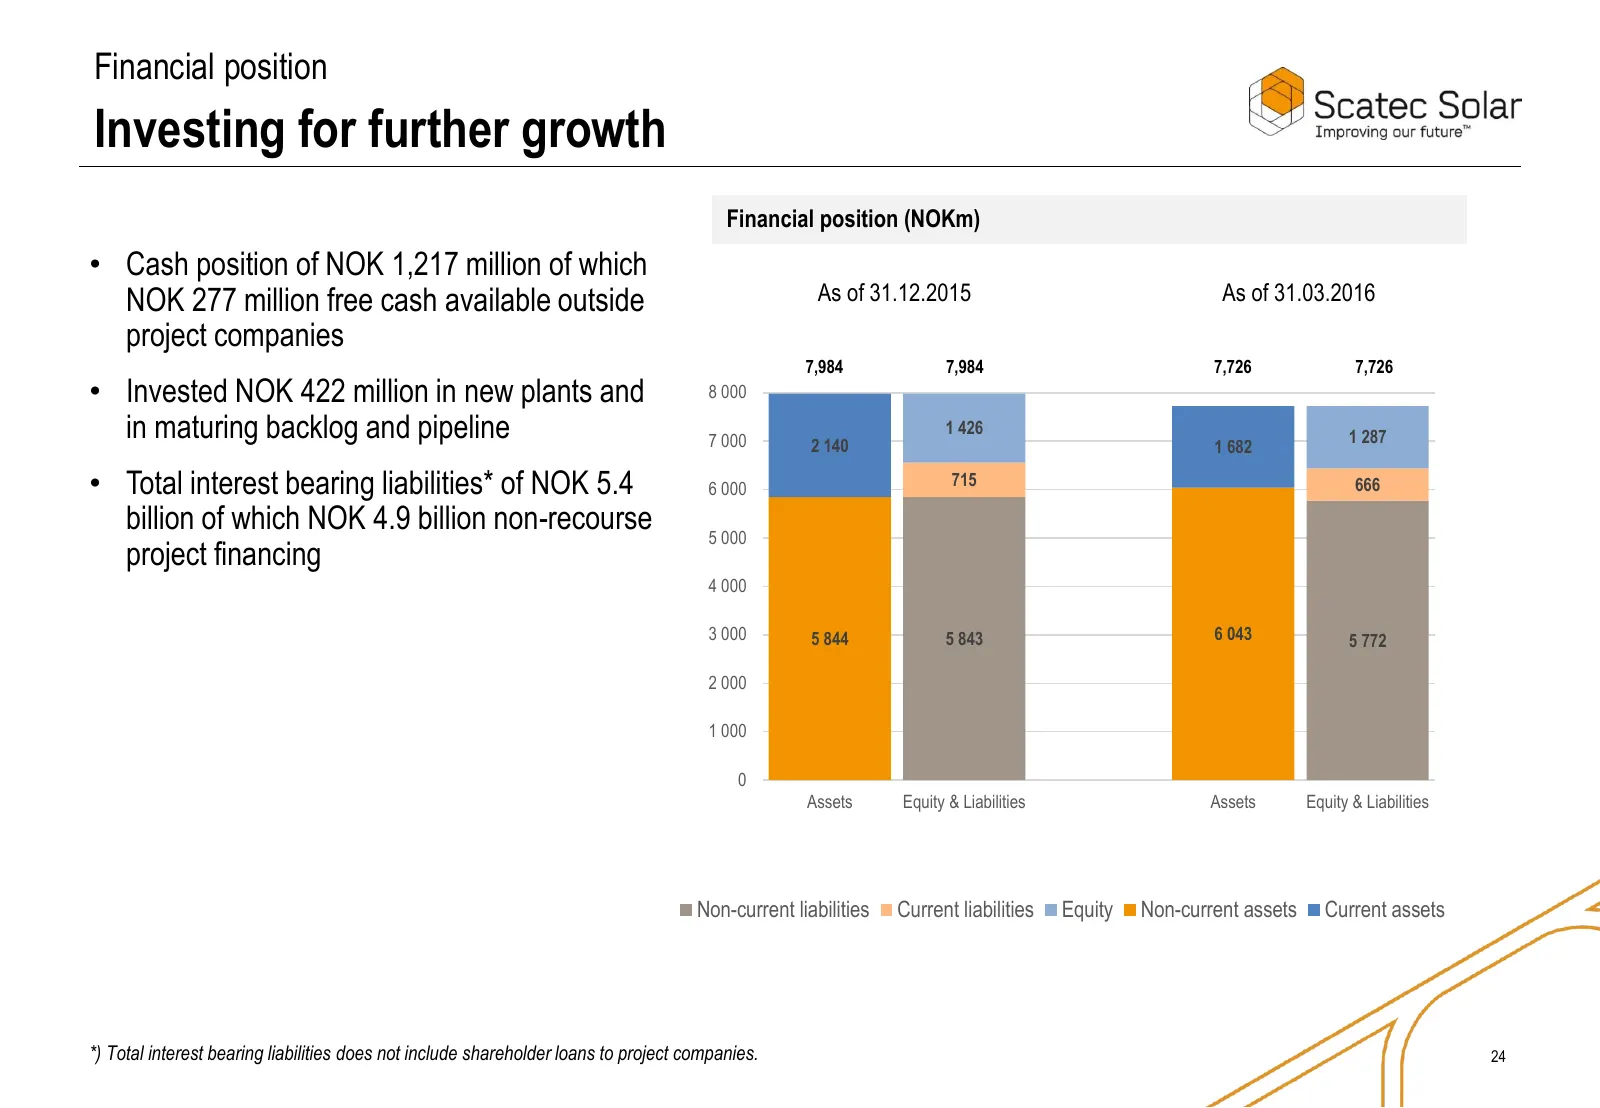
Slide 24: Investing for further growth
Financial position Investing for further growth Financial position (NOKm) • Cash position of NOK 1,217 million of which NOK 277 million free cash available outside As of 31.12.2015 As of 31.03.2016 project companies 7,984 7,984 7,726 7,726 • Invested NOK 422 million in new plants and 8 000 in maturi
Slide 25: Outlook
o Scatec Solar Improving our future™ Outlook
Slide 26: Strong market growth
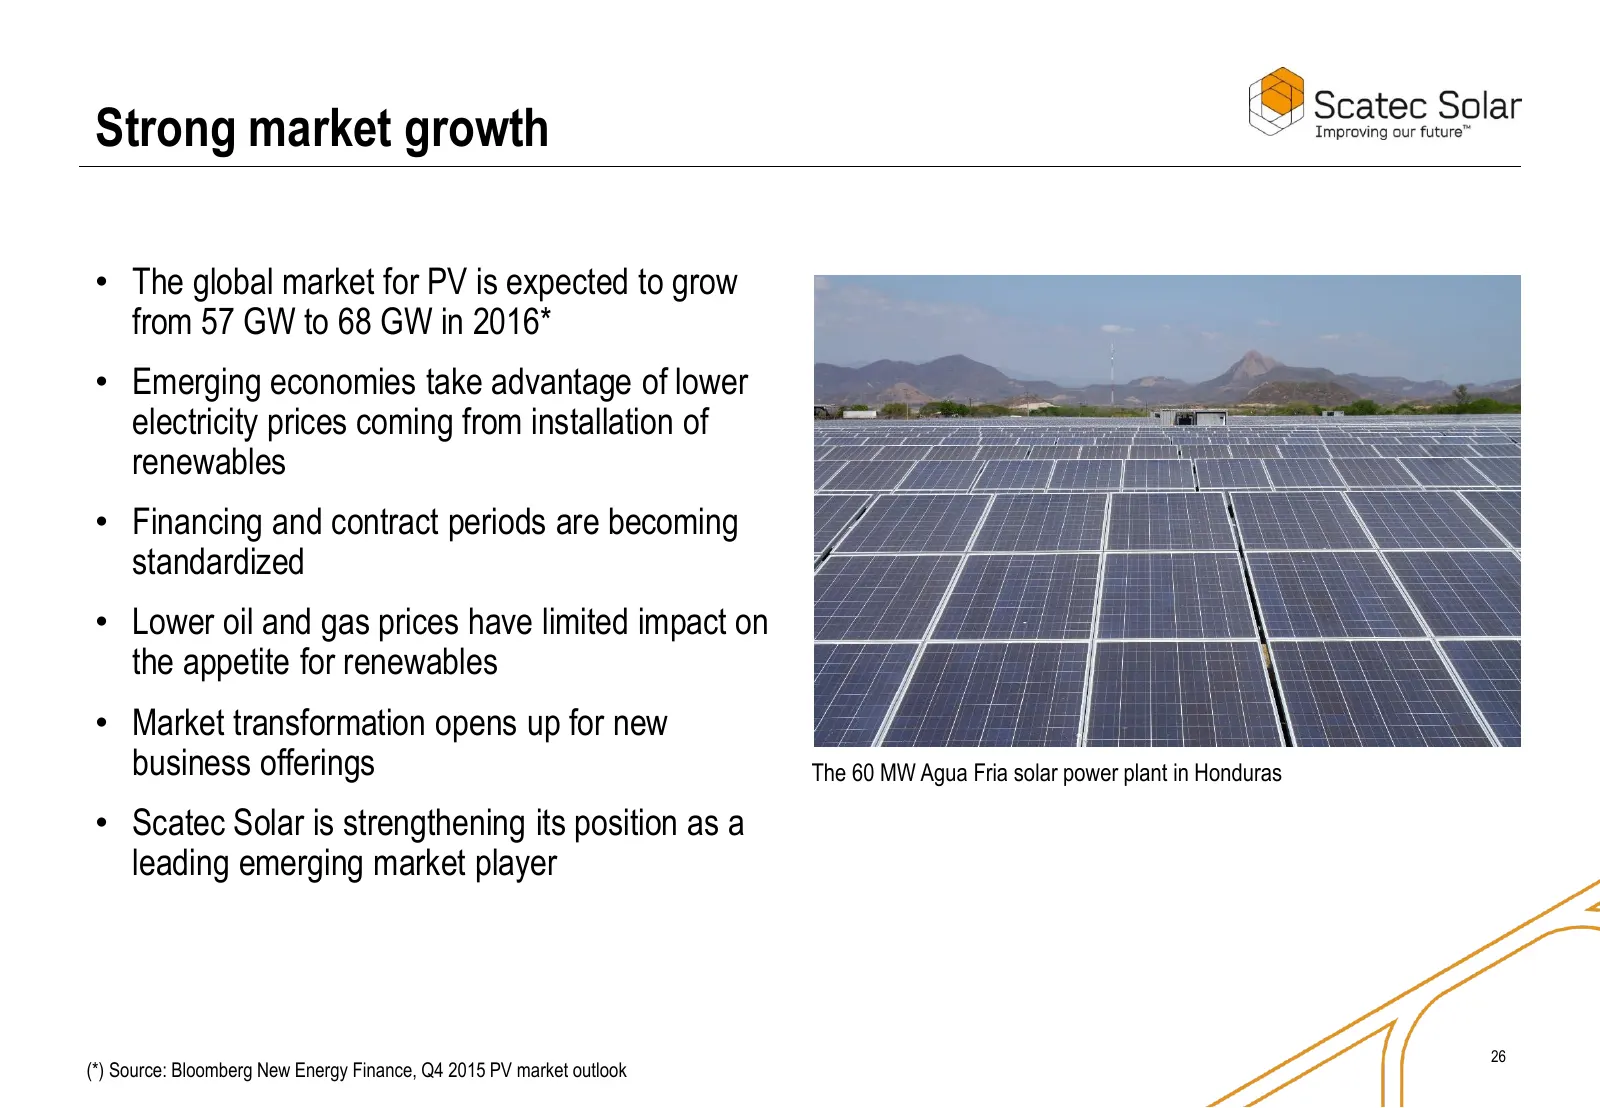
Strong market growth • The global market for PV is expected to grow from 57 GW to 68 GW in 2016* • Emerging economies take advantage of lower electricity prices coming from installation of renewables • Financing and contract periods are becoming standardized • Lower oil and gas prices have limited i
Slide 27: Outlook
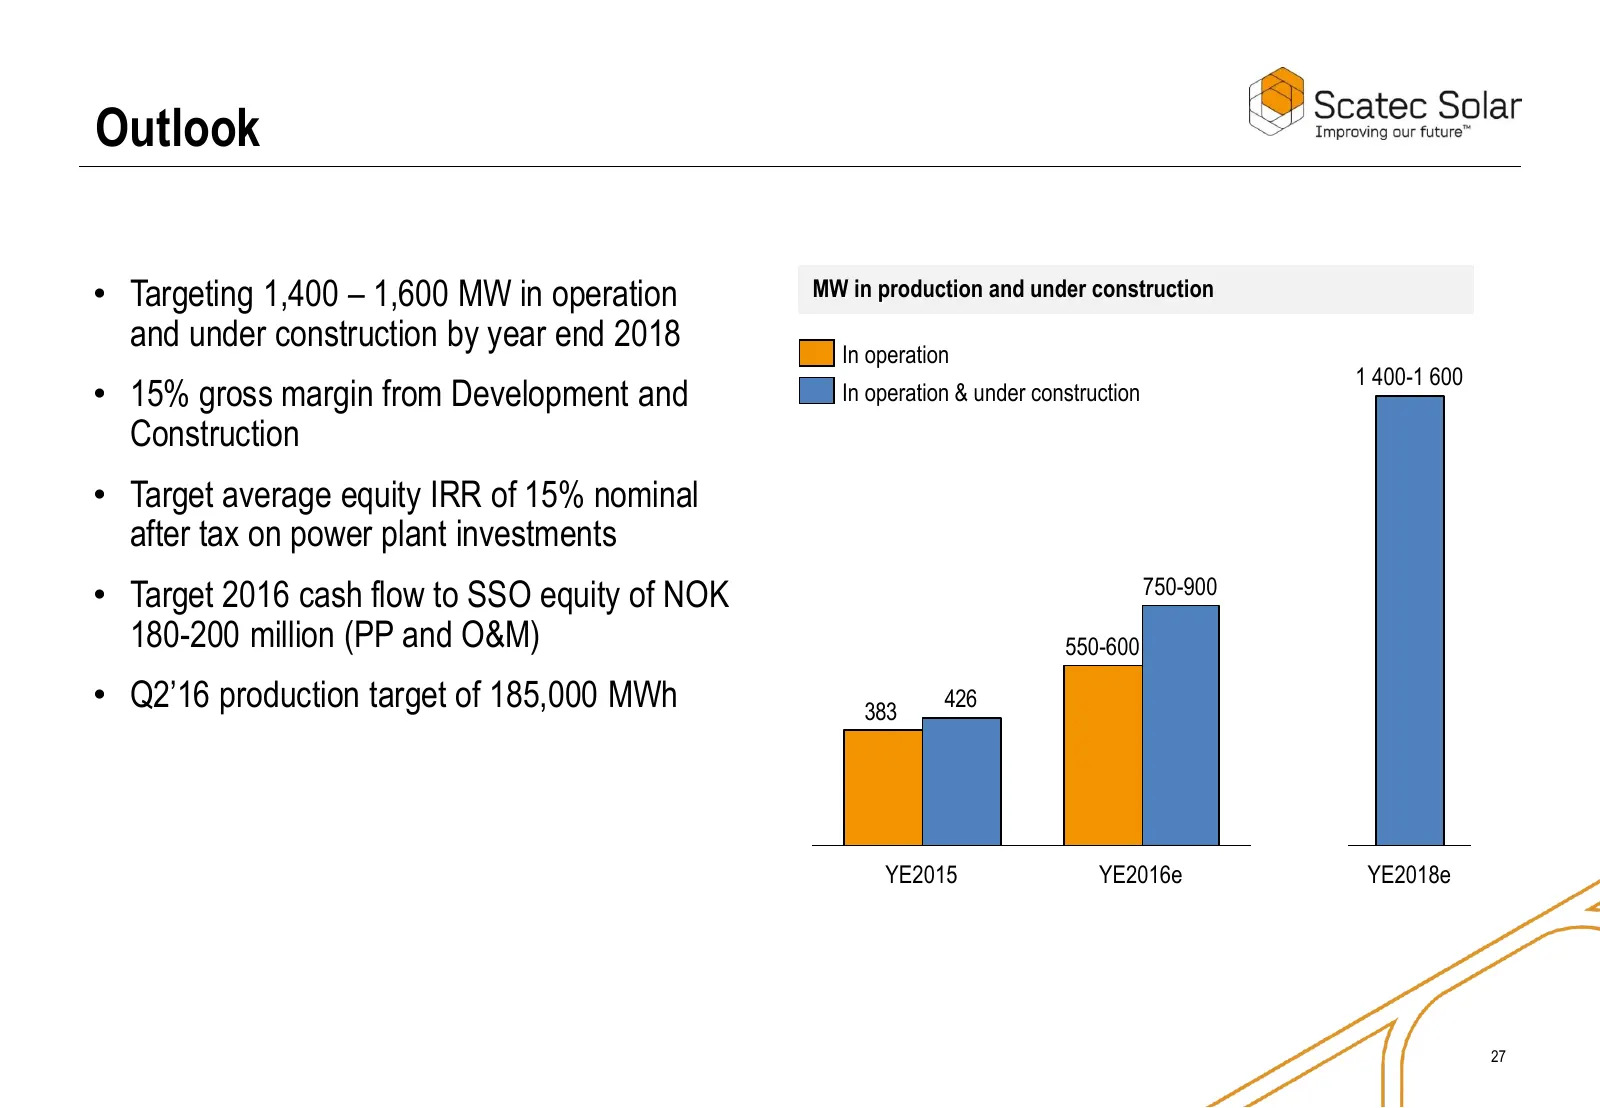
Outlook • Targeting 1,400 – 1,600 MW in operation MW in production and under construction and under construction by year end 2018 In operation 1 400-1 600 • 15% gross margin from Development and In operation & under construction Construction • Target average equity IRR of 15% nominal after tax on po
Slide 28: Thank you
Thank you Our values • Predictable • Driving results • Changemakers • Working together
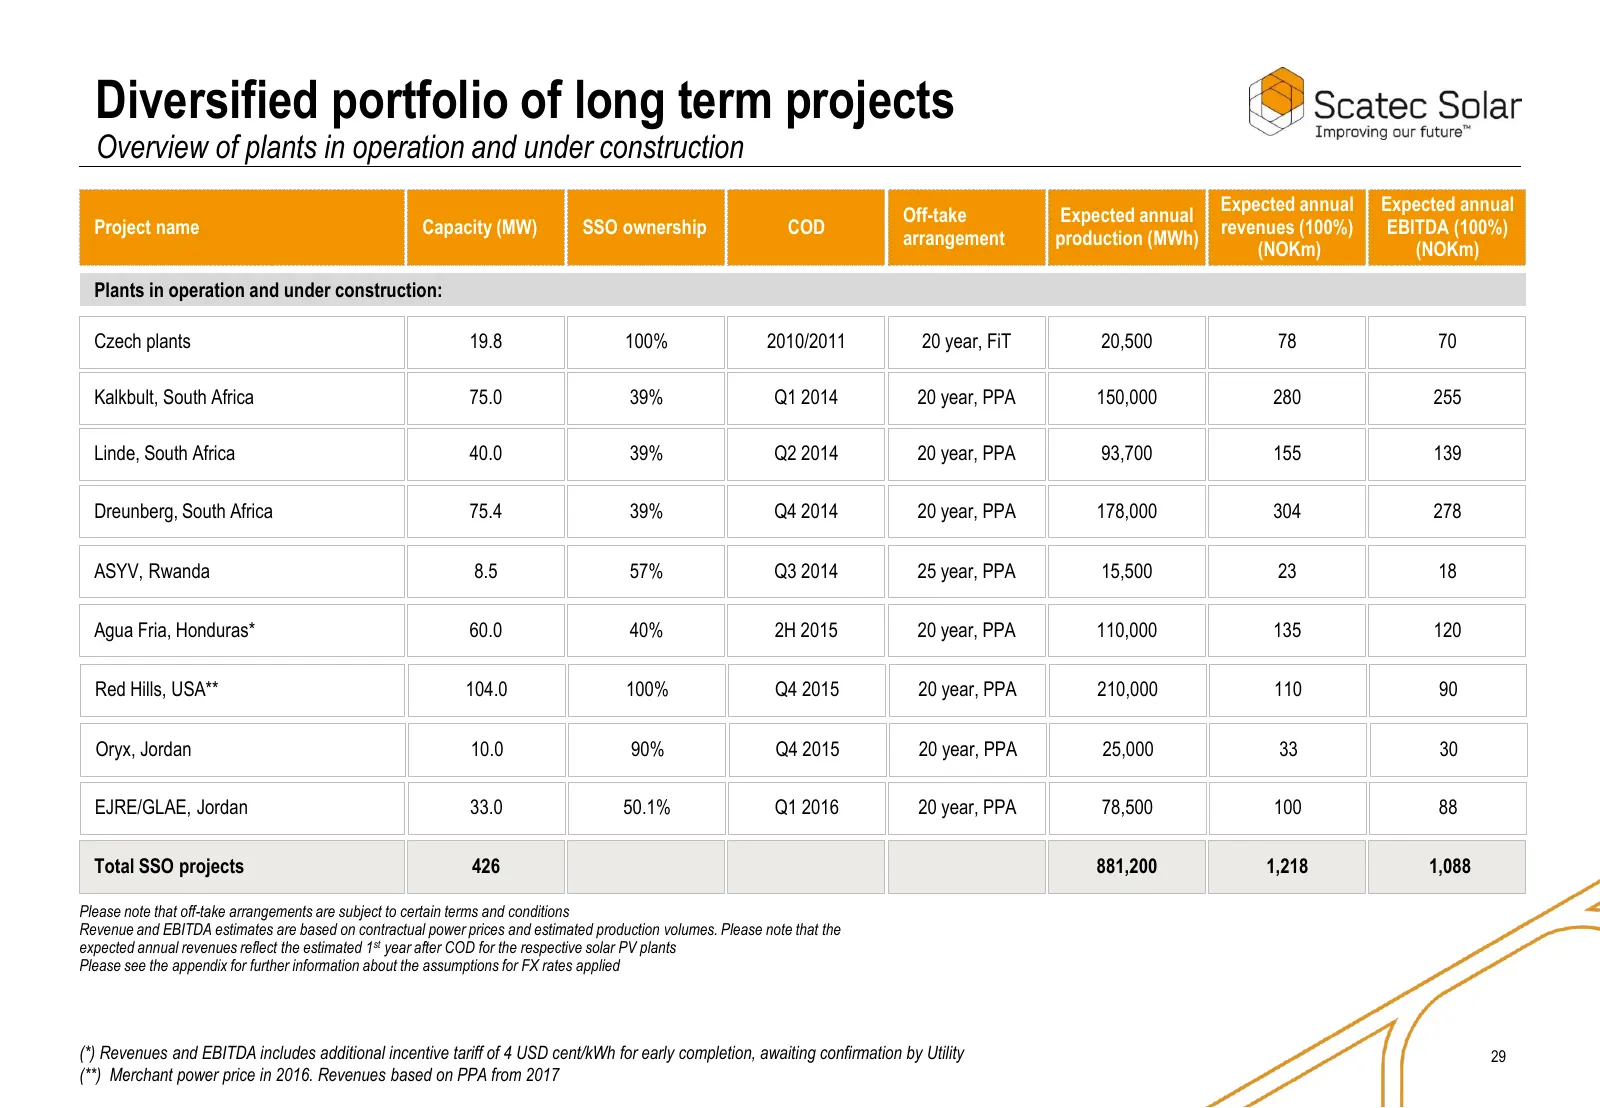
Slide 29: Diversified portfolio of long term projects
Diversified portfolio of long term projects Overview of plants in operation and under construction Expected annual Expected annual Off-take Expected annual Project name Capacity (MW) SSO ownership COD revenues (100%) EBITDA (100%) arrangement production (MWh) (NOKm) (NOKm) Plants in operation and un
Source: Internet Archive copy of scatecsolar.com
More decks from Scatec ASA
 Q3 2026 Earnings Presentation32 slides · Oct 30, 2026
 Q2 2026 Earnings Presentation23 slides · Aug 21, 2026
 Investor Presentation (August 2026)22 slides · August 2026
 Q1 2026 Earnings Presentation23 slides · May 6, 2026
 Investor Presentation (March 2026)22 slides · March 2026
 Q4 2025 Earnings Presentation24 slides · Jan 30, 2026