Boyd Group Services Inc · TSX:BYD
Boyd Group Services — Boyd Group Income Fund — Investor Presentation (November 2017)
32 slides from Boyd Group Services's investor presentation, November 2017
Slide 1: Investor Presentation Q3 2017
Investor Presentation Q3 2017 1
Slide 2: Forward-Looking Statements
Forward-Looking Statements This presentation contains forward-looking statements, other than historical facts, which reflect the view of the Fund's management with respect to future events. Such forward-looking statements reflect the current views of the Fund's management and are made on the basis o
Slide 3: Capital Markets Profile
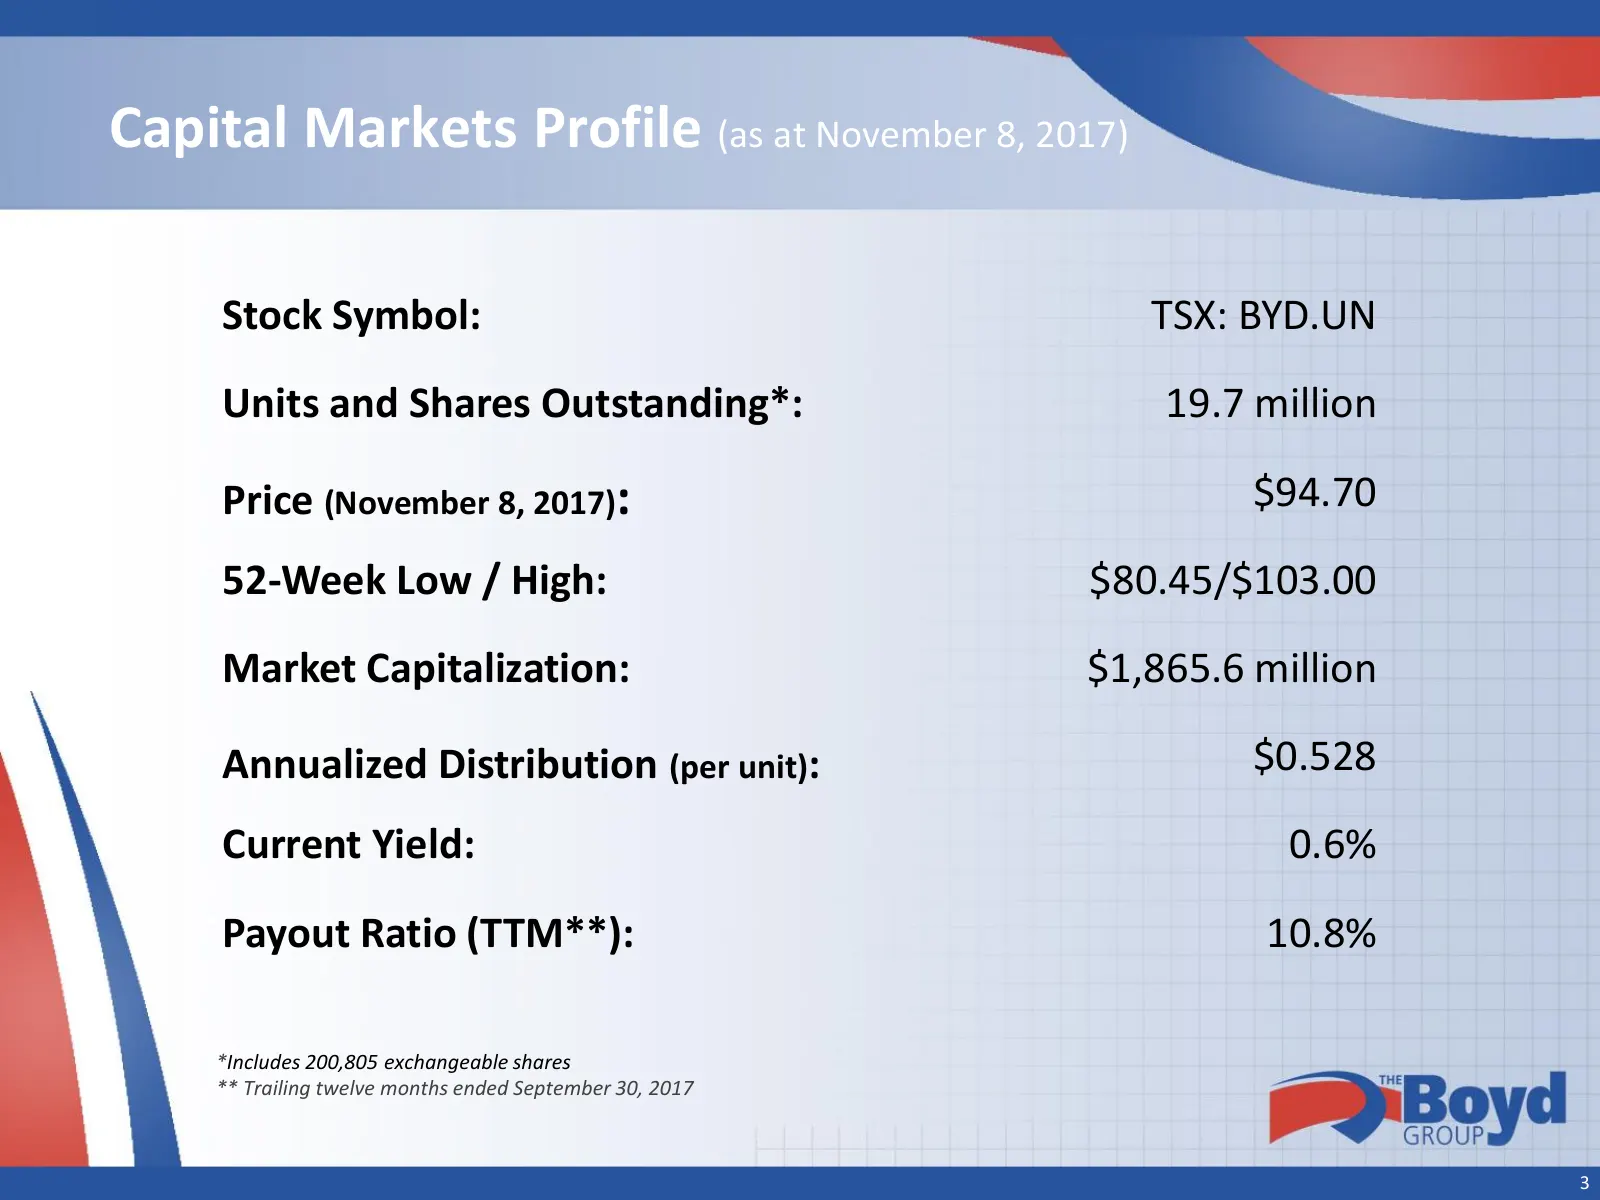
Capital Markets Profile (as at November 8, 2017) Stock Symbol: TSX: BYD.UN Units and Shares Outstanding*: 19.7 million Price (November 8, 2017): $94.70 52-Week Low / High: $80.45/$103.00 Market Capitalization: $1,865.6 million Annualized Distribution (per unit): $0.528 Current Yield: 0.6% Payout Rat
Slide 4: Company Overview
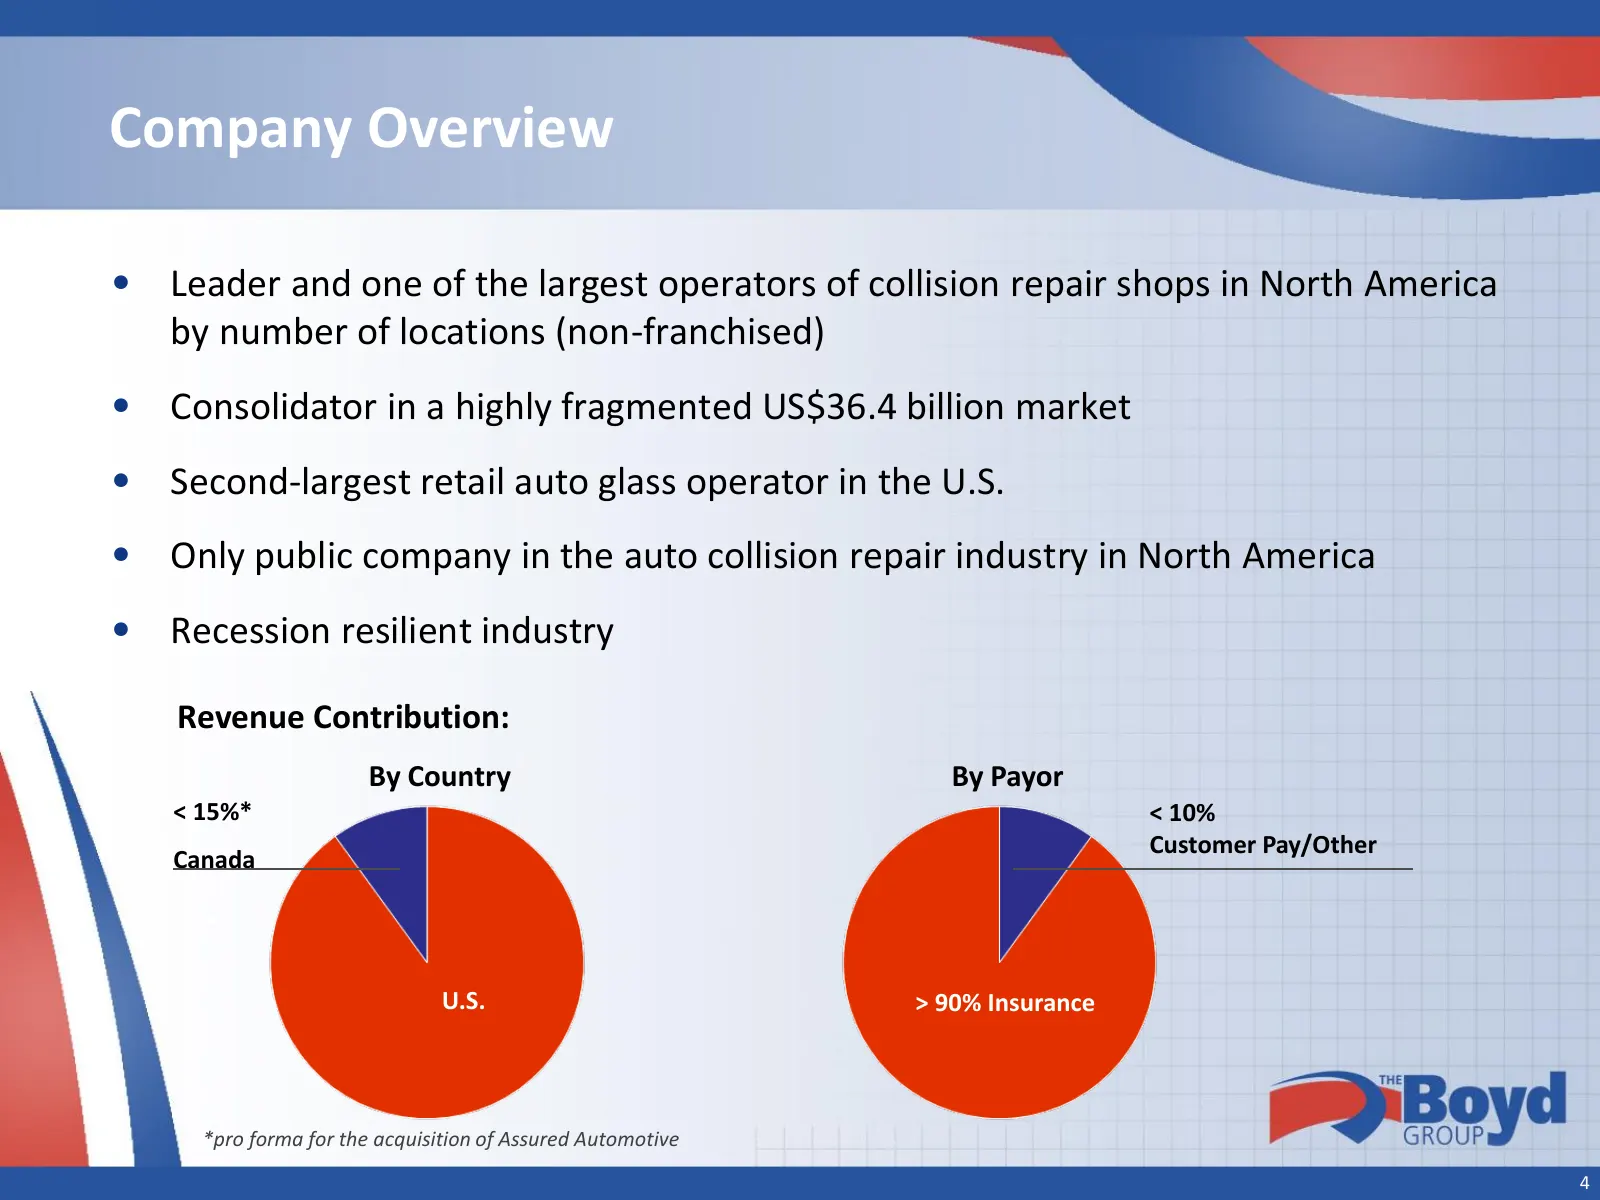
Company Overview • Leader and one of the largest operators of collision repair shops in North America by number of locations (non-franchised) • Consolidator in a highly fragmented US$36.4 billion market • Second-largest retail auto glass operator in the U.S. • Only public company in the auto collisi
Slide 5: Collision Operations
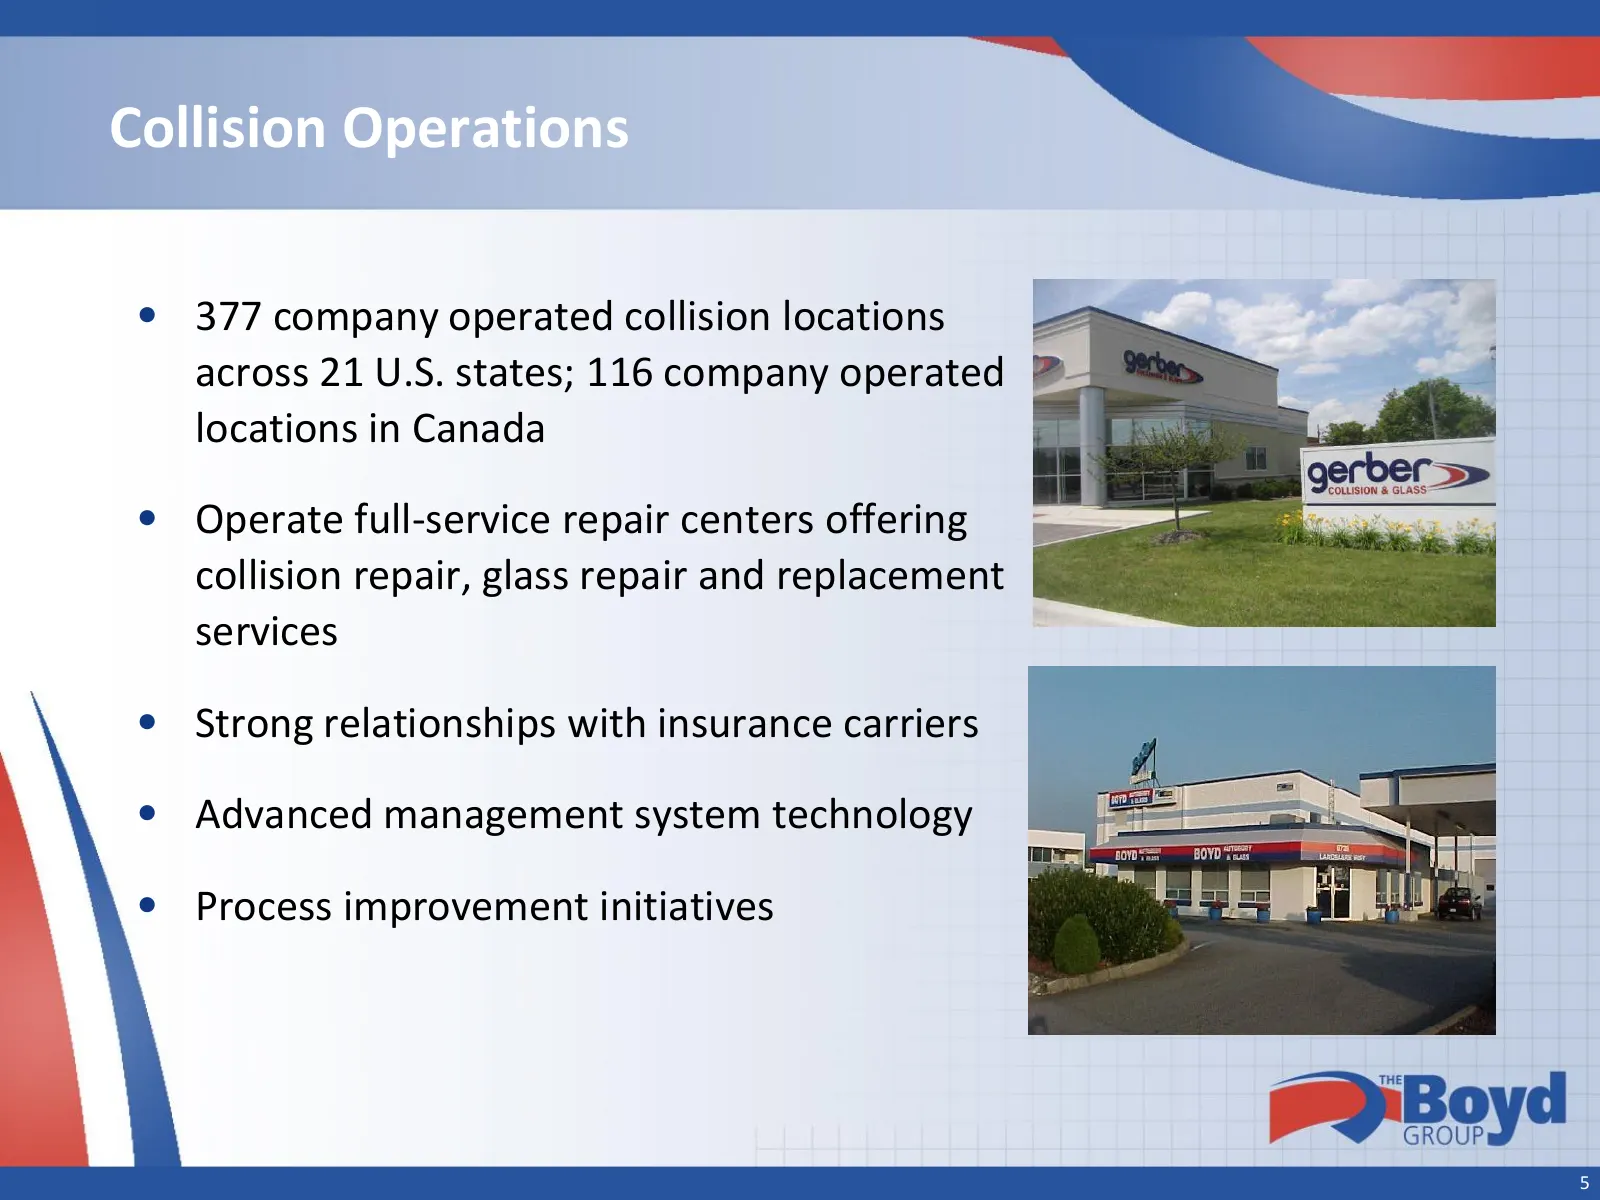
Collision Operations • 377 company operated collision locations across 21 U.S. states; 116 company operated locations in Canada • Operate full-service repair centers offering collision repair, glass repair and replacement services • Strong relationships with insurance carriers • Advanced management
Slide 6: North American Collision Repair Footprint
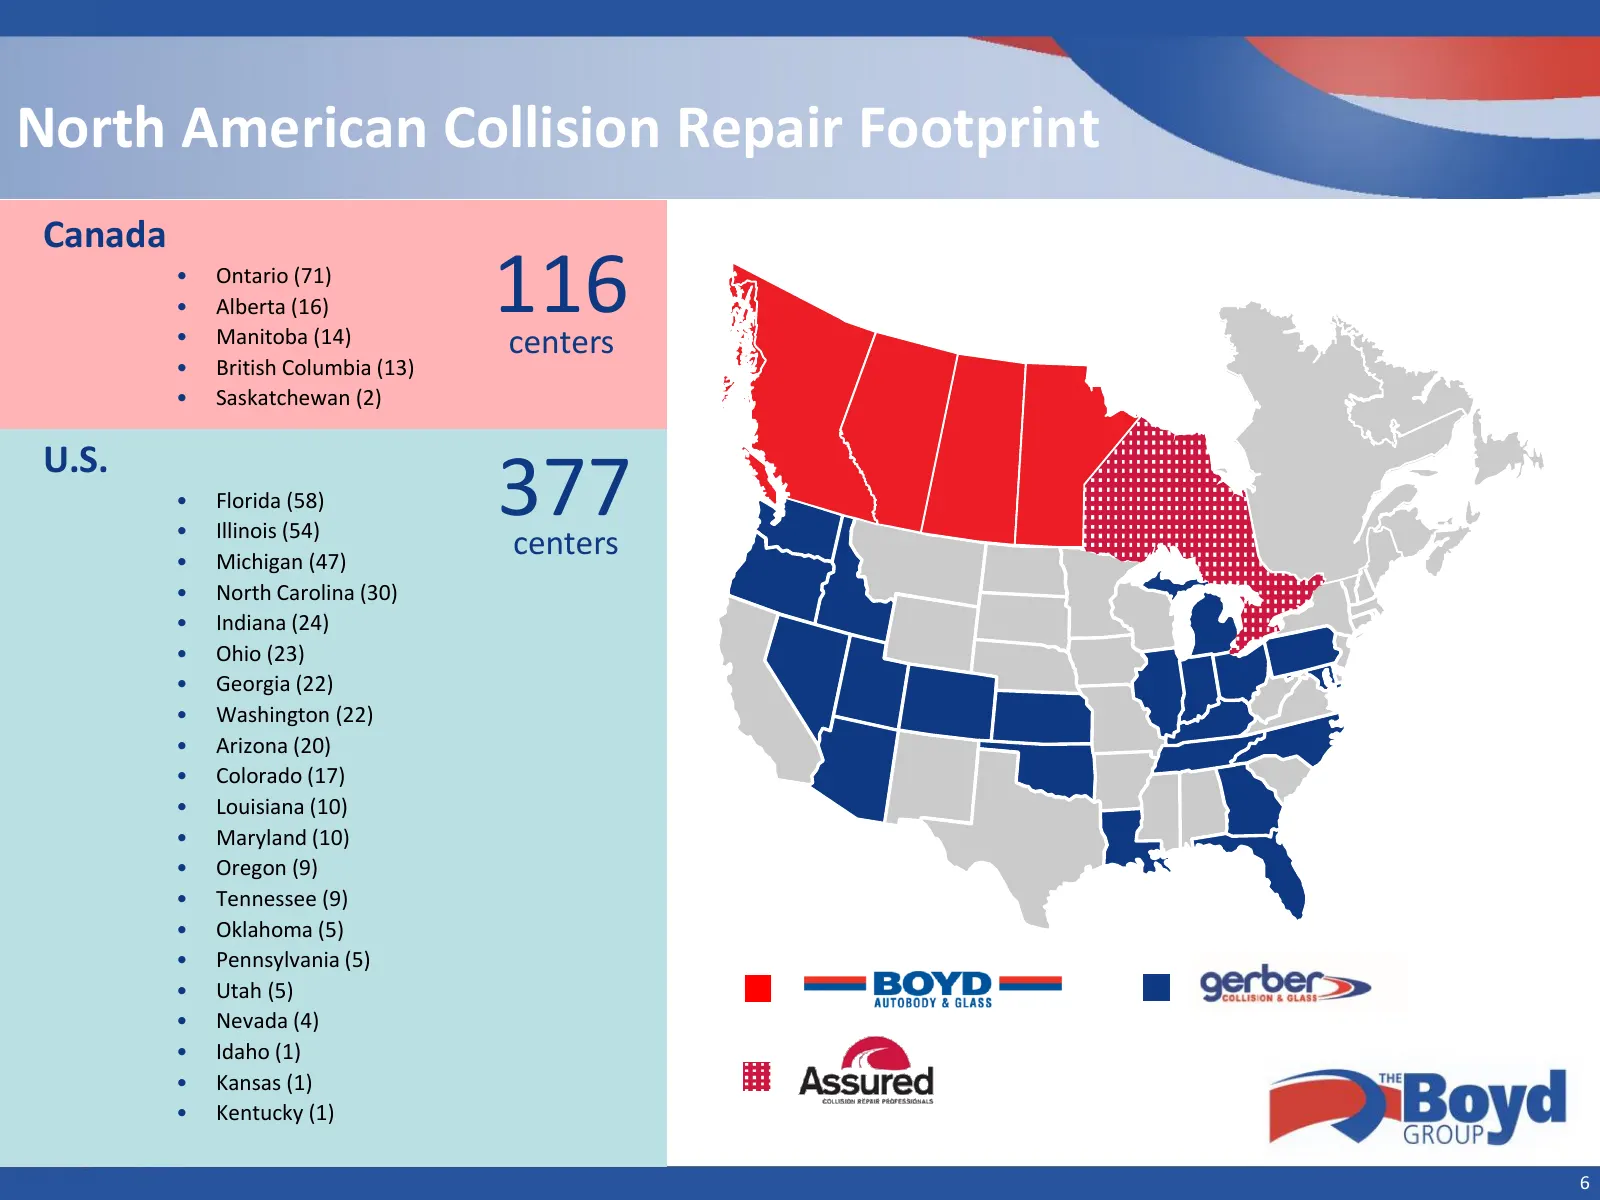
North American Collision Repair Footprint Canada • • • Ontario (71) Alberta (16) Manitoba (14) 116 centers • British Columbia (13) • Saskatchewan (2) U.S. • • Florida (58) Illinois (54) 377 centers • Michigan (47) • North Carolina (30) • Indiana (24) • Ohio (23) • Georgia (22) • Washington (22) • Ar
Slide 7: Glass Operations
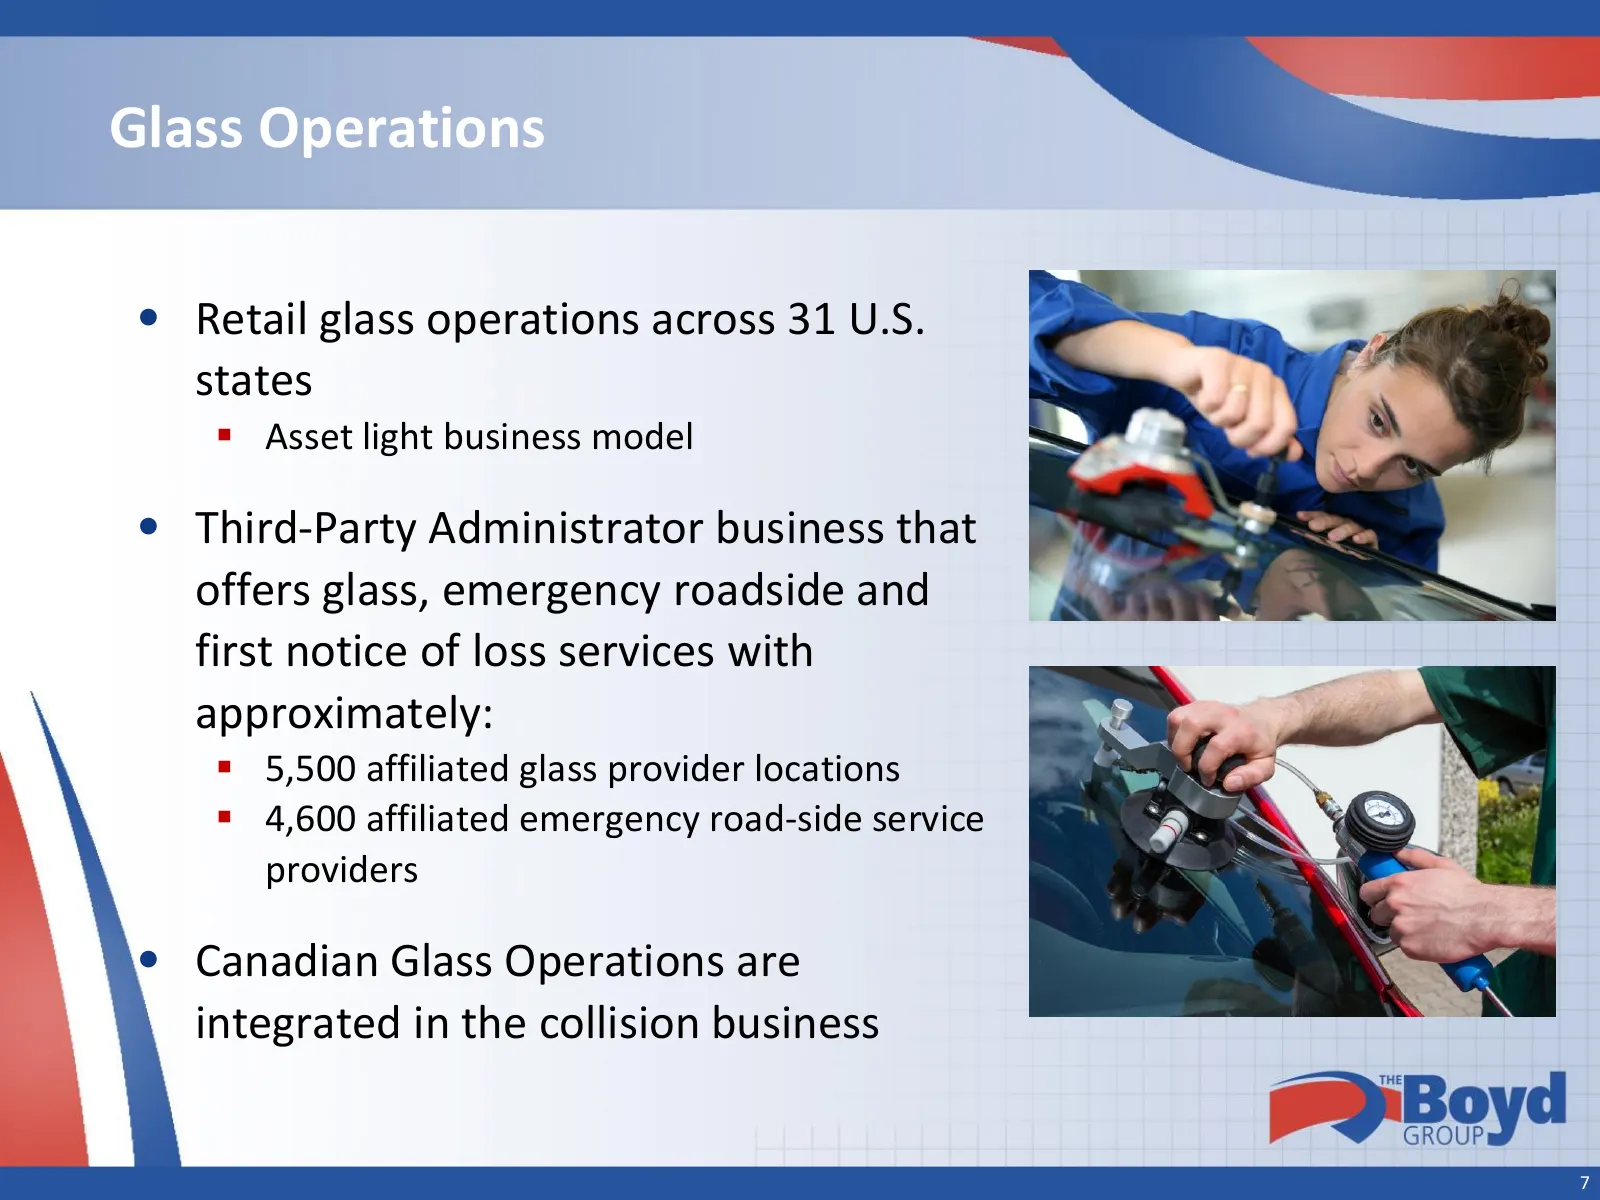
Glass Operations • Retail glass operations across 31 U.S. states Asset light business model • Third-Party Administrator business that offers glass, emergency roadside and first notice of loss services with approximately: 5,500 affiliated glass provider locations 4,600 affiliated emergency road
Slide 8: North American Glass Footprint
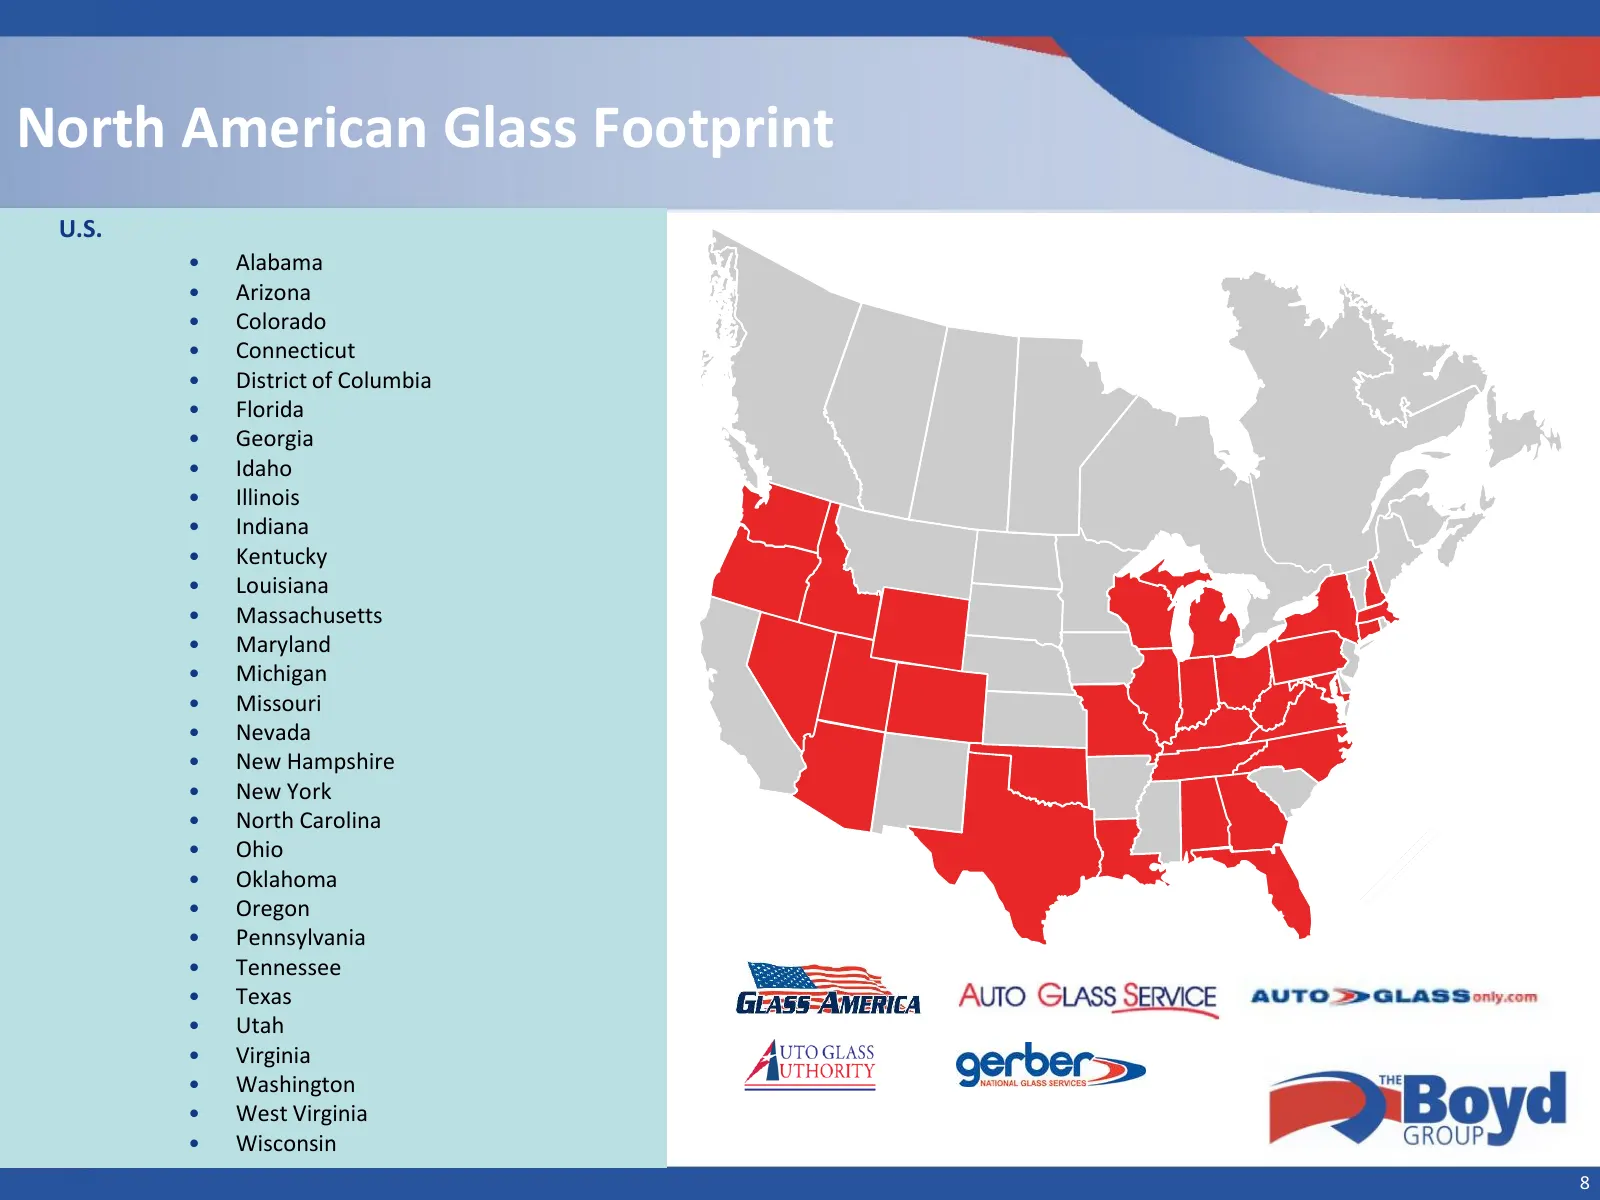
North American Glass Footprint U.S. • Alabama • Arizona • Colorado • Connecticut • District of Columbia • Florida • Georgia • Idaho • Illinois • Indiana • Kentucky • Louisiana • Massachusetts • Maryland • Michigan • Missouri • Nevada • New Hampshire • New York • North Carolina • Ohio • Oklahoma • Or
Slide 9: Market Overview & Business Strategy
Market Overview & Business Strategy 9
Slide 10: Large, Fragmented Market
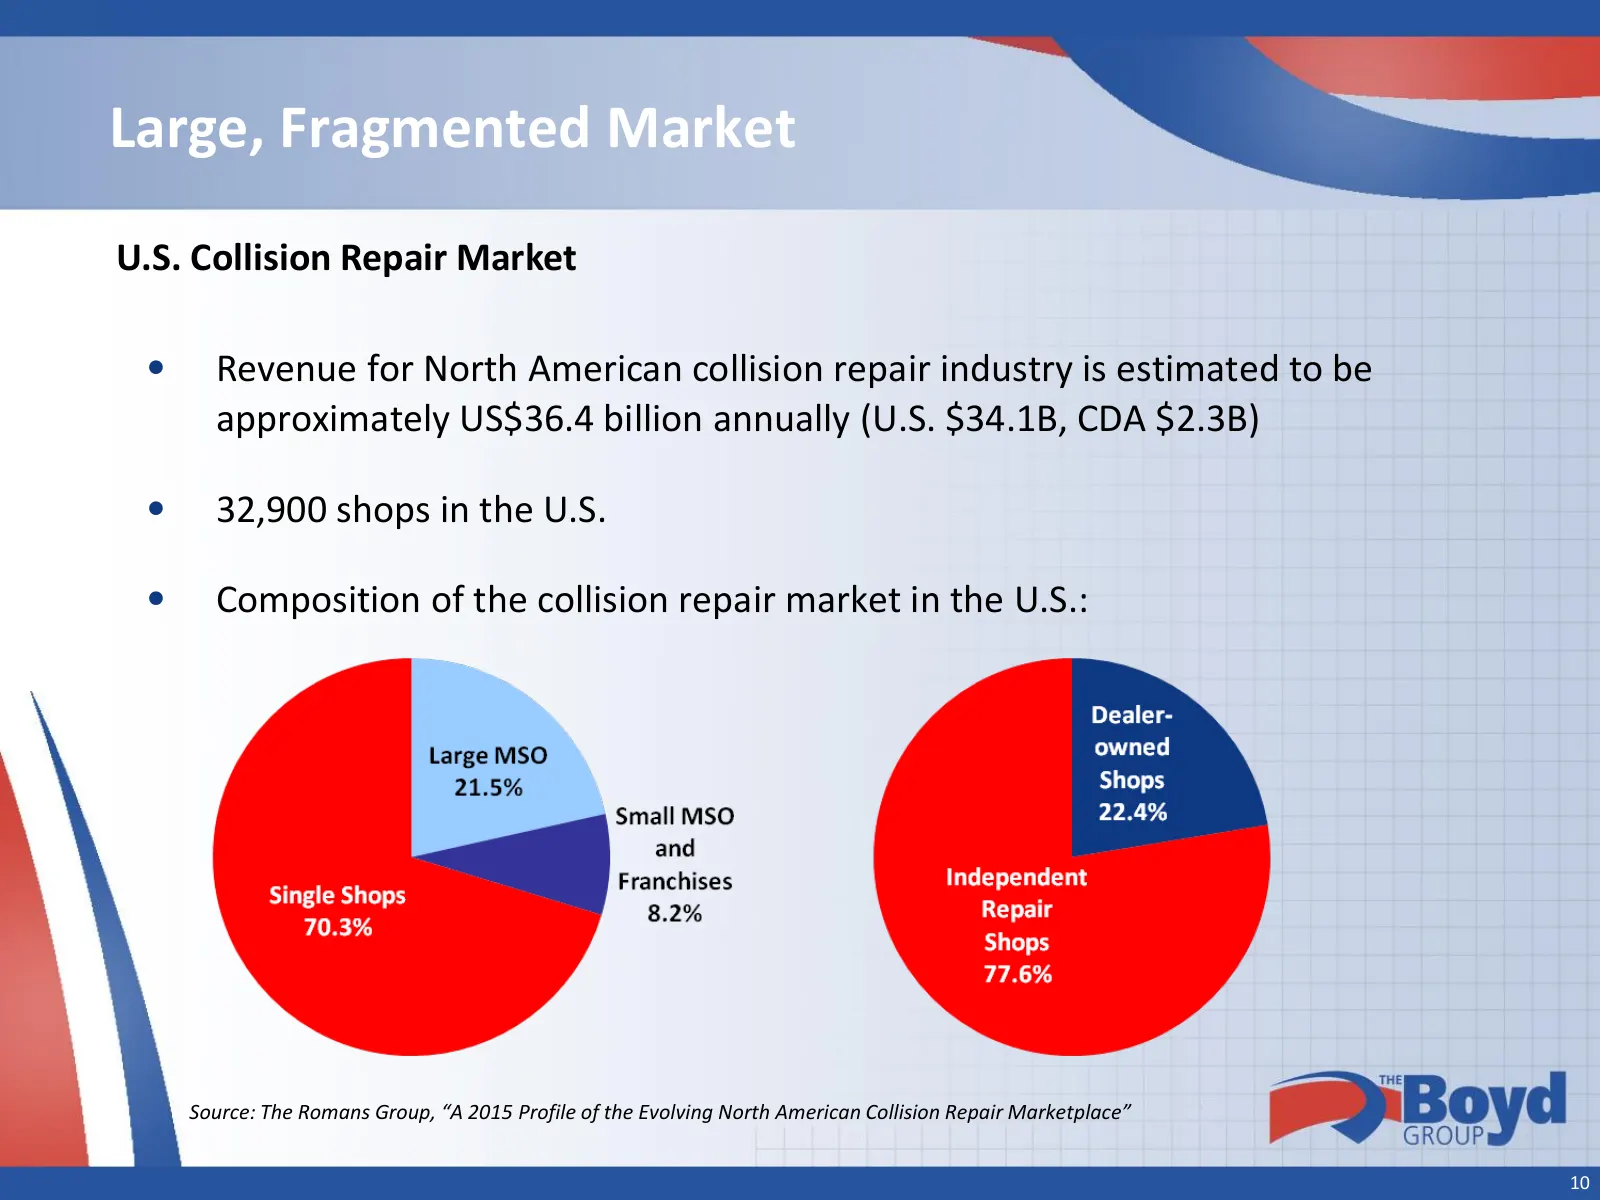
Large, Fragmented Market U.S. Collision Repair Market • Revenue for North American collision repair industry is estimated to be approximately US$36.4 billion annually (U.S. $34.1B, CDA $2.3B) • 32,900 shops in the U.S. • Composition of the collision repair market in the U.S.: Source: The Romans Grou
Slide 11: Evolving Collision Repair Market
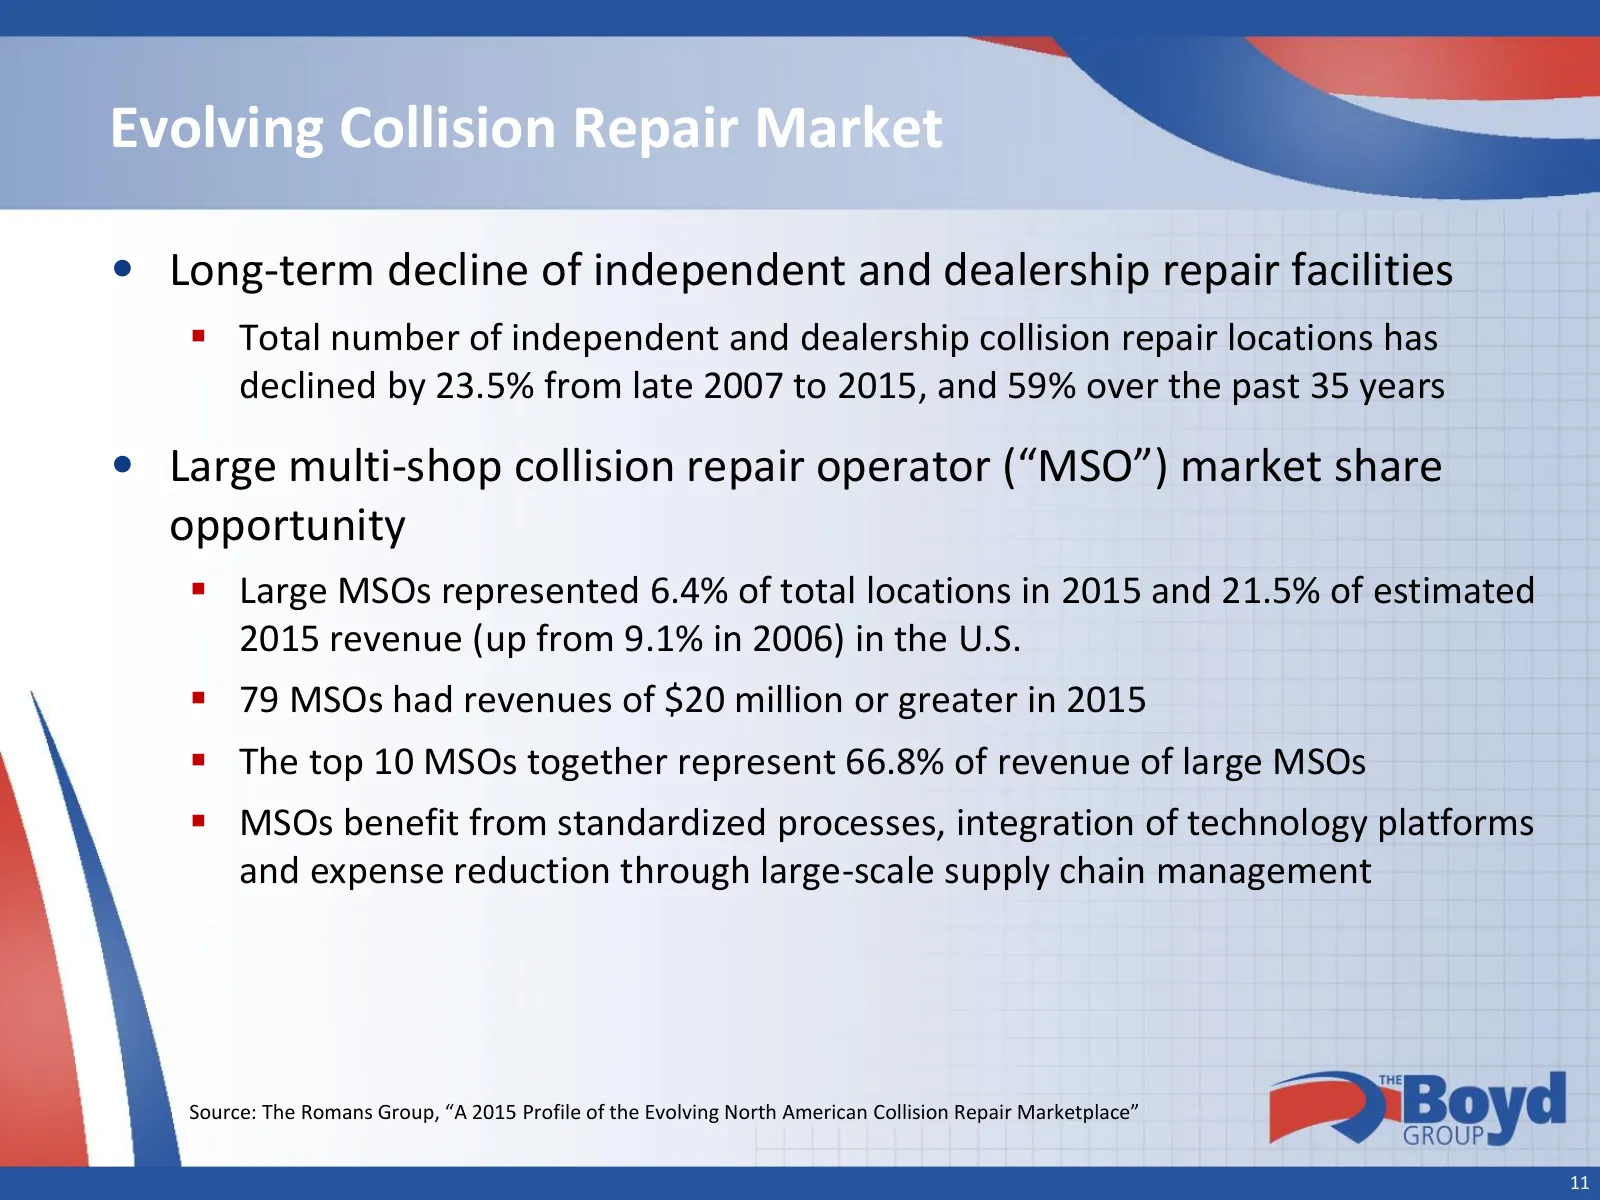
Evolving Collision Repair Market • Long-term decline of independent and dealership repair facilities Total number of independent and dealership collision repair locations has declined by 23.5% from late 2007 to 2015, and 59% over the past 35 years • Large multi-shop collision repair operator (“MSO
Slide 12: Strong Relationships with Insurance Companies through DRPs
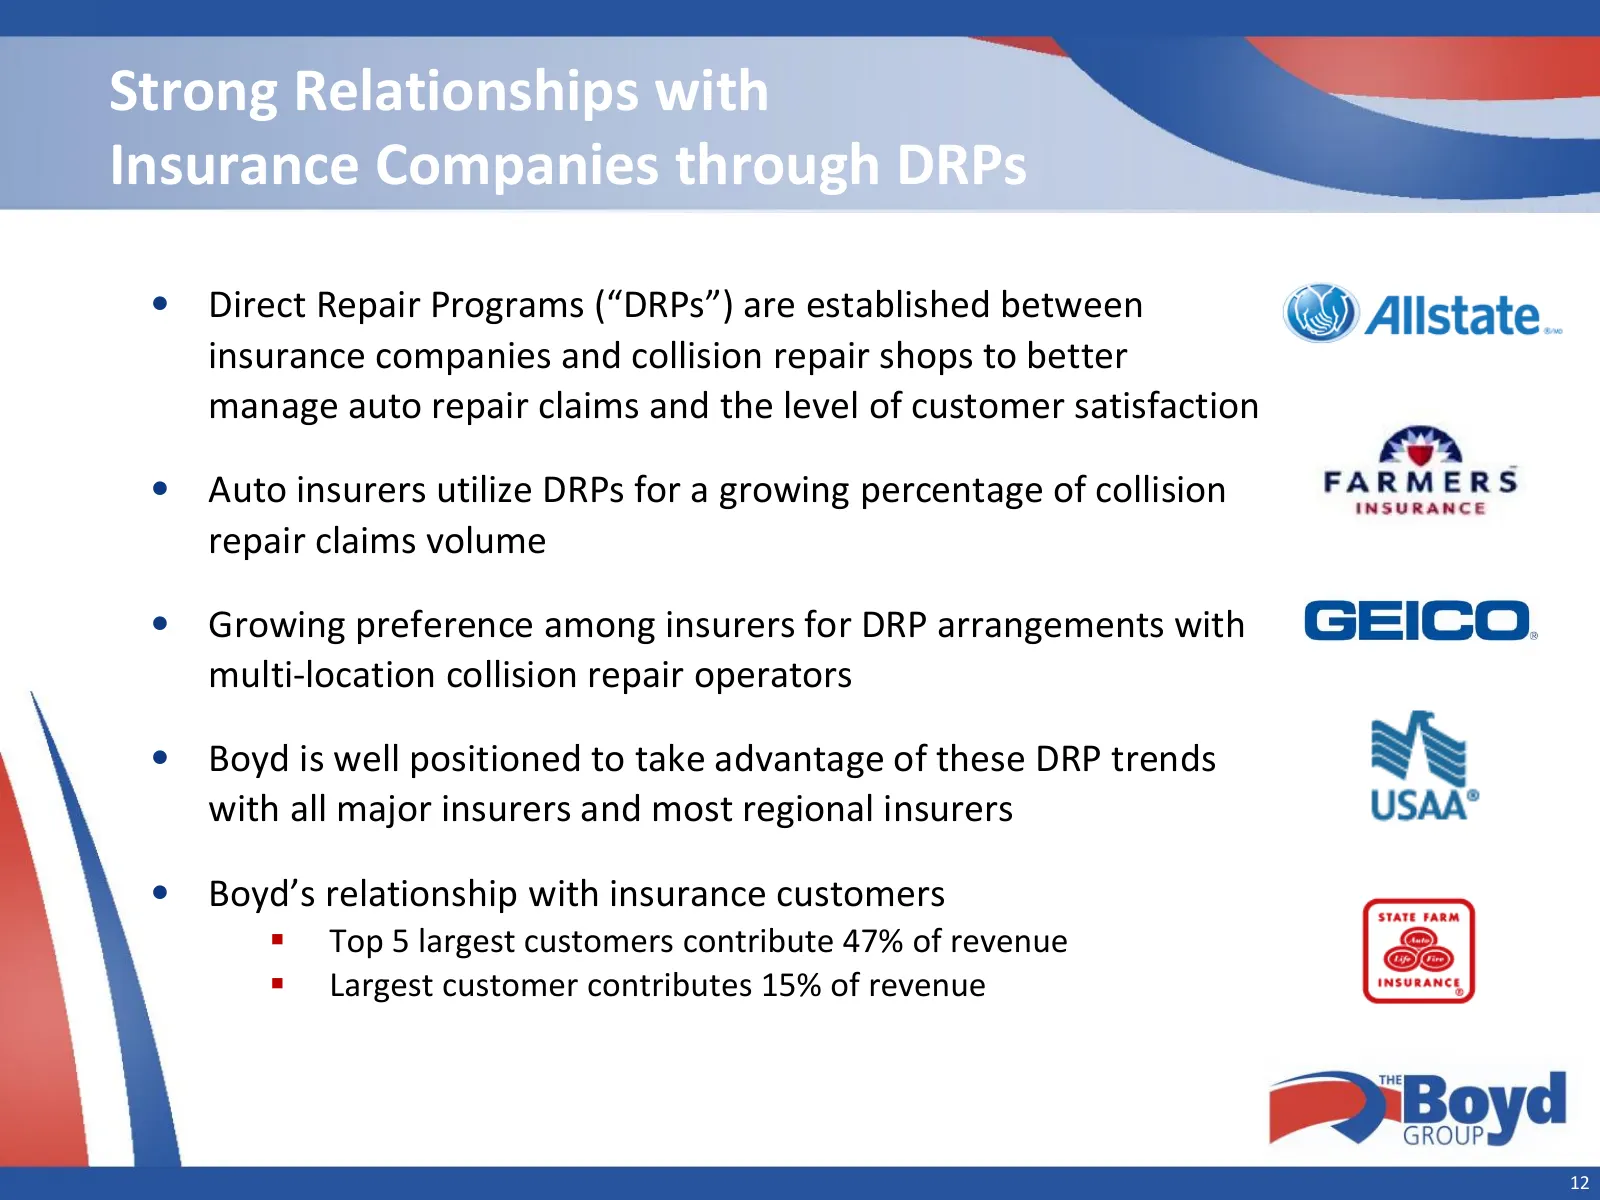
Strong Relationships with Insurance Companies through DRPs • Direct Repair Programs (“DRPs”) are established between insurance companies and collision repair shops to better manage auto repair claims and the level of customer satisfaction • Auto insurers utilize DRPs for a growing percentage of coll
Slide 13: Insurer Market Dynamics
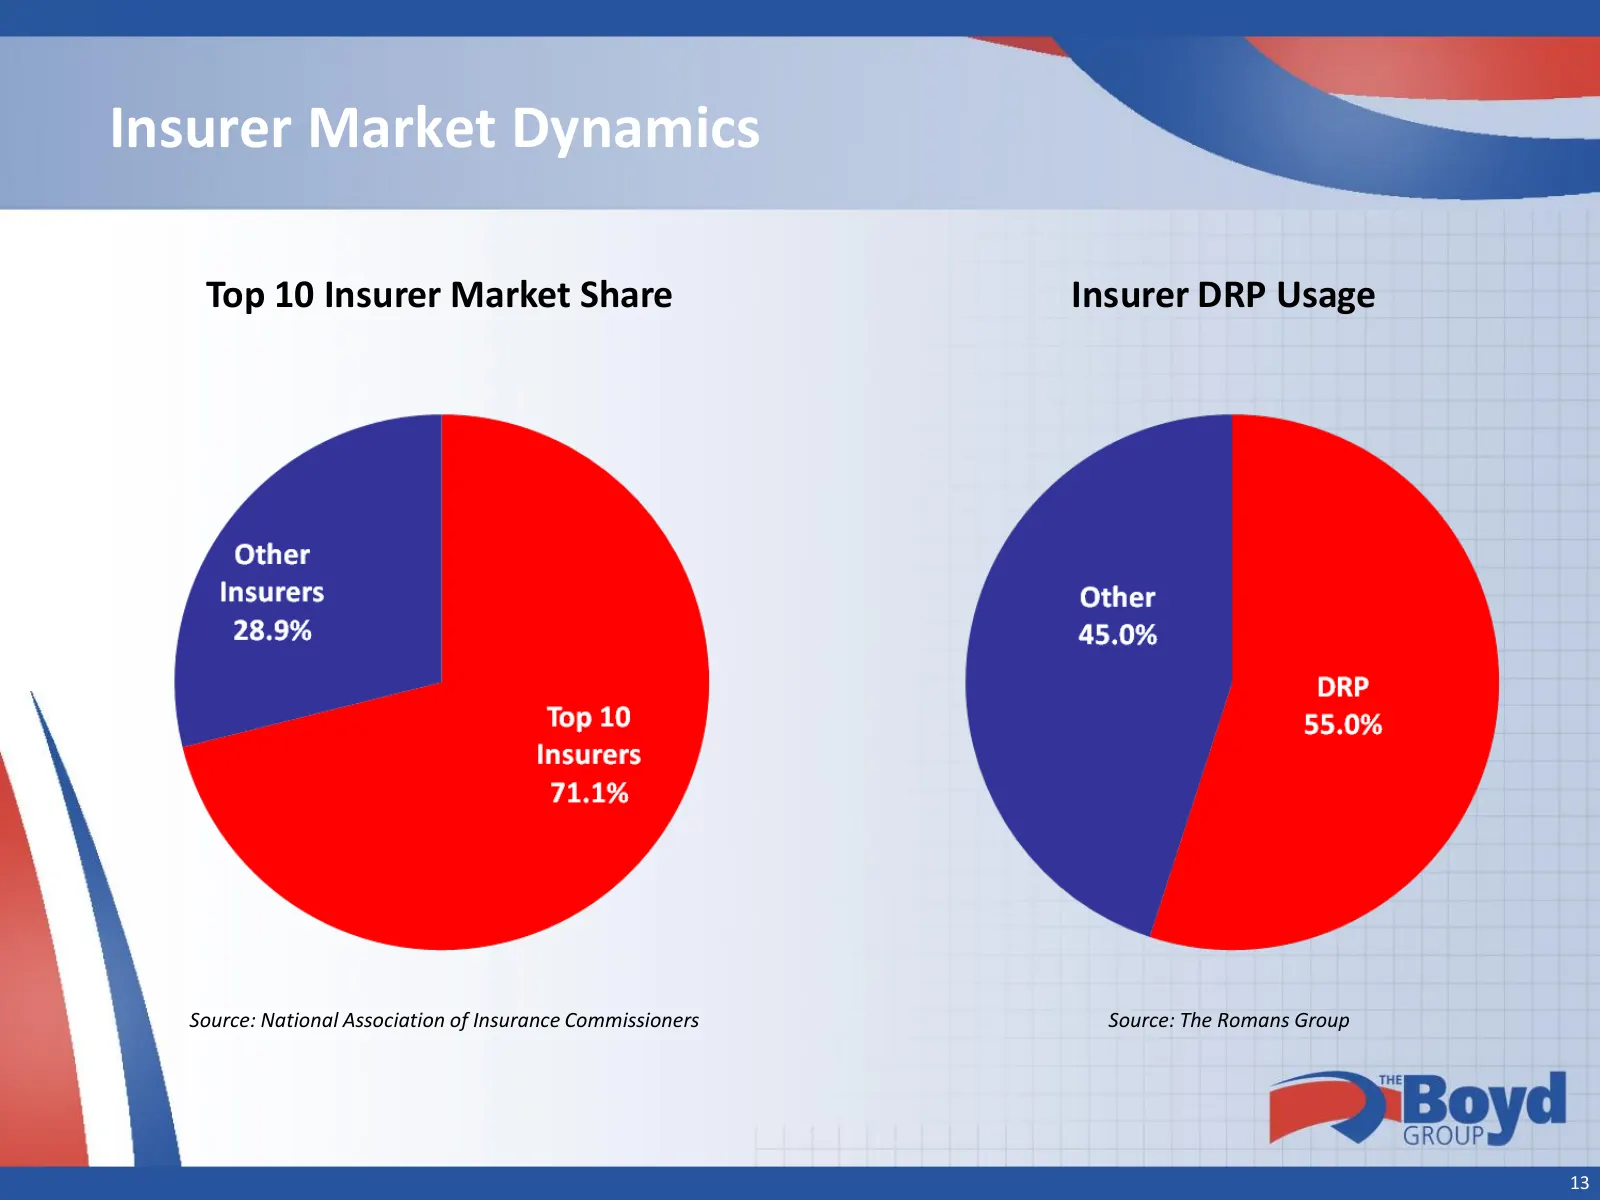
Insurer Market Dynamics Top 10 Insurer Market Share Insurer DRP Usage Source: National Association of Insurance Commissioners Source: The Romans Group 13
Slide 14: Impact of Collision Avoidance Systems
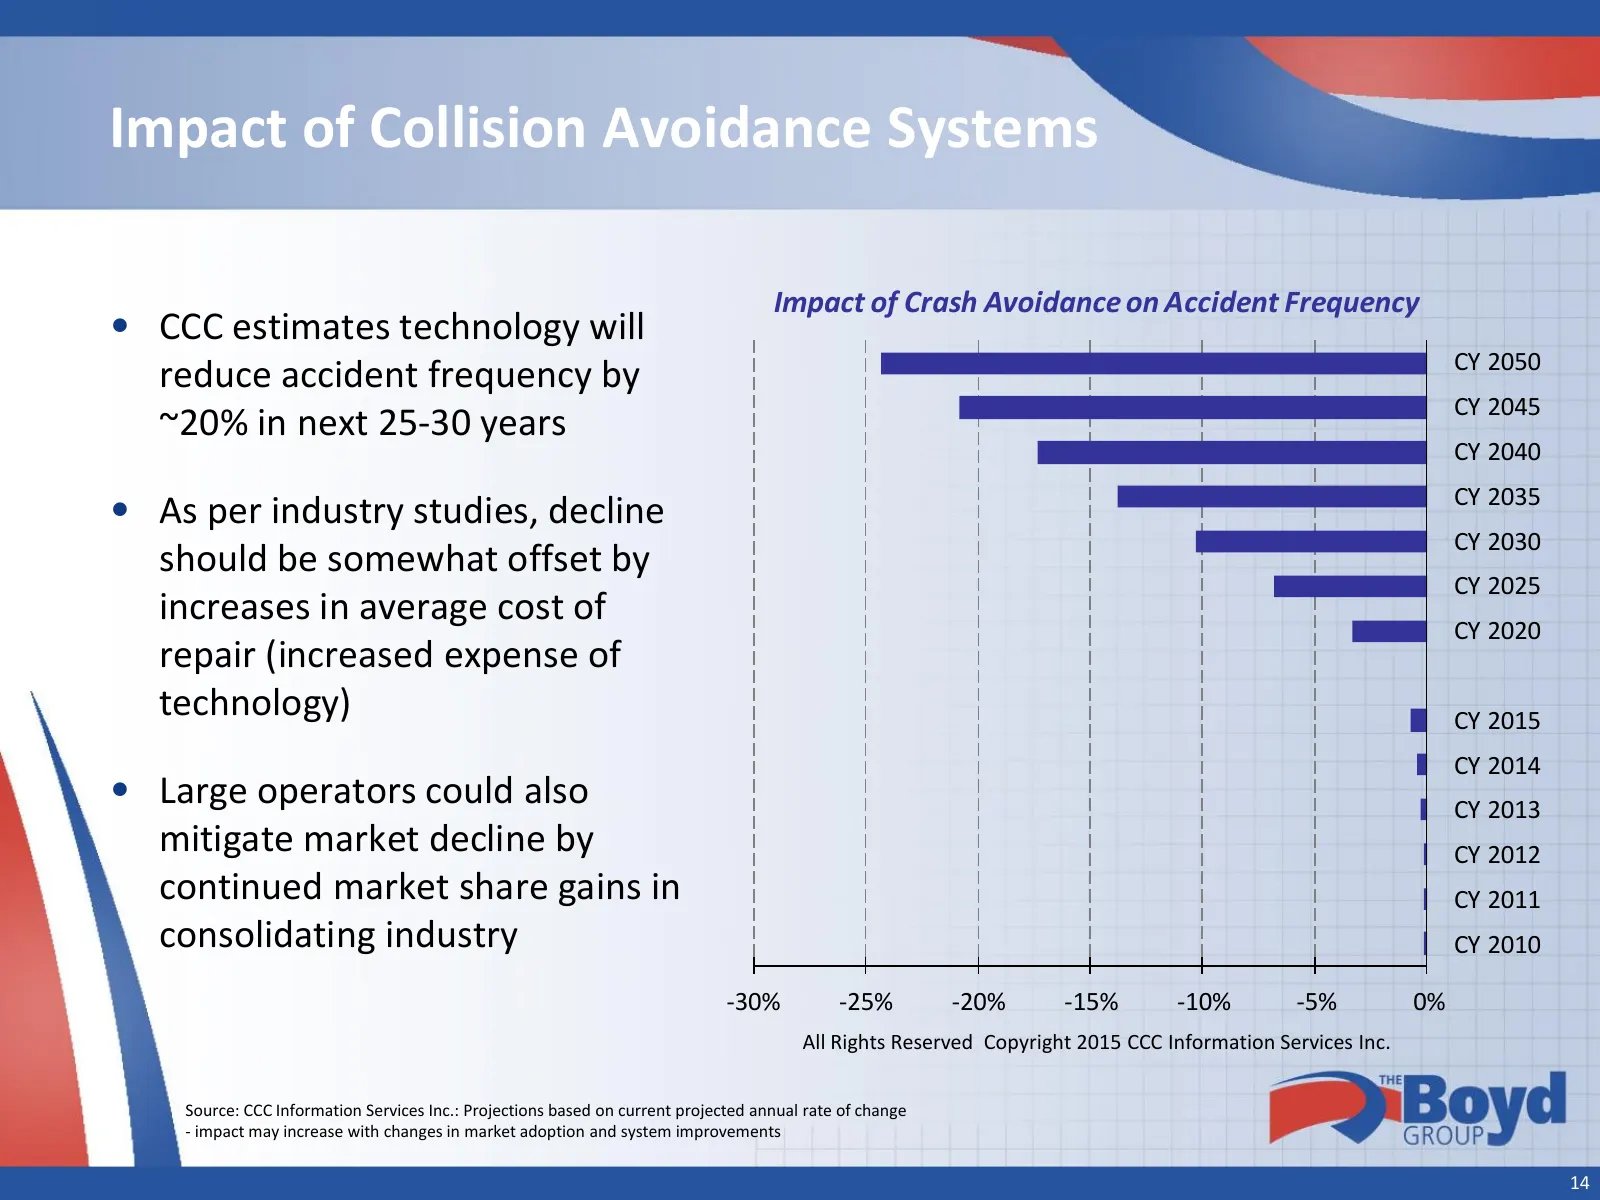
Impact of Collision Avoidance Systems Impact of Crash Avoidance on Accident Frequency • CCC estimates technology will CY 2050 reduce accident frequency by CY 2045 ~20% in next 25-30 years CY 2040 CY 2035 • As per industry studies, decline CY 2030 should be somewhat offset by CY 2025 increases in ave
Slide 15: Business Strategy
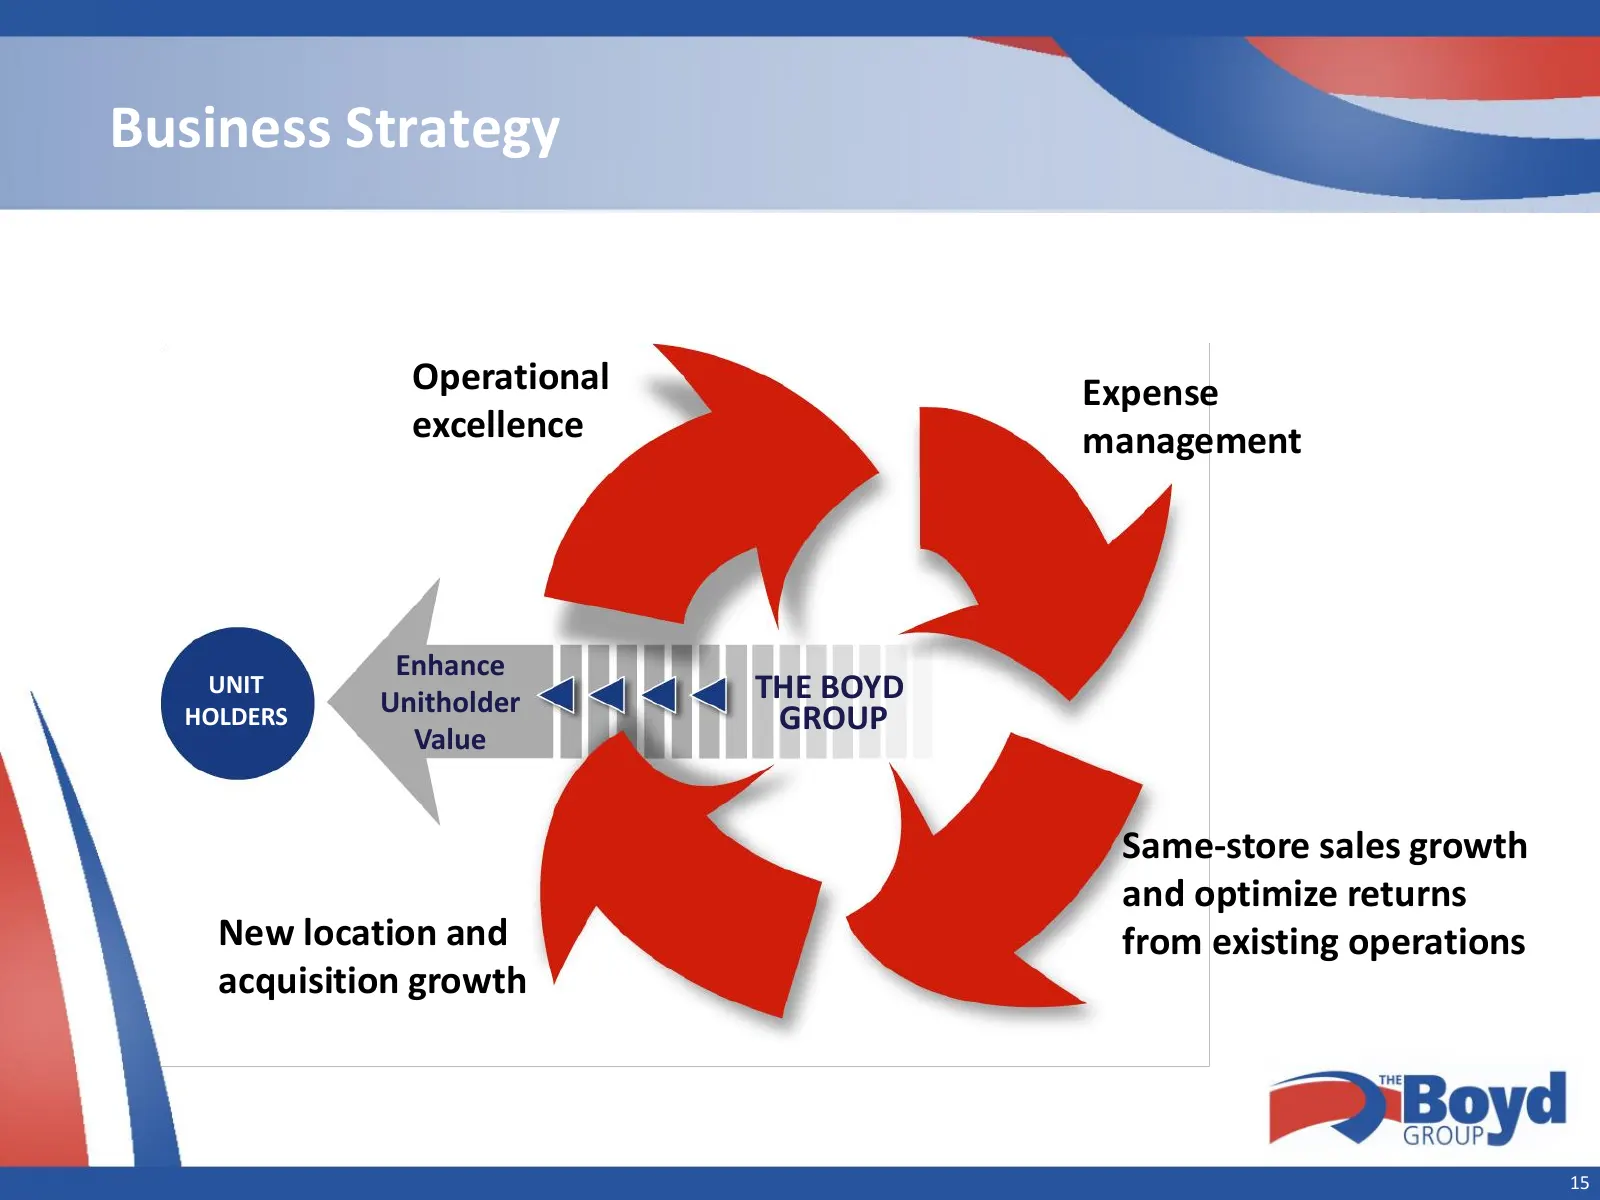
Business Strategy Operational Expense excellence management Enhance UNIT Unitholder THE BOYD HOLDERS GROUP Value Same-store sales growth and optimize returns New location and from existing operations acquisition growth 15
Slide 16: Operational Excellence – WOW Operating Way
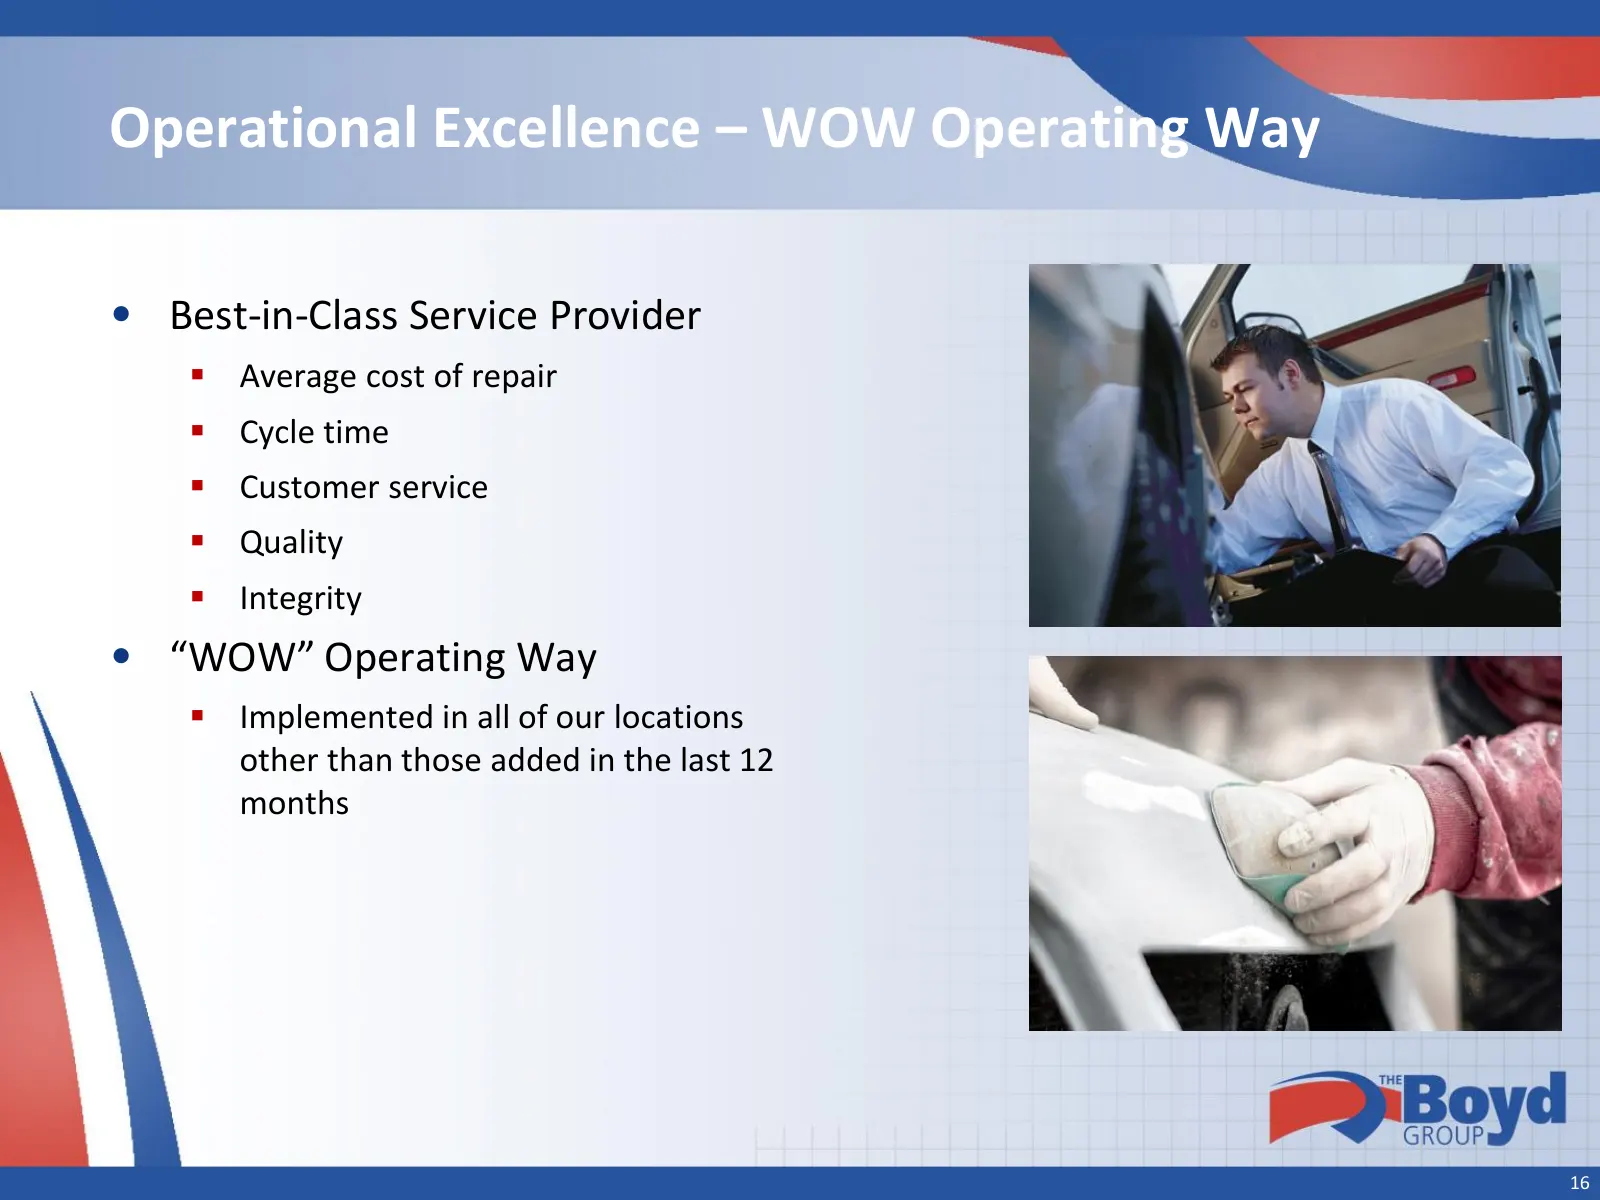
Operational Excellence – WOW Operating Way • Best-in-Class Service Provider Average cost of repair Cycle time Customer service Quality Integrity • “WOW” Operating Way Implemented in all of our locations other than those added in the last 12 months 16
Slide 17: Operating Expenses as % of Sales
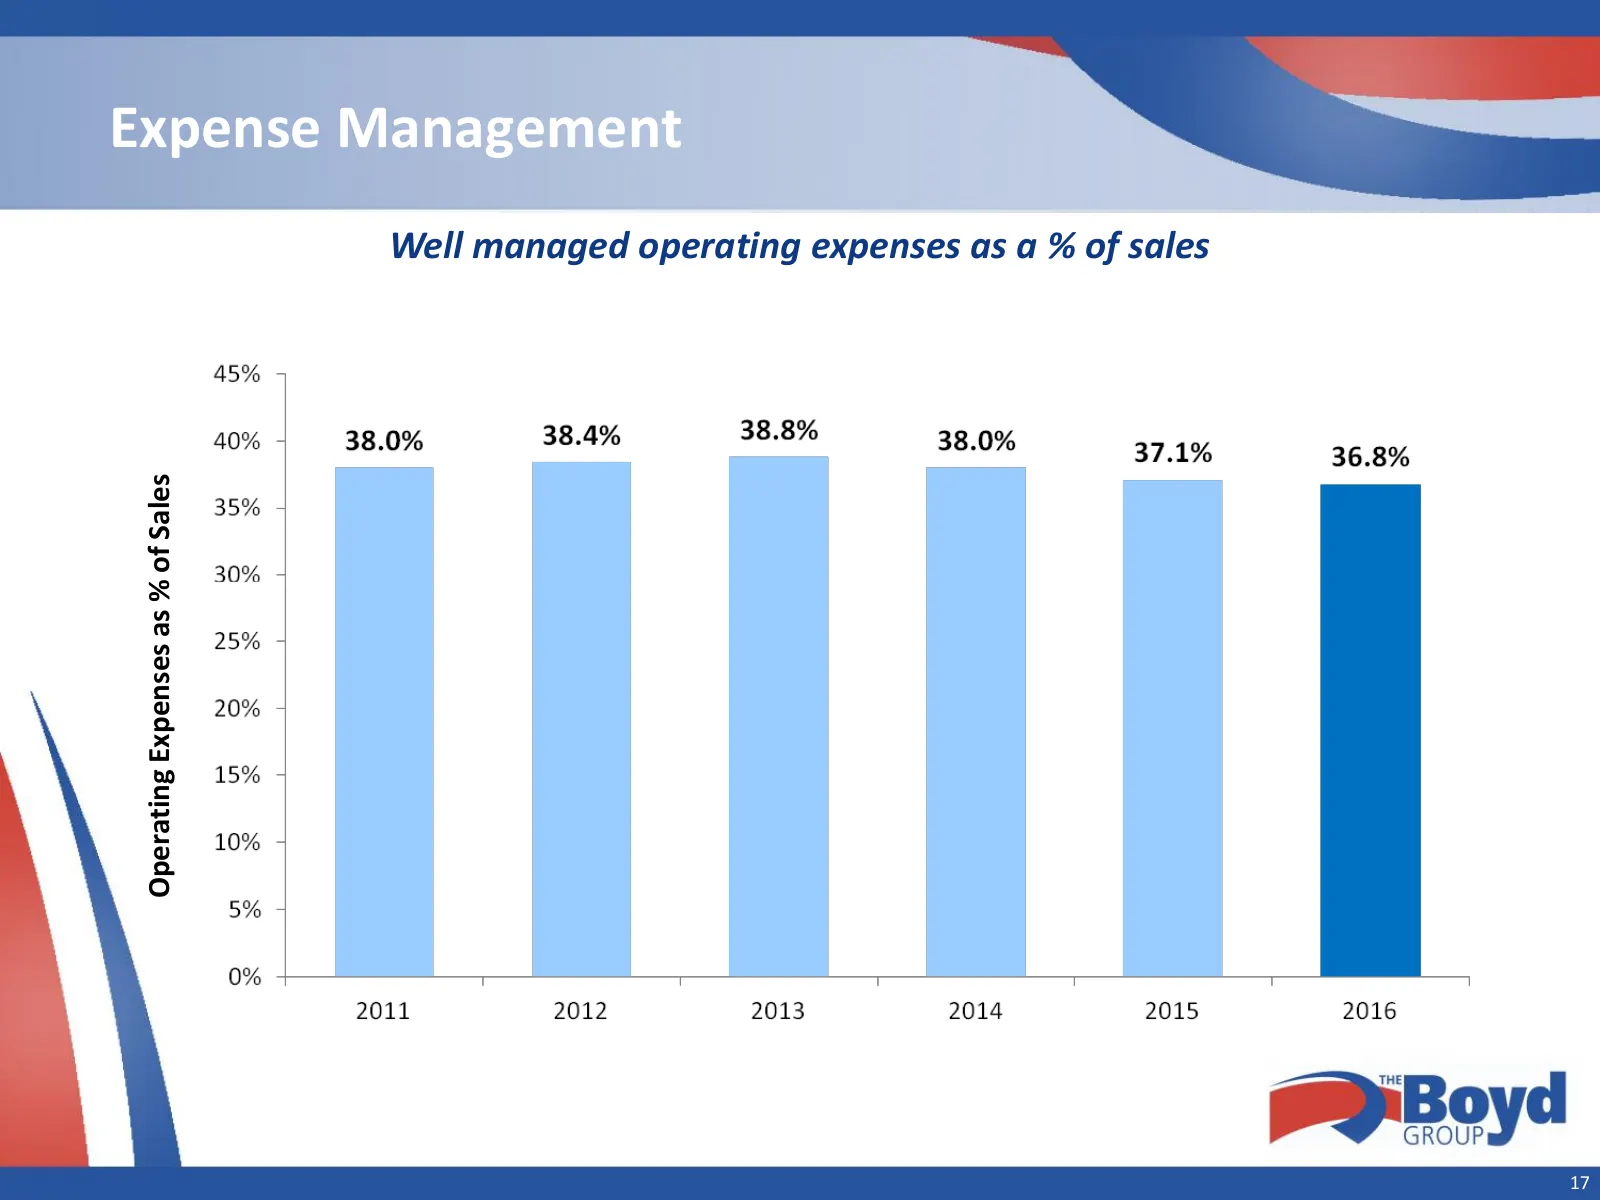
Expense Management Well managed operating expenses as a % of sales Operating Expenses as % of Sales 17
Slide 18: Same-Store Sales Growth
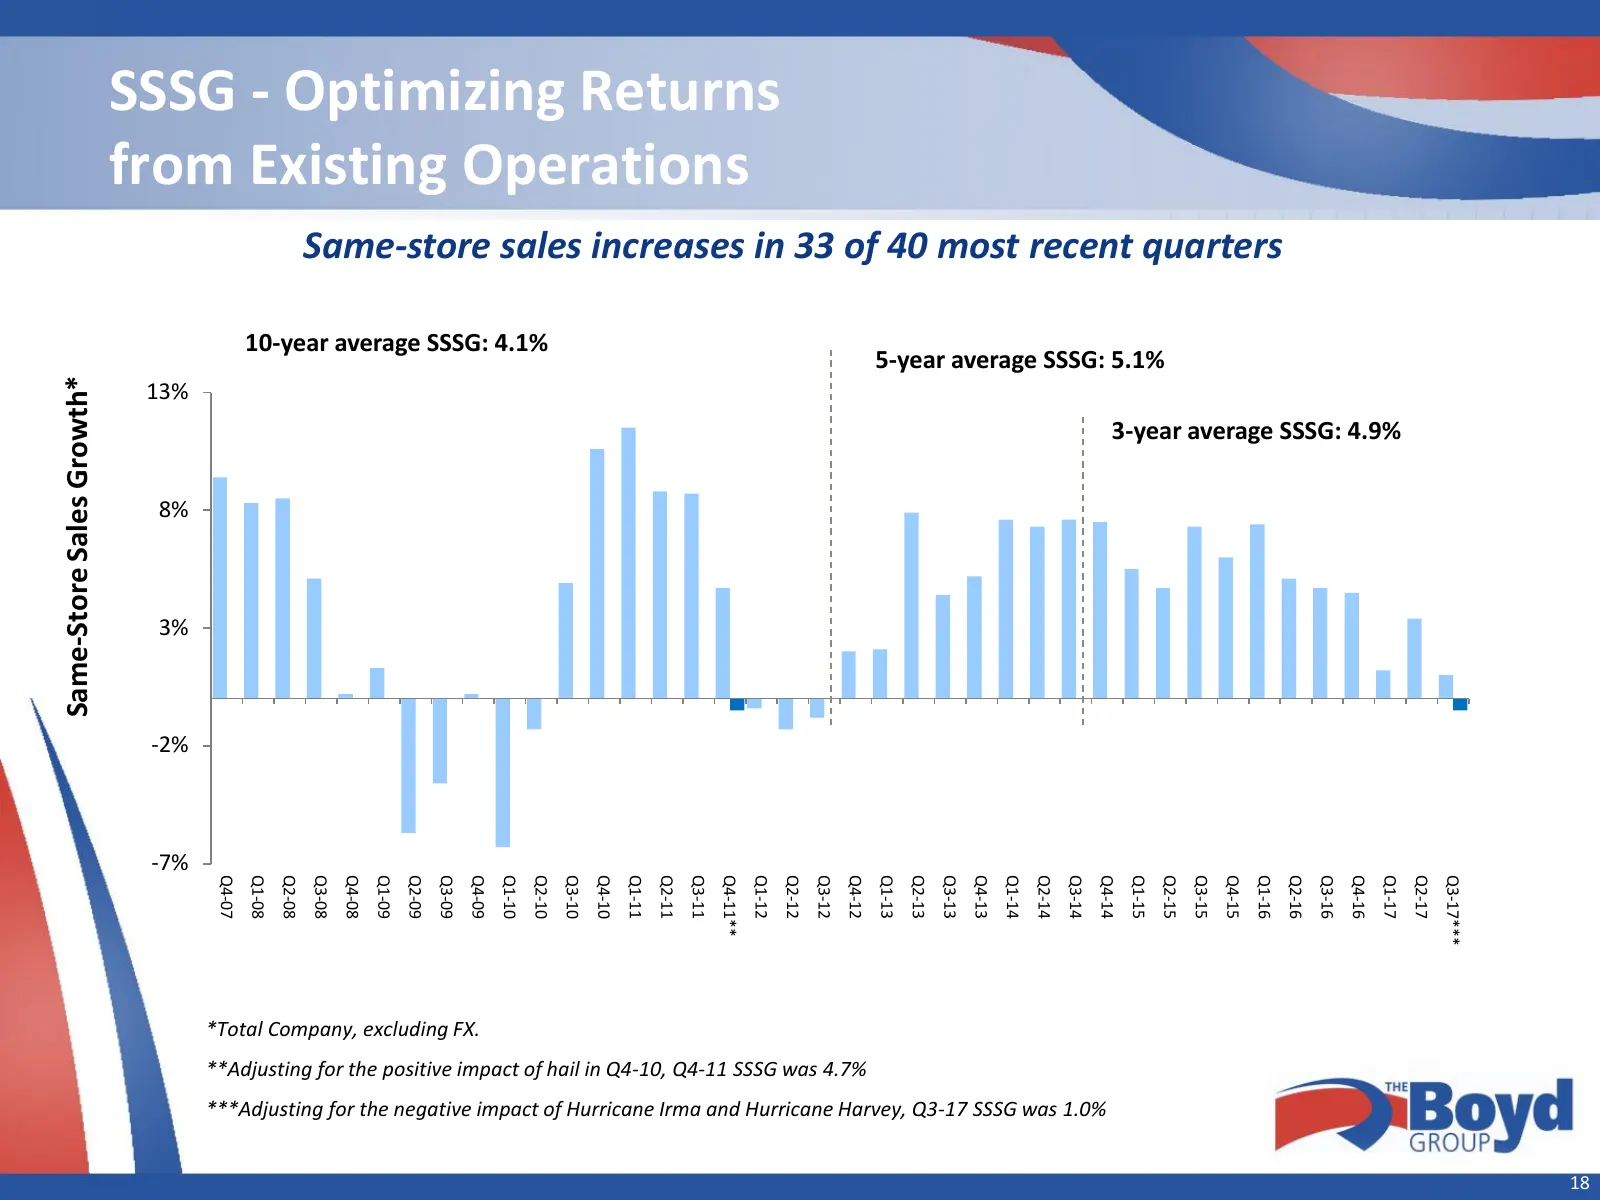
SSSG - Optimizing Returns from Existing Operations Same-store sales increases in 33 of 40 most recent quarters 10-year average SSSG: 4.1% 5-year average SSSG: 5.1% Same-Store Sales Growth* 13% 3-year average SSSG: 4.9% 8% 3% -2% -7% Q4-07 Q1-08 Q2-08 Q3-08 Q4-08 Q1-09 Q2-09 Q3-09 Q4-09 Q1-10 Q2-10 Q
Slide 19: Focus on Accretive Growth
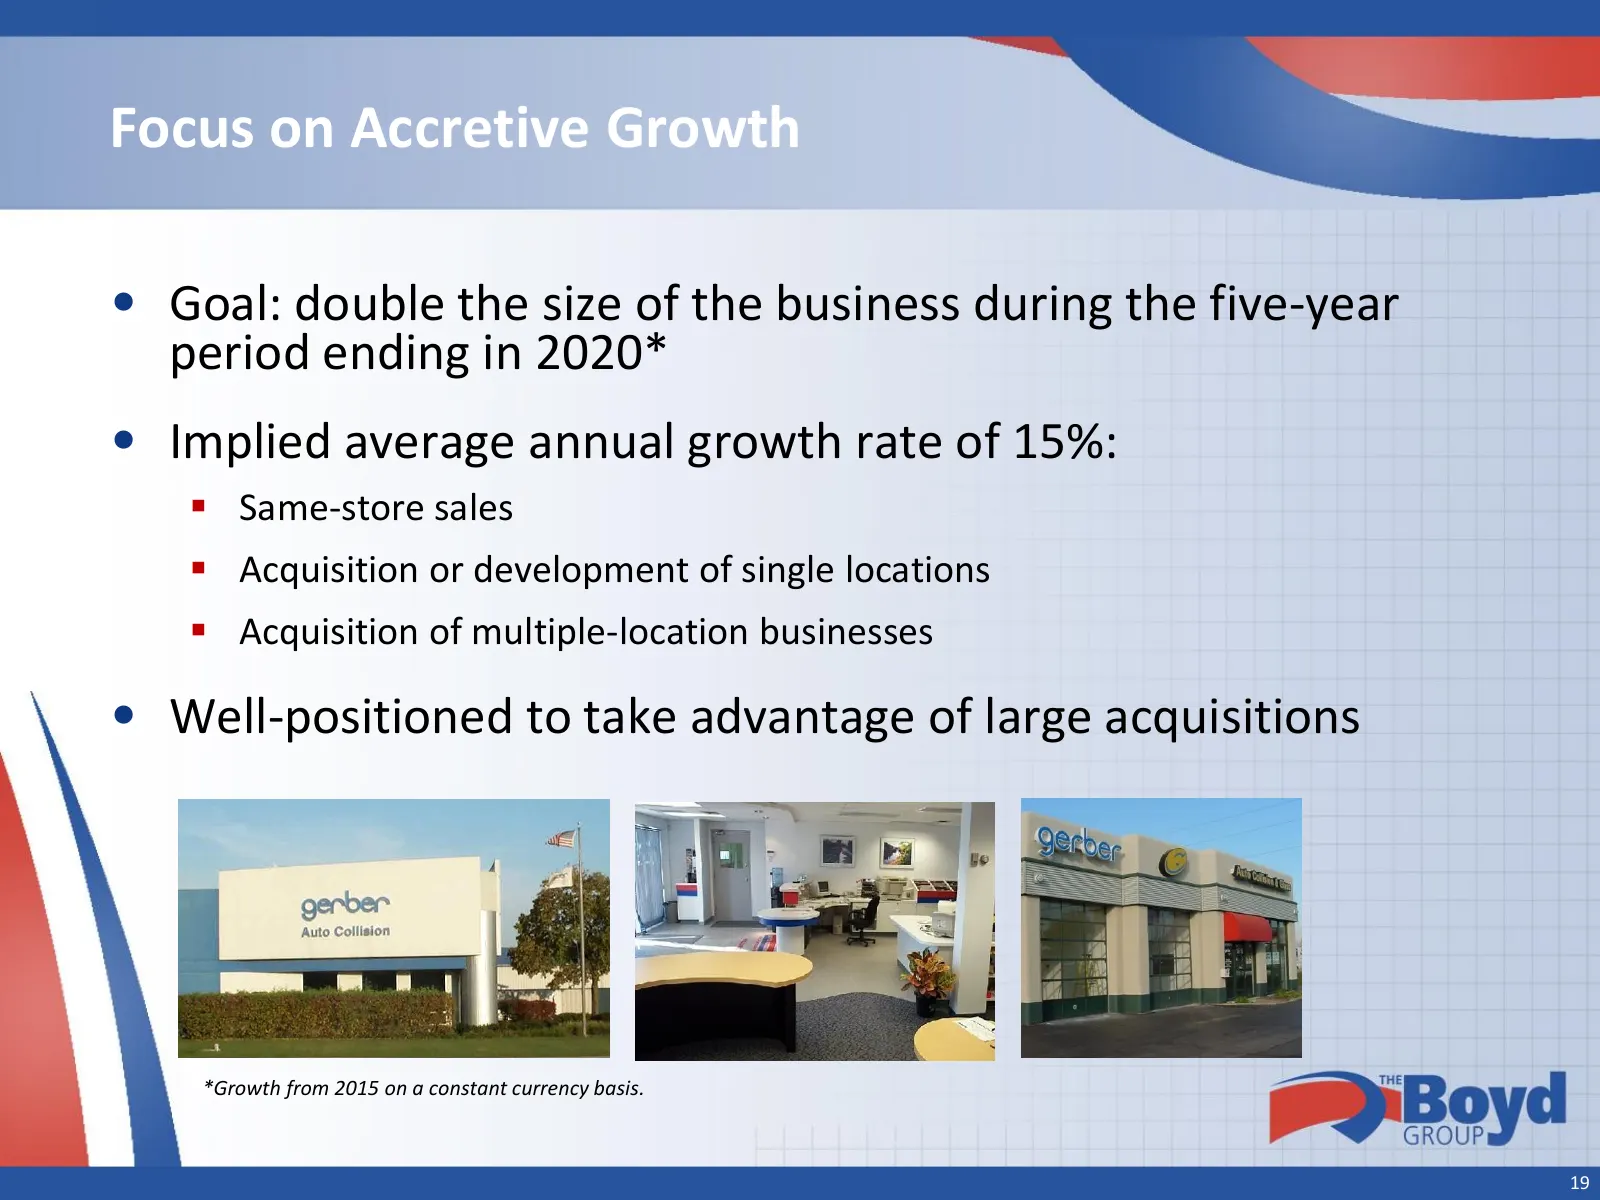
Focus on Accretive Growth • Goal: double the size of the business during the five-year period ending in 2020* • Implied average annual growth rate of 15%: Same-store sales Acquisition or development of single locations Acquisition of multiple-location businesses • Well-positioned to take advan
Slide 20: Strong Growth in Locations
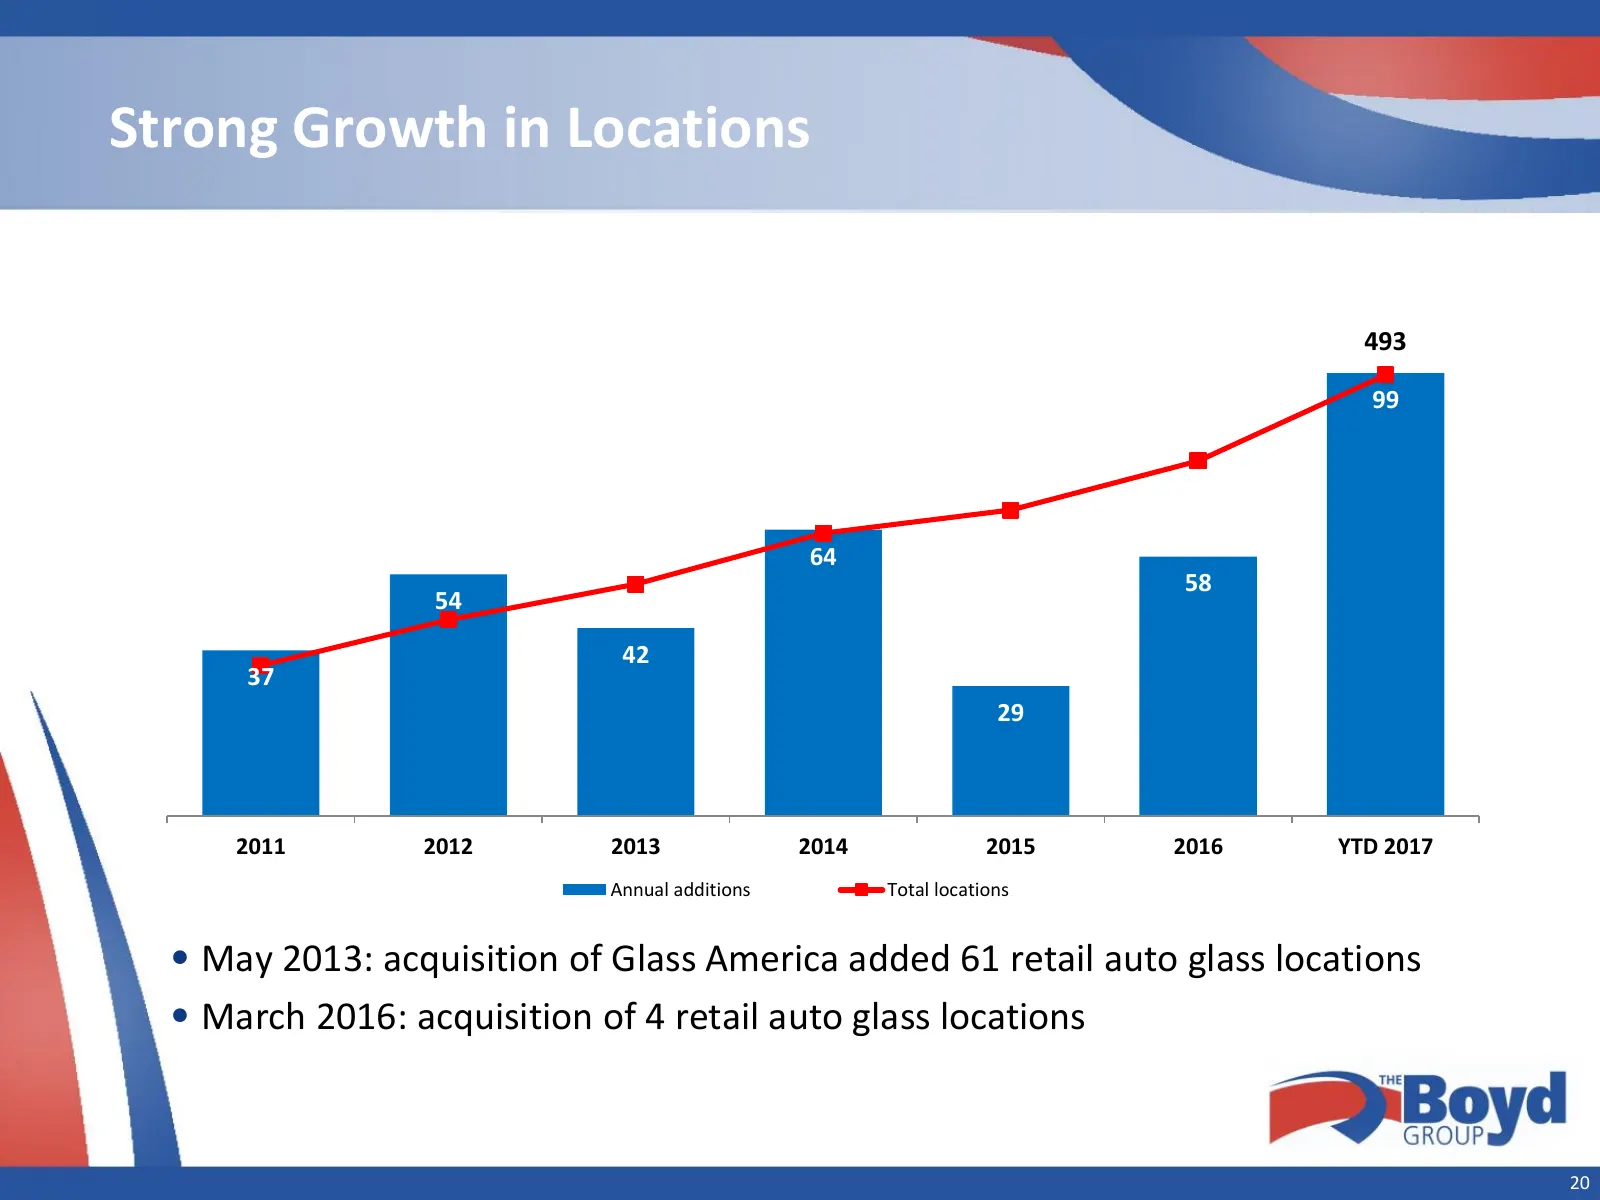
Strong Growth in Locations 120 600 493 100 500 99 80 400 60 300 64 58 54 40 200 42 37 20 29 100 0 0 2011 2012 2013 2014 2015 2016 YTD 2017 Annual additions Total locations • May 2013: acquisition of Glass America added 61 retail auto glass locations • March 2016: acquisition of 4 retail auto glass l
Slide 21: Financial Review
Financial Review 21
Slide 22: Revenue Growth
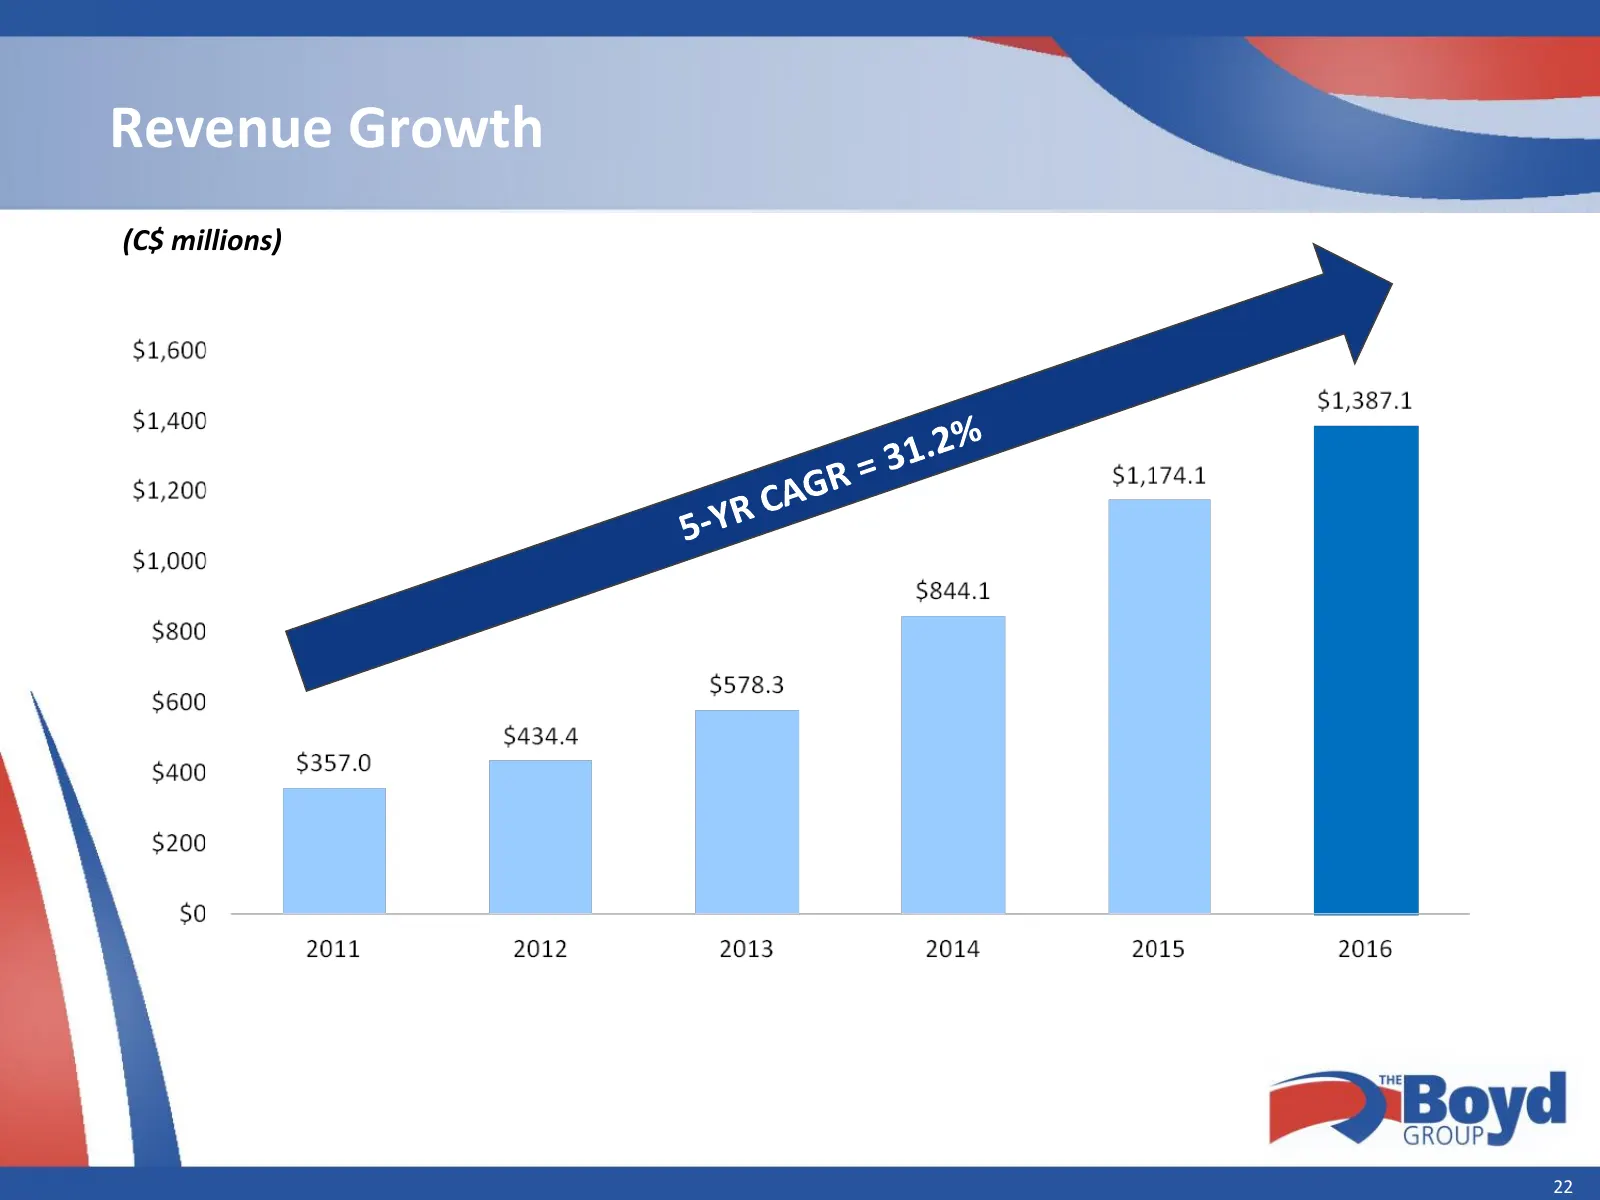
Revenue Growth (C$ millions) 22
Slide 23: Adjusted EBITDA Growth
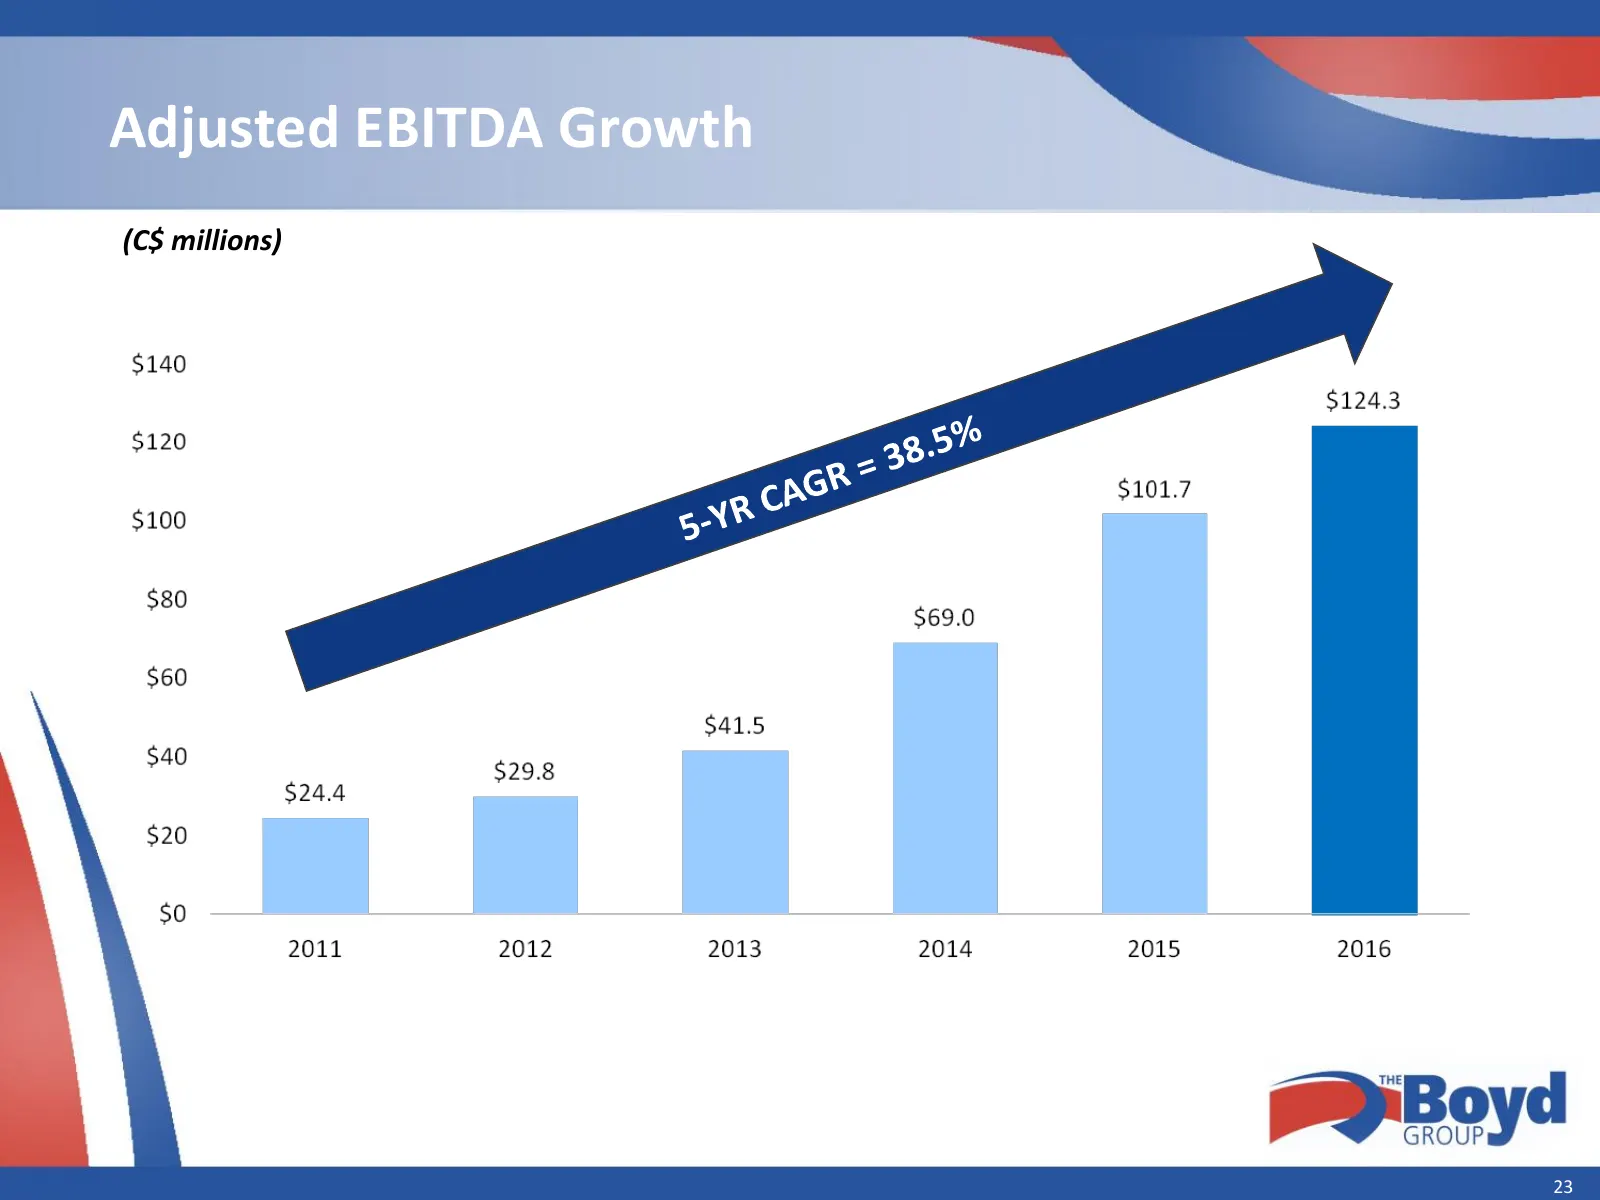
Adjusted EBITDA Growth (C$ millions) 23
Slide 24: Financial Summary
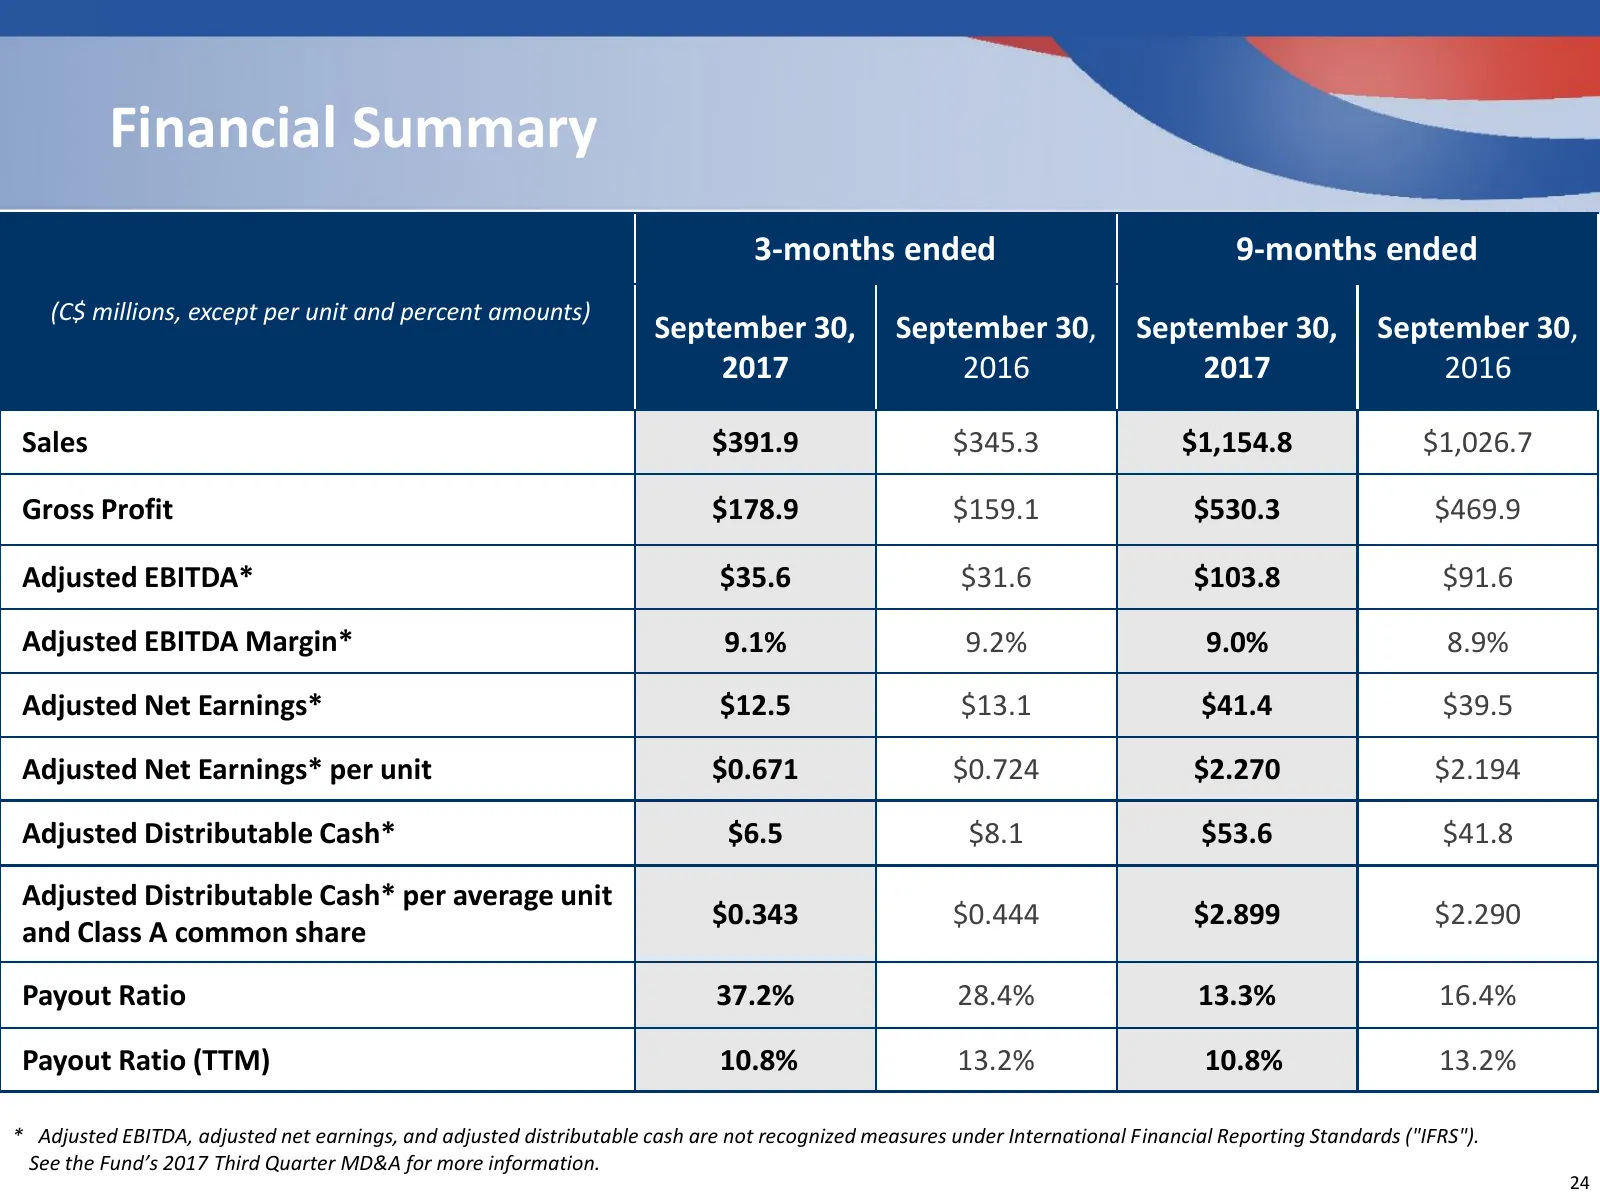
Financial Summary 3-months ended 9-months ended (C$ millions, except per unit and percent amounts) September 30, September 30, September 30, September 30, 2017 2016 2017 2016 Sales $391.9 $345.3 $1,154.8 $1,026.7 Gross Profit $178.9 $159.1 $530.3 $469.9 Adjusted EBITDA* $35.6 $31.6 $103.8 $91.6 Adju
Slide 25: Strong Balance Sheet
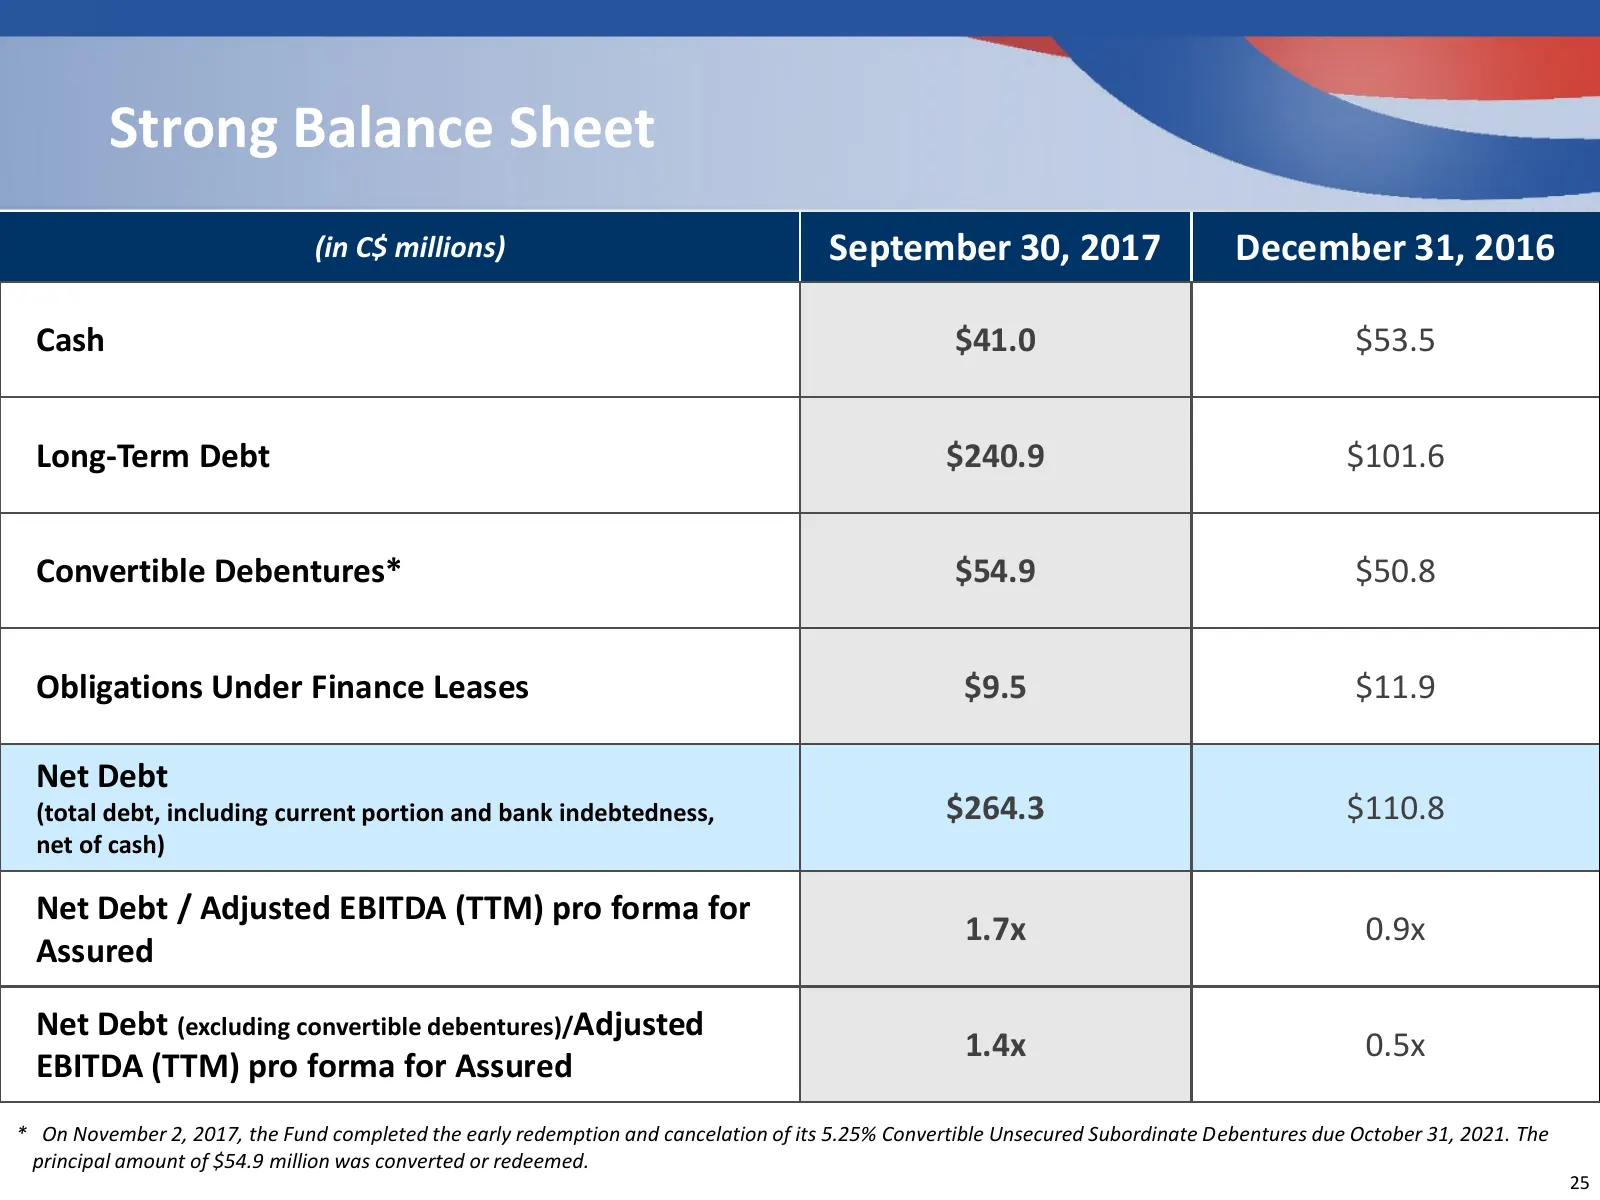
Strong Balance Sheet (in C$ millions) September 30, 2017 December 31, 2016 Cash $41.0 $53.5 Long-Term Debt $240.9 $101.6 Convertible Debentures* $54.9 $50.8 Obligations Under Finance Leases $9.5 $11.9 Net Debt (total debt, including current portion and bank indebtedness, $264.3 $110.8 net of cash) N
Slide 26: Financial Flexibility
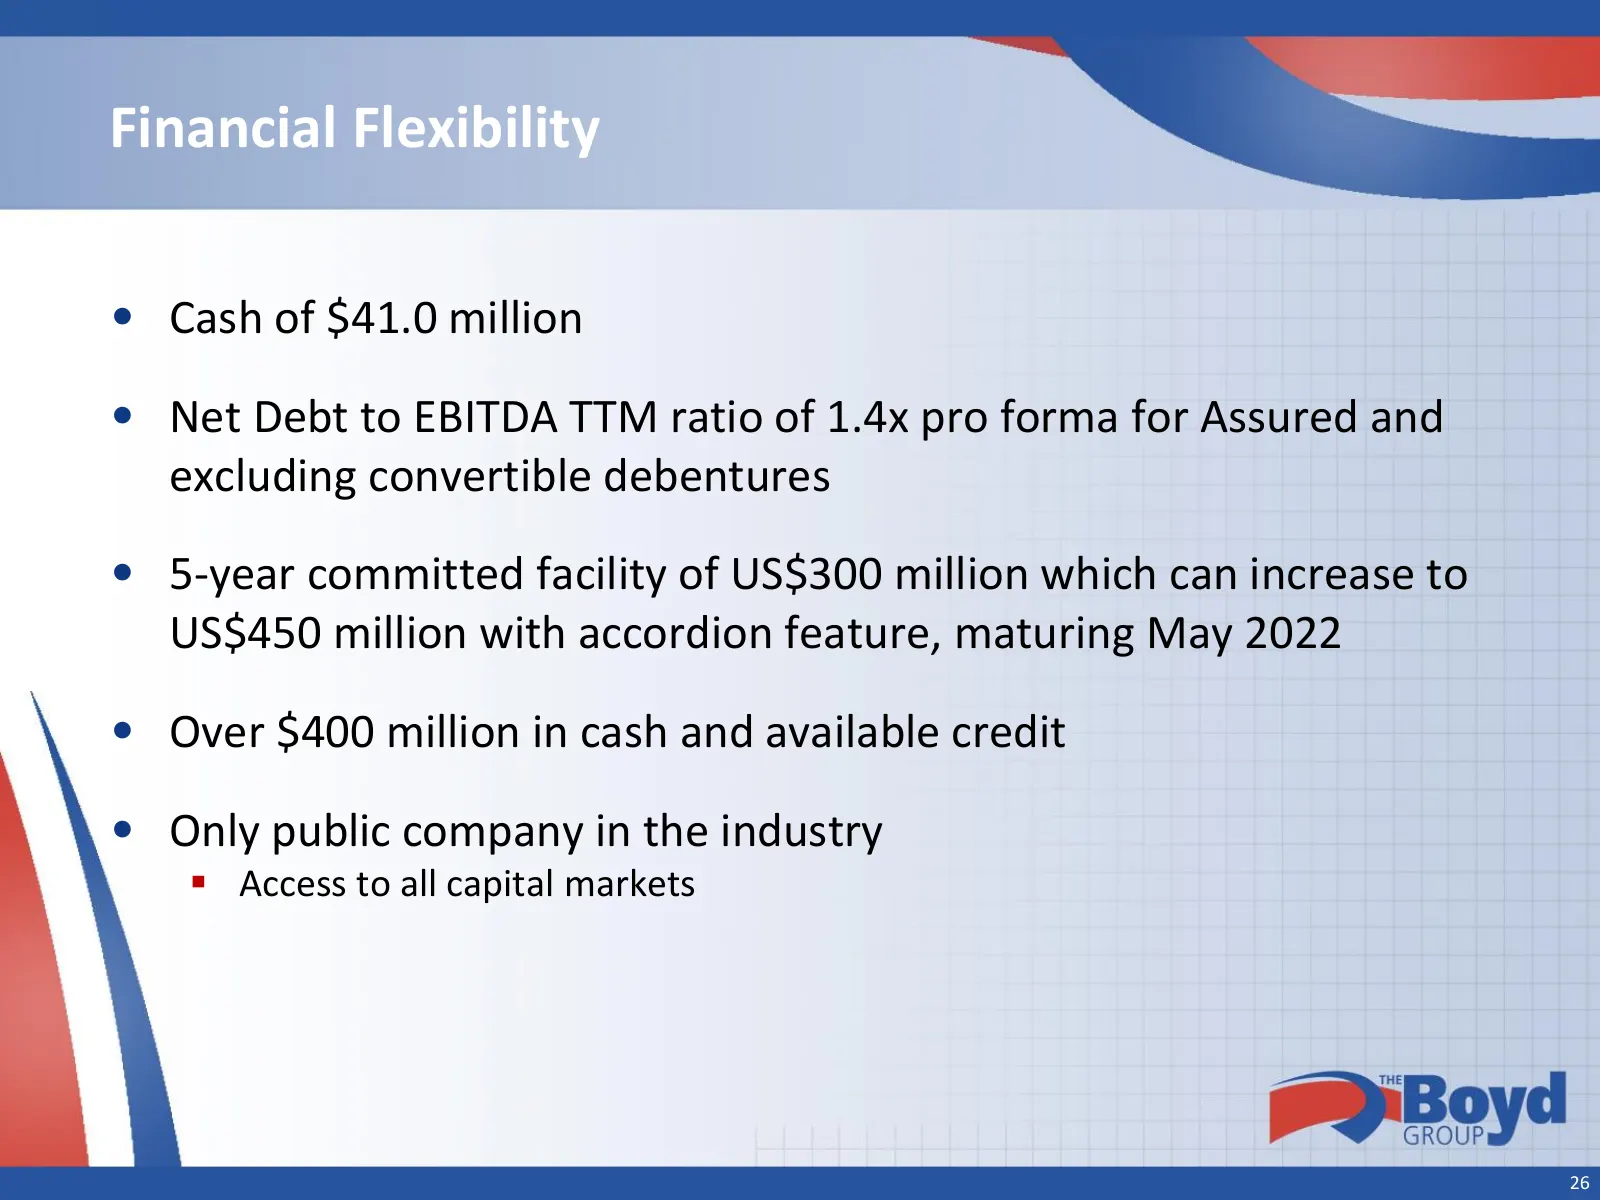
Financial Flexibility • Cash of $41.0 million • Net Debt to EBITDA TTM ratio of 1.4x pro forma for Assured and excluding convertible debentures • 5-year committed facility of US$300 million which can increase to US$450 million with accordion feature, maturing May 2022 • Over $400 million in cash and
Slide 27: Distributions
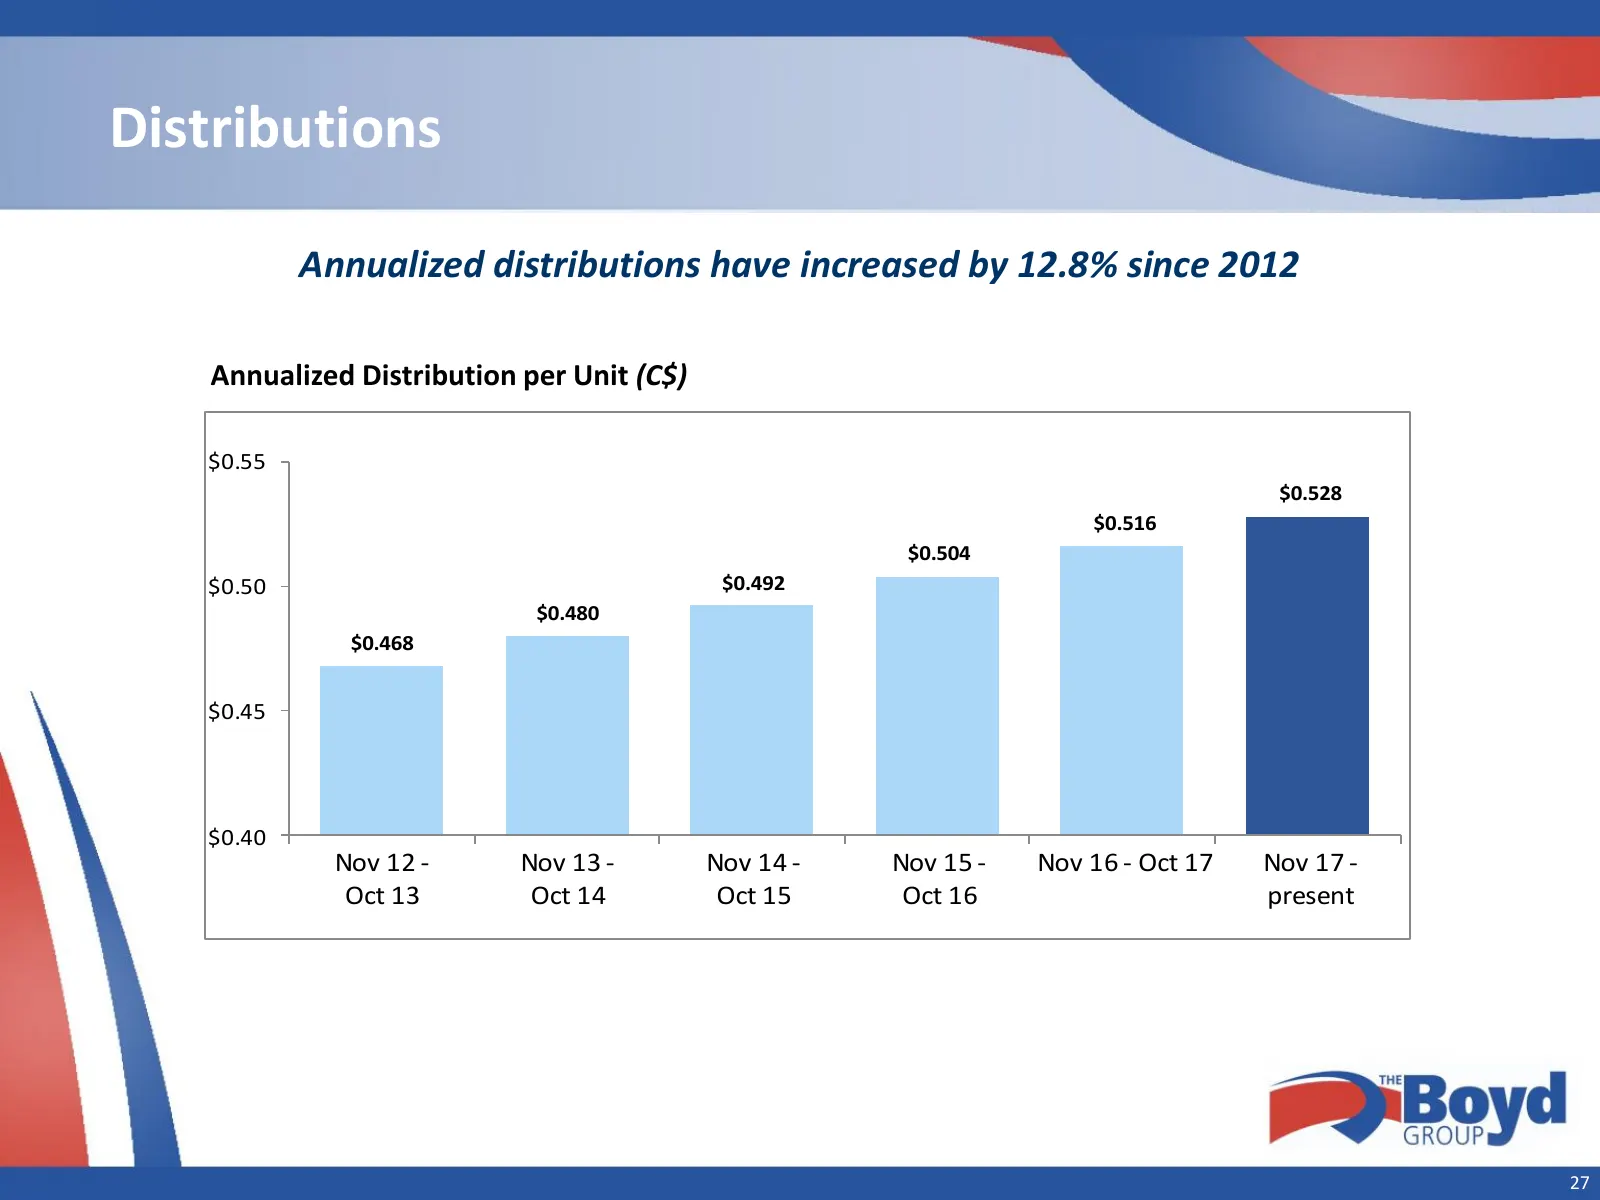
Distributions Annualized distributions have increased by 12.8% since 2012 Annualized Distribution per Unit (C$) $0.55 $0.528 $0.516 $0.504 $0.50 $0.492 $0.480 $0.468 $0.45 $0.40 Nov 12 - Nov 13 - Nov 14 - Nov 15 - Nov 16 - Oct 17 Nov 17 - Oct 13 Oct 14 Oct 15 Oct 16 present 27
Slide 28: Five-year Return to Unitholders
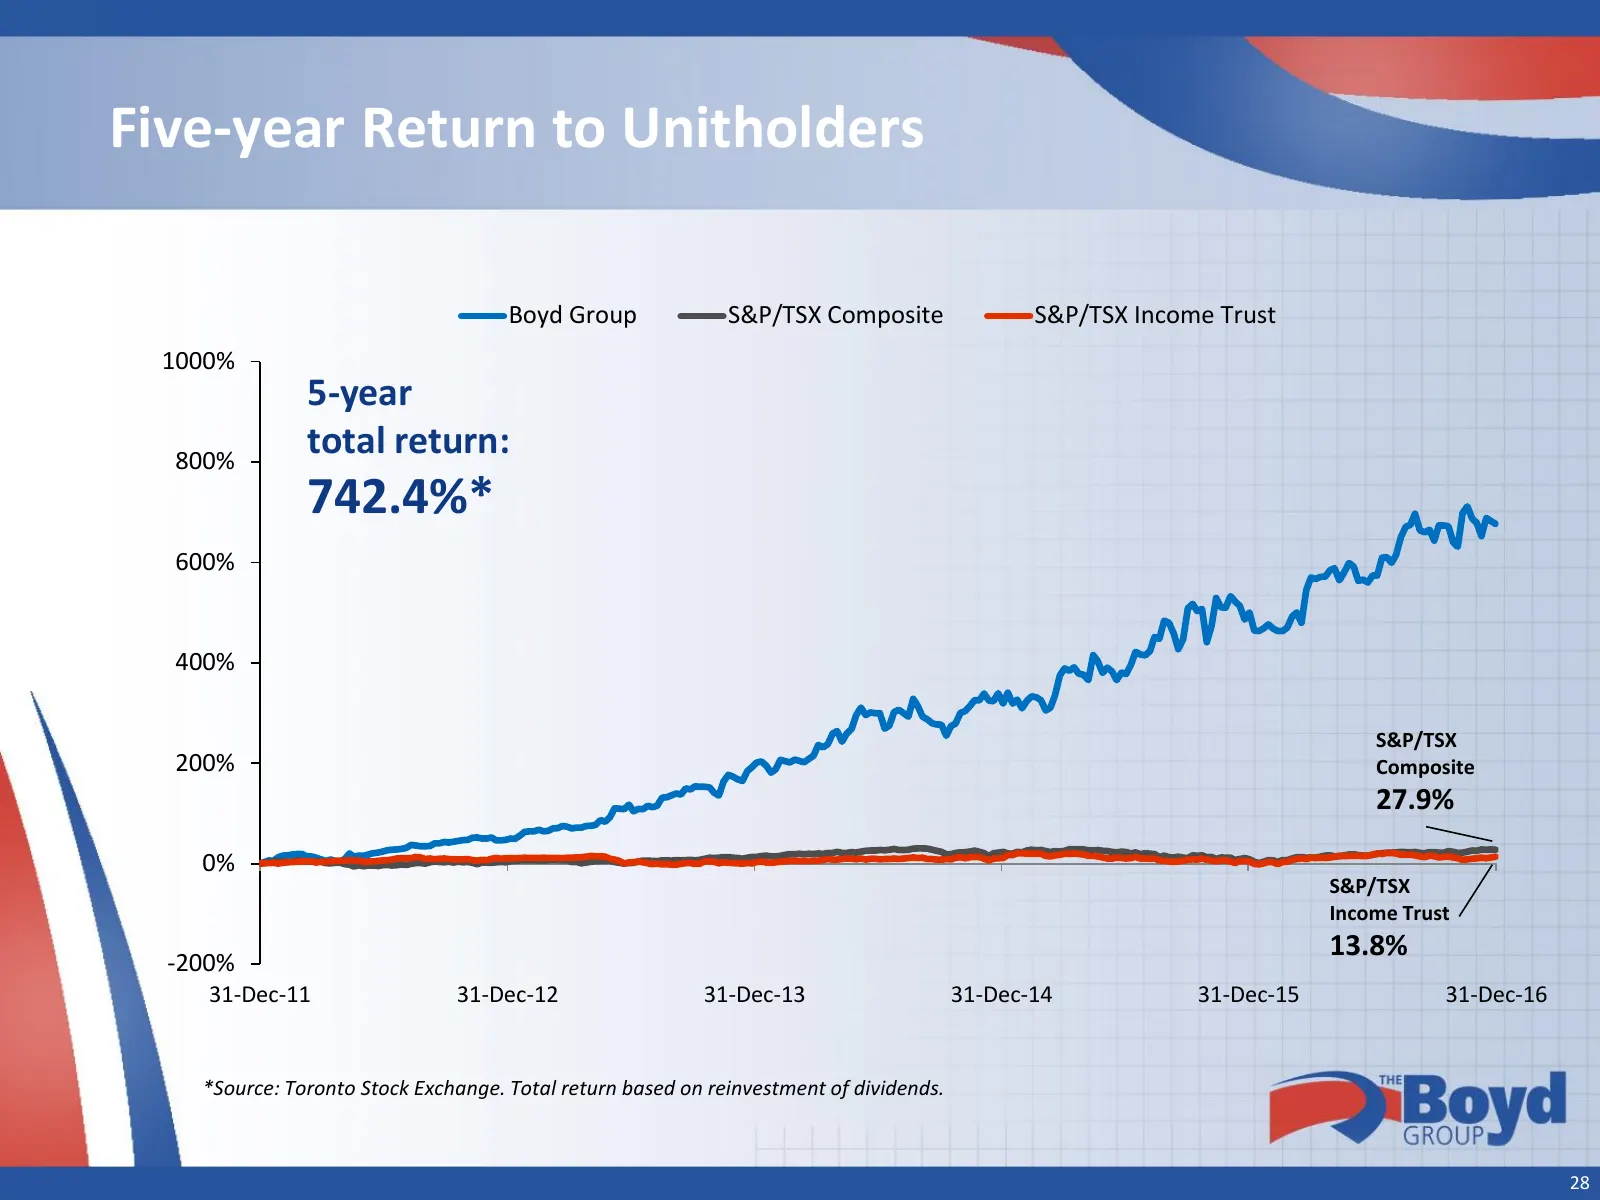
Five-year Return to Unitholders Boyd Group S&P/TSX Composite S&P/TSX Income Trust 1000% 5-year 800% total return: 742.4%* 600% 400% S&P/TSX 200% Composite 27.9% 0% S&P/TSX Income Trust 13.8% -200% 31-Dec-11 31-Dec-12 31-Dec-13 31-Dec-14 31-Dec-15 31-Dec-16 *Source: Toronto Stock Exchange. Total retu
Slide 29: Delivering long-term value to unitholders
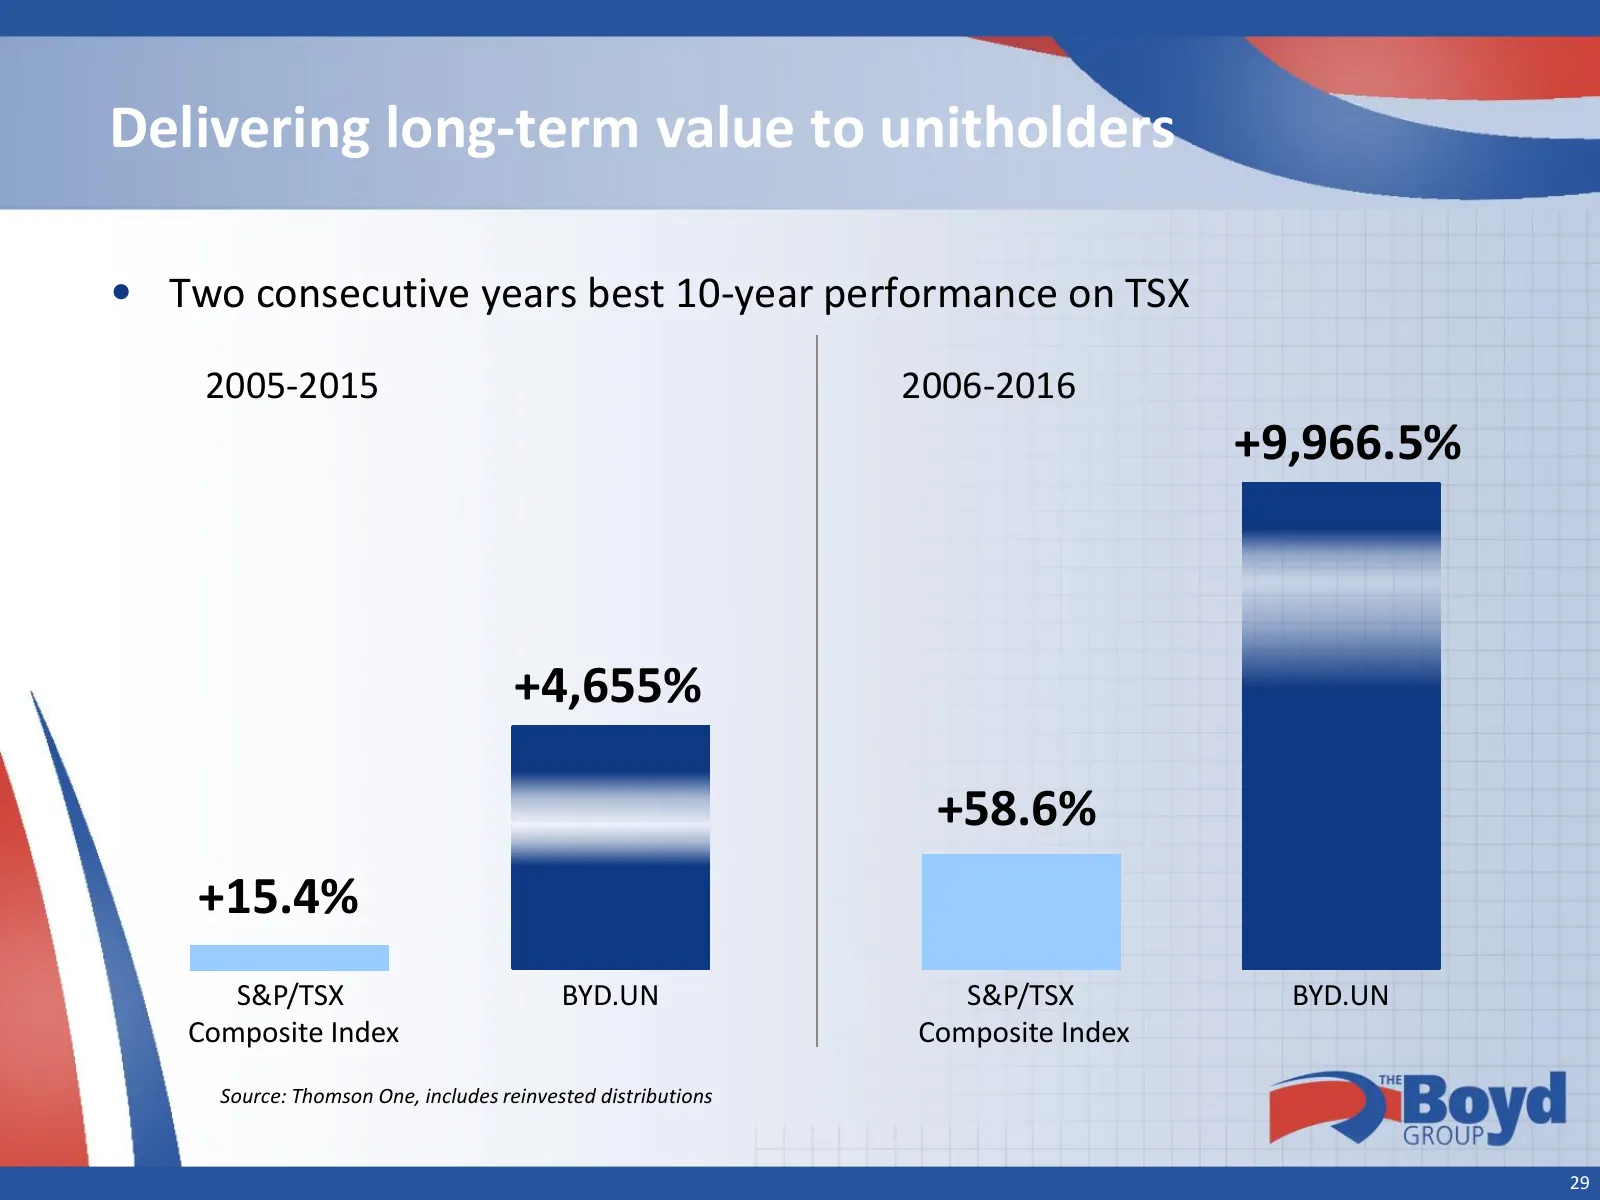
Delivering long-term value to unitholders • Two consecutive years best 10-year performance on TSX 2005-2015 2006-2016 +9,966.5% +4,655% +58.6% +15.4% S&P/TSX BYD.UN S&P/TSX BYD.UN Composite Index Composite Index Source: Thomson One, includes reinvested distributions 29
Slide 30: Experienced & Committed Management Team
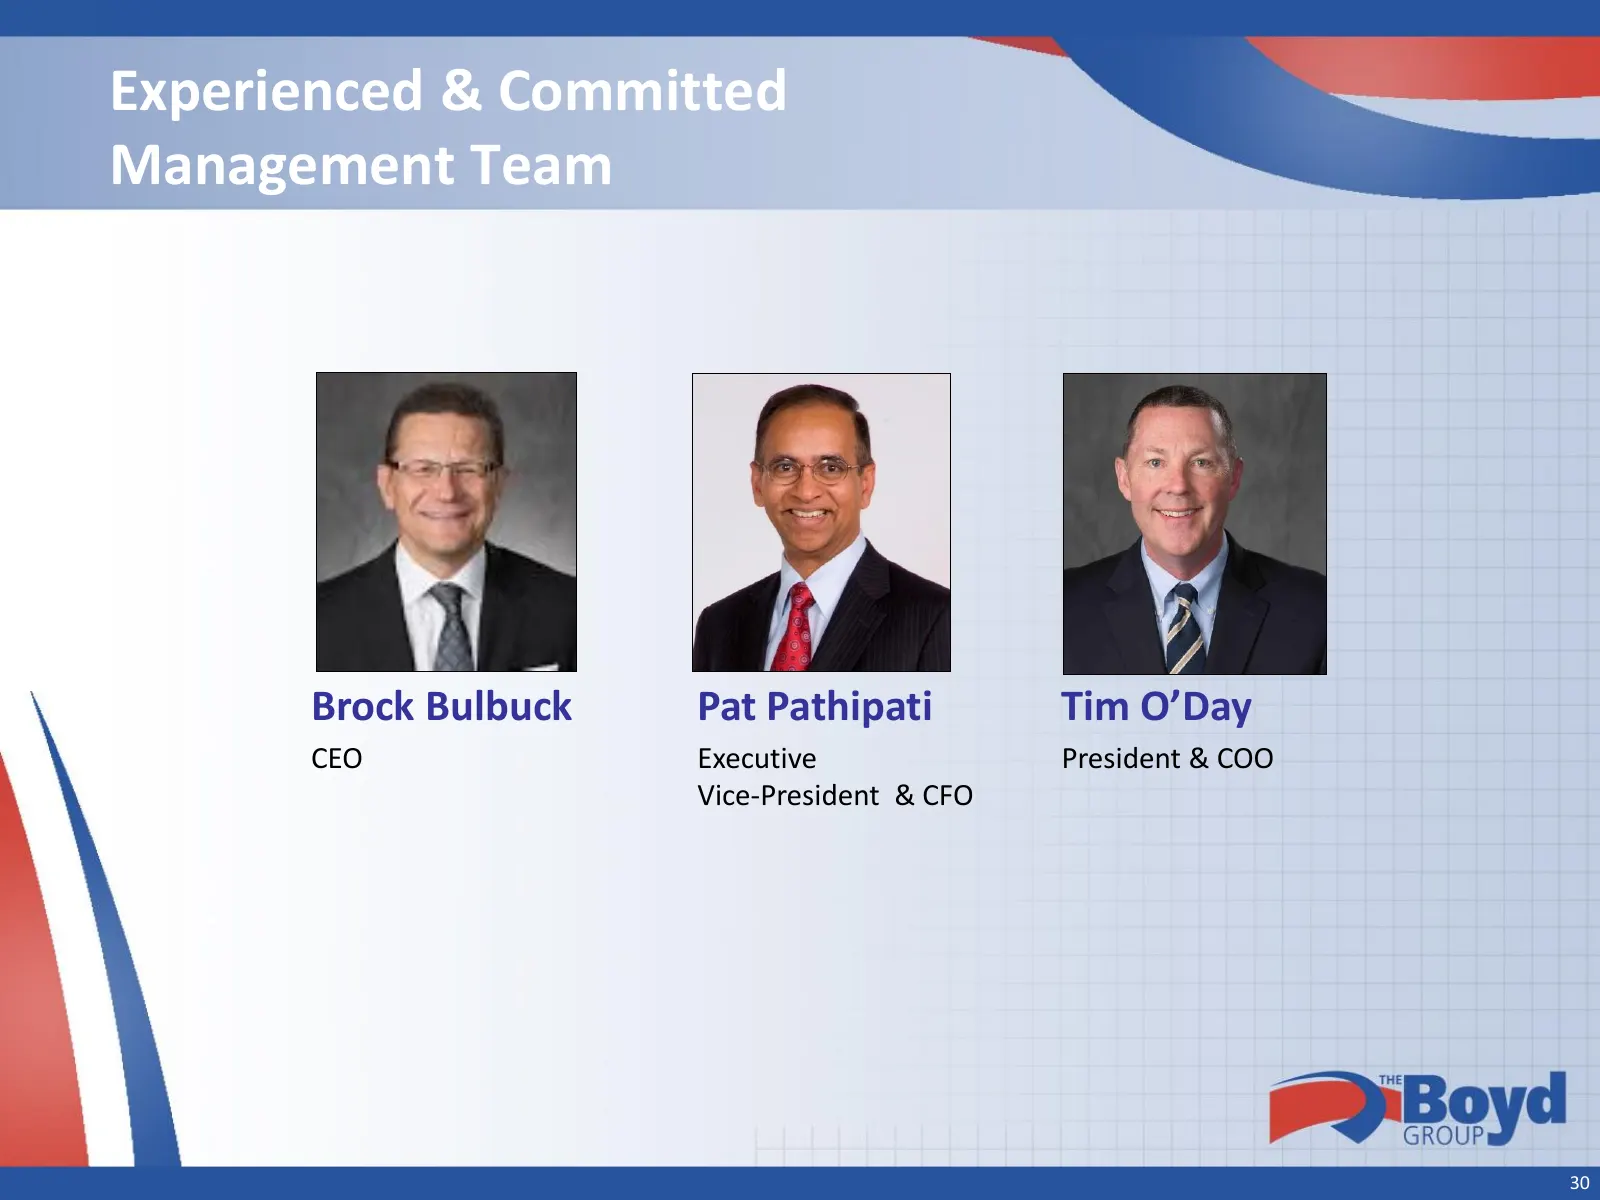
Experienced & Committed Management Team Brock Bulbuck Pat Pathipati Tim O’Day CEO Executive President & COO Vice-President & CFO 30
Slide 31: Outlook
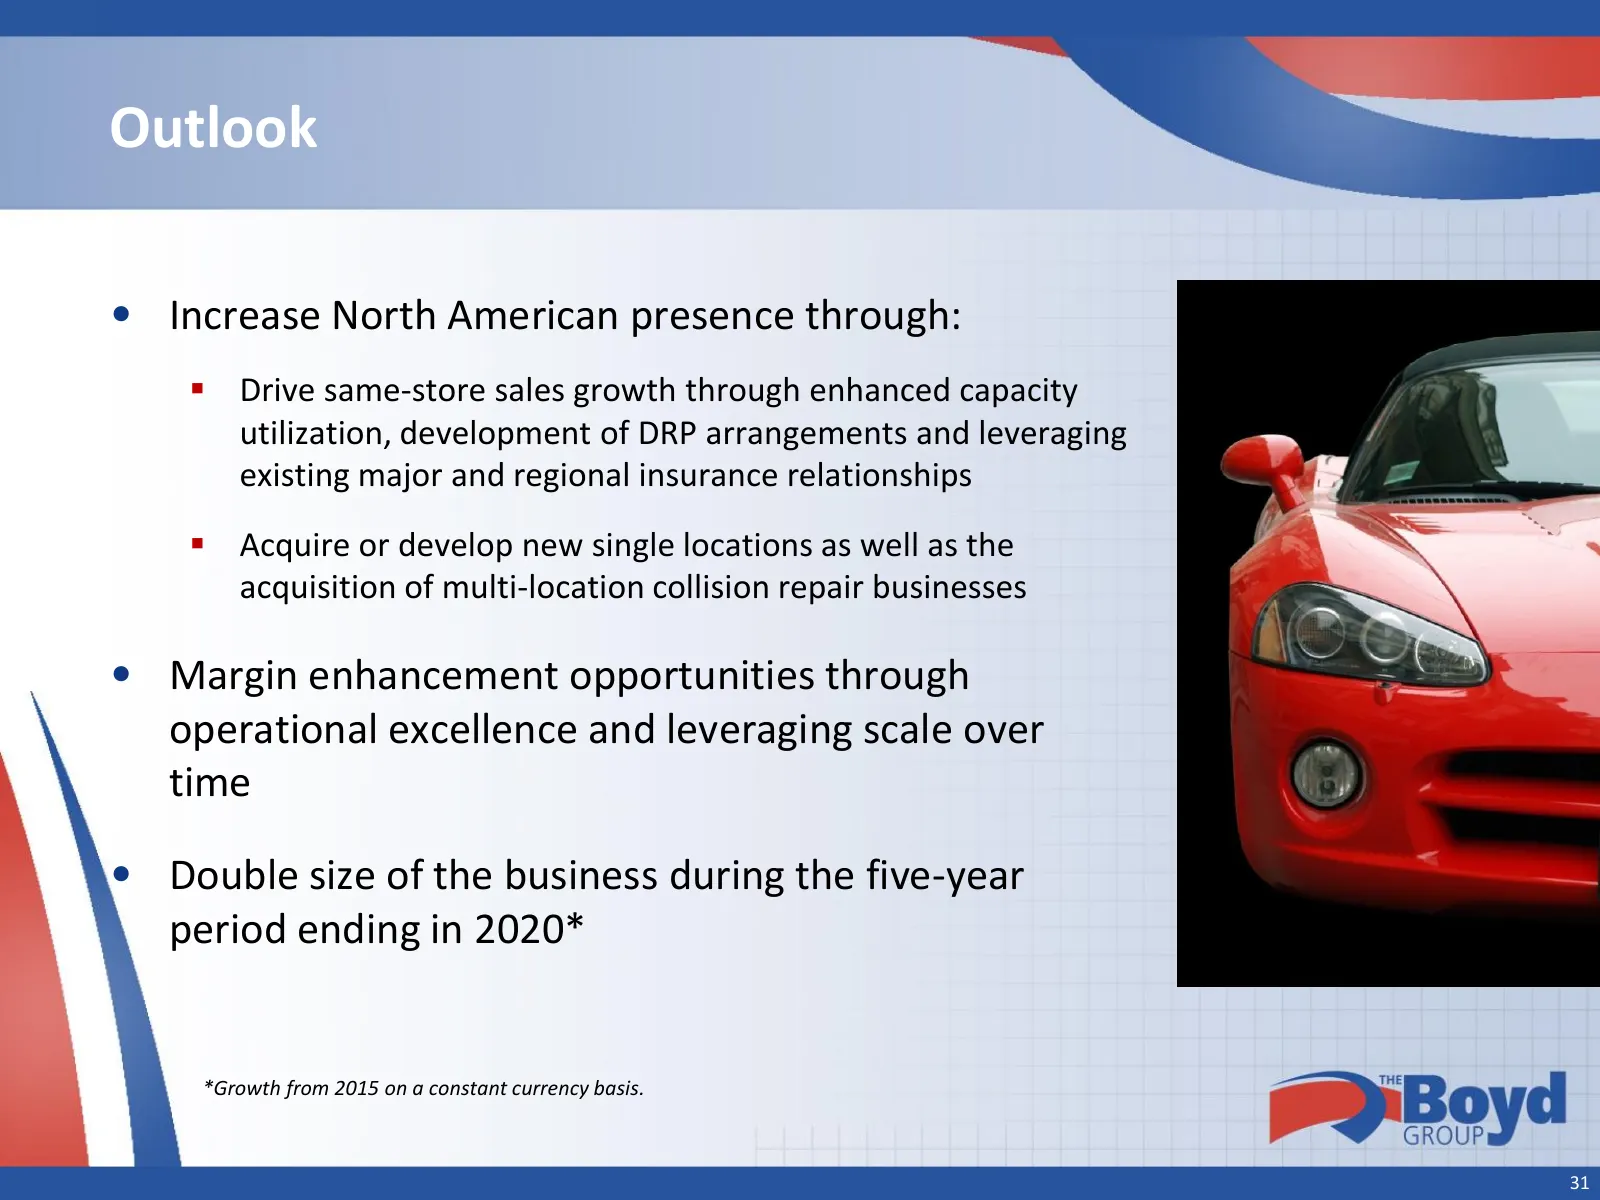
Outlook • Increase North American presence through: Drive same-store sales growth through enhanced capacity utilization, development of DRP arrangements and leveraging existing major and regional insurance relationships Acquire or develop new single locations as well as the acquisition of multi-
Slide 32: Summary
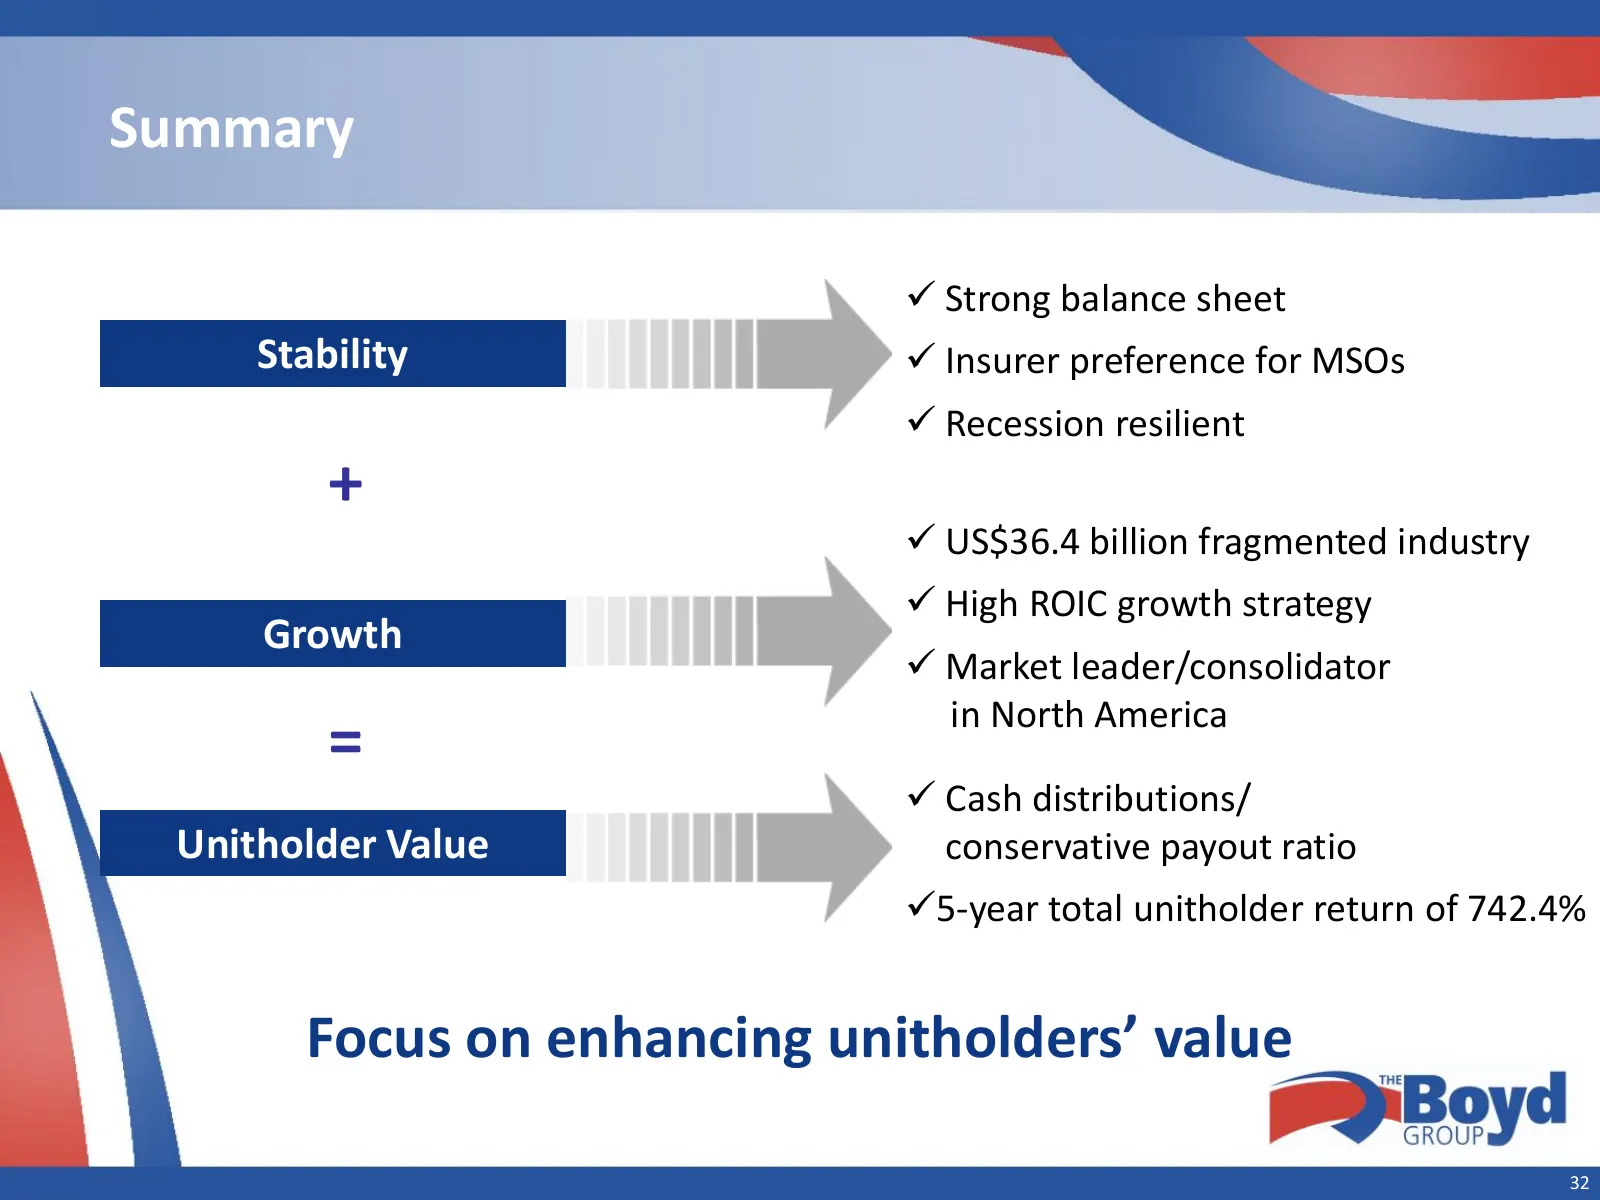
Summary Strong balance sheet Stability Insurer preference for MSOs Recession resilient + US$36.4 billion fragmented industry High ROIC growth strategy Growth Market leader/consolidator in North America = Cash distributions/ Unitholder Value conservative payout ratio 5-year total unith
Source: Internet Archive copy of boydgroup.com
More decks from Boyd Group Services Inc
 Investor Presentation (September 2026)28 slides · September 2026
 Q1 2026 Earnings Presentation24 slides · May 13, 2026
 Investor Presentation (May 2026)23 slides · May 2026
 Investor Presentation (February 2026)25 slides · February 2026
 Q1 2024 Earnings Presentation38 slides · May 2024
 Investor Presentation (January 2024)33 slides · January 2024