Sunrise Senior Living — Sunrise Assisted Living — Investor Presentation (February 2002)
13 slides from Sunrise Senior Living's investor presentation, Feb 12, 2002
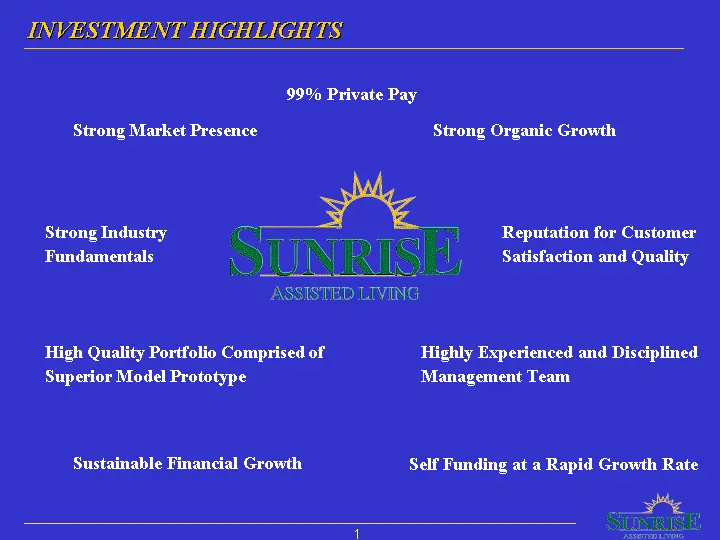
Slide 1: Investment Highlights
INVESTMENT HIGHLIGHTS, 99% Private Pay Strong Market Presence Strong Organic Growth Strong Industry Reputation for Customer Fundamentals UN RUS Satisfaction and Quality ASSISTED LIVING High Quality Portfolio Comprised of Highly Experienced and Disciplined Superior Model Prototype Management Team Sus
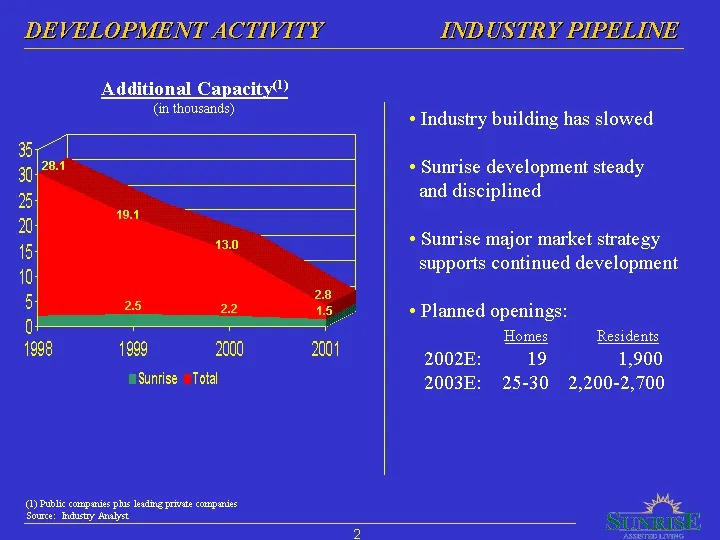
Slide 2: Development Activity
DEVELOPMENT ACTIVITY INDUSTRY PIPELINE Additional Capacity (in thousands) 1998 1999 2000 2001 eSunrise Total (Q) Public companies ps leting private companies Souce: Indasy Analyt + Industry building has slowed + Sunrise development steady and disciplined + Sunrise major market strategy supports cont
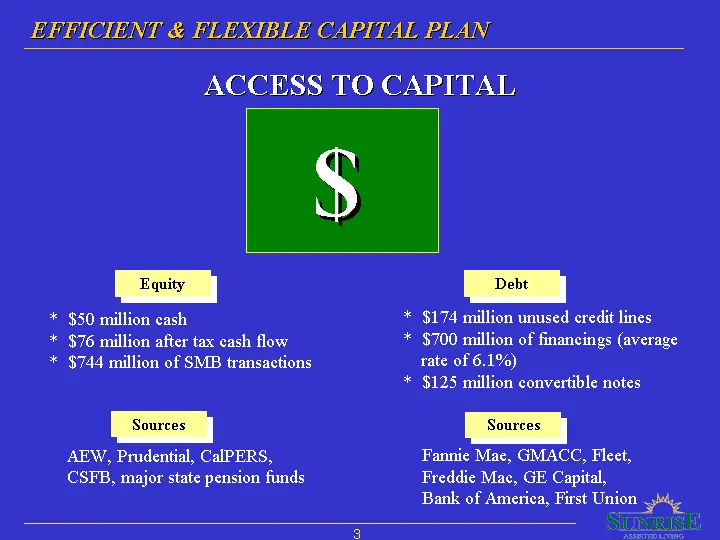
Slide 3: Efficient & Flexible Capital Plan
EEHICIENT & FLEXIBLE CAPITAL PLAN ACCESS TO CAPITAL * $50 million cash * $76 million after tax cash flow * $744 million of SMB transactions AEW, Prudential, CalPERS, CSEB, major state pension funds * $174 ion unused credit lines * $700 million of financings (average rate of 6.1%) * $125 million conv
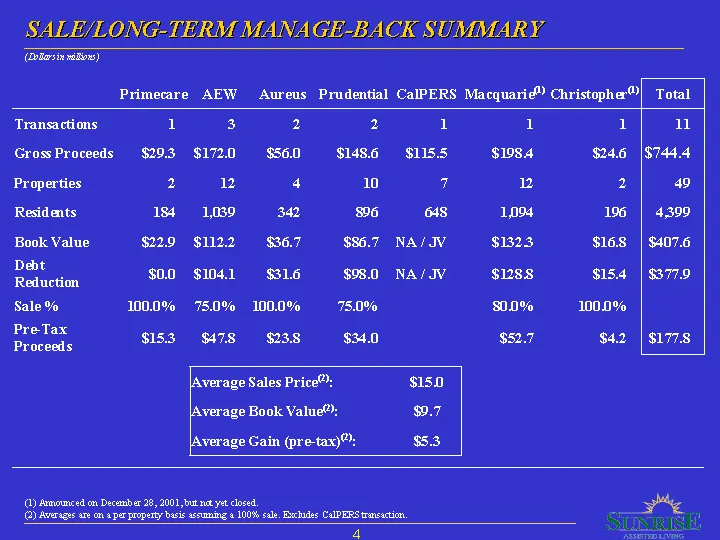
Slide 4: Sale/Long-Term Manage-Back Summary
SALE/LONG- TERM MANAGE-BACK SUMMARY (Botasin nde) Primecare AEW Aureus Prudential CalPERS Macquarid” Christophe) Total Transactions 1 3 2 2 1 1 1 au GrossProceeds $29.3 $1720 $560 $1486 $115.5 $198.4 $24.6 |$744.4 Properties 2 2 4 10 7 n 2 49 Residents 1s4 1039342 996 ws 1094 196 | 4399 Book Value $
Slide 5: Sunrise Growth Drivers
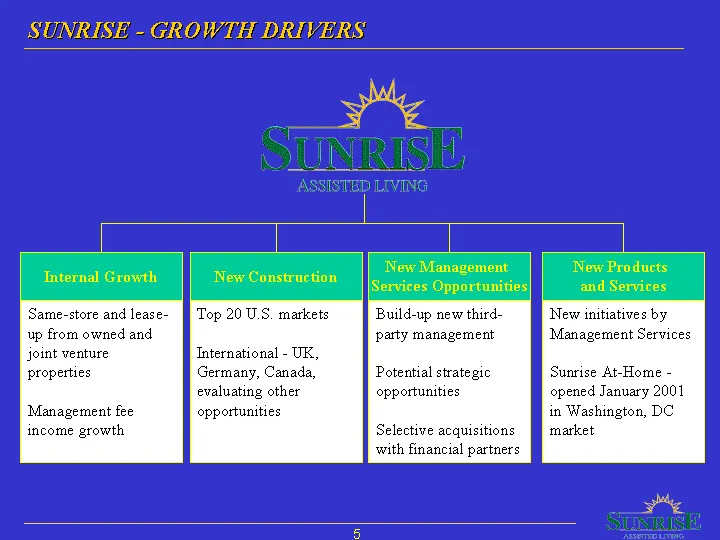
SUNEISH ~GROWIH DRIVERS TUNIS ISTED LIVING Internal Growth New Construction ‘New Management Services Opportunities| New Products and Services Same-store and lease- up from owned and joint venture properties ‘Management fee income growth Top 20 U.S. markets International - UK, Germany, Canada, evalua
Slide 6: More Seniors Are Choosing Sunrise
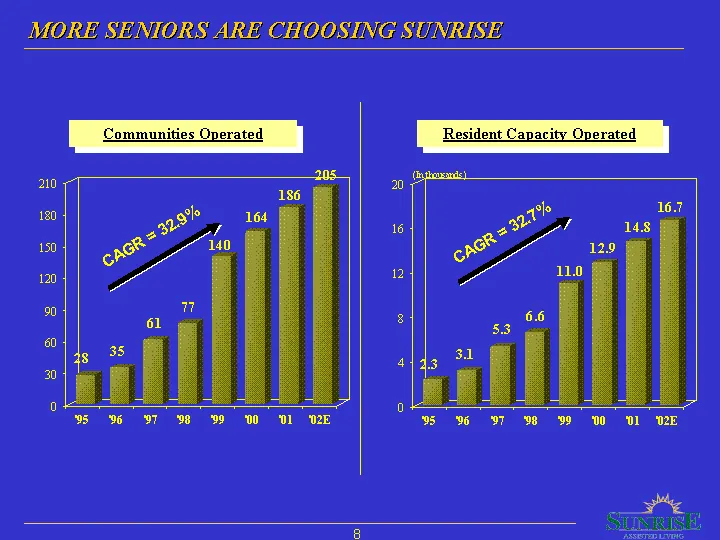
MORE SENIORS ARE CHOOSING SUNKISE
Slide 7: Solid Financial Performance
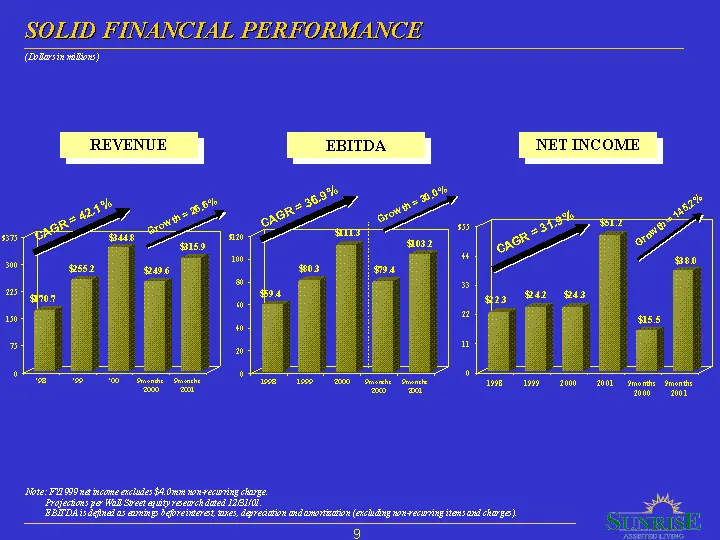
SOLID FINANCIAL PERFORMANCE (Botasin nde) Note: F900 xatincome xls $0nm won vecaring cage ‘rojecons por Wel Svea ep iy roemch dated 1220, AIDA: dgiuatas aos dgbreeret ine, davradation xd anorteaion (cud wn recing ions and charg) 9
Slide 8: Management Services Growth
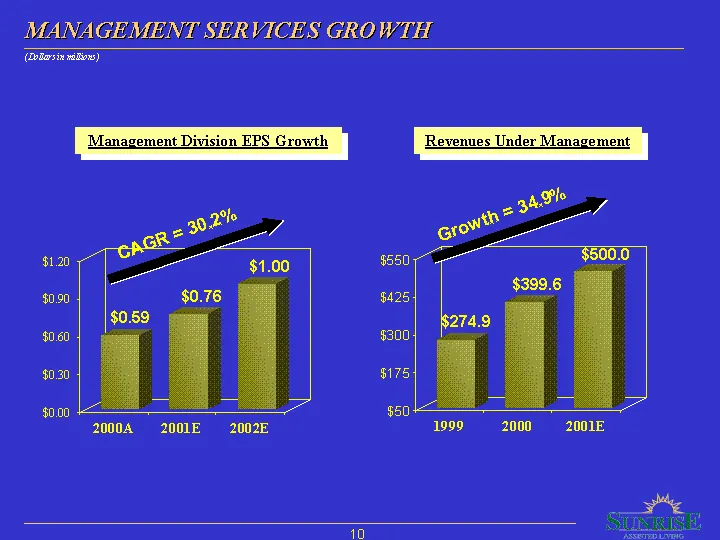
MANAGEMENT SERVICES GROWTH (Botasin nde) 20008 2001E —-2002E i999 = 2000 © 2001E
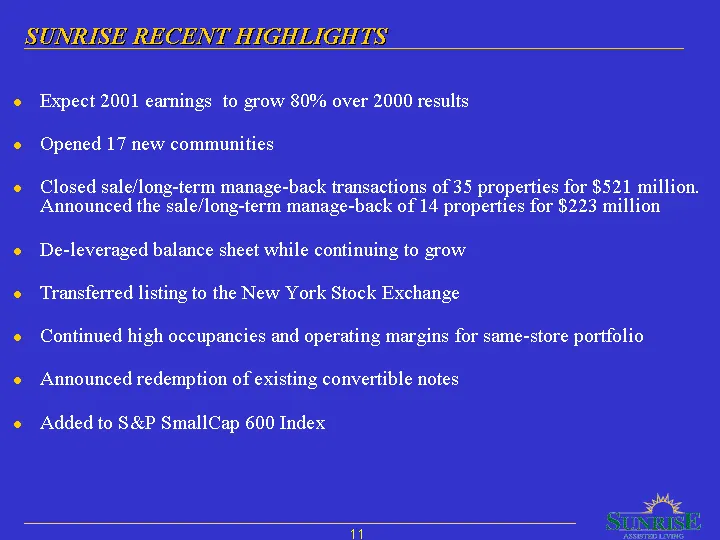
Slide 9: Sunrise Reaching Highlights
SUNEISH RECHNG HIGHLIGHTS Expect 2001 earnings to grow 80% over 2000 results Opened 17 new communities Closed sale/long-term manage-back transactions of 35 properties for $521 million. Announced the sale/long-term manage-back of 14 properties for $223 million De-leveraged balance sheet while continu
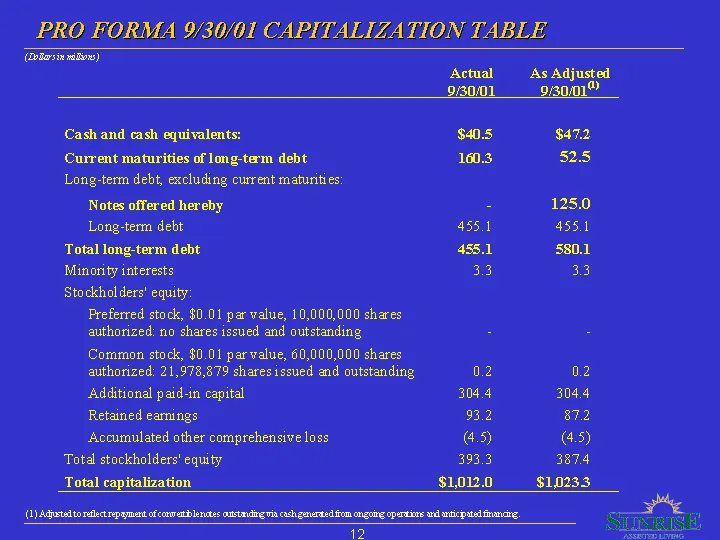
Slide 10: Pro Forma 9/30/01 Capitalization Table
PRO FORMA 930/01 CAPITALIZATION TABLE (Botasin nde) Actual As Adjusted 9/30/01 9001” Cash and cash equivalents: $40.5 $47.2 Current maturities of long-term debt 100.3 52.5 Long-term debt, excluding current maturities Notes offered hereby > 125.0 Long-term debt 455.1 455.1 Total long-term debt 455.1
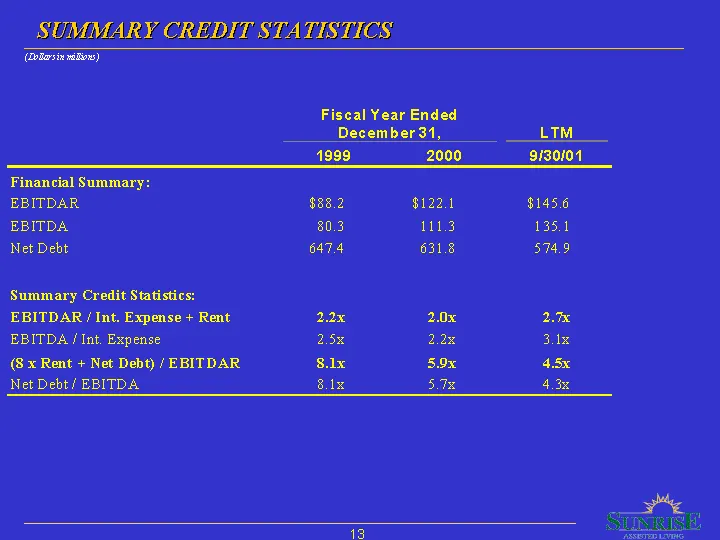
Slide 11: Summary Credit Statistics
SUMMARY CREDIT STATISTICS (Botasin nde) Fiscal Year Ended December 31, LT™M. 1999 2000 9130/01 Financial Summary: EBITDAR $88.2 $122.1 $1456 EBITDA 203 1113 135.1 Net Debt 647.4 631.8 5749 Summary Credit Statistics: EBITDAR / Int. Expense + Rent 22x 20x 29x EBITDA / Int, Expense 25x 2.2% 3.1x (8x Re
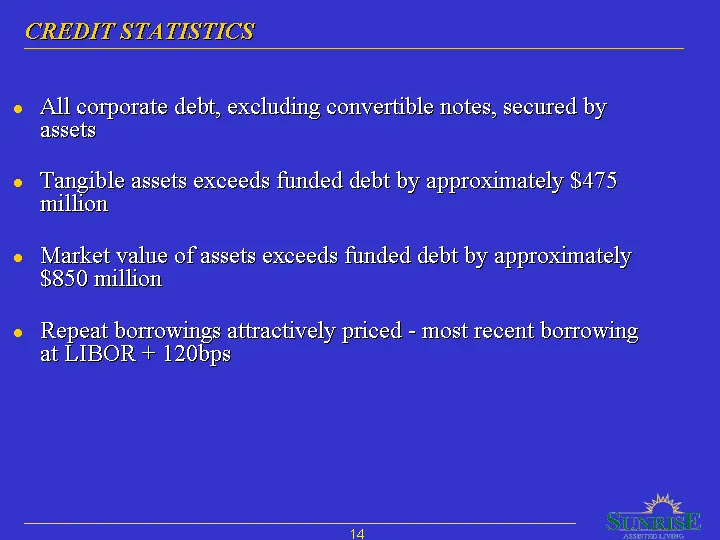
Slide 12: Credit Statistics
CREDIT STATISTICS All corporate debt, excluding convertible notes, secured by assets Tangible assets exceeds finded debt by approximately $475 million Market value of assets exceeds funded debt by approximately $850 million Repeat borrowings attractively priced - most recent borrowing at LIBOR + 120
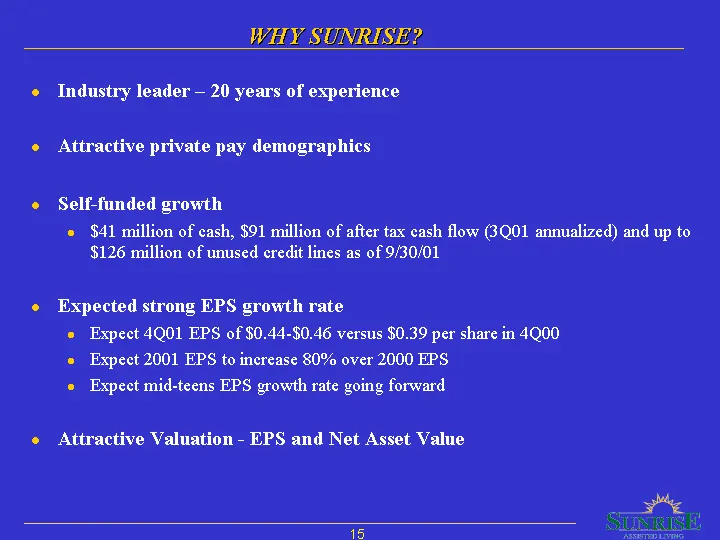
Slide 13: Why Sunrise?
WHY SUNRISE? Industry leader — 20 years of experience Attractive private pay demographics Self-funded growth e $41 million of cash, $91 million of after tax cash flow (3Q01 annualized) and up to $126 million of unused credit lines as of 9/30/01 Expected strong EPS growth rate » Expect 4Q01 EPS of $0
Source: SEC EDGAR · 8-K filed Feb 12, 2002
More decks from Sunrise Senior Living
 Merger or Acquisition (August 2012)12 slides · Aug 22, 2012
 Investor Presentation (June 2011)27 slides · Jun 14, 2011
 Investor Presentation (May 2008)38 slides · May 21, 2008
 Investor Presentation (May 2008)38 slides · May 14, 2008
 Lehman Brothers Ninth Annual Healthcare Conference 200642 slides · Mar 8, 2006
 Investor Presentation (May 2005)39 slides · May 18, 2005