Kewaunee Scientific Corporation · NASDAQ:KEQU
Kewaunee Scientific — Shareholder Meeting (August 2023)
24 slides from Kewaunee Scientific's shareholder meeting presentation, Aug 23, 2023
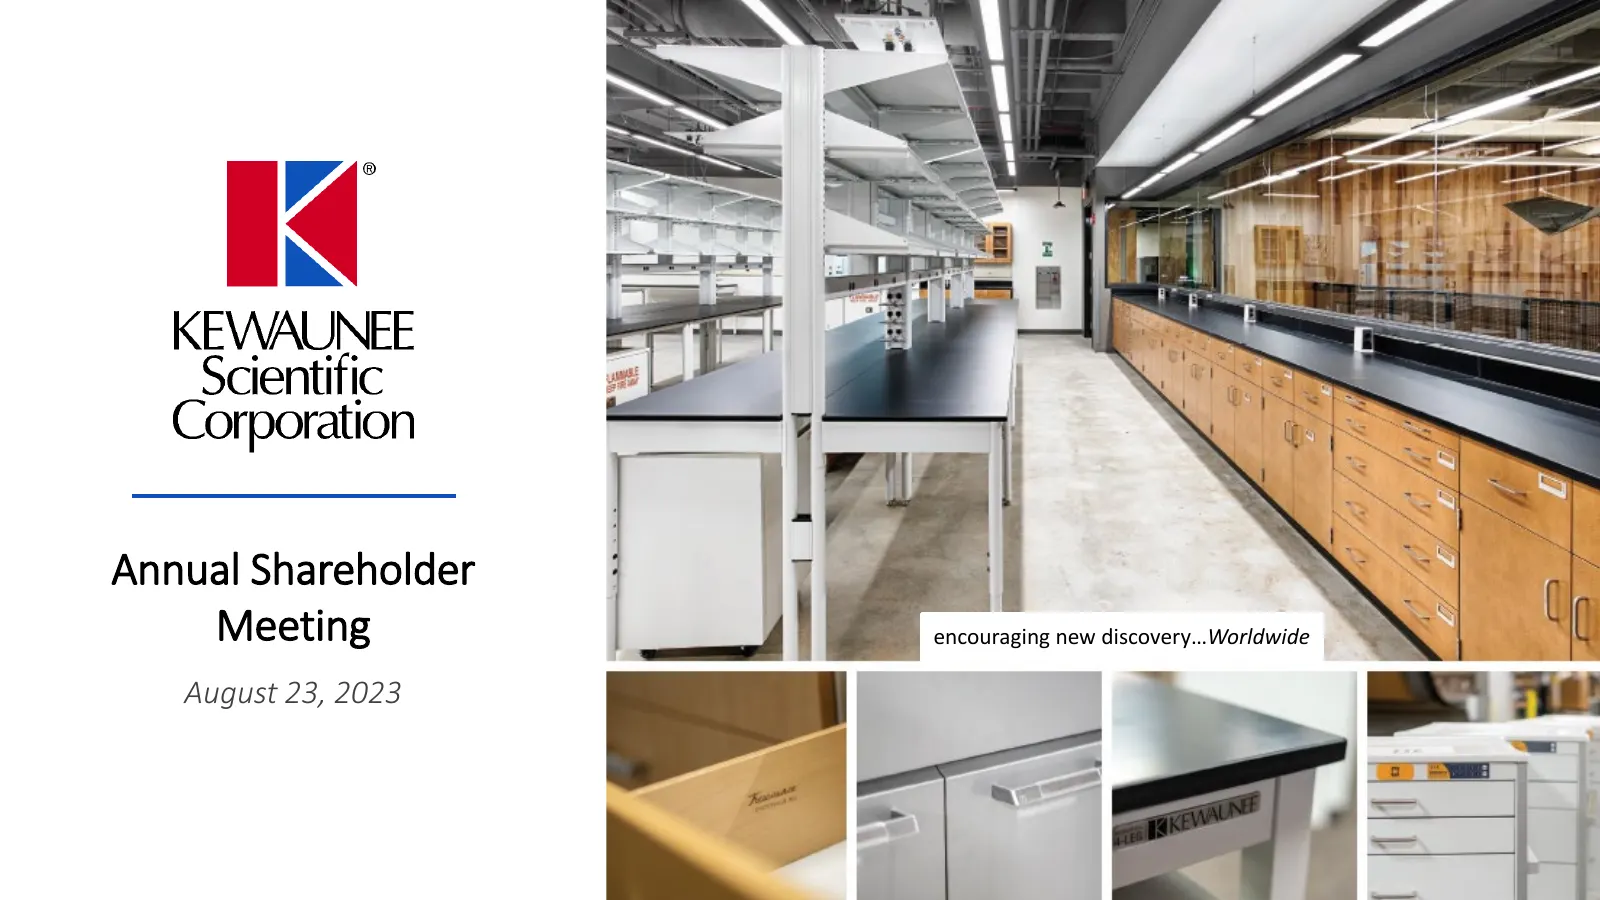
Slide 1: Annual Shareholder Meeting
Annual Shareholder Meeting encouraging new discovery…Worldwide August 23, 2023
Slide 2: Safe Harbor Statement
Safe Harbor Statement Certain statements in this document constitute “forward-looking” statements within the meaning of the Private Securities Litigation Reform Act of 1995 (the “Reform Act”). All statements other than statements of historical fact included in this document, including statements reg
Slide 3: Agenda
Agenda Annual Shareholder Meeting • Kewaunee Scientific Overview • Fiscal Year 2023 Review • Strategic Direction and Outlook • Q&A 3 | NASDAQ: KEQU

Slide 4: Kewaunee Scientific Corporation Overview
Kewaunee Scientific Corporation Overview 4 | NASDAQ: KEQU
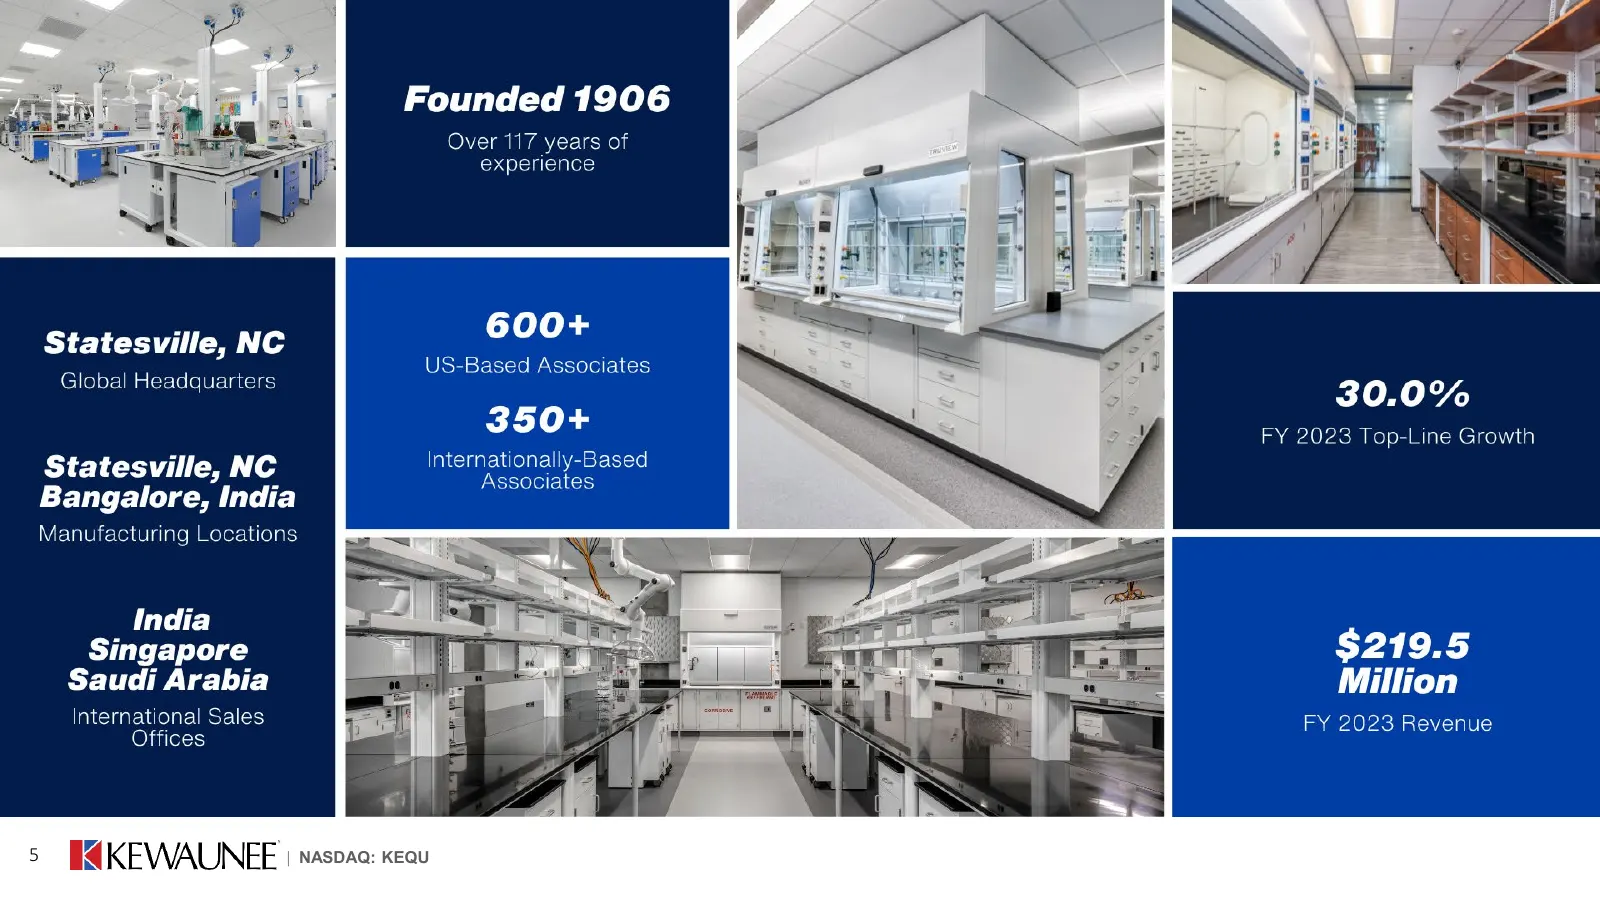
Slide 5: | NASDAQ: KEQU
Founded 1906 Over 117 years of experience Statesville, NC Global Headquarters Statesville, NC Bangalore, India Manufacturing Locations India Singapore Saudi Arabia International Sales Offices 5S BKEWAUNEE | naspaa: keau
Slide 6: Kewaunee Scientific Overview
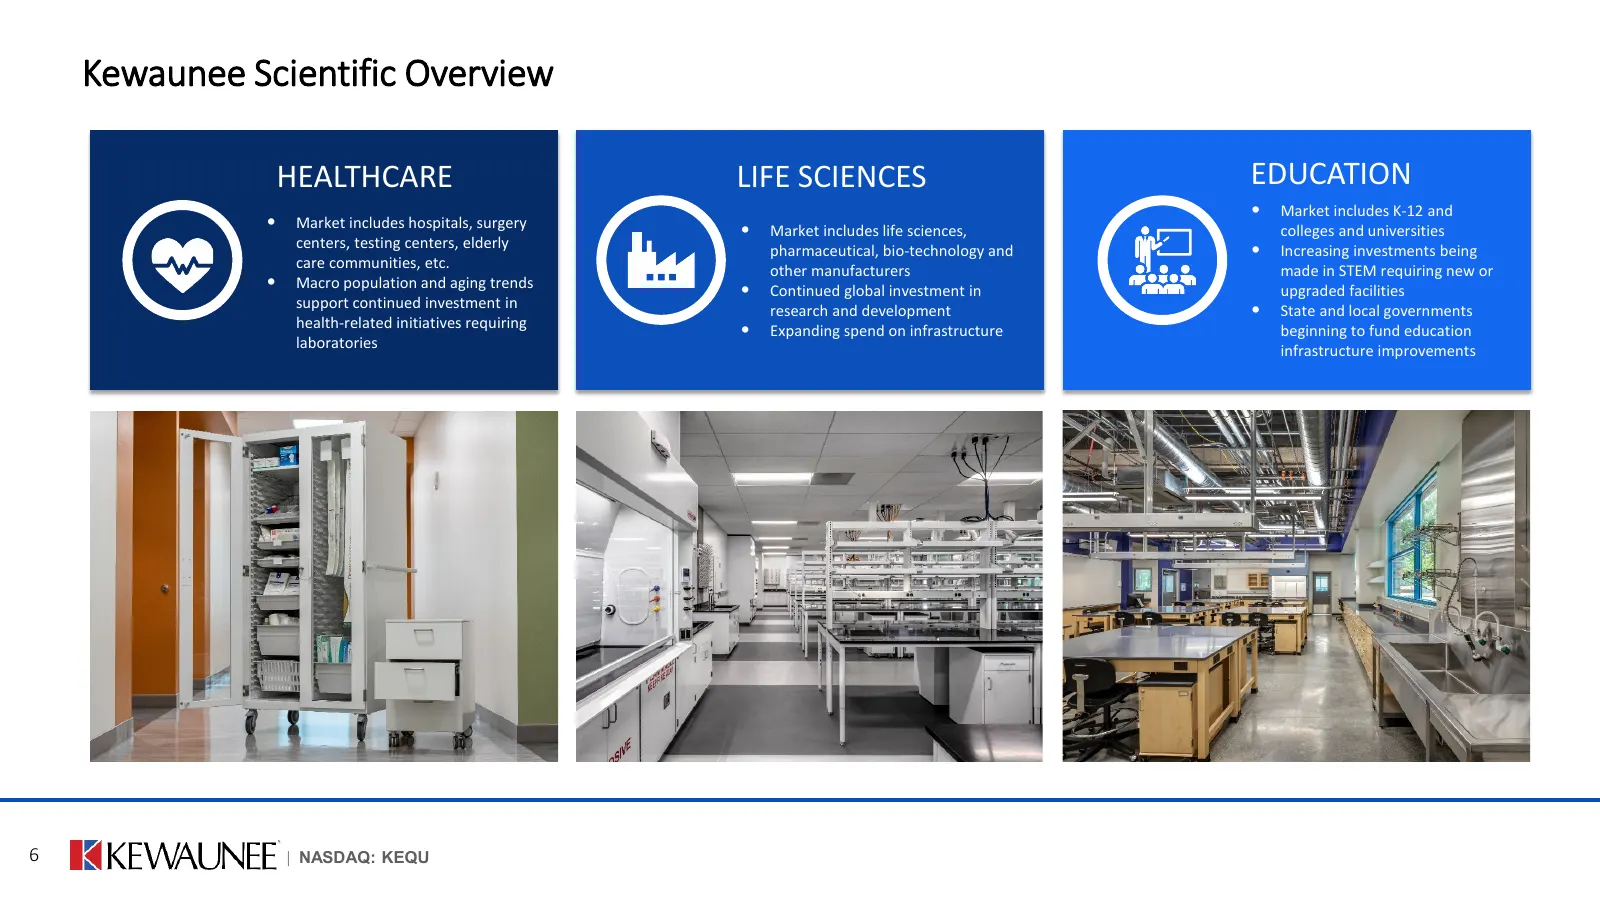
Kewaunee Scientific Overview HEALTHCARE LIFE SCIENCES EDUCATION • Market includes K-12 and • Market includes hospitals, surgery • Market includes life sciences, colleges and universities centers, testing centers, elderly pharmaceutical, bio-technology and • Increasing investments being care communit
Slide 7: Kewaunee's History
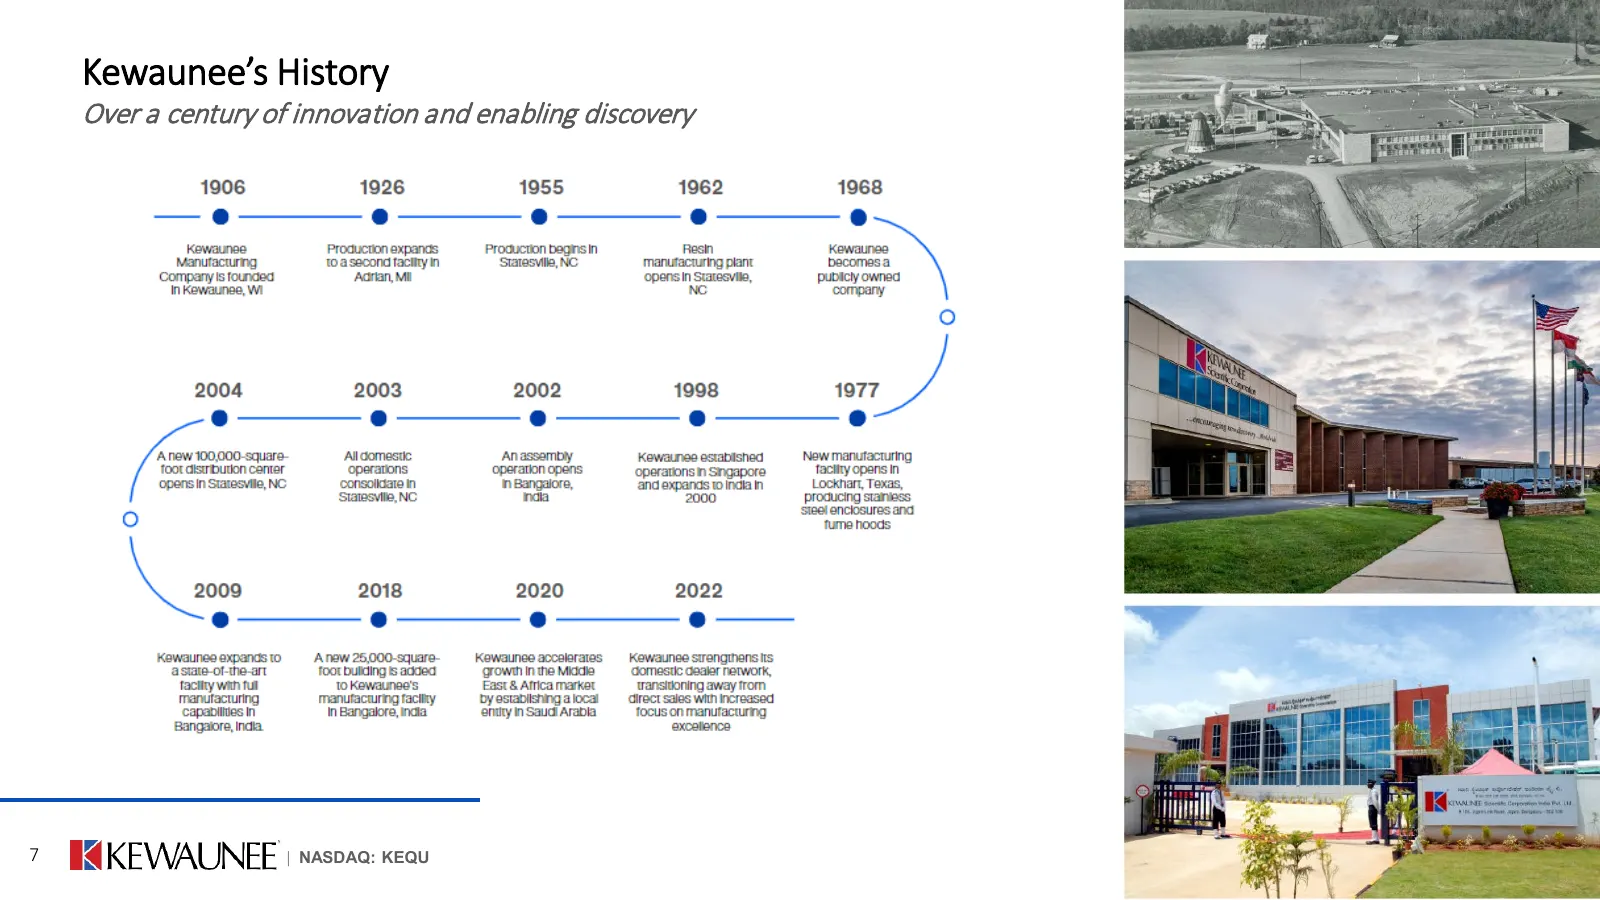
Kewaunee’s History Over a century of innovation and enabling discovery 7 | NASDAQ: KEQU
Slide 8: Kewaunee Scientific Overview
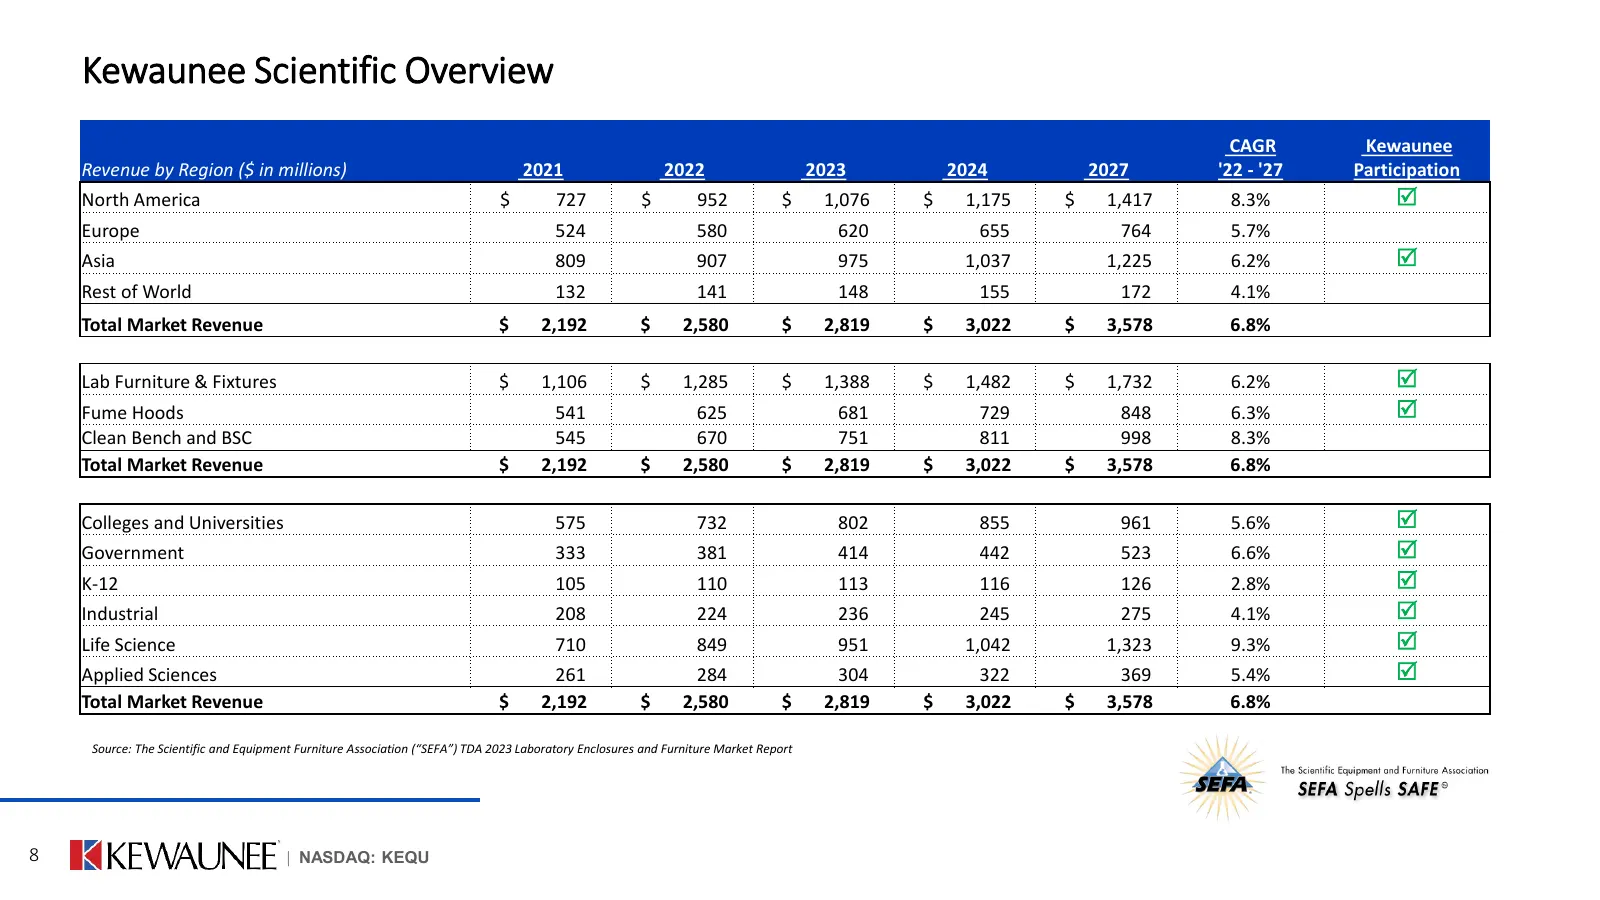
Kewaunee Scientific Overview CAGR Kewaunee Revenue by Region ($ in millions) 2021 2022 2023 2024 2027 '22 - '27 Participation North America $ 727 $ 952 $ 1,076 $ 1,175 $ 1,417 8.3% Europe 524 580 620 655 764 5.7% Asia 809 907 975 1,037 1,225 6.2% Rest of World 132 141 148 155 172 4.1% Total Mark
Slide 9: FY 2023 Review
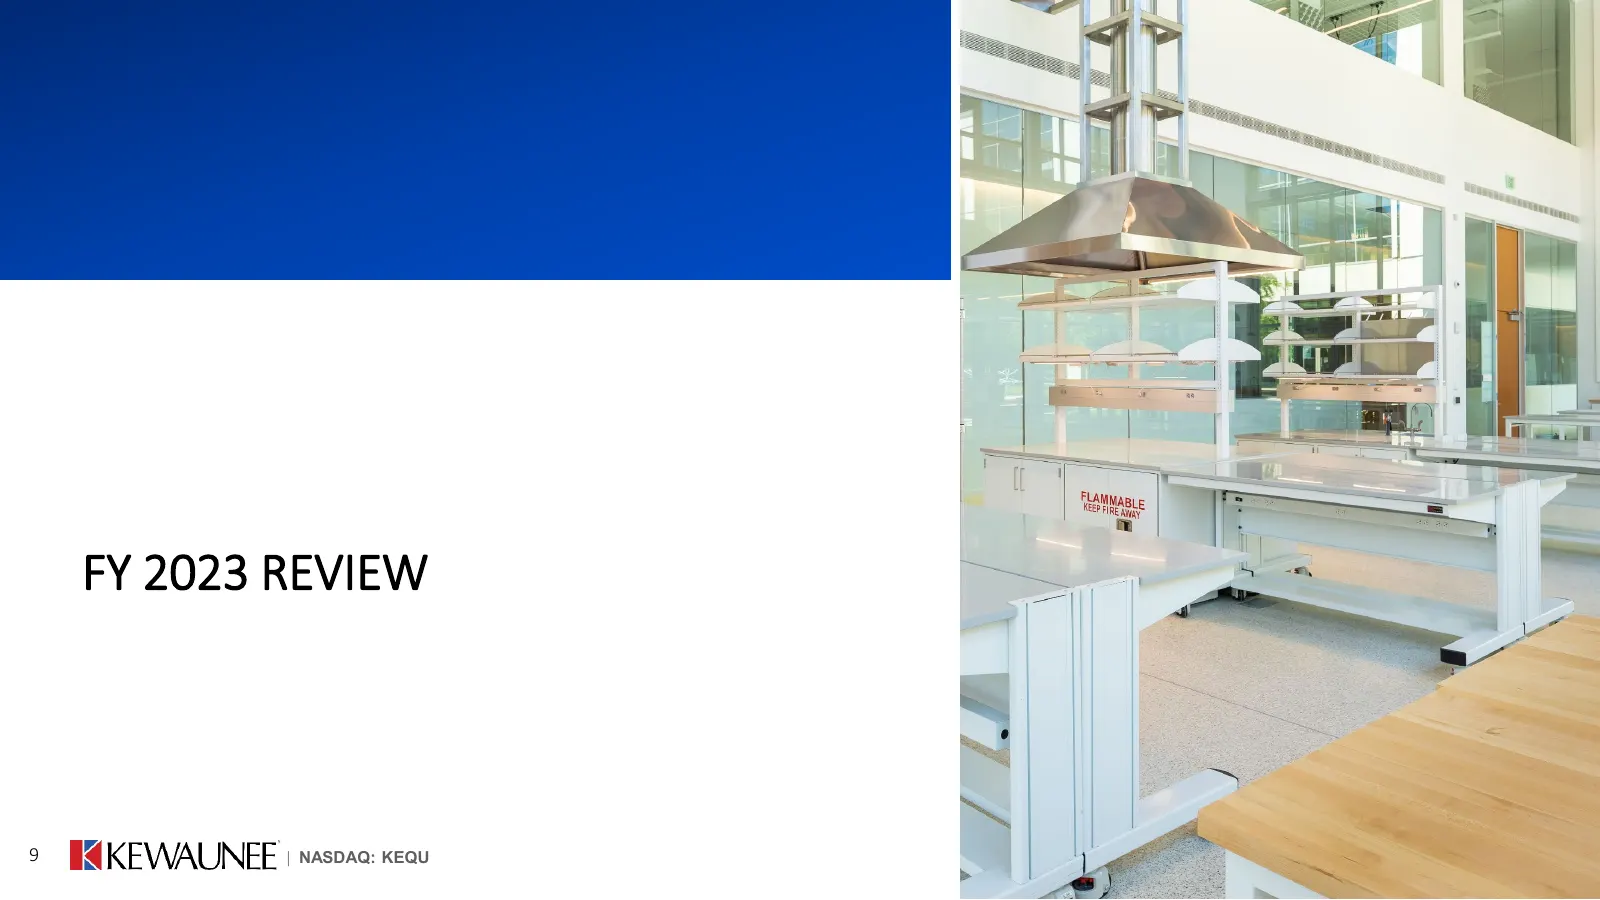
FY 2023 REVIEW 9 | NASDAQ: KEQU
Slide 10: FY 2023 Review – Consolidated Results
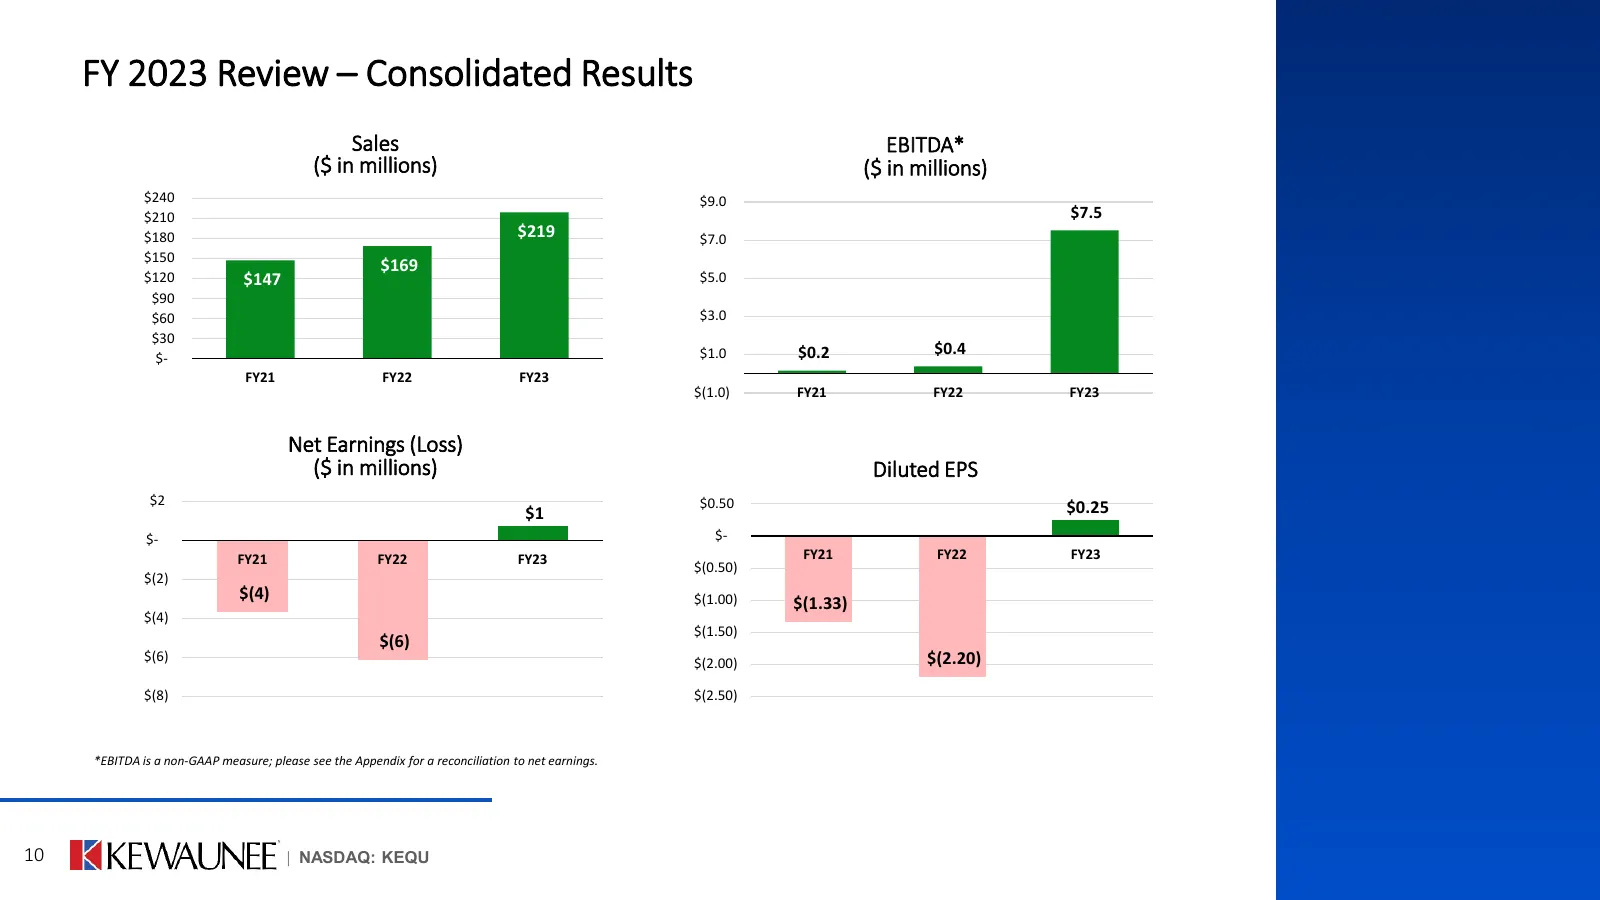
FY 2023 Review – Consolidated Results Sales EBITDA* ($ in millions) ($ in millions) $240 $9.0 $210 $7.5 $180 $219 $7.0 $150 $169 $120 $147 $5.0 $90 $60 $3.0 $30 $1.0 $0.2 $0.4 $- FY21 FY22 FY23 $(1.0) FY21 FY22 FY23 Net Earnings (Loss) ($ in millions) Diluted EPS $2 $0.50 $1 $0.25 $- $- FY21 FY22 FY
Slide 11: FY 2023 Review – Domestic Segment
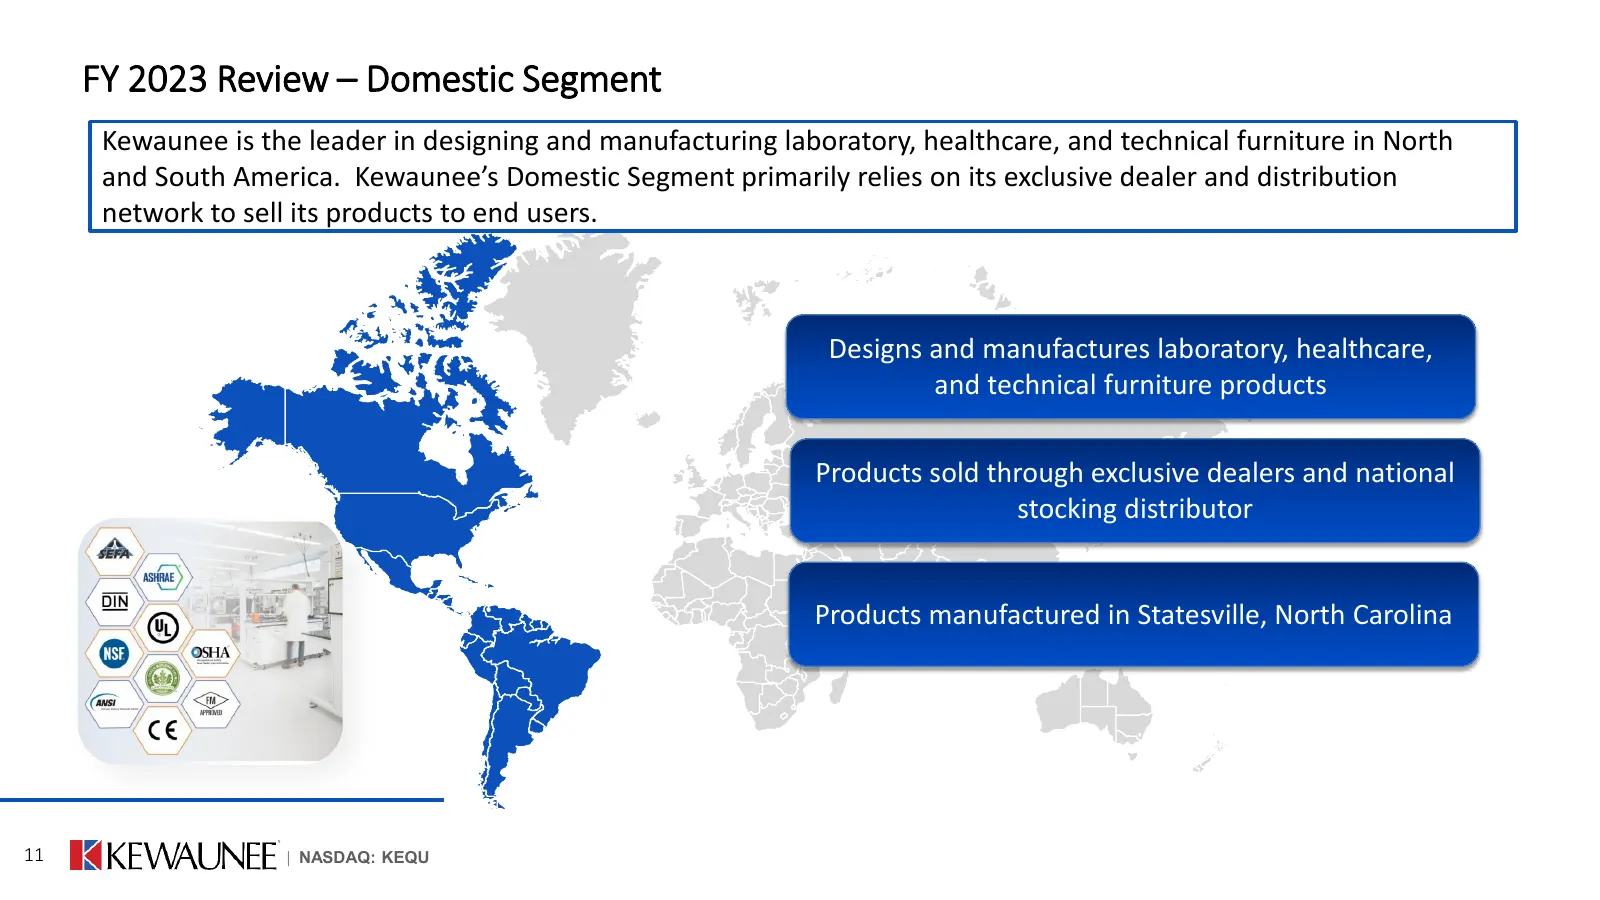
FY 2023 Review – Domestic Segment Kewaunee is the leader in designing and manufacturing laboratory, healthcare, and technical furniture in North and South America. Kewaunee’s Domestic Segment primarily relies on its exclusive dealer and distribution network to sell its products to end users. Designs
Slide 12: FY 2023 Review – Domestic Segment
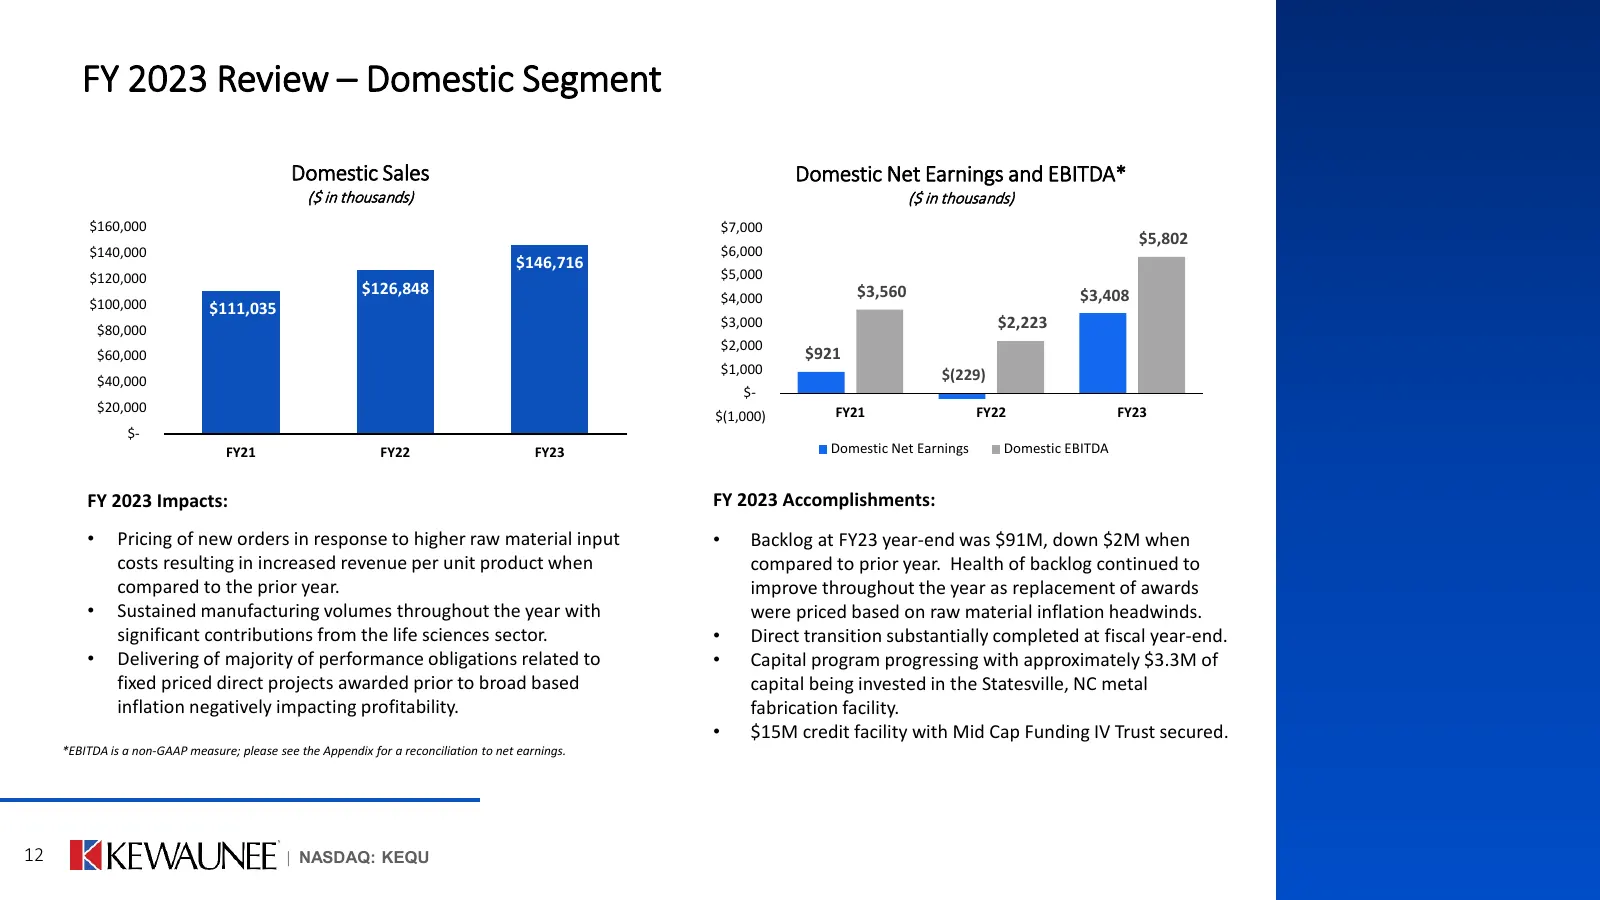
FY 2023 Review – Domestic Segment Domestic Sales Domestic Net Earnings and EBITDA* ($ in thousands) ($ in thousands) $160,000 $7,000 $5,802 $140,000 $6,000 $146,716 $120,000 $5,000 $126,848 $3,560 $3,408 $100,000 $4,000 $111,035 $80,000 $3,000 $2,223 $2,000 $60,000 $921 $1,000 $(229) $40,000 $- $20,
Slide 13: FY 2023 Review – Domestic Segment
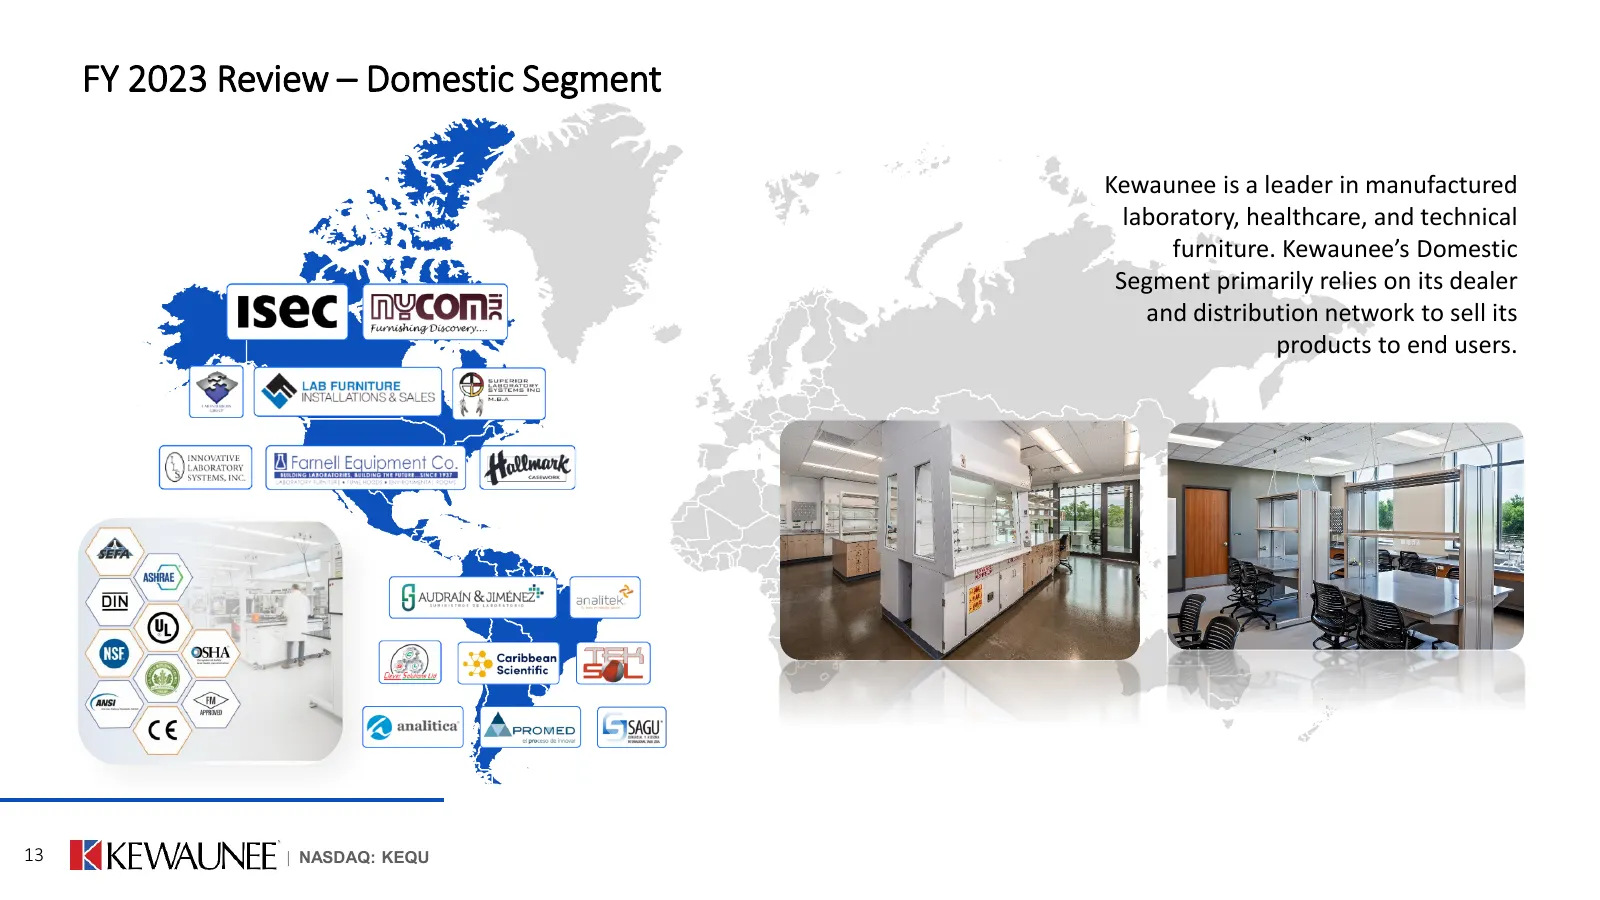
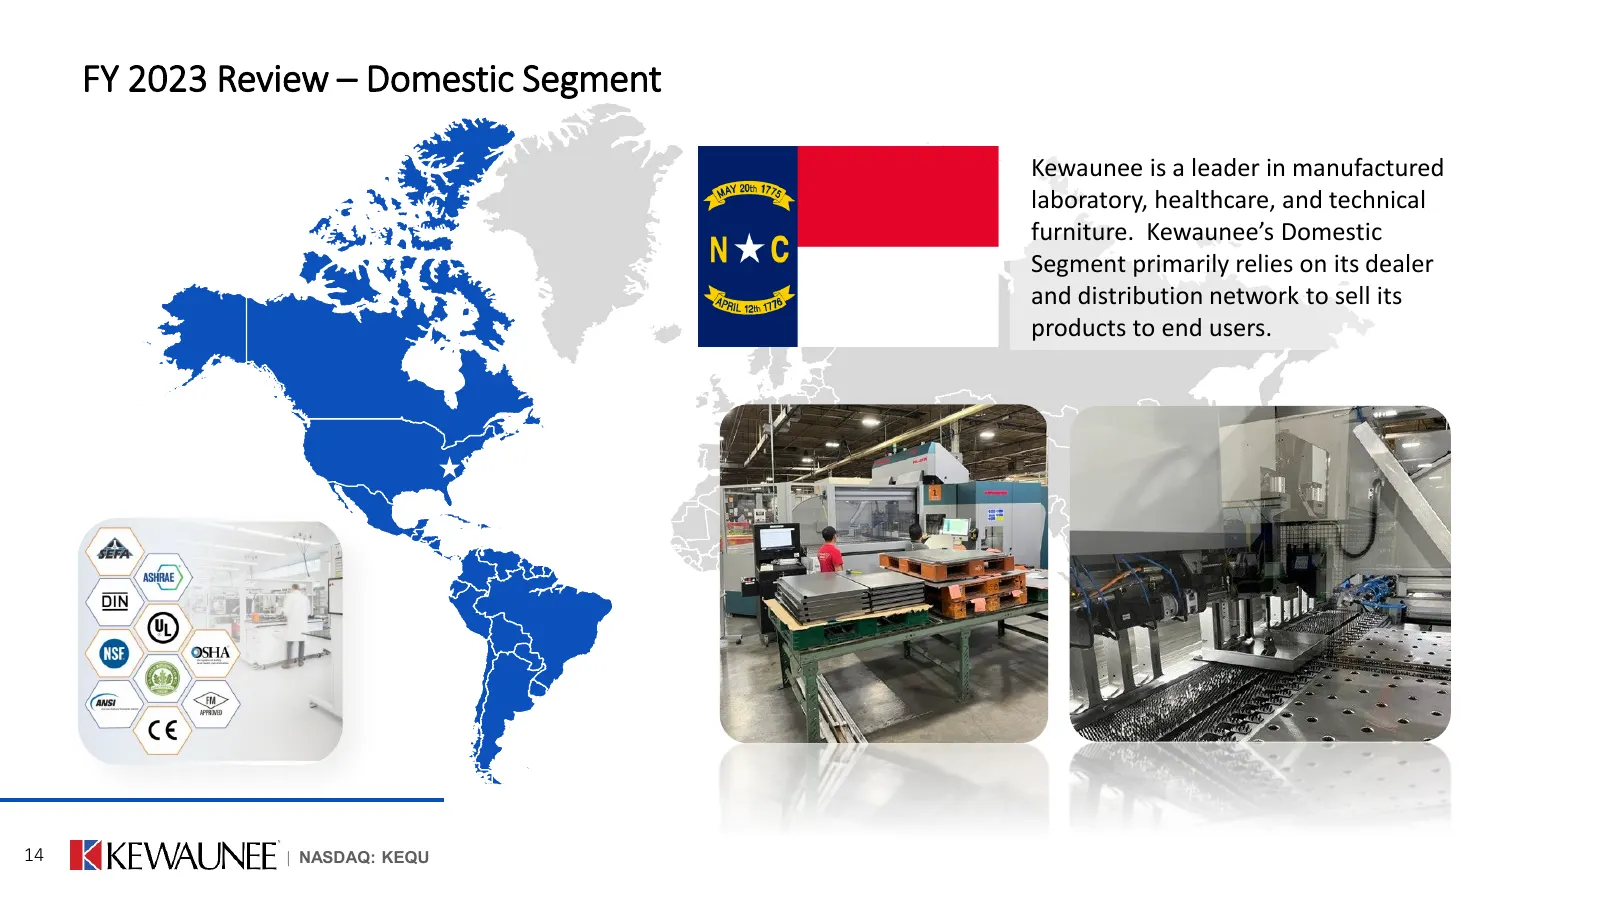
FY 2023 Review – Domestic Segment Kewaunee is a leader in manufactured laboratory, healthcare, and technical furniture. Kewaunee’s Domestic Segment primarily relies on its dealer and distribution network to sell its products to end users. 13 | NASDAQ: KEQU
Slide 14: FY 2023 Review – Domestic Segment
FY 2023 Review – Domestic Segment Kewaunee is a leader in manufactured laboratory, healthcare, and technical furniture. Kewaunee’s Domestic Segment primarily relies on its dealer and distribution network to sell its products to end users. 14 | NASDAQ: KEQU
Slide 15: FY 2023 Review – International Segment
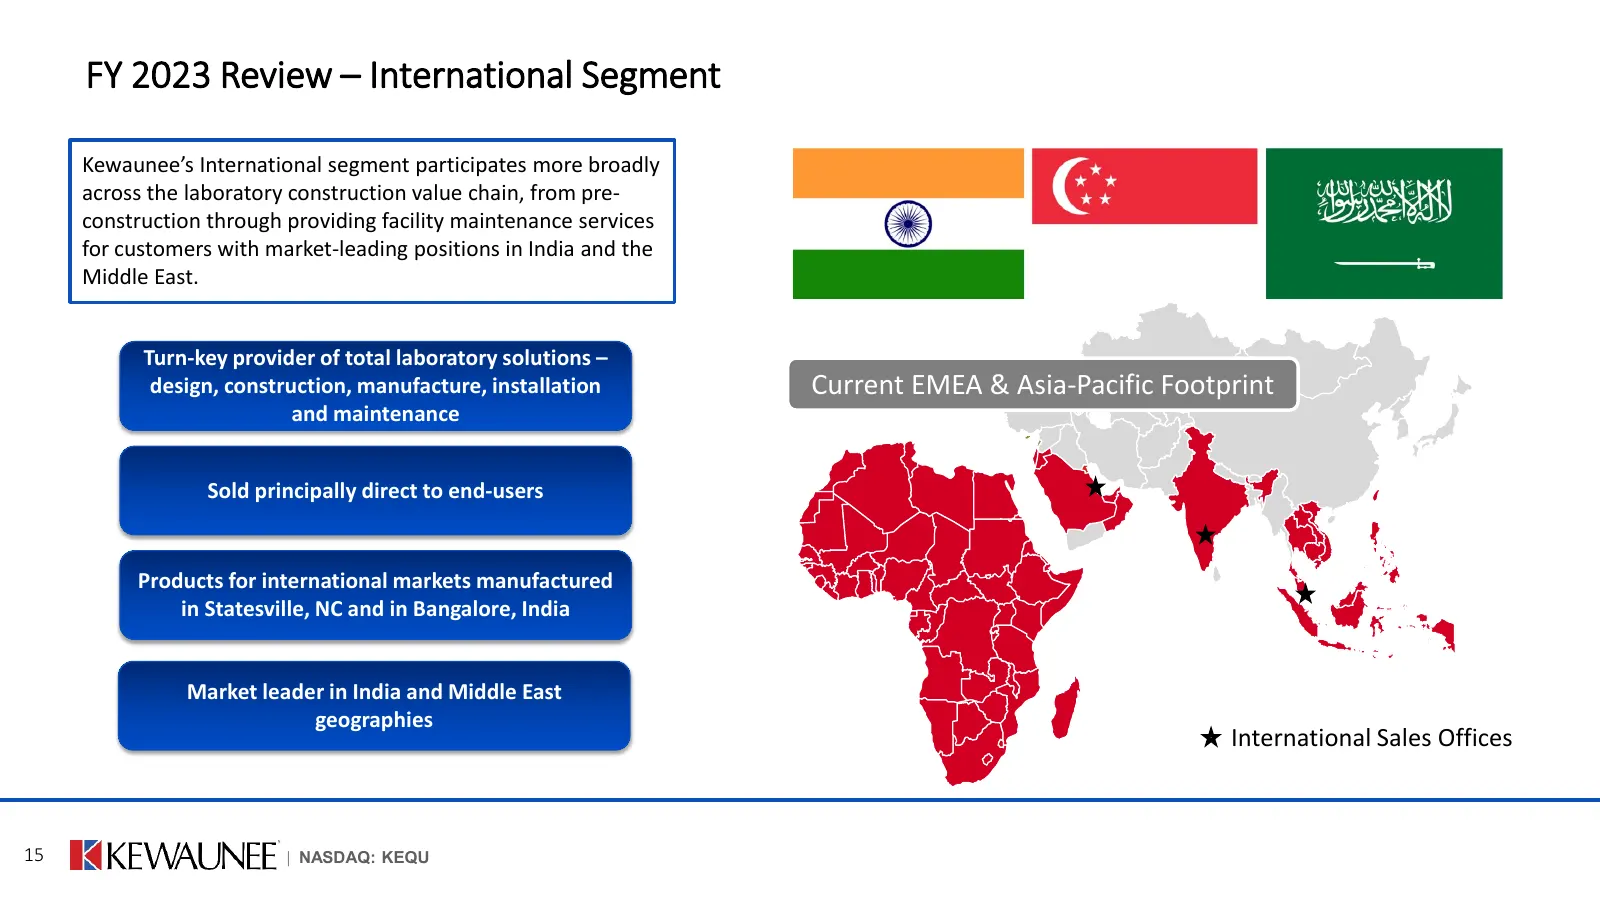
FY 2023 Review – International Segment Kewaunee’s International segment participates more broadly across the laboratory construction value chain, from pre- construction through providing facility maintenance services for customers with market-leading positions in India and the Middle East. Turn-key
Slide 16: FY 2023 Review – International Segment
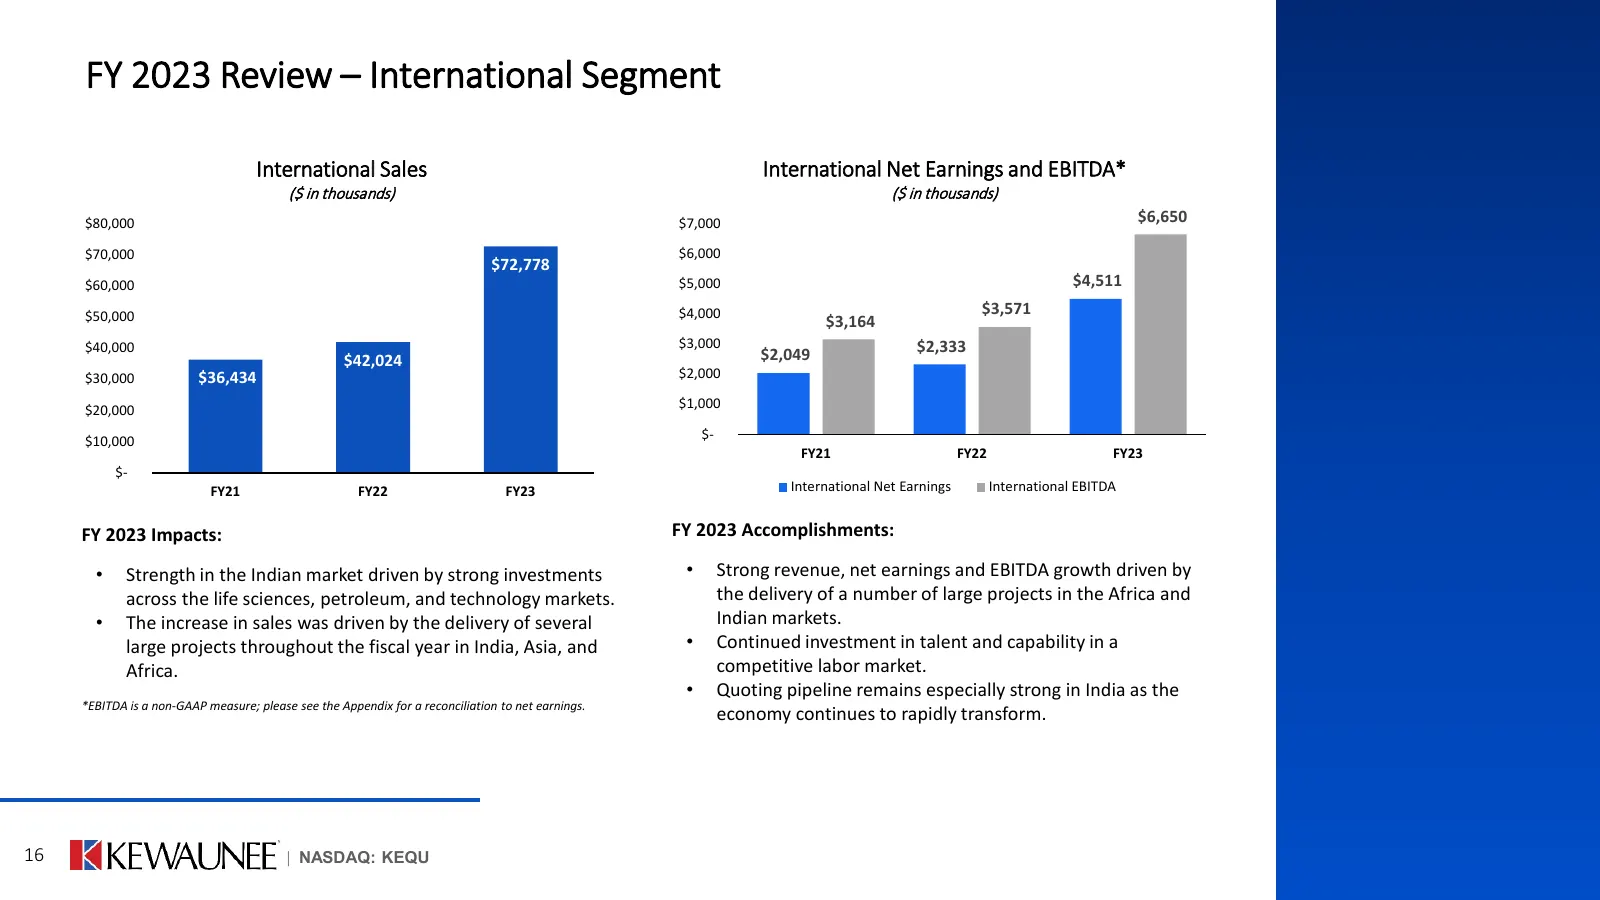
FY 2023 Review – International Segment International Sales International Net Earnings and EBITDA* ($ in thousands) ($ in thousands) $80,000 $7,000 $6,650 $70,000 $6,000 $72,778 $60,000 $5,000 $4,511 $50,000 $4,000 $3,571 $3,164 $40,000 $3,000 $2,333 $42,024 $2,049 $30,000 $36,434 $2,000 $20,000 $1,0
Slide 17: FY 2023 Review – International Segment
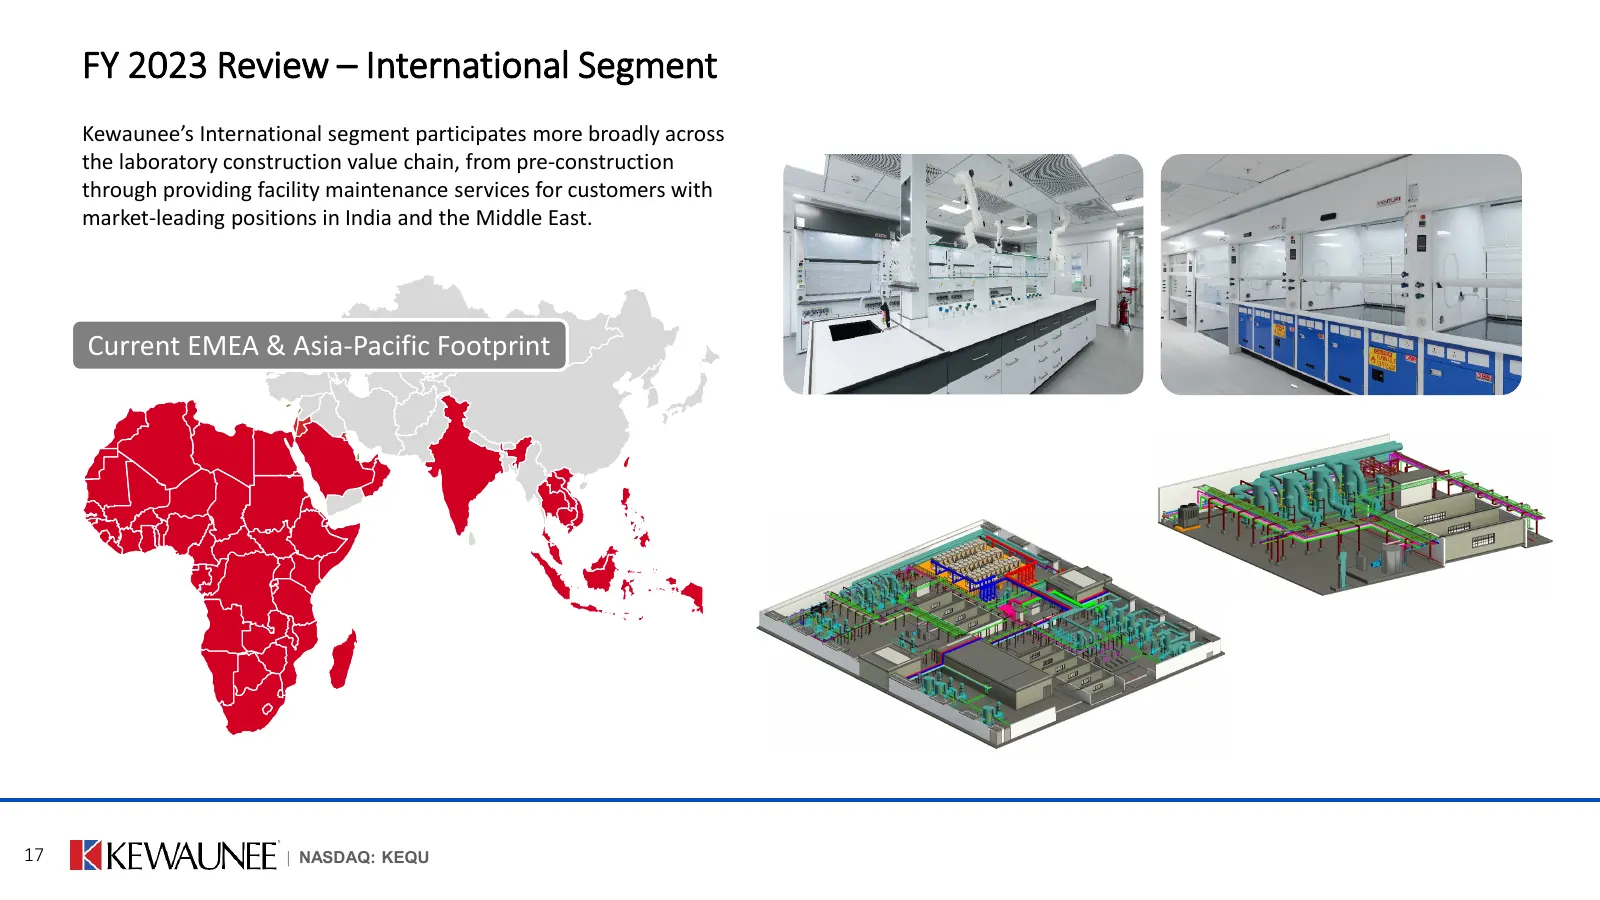
FY 2023 Review – International Segment Kewaunee’s International segment participates more broadly across the laboratory construction value chain, from pre-construction through providing facility maintenance services for customers with market-leading positions in India and the Middle East. Current EM
Slide 18: FY 2023 Review – Corporate Segment
FY 2023 Review – Corporate Segment Corporate Segment: • CEO and CFO compensation • Corporate finance and global treasury • Stock-based incentive compensation • Public company costs • Pension administration • Expenses related to the amortization of the underfunded pension liability • Other expenses 1
Slide 19: Strategic Direction and Outlook
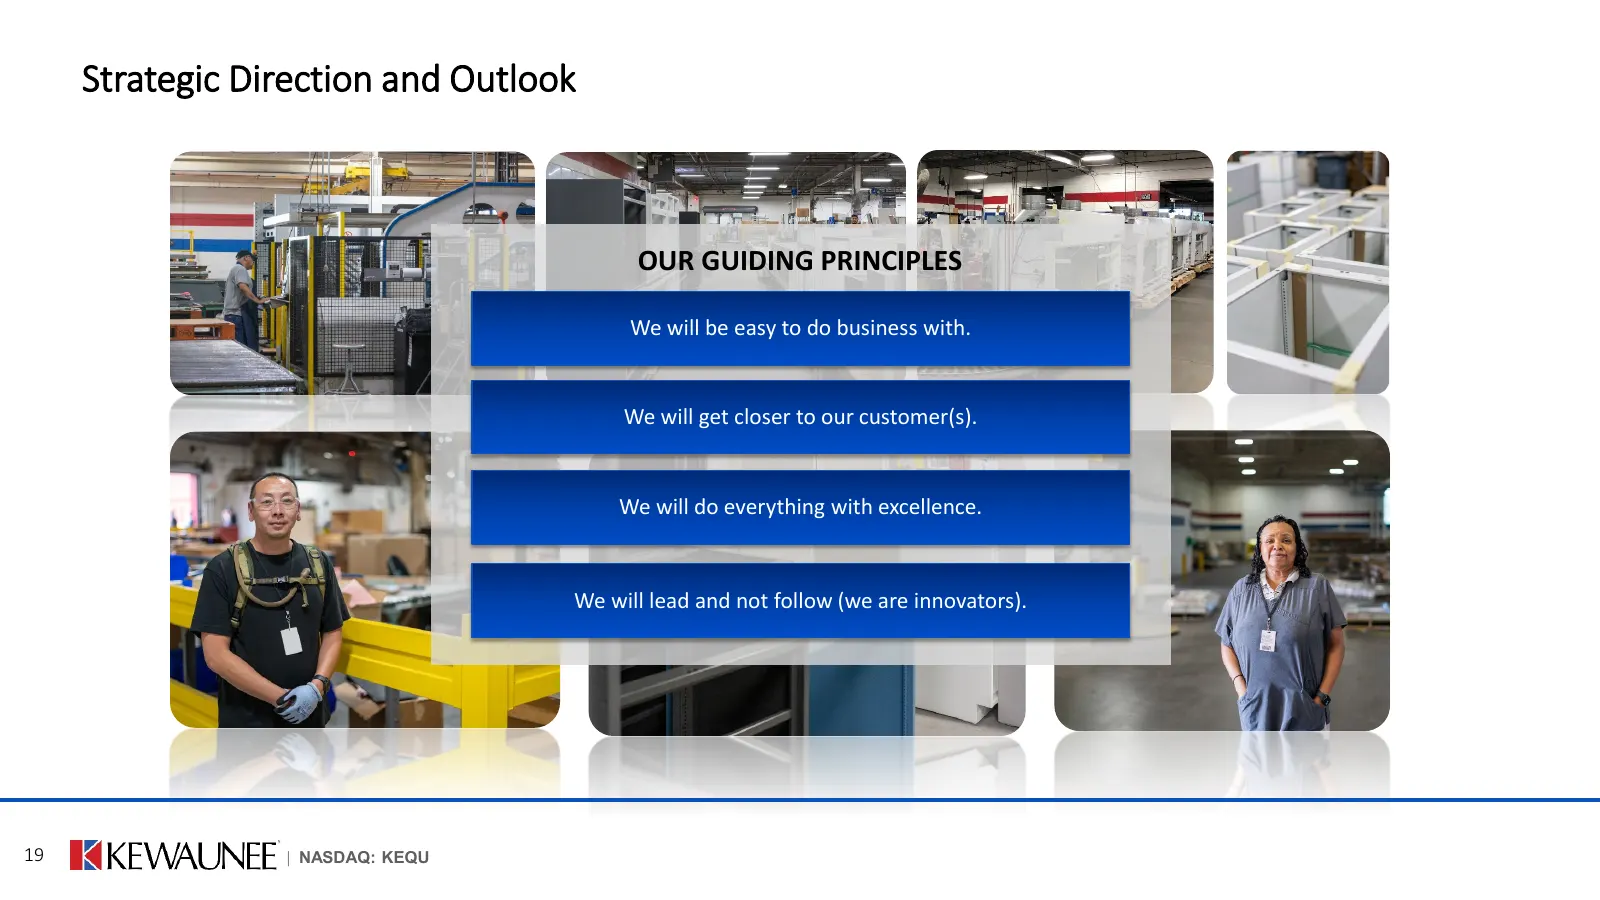
Strategic Direction and Outlook OUR GUIDING PRINCIPLES We will be easy to do business with. We will get closer to our customer(s). We will do everything with excellence. We will lead and not follow (we are innovators). 19 | NASDAQ: KEQU
Slide 20: Associates, Our Foundation
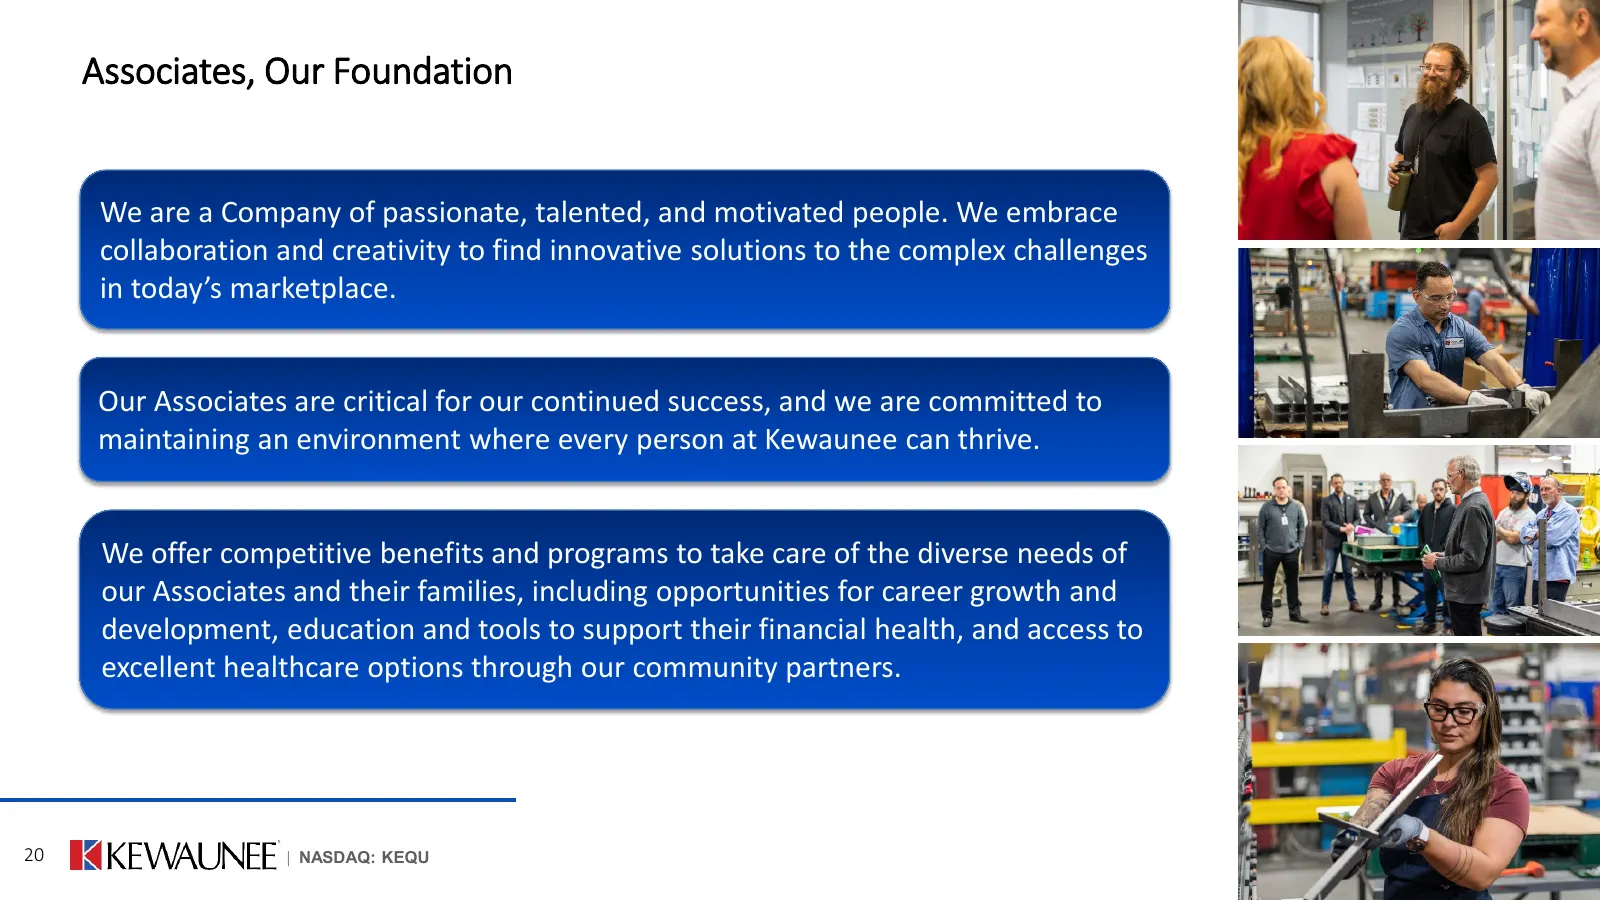
Associates, Our Foundation We are a Company of passionate, talented, and motivated people. We embrace collaboration and creativity to find innovative solutions to the complex challenges in today’s marketplace. Our Associates are critical for our continued success, and we are committed to maintaining
Slide 21: Why Choose Kewaunee?
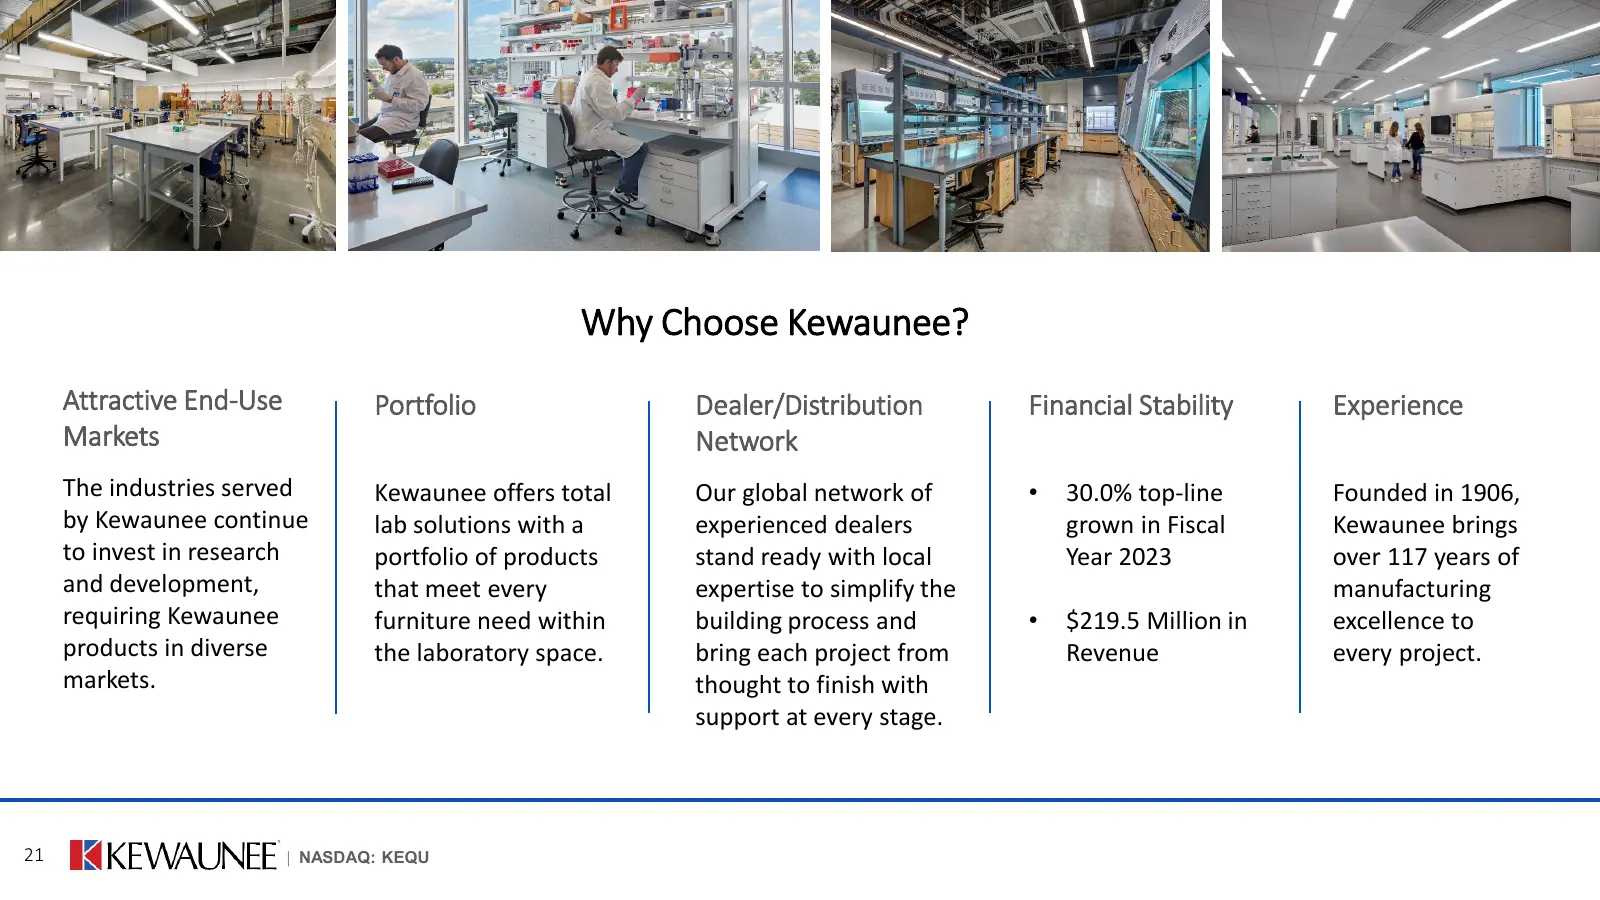
Why Choose Kewaunee? Attractive End-Use Portfolio Dealer/Distribution Financial Stability Experience Markets Network The industries served Kewaunee offers total Our global network of • 30.0% top-line Founded in 1906, by Kewaunee continue lab solutions with a experienced dealers grown in Fiscal Kewau

Slide 22: Thank You & Questions
Thank You & Questions 22 | NASDAQ: KEQU

Slide 23: Appendix
Appendix MKEWAUNEE | "soa: Keau 23
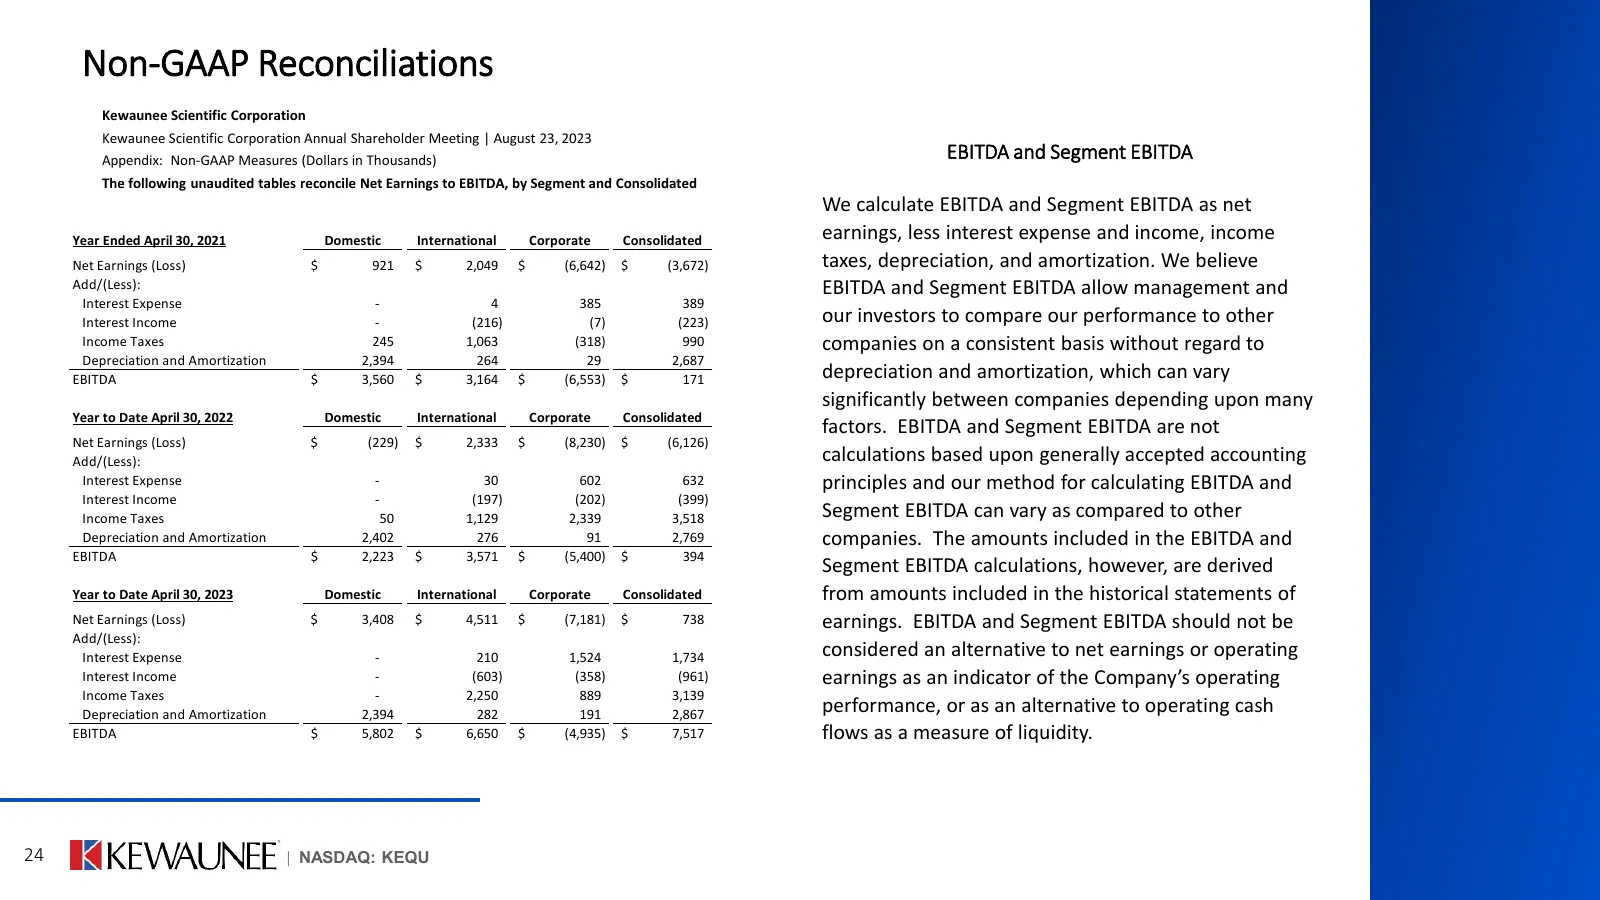
Slide 24: Non-GAAP Reconciliations
Non-GAAP Reconciliations Kewaunee Scientific Corporation Kewaunee Scientific Corporation Annual Shareholder Meeting | August 23, 2023 Appendix: Non-GAAP Measures (Dollars in Thousands) EBITDA and Segment EBITDA The following unaudited tables reconcile Net Earnings to EBITDA, by Segment and Consolida
Source: company website
More decks from Kewaunee Scientific Corporation
 Q1 FY2027 Earnings Presentation20 slides · September 2026
 Shareholder Meeting (August 2026)17 slides · Aug 26, 2026
 FY2026 Earnings Presentation21 slides · June 2026
 Q3 FY2026 Earnings Presentation22 slides · March 2026
 Q2 FY2026 Earnings Presentation22 slides · December 2025
 Q1 FY2026 Earnings Presentation22 slides · September 2025