INFICON Holding AG · SIX:IFCN
INFICON — Q1 2023 Earnings Presentation
18 slides from INFICON's earnings presentation, Apr 26, 2023

Slide 1: Earnings Release - Analyst/Media Conference Q1 2023
Earnings Release - Analyst/Media Conference Q1 2023 April 26, 2023
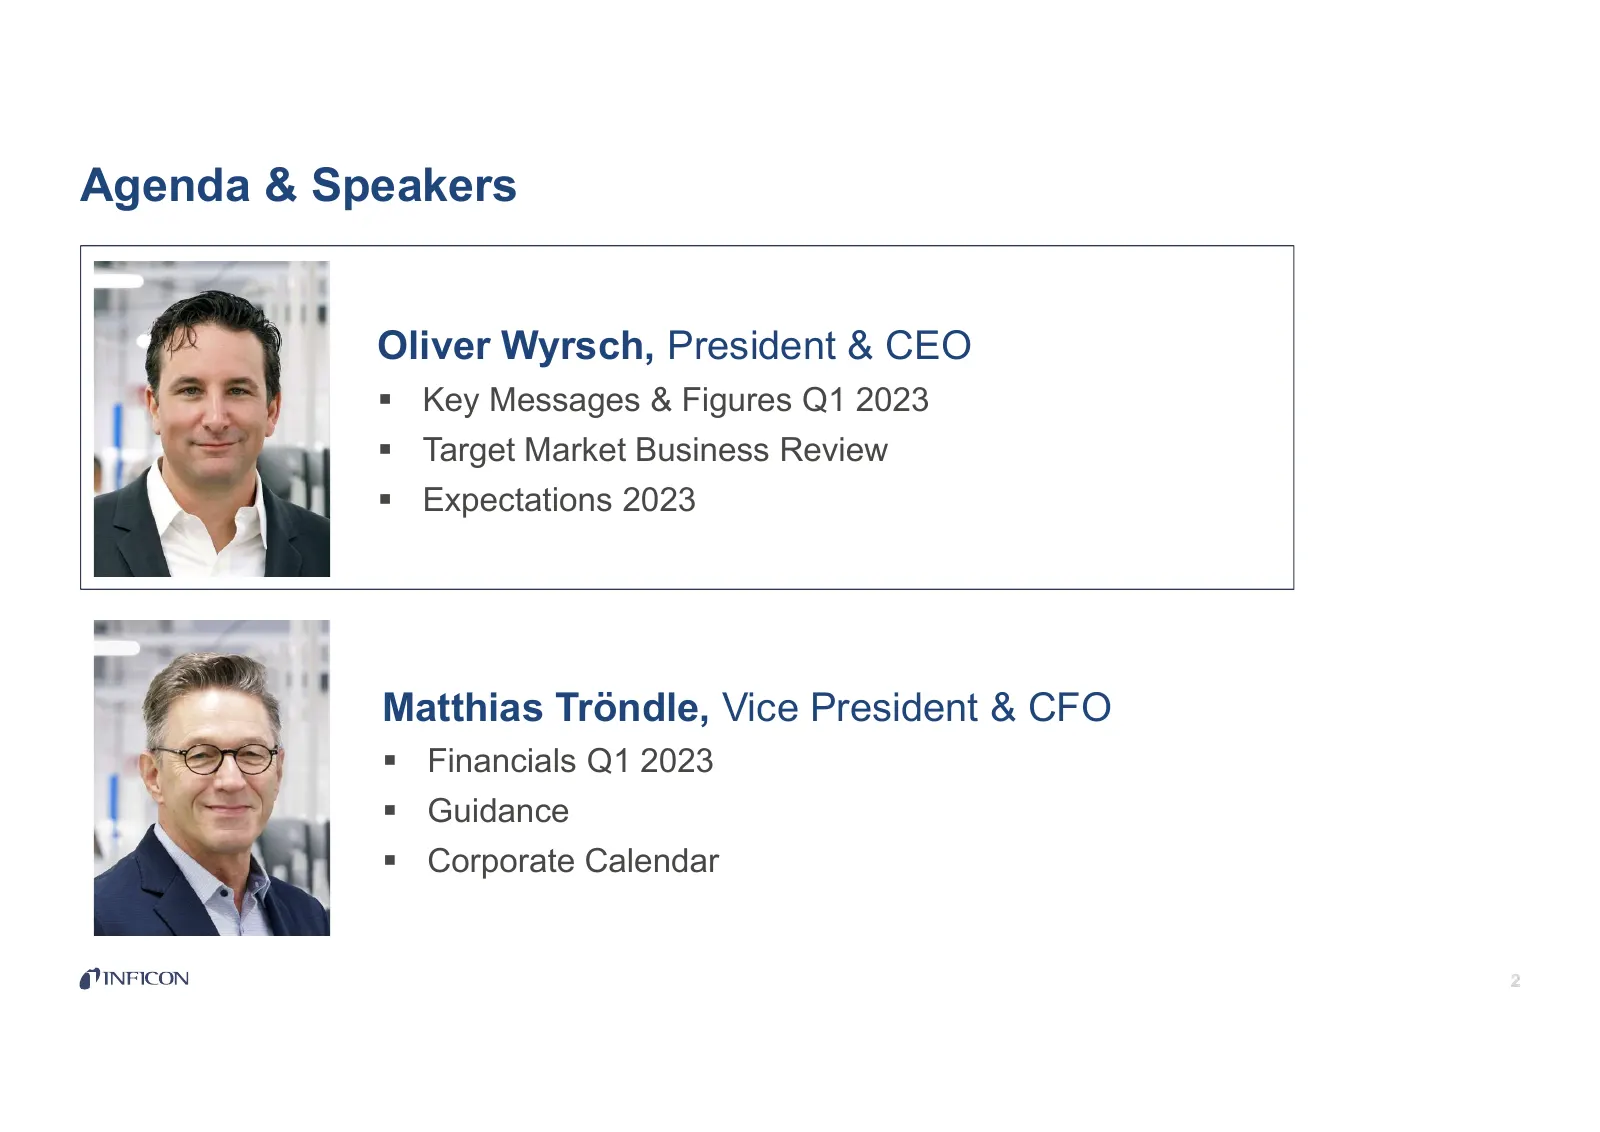
Slide 2: Agenda & Speakers
Agenda & Speakers Oliver Wyrsch, President & CEO Key Messages & Figures Q1 2023 Target Market Business Review Expectations 2023 Matthias Tröndle, Vice President & CFO Financials Q1 2023 Guidance Corporate Calendar
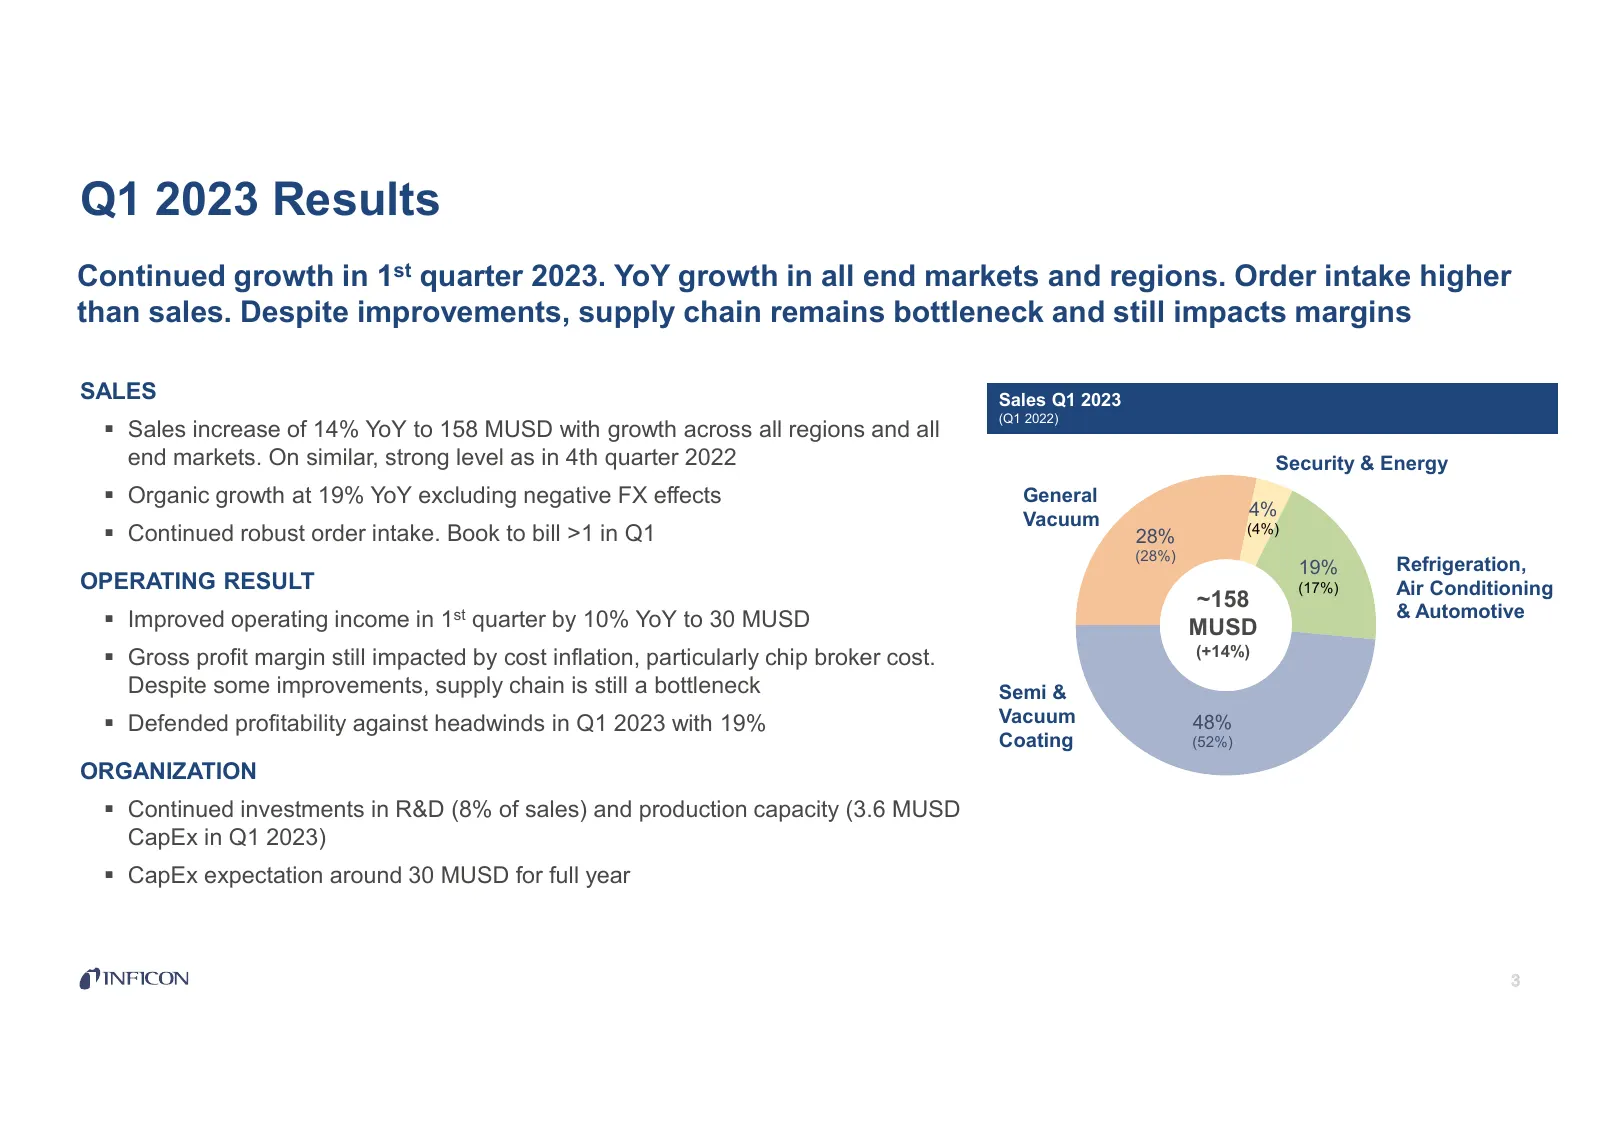
Slide 3: Q1 2023 Results
Q1 2023 Results Continued growth in 1st quarter 2023. YoY growth in all end markets and regions. Order intake higher than sales. Despite improvements, supply chain remains bottleneck and still impacts margins SALES Sales Q1 2023 (Q1 2022) Sales increase of 14% YoY to 158 MUSD with growth across al
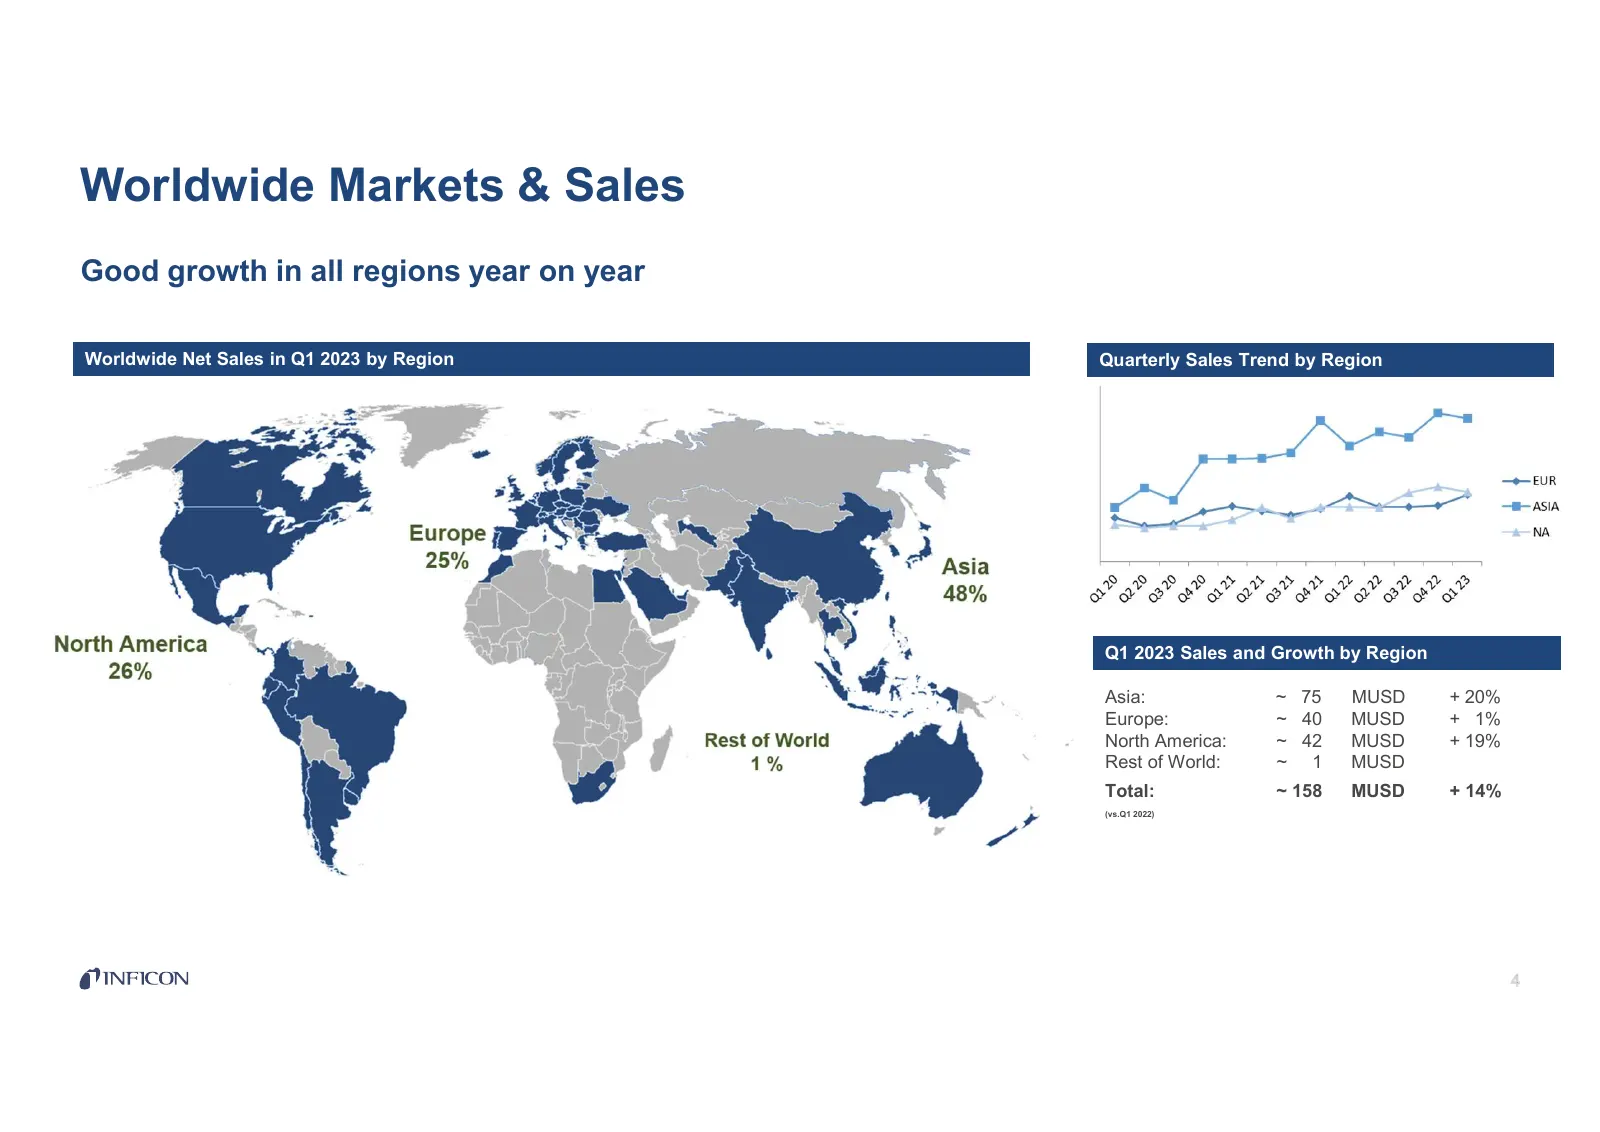
Slide 4: Worldwide Markets & Sales
Worldwide Markets & Sales Good growth in all regions year on year Worldwide Net Sales in Q1 2023 by Region Quarterly Sales Trend by Region Q1 2023 Sales and Growth by Region Asia: ~ 75 MUSD + 20% Europe: ~ 40 MUSD + 1% North America: ~ 42 MUSD + 19% Rest of World: ~ 1 MUSD Total: ~ 158 MUSD + 14% (v
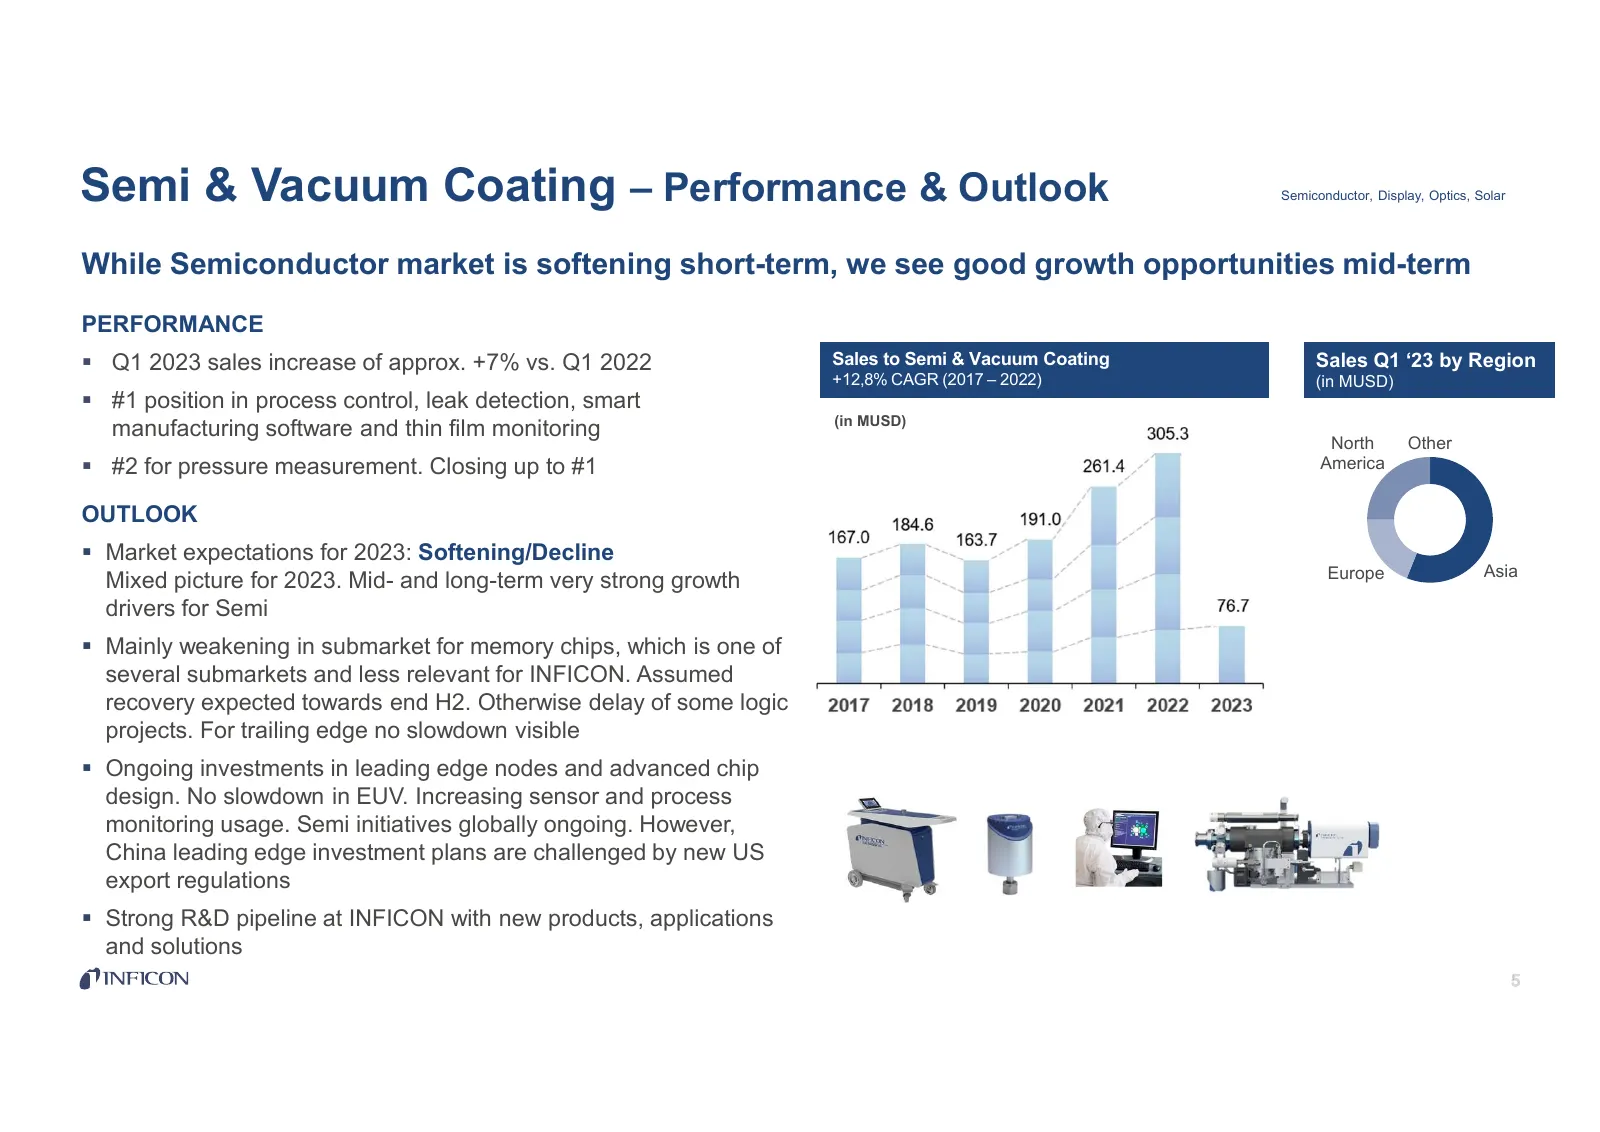
Slide 5: Semi & Vacuum Coating – Performance & Outlook
Semi & Vacuum Coating – Performance & Outlook Semiconductor, Display, Optics, Solar While Semiconductor market is softening short-term, we see good growth opportunities mid-term PERFORMANCE Q1 2023 sales increase of approx. +7% vs. Q1 2022 Sales to Semi & Vacuum Coating Sales Q1 ‘23 by Region +12,
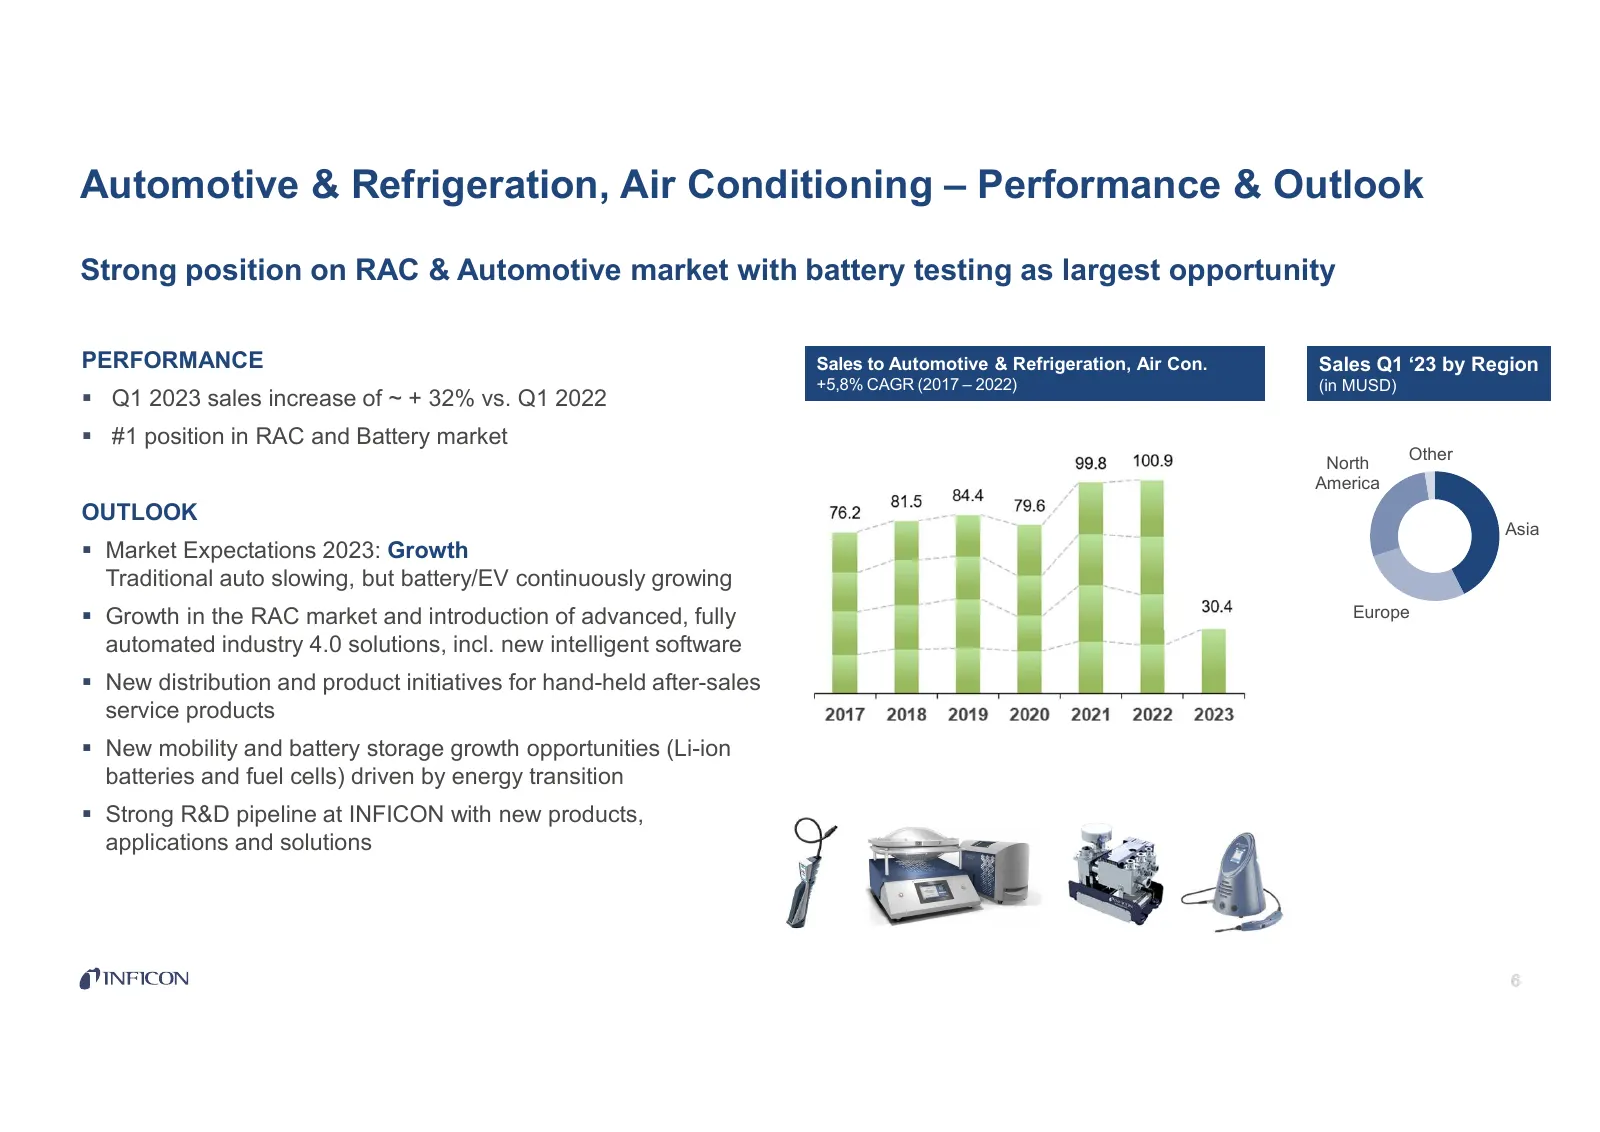
Slide 6: Automotive & Refrigeration, Air Conditioning – Performance & Outlook
Automotive & Refrigeration, Air Conditioning – Performance & Outlook Strong position on RAC & Automotive market with battery testing as largest opportunity PERFORMANCE Sales to Automotive & Refrigeration, Air Con. Sales Q1 ‘23 by Region +5,8% CAGR (2017 – 2022) (in MUSD) Q1 2023 sales increase of
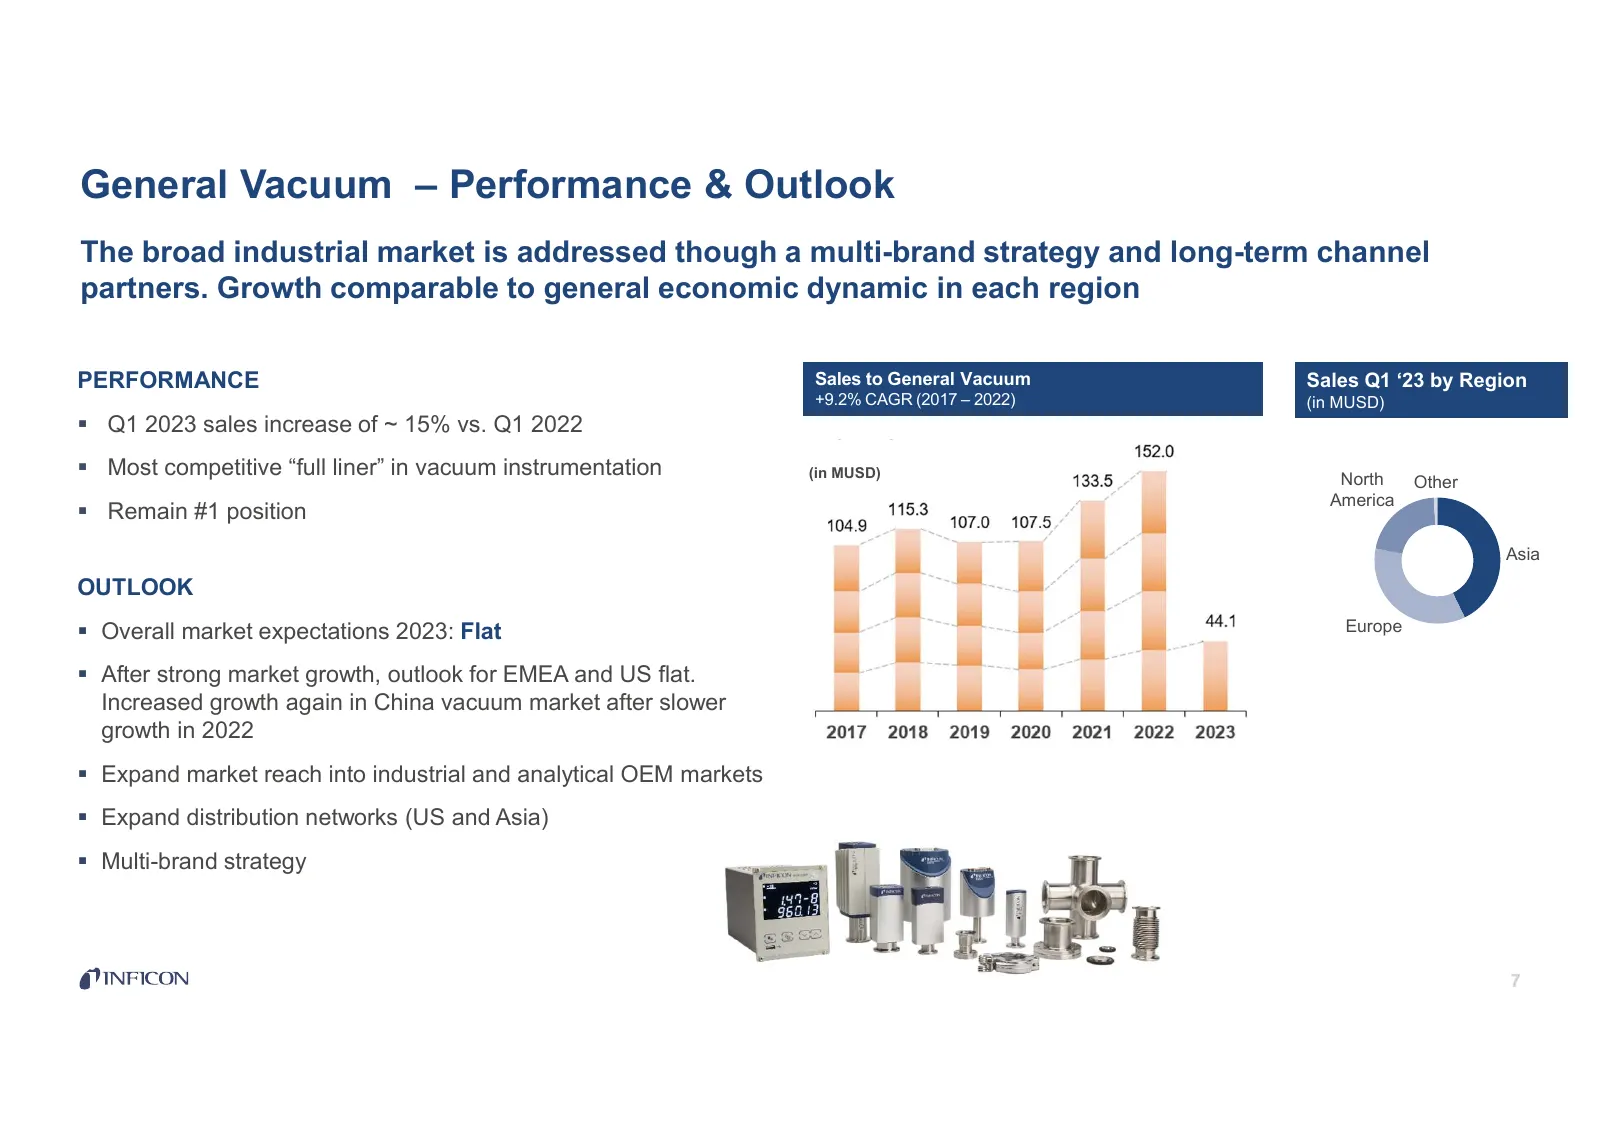
Slide 7: General Vacuum – Performance & Outlook
General Vacuum – Performance & Outlook The broad industrial market is addressed though a multi-brand strategy and long-term channel partners. Growth comparable to general economic dynamic in each region PERFORMANCE Sales to General Vacuum Sales Q1 ‘23 by Region +9.2% CAGR (2017 – 2022) (in MUSD) Q
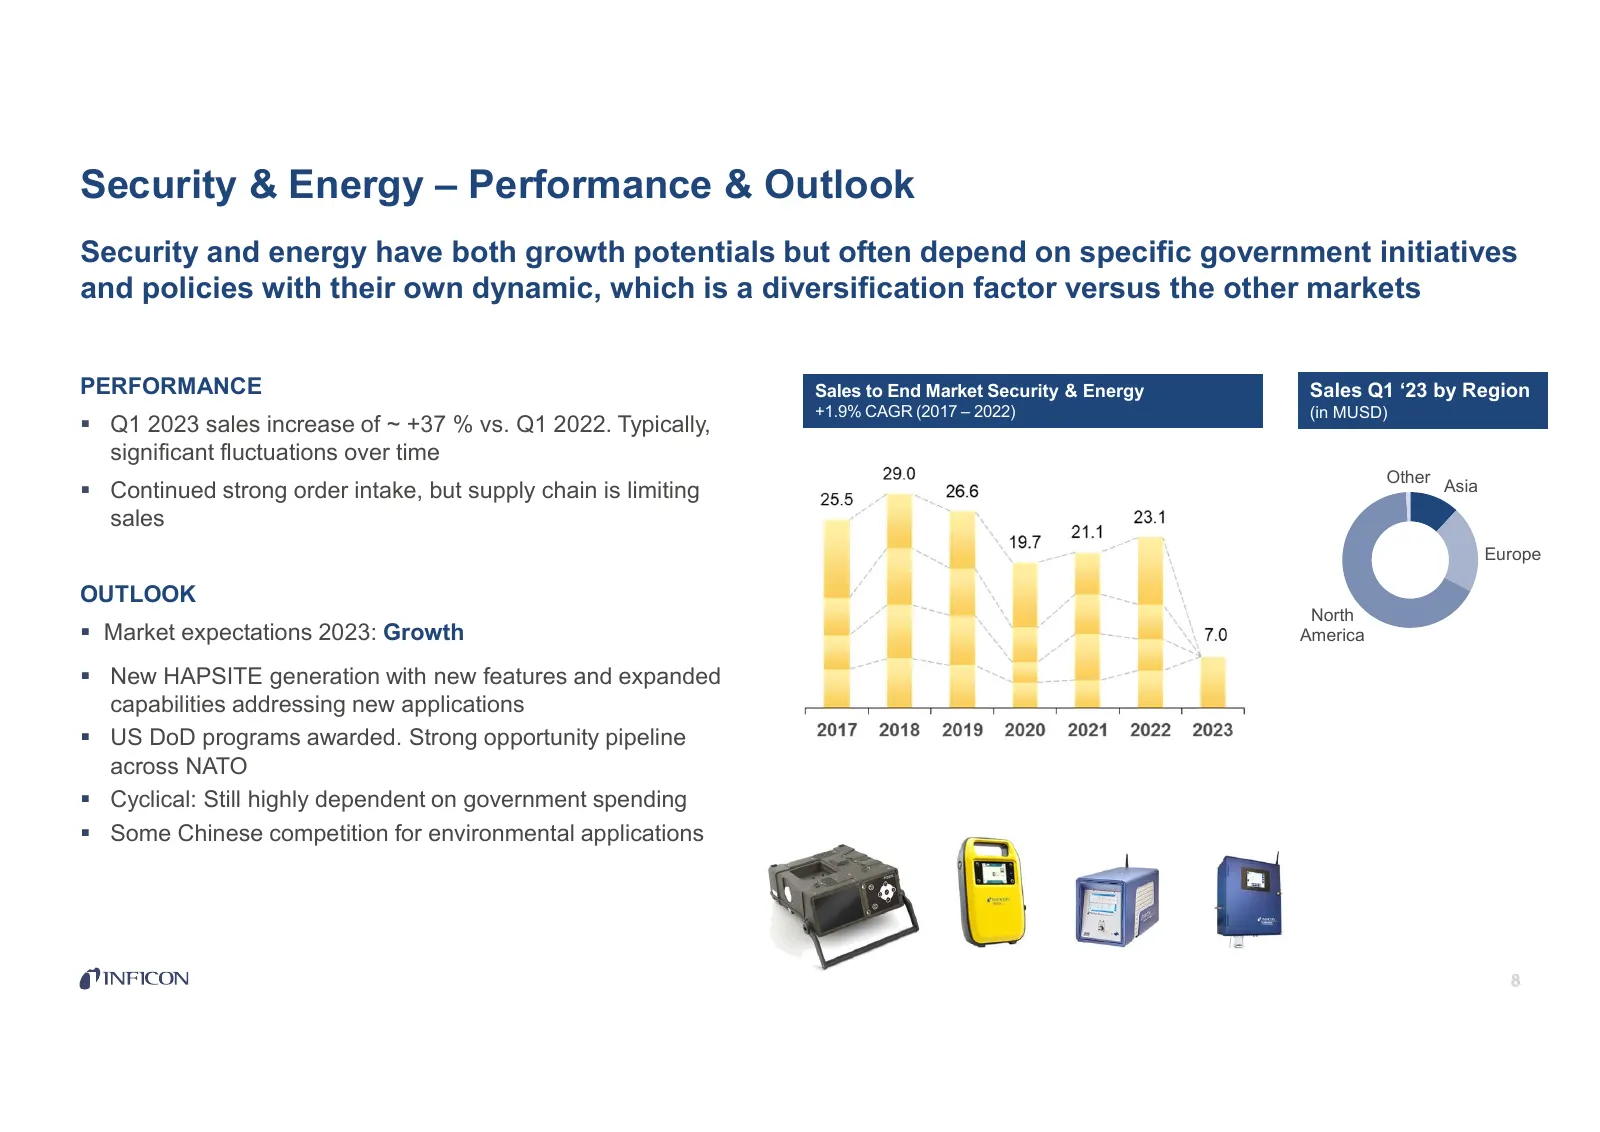
Slide 8: Security & Energy – Performance & Outlook
Security & Energy – Performance & Outlook Security and energy have both growth potentials but often depend on specific government initiatives and policies with their own dynamic, which is a diversification factor versus the other markets PERFORMANCE Sales to End Market Security & Energy Sales Q1 ‘23
Slide 9: Expectations 2023
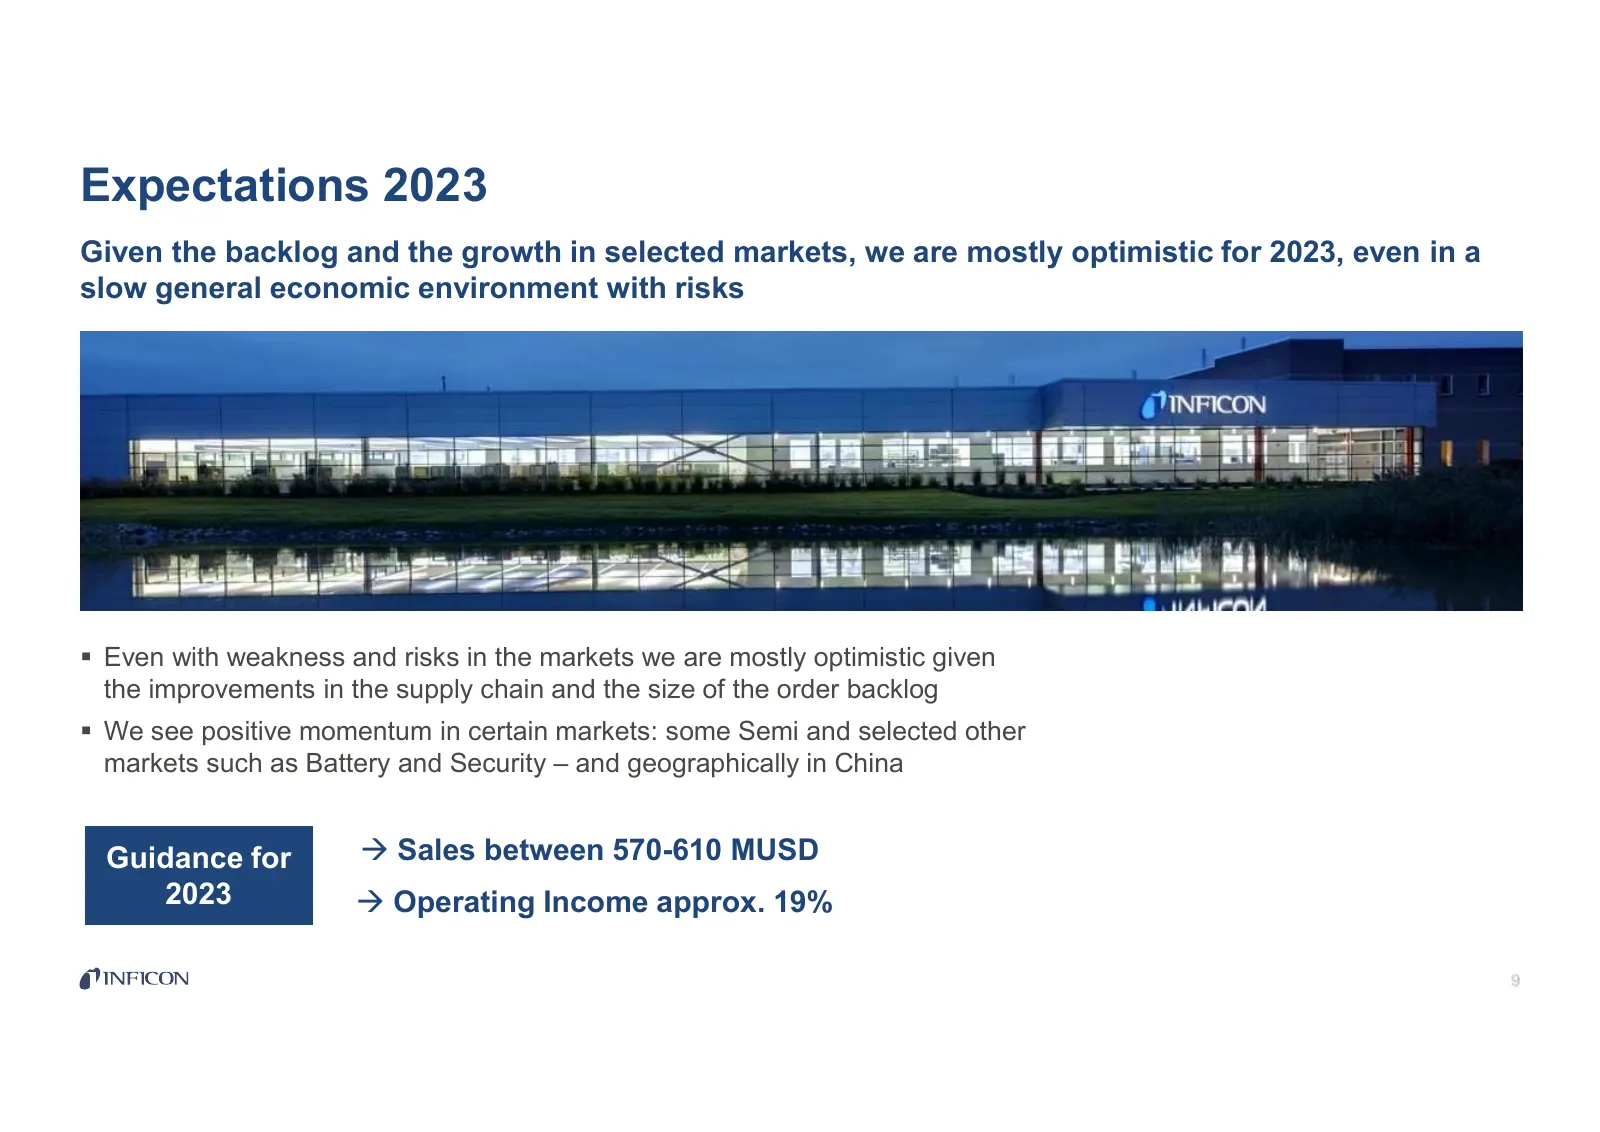
Expectations 2023 Given the backlog and the growth in selected markets, we are mostly optimistic for 2023, even in a slow general economic environment with risks Even with weakness and risks in the markets we are mostly optimistic given the improvements in the supply chain and the size of the orde
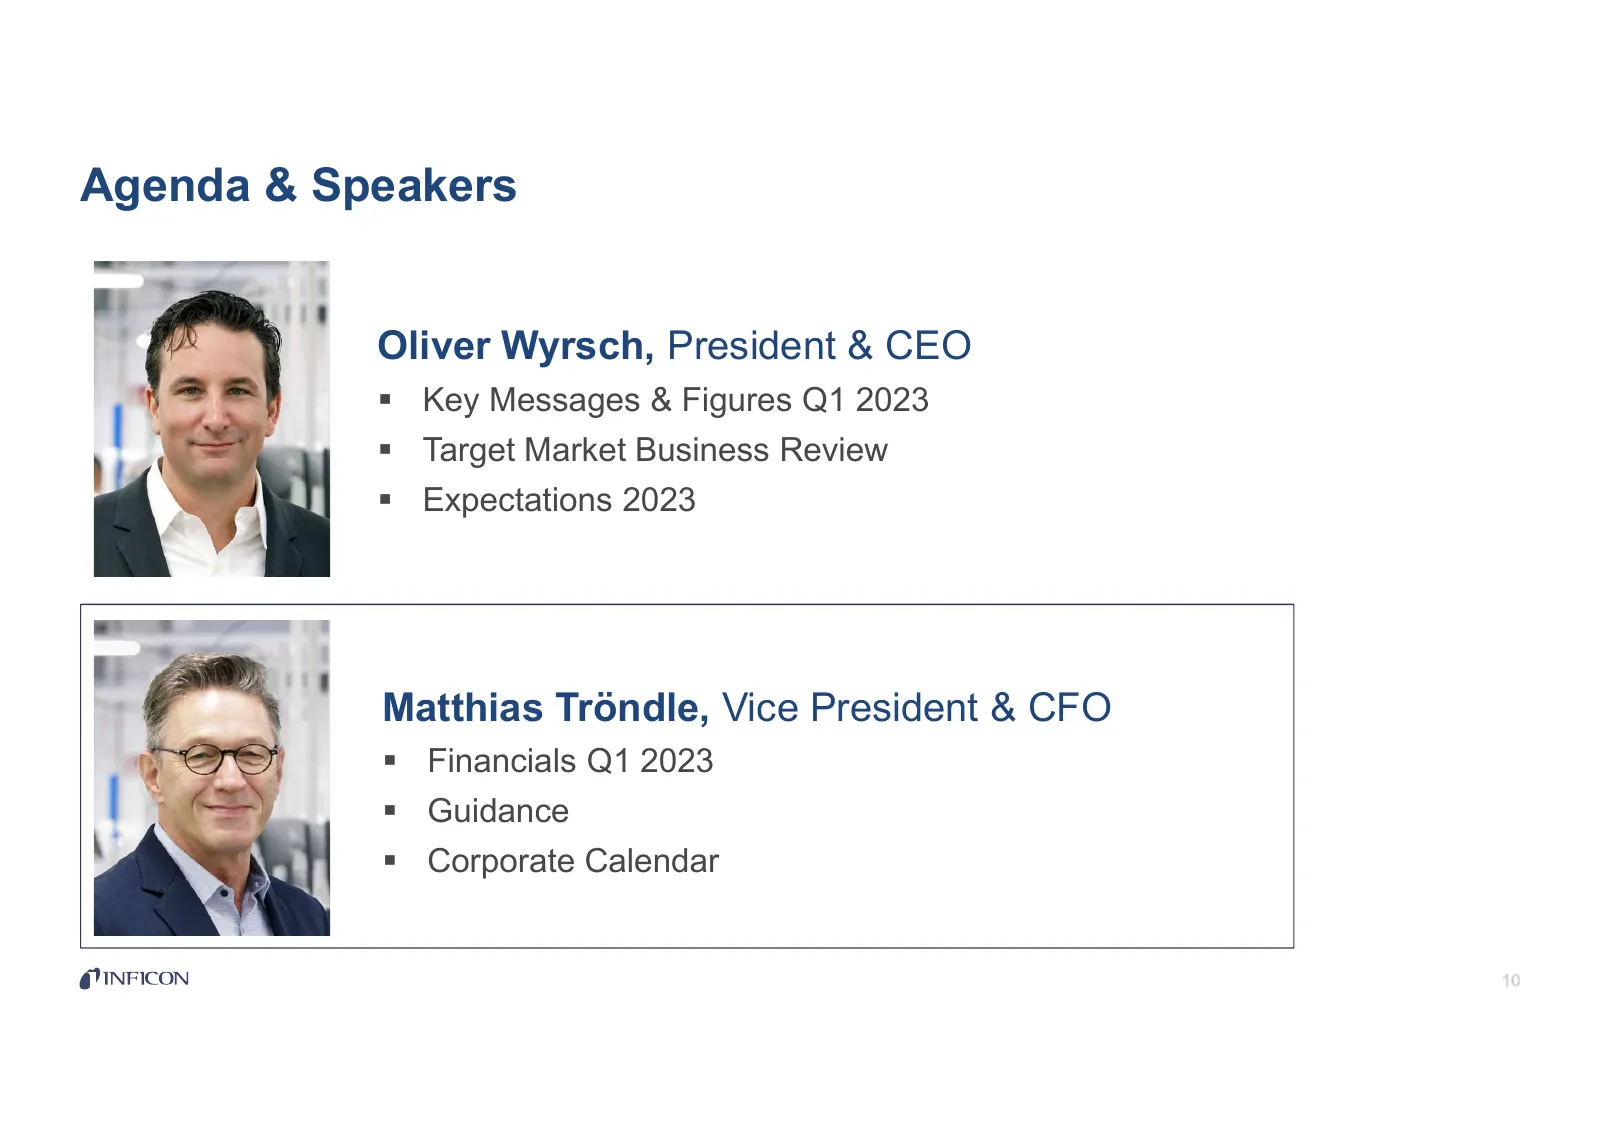
Slide 10: Agenda & Speakers
Agenda & Speakers Oliver Wyrsch, President & CEO Key Messages & Figures Q1 2023 Target Market Business Review Expectations 2023 Matthias Tröndle, Vice President & CFO Financials Q1 2023 Guidance Corporate Calendar
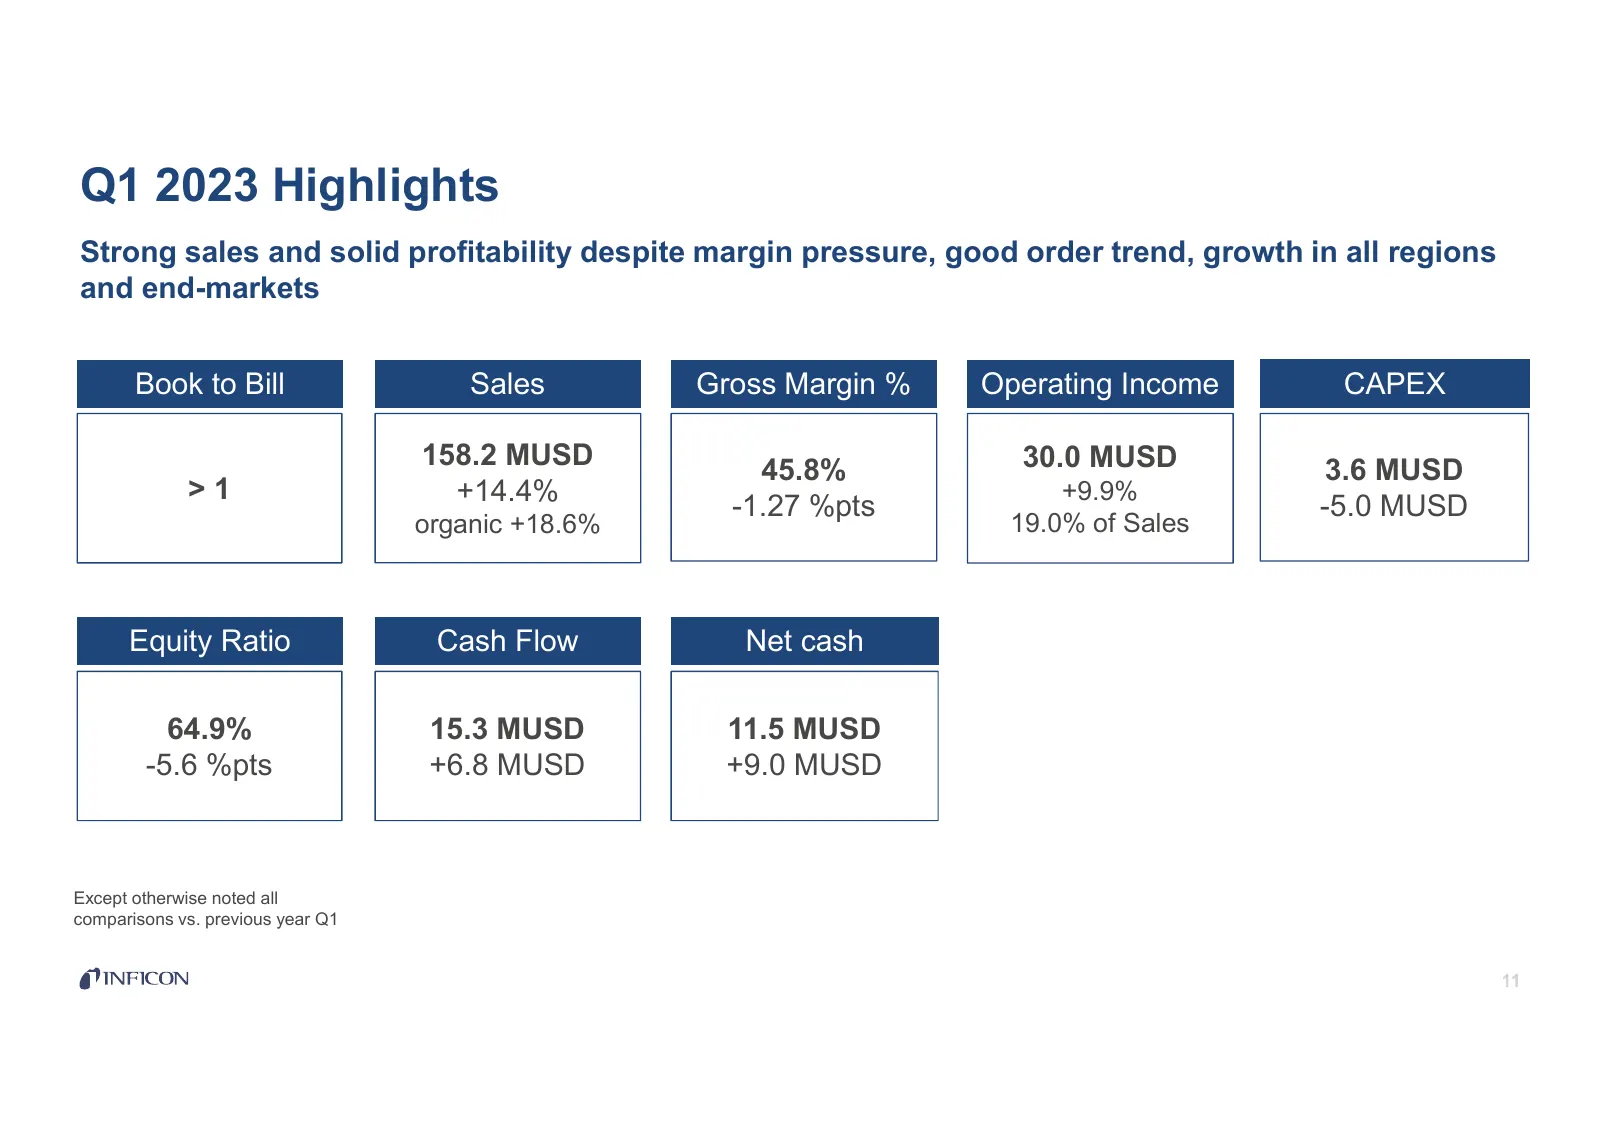
Slide 11: Q1 2023 Highlights
Q1 2023 Highlights Strong sales and solid profitability despite margin pressure, good order trend, growth in all regions and end-markets Book to Bill Sales Gross Margin % Operating Income CAPEX 158.2 MUSD 45.8% 30.0 MUSD 3.6 MUSD >1 +14.4% +9.9% -1.27 %pts -5.0 MUSD organic +18.6% 19.0% of Sales Equ
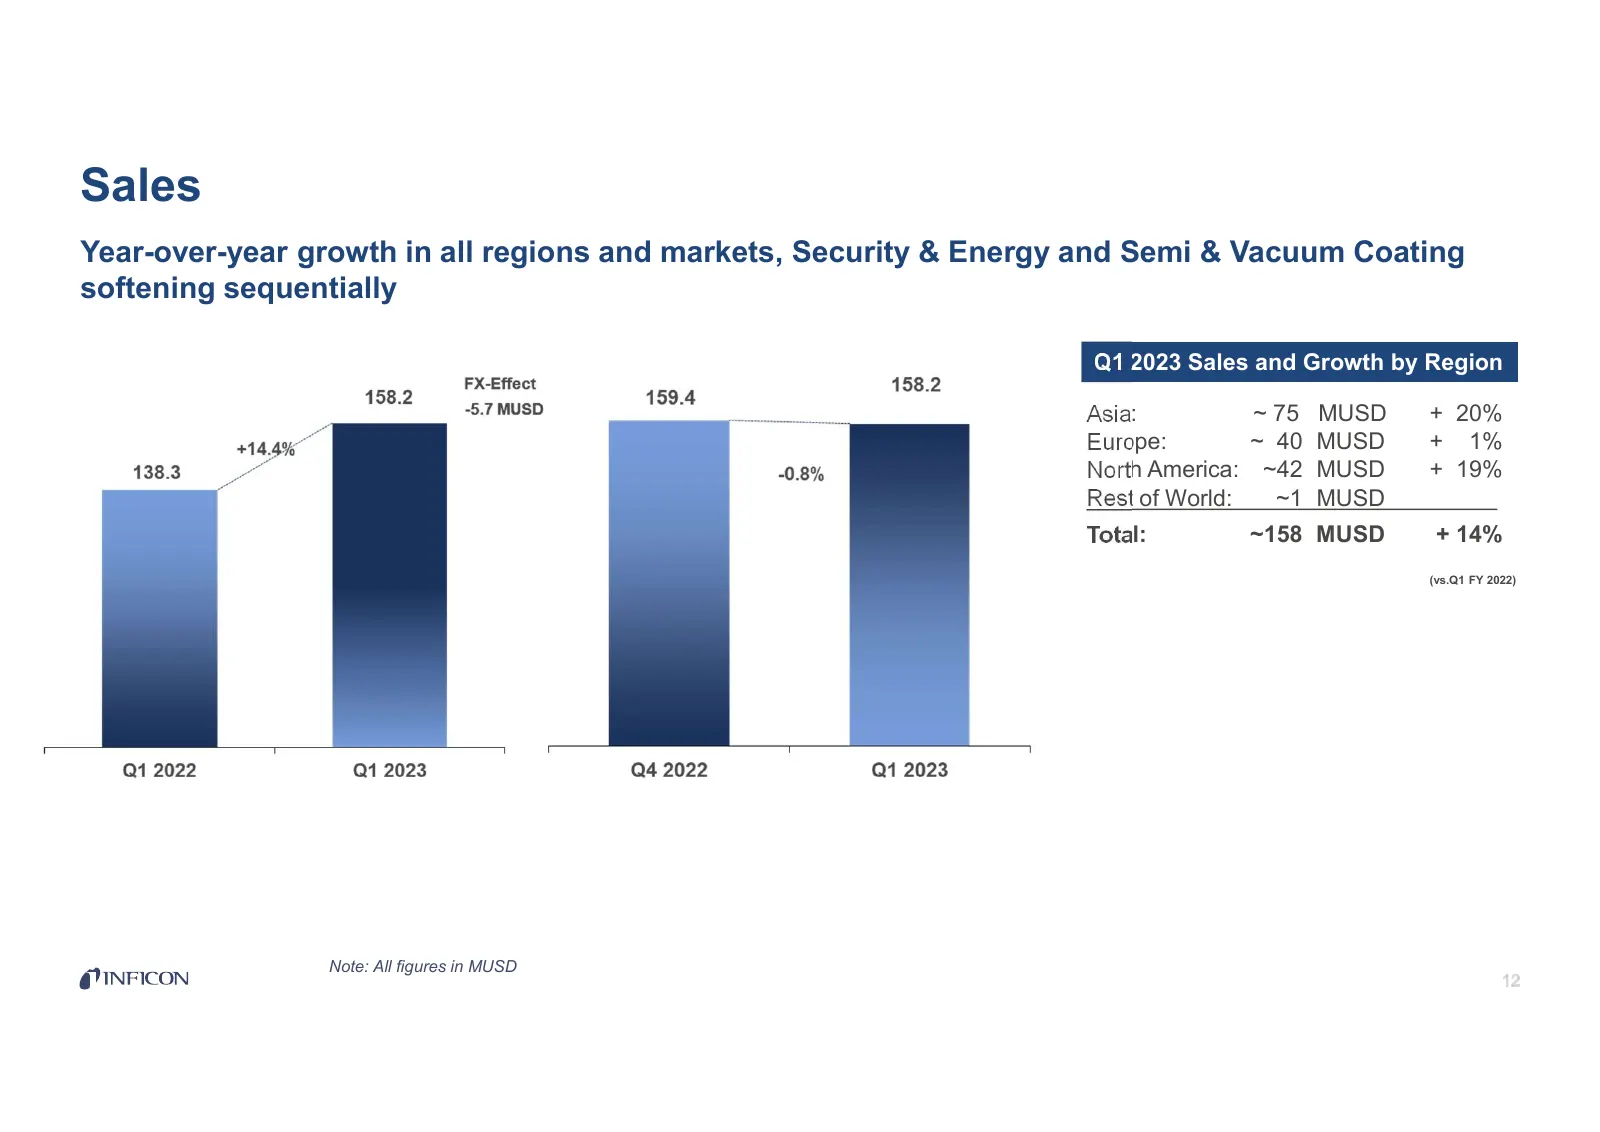
Slide 12: Sales
Sales Year-over-year growth in all regions and markets, Security & Energy and Semi & Vacuum Coating softening sequentially Q1 2023 Sales and Growth by Region Asia: ~ 75 MUSD + 20% Europe: ~ 40 MUSD + 1% North America: ~42 MUSD + 19% Rest of World: ~1 MUSD Total: ~158 MUSD + 14% (vs.Q1 FY 2022) Note:
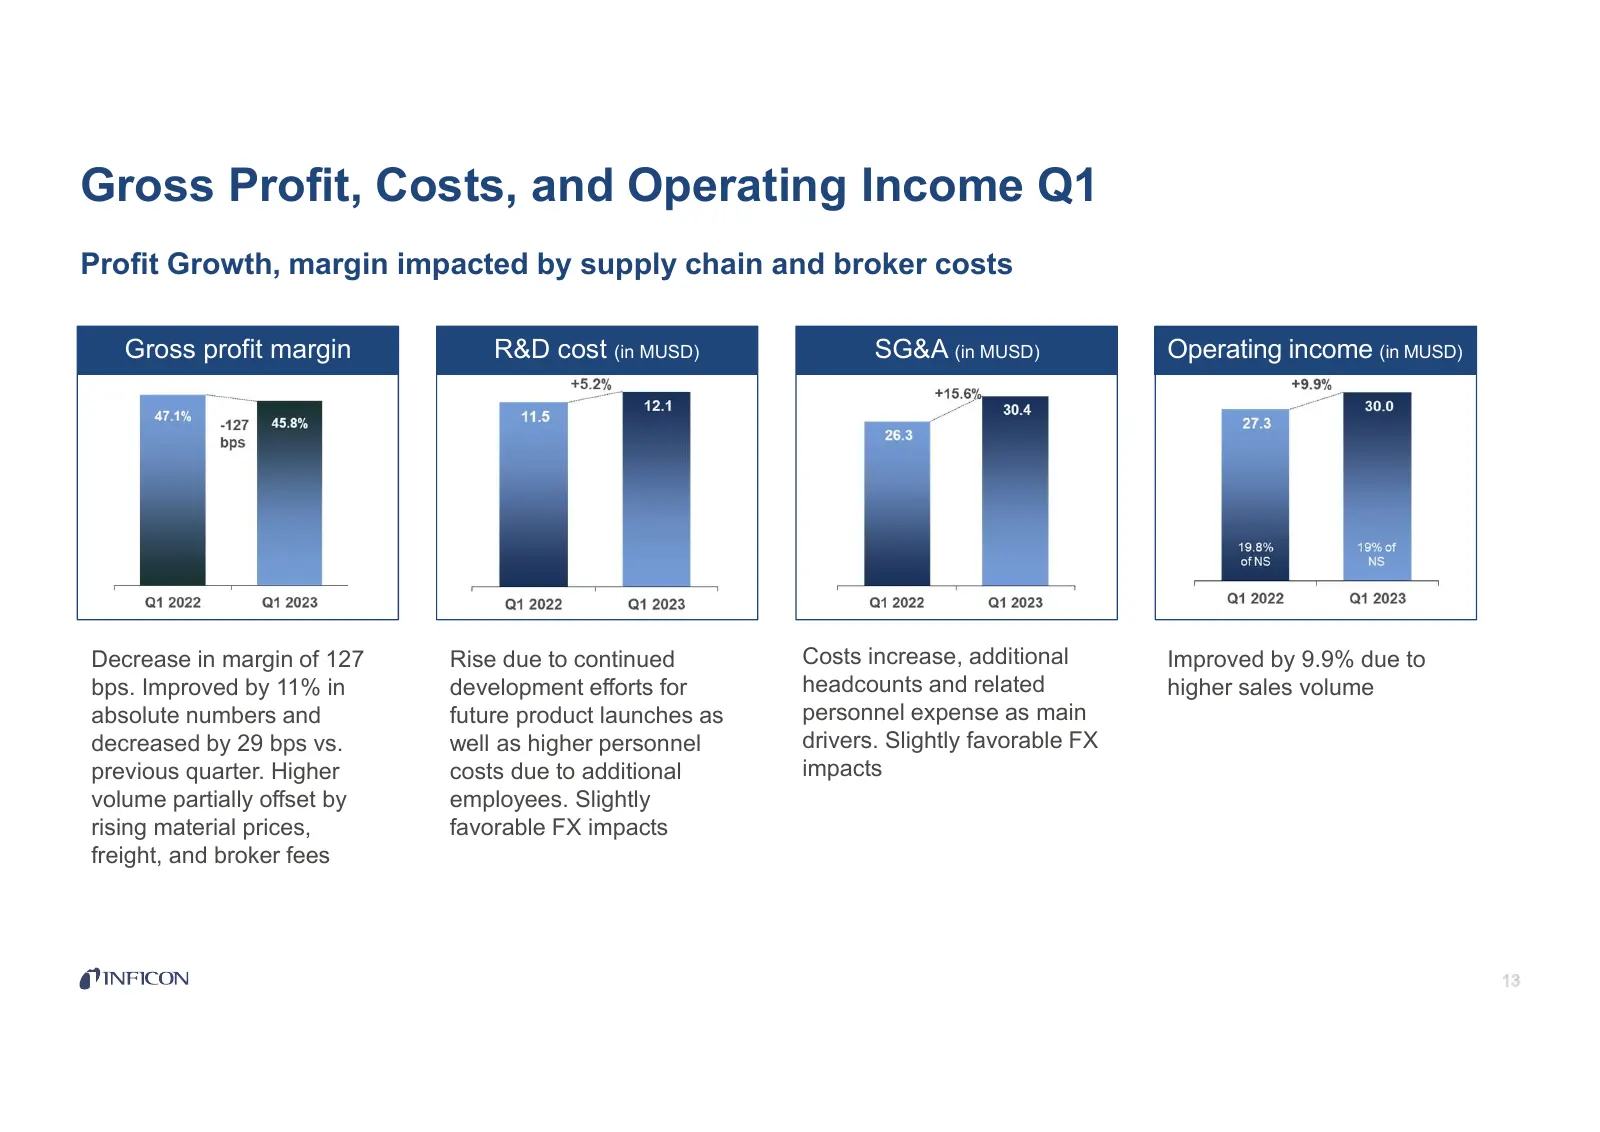
Slide 13: Gross Profit, Costs, and Operating Income Q1
Gross Profit, Costs, and Operating Income Q1 Profit Growth, margin impacted by supply chain and broker costs Gross profit margin R&D cost (in MUSD) SG&A (in MUSD) Operating income (in MUSD) Decrease in margin of 127 Rise due to continued Costs increase, additional Improved by 9.9% due to bps. Improv
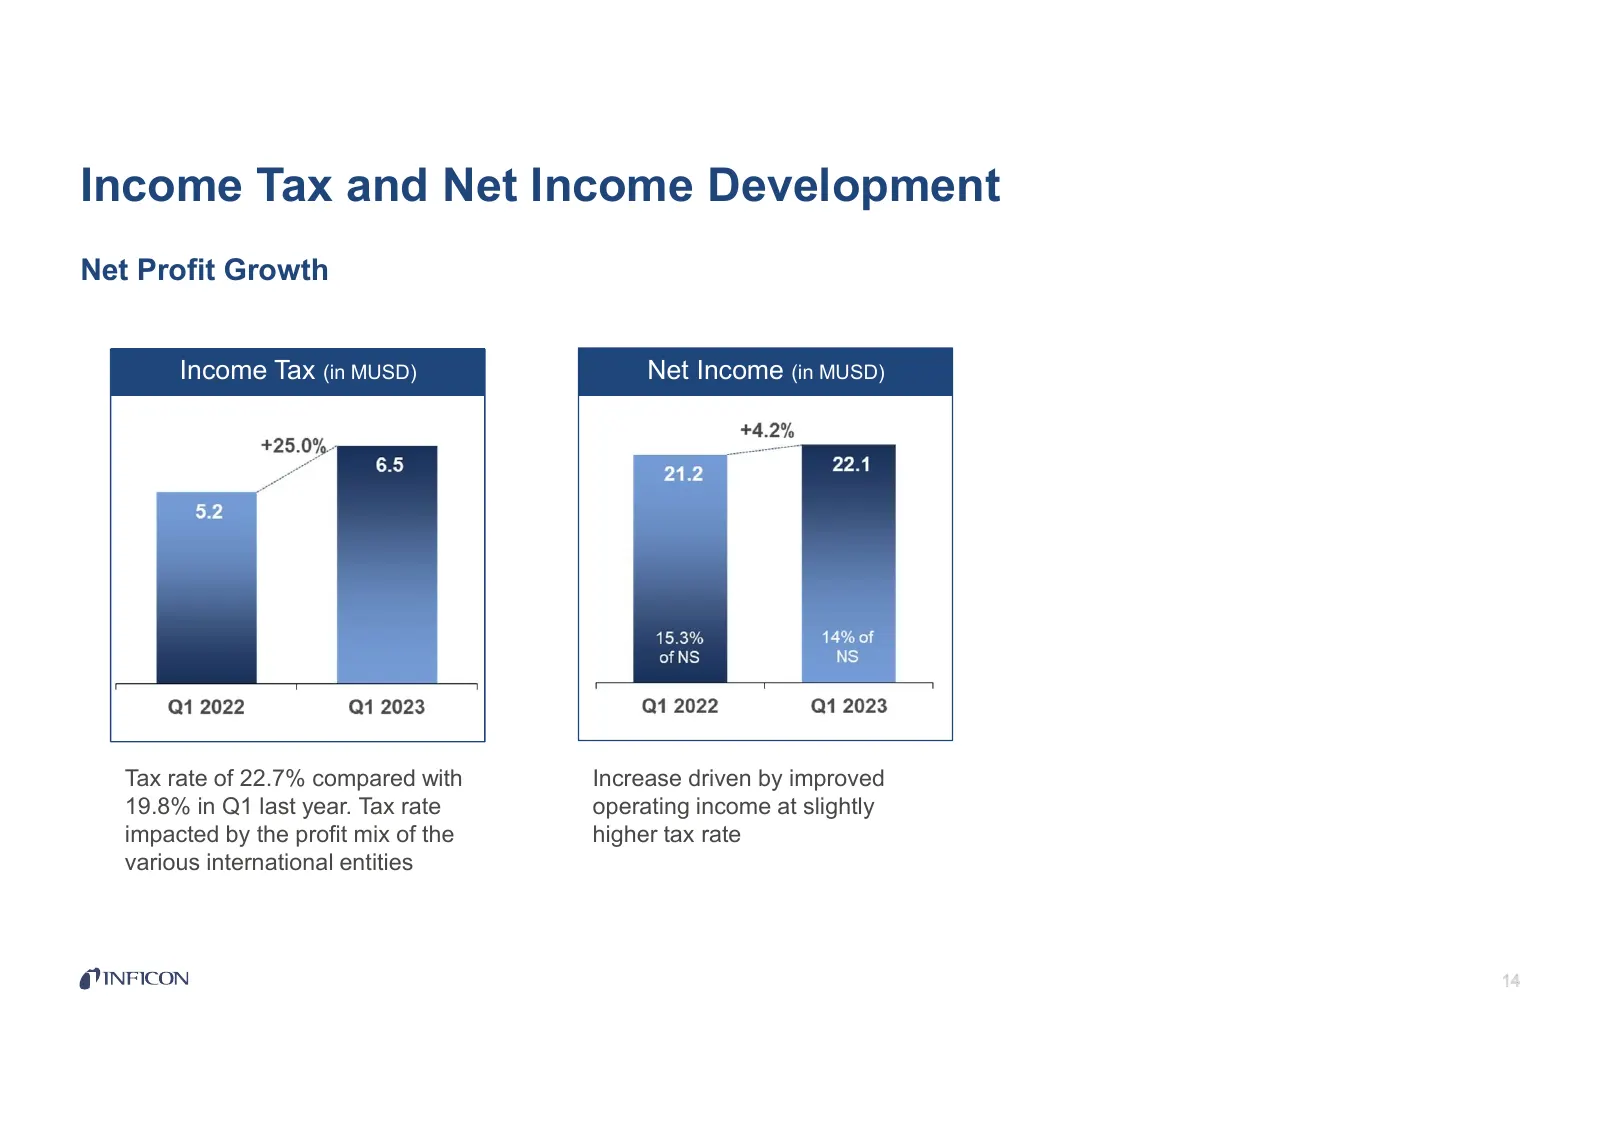
Slide 14: Income Tax and Net Income Development
Income Tax and Net Income Development Net Profit Growth Income Tax (in MUSD) Net Income (in MUSD) Tax rate of 22.7% compared with Increase driven by improved 19.8% in Q1 last year. Tax rate operating income at slightly impacted by the profit mix of the higher tax rate various international entities
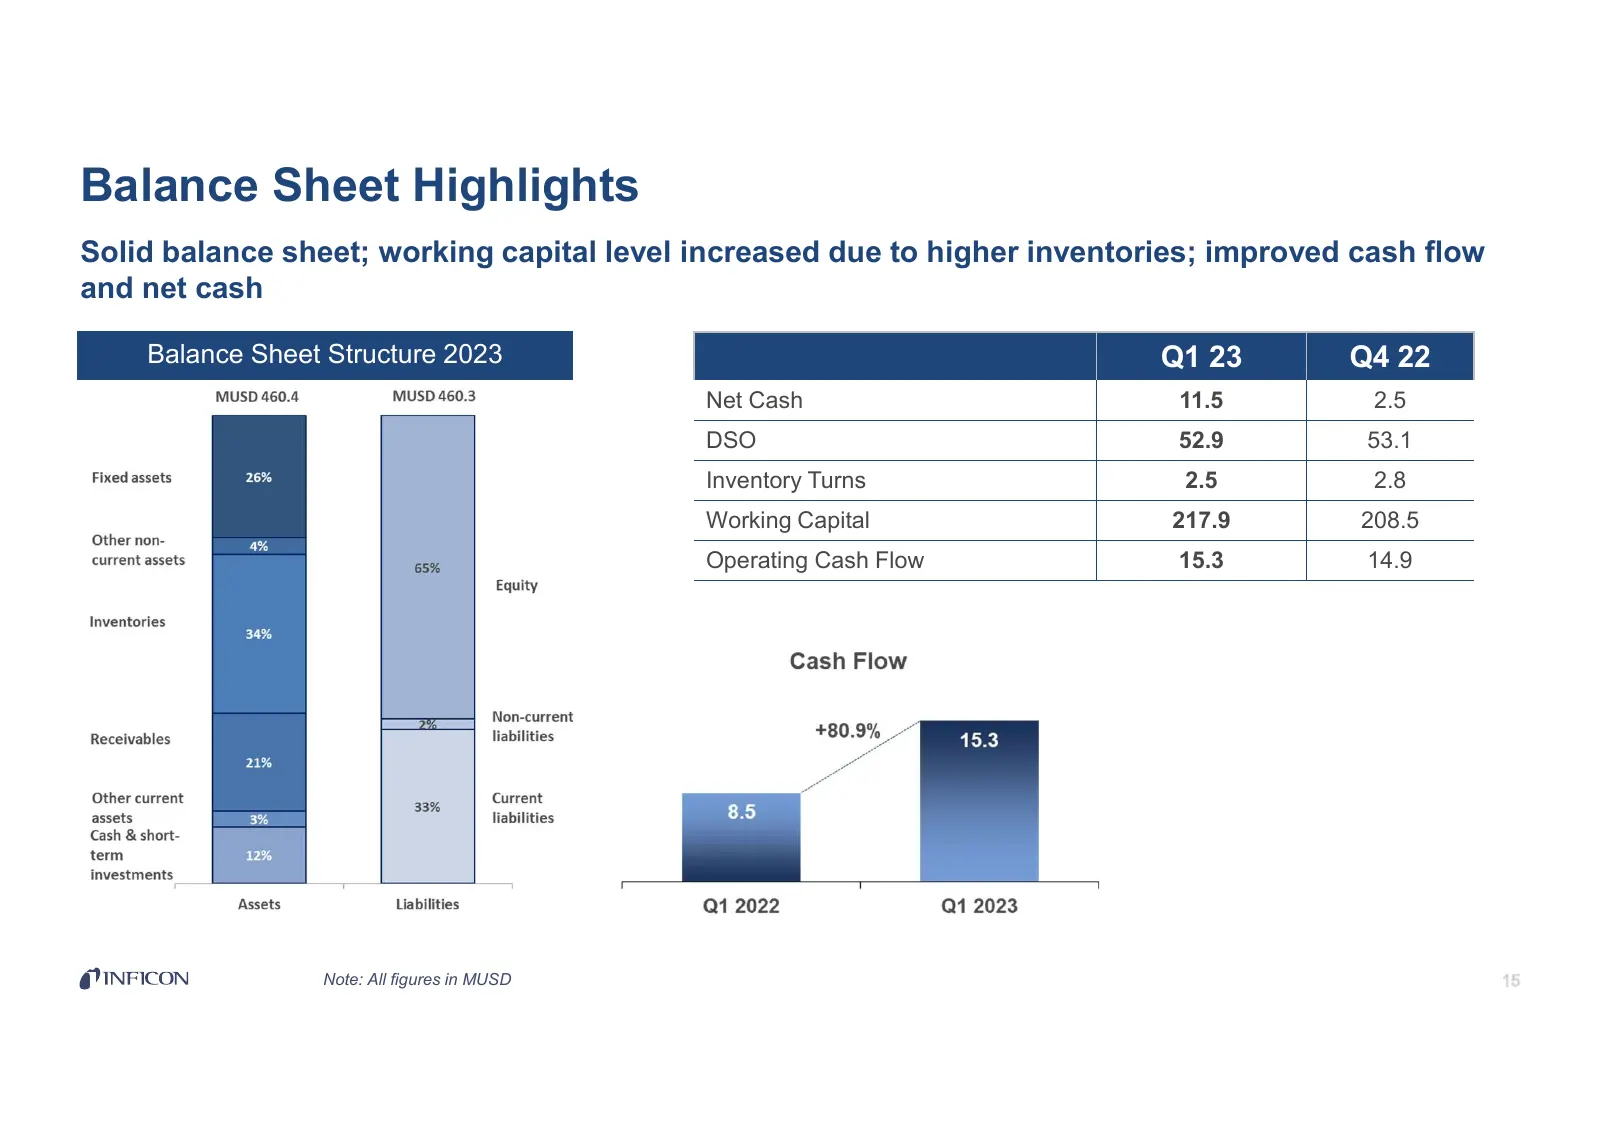
Slide 15: Balance Sheet Highlights
Balance Sheet Highlights Solid balance sheet; working capital level increased due to higher inventories; improved cash flow and net cash Balance Sheet Structure 2023 Q1 23 Q4 22 Net Cash 11.5 2.5 DSO 52.9 53.1 Inventory Turns 2.5 2.8 Working Capital 217.9 208.5 Operating Cash Flow 15.3 14.9 Note: Al
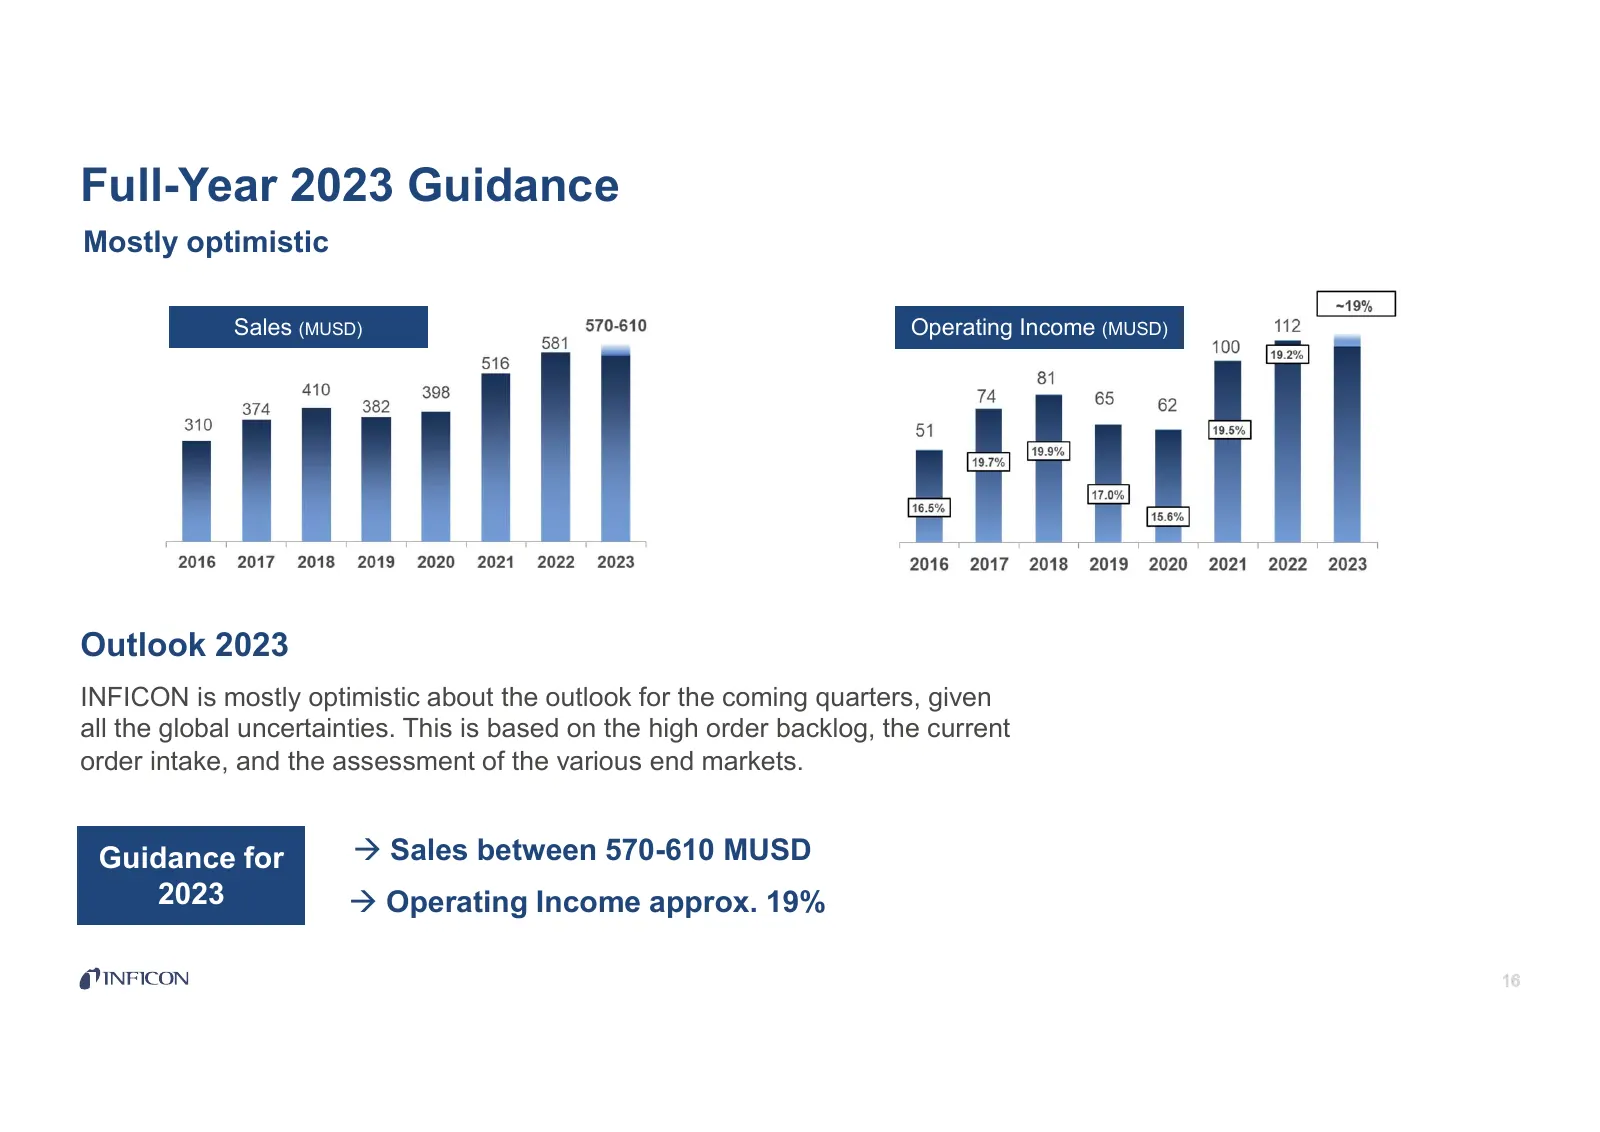
Slide 16: Full-Year 2023 Guidance
Full-Year 2023 Guidance Mostly optimistic Sales (MUSD) Operating Income (MUSD) Outlook 2023 INFICON is mostly optimistic about the outlook for the coming quarters, given all the global uncertainties. This is based on the high order backlog, the current order intake, and the assessment of the various
Slide 17: Thank You for Your Attention Q&A
Thank You for Your Attention Q&A Next Events on Corporate Calendar 2023 Q2 and HY 2023 Earnings Conference Call July 27, 2023 Q3 FY 2023 Earnings Conference Call October 19, 2023 **Earnings dates are subject to change**
Slide 18: INFICON believes that a deep understanding of our customers' challenges
INFICON believes that a deep understanding of our customers’ challenges and their visions for success are paramount to everything we do. These long-standing partnerships and the commitment to see our customers succeed inspire our dedicated, talented employees to develop and build market-leading inst
Source: Internet Archive copy of ir.inficon.com
More decks from INFICON Holding AG
 Q3 2026 Earnings Presentation18 slides · Oct 27, 2026
 Q2 2026 Earnings Presentation20 slides · Jul 30, 2026
 Q1 2026 Earnings Presentation20 slides · Apr 24, 2026
 Q4 2025 Earnings Presentation32 slides · Mar 24, 2026
 Q1 2025 Earnings Presentation20 slides · Apr 24, 2025
 Technical Presentation (September 2024)44 slides · September 2024