Computershare Limited · ASX:CPU
Computershare — ProShare SAYE & SIP Report webinar (September 2019)
38 slides from Computershare's conference presentation, Sep 25, 2019

Slide 1: ProShare SAYE & SIP Report – Findings from 2018
PROSHARE SAYE & SIP REPORT – FINDINGS FROM 2018
Slide 2: Disclaimer
Disclaimer The following presentation and the views expressed by the presenters are not intended to provide legal, tax, accounting, investment, or other professional advice. The information contained in this presentation is general in nature and based on authorities that are subject to change. Appli
Slide 3: Asking Questions
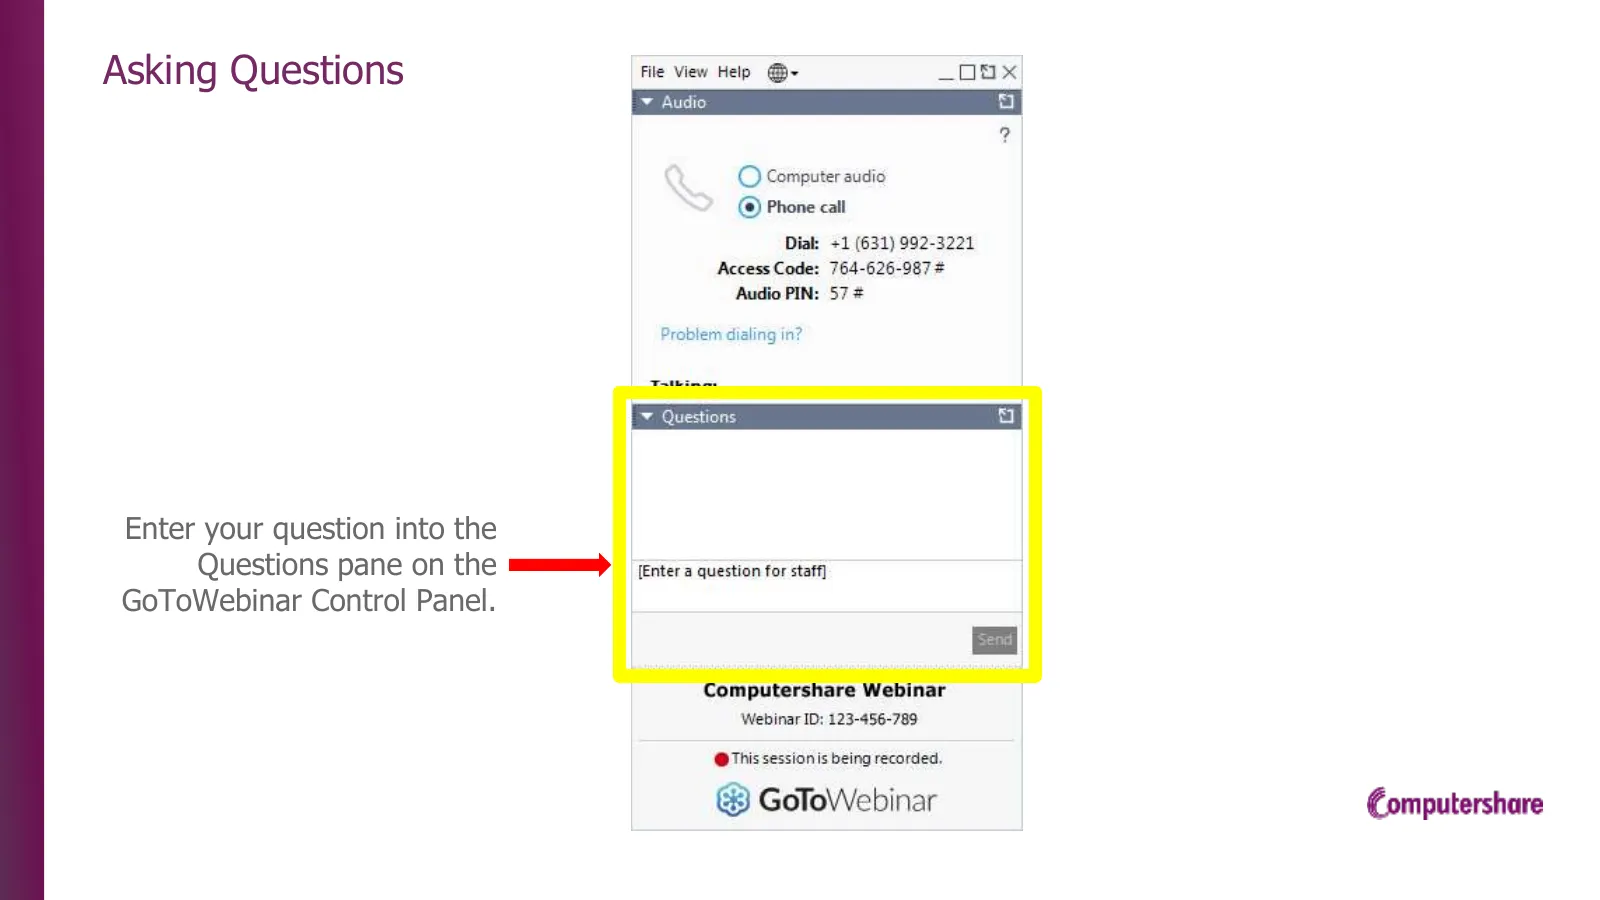
Asking Questions Enter your question into the Questions pane on the GoToWebinar Control Panel.
Slide 4: Housekeeping
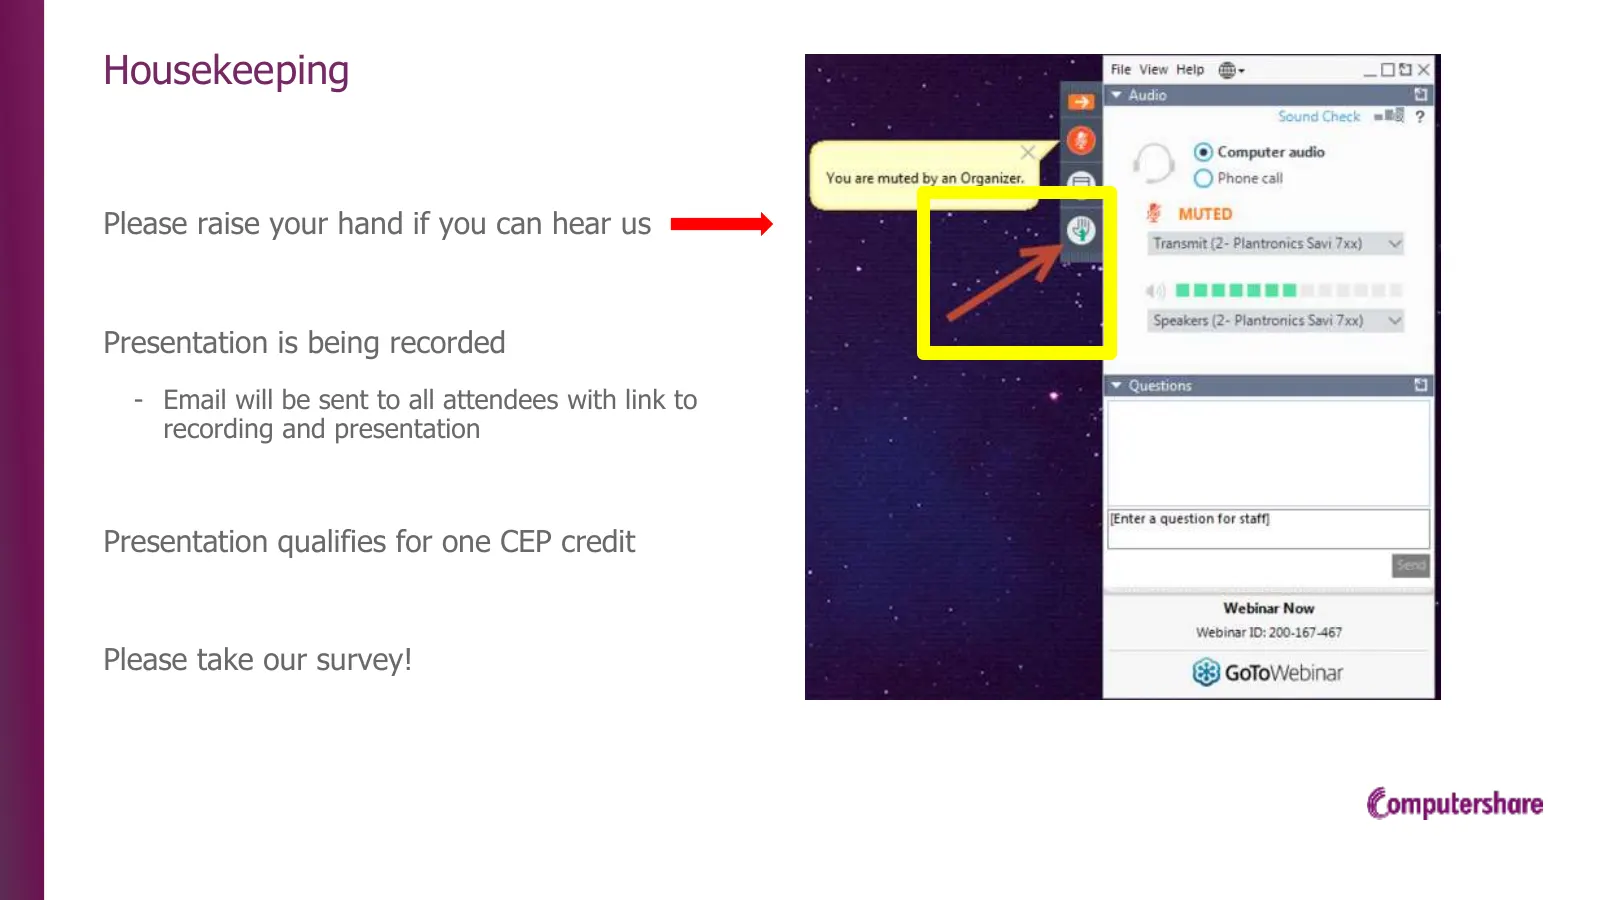
Housekeeping Please raise your hand if you can hear us Presentation is being recorded - Email will be sent to all attendees with link to recording and presentation Presentation qualifies for one CEP credit Please take our survey!
Slide 5: Introductions
Introductions Stuart Bailey, Associate Director, Business Development, Computershare UK Gabbi Stopp, Executive Director, ProShare
Slide 6: Agenda
Agenda • Introductions and Background • About this year’s report • Key findings for SAYE (20 minutes) • Key findings for SIP (20 minutes) • Q&A (15 minutes) • Thanks
Slide 7: About this year's report
About this year’s report What’s new? • Second year of gender-related breakdowns – so year-on-year comparison now possible • First year of sector-specific take-up and contribution levels on both SAYE and SIP – so you can now benchmark against industry peer averages
Slide 8: Scope of our report
Scope of our report Our report covers 447 companies operating SAYE (422 companies with live schemes), and 424 companies operating SIP, over the 2018 calendar year. HMRC’s latest share scheme statistics cover the 2017-18 tax year, for 330 SAYE and 460 SIP scheme returns (active schemes).
Slide 9: Key findings for SAYE
Key findings for SAYE ProShare
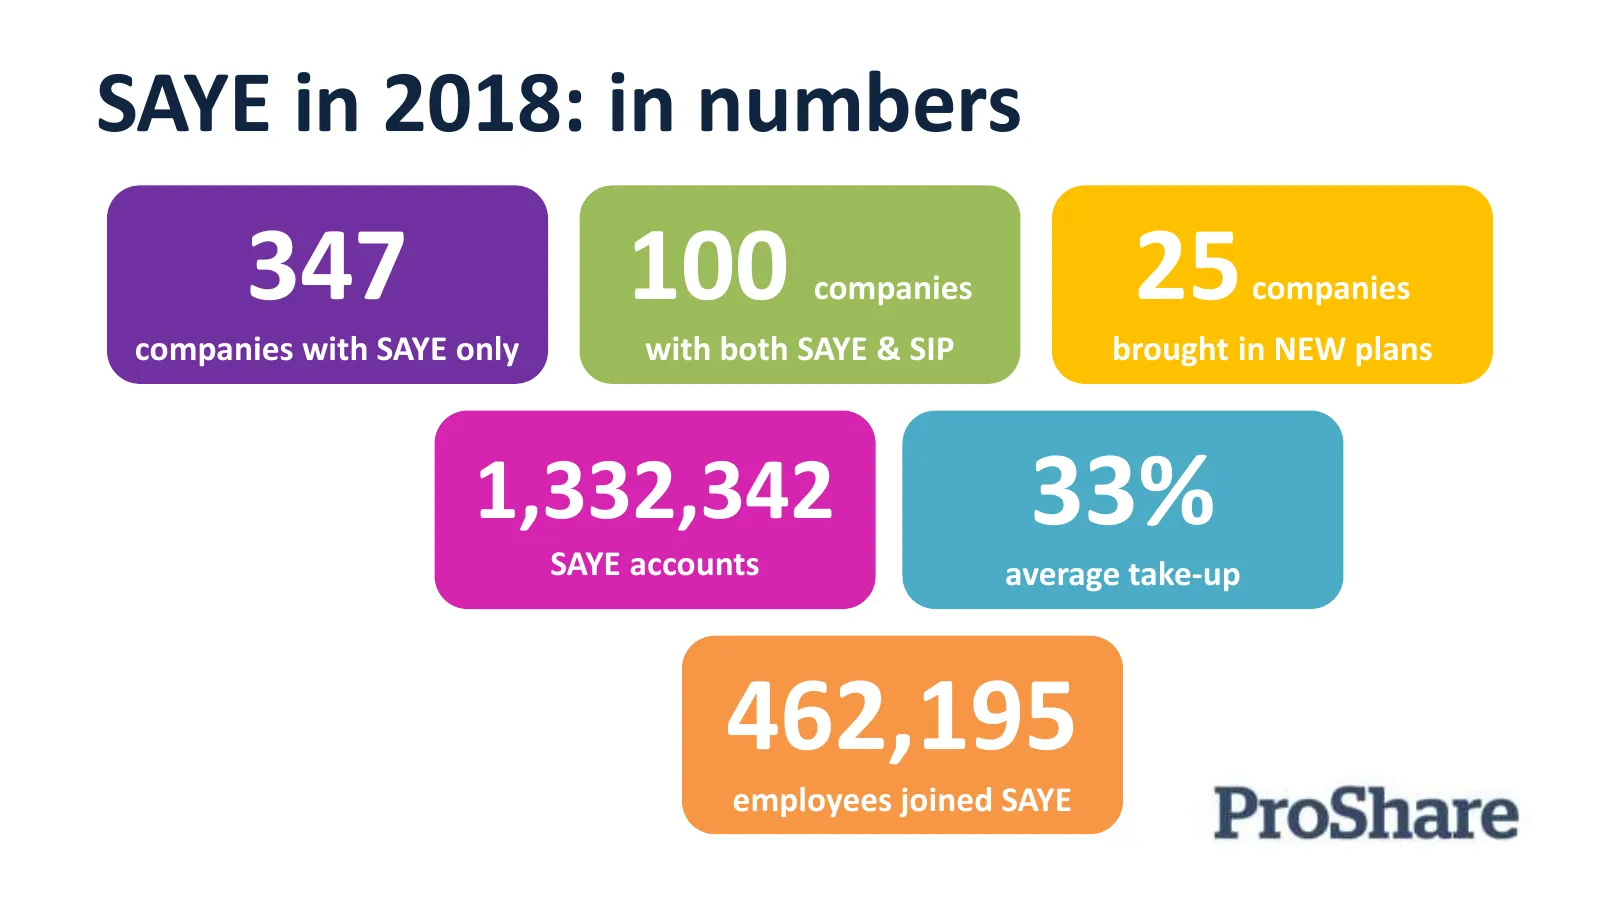
Slide 10: SAYE in 2018: in numbers
SAYE in 2018: in numbers 347 100 companies 25 companies companies with SAYE only with both SAYE & SIP brought in NEW plans 1,332,342 SAYE accounts 33% average take-up 462,195 employees joined SAYE
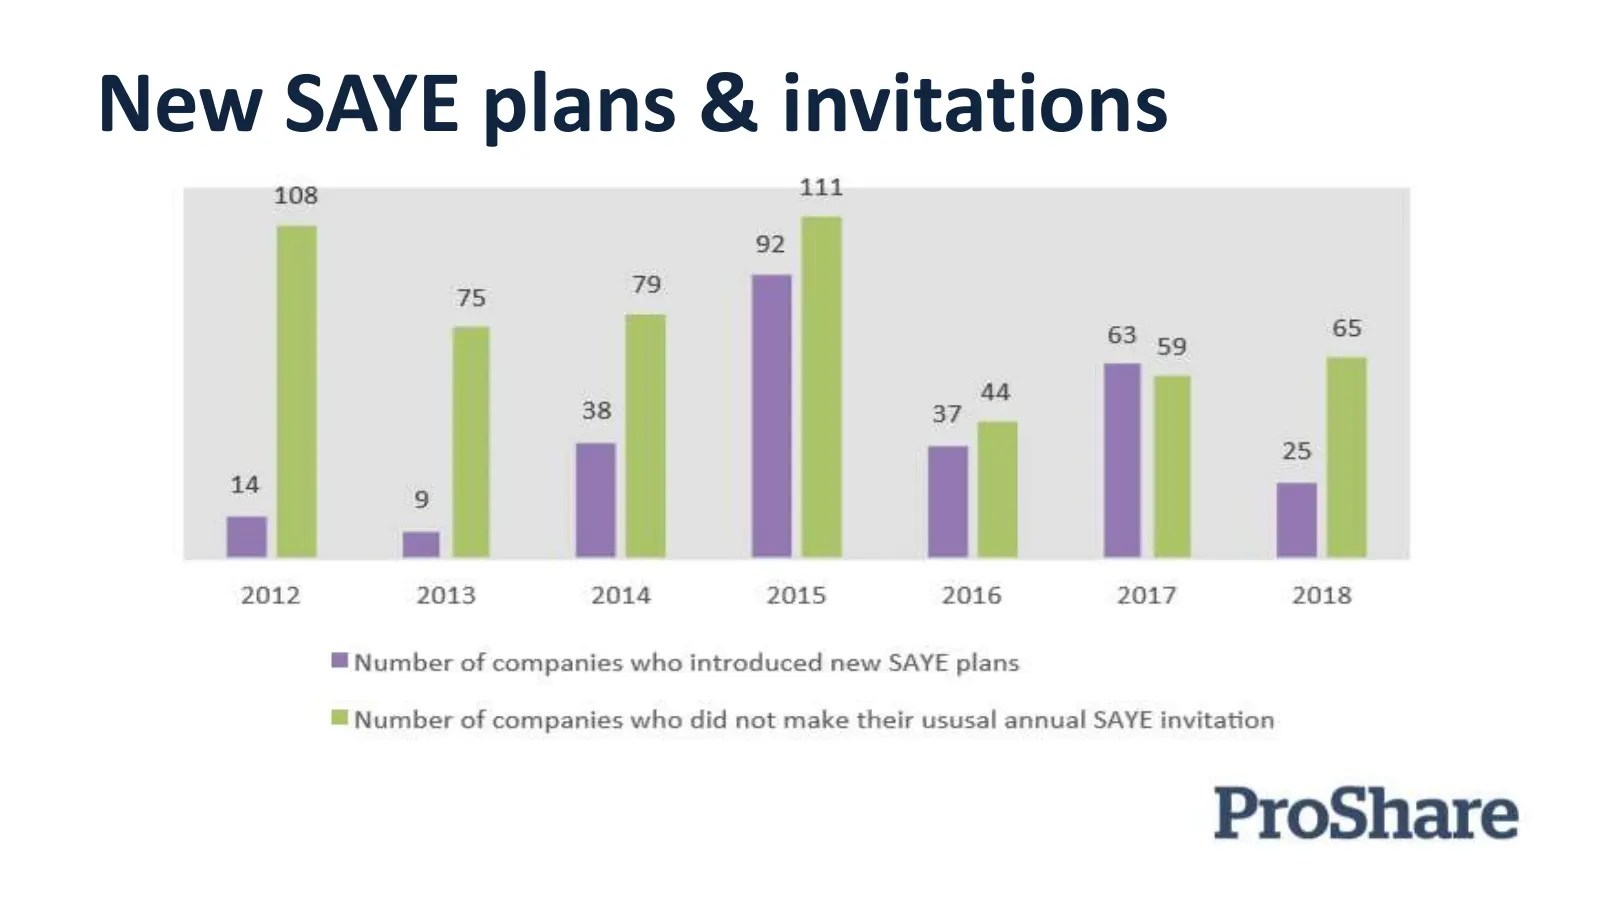
Slide 11: New SAYE plans & invitations
New SAYE plans & invitations 108 111 92 95 79 63 5g 38 i = 2012 2013 2014 2015 2016 2017 2018 @ Number of companies who introduced new SAYE plans ® Number of companies who did not make their ususal annual SAYE invitation ProShare
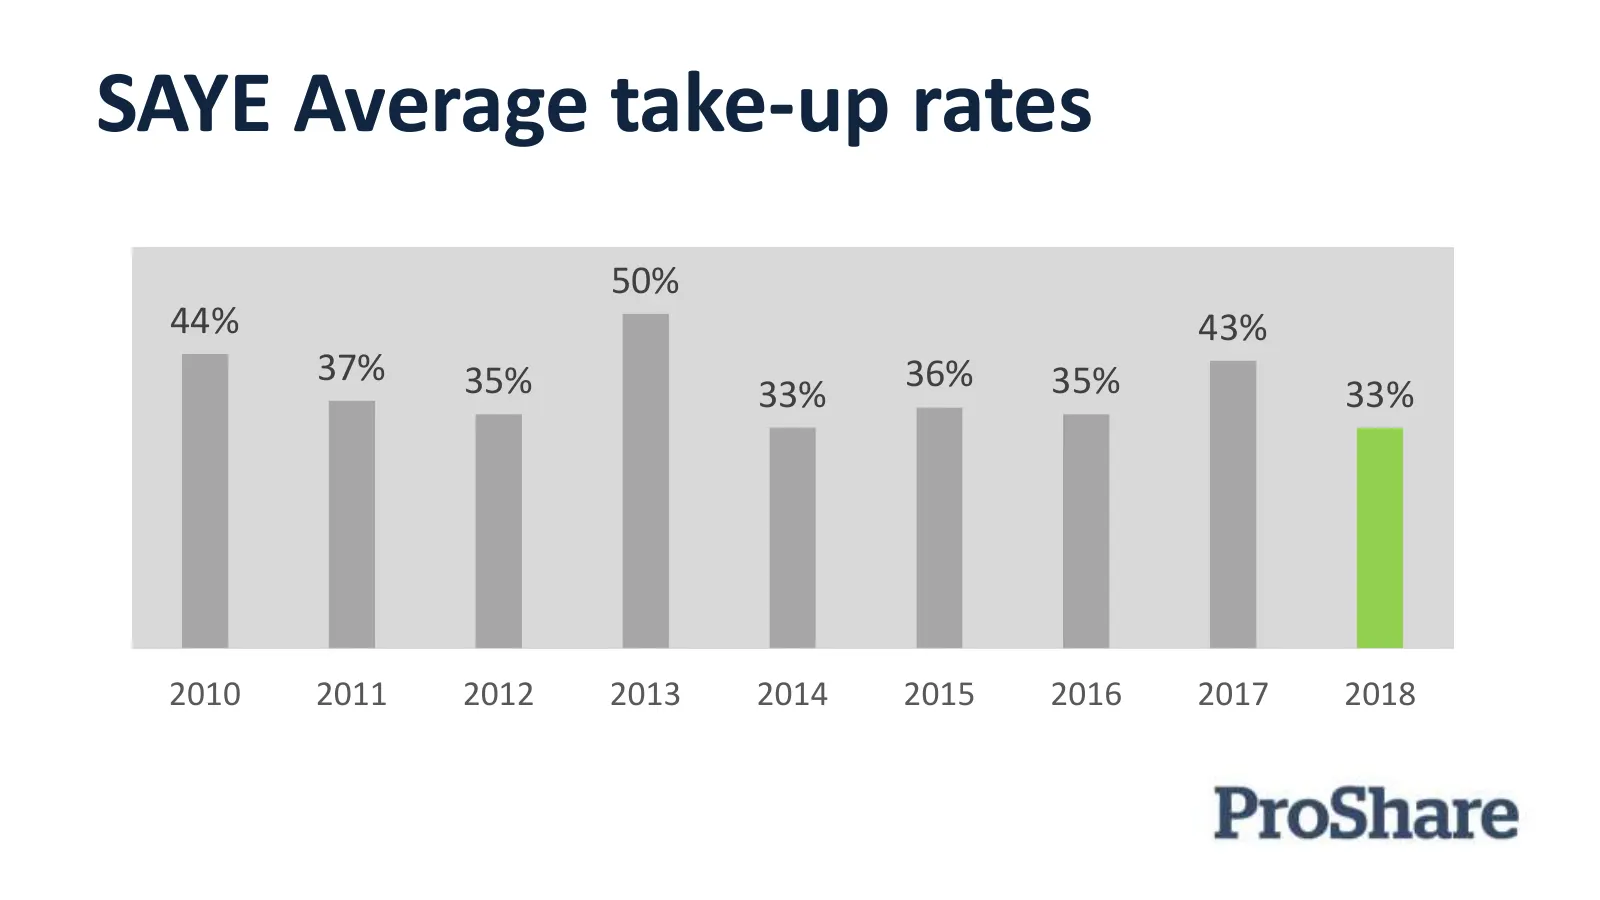
Slide 12: SAYE Average take-up rates
SAYE Average take-up rates 50% 44% 43% 37% 35% 36% 35% 33% 33% 2010 2011 2012 2013 2014 2015 2016 2017 2018
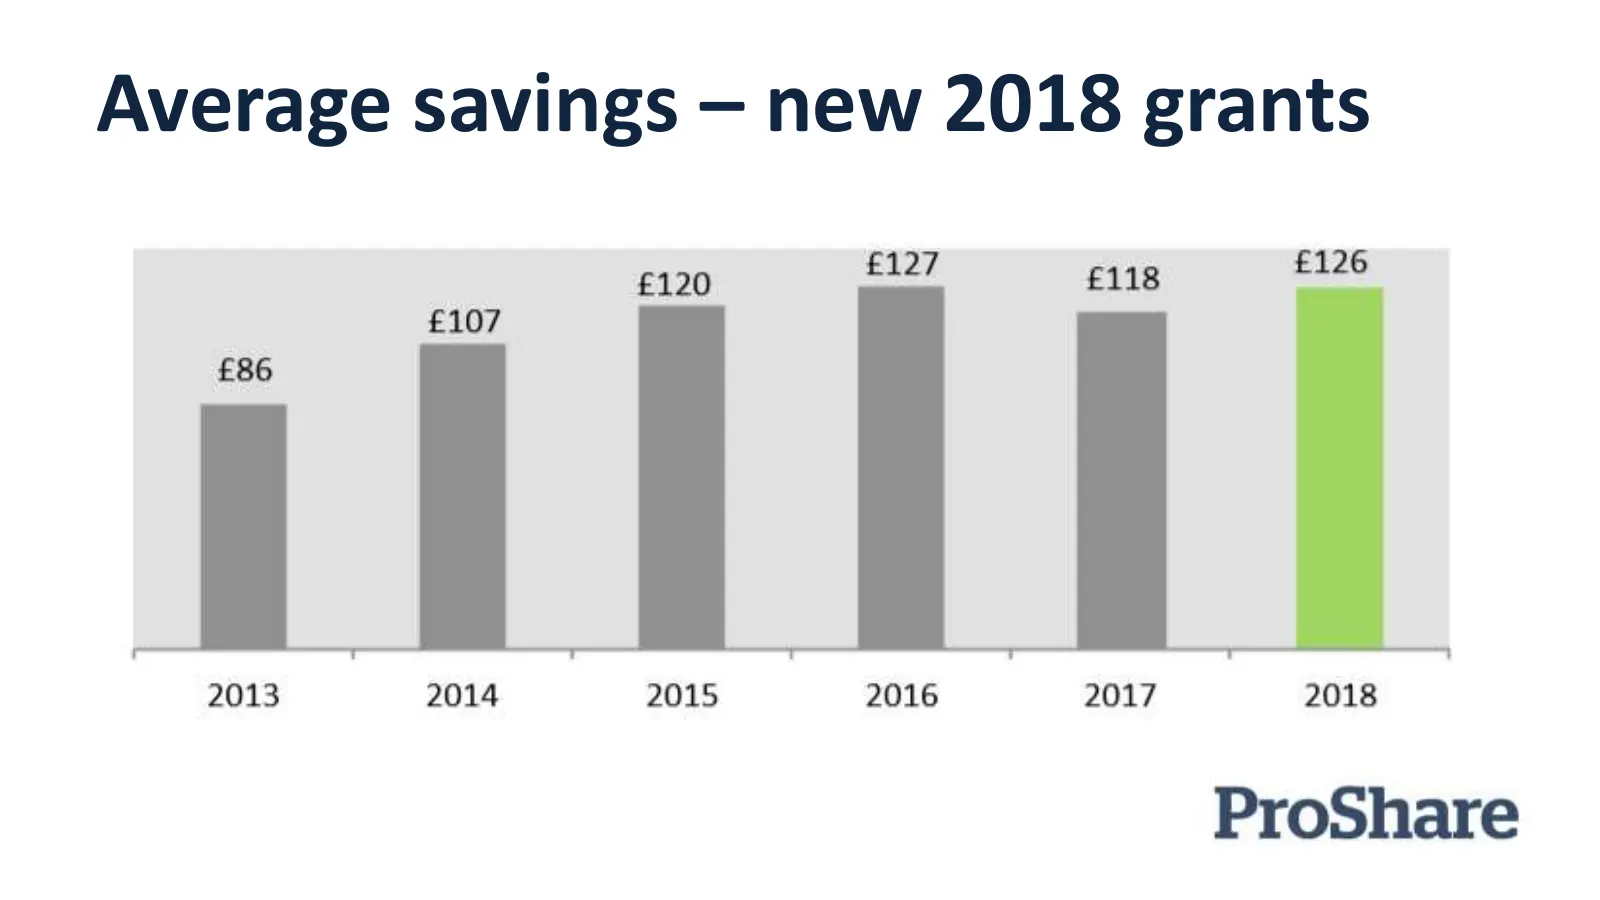
Slide 13: Average savings – new 2018 grants
Average savings – new 2018 grants
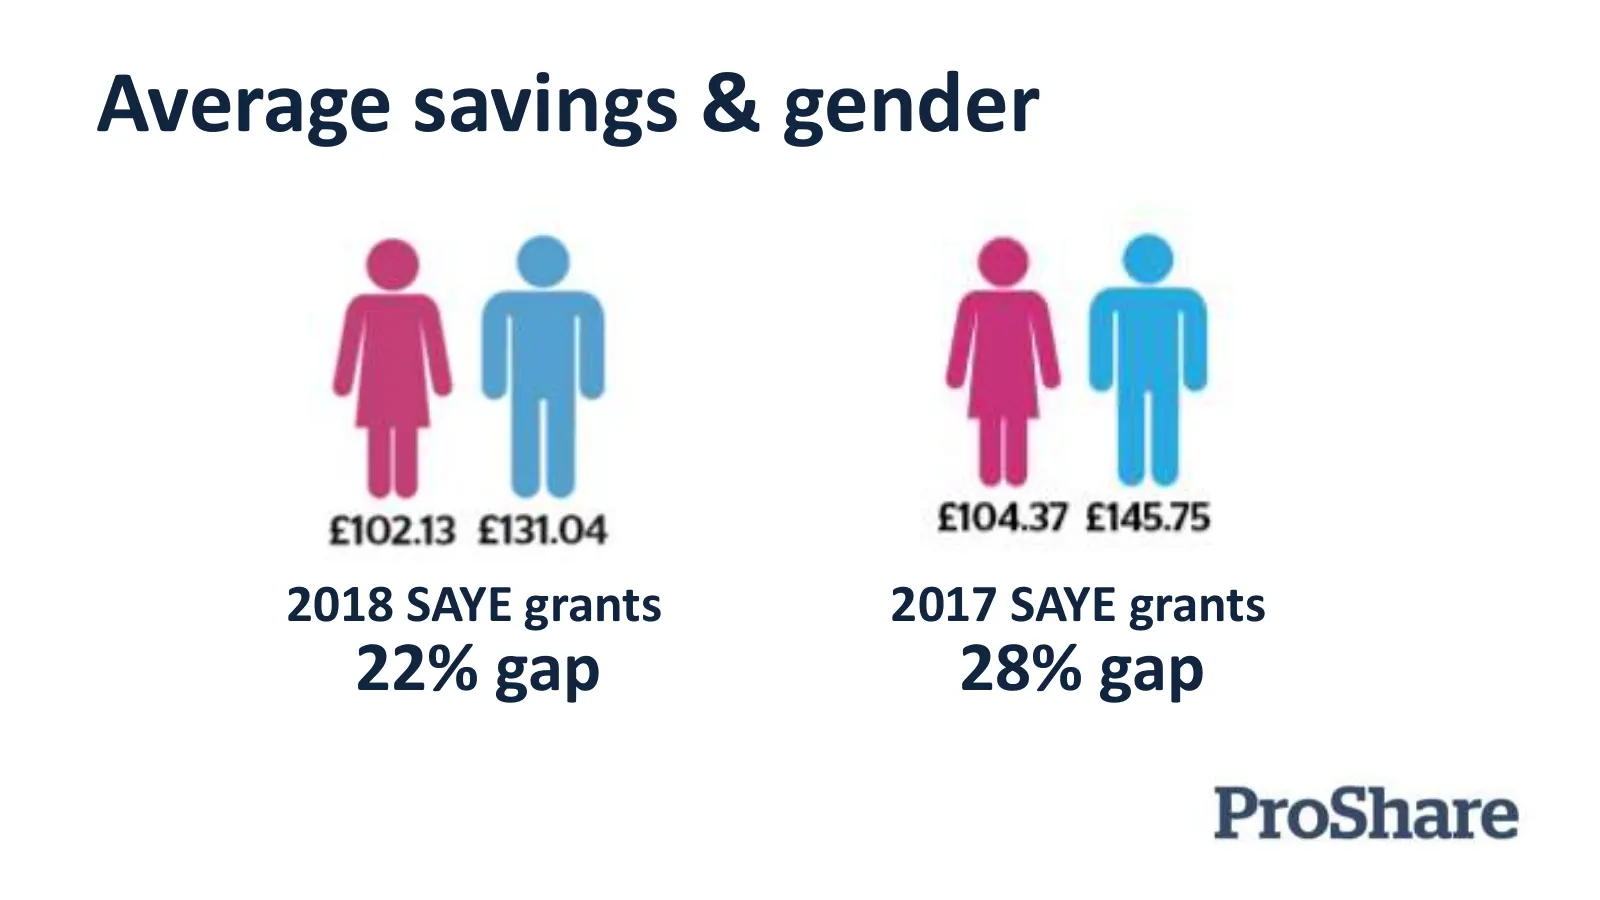
Slide 14: Average savings & gender
Average savings & gender 2018 SAYE grants 2017 SAYE grants 22% gap 28% gap
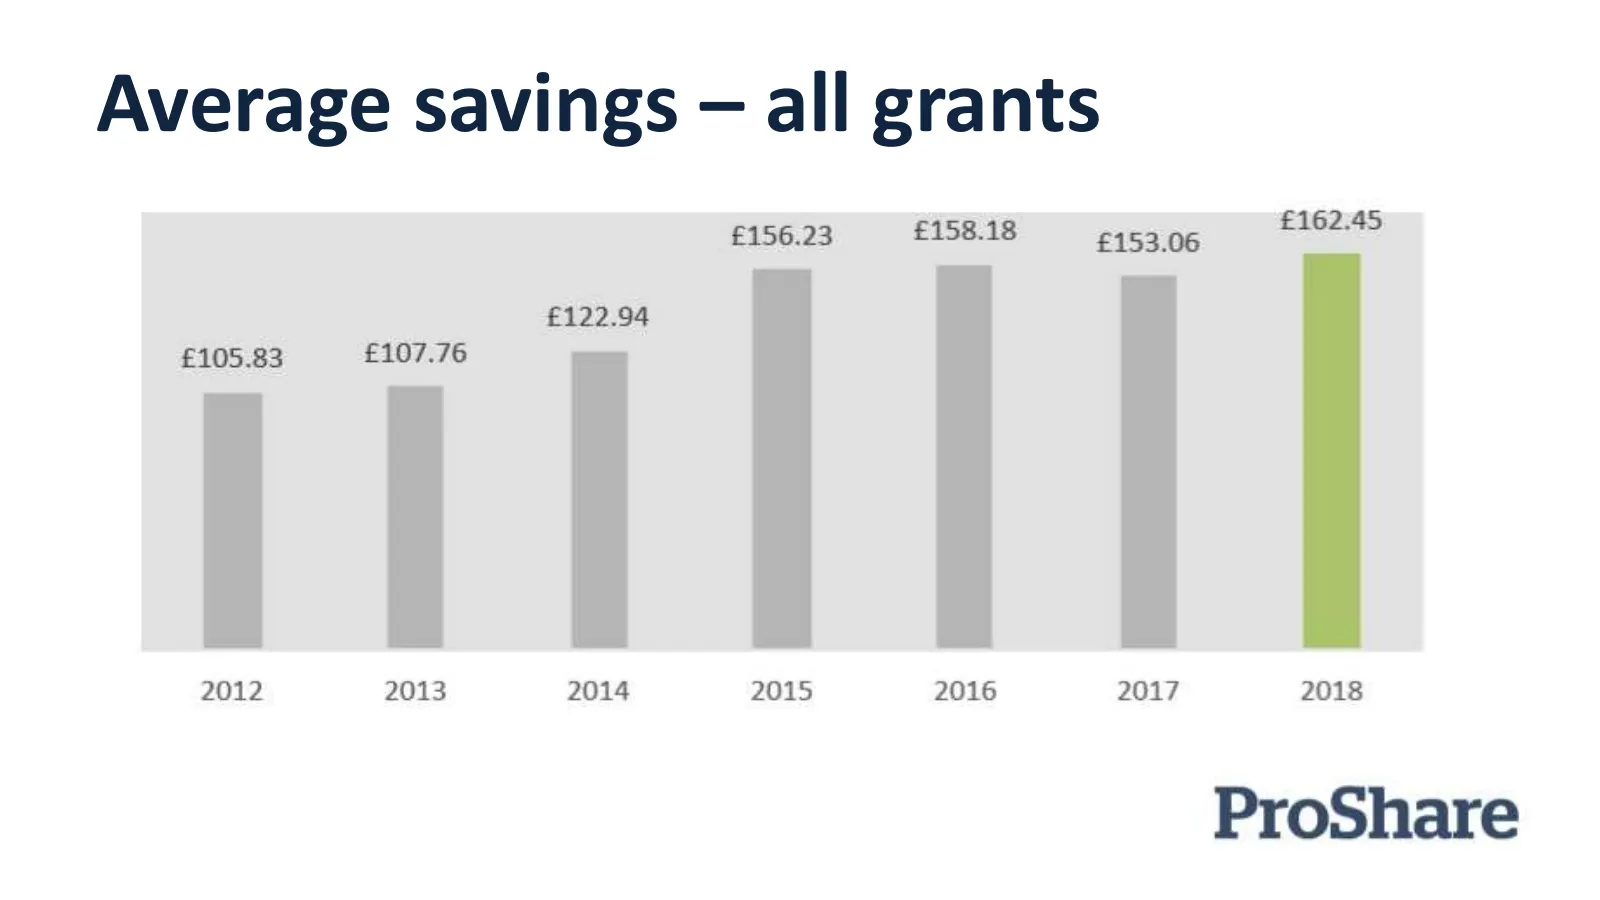
Slide 15: Average savings – all grants
Average savings — all grants £162.45 £158.18 £153.06 £122.94 £105.83 £107.76 | 2012 2013 2014 2015 2016 2017 2018 ProShare
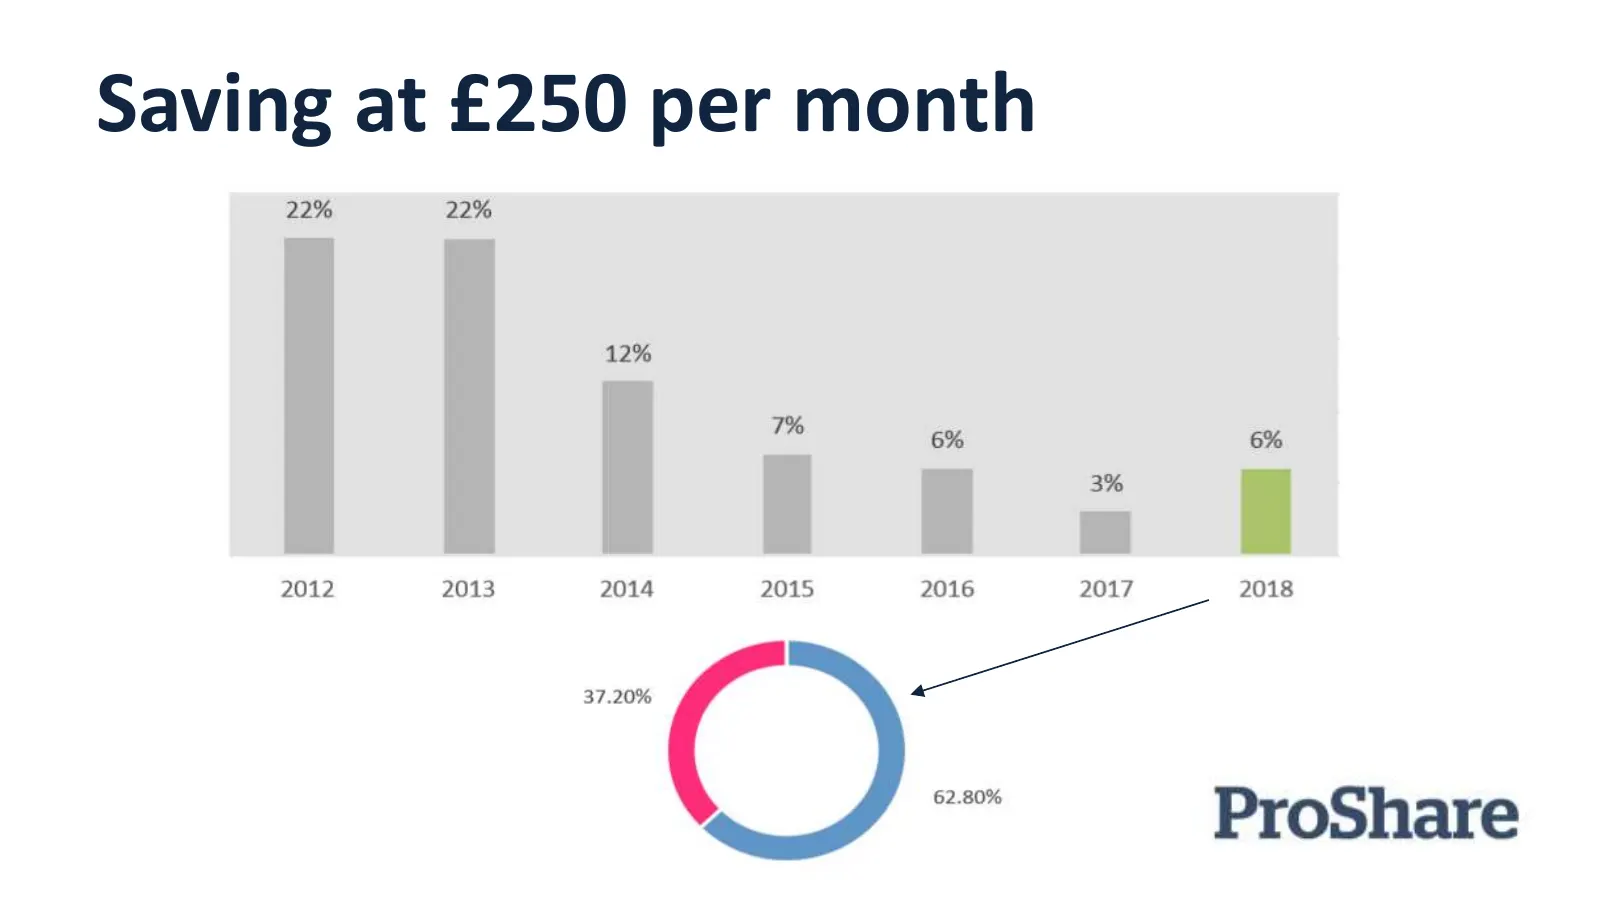
Slide 16: Saving at £250 per month
Saving at £250 per month | | lia: i O-- ProShare
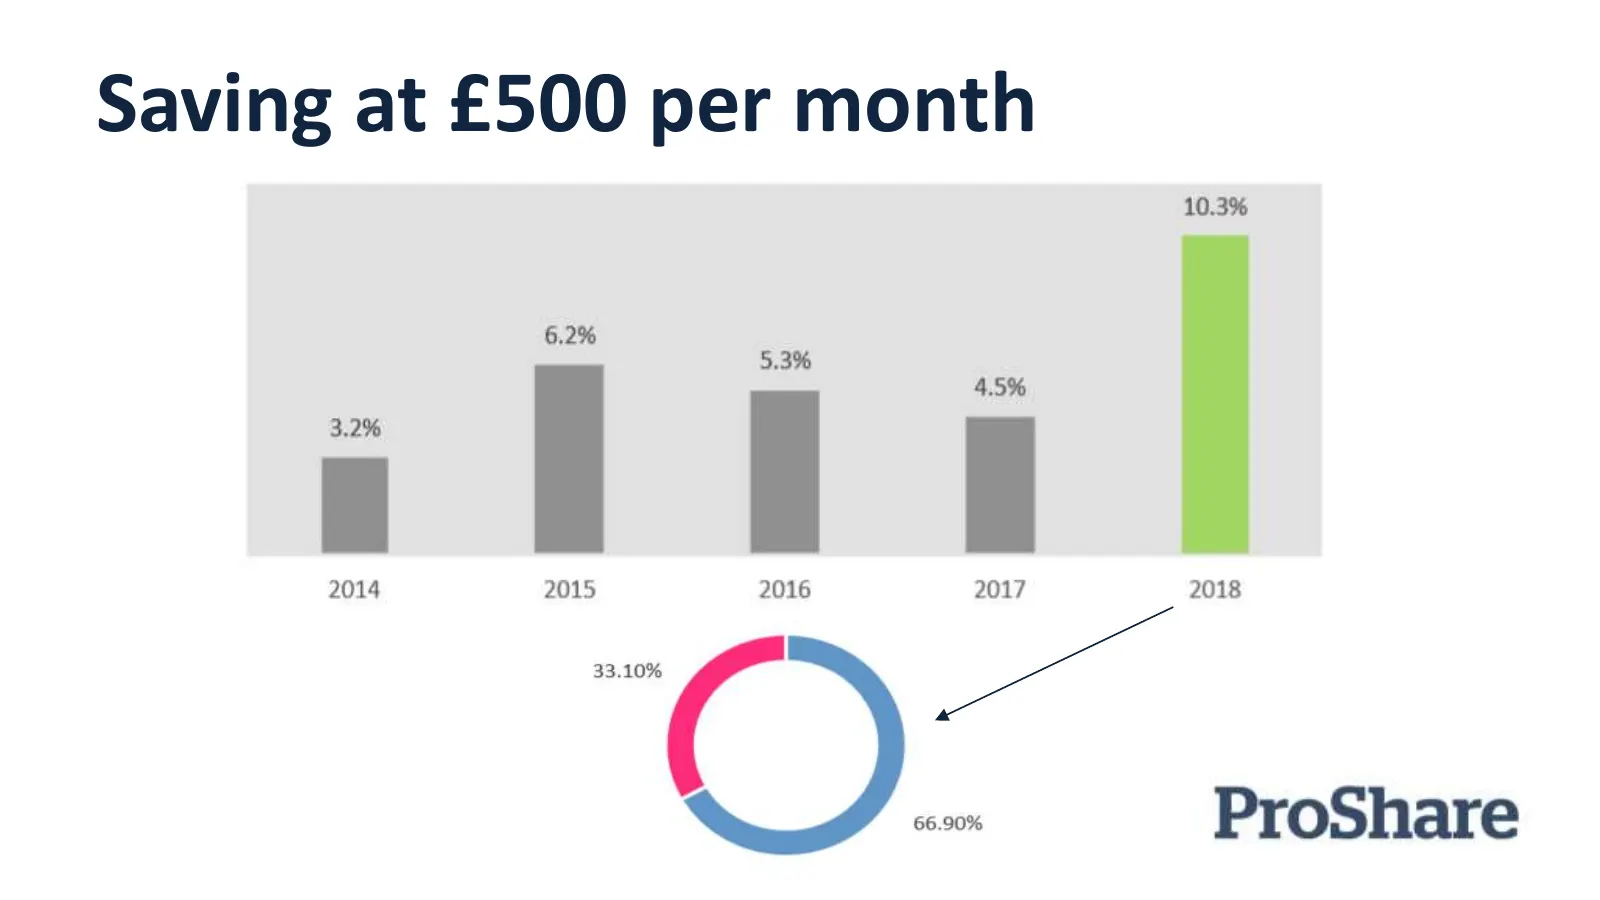
Slide 17: Saving at £500 per month
Saving at £500 per month 10.3% si : 7 2014 2015 2016 a 2018 O- so ProShare
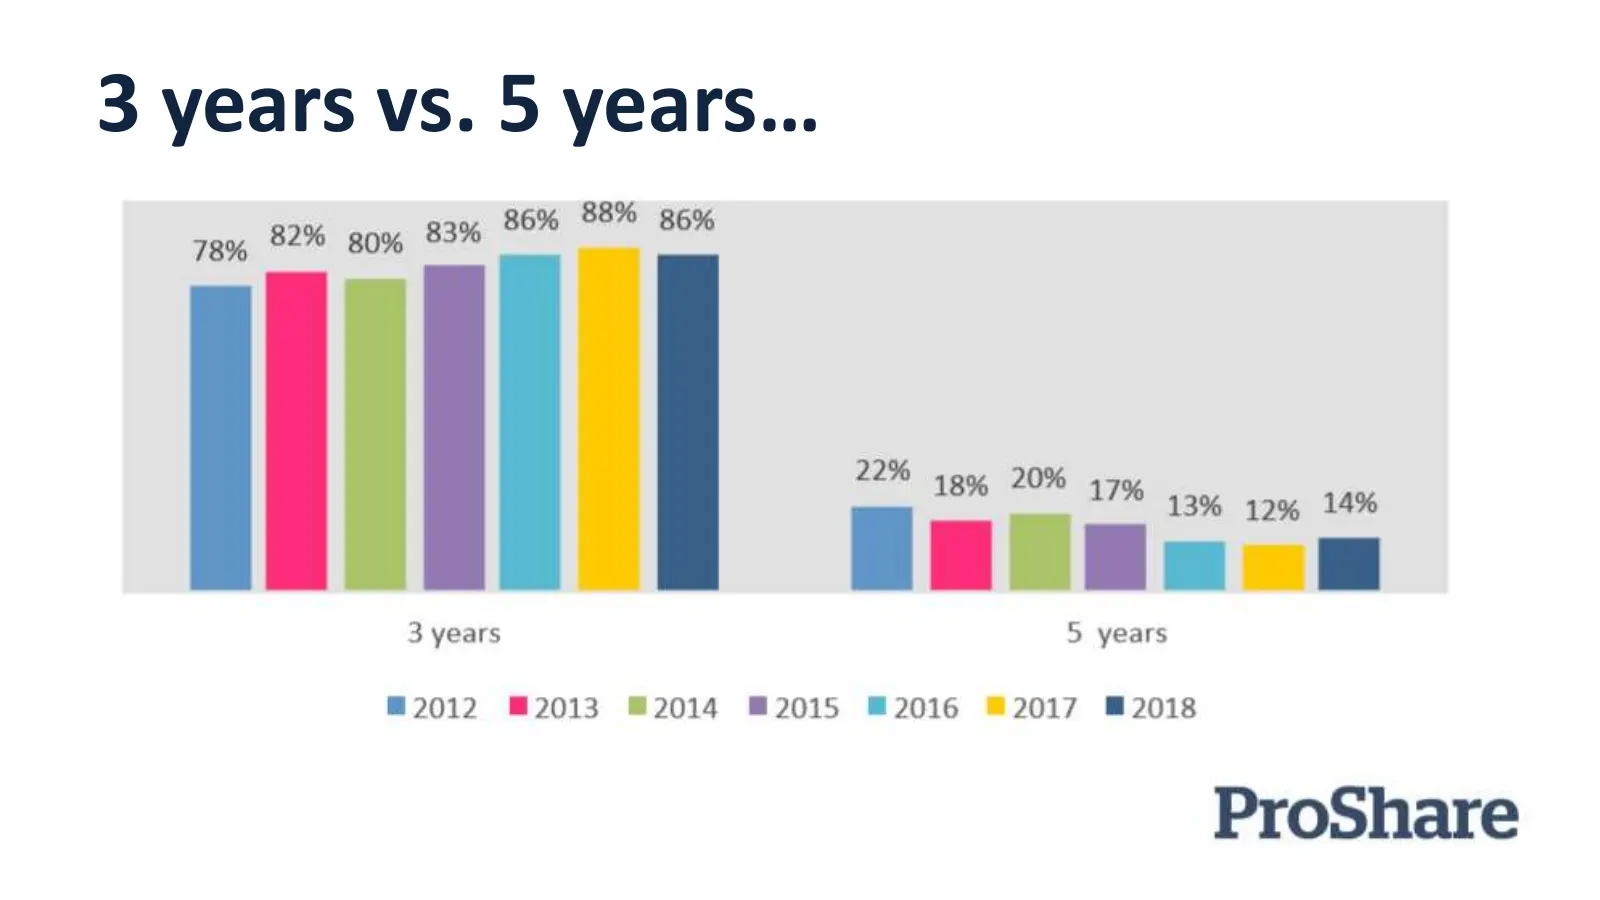
Slide 18: 3 years vs. 5 years
3 years vs. 5 years... 88% 82% go% 83% 86% = Wi ee 13% 12% 14% Ballann 3 years 5 years 78% 2012 ©2013 @2014 @2015 2016 2017 2018 ProShare
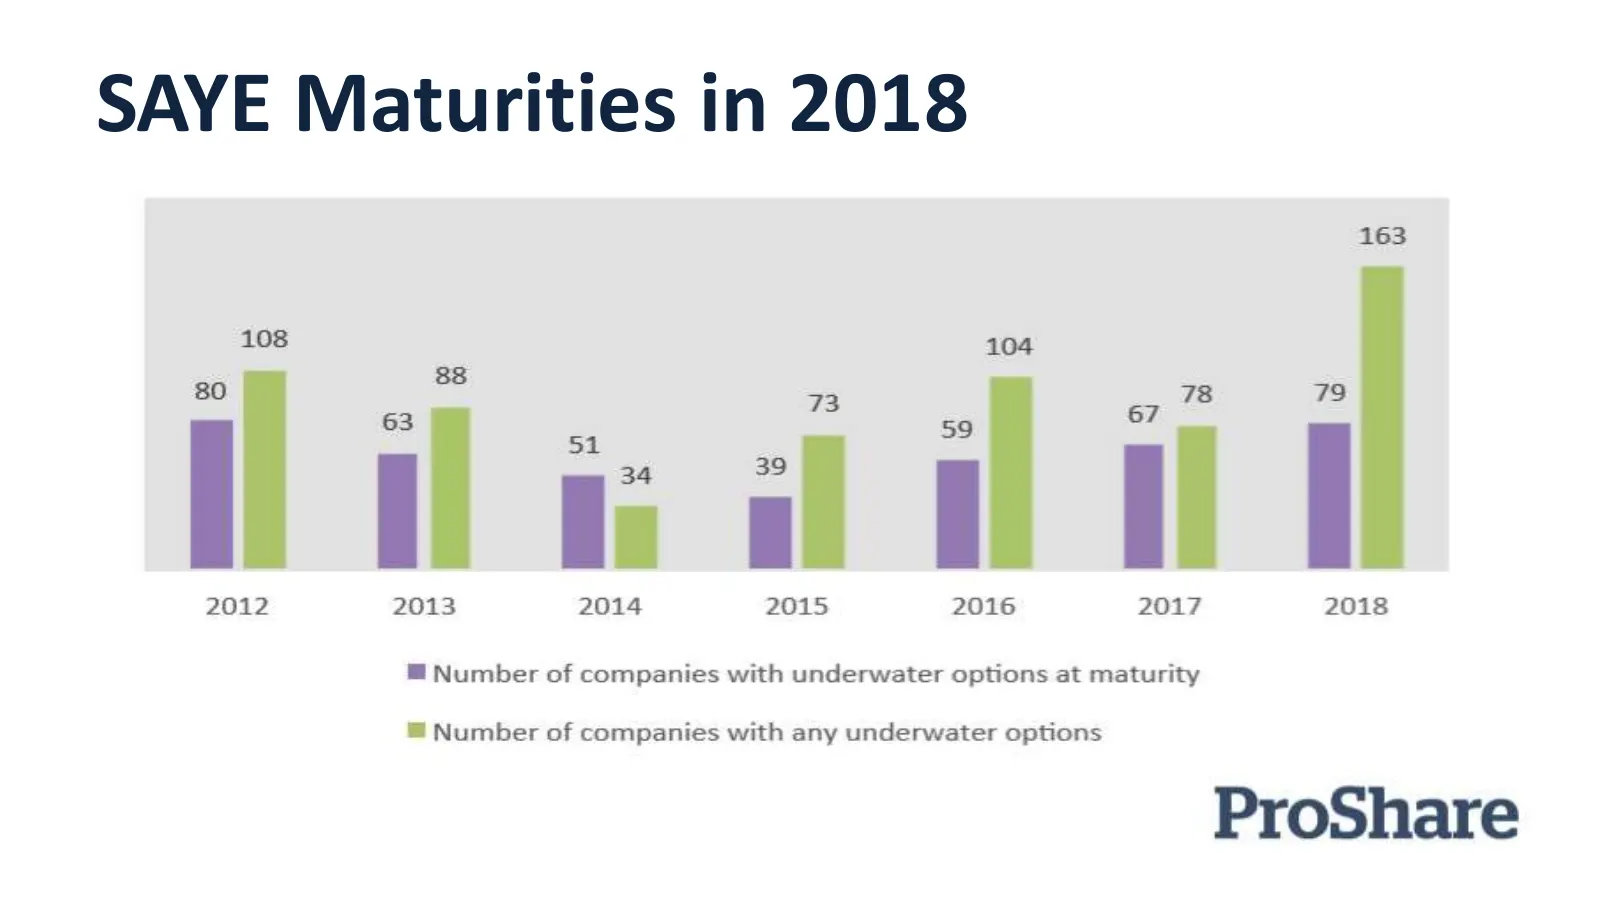
Slide 19: SAYE Maturities in 2018
SAYE Maturities in 2018 163 108 104 80 ee 78 73 63 73 67 51 59 |] ll : ll il 2012 2013 2014 2015 2016 2017 2018 @ Number of companies with underwater options at maturity ® Number of companies with any underwater options ProShare
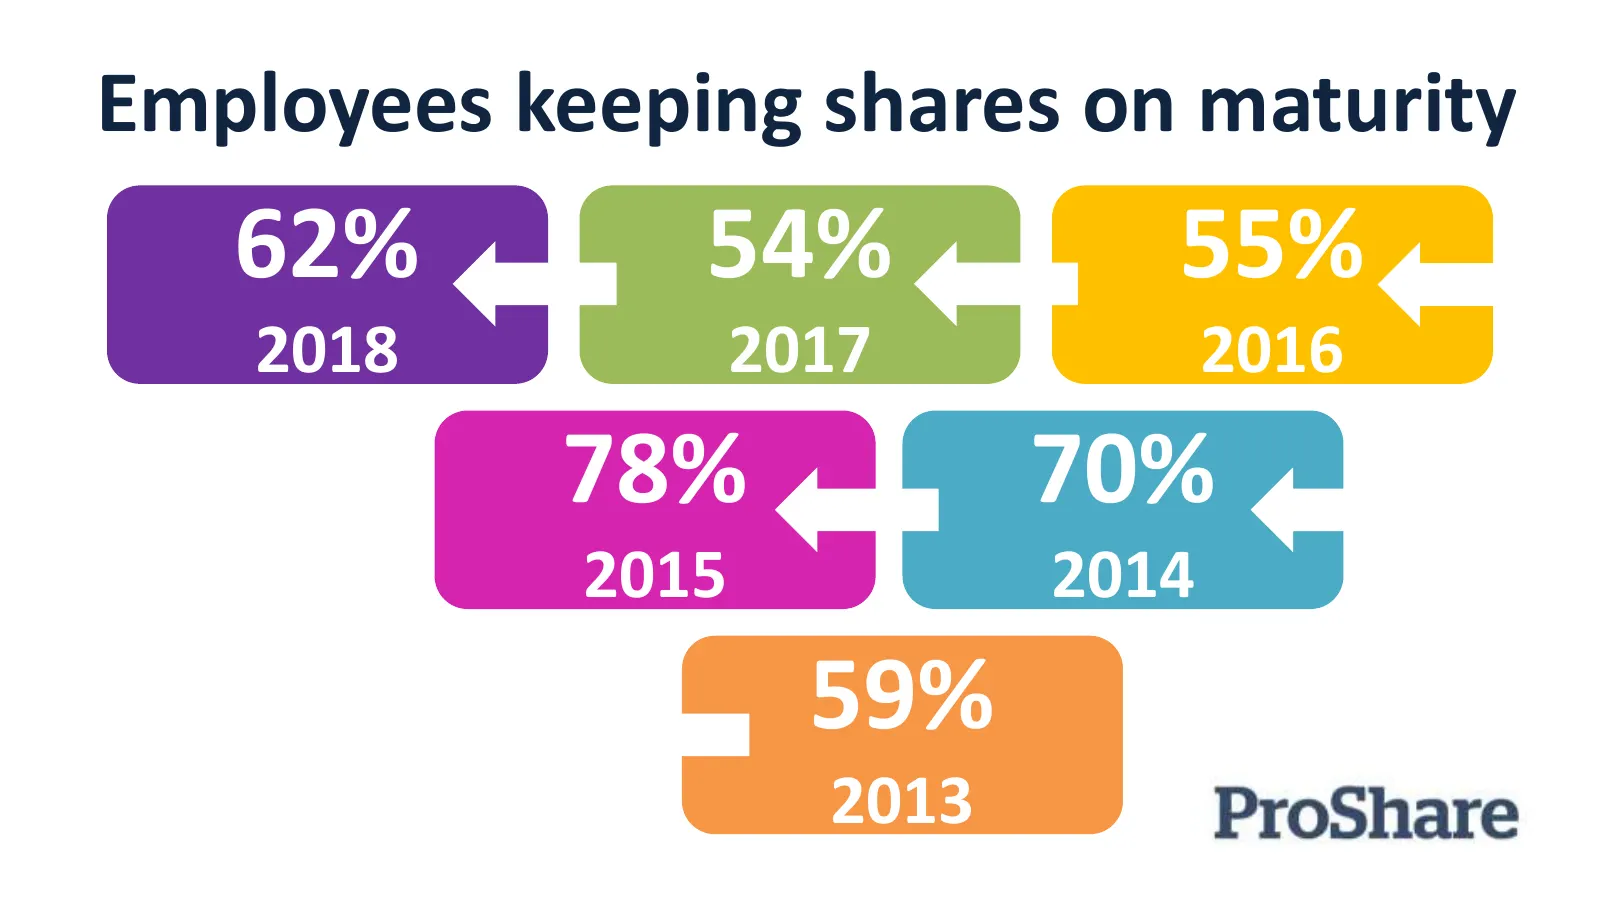
Slide 20: Employees keeping shares on maturity
Employees keeping shares on maturity 62% 54% 55% 2018 2017 2016 78% 70% 2015 2014 59% 2013
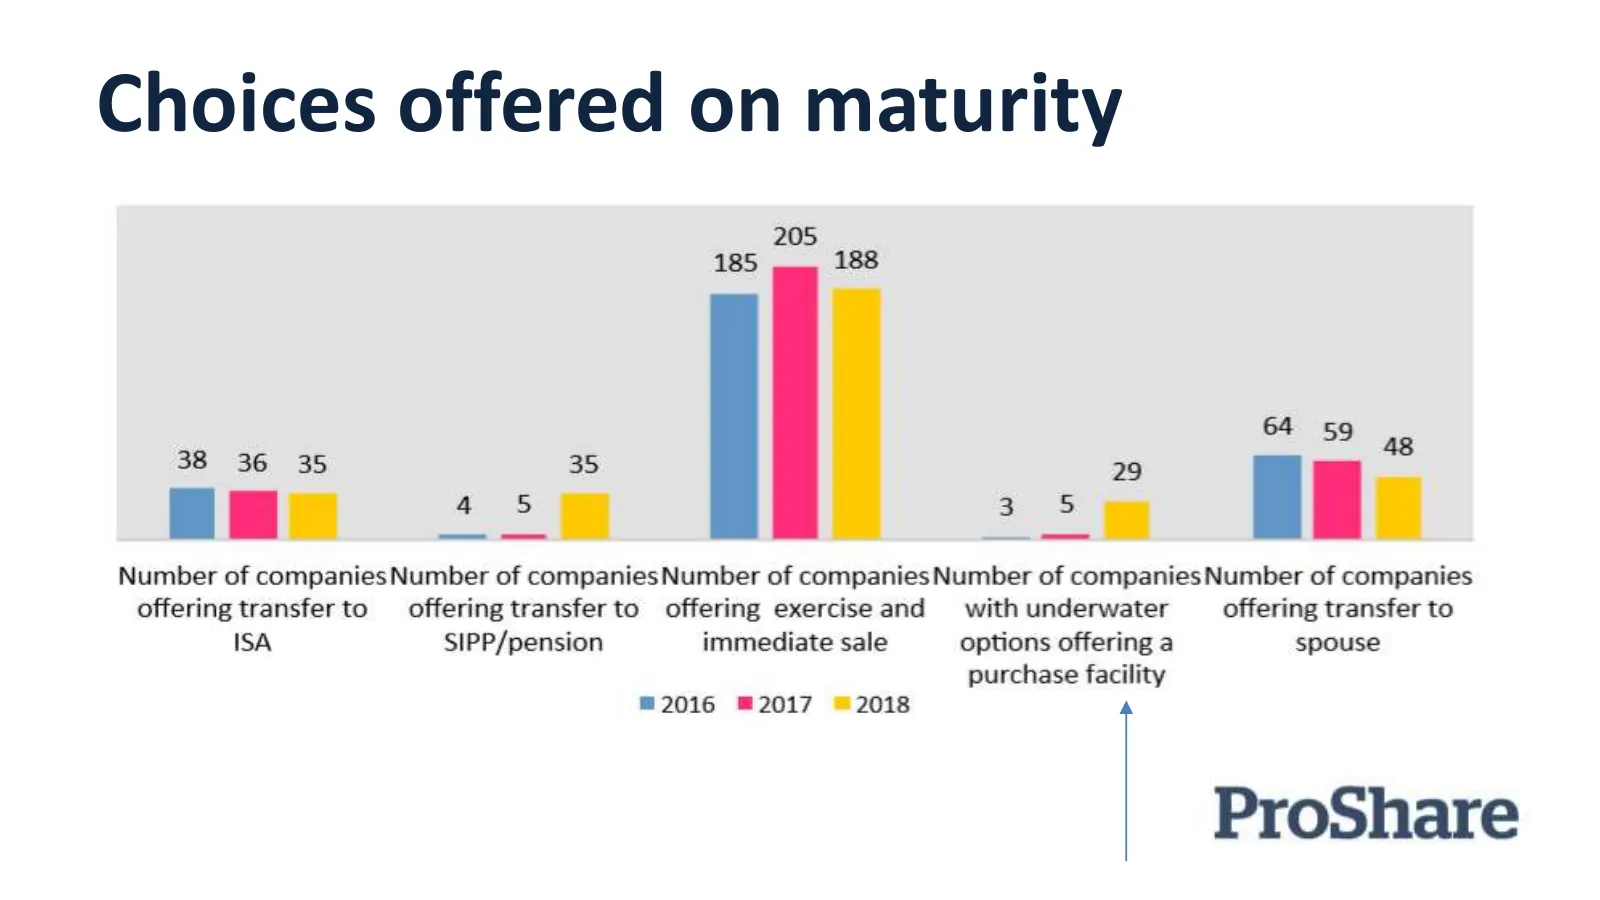
Slide 21: Choices offered on maturity
Choices offered on maturity 205 185 188 64 59 38 36 35 35 29 “8 “T | .se [ea Number of companies Number of companiesNumber of companies Number of companies Number of companies offering transfer to offeringtransferto offering exercise and with underwater offering transfer to ISA SIPP/pension immediat
Slide 22: Key findings for SIP
Key findings for SIP ProShare
Slide 23: SIPs offered in 2018
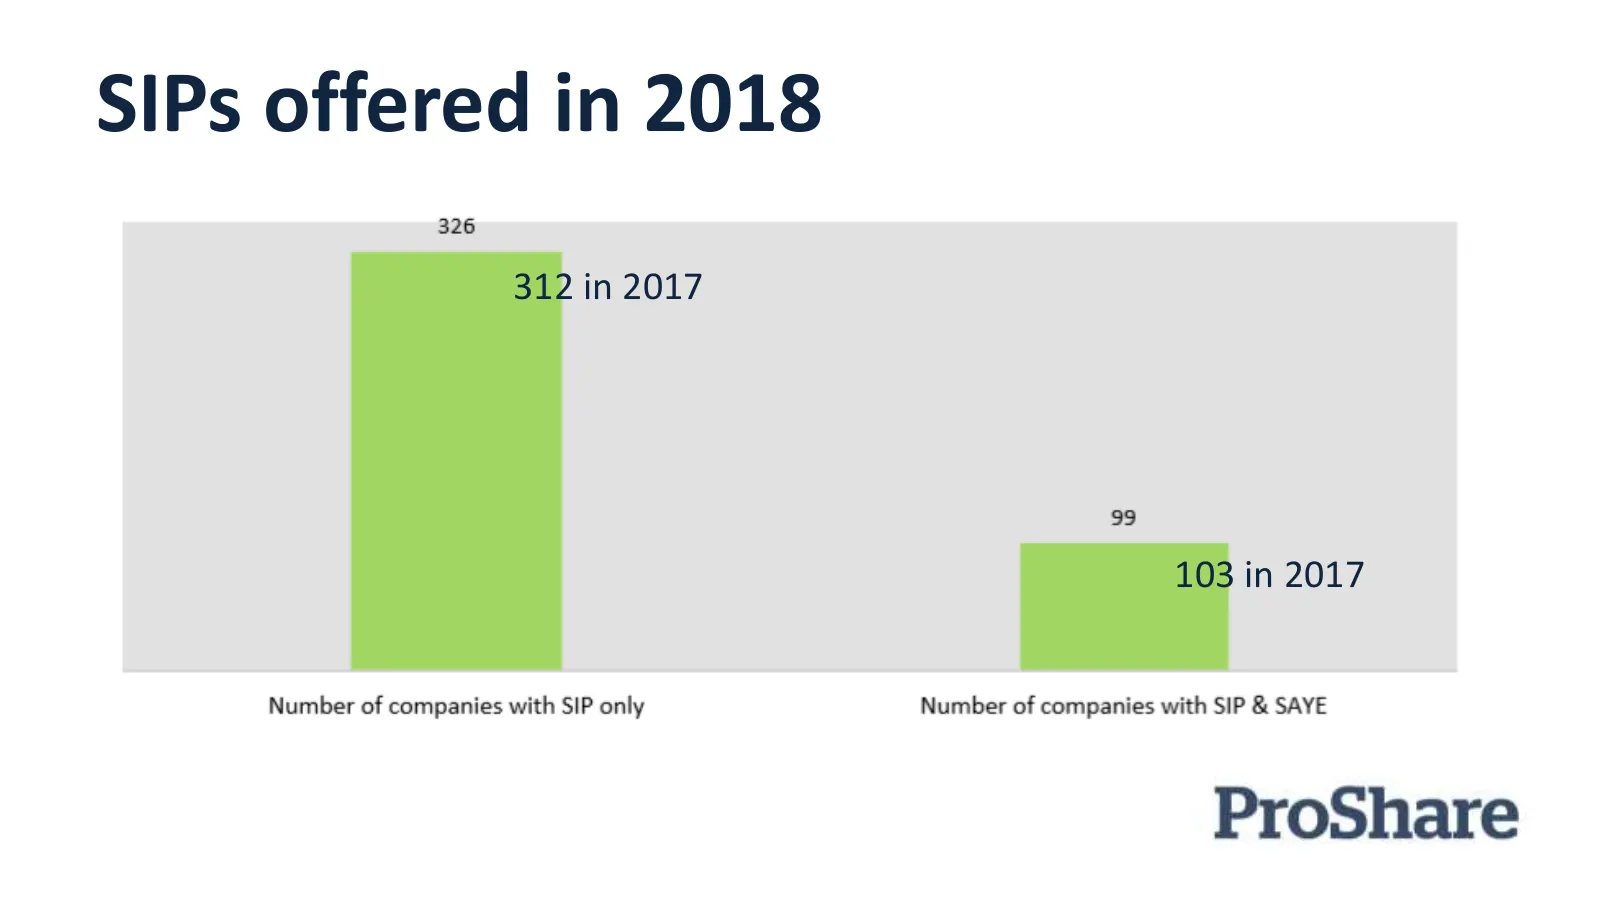
SIPs offered in 2018 312 in 2017 103 in 2017
Slide 24: Types of shares offered
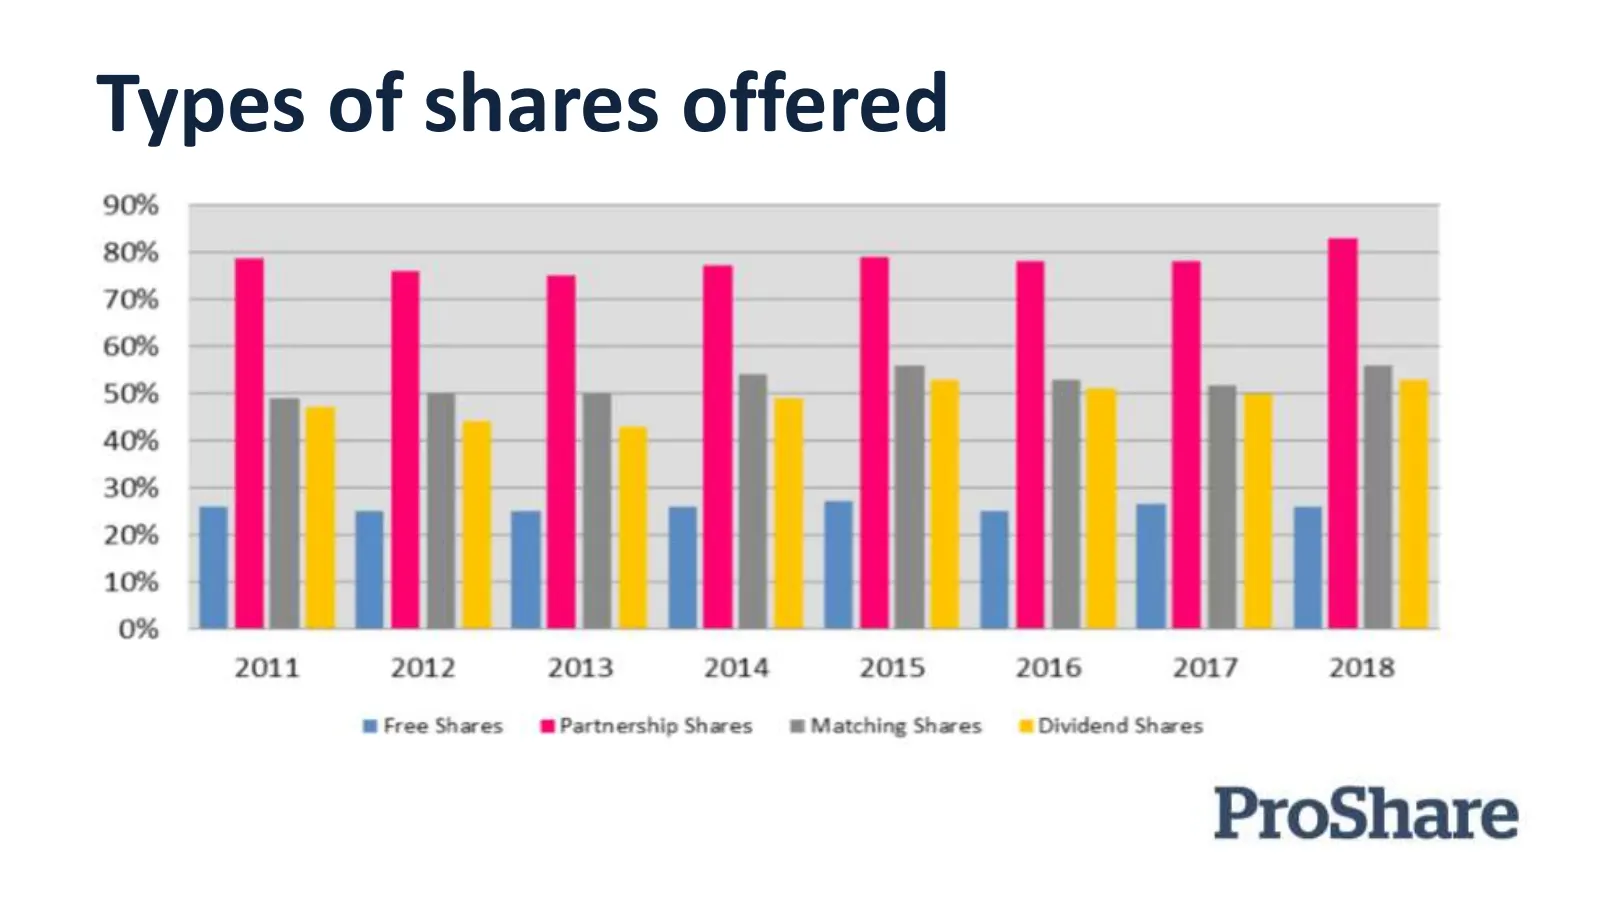
Types of shares offered 90% 80% 70% 60% 50% 40% - 30% - 20% 10% 0% 2011 2012 2013 2014 2015 2016 2017 2018 @Free Shares PartnershipShares &MatchingShares © Dividend Shares ProShare
Slide 25: Combinations of shares offered
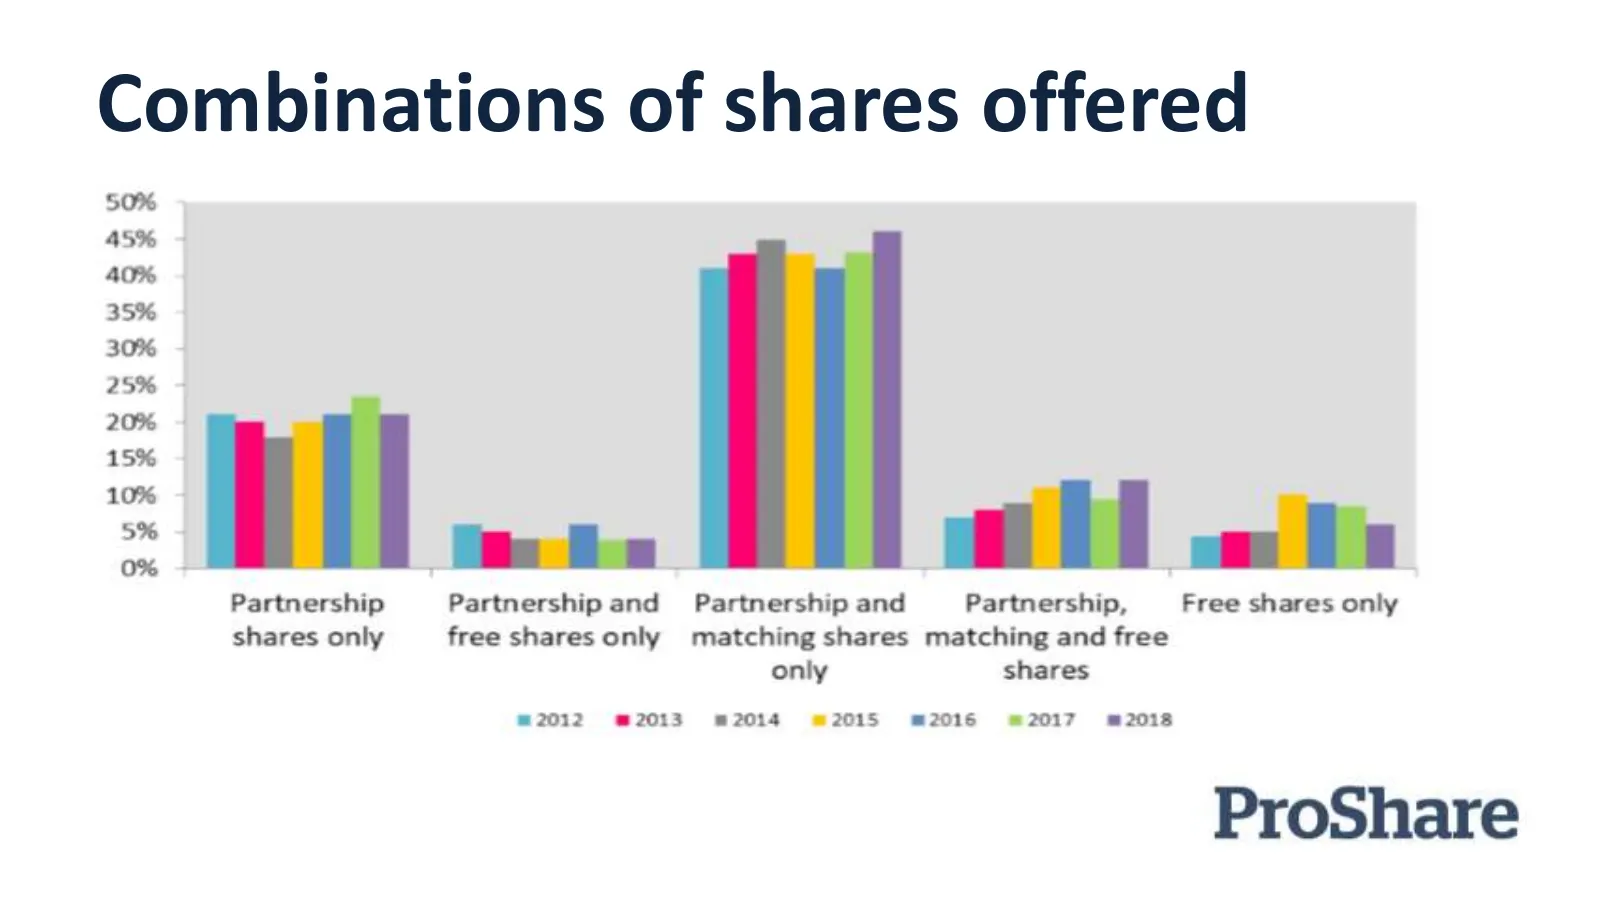
Combinations of shares offered
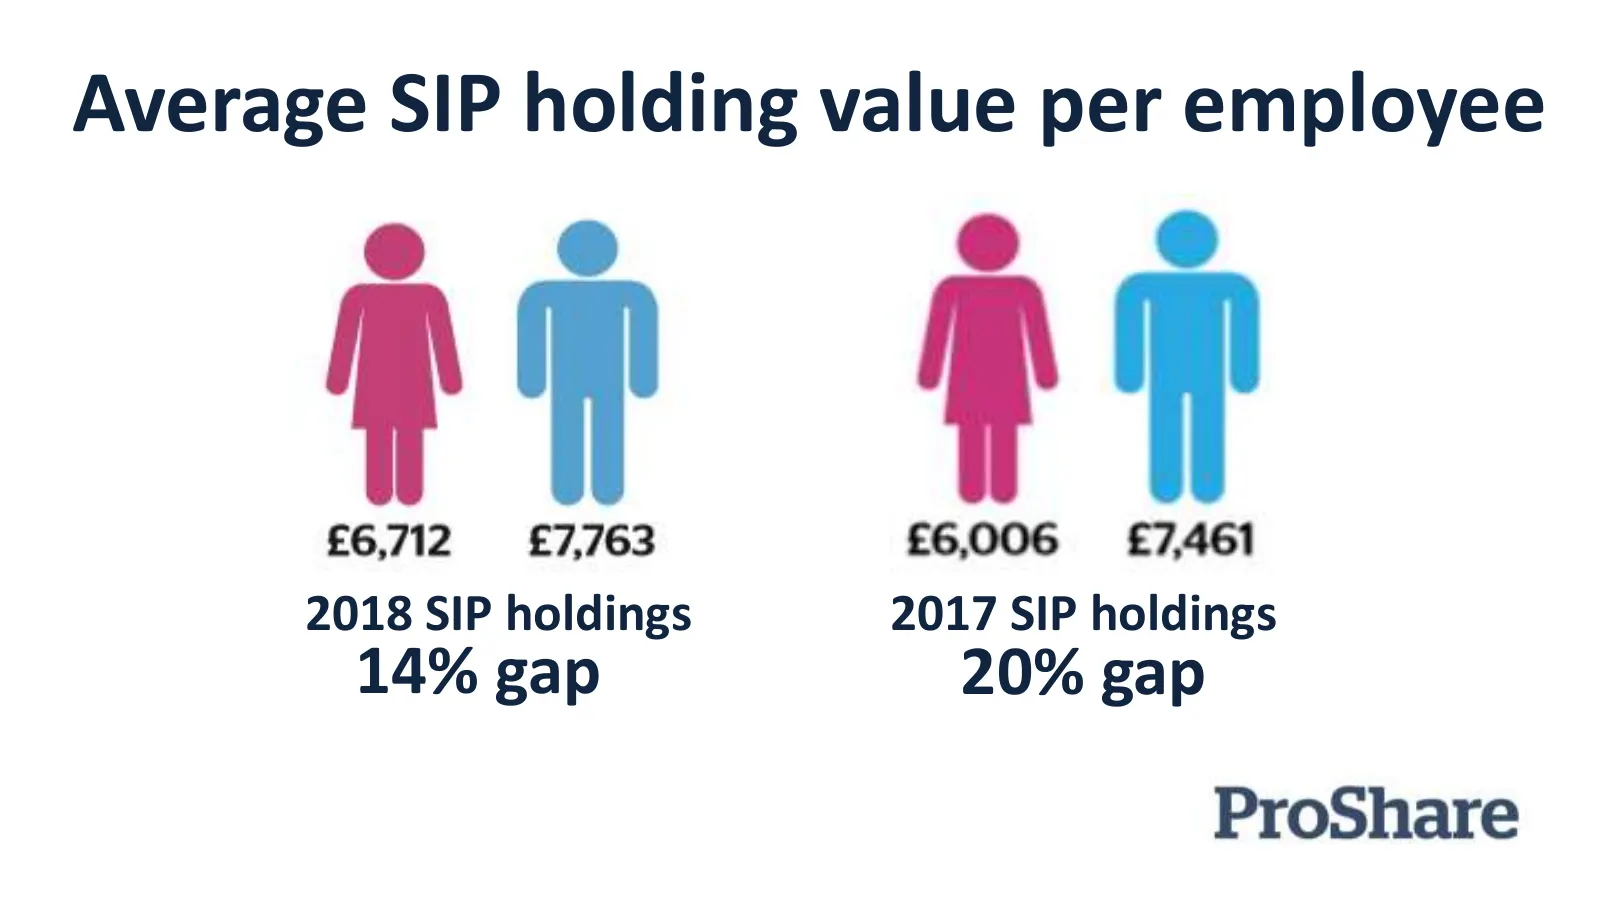
Slide 26: Average SIP holding value per employee
Average SIP holding value per employee 2018 SIP holdings 2017 SIP holdings 14% gap 20% gap
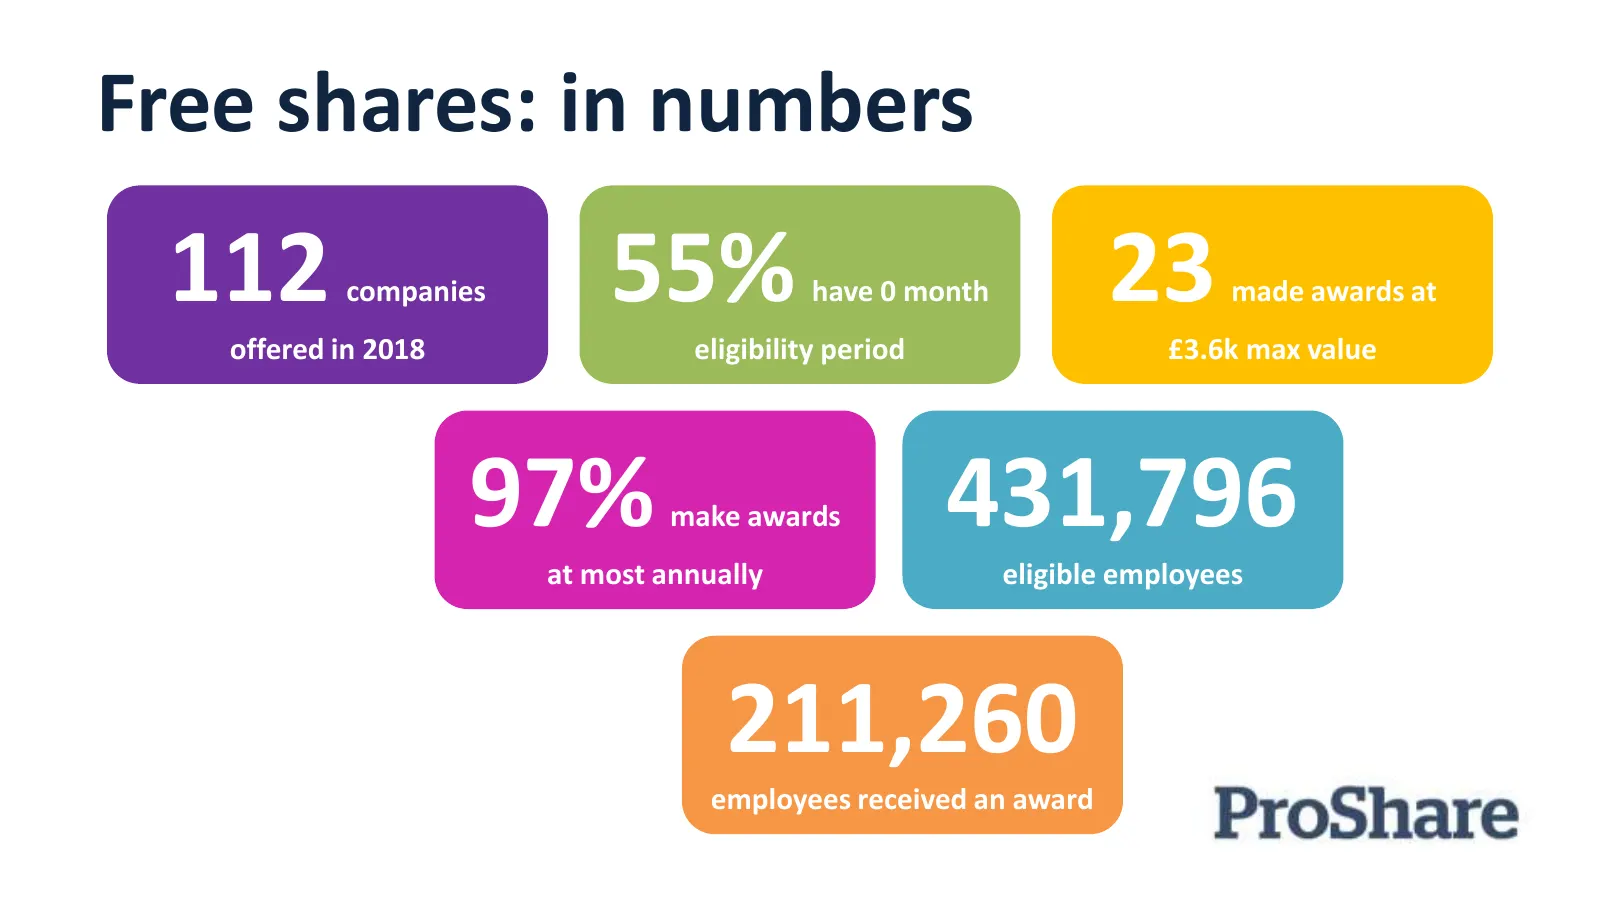
Slide 27: Free shares: in numbers
Free shares: in numbers 112 companies 55% have 0 month 23 made awards at offered in 2018 eligibility period £3.6k max value 97% make awards 431,796 at most annually eligible employees 211,260 employees received an award
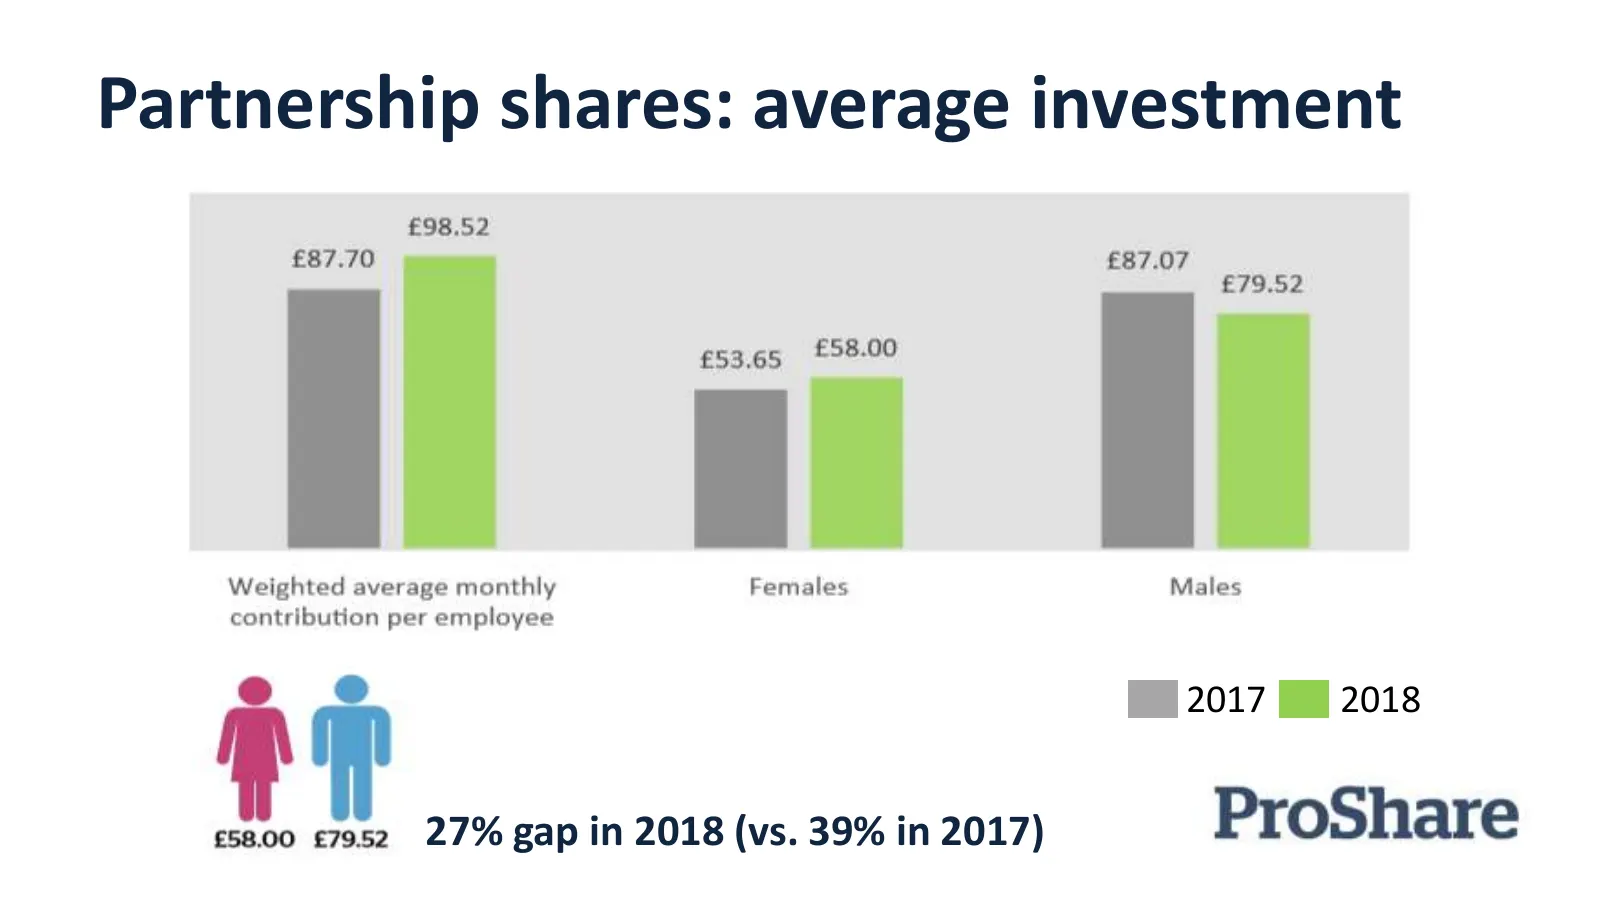
Slide 28: Partnership shares: average investment
Partnership shares: average investment 2017 2018 27% gap in 2018 (vs. 39% in 2017)
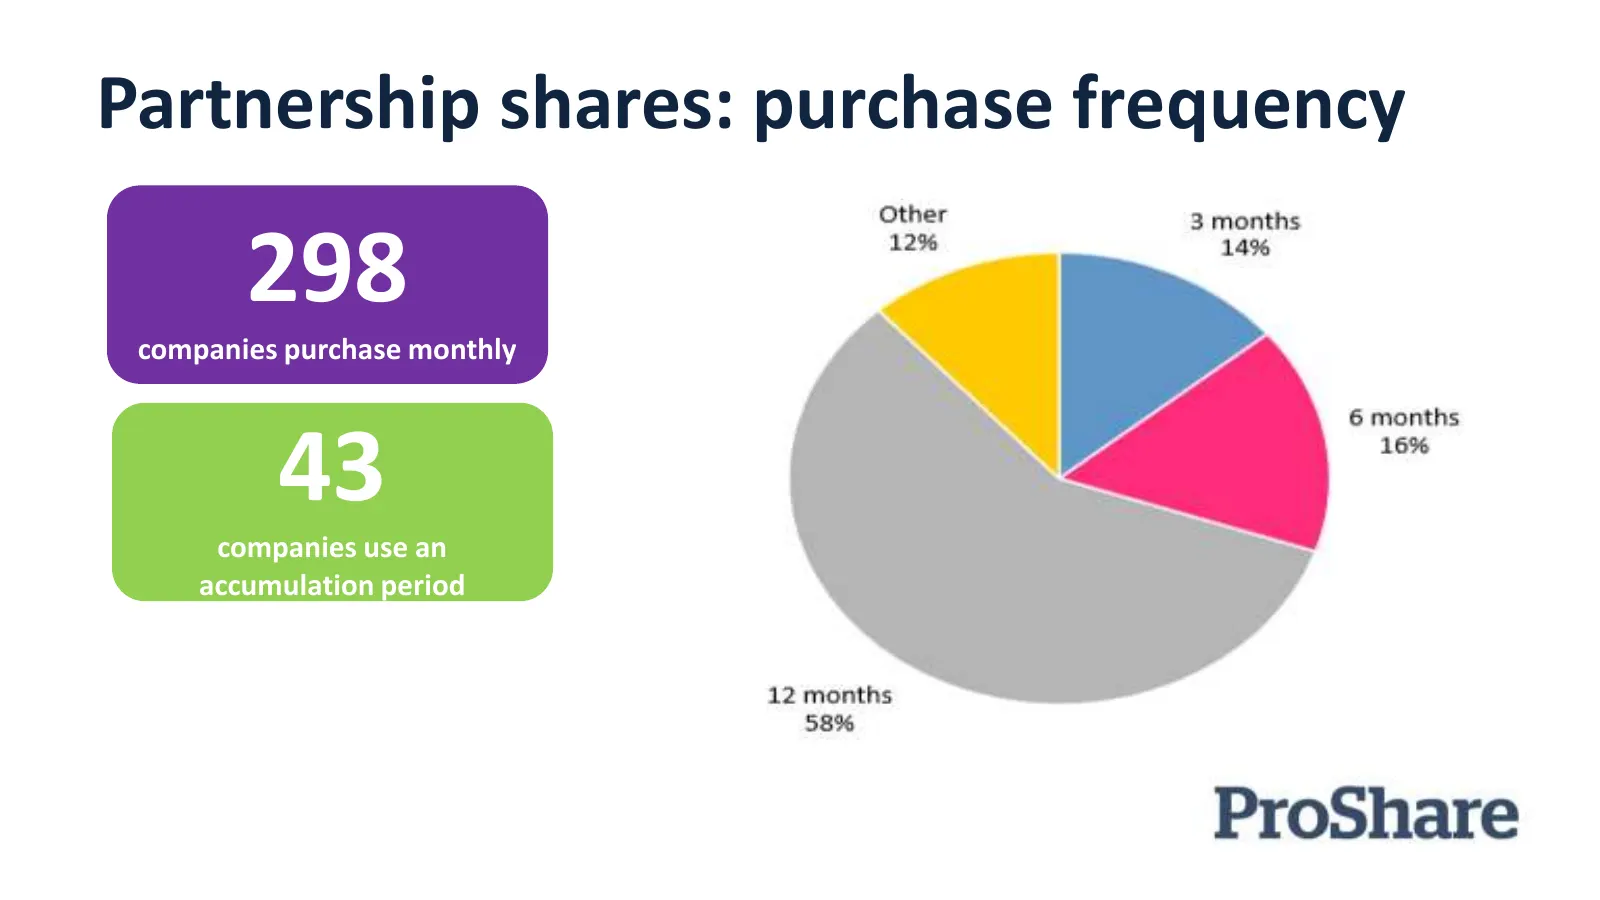
Slide 29: Partnership shares: purchase frequency
Partnership shares: purchase frequency 298 companies purchase monthly 43 companies use an accumulation period
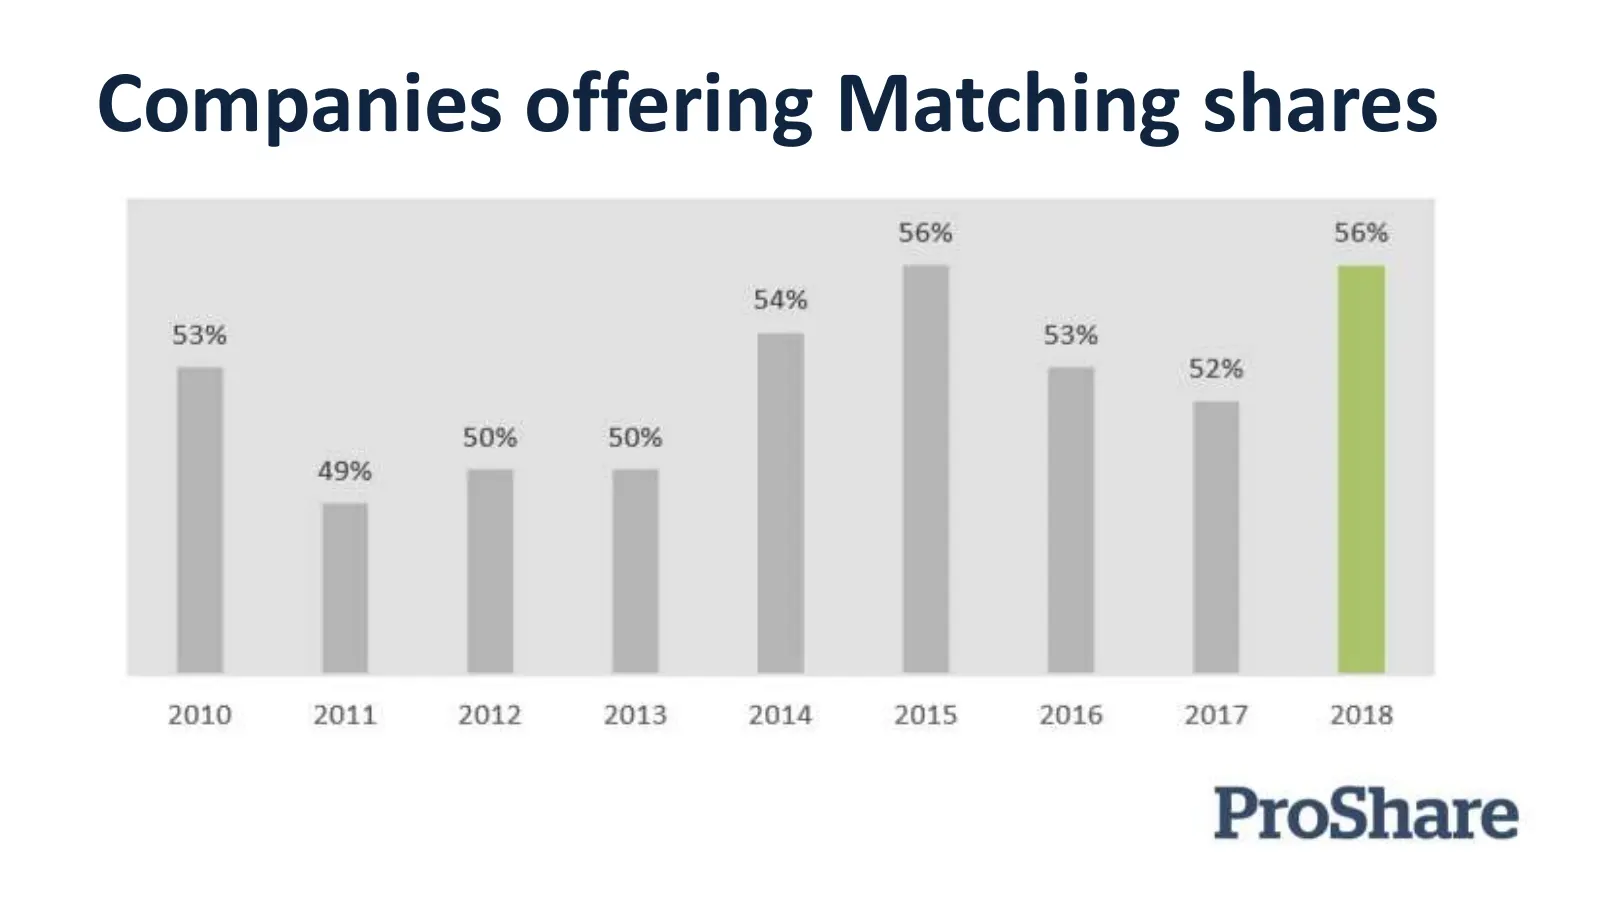
Slide 30: Companies offering Matching shares
Companies offering Matching shares
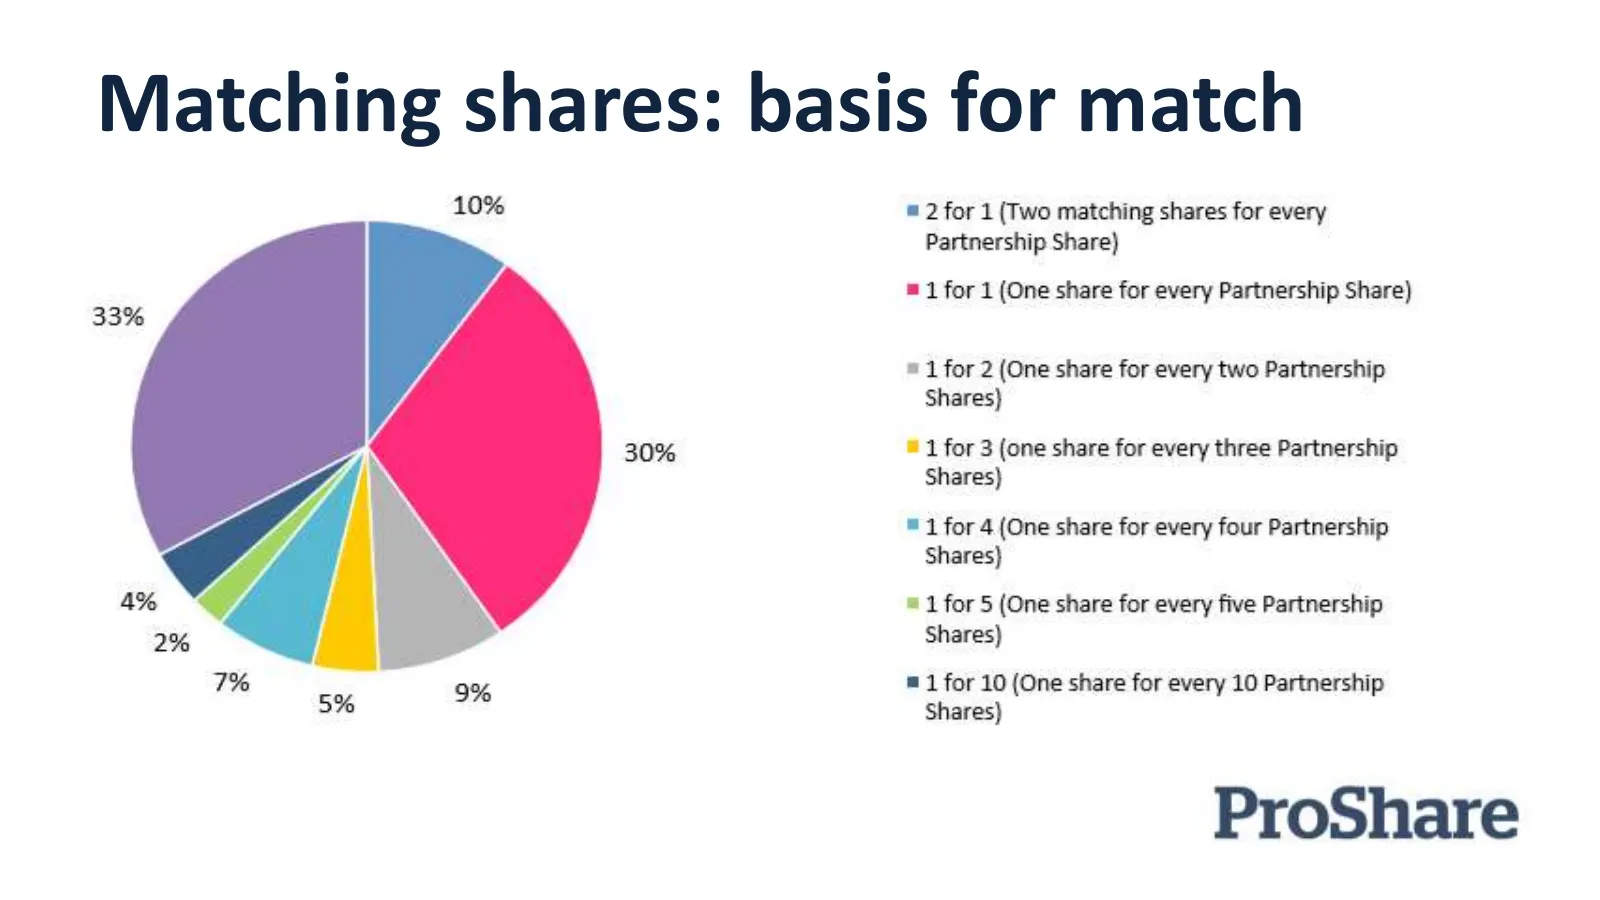
Slide 31: Matching shares: basis for match
Matching shares: basis for match
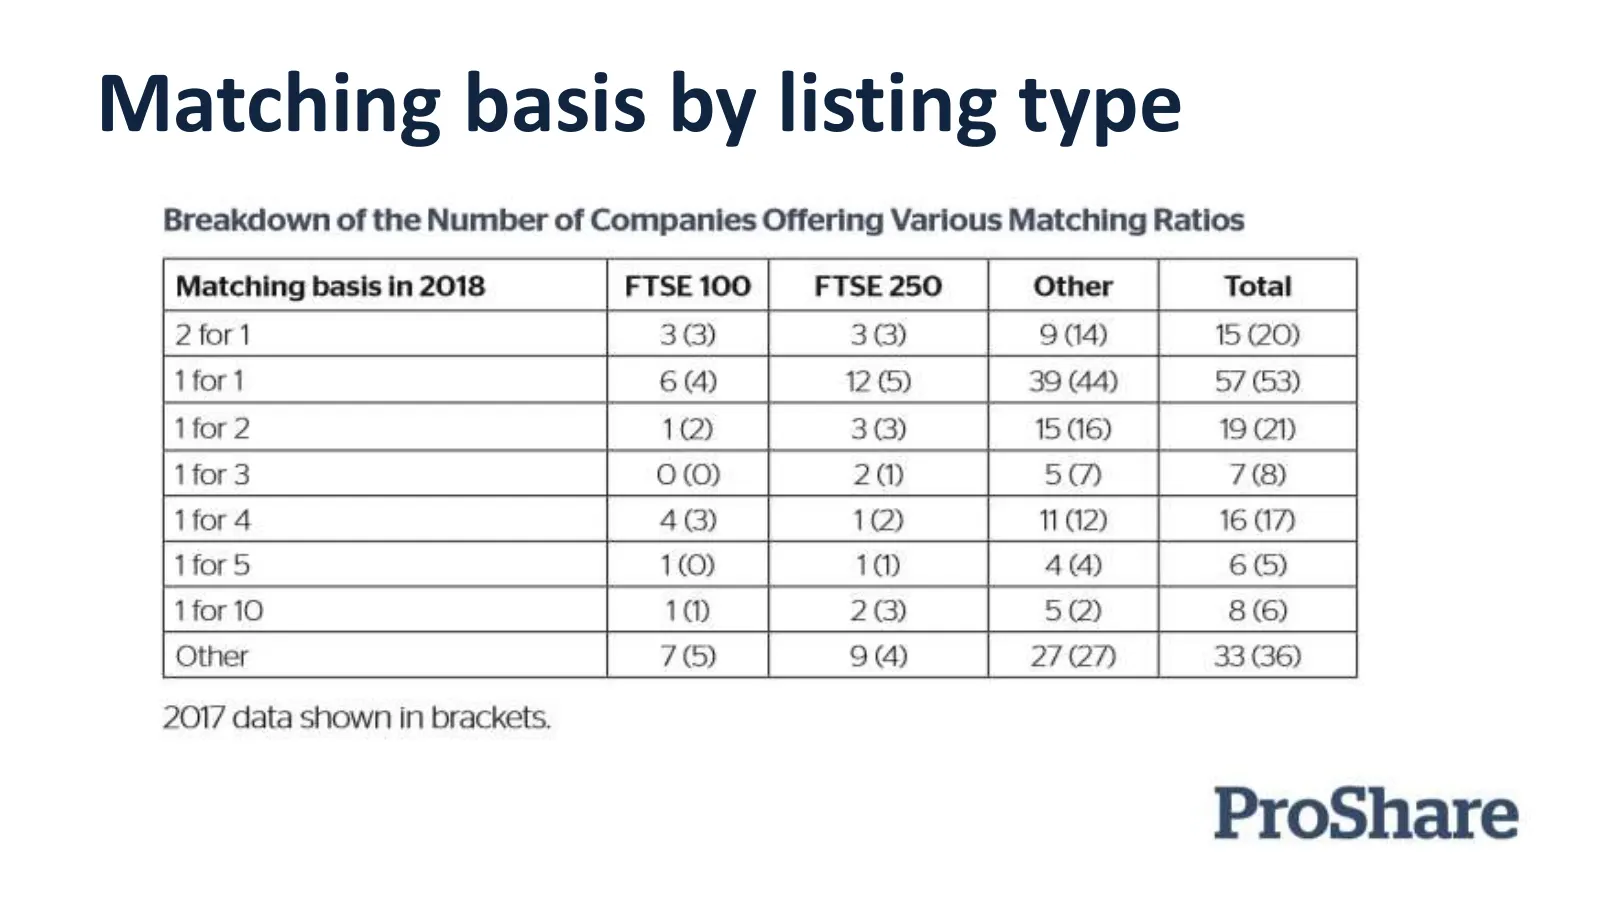
Slide 32: Matching basis by listing type
Matching basis by listing type
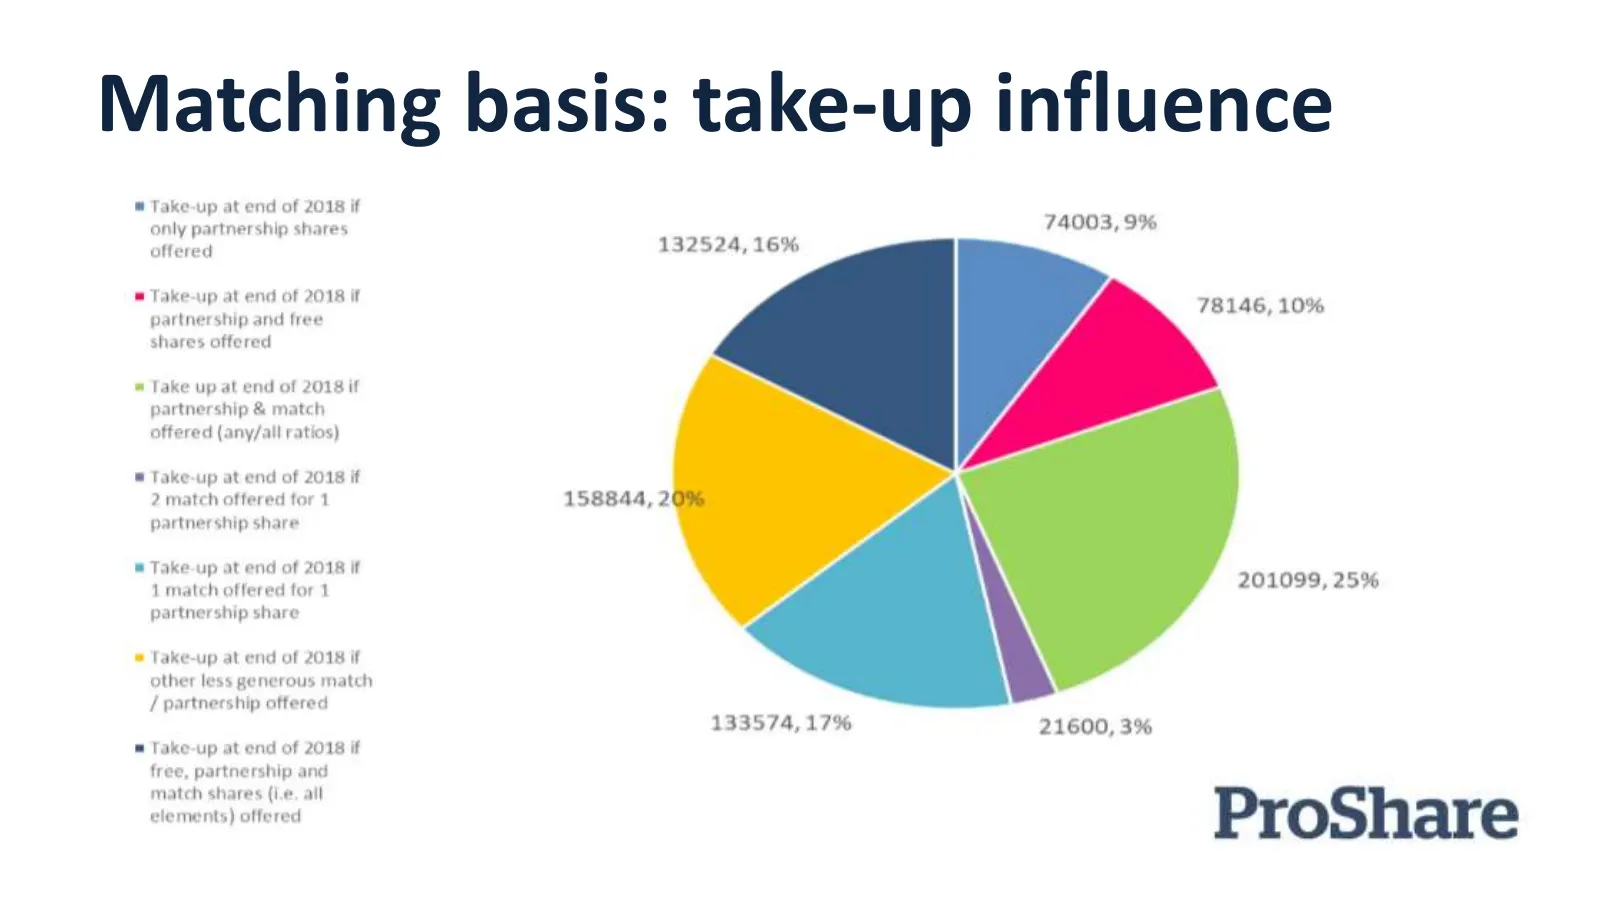
Slide 33: Matching basis: take-up influence
Matching basis: take-up influence
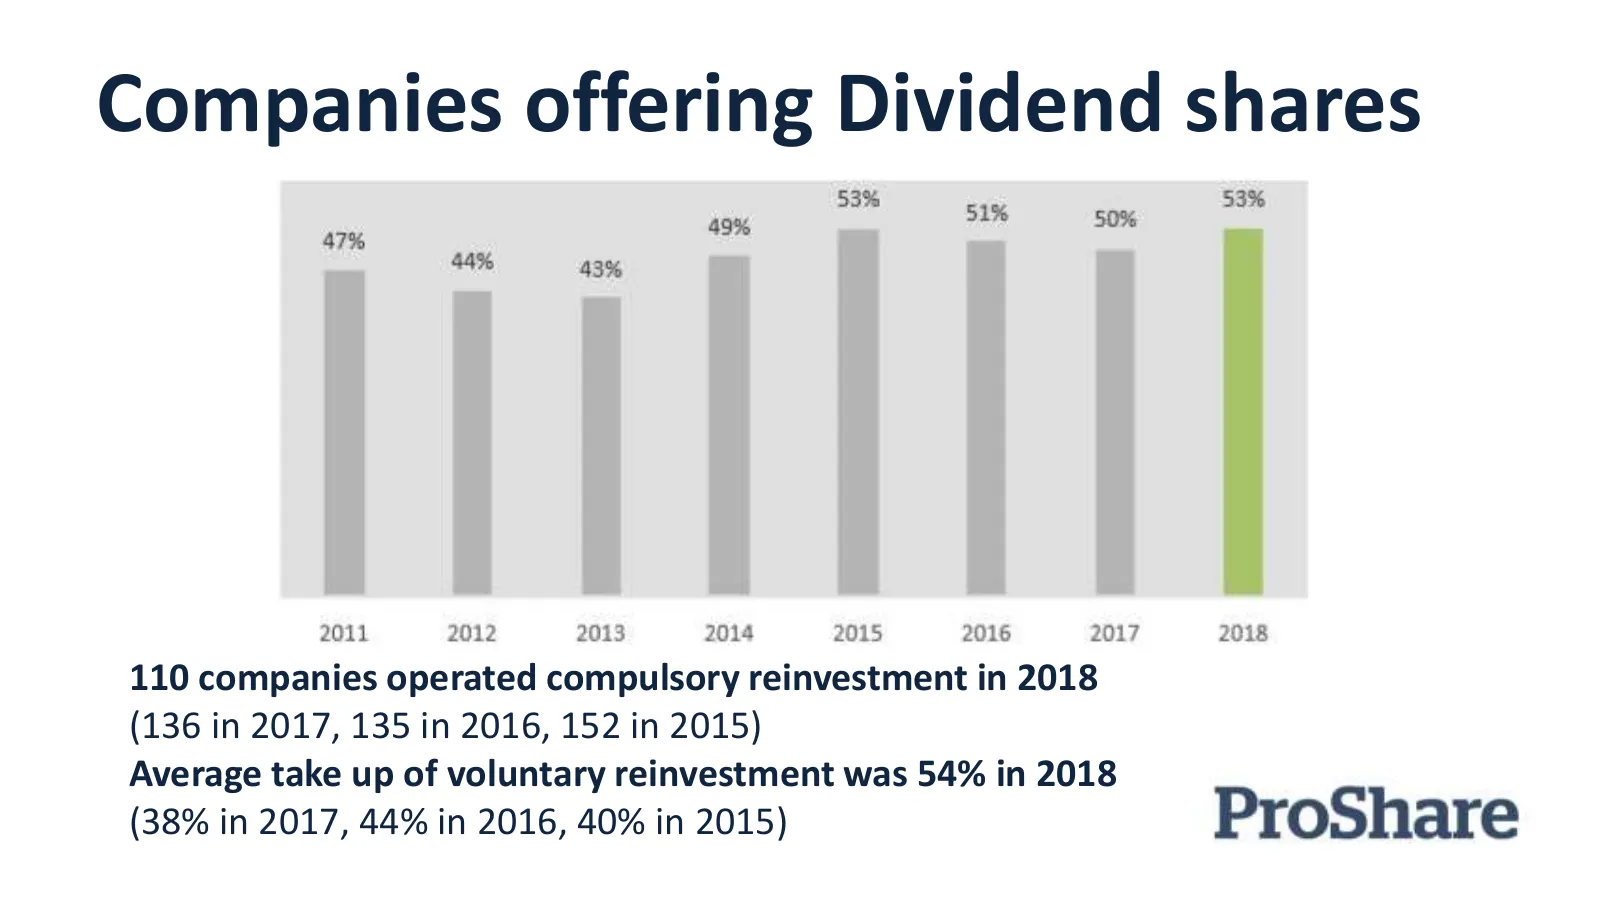
Slide 34: Companies offering Dividend shares
Companies offering Dividend shares 110 companies operated compulsory reinvestment in 2018 (136 in 2017, 135 in 2016, 152 in 2015) Average take up of voluntary reinvestment was 54% in 2018 (38% in 2017, 44% in 2016, 40% in 2015)
Slide 35: Questions for discussion
Questions for discussion • What did you find surprising or significant in the report findings? • Do you track gender participation rates for your plans? • How do your plans benchmark against these market / industry sector averages? • Do you think share ownership is well-understood by your workforce?
Slide 36: Super-charging share plans
Super-charging share plans • Continued progress on communication > accommodate different learning styles/preferences & access routes to information. • Greater flexibility in plan design > address affordability issues. • Shorter holding periods > address tenure concerns. • Review good/bad leaver trea
Slide 37: Thank You
Thank You Stuart Bailey Gabbi Stopp Computershare ProShare stuart.bailey@computershare.co.uk gabbi@proshare.org
Slide 38: Thank You
Thank You Thank you for attending our webinar. We hope you enjoyed this session. › If you require CPE Credit, don’t forget to Sign Out › Please take our survey
Source: Internet Archive copy of content-assets.computershare.com
More decks from Computershare Limited
 Shareholder Meeting (November 2026)13 slides · Nov 12, 2026
 FY2026 Earnings Presentation52 slides · Aug 11, 2026
 Q2 2026 Earnings Presentation51 slides · Feb 11, 2026
 Shareholder Meeting (November 2025)16 slides · Nov 13, 2025
 FY2025 Earnings Presentation51 slides · Aug 12, 2025
 Macquarie Australia Conference 202513 slides · May 6, 2025