Bertrandt AG · XETR:BDT
Bertrandt — Non-Deal Roadshow (October 2019)
54 slides from Bertrandt's roadshow presentation, Oct 22, 2019
Slide 1: Corporate Presentation Bertrandt AG
Corporate Presentation Bertrandt AG Frankfurt, 22 October 2019, Markus Ruf 0
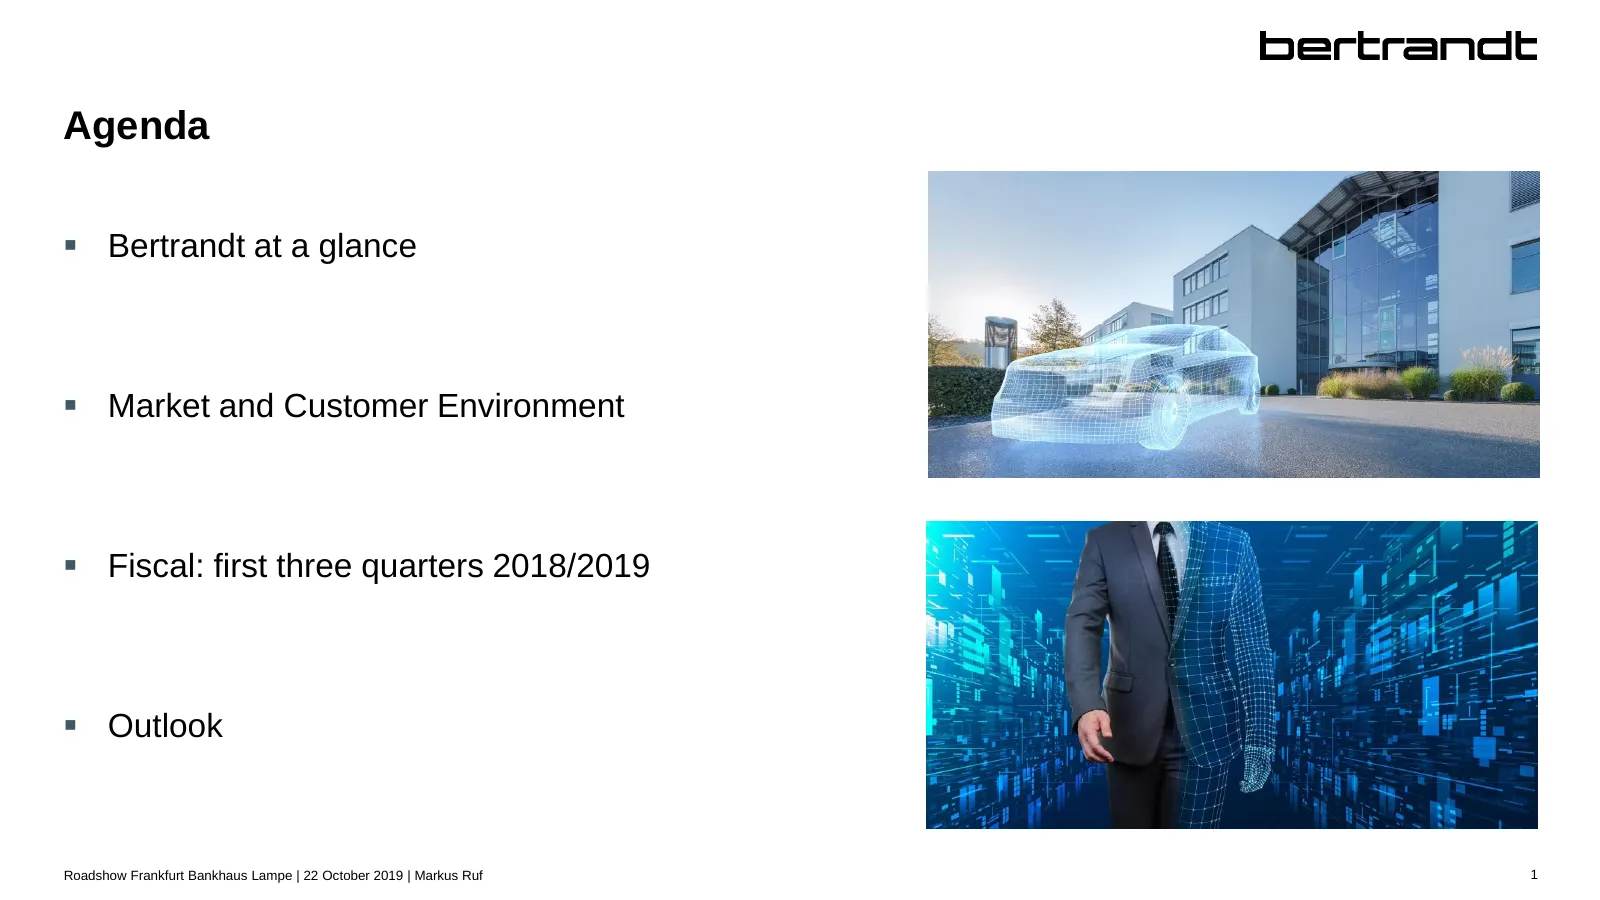
Slide 2: Agenda
Agenda Bertrandt at a glance Market and Customer Environment Fiscal: first three quarters 2018/2019 Outlook Roadshow Frankfurt Bankhaus Lampe | 22 October 2019 | Markus Ruf 1
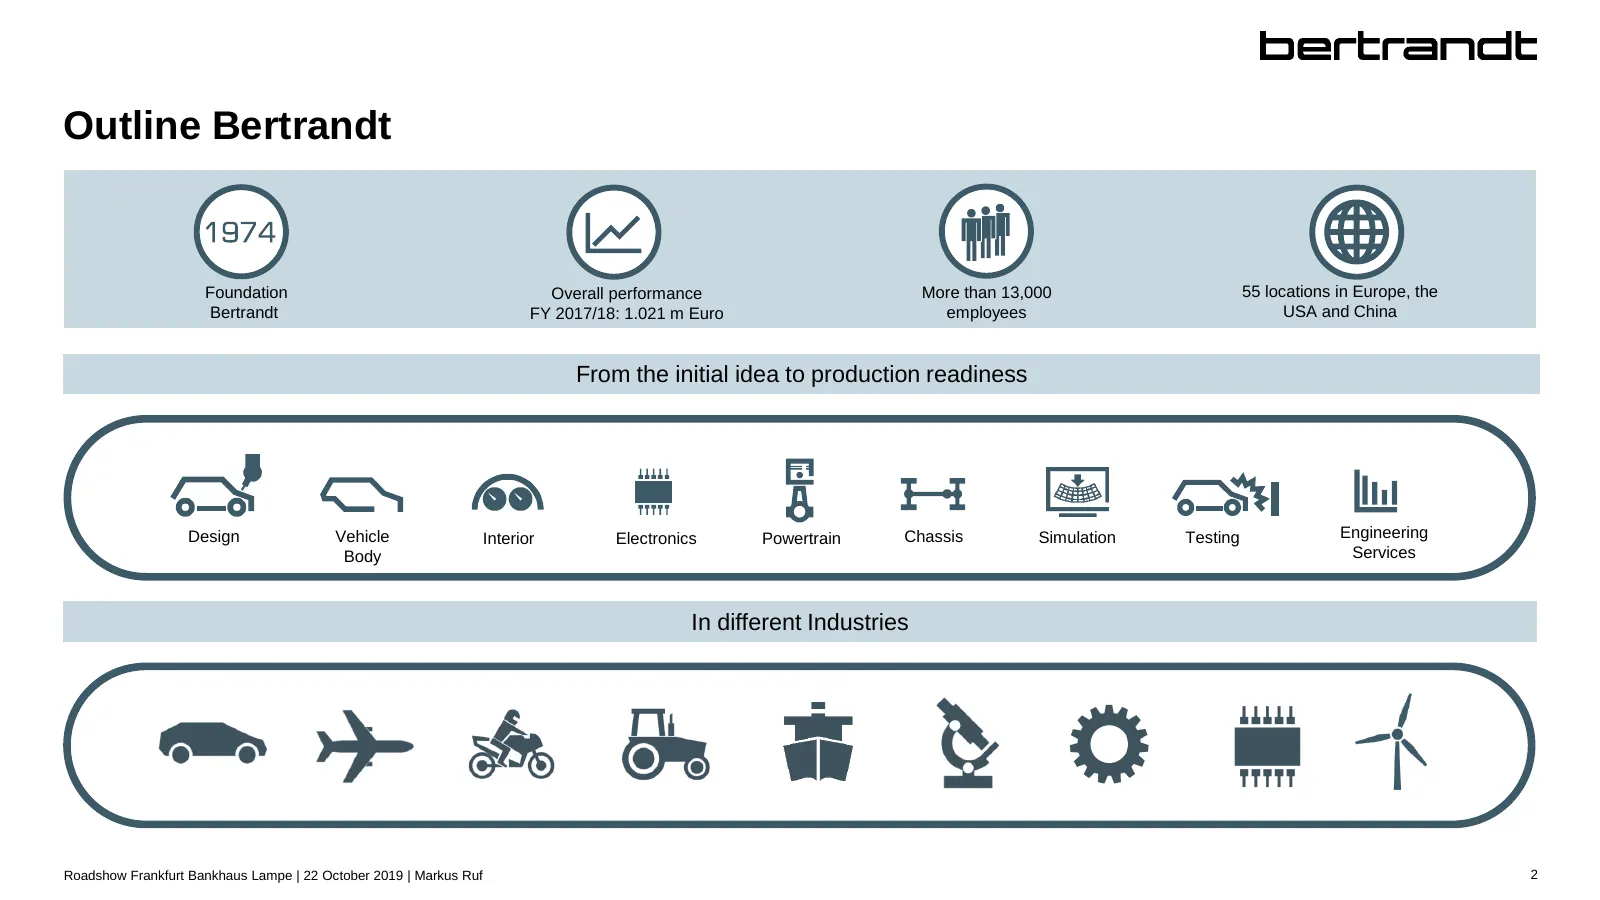
Slide 3: Outline Bertrandt
Outline Bertrandt Foundation Overall performance More than 13,000 55 locations in Europe, the Bertrandt FY 2017/18: 1.021 m Euro employees USA and China From the initial idea to production readiness Design Vehicle Interior Electronics Powertrain Chassis Simulation Testing Engineering Body Services I
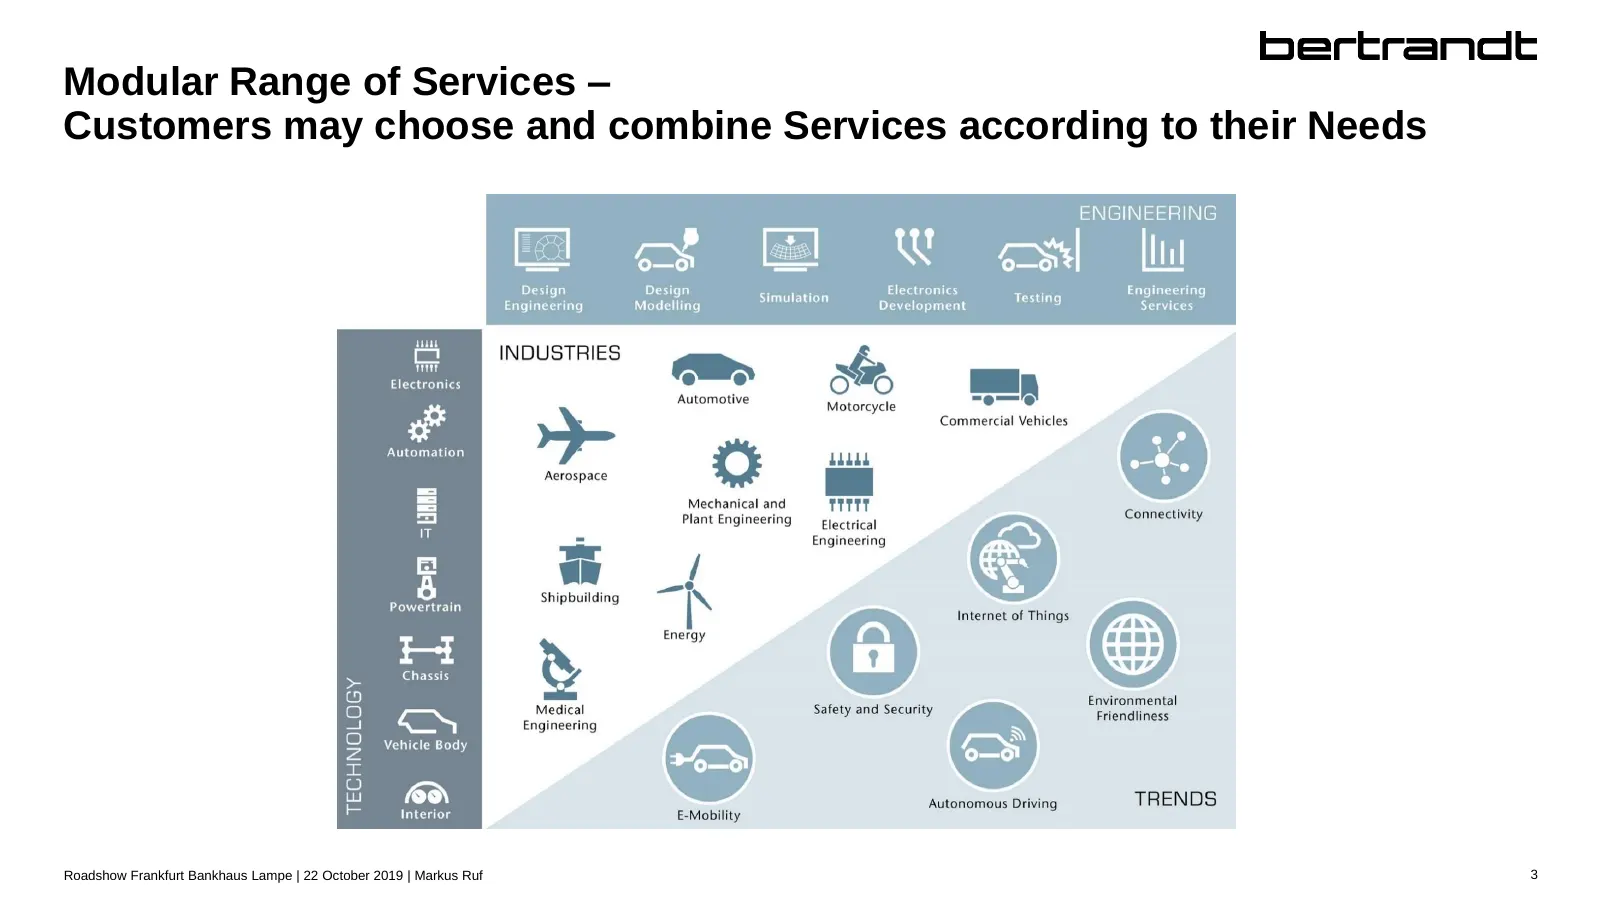
Slide 4: Modular Range of Services
Modular Range of Services – Customers may choose and combine Services according to their Needs Roadshow Frankfurt Bankhaus Lampe | 22 October 2019 | Markus Ruf 3
Slide 5: We want to be close to our Customers – decentralised Organisation
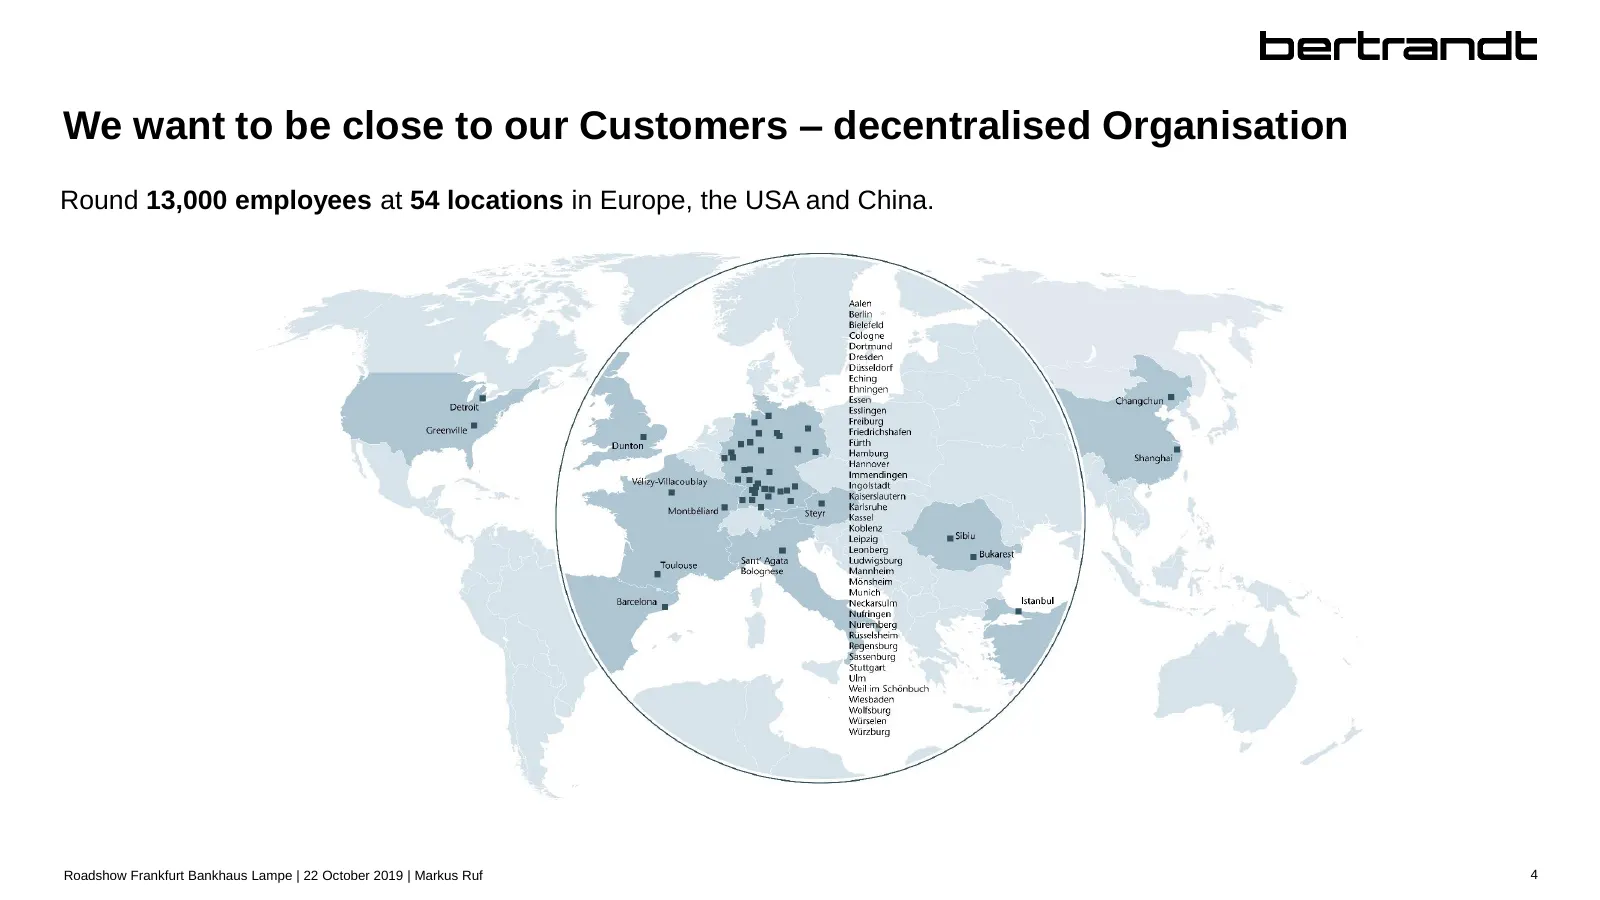
We want to be close to our Customers – decentralised Organisation Round 13,000 employees at 54 locations in Europe, the USA and China. Roadshow Frankfurt Bankhaus Lampe | 22 October 2019 | Markus Ruf 4
Slide 6: Maximum Customer Focus and Competence Alignment
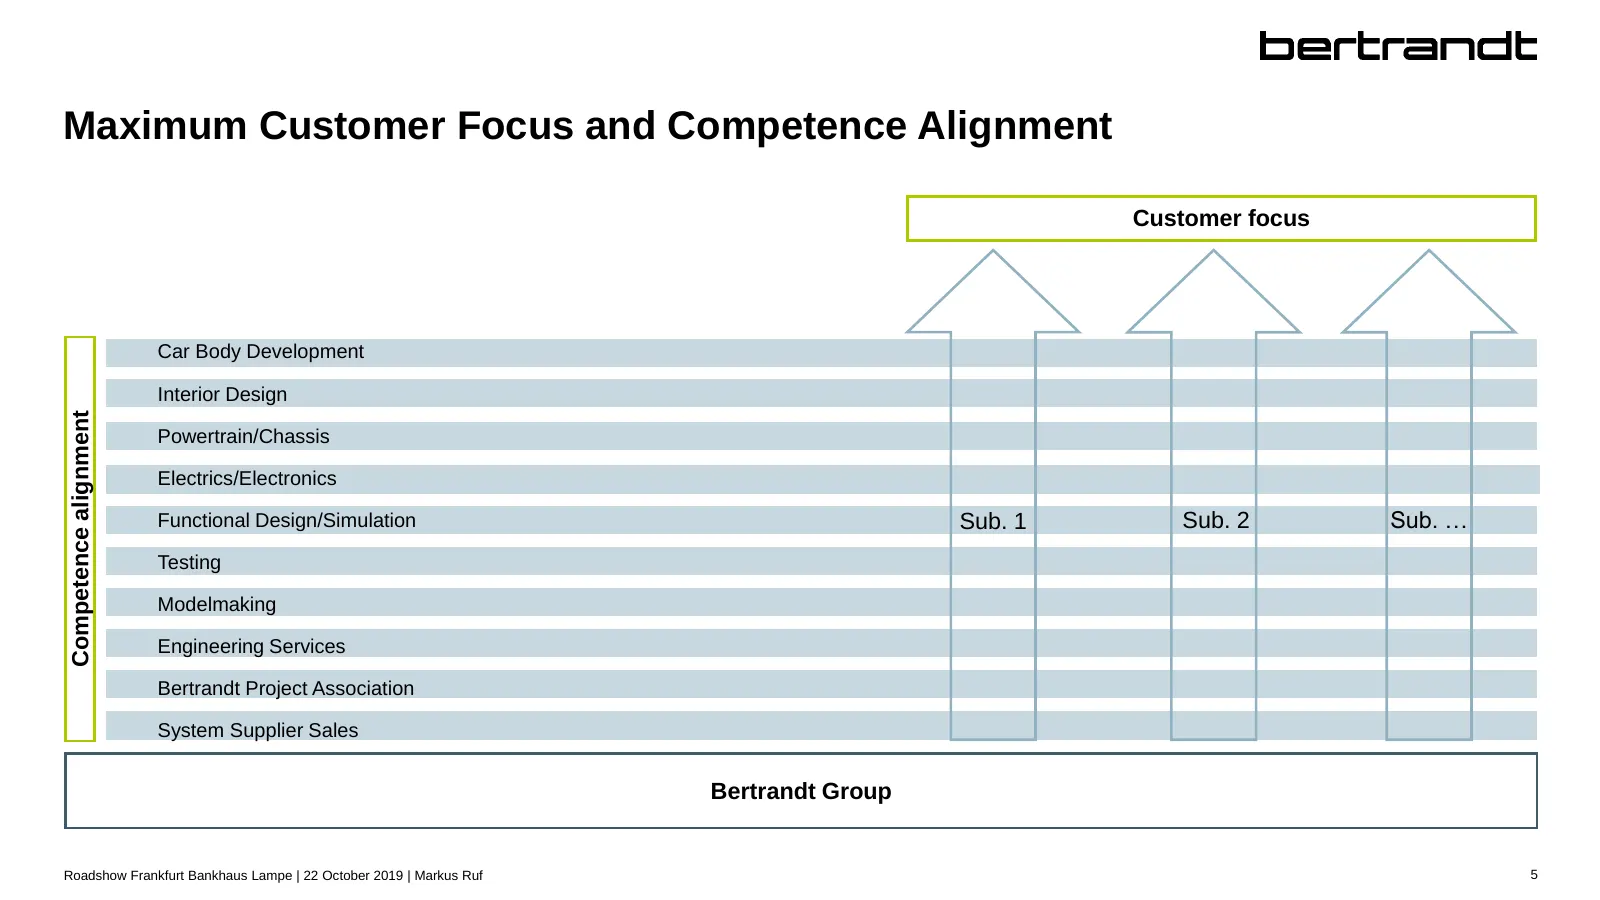
Maximum Customer Focus and Competence Alignment Customer focus Car Body Development Interior Design Competence alignment Powertrain/Chassis Electrics/Electronics Functional Design/Simulation Sub. 1 Sub. 2 Sub. … Testing Modelmaking Engineering Services Bertrandt Project Association System Supplier S
Slide 7: Bertrandt offers end-to-end Engineering Services
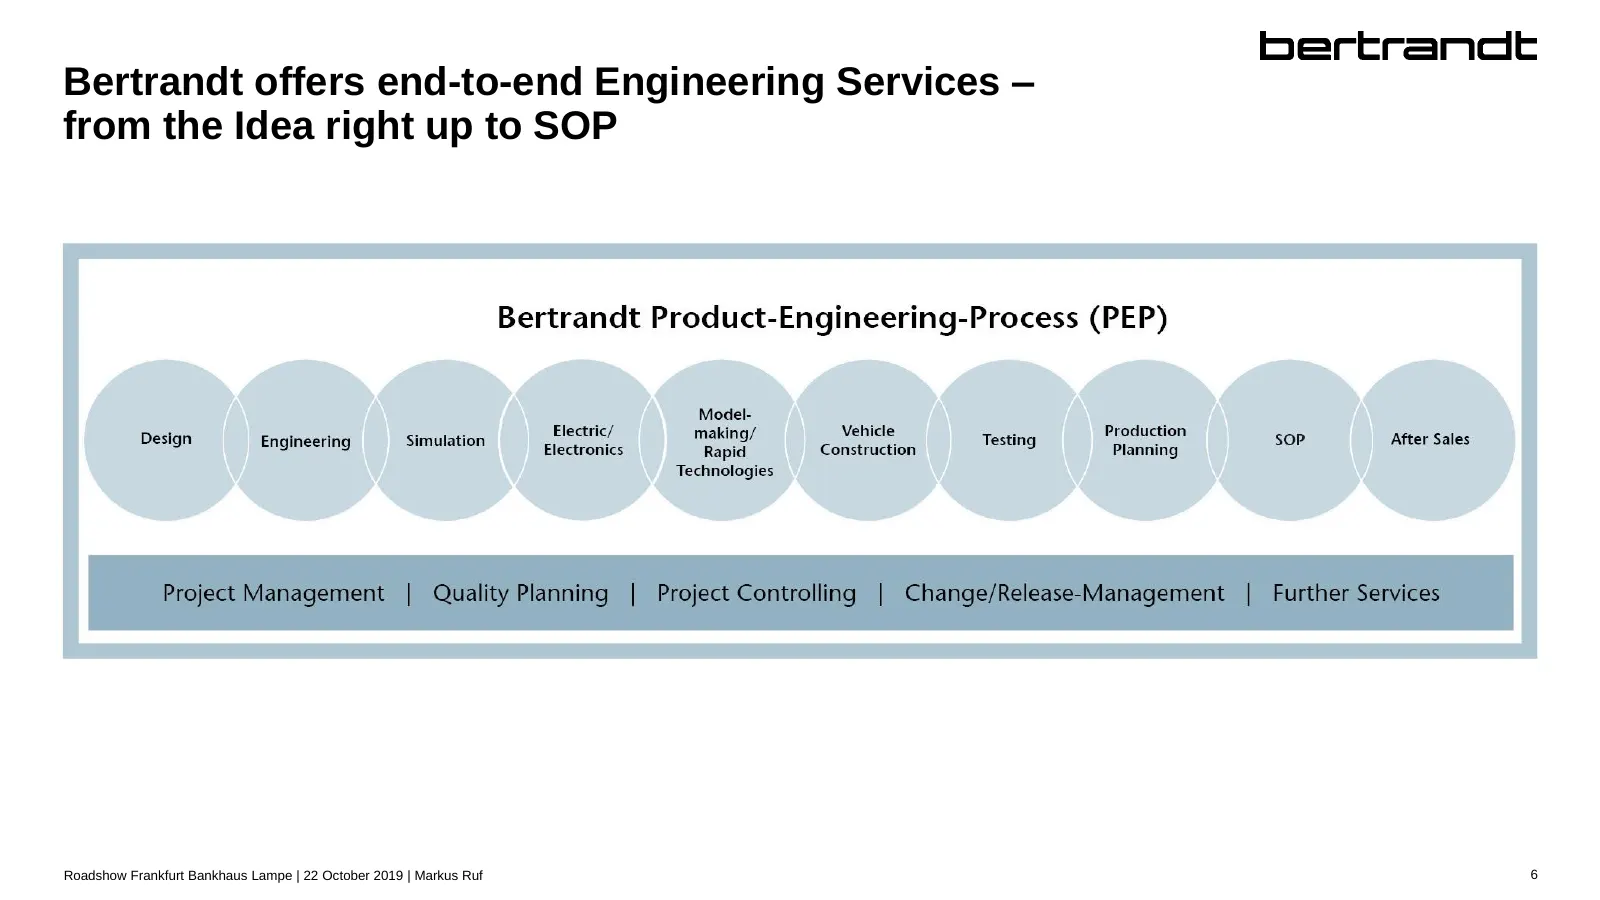
Bertrandt offers end-to-end Engineering Services – from the Idea right up to SOP Roadshow Frankfurt Bankhaus Lampe | 22 October 2019 | Markus Ruf 6
Slide 8: Shareholder structure
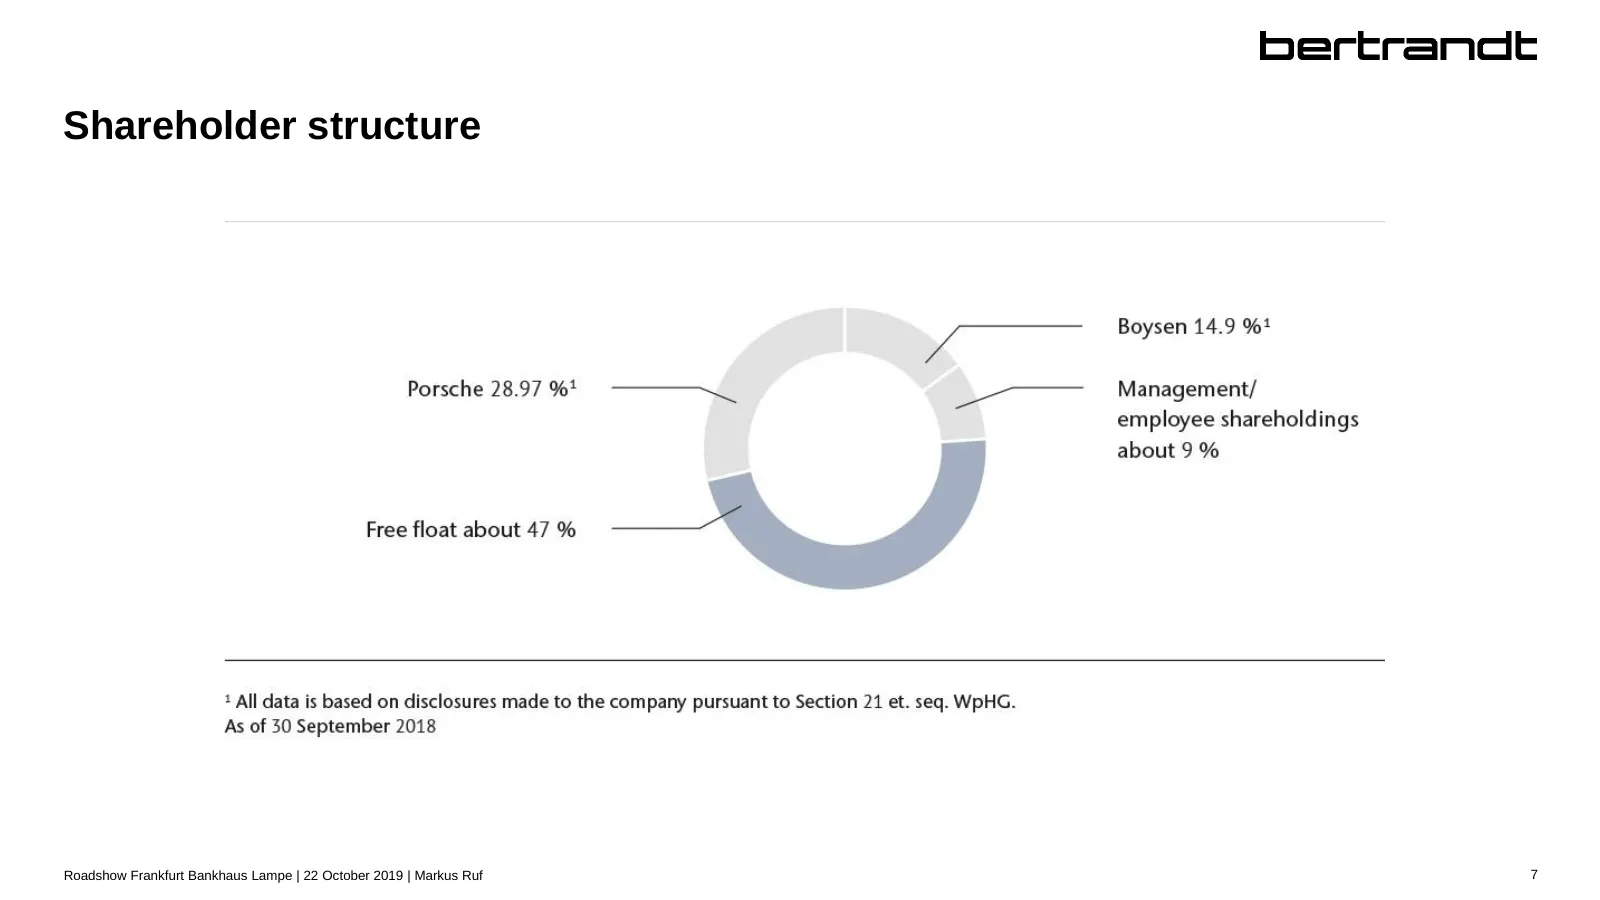
Shareholder structure Roadshow Frankfurt Bankhaus Lampe | 22 October 2019 | Markus Ruf 7
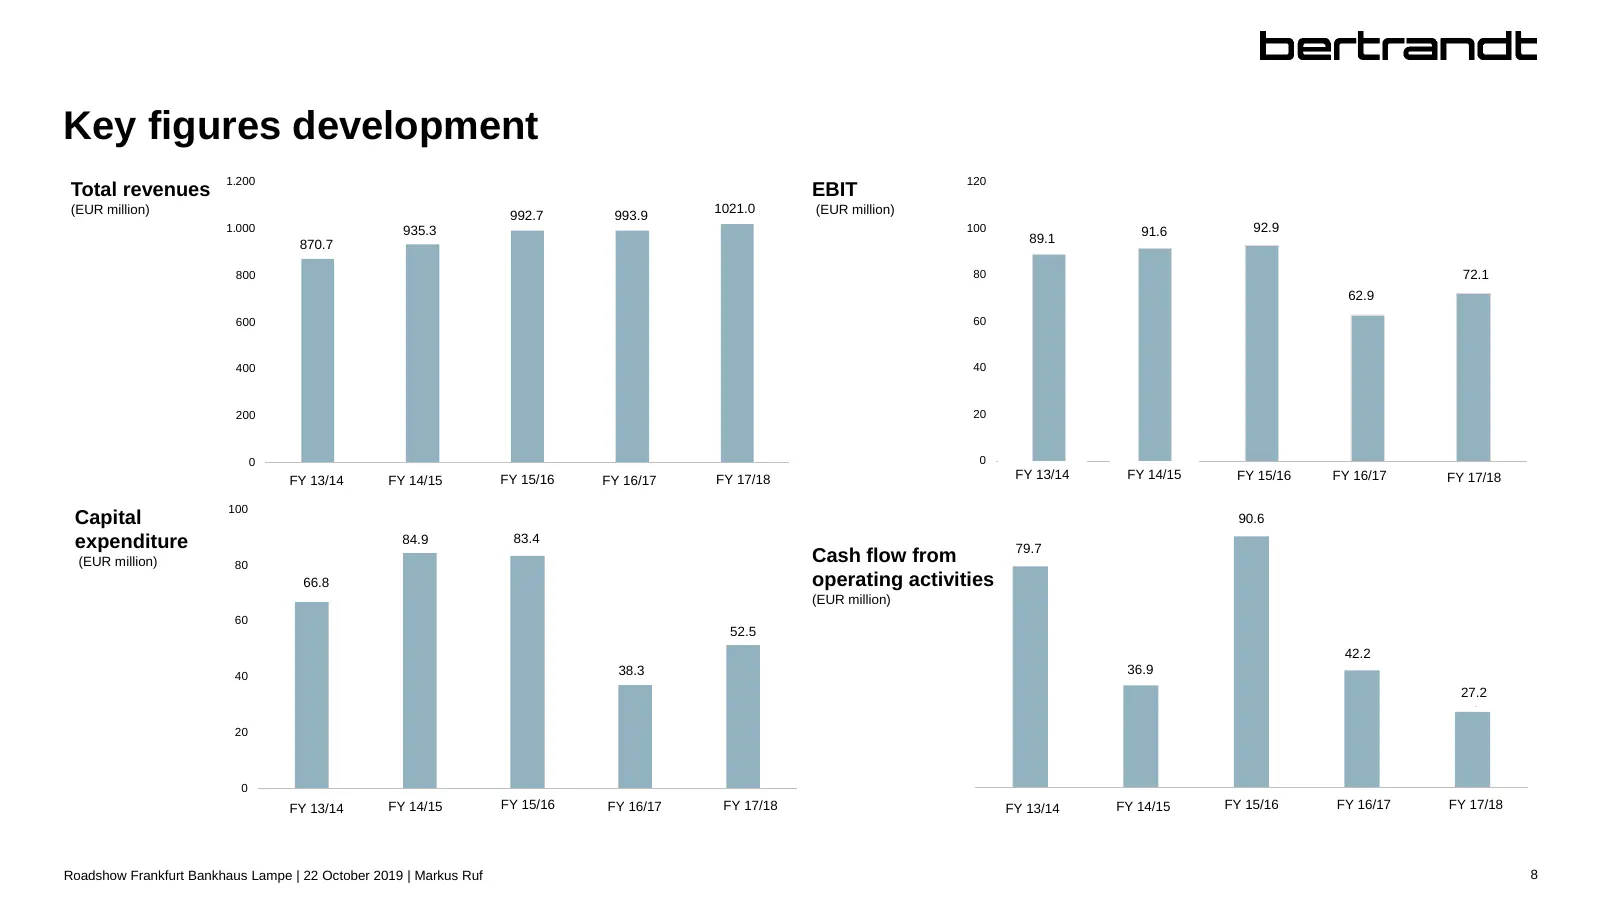
Slide 9: Key figures development
Key figures development 1.200 120 Total revenues EBIT (EUR million) 1021.0 1.021,0 (EUR million) 992.7 992,7 993.9 993,9 1.000 935.3 935,3 100 91.6 92.9 92,9 89.1 91,6 870.7 870,7 89,1 800 80 72.1 72,1 62.9 62,9 600 60 400 40 200 20 0 0 GJ 13/14 FY 13/14 FYGJ14/15 14/15 GJ 15/16 FY 15/16 GJ16/17 FY
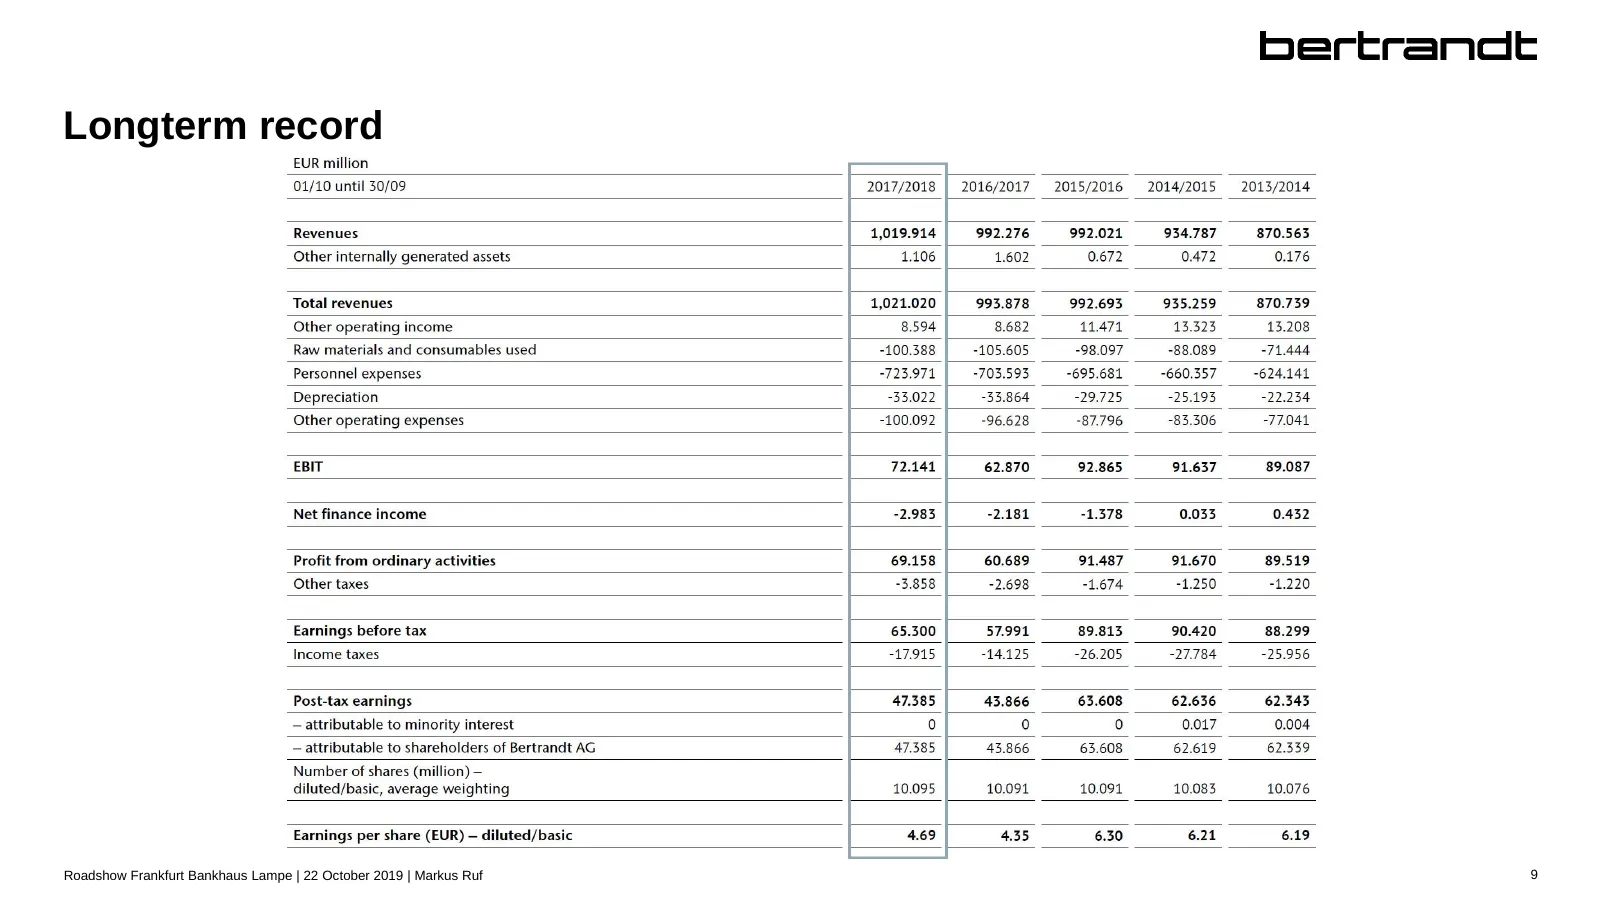
Slide 10: Longterm record
Longterm record Roadshow Frankfurt Bankhaus Lampe | 22 October 2019 | Markus Ruf 9
Slide 11: Market and Customer Environment
Market and Customer Environment Roadshow Frankfurt Bankhaus Lampe | 22 October 2019 | Markus Ruf 10
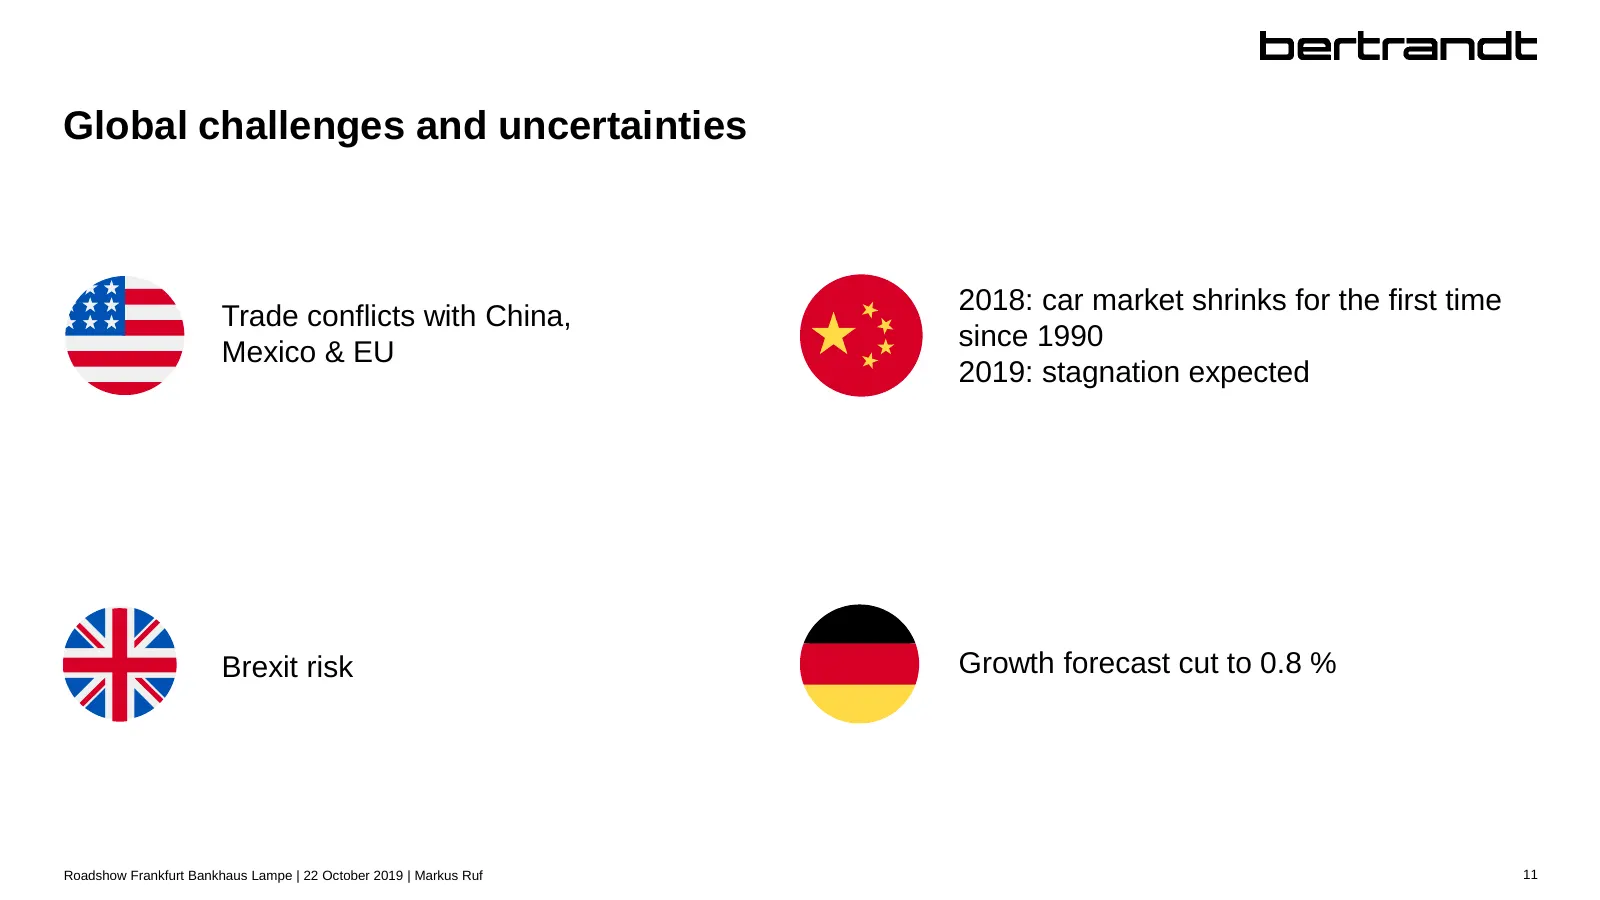
Slide 12: Global challenges and uncertainties
Global challenges and uncertainties 2018: car market shrinks for the first time Trade conflicts with China, since 1990 Mexico & EU 2019: stagnation expected Brexit risk Growth forecast cut to 0.8 % Roadshow Frankfurt Bankhaus Lampe | 22 October 2019 | Markus Ruf 11
Slide 13: Automotive industry in transition
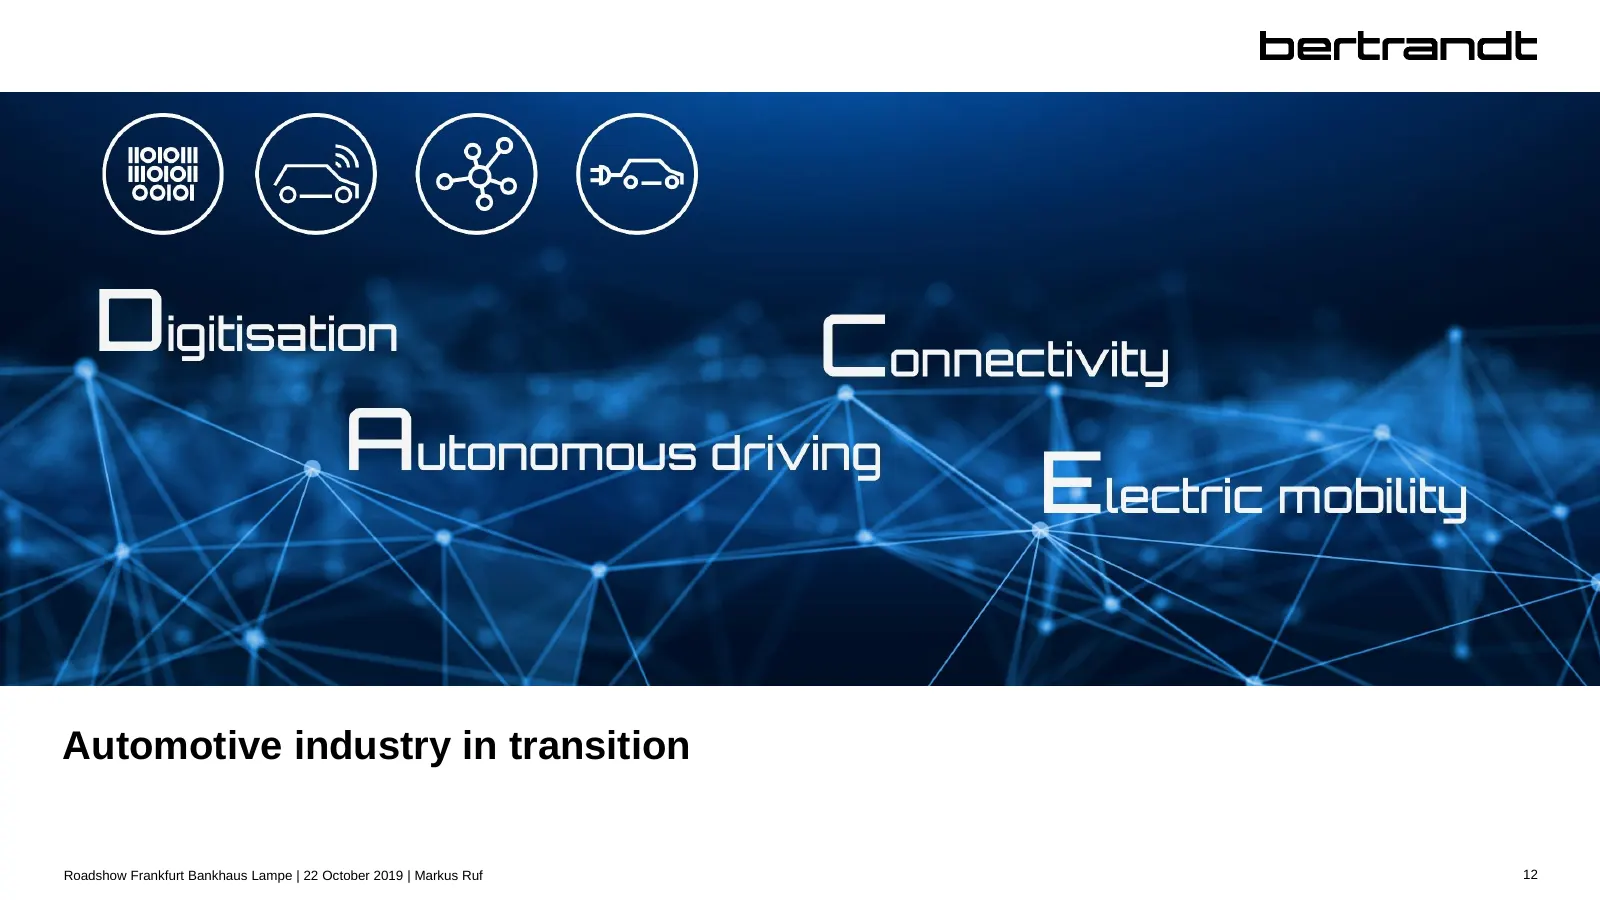
Automotive industry in transition Roadshow Frankfurt Bankhaus Lampe | 22 October 2019 | Markus Ruf 12
Slide 14: Reactions of the OEM
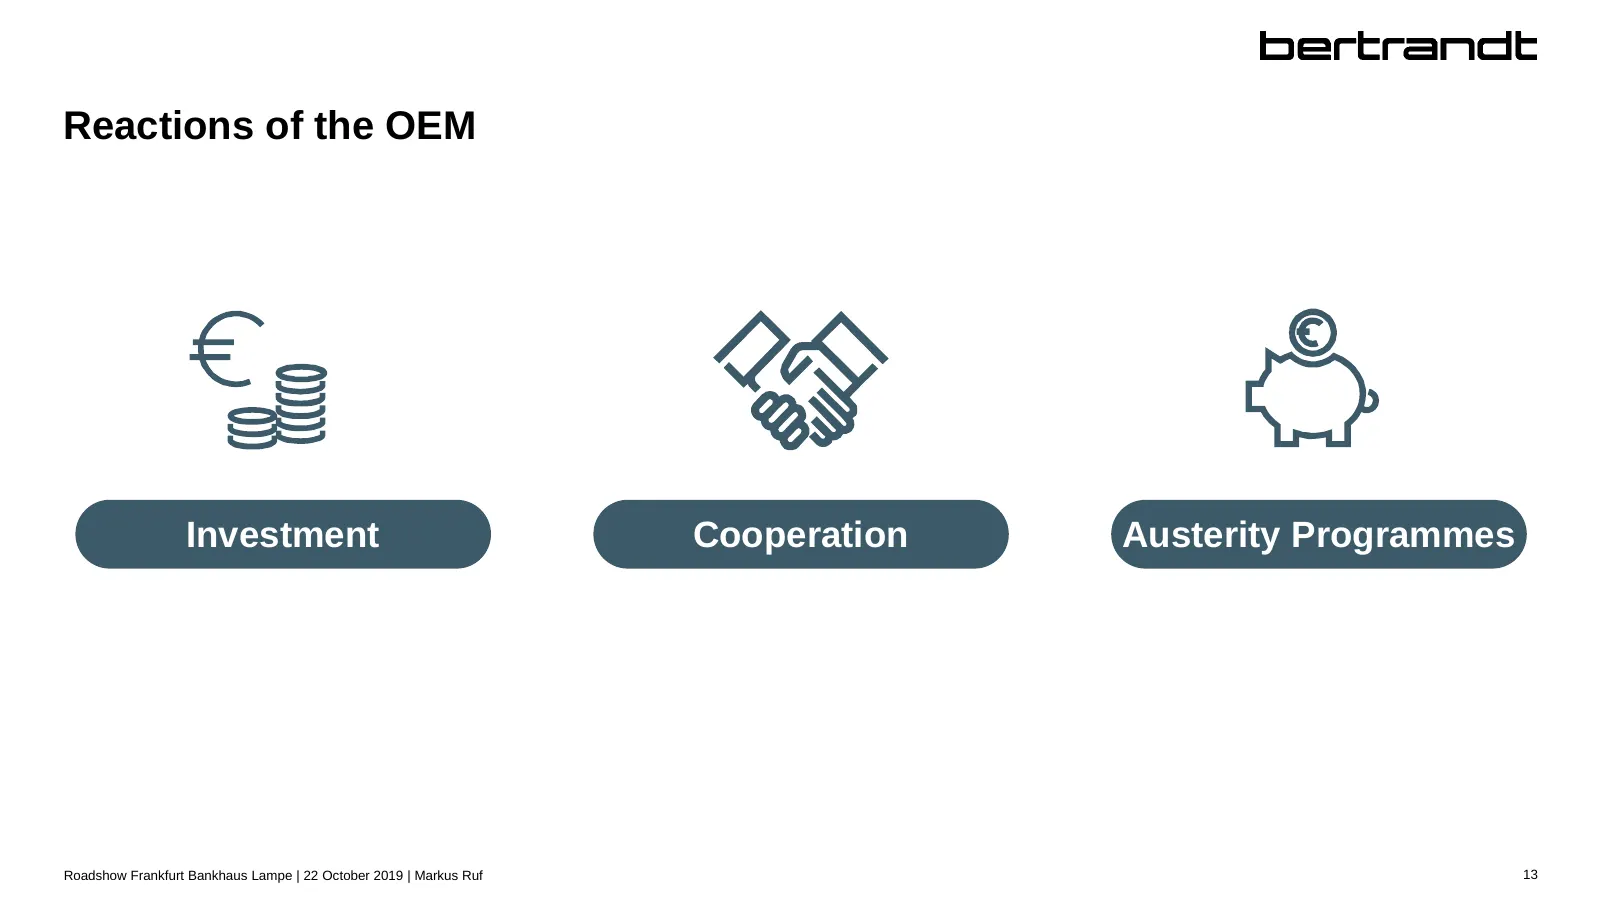
Reactions of the OEM Investment Cooperation Austerity Programmes Roadshow Frankfurt Bankhaus Lampe | 22 October 2019 | Markus Ruf 13
Slide 15: Importance for development service providers
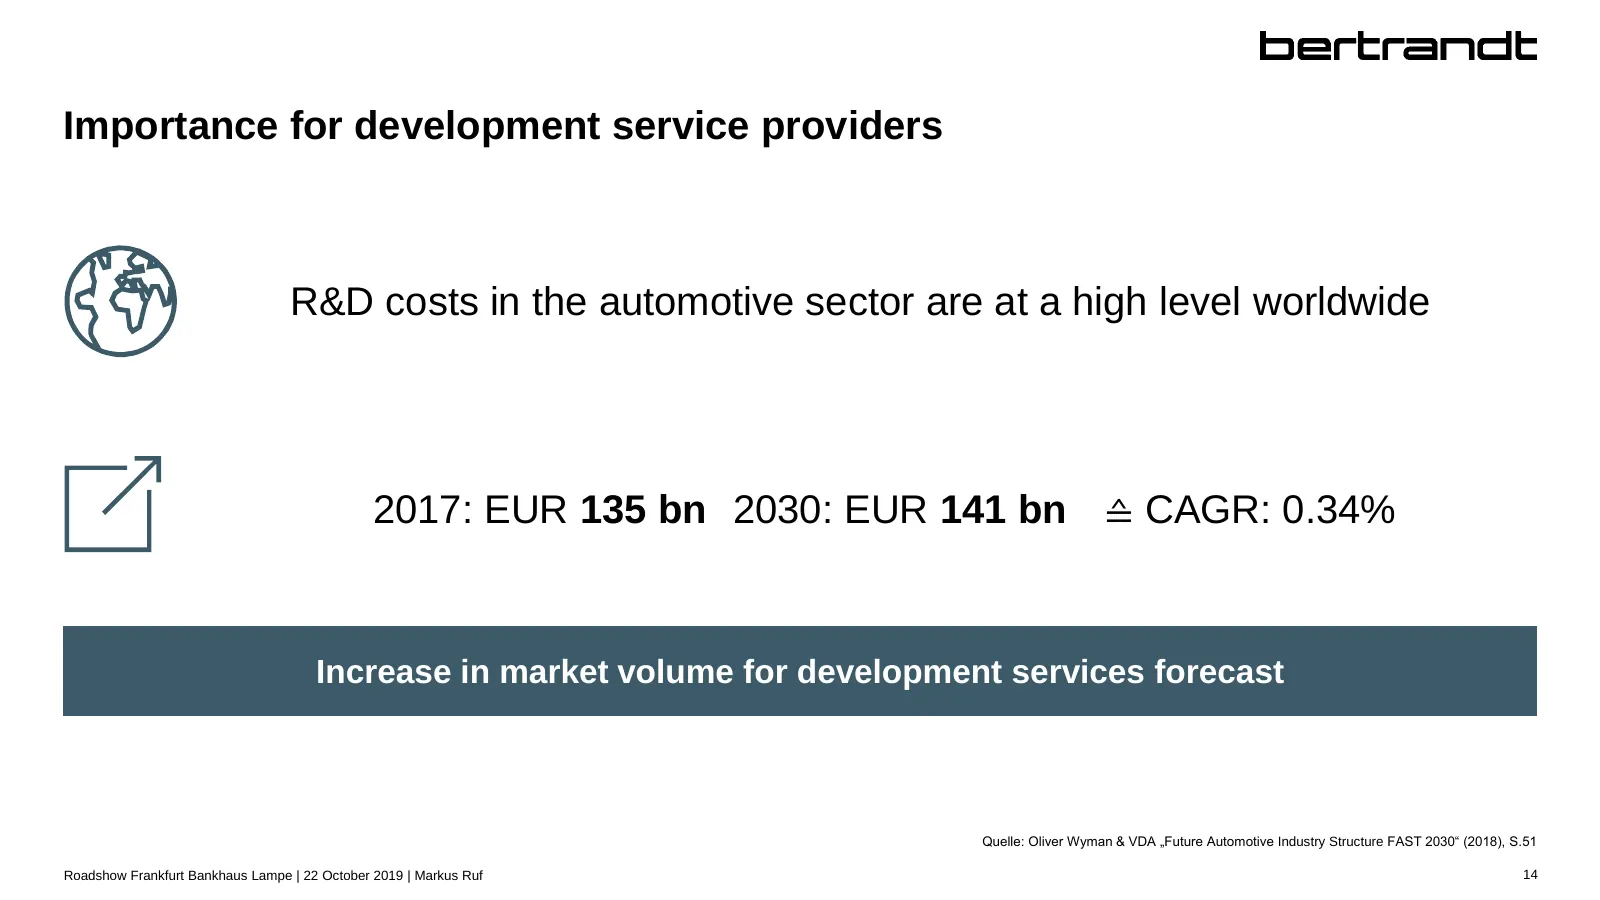
Importance for development service providers R&D costs in the automotive sector are at a high level worldwide 2017: EUR 135 bn 2030: EUR 141 bn ≙ CAGR: 0.34% Increase in market volume for development services forecast Quelle: Oliver Wyman & VDA „Future Automotive Industry Structure FAST 2030“ (2018)
Slide 16: Derivatives for Bertrandt
Derivatives for bertrandt Customers are reviewing their core in-house development activities Trend towards awarding larger order packages (Capacities, speed, costs, investments) Roadshow Frankfurt Bankhaus Lampe | 22 October 2019 | Markus Ruf 15
Slide 17: Orientation: Markets & Customers, Services & Solutions, Globalisation
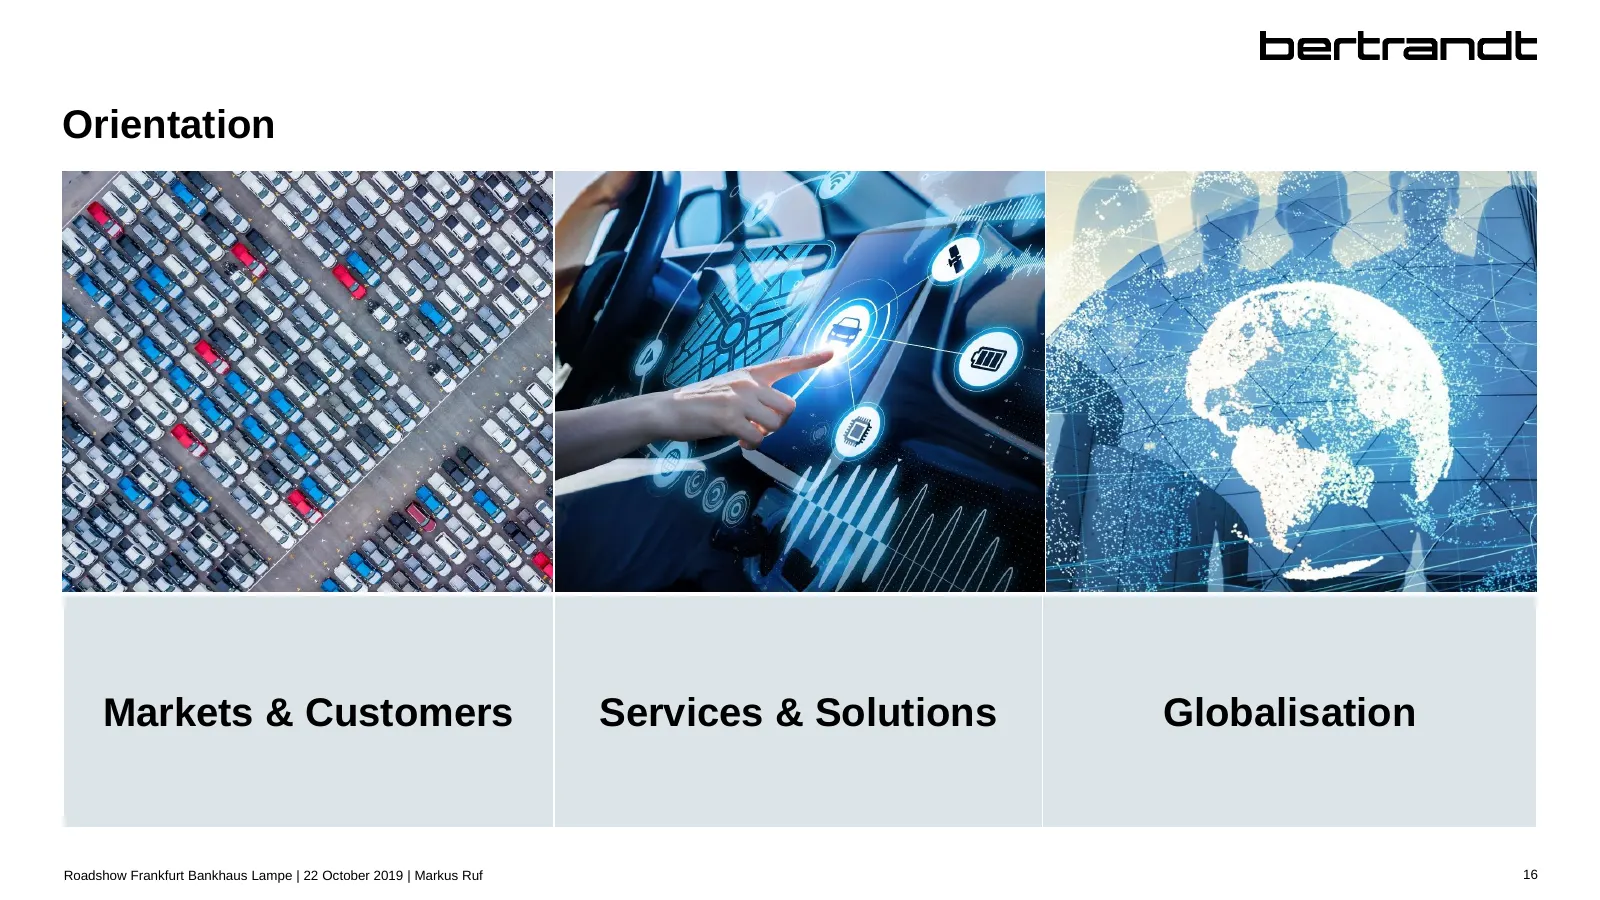
Orientation Markets & Customers Services & Solutions Globalisation Roadshow Frankfurt Bankhaus Lampe | 22 October 2019 | Markus Ruf 16
Slide 18: Mobility
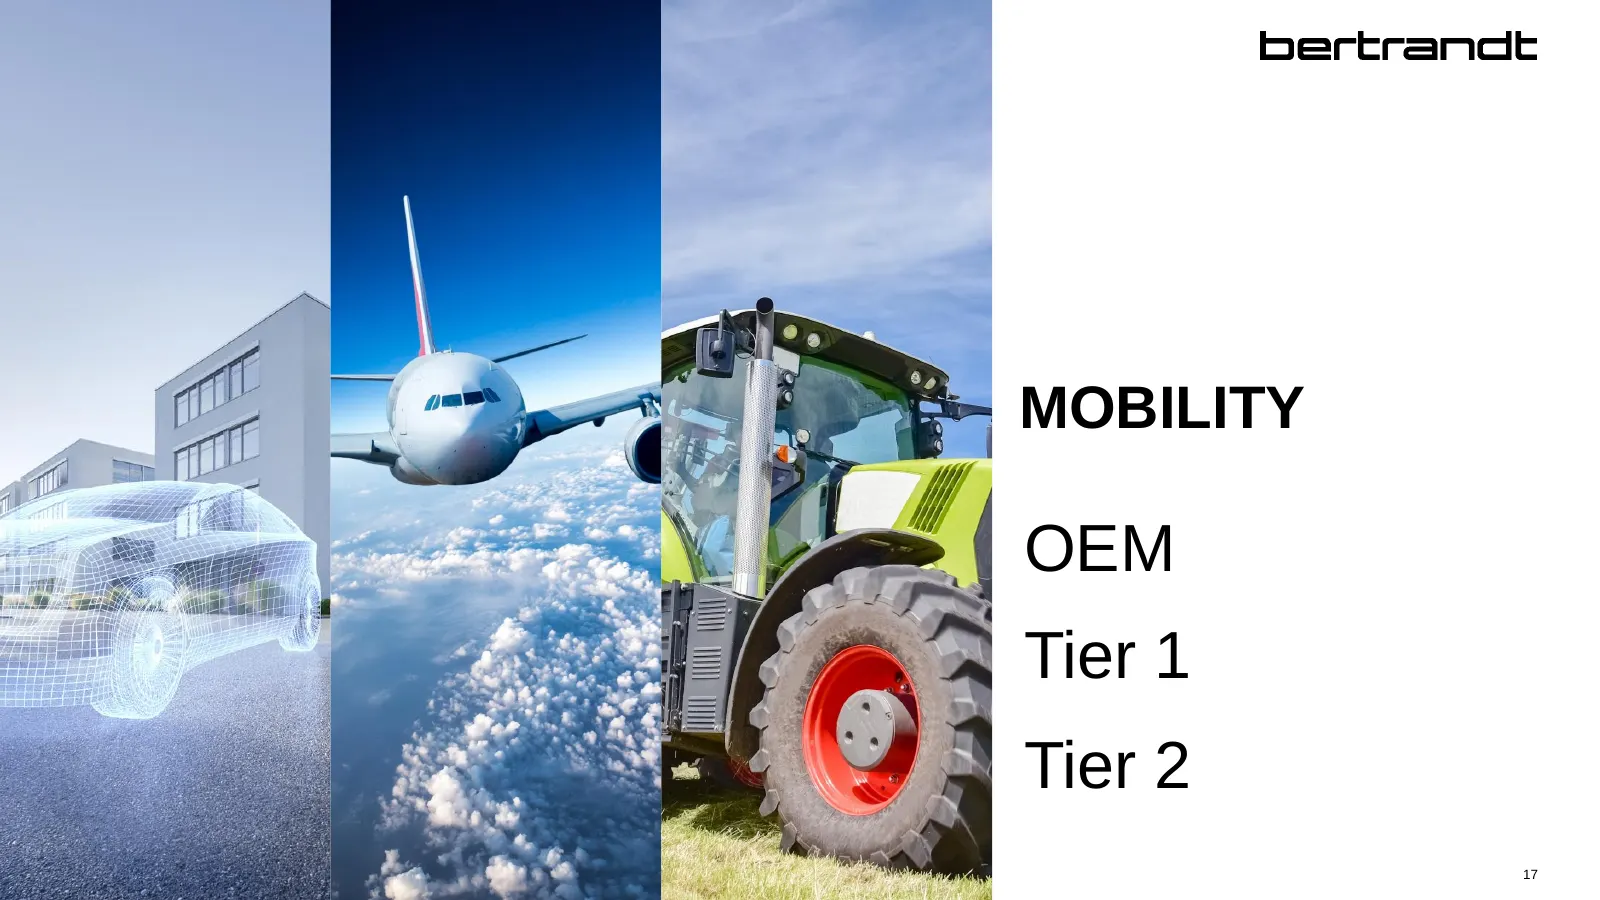
MOBILITY OEM Tier 1 Tier 2 17
Slide 19: Non-Mobility
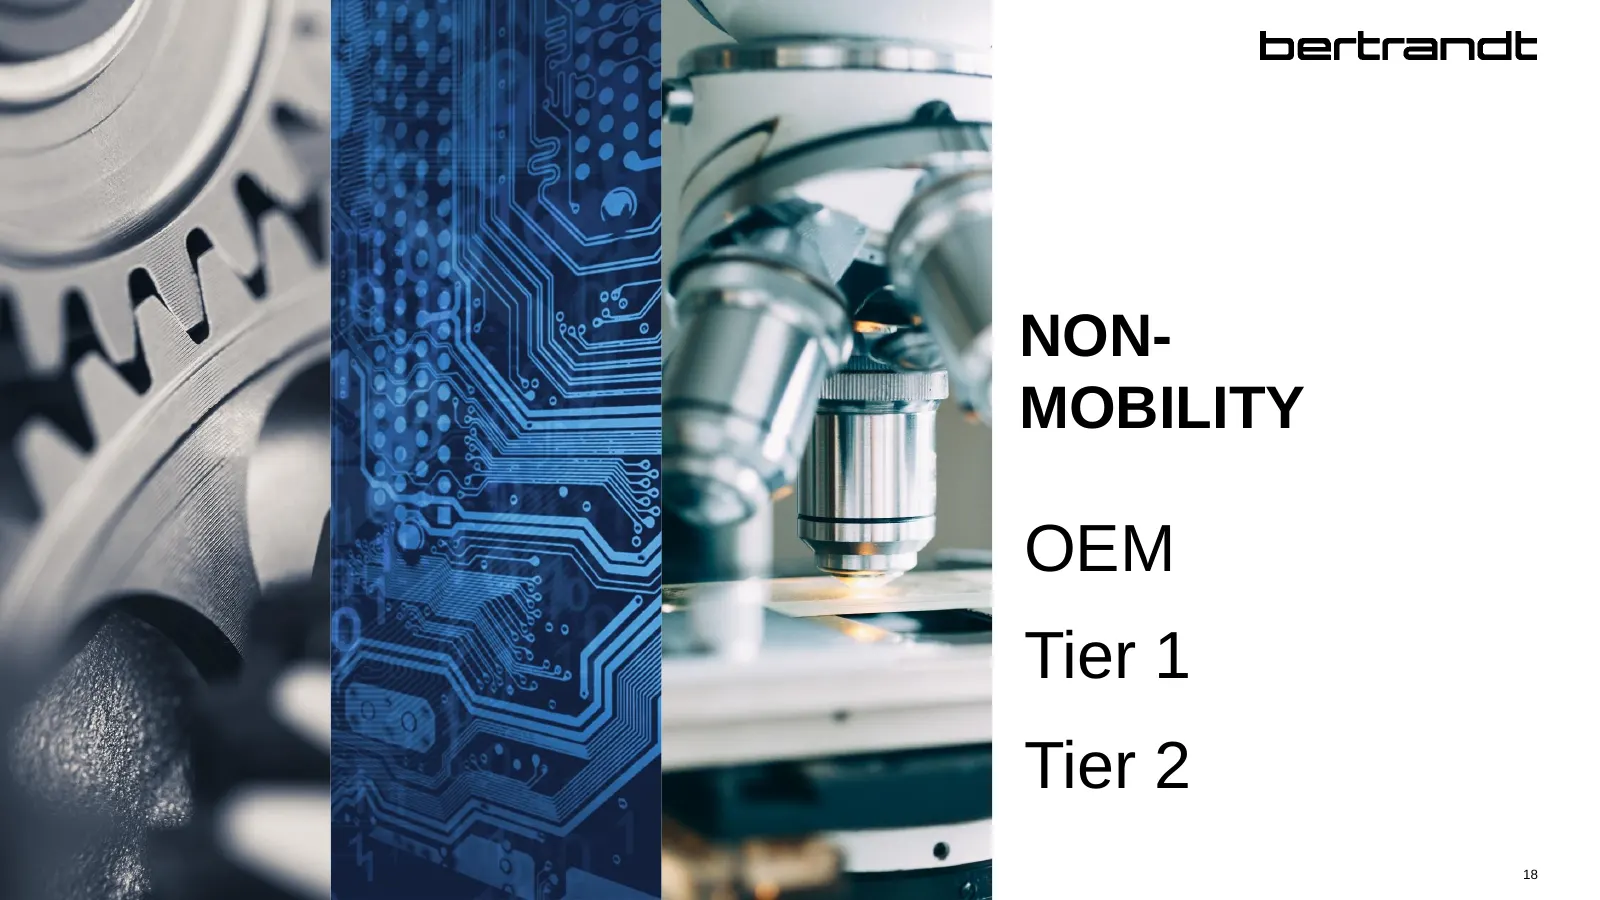
NON- MOBILITY OEM Tier 1 Tier 2 18
Slide 20: Services and solutions
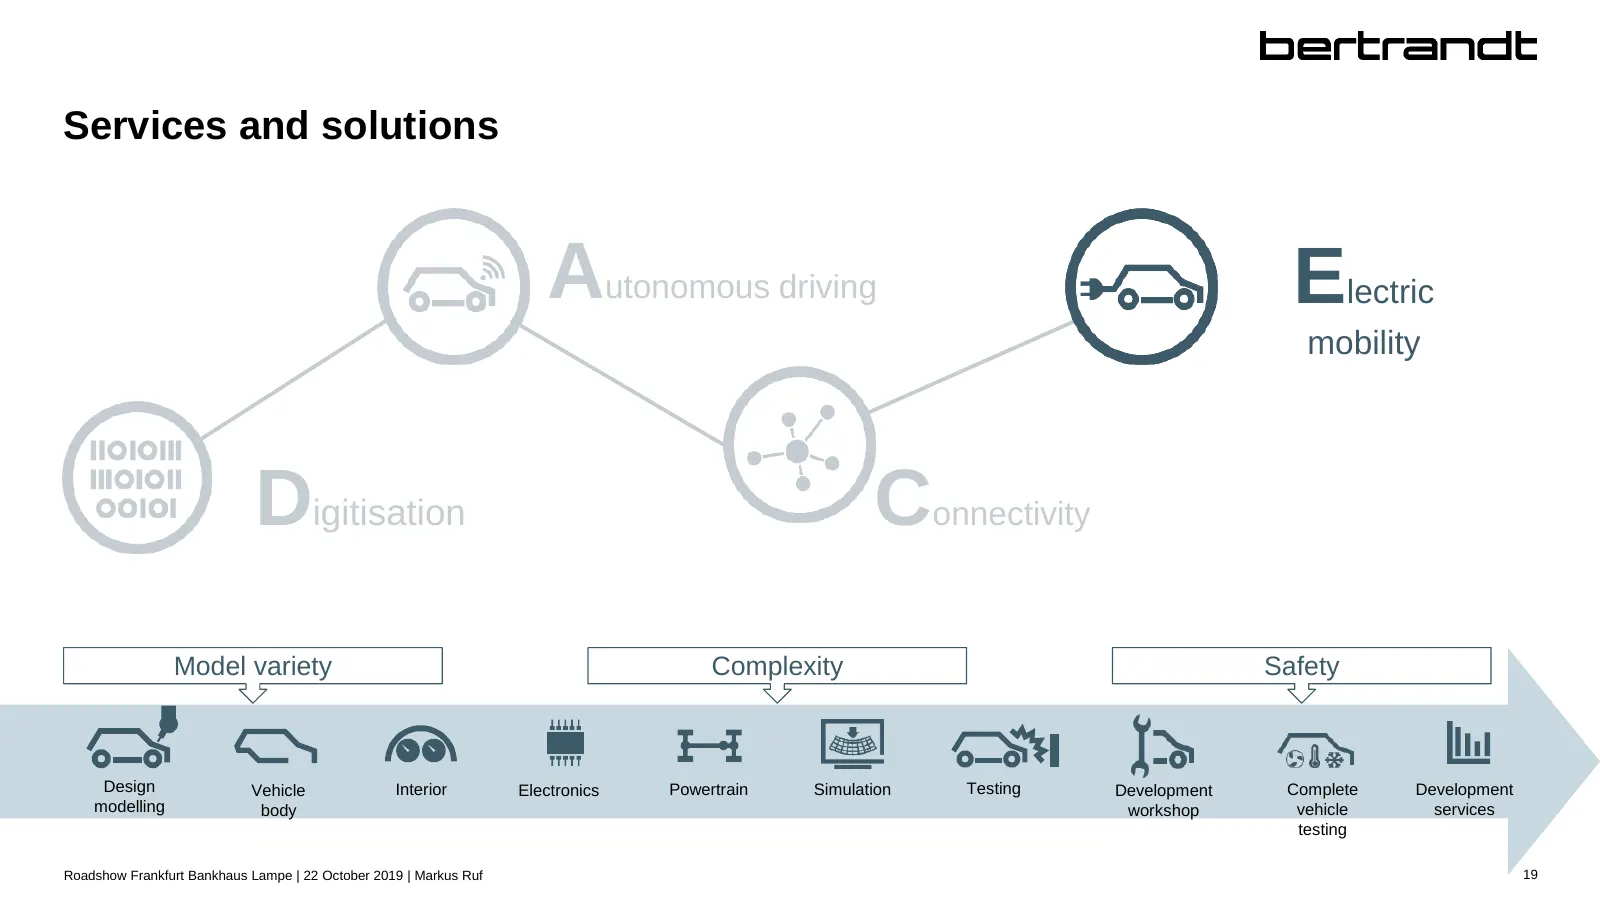
Services and solutions Autonomous driving Electric mobility Digitisation Connectivity Model variety Complexity Safety Design Vehicle Interior Electronics Powertrain Simulation Testing Development Complete Development modelling body workshop vehicle services testing Roadshow Frankfurt Bankhaus Lampe
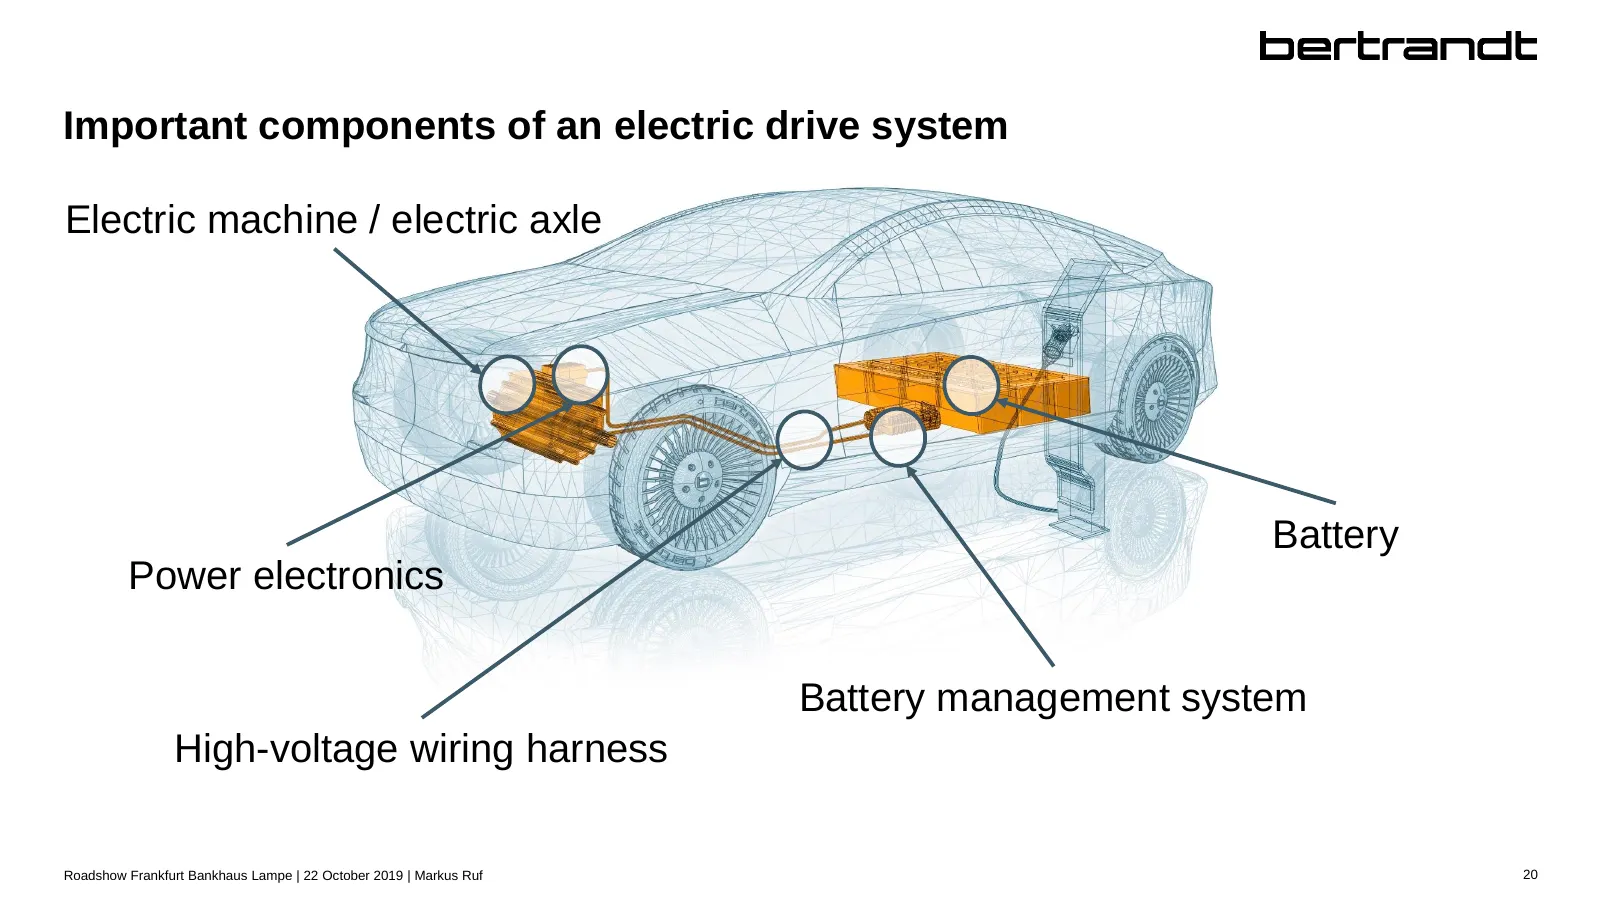
Slide 21: Important components of an electric drive system
Important components of an electric drive system Electric machine / electric axle Battery Power electronics Battery management system High-voltage wiring harness Roadshow Frankfurt Bankhaus Lampe | 22 October 2019 | Markus Ruf 20
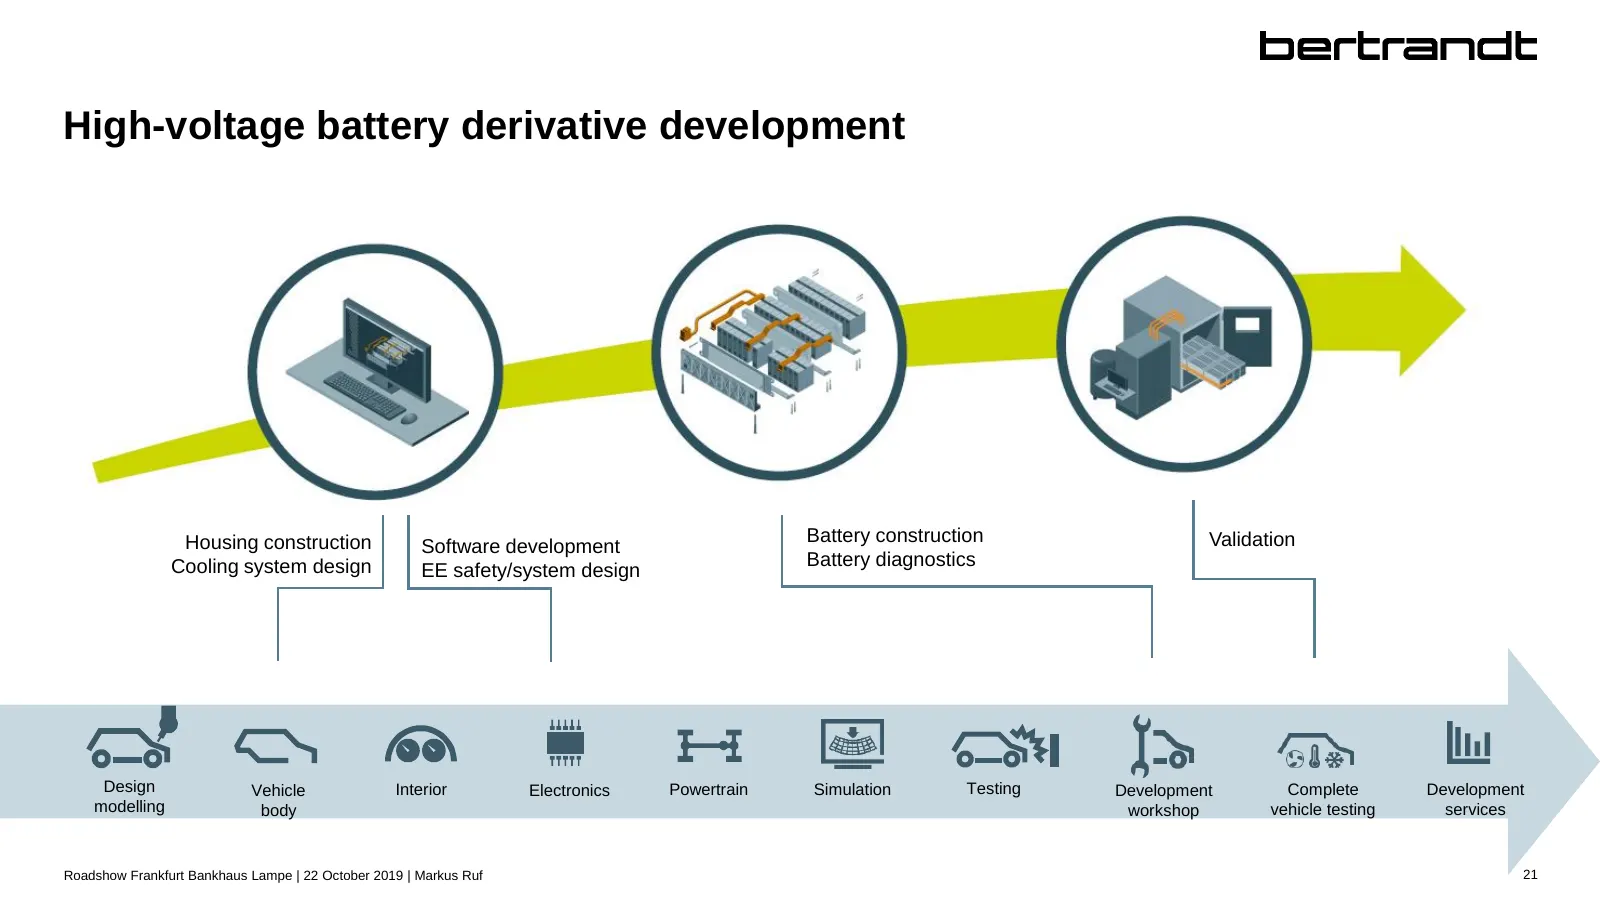
Slide 22: High-voltage battery derivative development
High-voltage battery derivative development Housing construction Battery construction Validation Software development Cooling system design Battery diagnostics EE safety/system design Design Vehicle Interior Electronics Powertrain Simulation Testing Development Complete Development modelling body wo
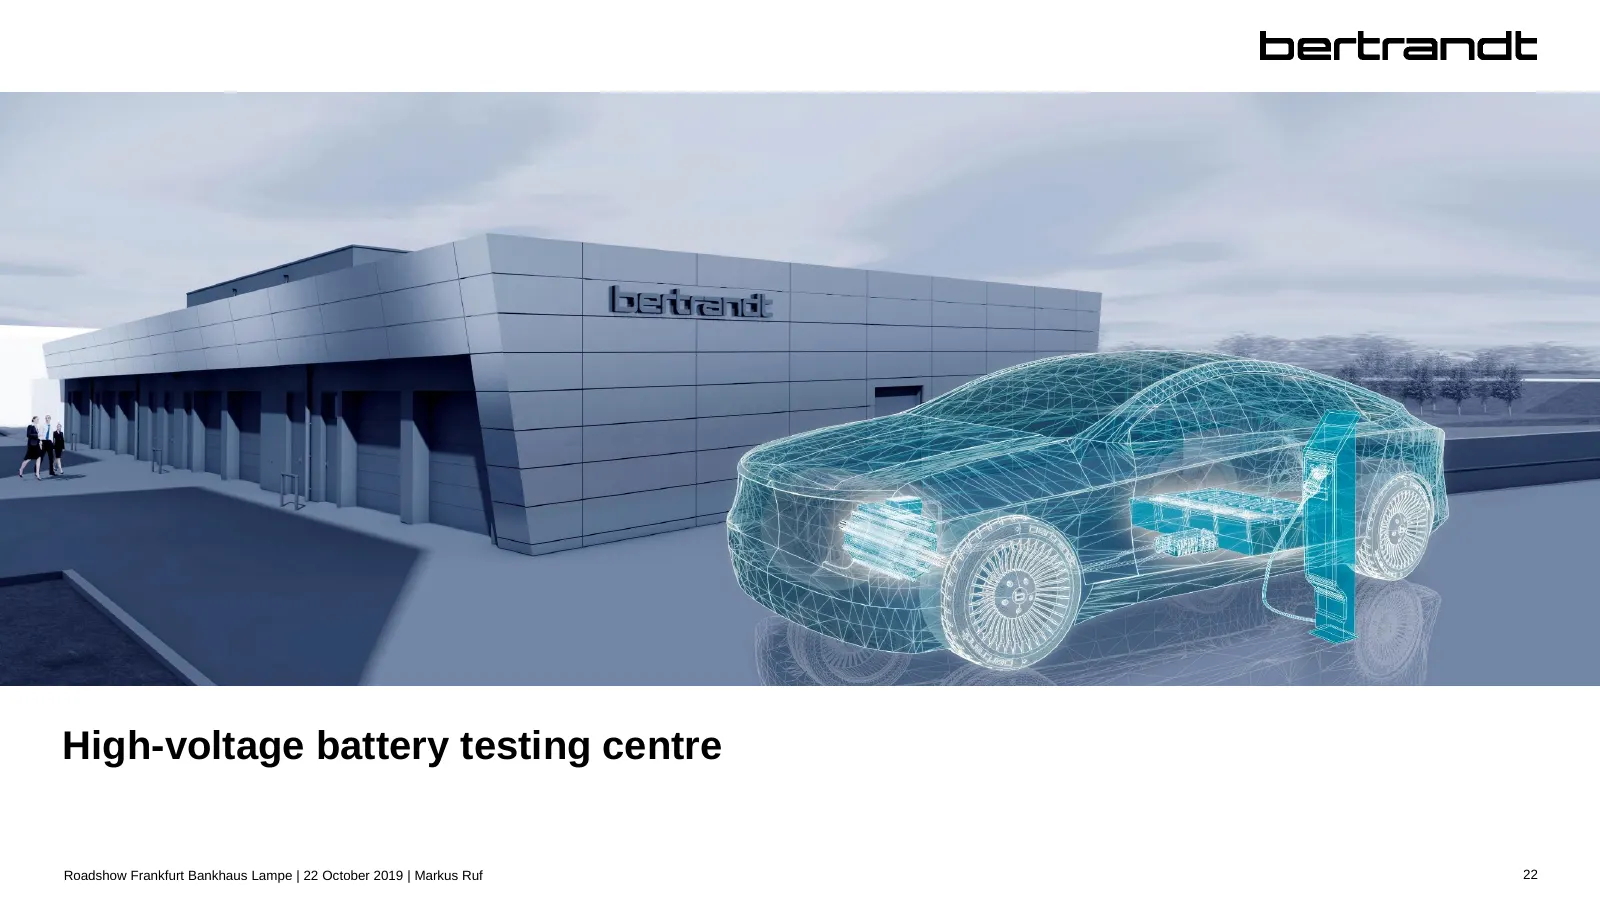
Slide 23: High-voltage battery testing centre
High-voltage battery testing centre Roadshow Frankfurt Bankhaus Lampe | 22 October 2019 | Markus Ruf 22
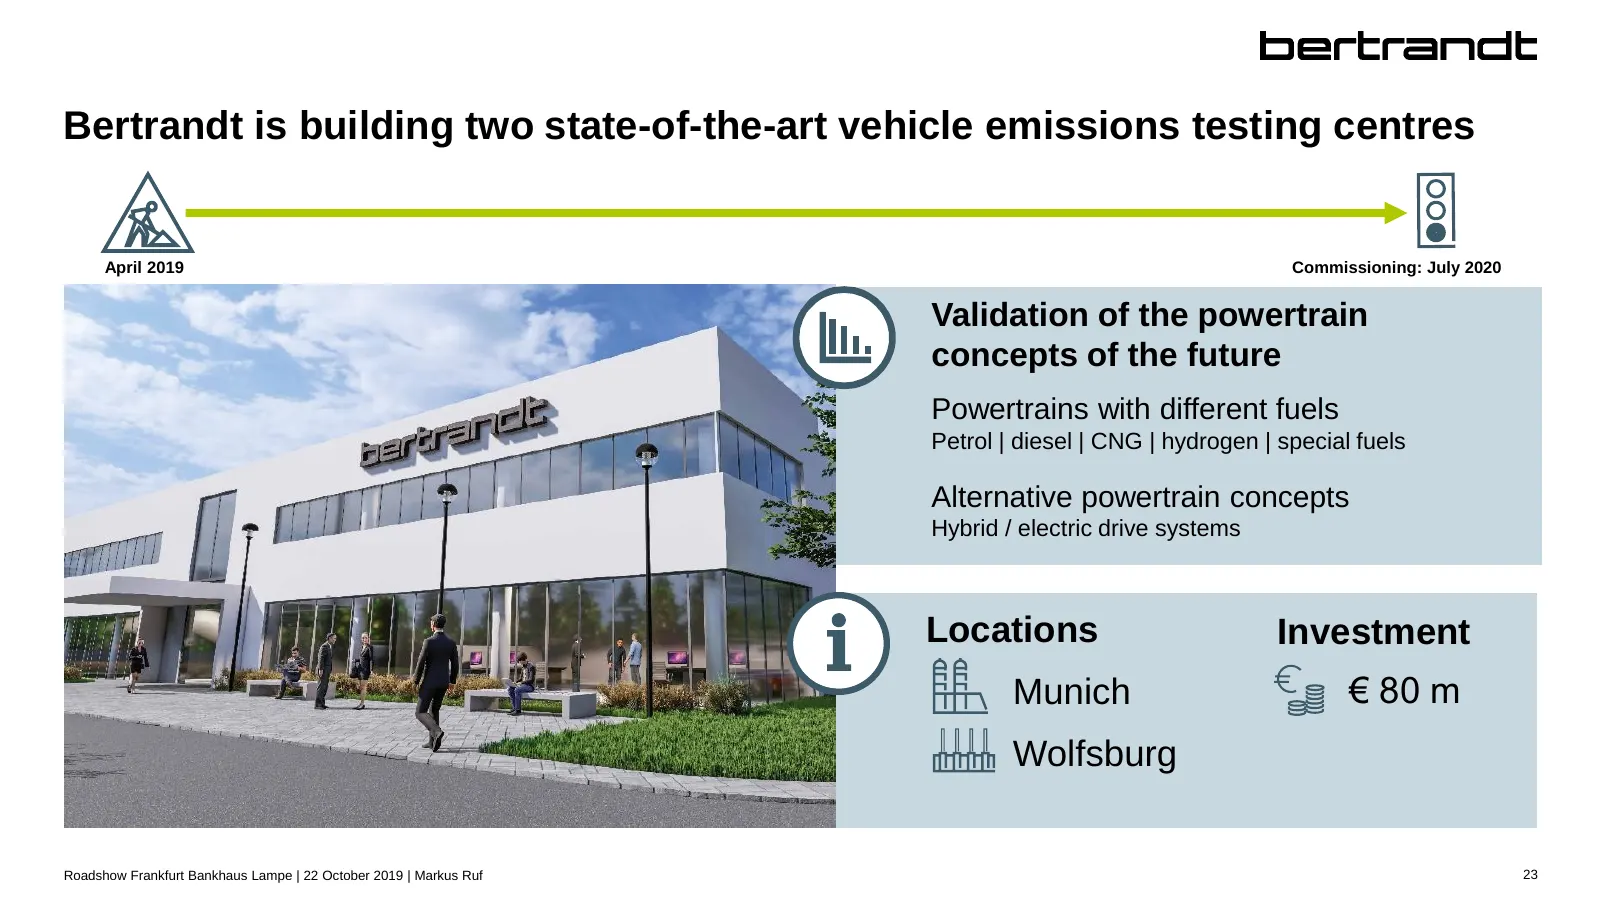
Slide 24: Two state-of-the-art vehicle emissions testing centres
Bertrandt is building two state-of-the-art vehicle emissions testing centres April 2019 Commissioning: July 2020 Validation of the powertrain concepts of the future Powertrains with different fuels Petrol | diesel | CNG | hydrogen | special fuels Alternative powertrain concepts Hybrid / electric dri
Slide 25: Services and solutions
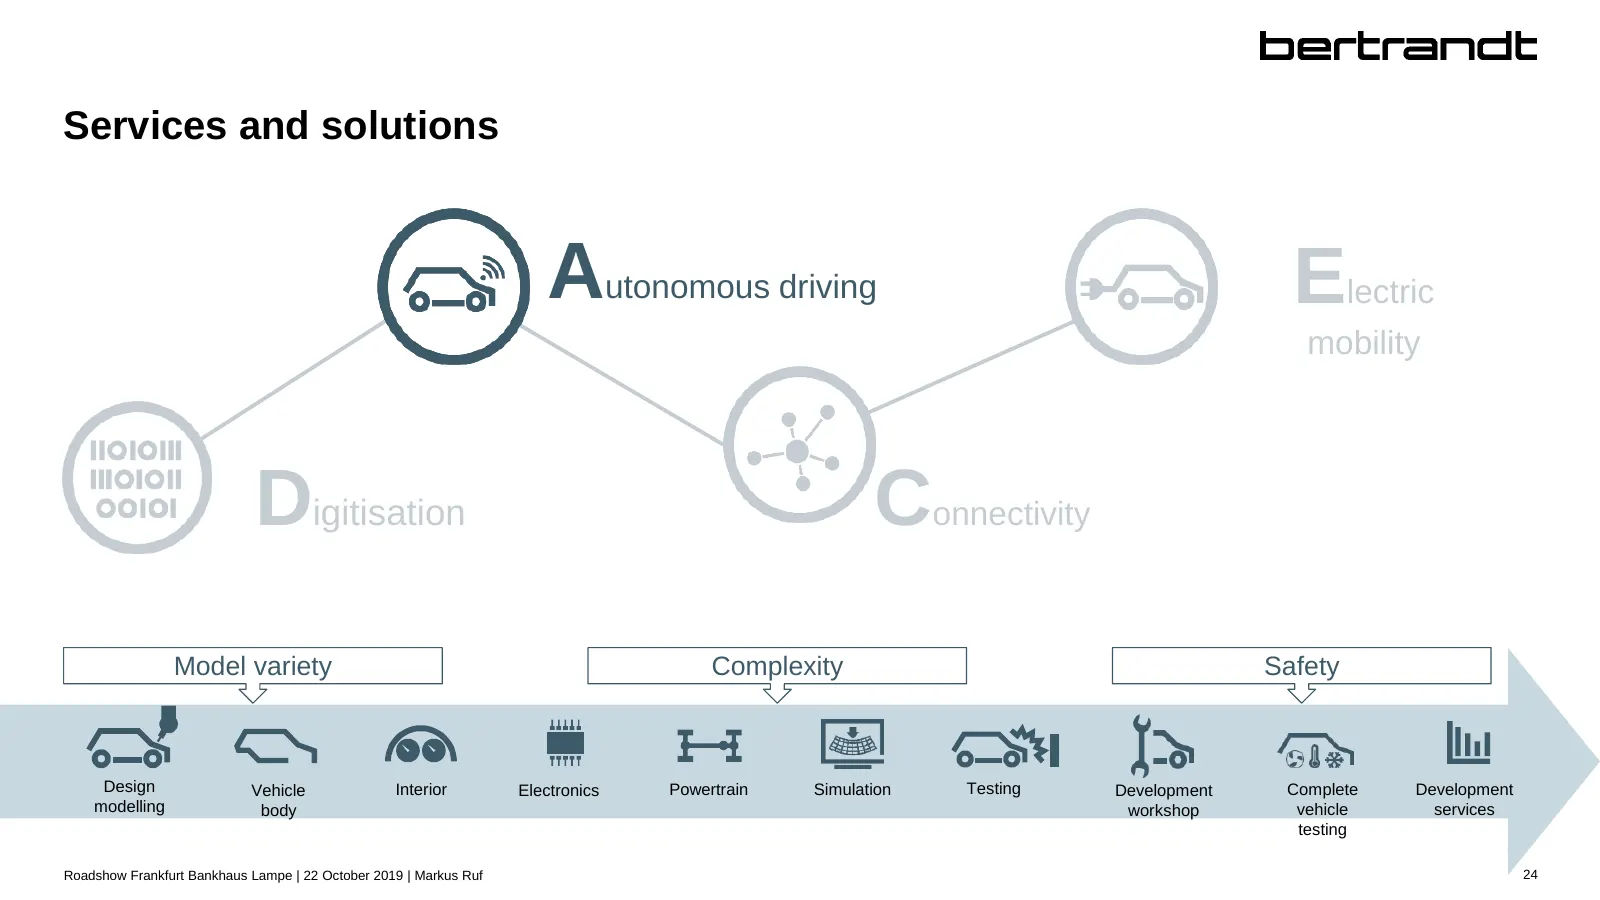
Services and solutions Autonomous driving Electric mobility Digitisation Connectivity Model variety Complexity Safety Design Vehicle Interior Electronics Powertrain Simulation Testing Development Complete Development modelling body workshop vehicle services testing Roadshow Frankfurt Bankhaus Lampe
Slide 26: Autonomous driving – development of driver assistance systems
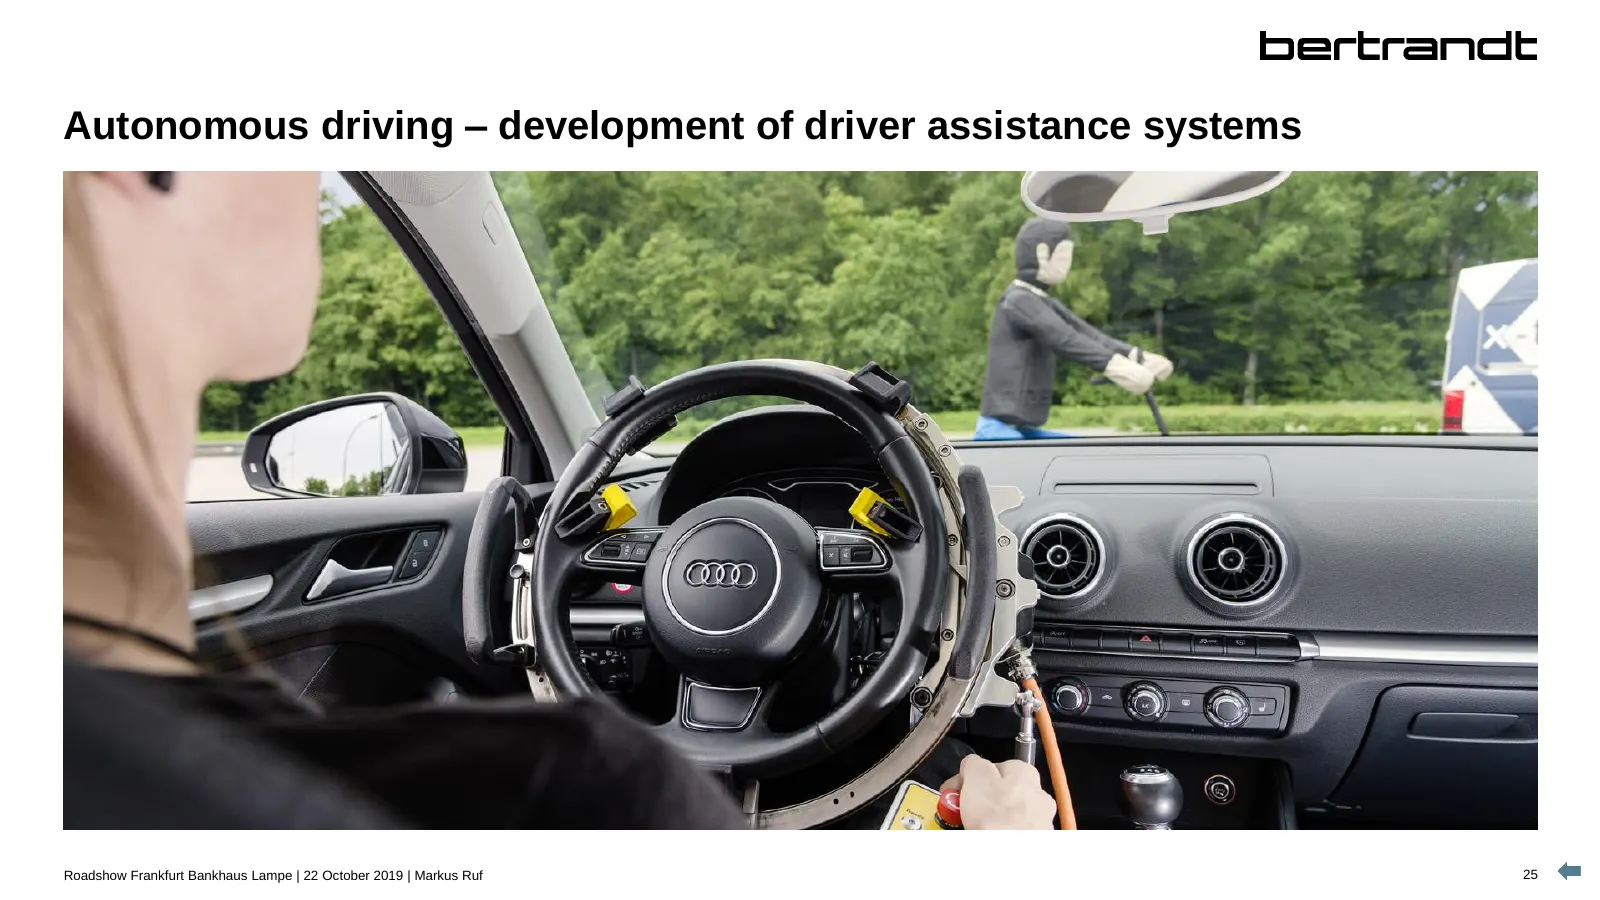
Autonomous driving – development of driver assistance systems Roadshow Frankfurt Bankhaus Lampe | 22 October 2019 | Markus Ruf 25
Slide 27: Autonomous driving – validation of driver assistance systems
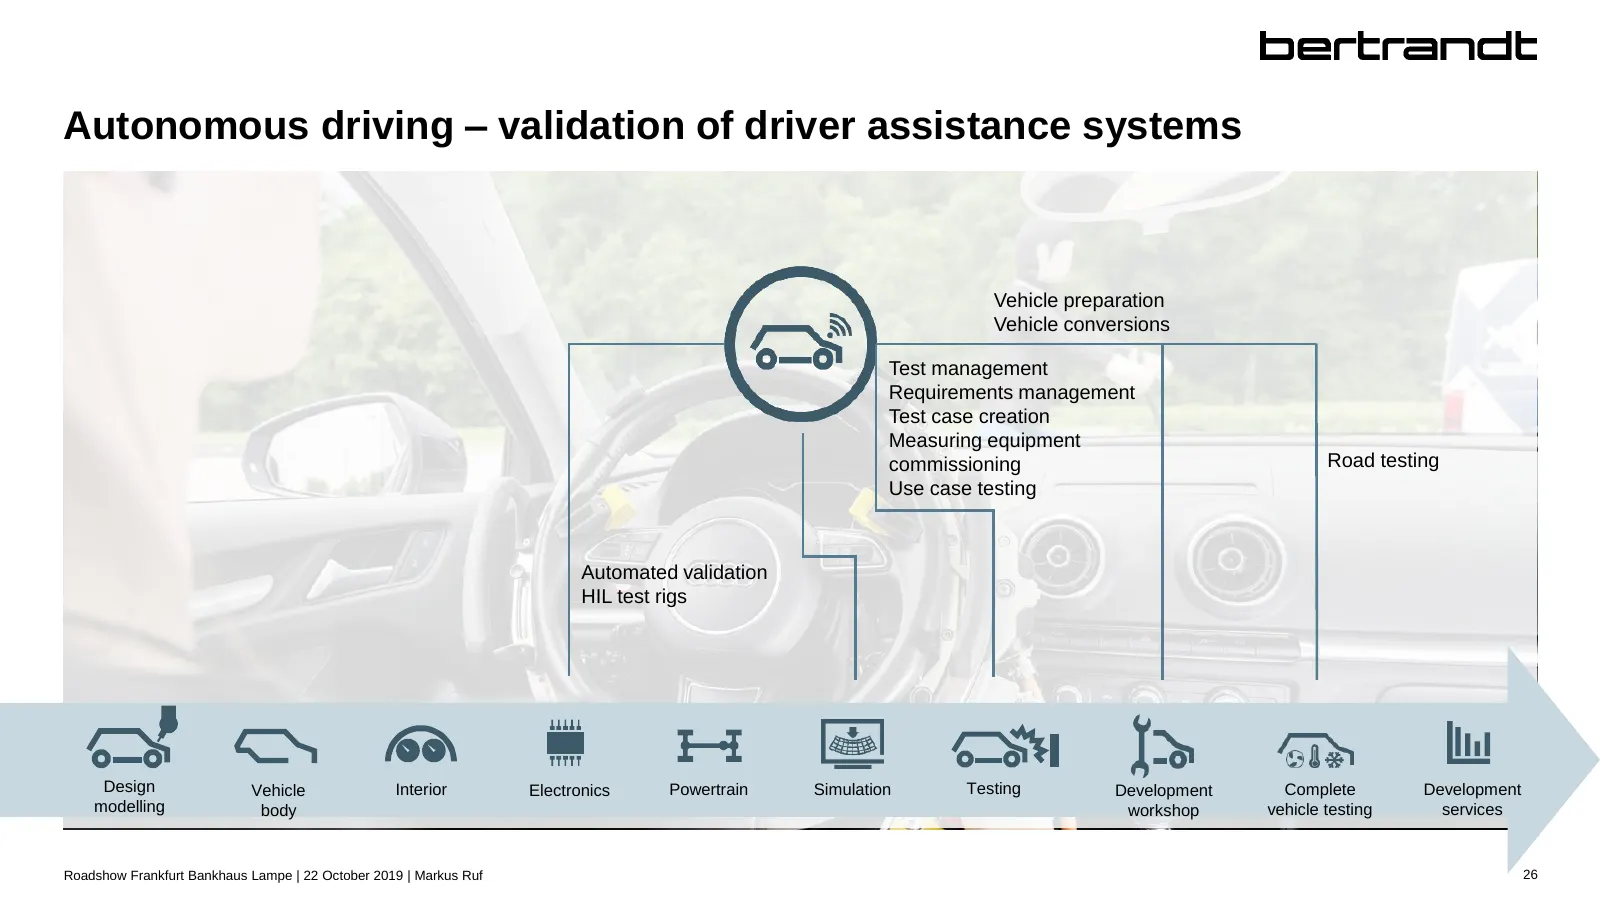
Autonomous driving – validation of driver assistance systems Vehicle preparation Vehicle conversions Test management Requirements management Test case creation Measuring equipment commissioning Road testing Use case testing Automated validation HIL test rigs Design Vehicle Interior Electronics Power
Slide 28: Services and solutions
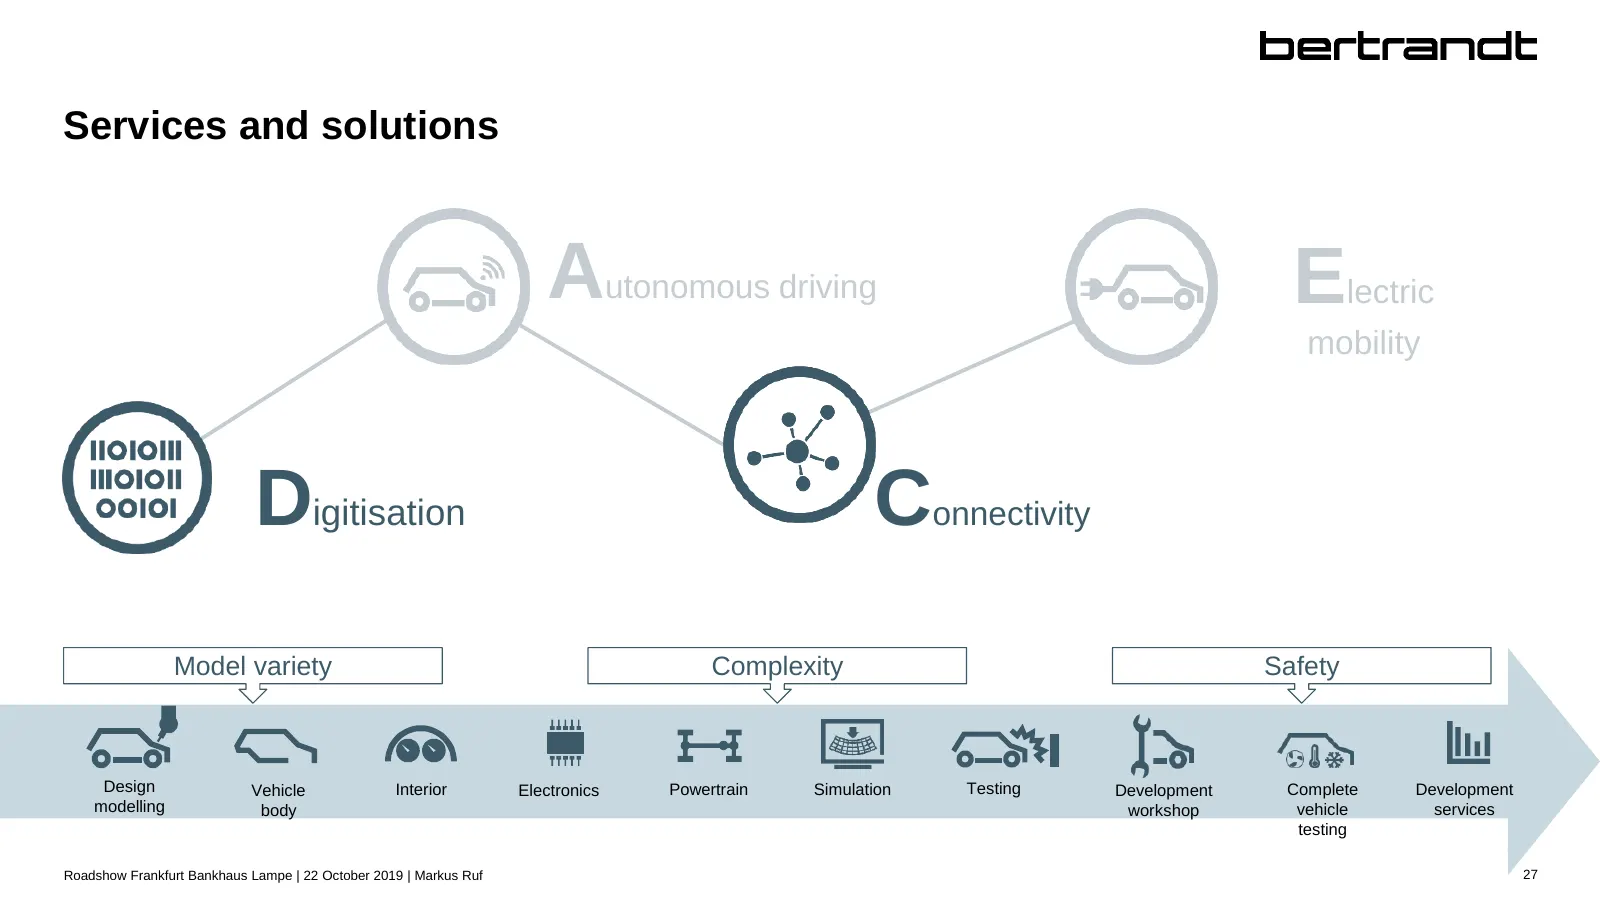
Services and solutions Autonomous driving Electric mobility Digitisation Connectivity Model variety Complexity Safety Design Vehicle Interior Electronics Powertrain Simulation Testing Development Complete Development modelling body workshop vehicle services testing Roadshow Frankfurt Bankhaus Lampe
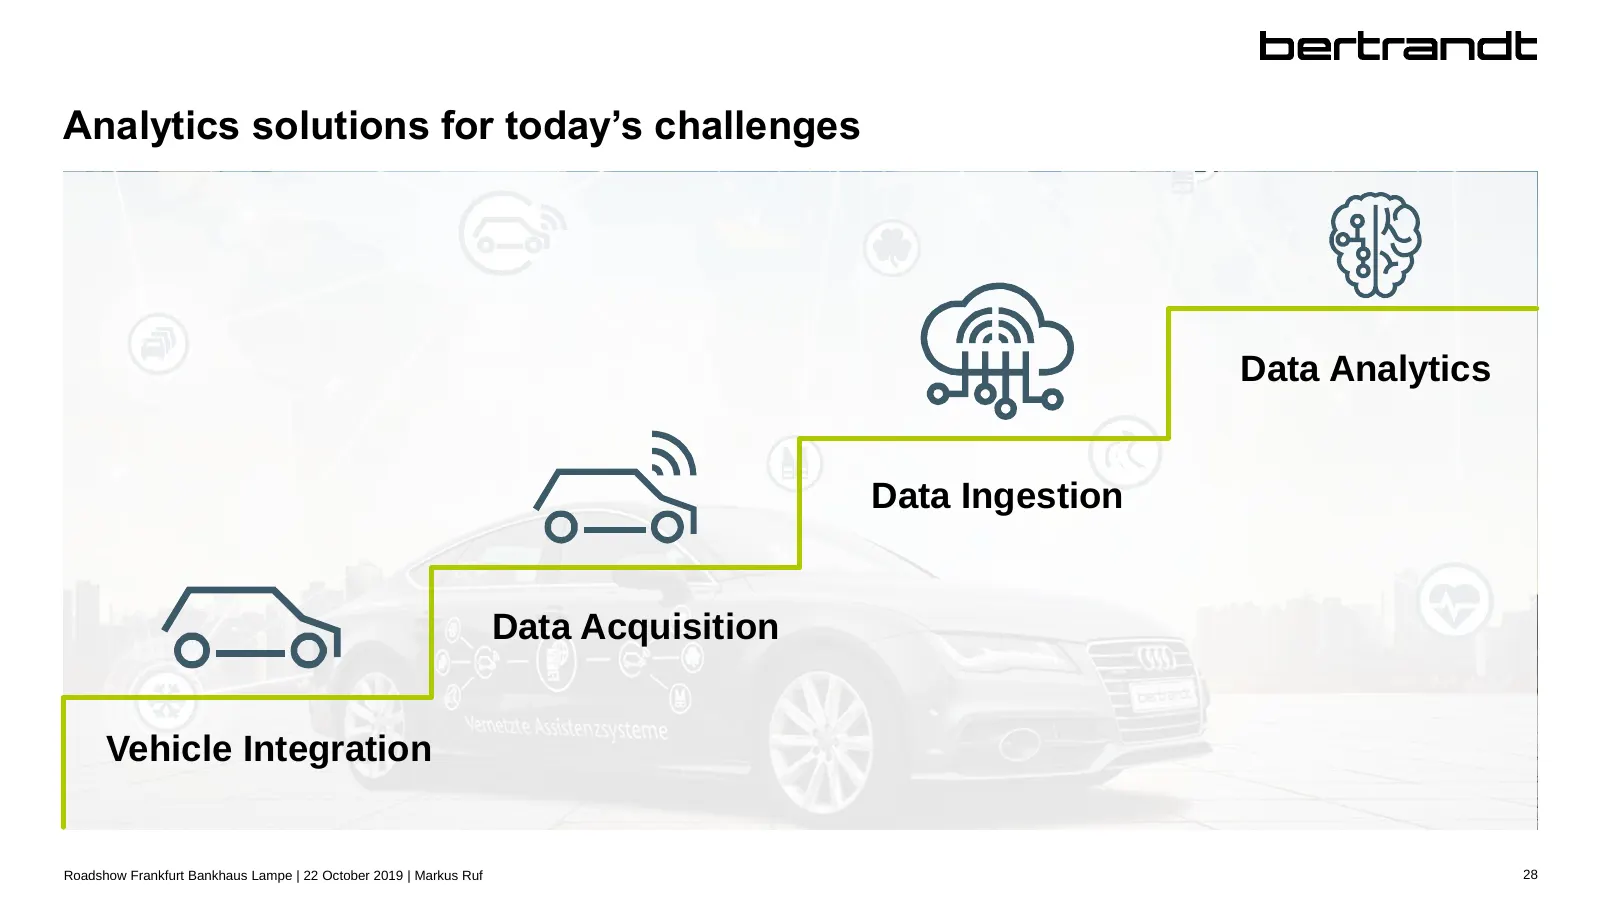
Slide 29: Analytics solutions for today's challenges
Analytics solutions for today’s challenges Data Analytics Data Ingestion Data Acquisition Vehicle Integration Roadshow Frankfurt Bankhaus Lampe | 22 October 2019 | Markus Ruf 28
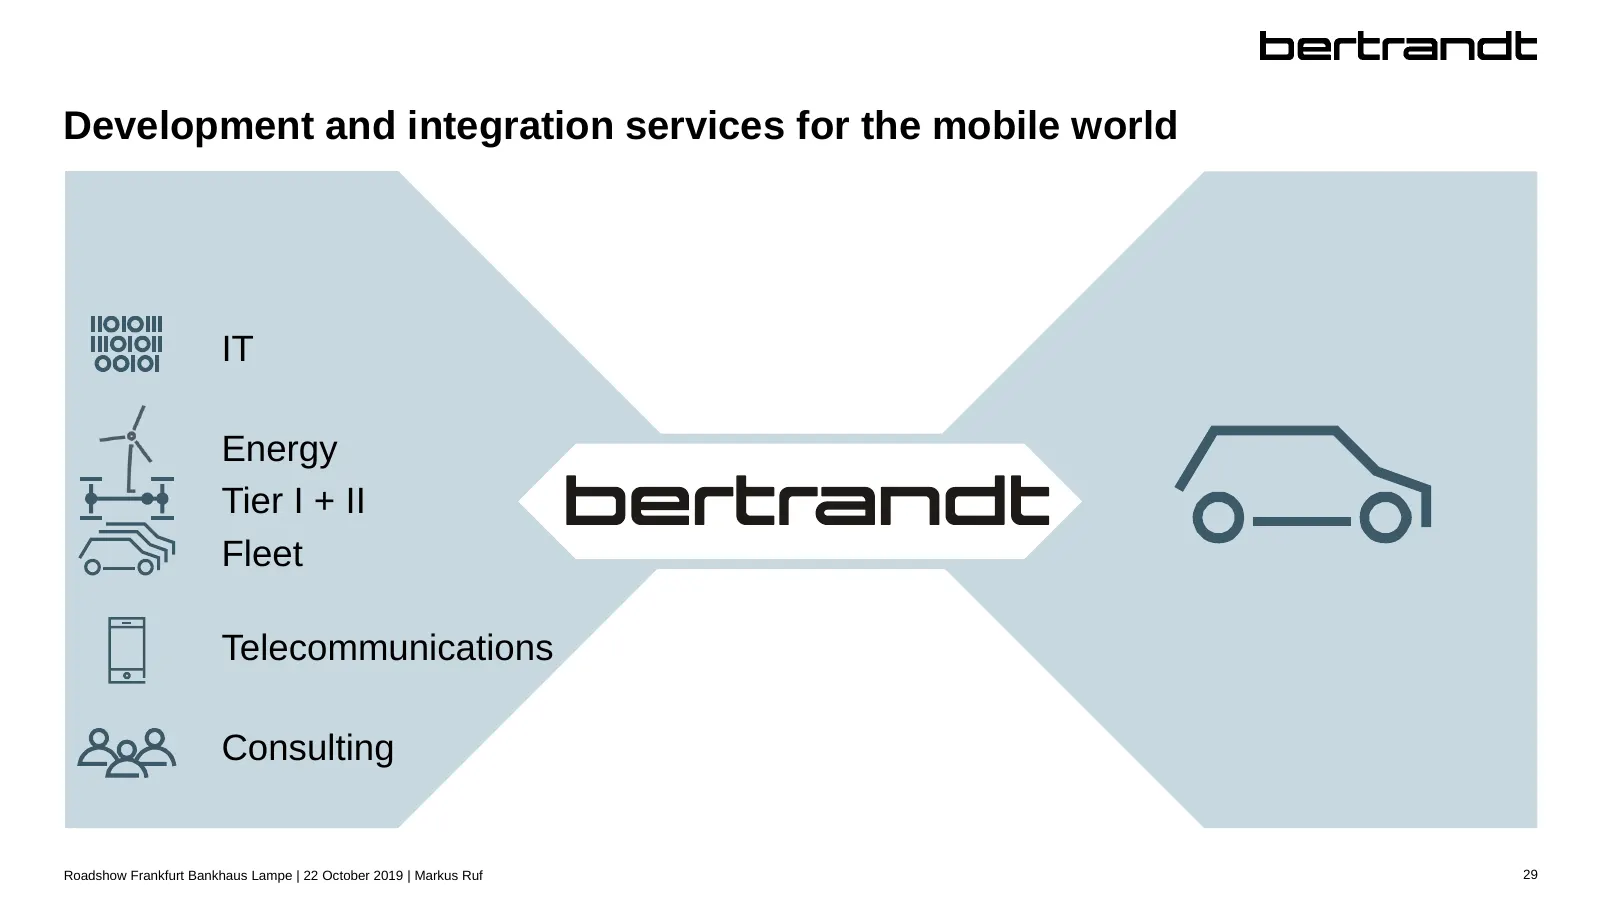
Slide 30: Development and integration services for the mobile world
Development and integration services for the mobile world IT Energy Tier I + II Fleet Telecommunications Consulting Roadshow Frankfurt Bankhaus Lampe | 22 October 2019 | Markus Ruf 29
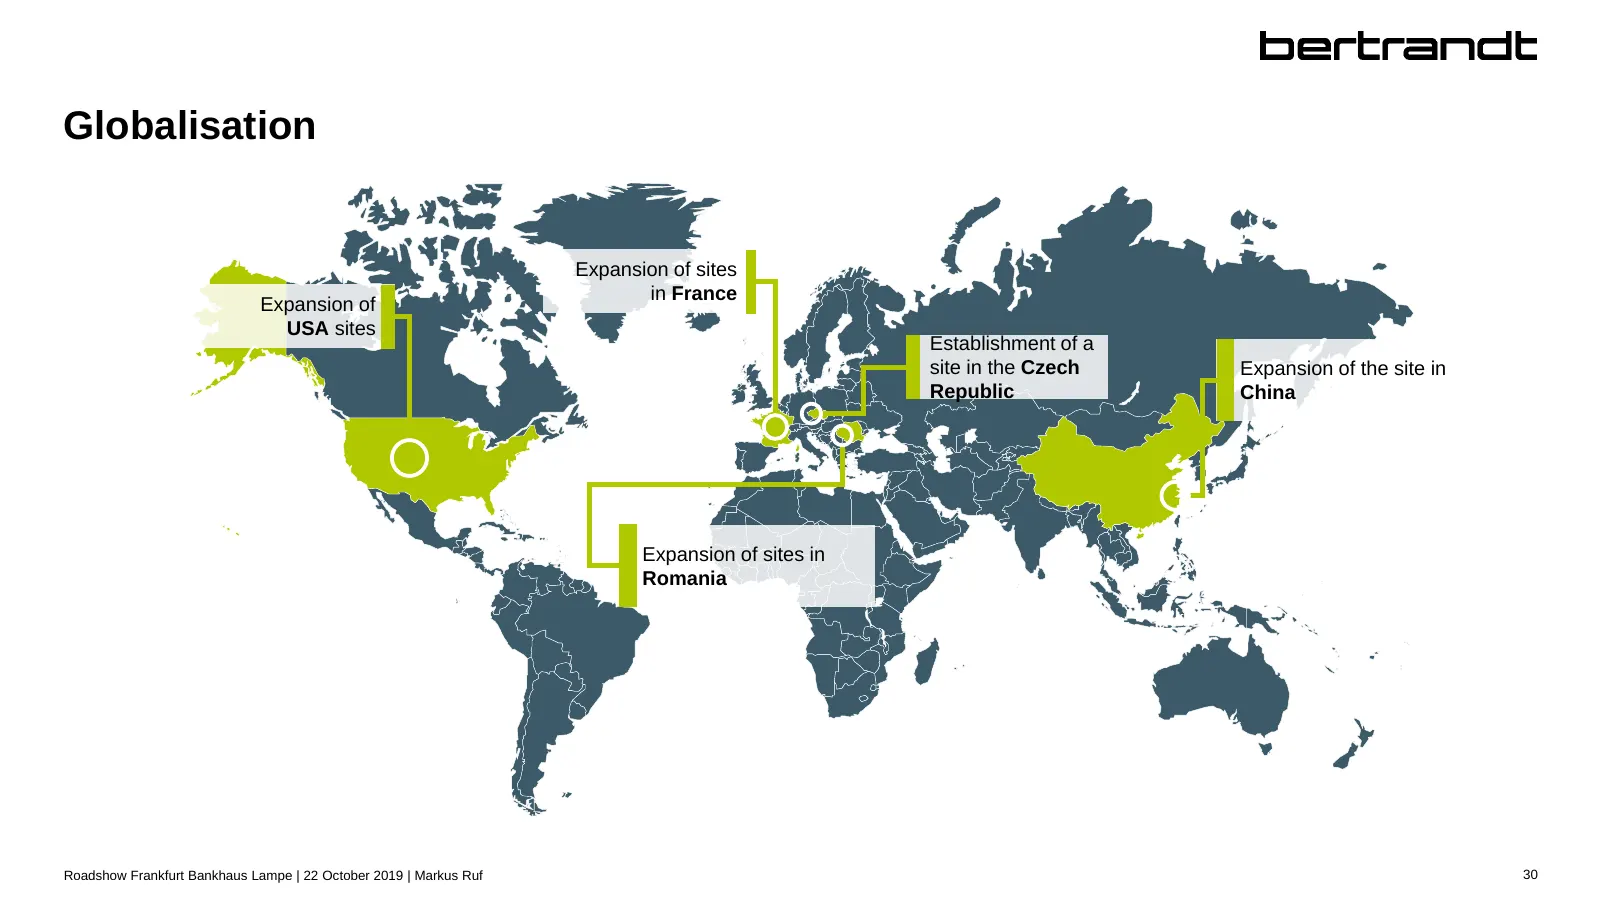
Slide 31: Globalisation
Globalisation Expansion of sites in France Expansion of USA sites Establishment of a site in the Czech Expansion of the site in Republic China Expansion of sites in Romania Roadshow Frankfurt Bankhaus Lampe | 22 October 2019 | Markus Ruf 30
Slide 32: First three quarters of fiscal 2018/2019
First three quarters of fiscal 2018/2019 All ratios refer to the Group Roadshow Frankfurt Bankhaus Lampe | 22 October 2019 | Markus Ruf 31
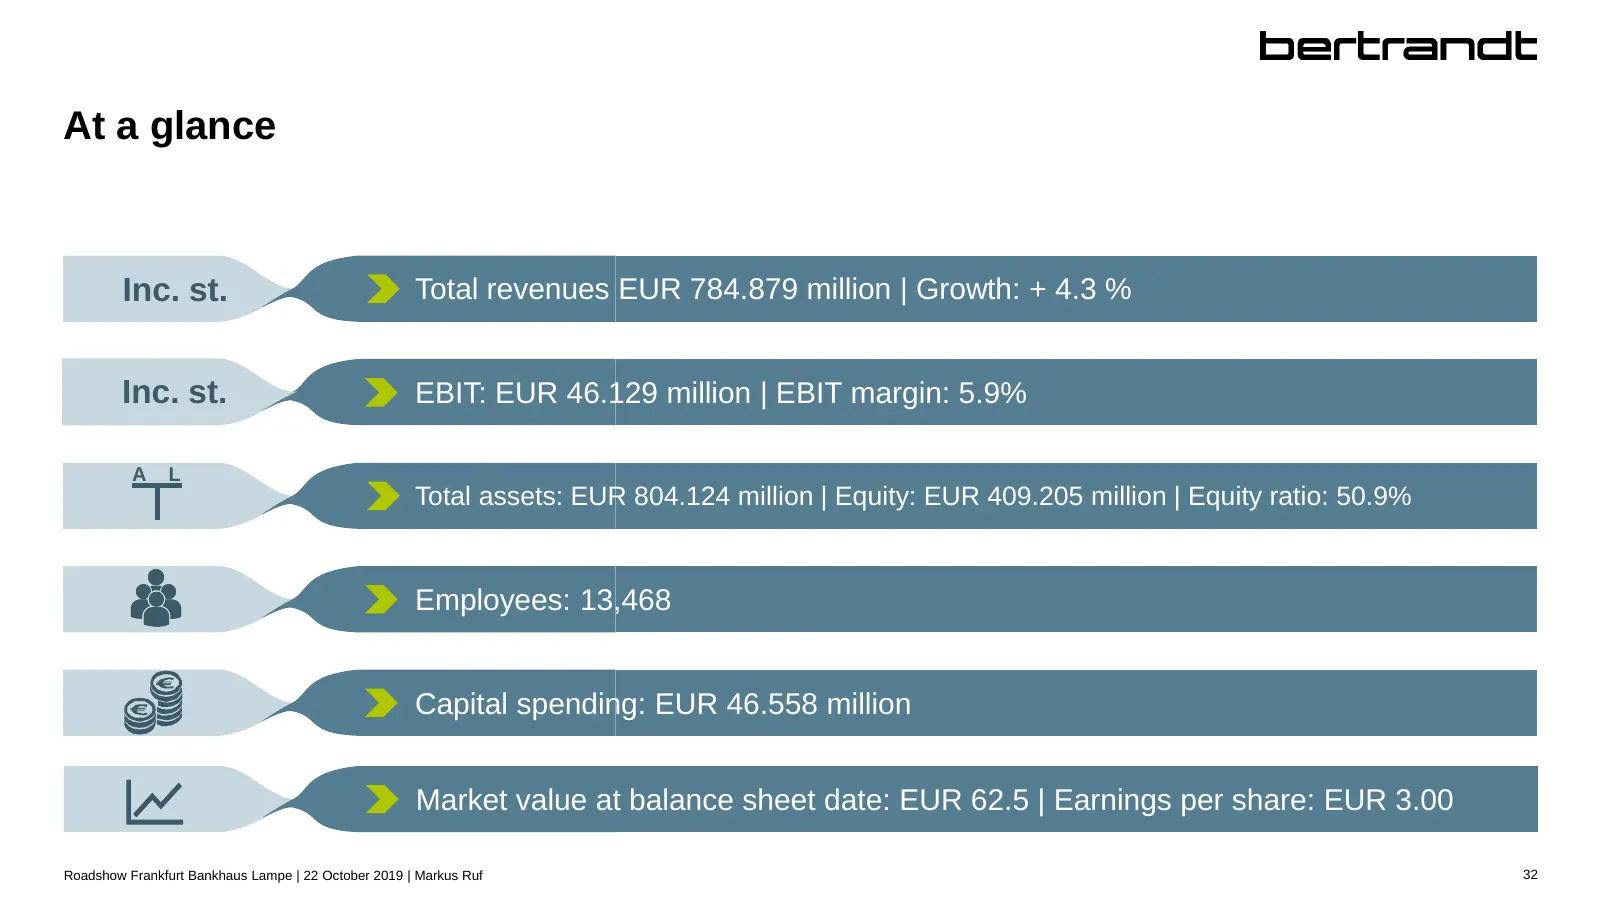
Slide 33: At a glance
At a glance Inc. st. Total revenues EUR 784.879 million | Growth: + 4.3 % Inc. st. EBIT: EUR 46.129 million | EBIT margin: 5.9% A L Total assets: EUR 804.124 million | Equity: EUR 409.205 million | Equity ratio: 50.9% Employees: 13,468 Capital spending: EUR 46.558 million Market value at balance she
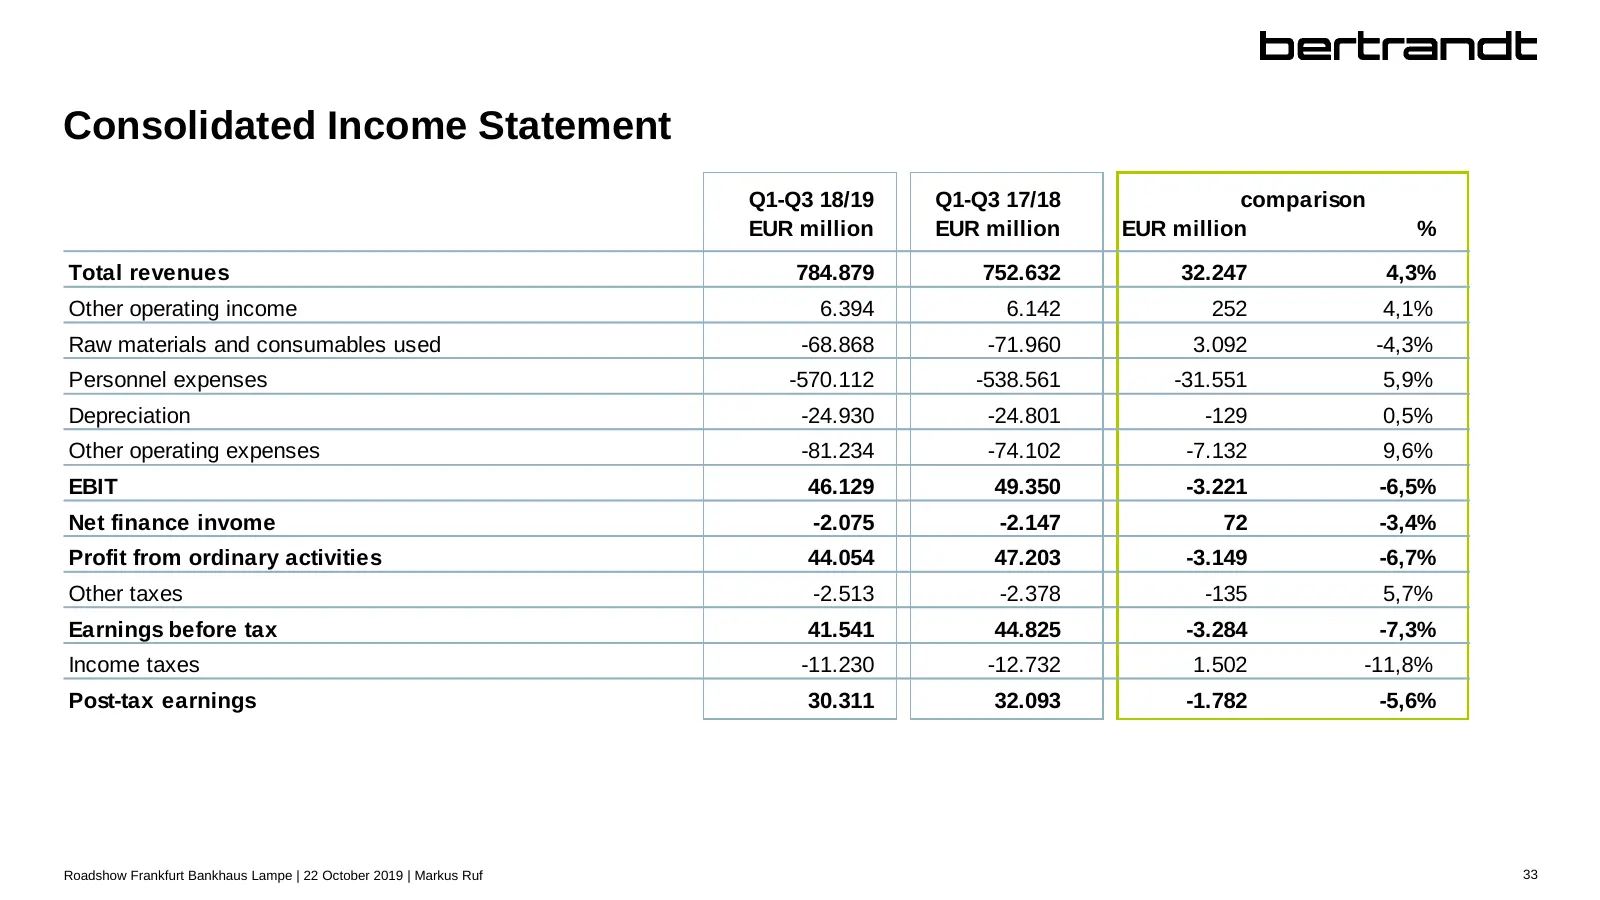
Slide 34: Consolidated Income Statement
Consolidated Income Statement Q1-Q3 18/19 Q1-Q3 17/18 comparison EUR million EUR million EUR million % Total revenues 784.879 752.632 32.247 4,3% Other operating income 6.394 6.142 252 4,1% Raw materials and consumables used -68.868 -71.960 3.092 -4,3% Personnel expenses -570.112 -538.561 -31.551 5,
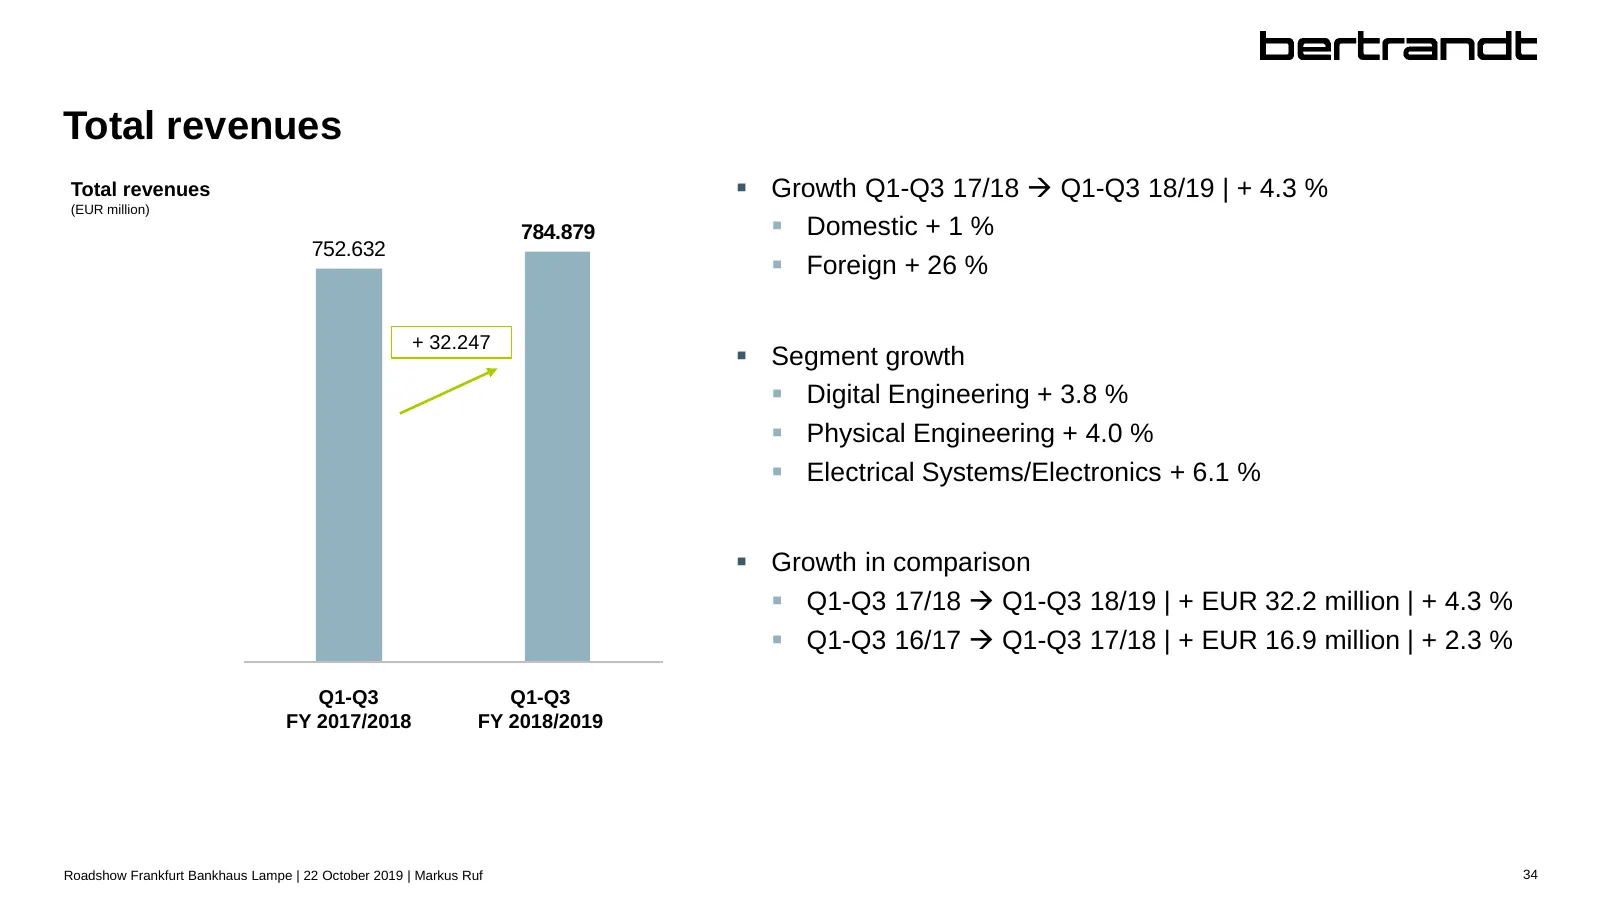
Slide 35: Total revenues
Total revenues Total revenues Growth Q1-Q3 17/18 Q1-Q3 18/19 | + 4.3 % (EUR million) 784.879 Domestic + 1 % 752.632 Foreign + 26 % + 32.247 Segment growth Digital Engineering + 3.8 % Physical Engineering + 4.0 % Electrical Systems/Electronics + 6.1 % Growth in comparison Q1-Q3 17
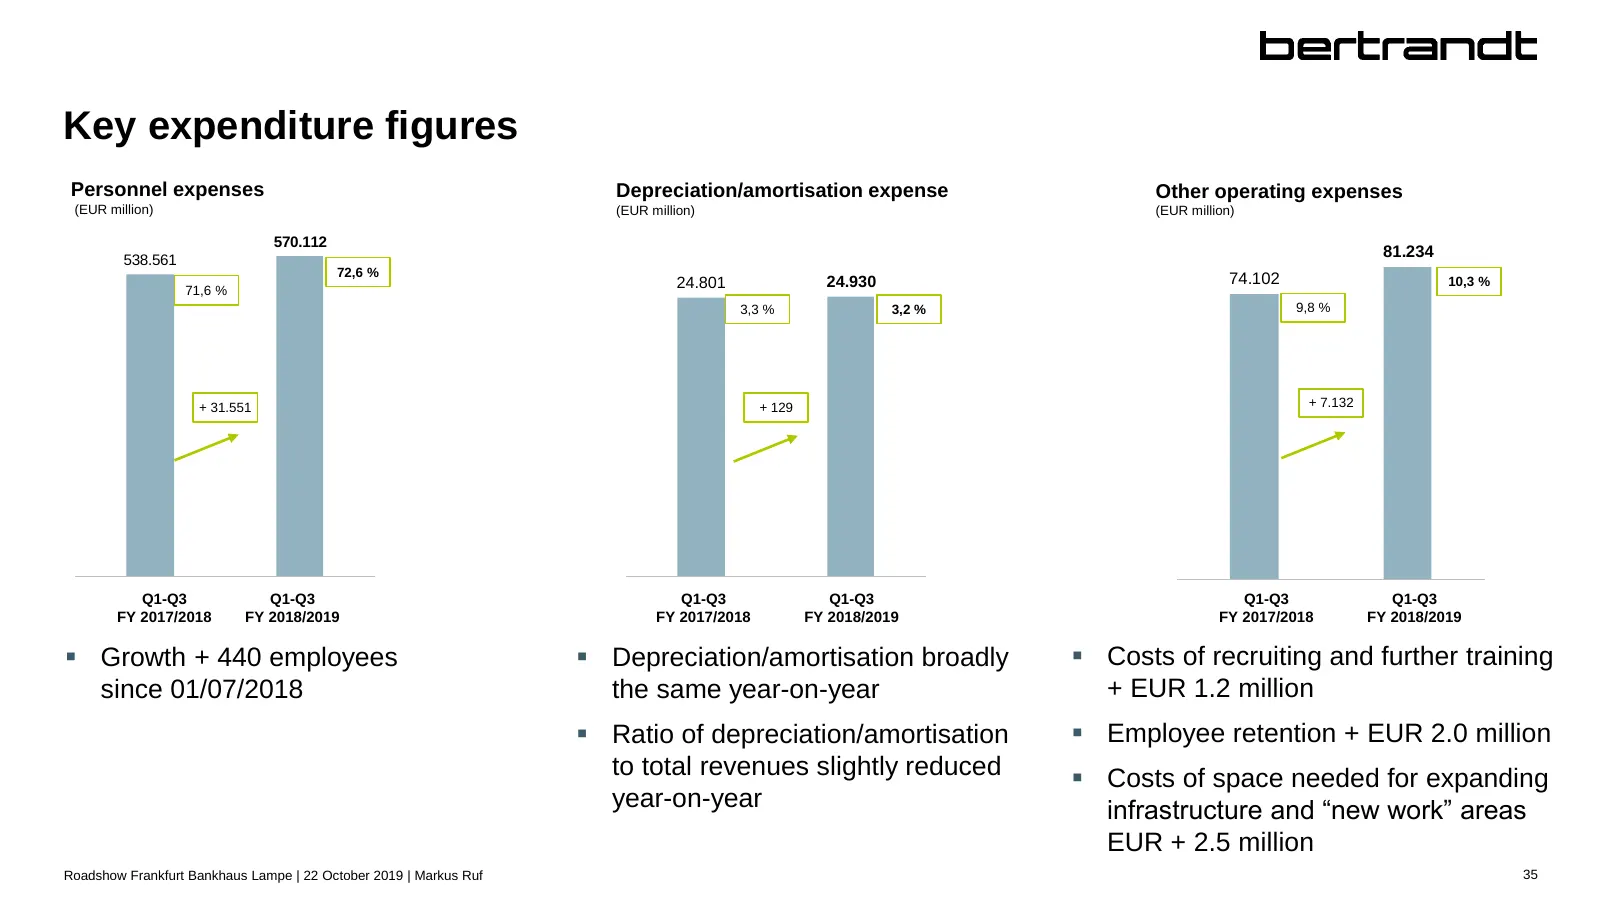
Slide 36: Key expenditure figures
Key expenditure figures Personnel expenses Depreciation/amortisation expense Other operating expenses (EUR million) (EUR million) (EUR million) 570.112 538.561 81.234 72,6 % 24.801 24.930 74.102 10,3 % 71,6 % 3,3 % 3,2 % 9,8 % + 31.551 + 129 + 7.132 Q1Q1-Q3 - Q3 Q1 - Q3 Q1-Q3 Q1 - Q3 Q1-Q3 Q1 - Q3 Q
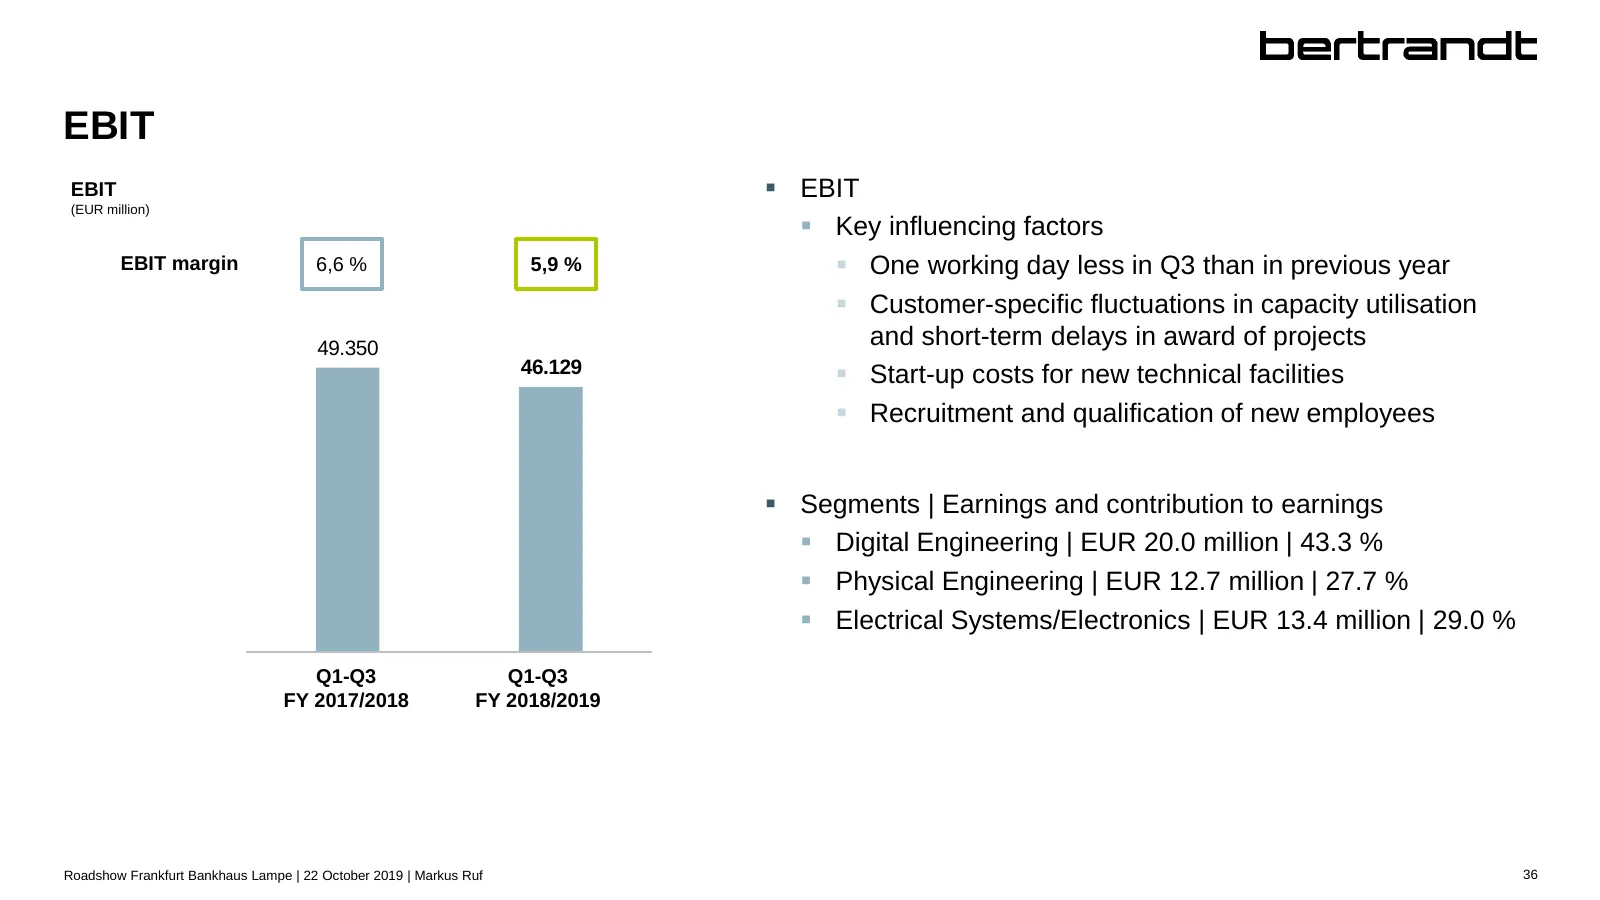
Slide 37: EBIT
EBIT EBIT EBIT (EUR million) Key influencing factors EBIT margin 6,6 % 5,9 % One working day less in Q3 than in previous year Customer-specific fluctuations in capacity utilisation 49.350 and short-term delays in award of projects 46.129 Start-up costs for new technical facilities Recrui
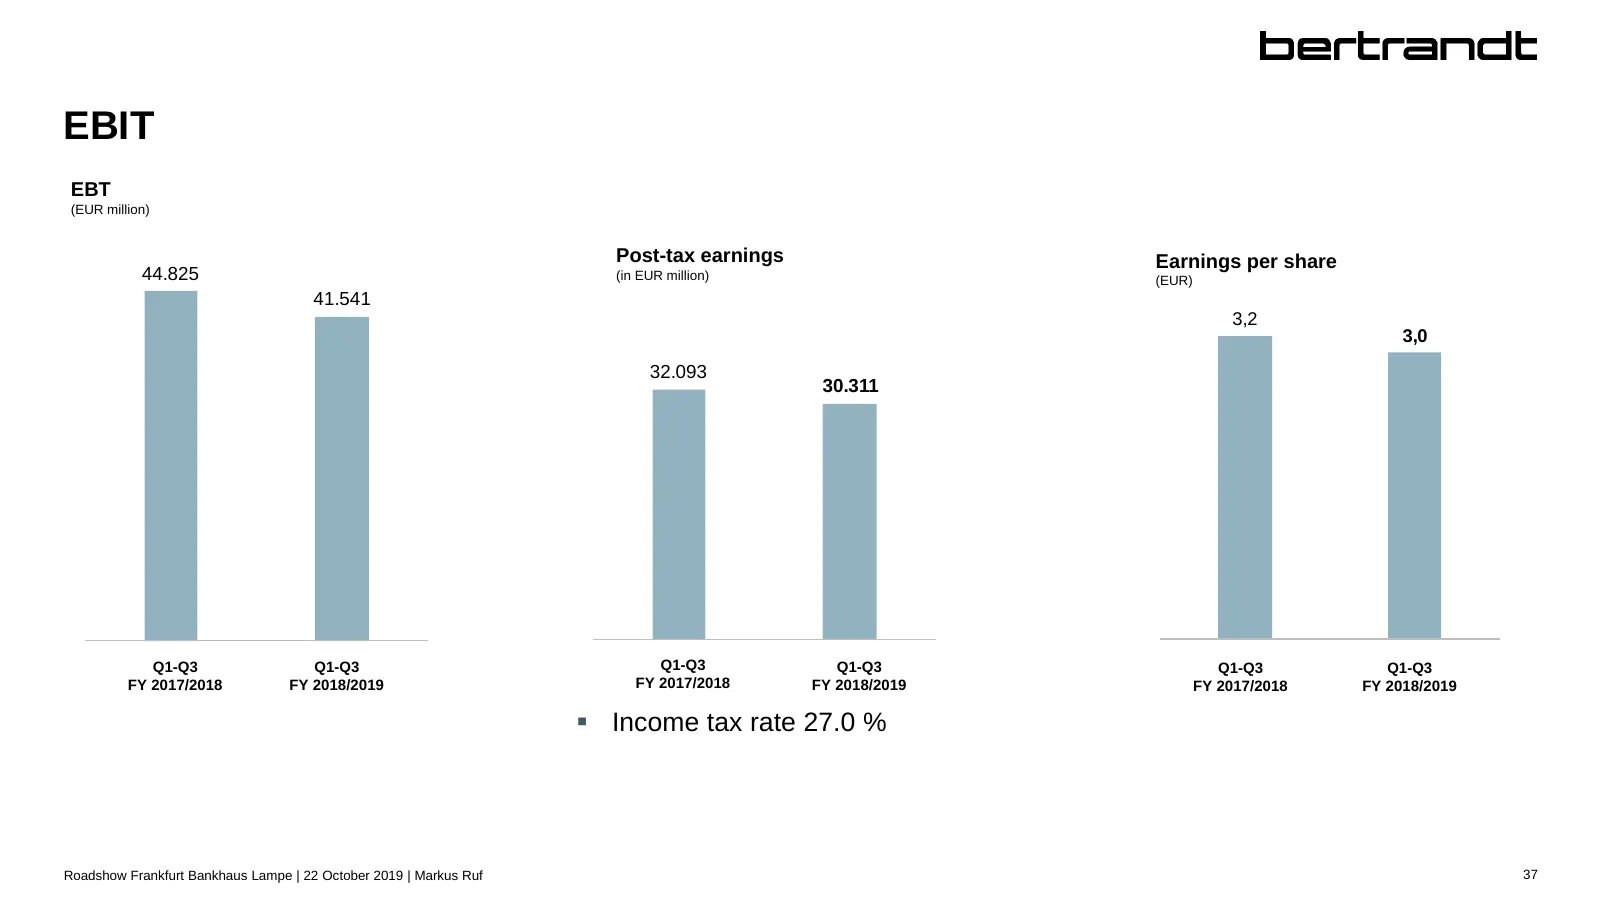
Slide 38: EBT, post-tax earnings and earnings per share
EBIT EBT (EUR million) Post-tax earnings Earnings per share 44.825 (in EUR million) (EUR) 41.541 3,2 3,0 32.093 30.311 Q1 - Q3 Q1-Q3 Q1 - Q3 Q1-Q3 Q1 - Q3 Q1-Q3 Q1Q1-Q3 - Q3 Q1 - Q3 Q1-Q3 Q1 - Q3 Q1-Q3 GJFY2017/2018 2017/2018 GJ 2018/2019 FY 2018/2019 GJFY2017/2018 2017/2018 GJFY2018/2019 2018/2019
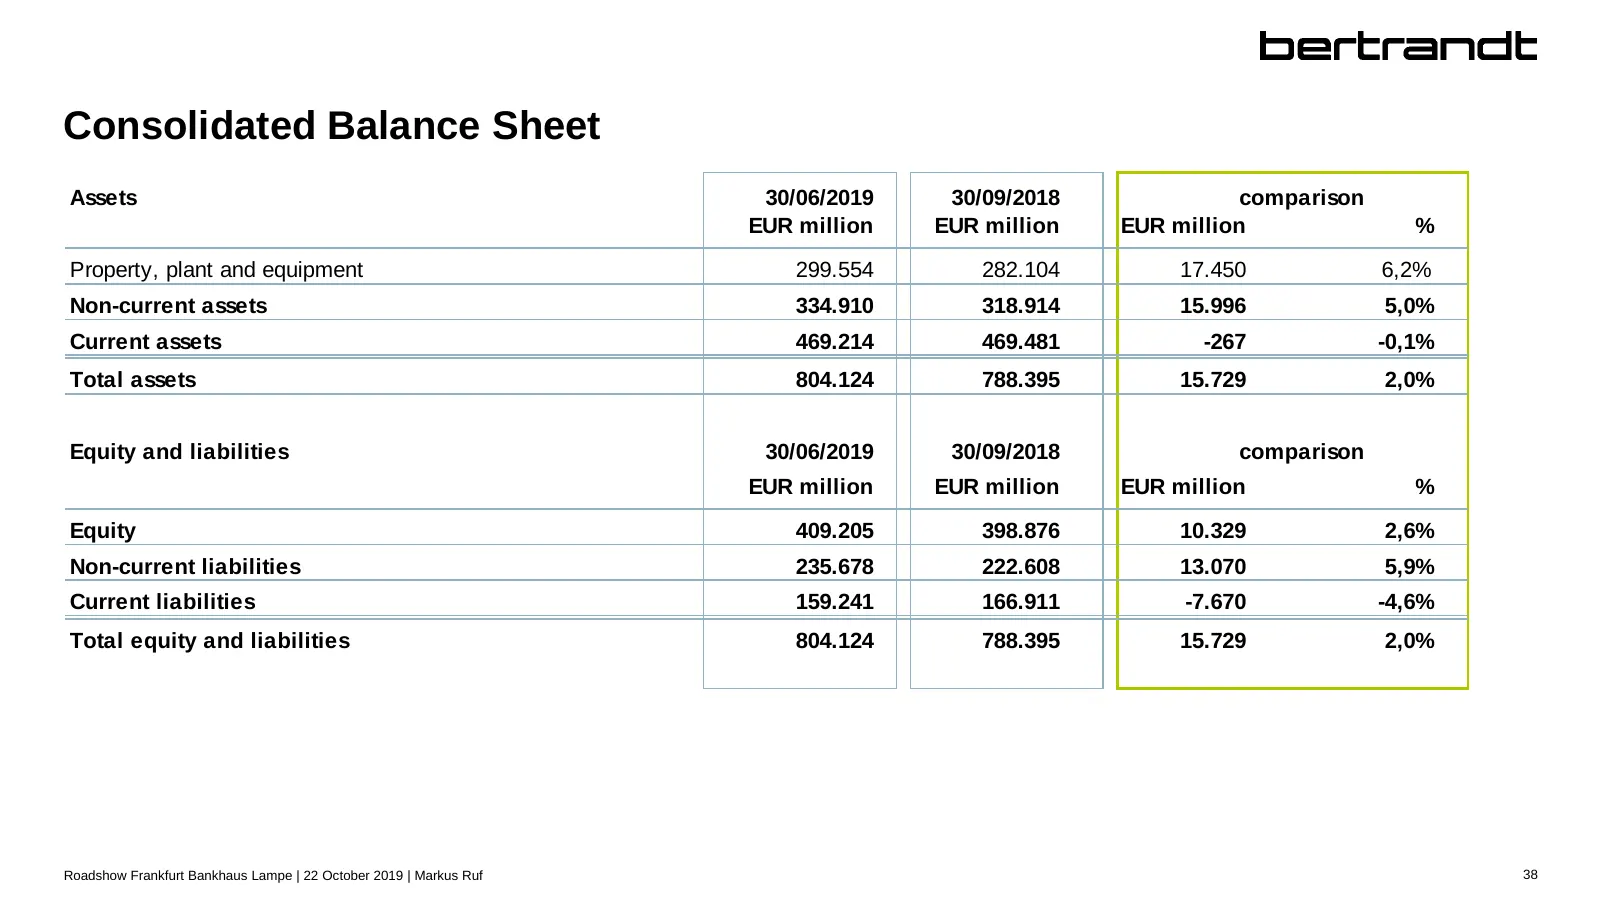
Slide 39: Consolidated Balance Sheet
Consolidated Balance Sheet Assets 30/06/2019 30/09/2018 comparison EUR million EUR million EUR million % Property, plant and equipment 299.554 282.104 17.450 6,2% Non-current assets 334.910 318.914 15.996 5,0% Current assets 469.214 469.481 -267 -0,1% Total assets 804.124 788.395 15.729 2,0% Equity
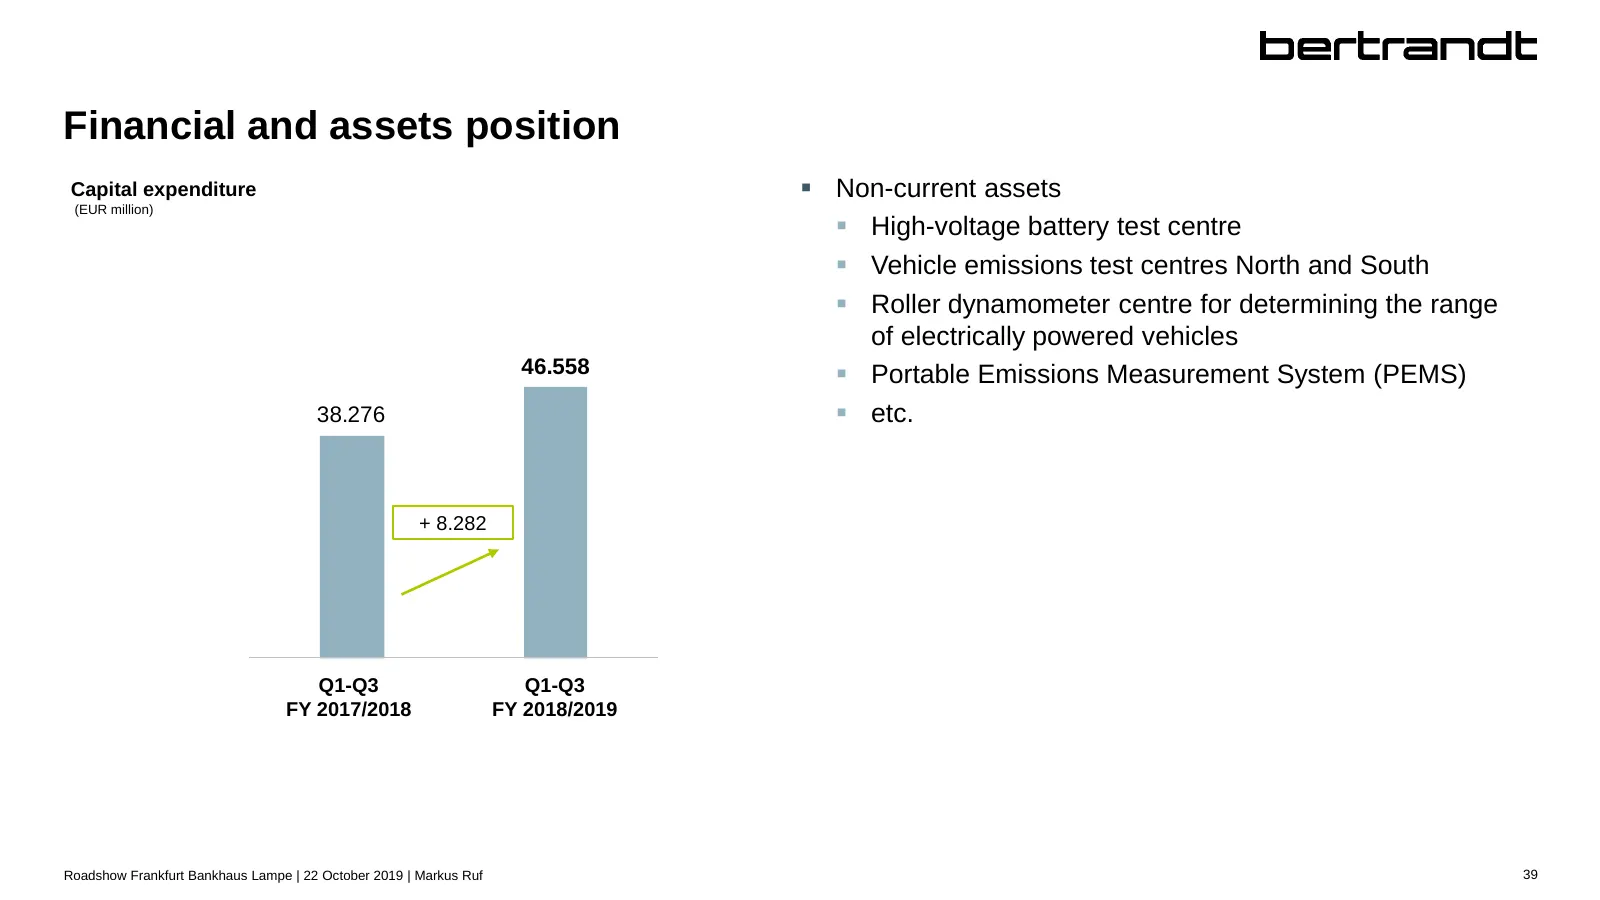
Slide 40: Financial and assets position
Financial and assets position Capital expenditure Non-current assets (EUR million) High-voltage battery test centre Vehicle emissions test centres North and South Roller dynamometer centre for determining the range of electrically powered vehicles 46.558 Portable Emissions Measurement Syst
Slide 41: Financial and assets position
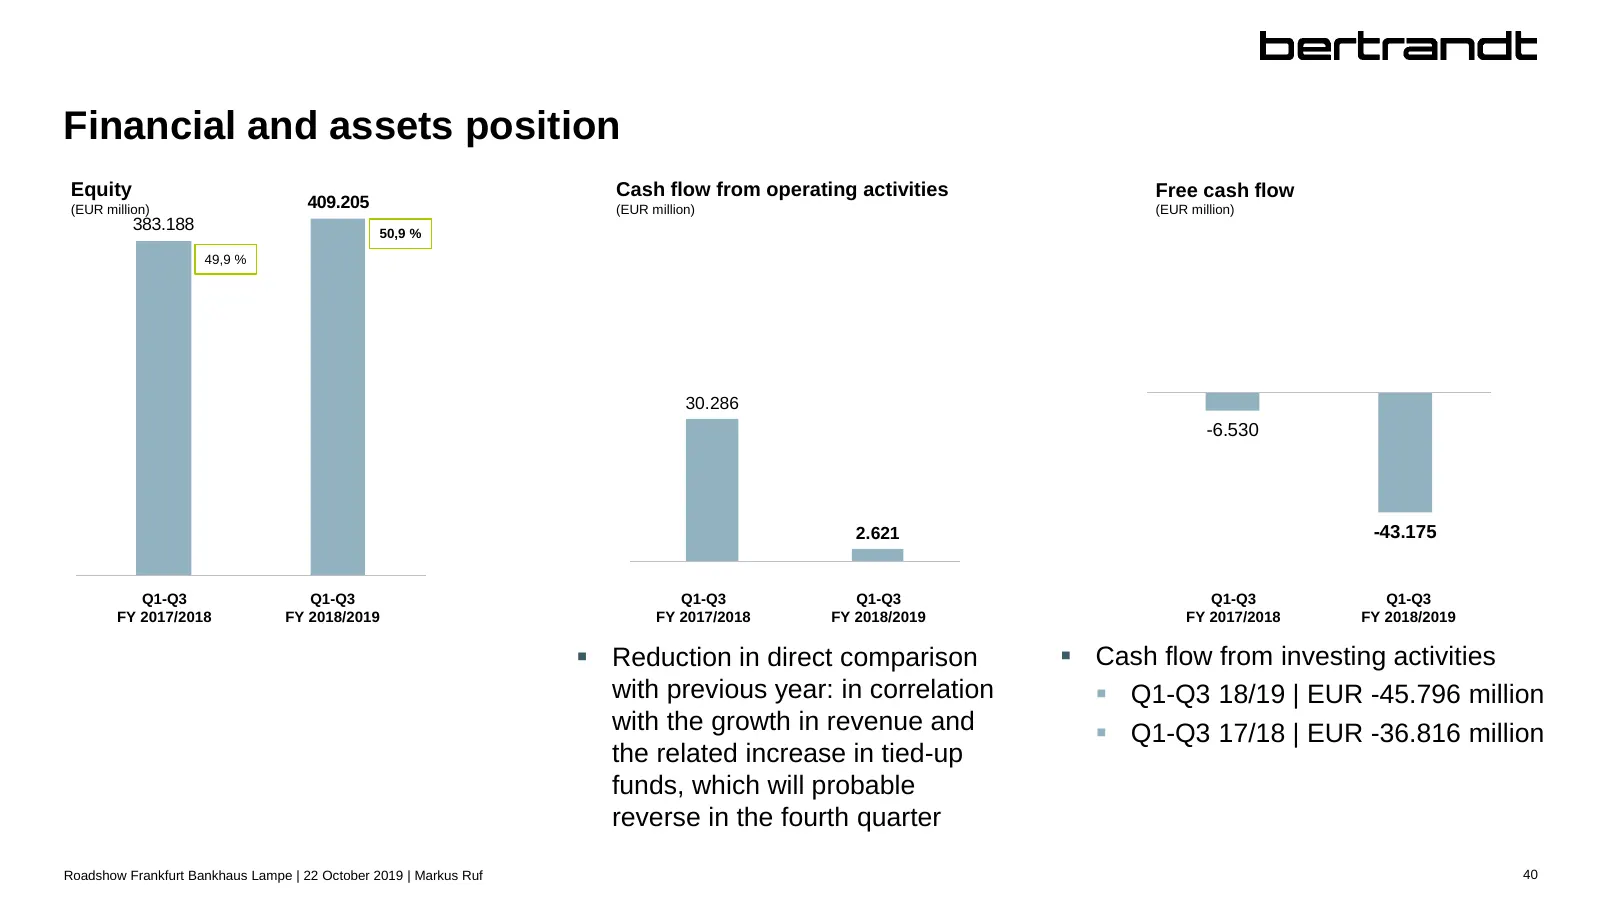
Financial and assets position Equity Cash flow from operating activities Free cash flow (EUR million) 409.205 (EUR million) (EUR million) 383.188 50,9 % 49,9 % 30.286 -6.530 2.621 -43.175 Q1 - Q3 Q1-Q3 Q1 - Q3 Q1-Q3 Q1-Q3 Q1-Q3 Q1 - Q3 Q1-Q3 Q1 - Q3 Q1-Q3 Q1 - Q3 Q1 - Q3 FY2017/2018 GJ 2017/2018 FY
Slide 42: Share price
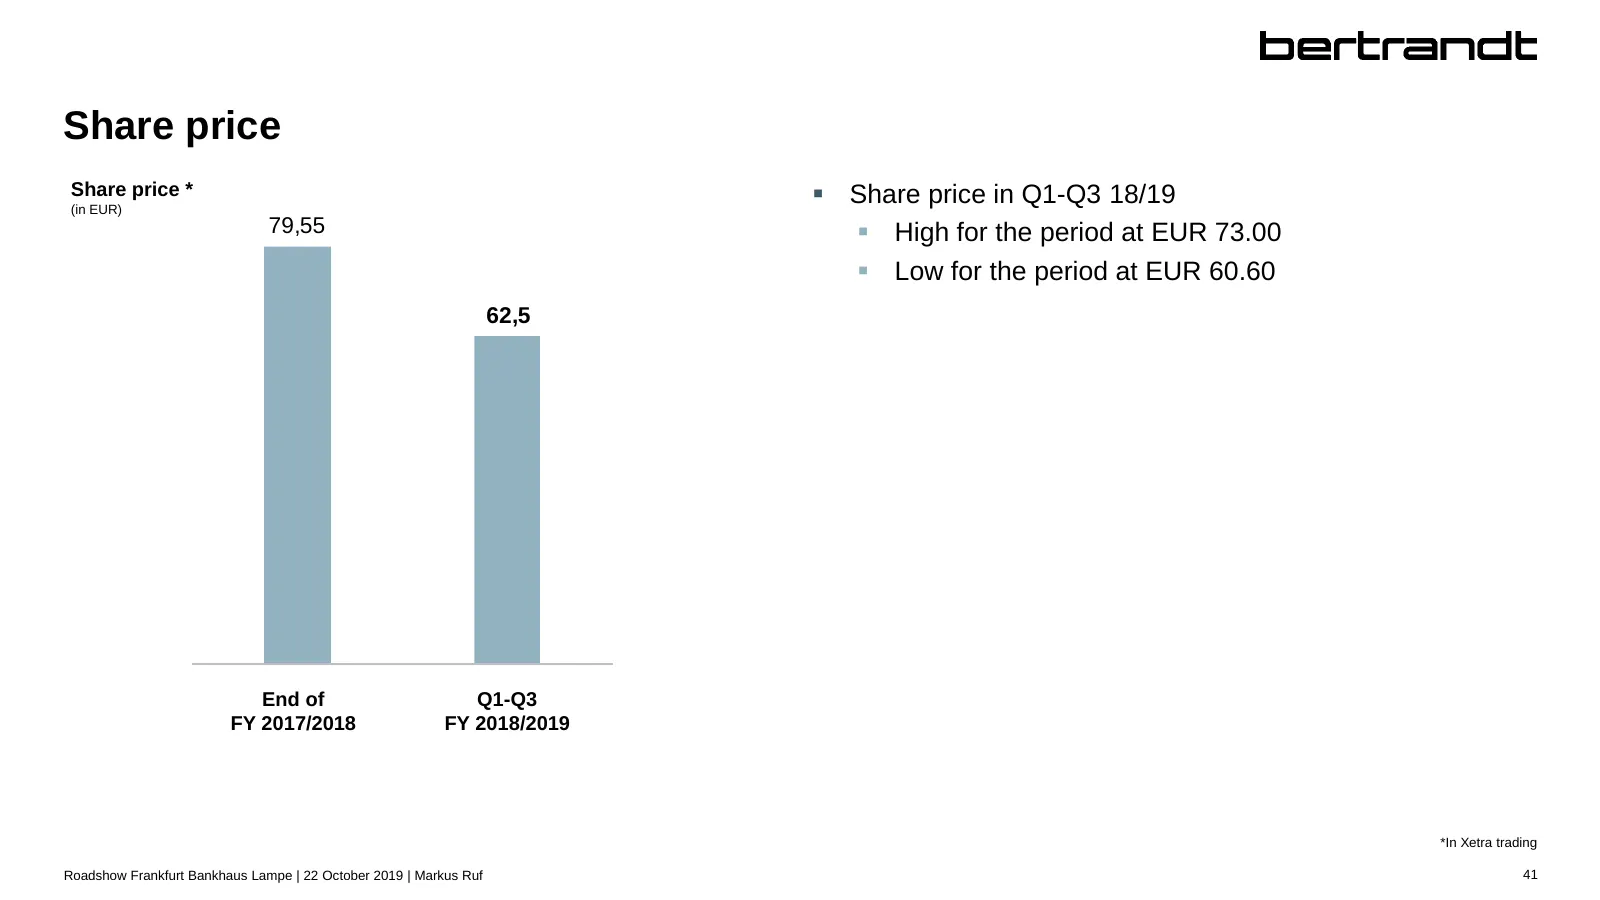
Share price Share price * (in EUR) Share price in Q1-Q3 18/19 79,55 High for the period at EUR 73.00 Low for the period at EUR 60.60 62,5 Schlusskurs End of Schlusskurs Q1-Q3 Q3 GJ 2017/2018 FY 2017/2018 GJ FY 2018/2019 2018/2019 *In Xetra trading Roadshow Frankfurt Bankhaus Lampe | 22 October
Slide 43: Human resources
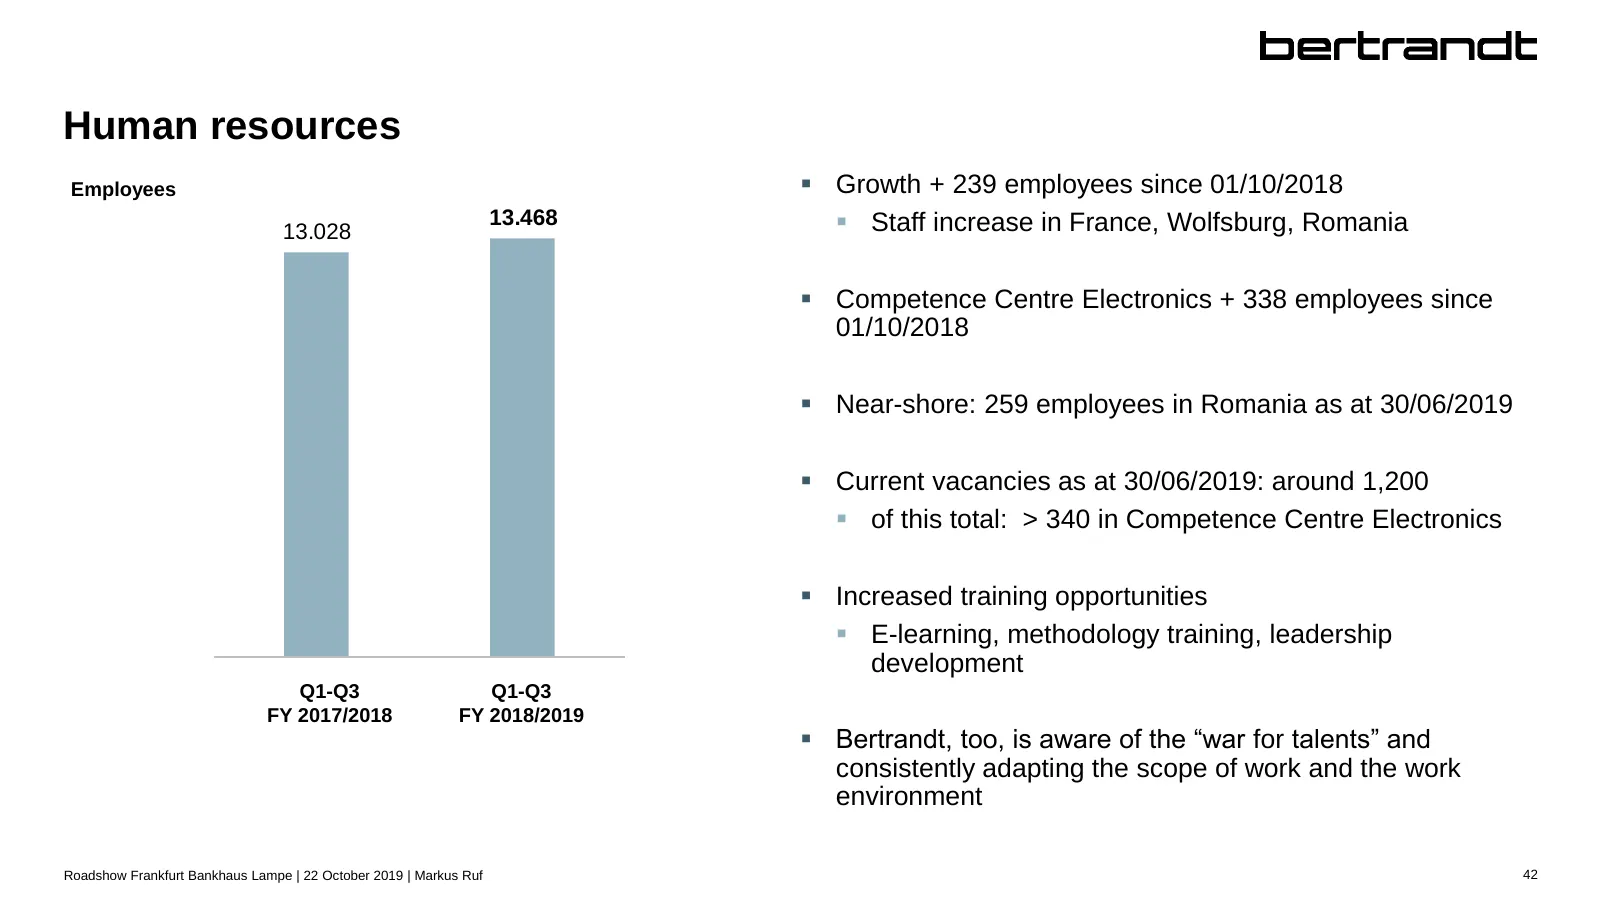
Human resources Employees Growth + 239 employees since 01/10/2018 13.028 13.468 Staff increase in France, Wolfsburg, Romania Competence Centre Electronics + 338 employees since 01/10/2018 Near-shore: 259 employees in Romania as at 30/06/2019 Current vacancies as at 30/06/2019: around 1,200
Slide 44: Mission statement: basis of our competence model for career development
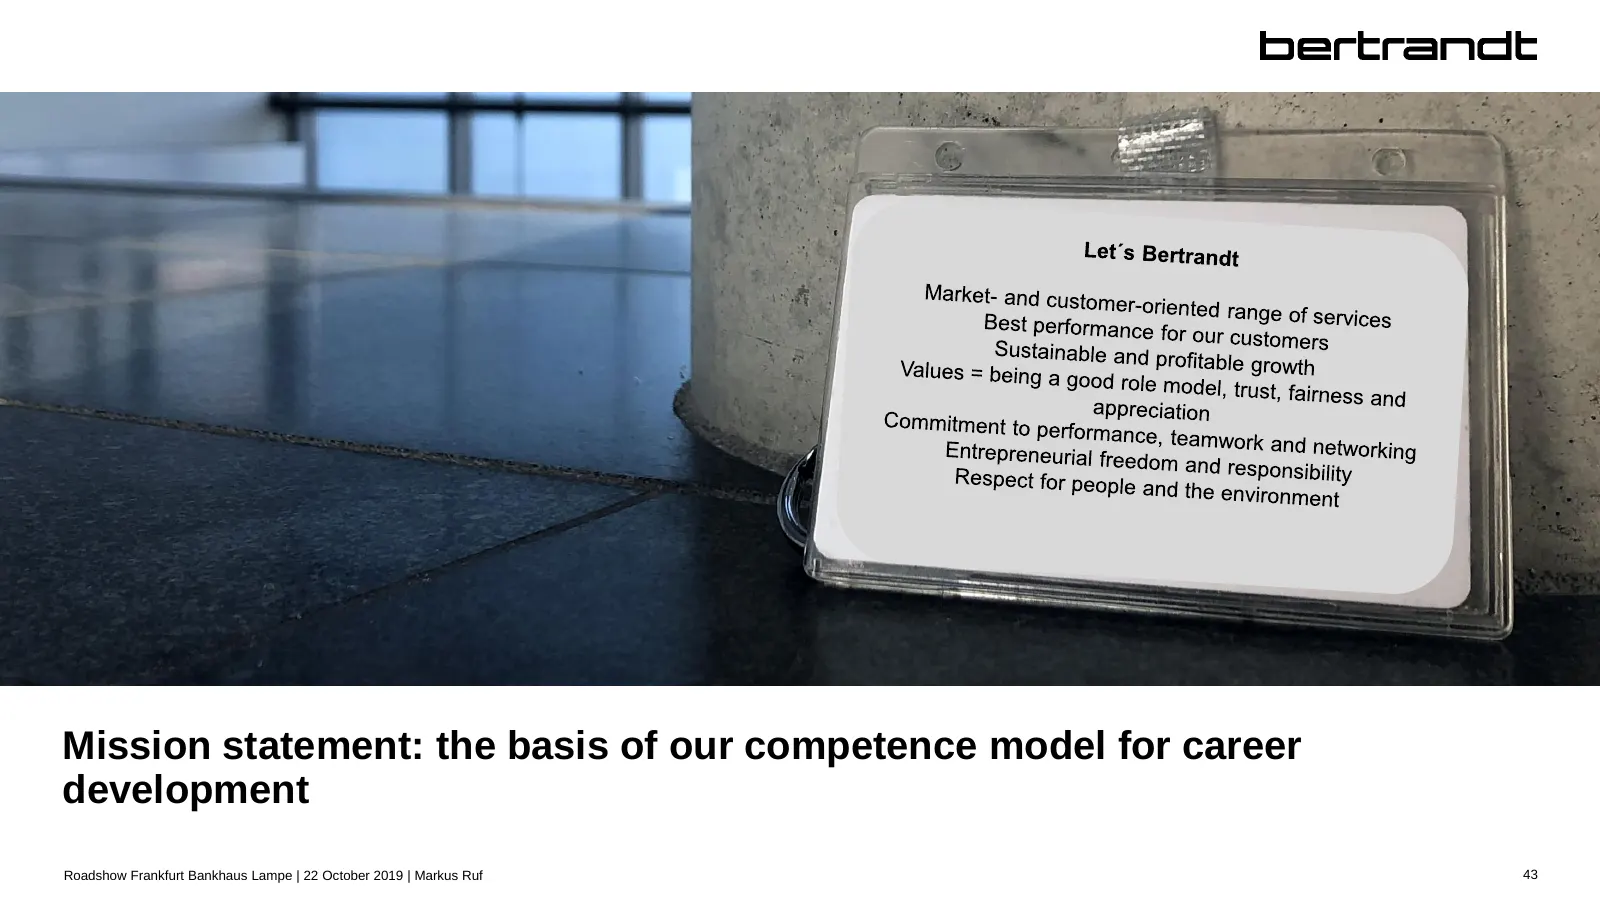
Mission statement: the basis of our competence model for career development Roadshow Frankfurt Bankhaus Lampe | 22 October 2019 | Markus Ruf 43

Slide 45: Employer branding: focus on workforce increase in new fields
Employer branding: focus on workforce increase in new fields *Stand Dezember 2018 Roadshow Frankfurt Bankhaus Lampe | 22 October 2019 | Markus Ruf 44
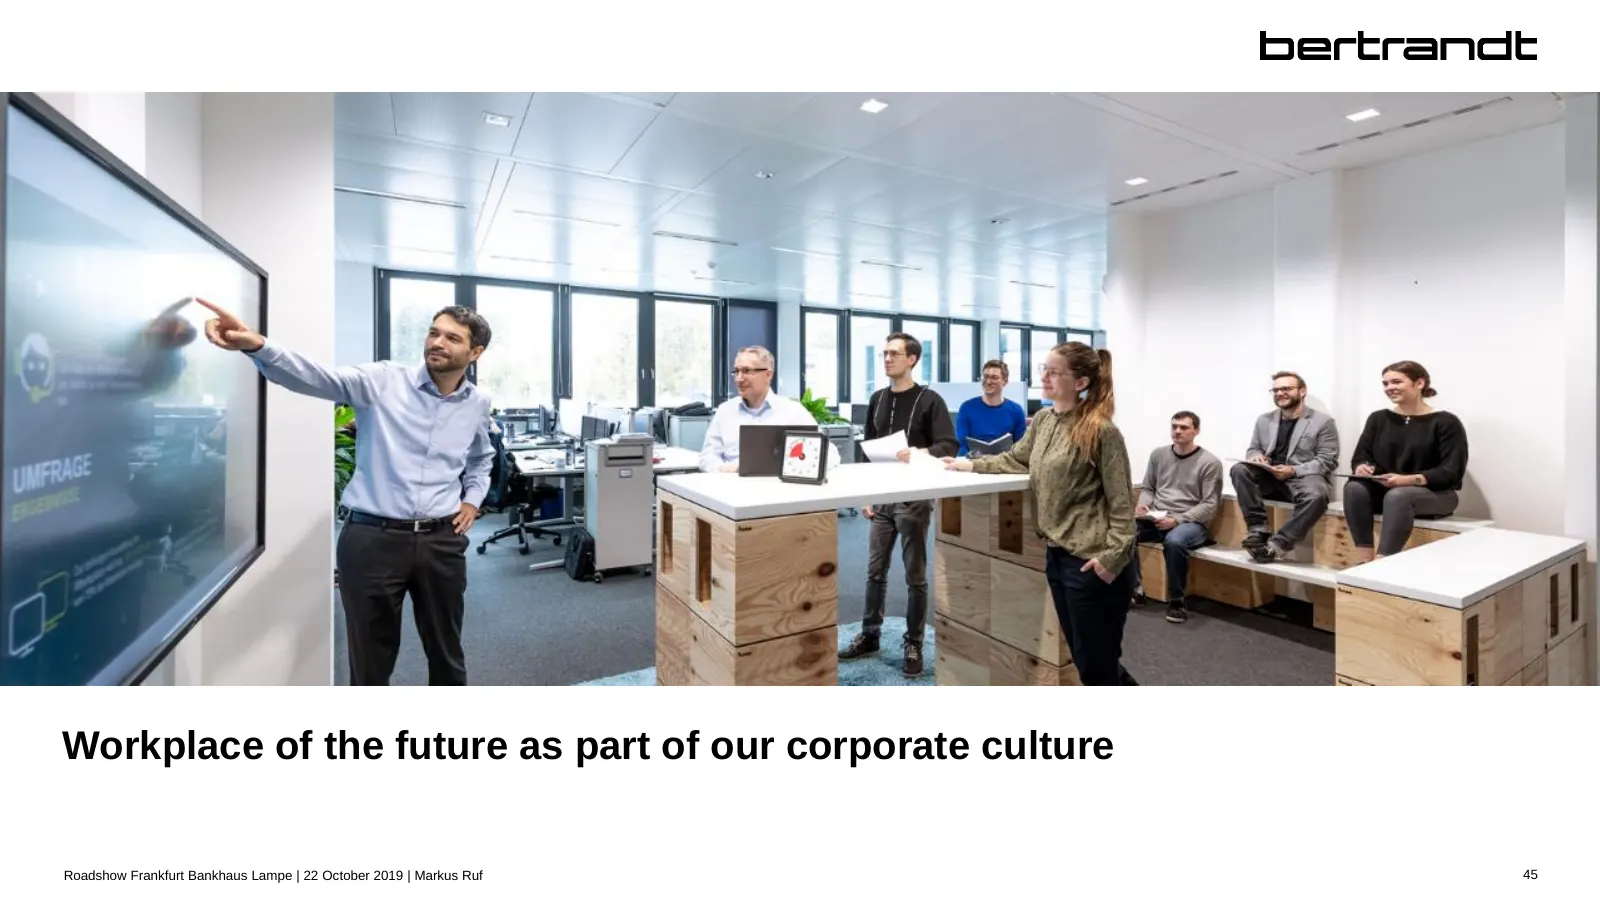
Slide 46: Workplace of the future as part of our corporate culture
Workplace of the future as part of our corporate culture Roadshow Frankfurt Bankhaus Lampe | 22 October 2019 | Markus Ruf 45

Slide 47: Outlook
Outlook Roadshow Frankfurt Bankhaus Lampe | 22 October 2019 | Markus Ruf 46
Slide 48: Adjustment of full-year forecast - Gathering economic clouds
Adjustment of full-year forecast - Gathering economic clouds and industry-specific challenges Anticipated recovery in economic and industry development did not materialise in the second half of 2019 Slowdown in global economy set to continue in 2019 and 2020 Business sentiment and order backlo
Slide 49: Adjustment of full-year forecast - Gathering economic clouds
Adjustment of full-year forecast - Gathering economic clouds and industry-specific challenges Based on economic and industry developments, the Management Board sees higher risk for the fourth quarter and consequent need to adjust earnings forecast Bertrandt earnings optimisation programme establ
Slide 50: Adjustment of full-year forecast - reassessment of earnings & capital spending
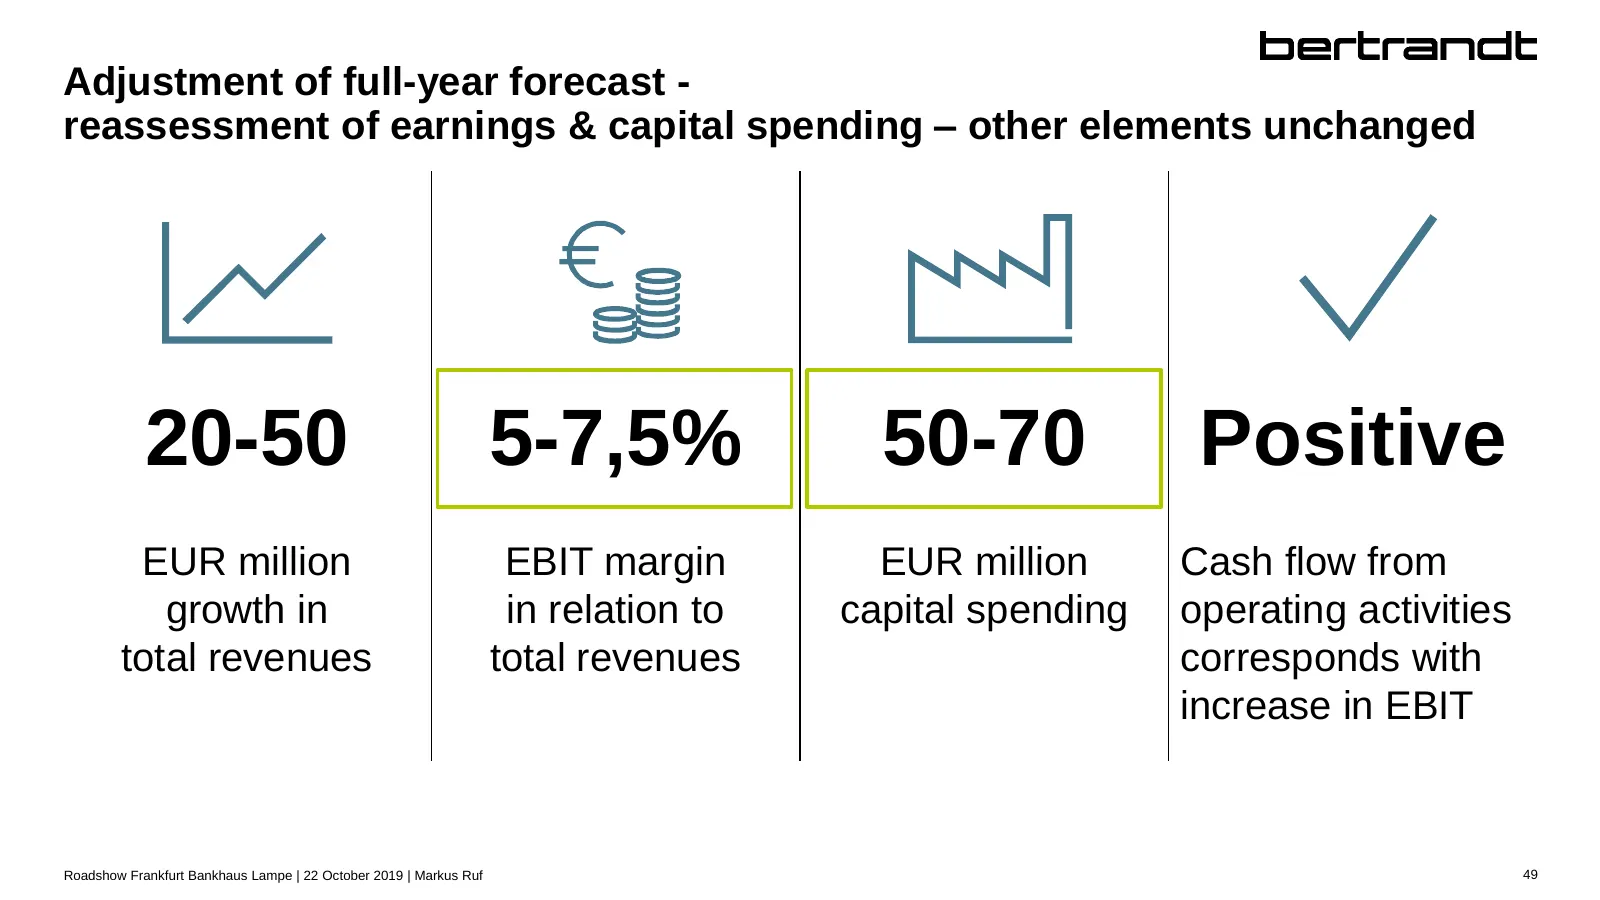
Adjustment of full-year forecast - reassessment of earnings & capital spending – other elements unchanged 20-50 5-7,5% 50-70 Positive EUR million EBIT margin EUR million Cash flow from growth in in relation to capital spending operating activities total revenues total revenues corresponds with incre
Slide 51: Positive business development in the medium term
Positive business development in the medium term – Management Board sees good opportunities for growth and earnings According to forecasts OEMs’ research and development budgets remain at high level and Work continues to be outsourced to engineering service providers Market trends are intact a
Slide 52: Megatrends and new technologies as a basis for long-term development
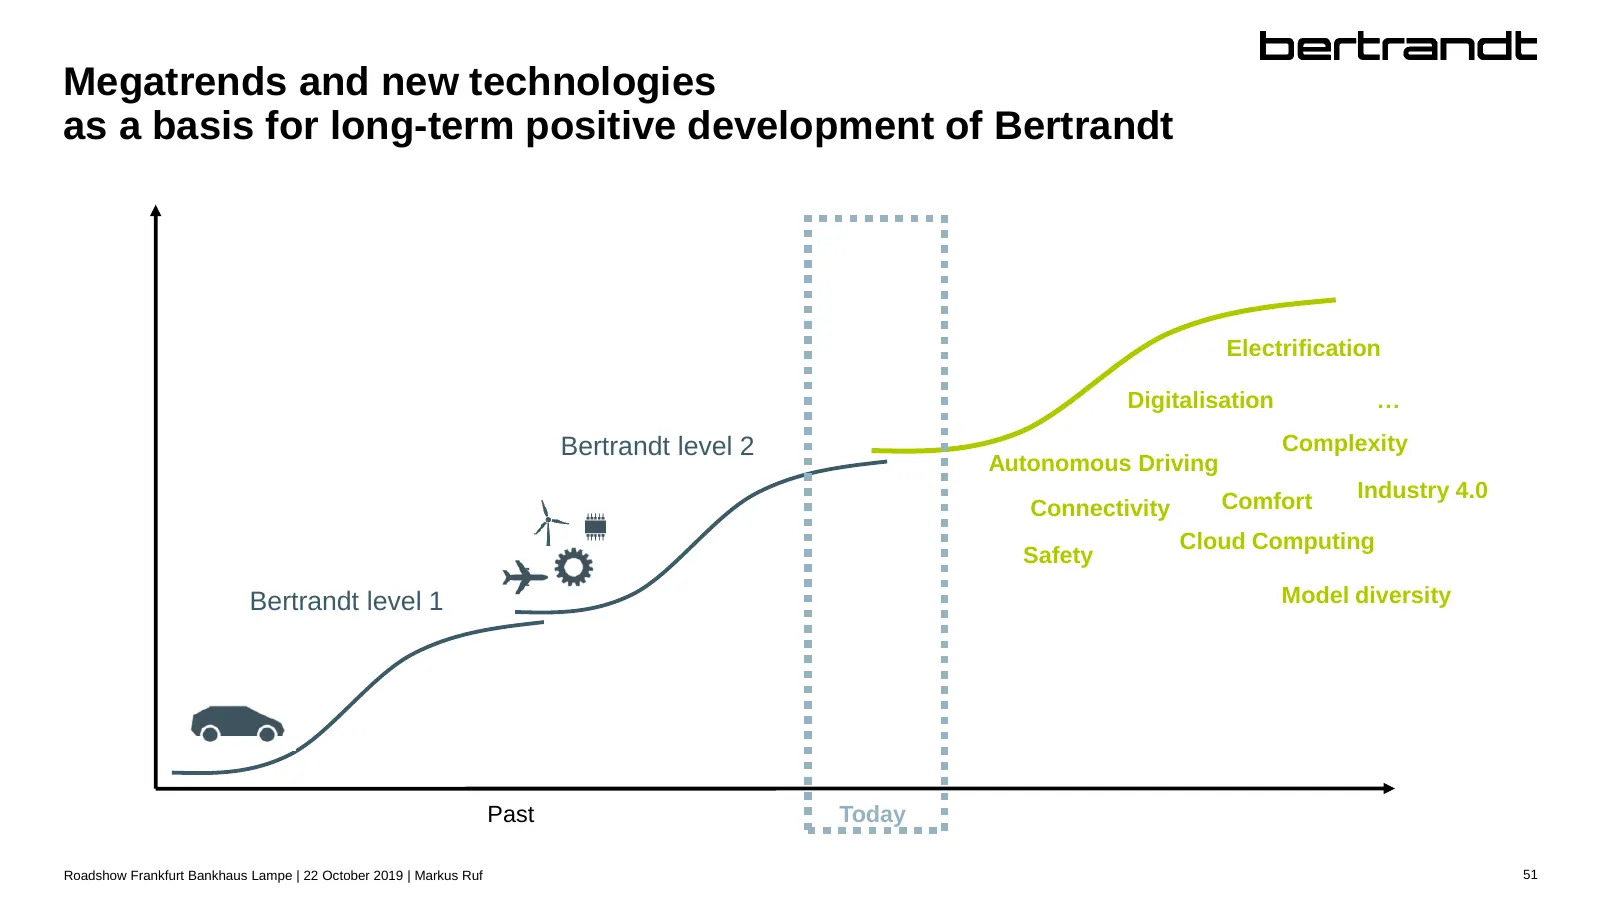
Megatrends and new technologies as a basis for long-term positive development of Bertrandt Electrification Digitalisation … Bertrandt level 2 Complexity Autonomous Driving Comfort Industry 4.0 Connectivity Cloud Computing Safety Bertrandt level 1 Model diversity Past Today Roadshow Frankfurt Bankhau
Slide 53: Thank you for your attention
Thank you for your attention, we look forward to your questions! 52
Slide 54: Legal notice
Legal notice This presentation contains inter alia certain foresighted statements about future developments, which are based on current estimates of management. Such statements are subjected to certain risks and uncertainties. If one of these factors of uncertainty or other imponderables should occu
Source: Internet Archive copy of bertrandt.com
More decks from Bertrandt AG
 9M 2025/2026 Earnings Presentation20 slides · Aug 3, 2026
 Investor Day (May 2026)82 slides · May 13, 2026
 H1 2025/2026 Earnings Presentation19 slides · May 13, 2026
 Q1 2025/2026 Earnings Presentation15 slides · Feb 12, 2026
 Investor Presentation (January 2026)61 slides · Jan 12, 2026
 FY2024/2025 Earnings Presentation41 slides · Dec 18, 2025