Essity AB Class A · OMXSTO:ESSITY_A
Essity AB Class A — Investor Day (2021)
105 slides from Essity AB Class A's investor day presentation, 2021

Slide 1: Essity Capital Markets Day 2021
Essity Capital Markets Day 2021 Text Breaking Barriers to Well-being and Delivering Profitable Growth

Slide 2: Presenters
Magnus Groth Fredrik Rystedt Sahil Tesfu Tuomas Yrjölä President and CEO Executive Vice President and CFO SVP Group Function Strategy & Business President Global Brand, Innovation and Development Sustainability Text Volker Zöller Ulrika Kolsrud Robert Sjöström Donato Giorgio President Consumer Goods

Slide 3: Our Purpose: Breaking Barriers to Well-being
Our Purpose Breaking Barriers to Well-being Text
Slide 4: Agenda
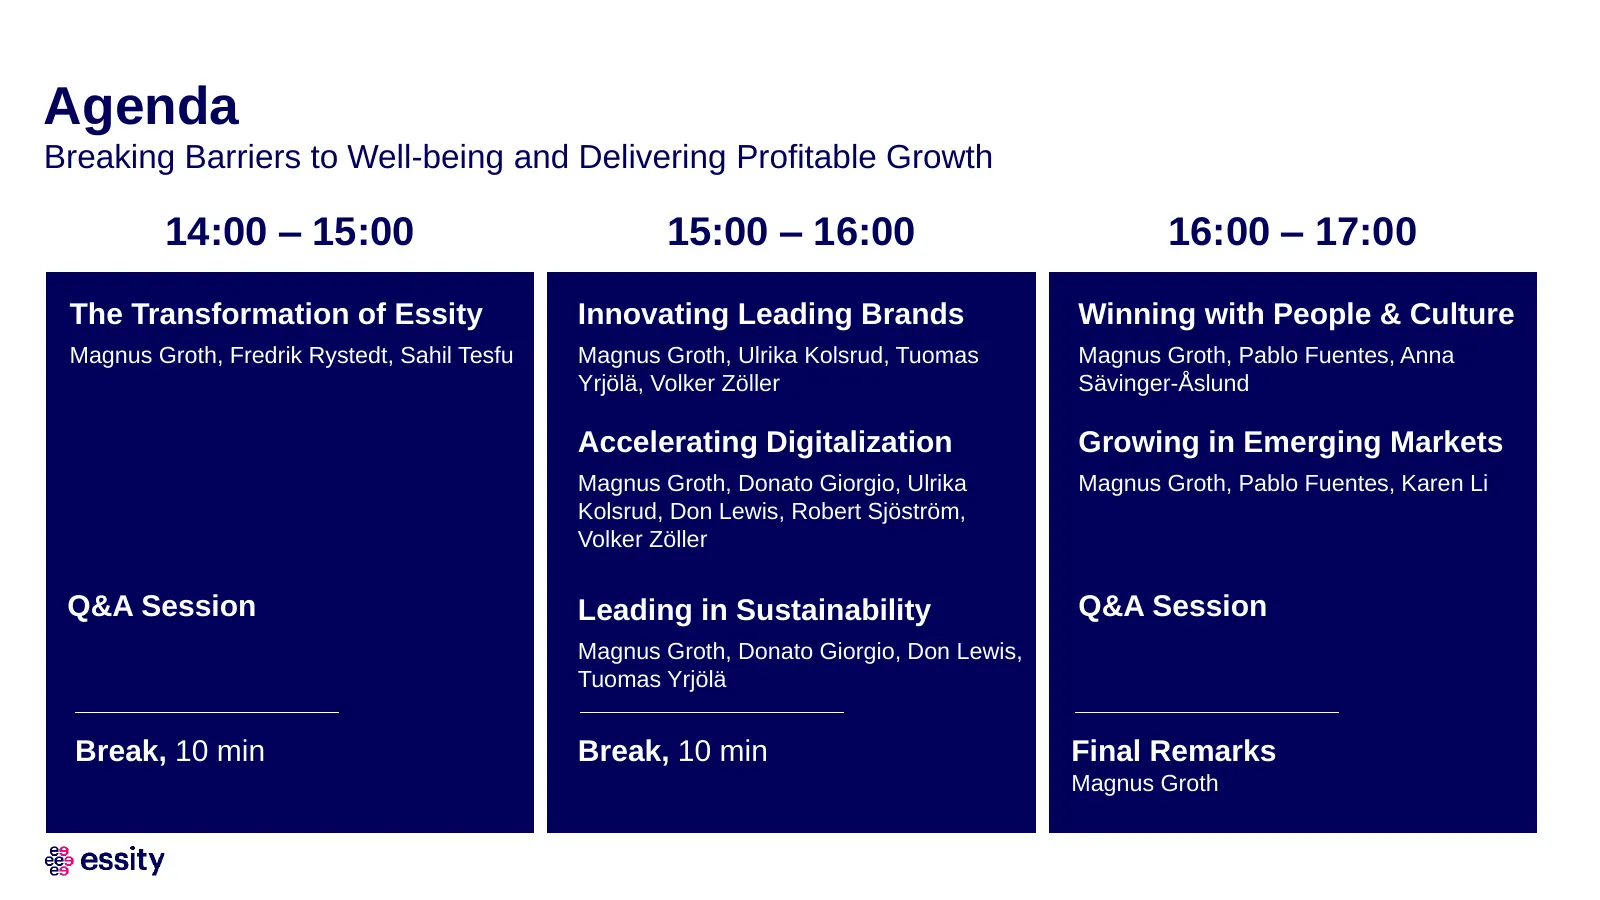
Agenda Breaking Barriers to Well-being and Delivering Profitable Growth 14:00 – 15:00 15:00 – 16:00 16:00 – 17:00 The Transformation of Essity Innovating Leading Brands Winning with People & Culture Magnus Groth, Fredrik Rystedt, Sahil Tesfu Magnus Groth, Ulrika Kolsrud, Tuomas Magnus Groth, Pablo F
Slide 5: Development of Sales and Profitability
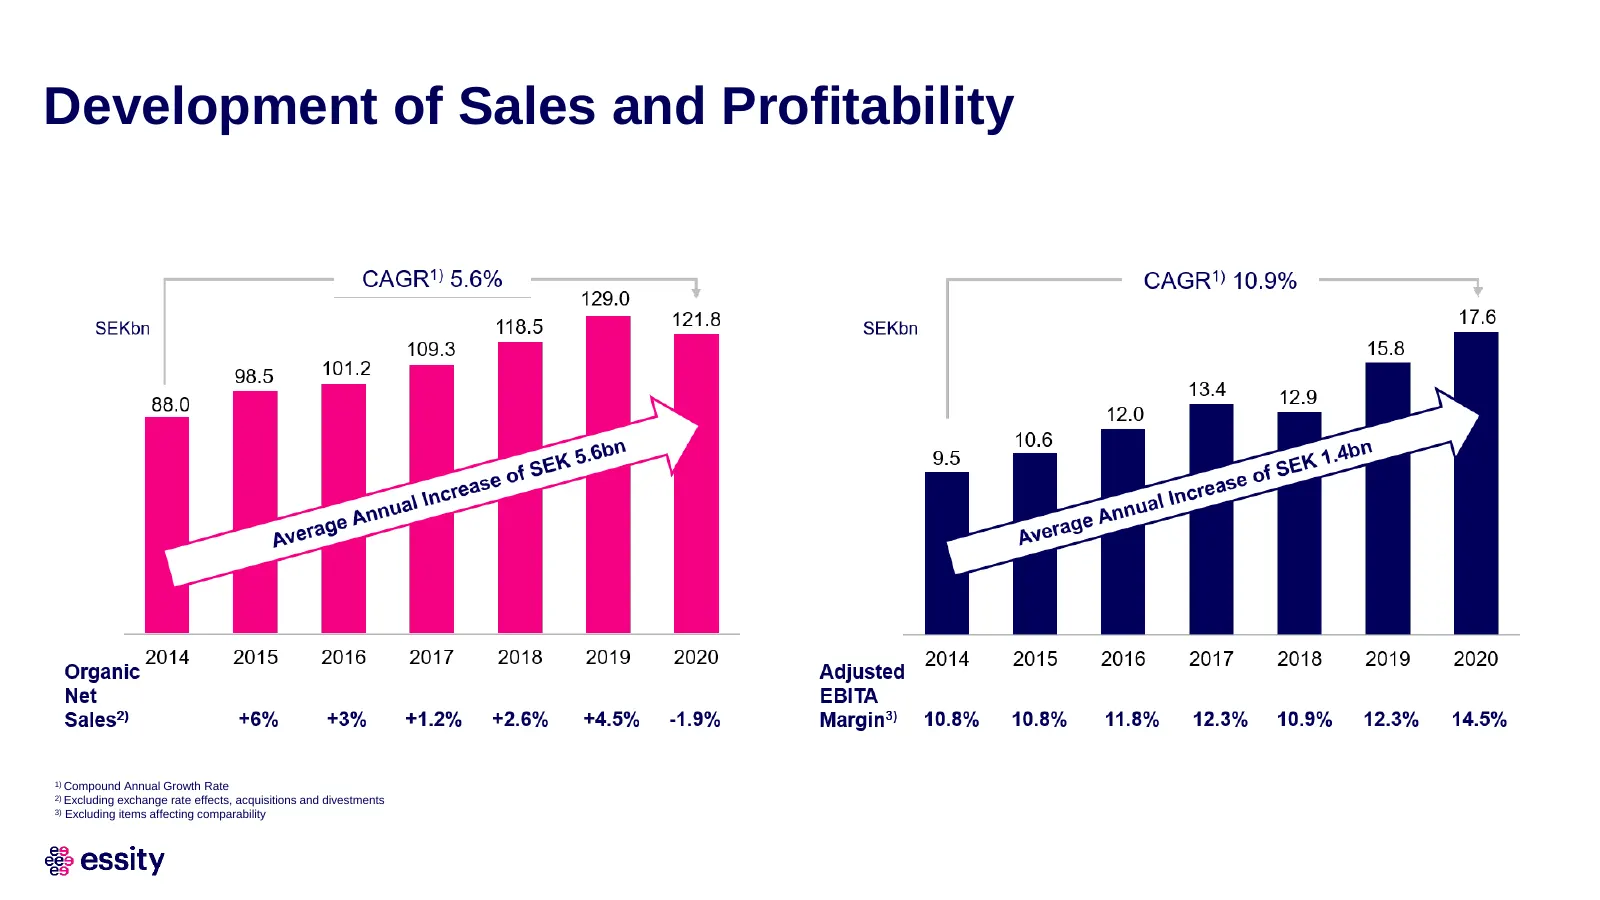
Development of Sales and Profitability 1) Compound Annual Growth Rate 2) Excluding exchange rate effects, acquisitions and divestments 3) Excluding items affecting comparability
Slide 6: Adjusted EBITA Margin Development
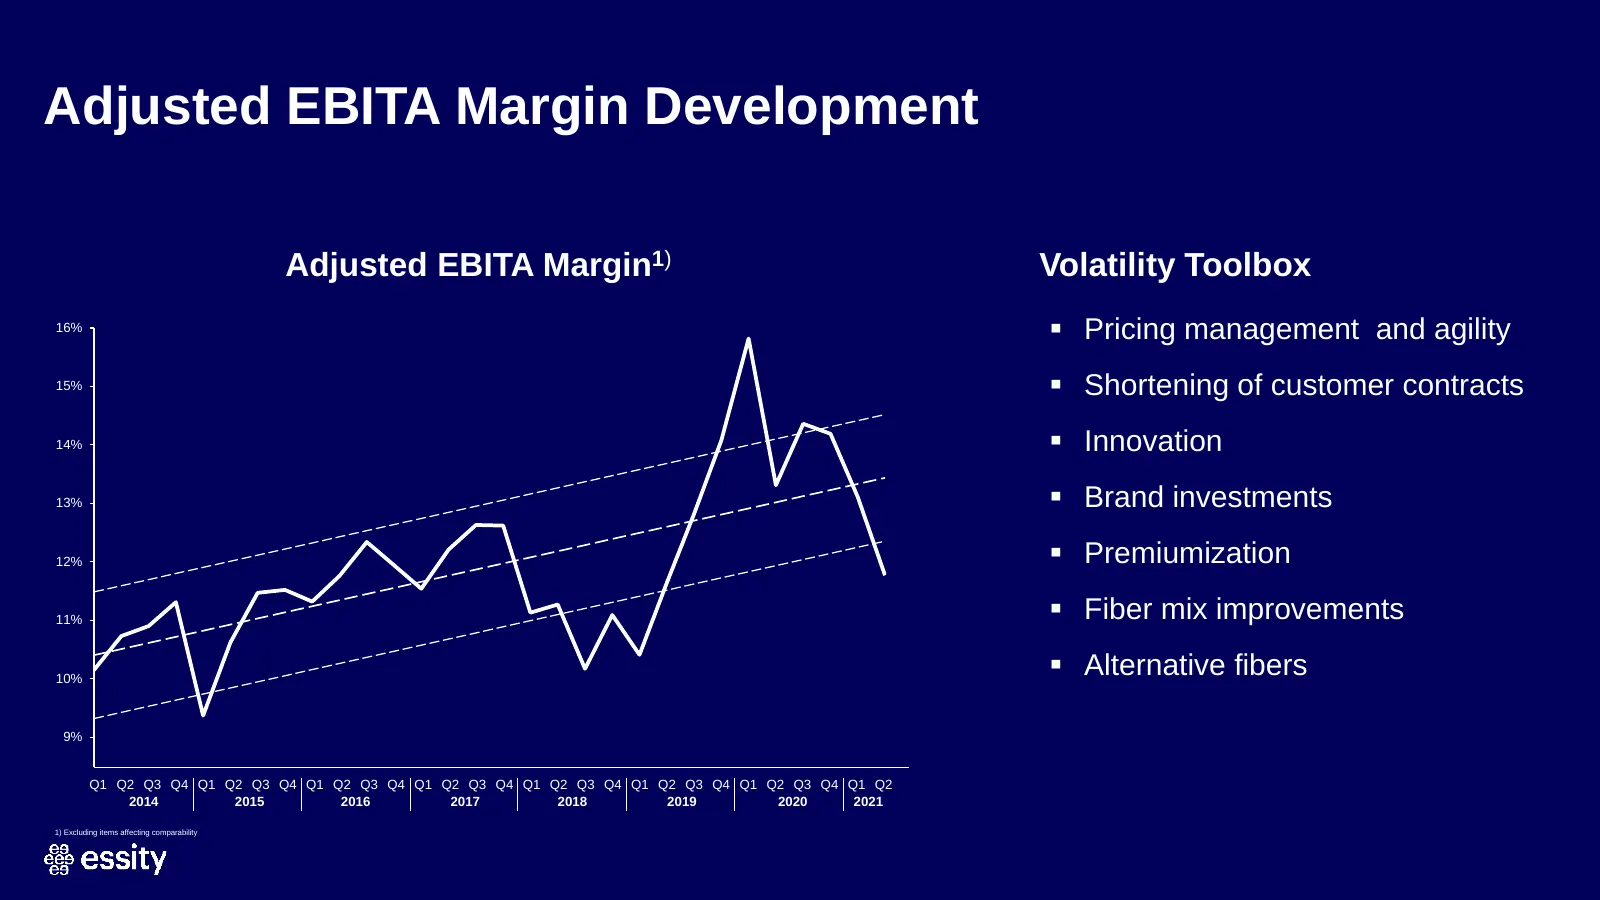
Adjusted EBITA Margin Development Adjusted EBITA Margin1) Volatility Toolbox 16% ▪ Pricing management and agility 15% ▪ Shortening of customer contracts 14% ▪ Innovation 13% ▪ Brand investments 12% ▪ Premiumization 11% ▪ Fiber mix improvements 10% ▪ Alternative fibers 9% Q1 Q2 Q3 Q4 Q1 Q2 Q3 Q4 Q1 Q
Slide 7: Lower Volatility vs Peers
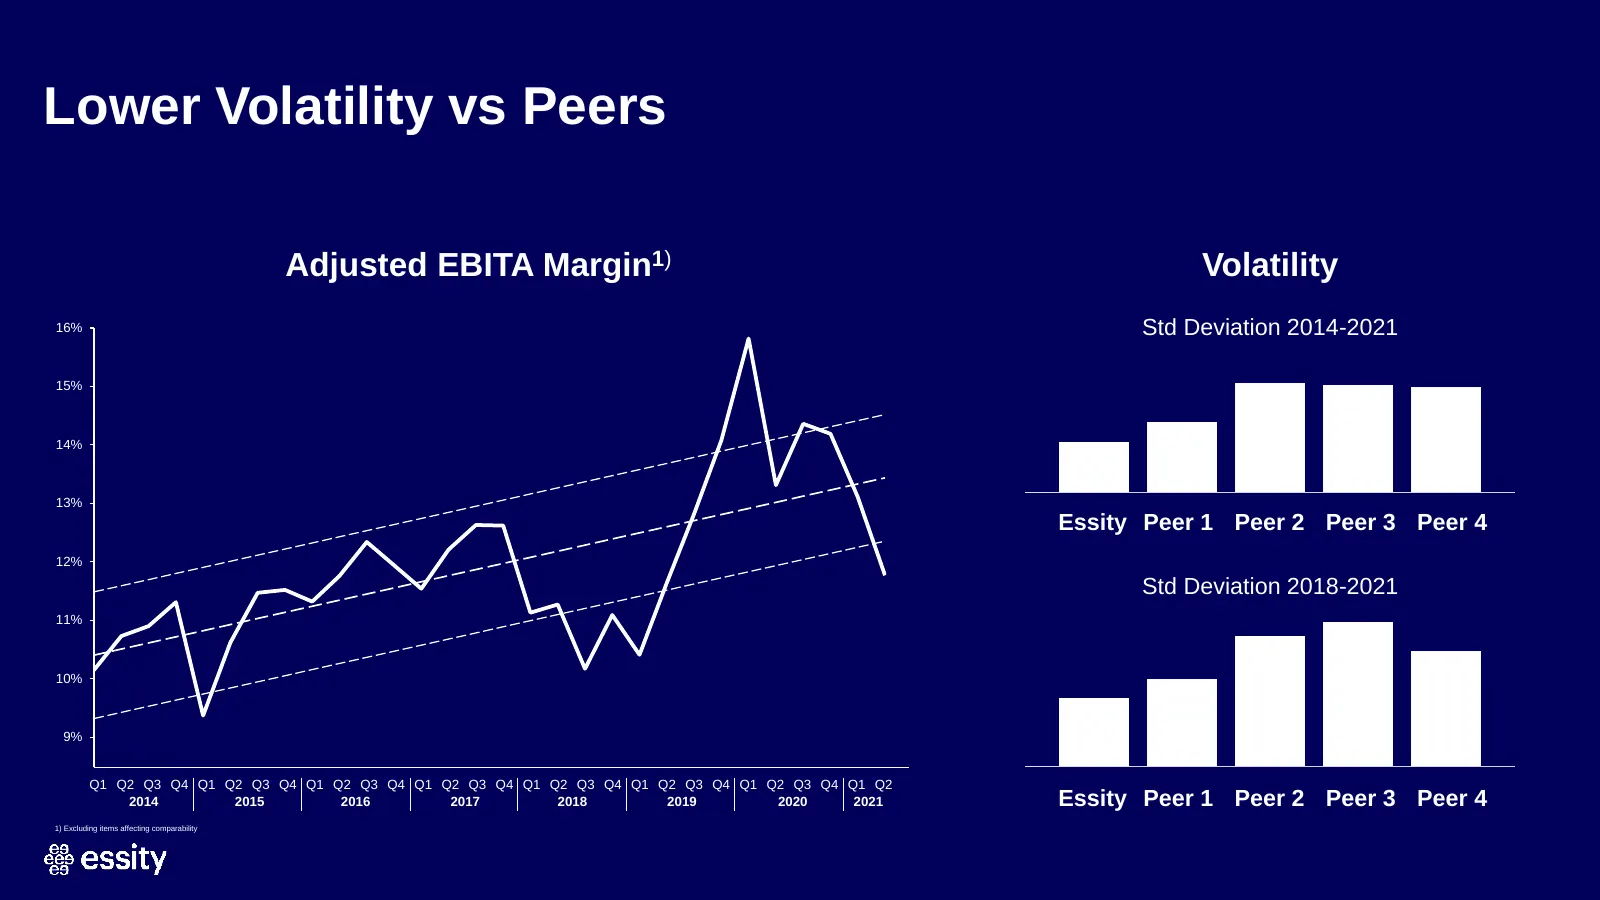
Lower Volatility vs Peers Adjusted EBITA Margin1) Volatility 16% Std Deviation 2014-2021 15% 14% 13% Essity Peer 1 Peer 2 Peer 3 Peer 4 12% Std Deviation 2018-2021 11% 10% 9% Q1 Q2 Q3 Q4 Q1 Q2 Q3 Q4 Q1 Q2 Q3 Q4 Q1 Q2 Q3 Q4 Q1 Q2 Q3 Q4 Q1 Q2 Q3 Q4 Q1 Q2 Q3 Q4 Q1 Q2 8% 2014 2015 2016 2017 2018 2019 20
Slide 8: Stronger Post Pandemic
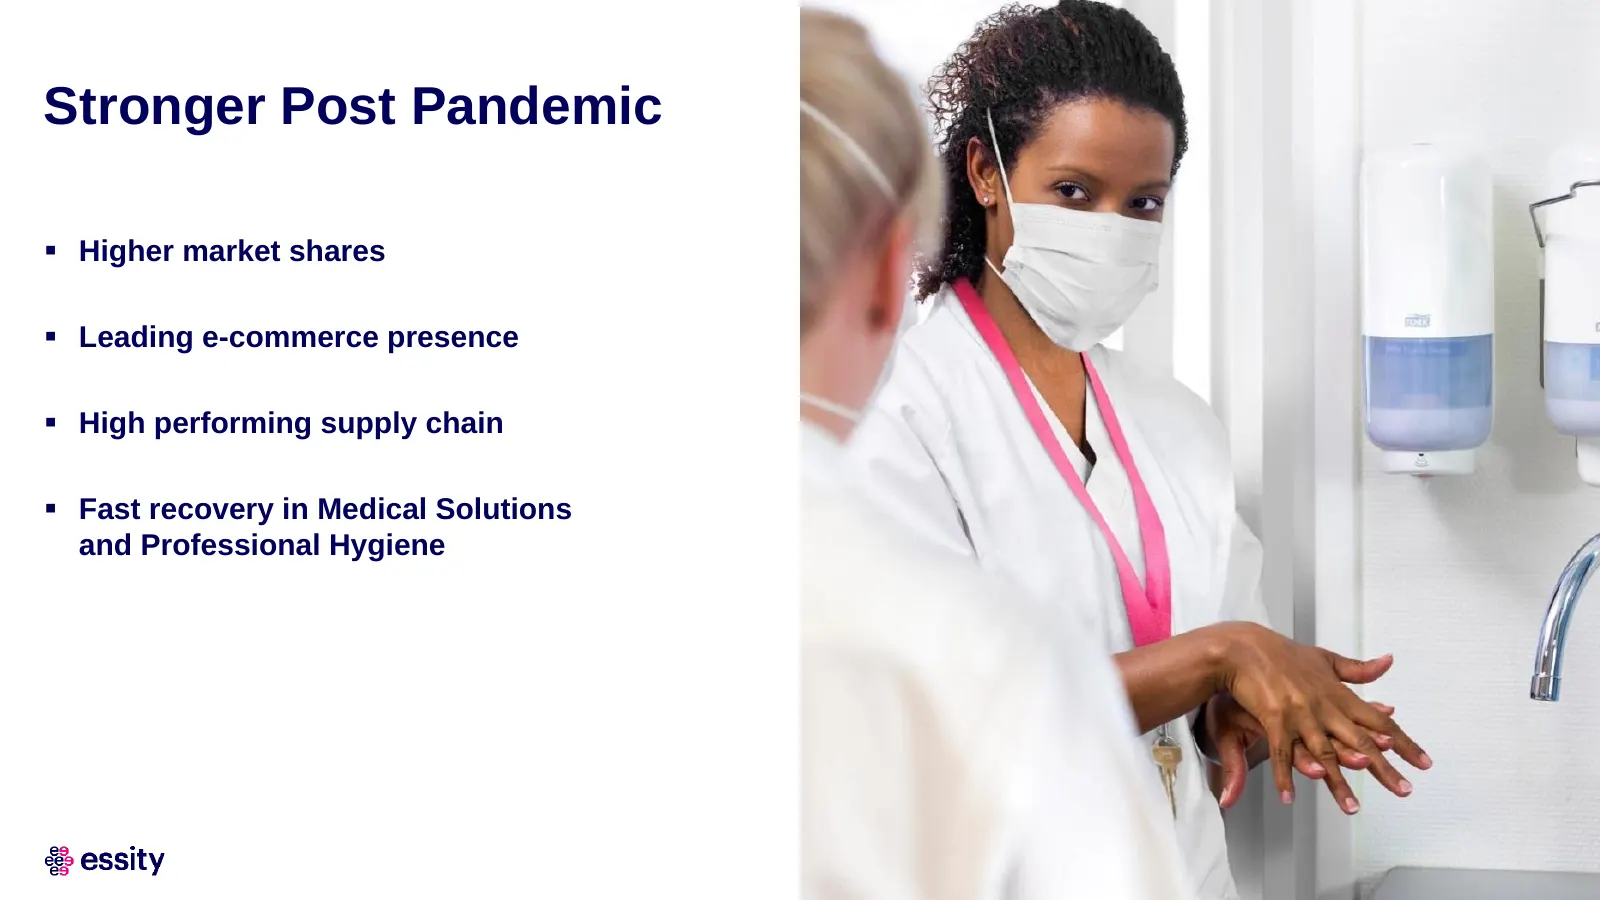
Stronger Post Pandemic ▪ Higher market shares ▪ Leading e-commerce presence ▪ High performing supply chain ▪ Fast recovery in Medical Solutions and Professional Hygiene
Slide 9: Financial Targets and Policies
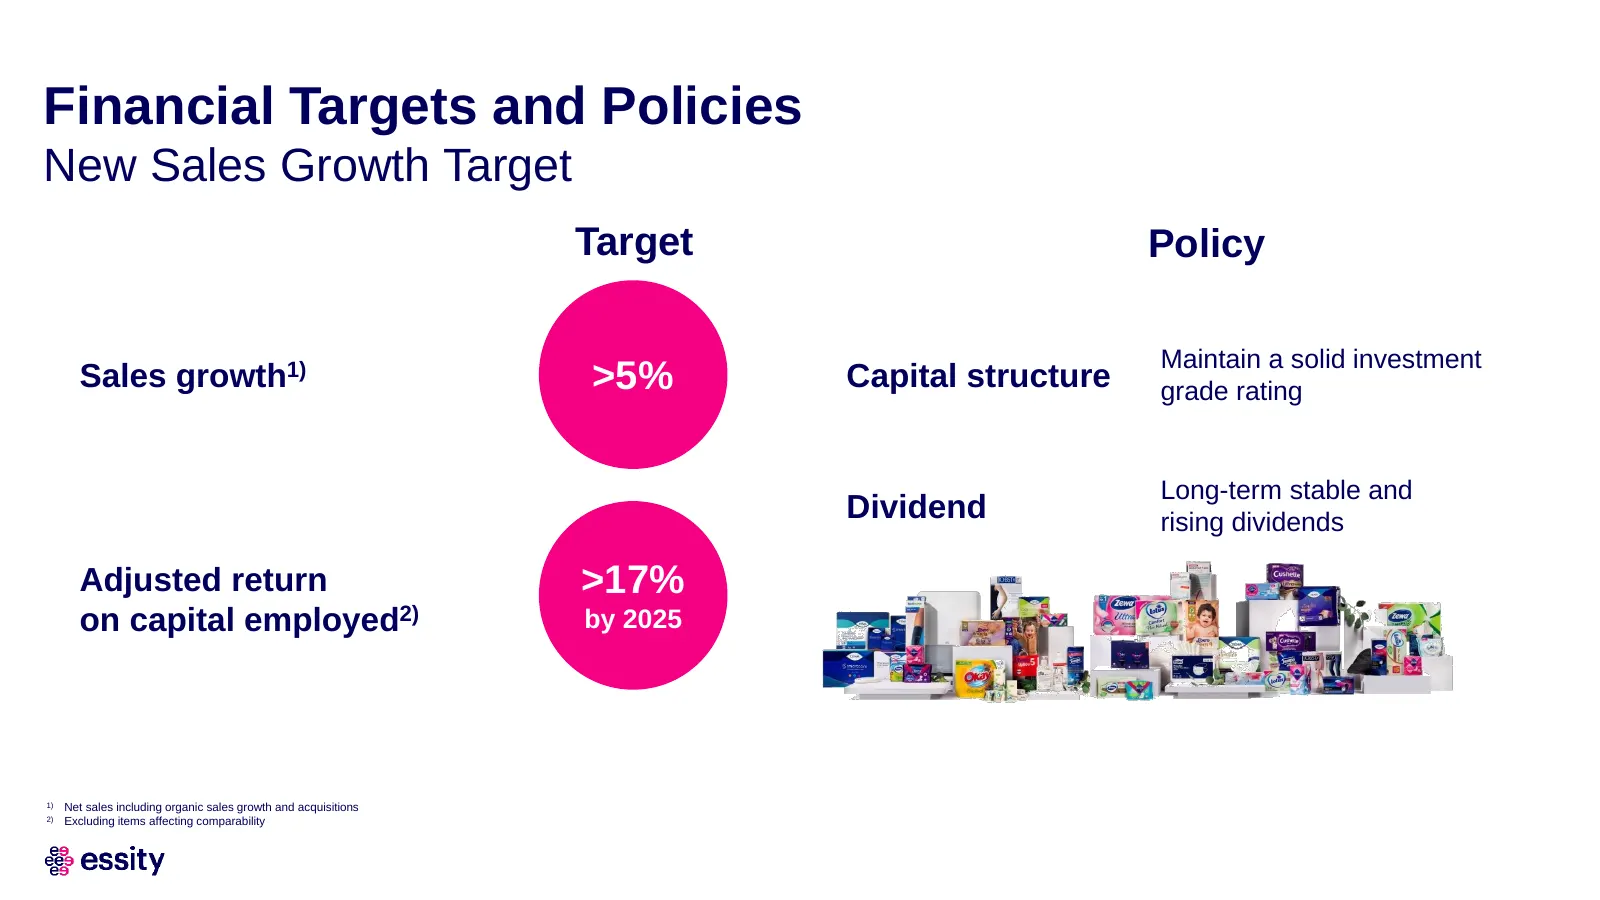
Financial Targets and Policies New Sales Growth Target Target Policy Maintain a solid investment Sales growth1) >5% Capital structure grade rating Long-term stable and Dividend rising dividends Adjusted return >17% on capital employed2) by 2025 1) Net sales including organic sales growth and acquisi
Slide 10: Adjusted ROCE >17% by 2025 Reached Primarily by Margin Enhancement
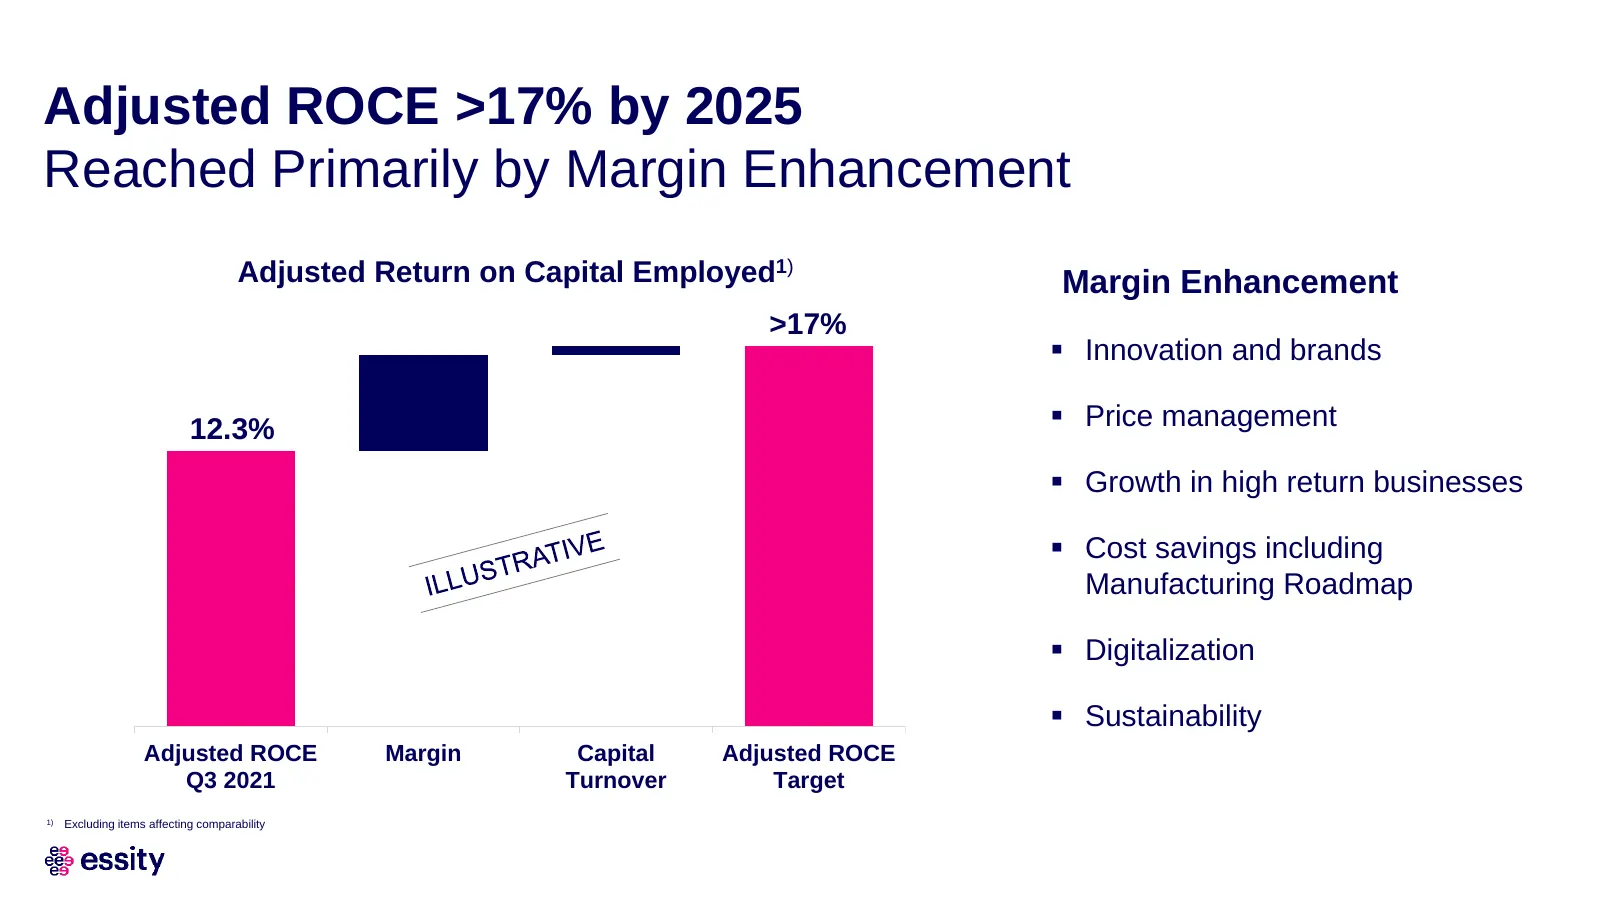
Adjusted ROCE >17% by 2025 Reached Primarily by Margin Enhancement Adjusted Return on Capital Employed1) Margin Enhancement >17% ▪ Innovation and brands 12.3% ▪ Price management ▪ Growth in high return businesses ▪ Cost savings including Manufacturing Roadmap ▪ Digitalization ▪ Sustainability Adjust
Slide 11: Improving Efficiency
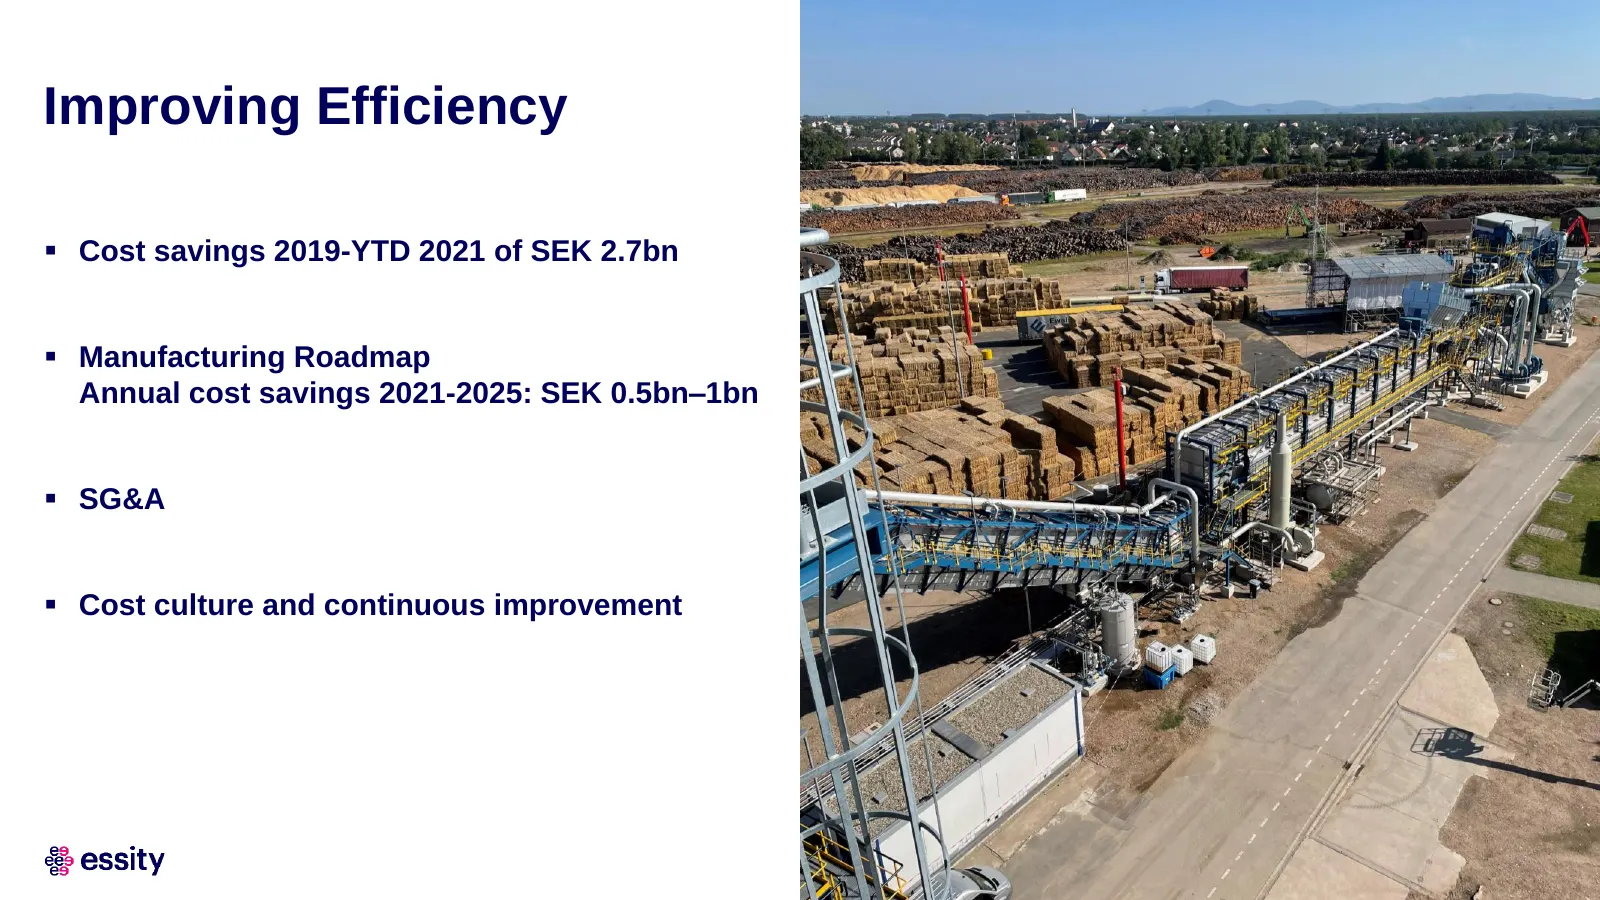
F Improving Efficiency ▪ Cost savings 2019-YTD 2021 of SEK 2.7bn ▪ Manufacturing Roadmap Annual cost savings 2021-2025: SEK 0.5bn–1bn ▪ SG&A ▪ Cost culture and continuous improvement Capital Markets Day 2021
Slide 12: Continuing Our Transformation – New Business Areas
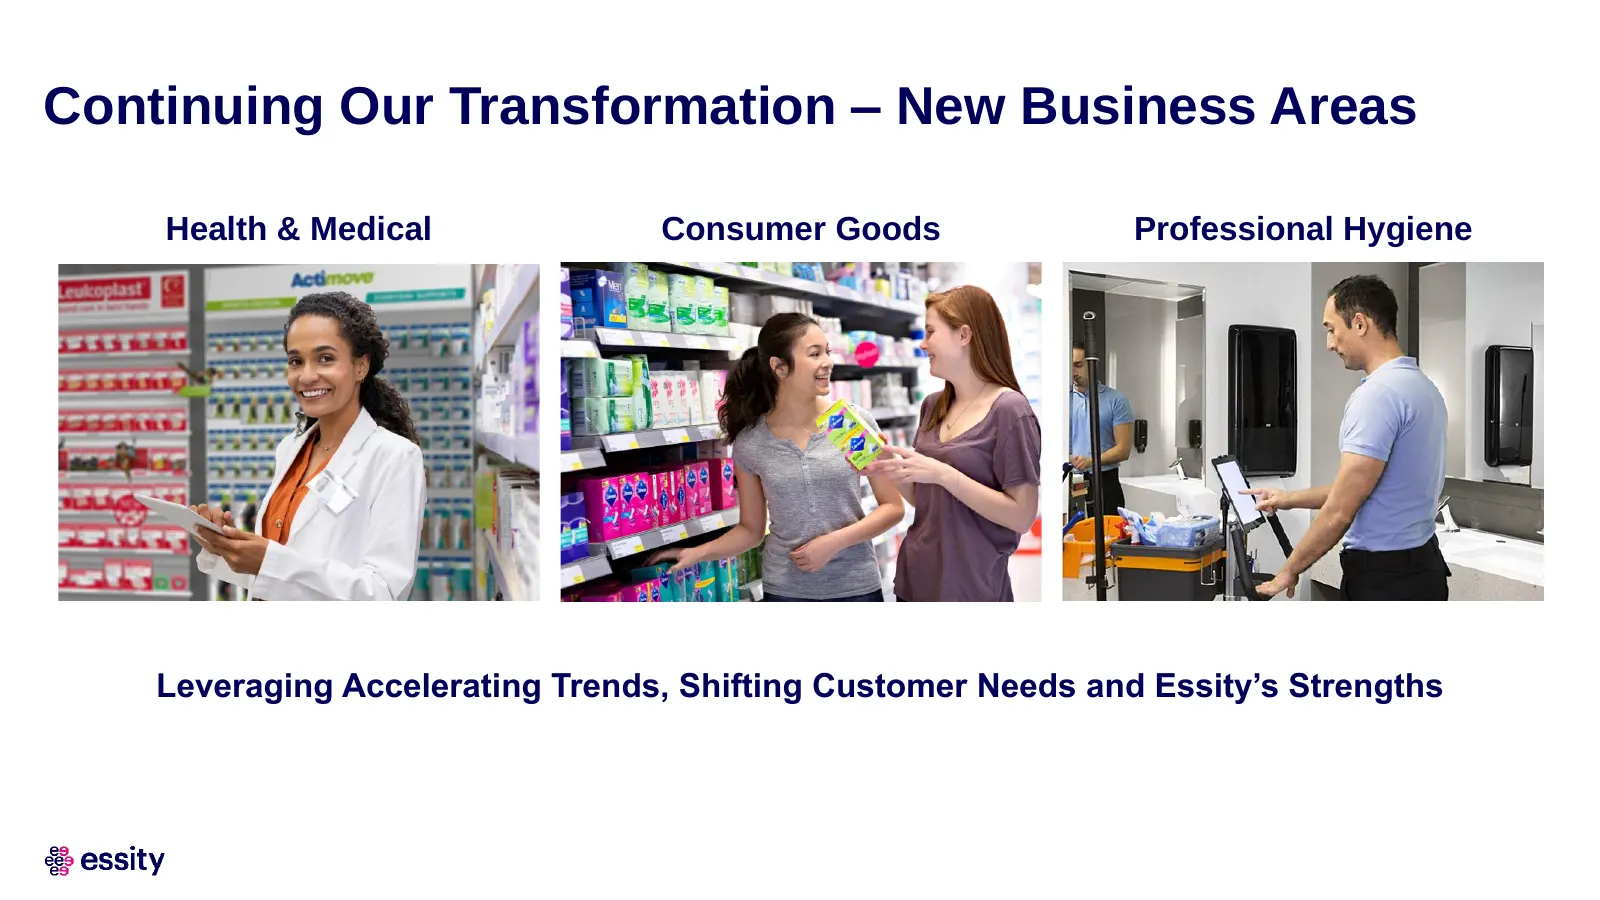
Continuing Our Transformation – New Business Areas Health & Medical Consumer Goods Professional Hygiene Leveraging Accelerating Trends, Shifting Customer Needs and Essity’s Strengths
Slide 13: New Business Areas
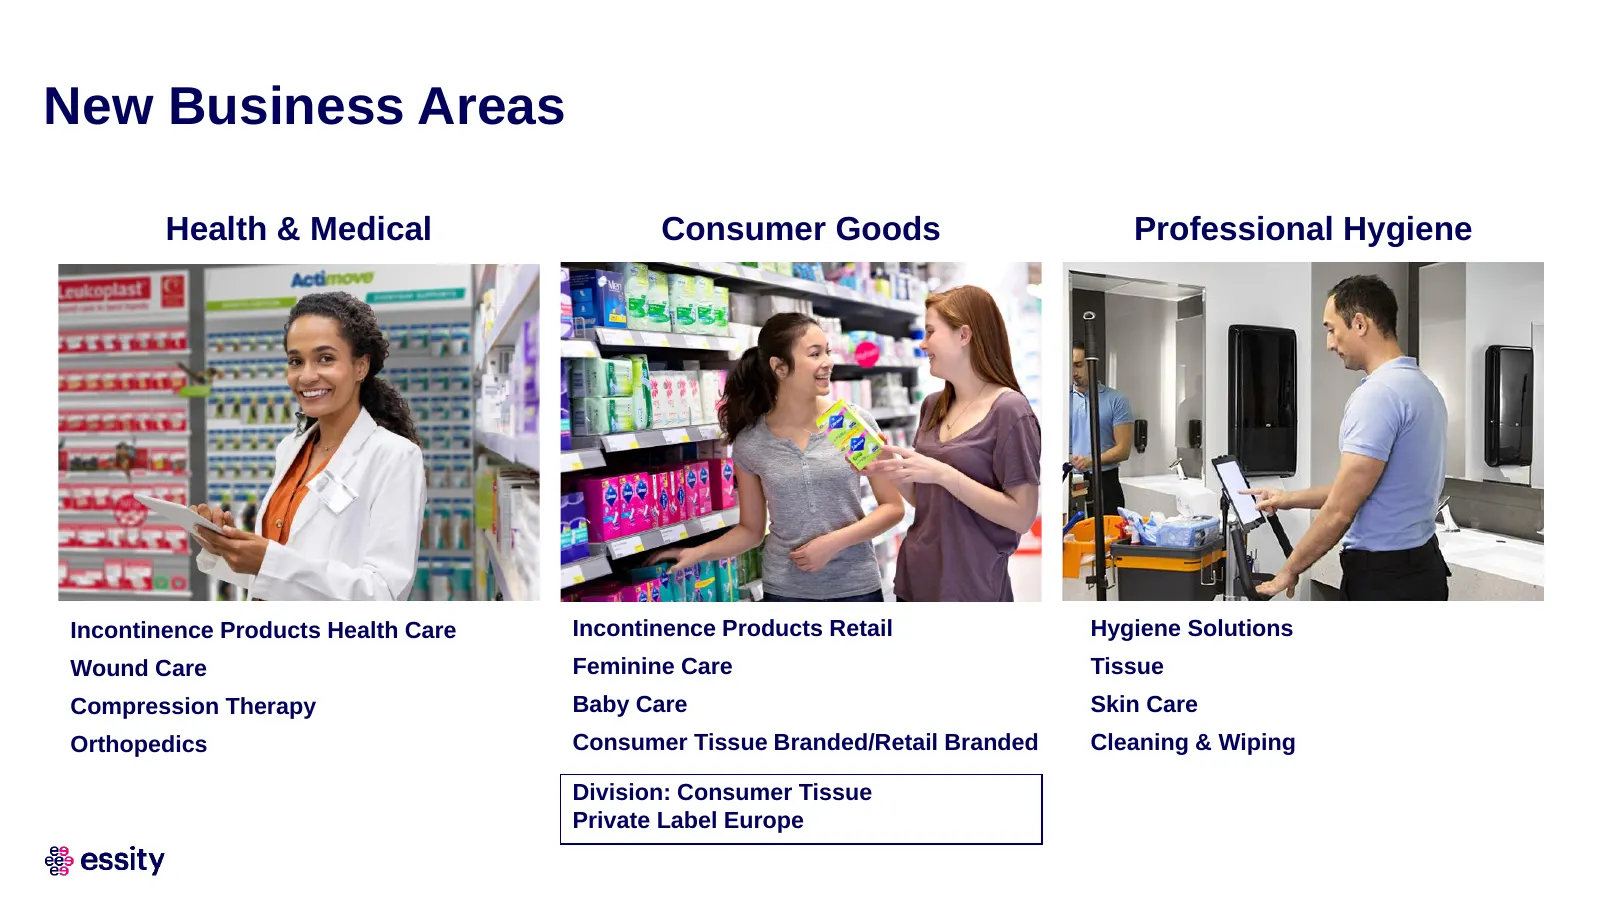
New Business Areas Health & Medical Consumer Goods Professional Hygiene Incontinence Products Health Care Incontinence Products Retail Hygiene Solutions Wound Care Feminine Care Tissue Compression Therapy Baby Care Skin Care Orthopedics Consumer Tissue Branded/Retail Branded Cleaning & Wiping Divisi
Slide 14: New Business Areas Split, Proforma 9M 2021
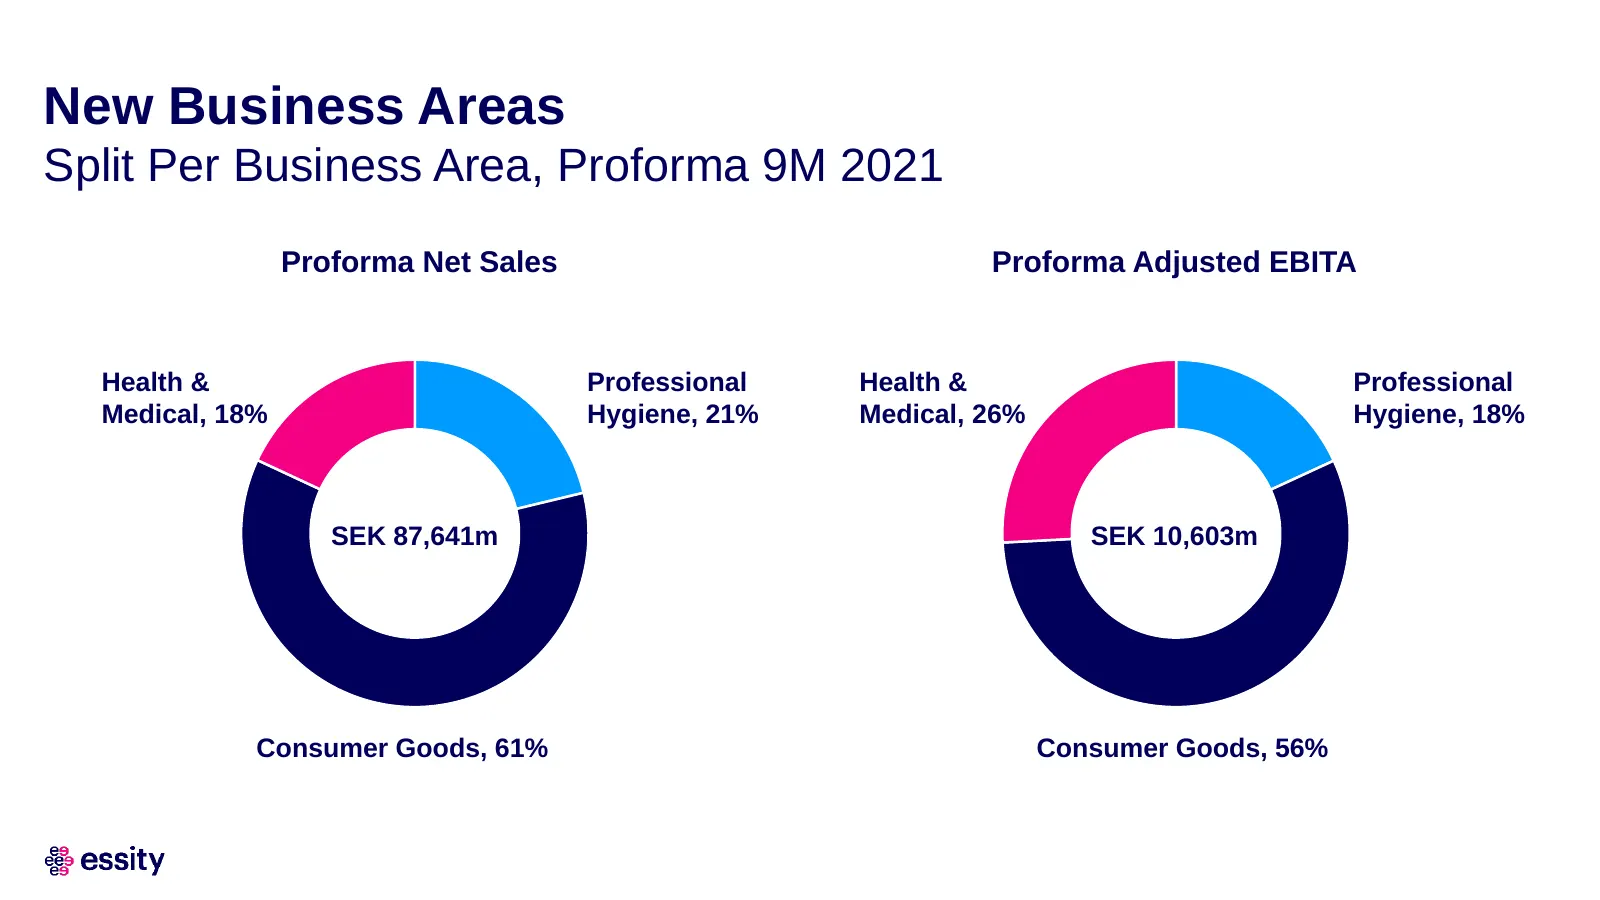
New Business Areas Split Per Business Area, Proforma 9M 2021 Proforma Net Sales Proforma Adjusted EBITA Health & Professional Health & Professional Medical, 18% Hygiene, 21% Medical, 26% Hygiene, 18% SEK 87,641m SEK 10,603m Consumer Goods, 61% Consumer Goods, 56%
Slide 15: Our Current Addressable Market
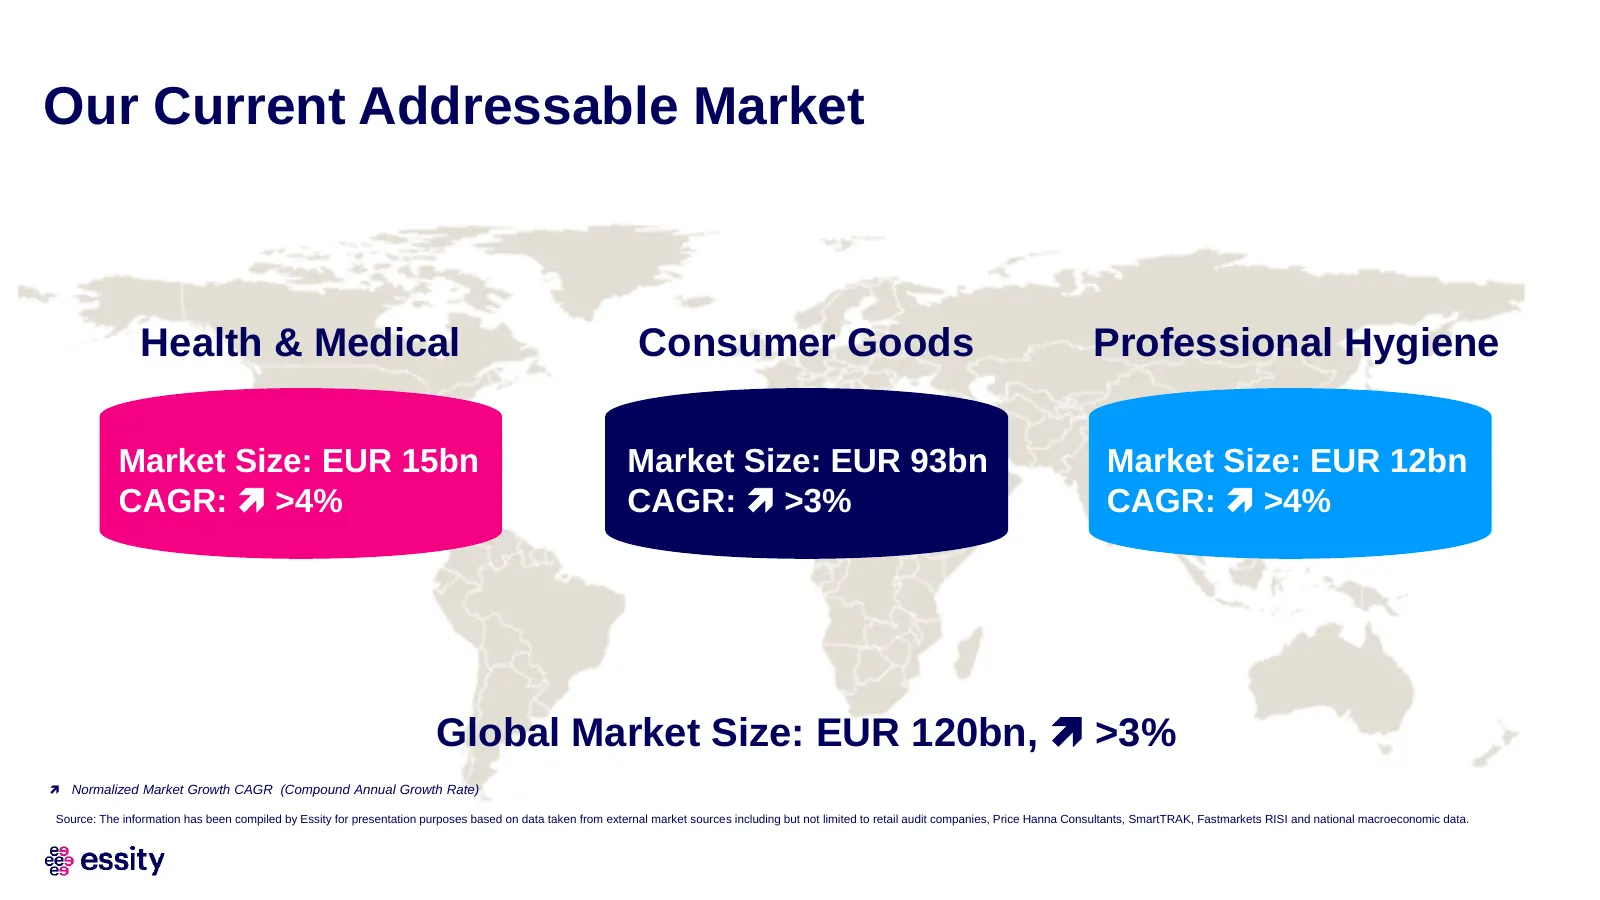
Our Current Addressable Market Health & Medical Consumer Goods Professional Hygiene Market Size: EUR 15bn Market Size: EUR 93bn Market Size: EUR 12bn CAGR: >4% CAGR: >3% CAGR: >4% Global Market Size: EUR 120bn, >3% Normalized Market Growth CAGR (Compound Annual Growth Rate) Source: The inf
Slide 16: Global Market Positions
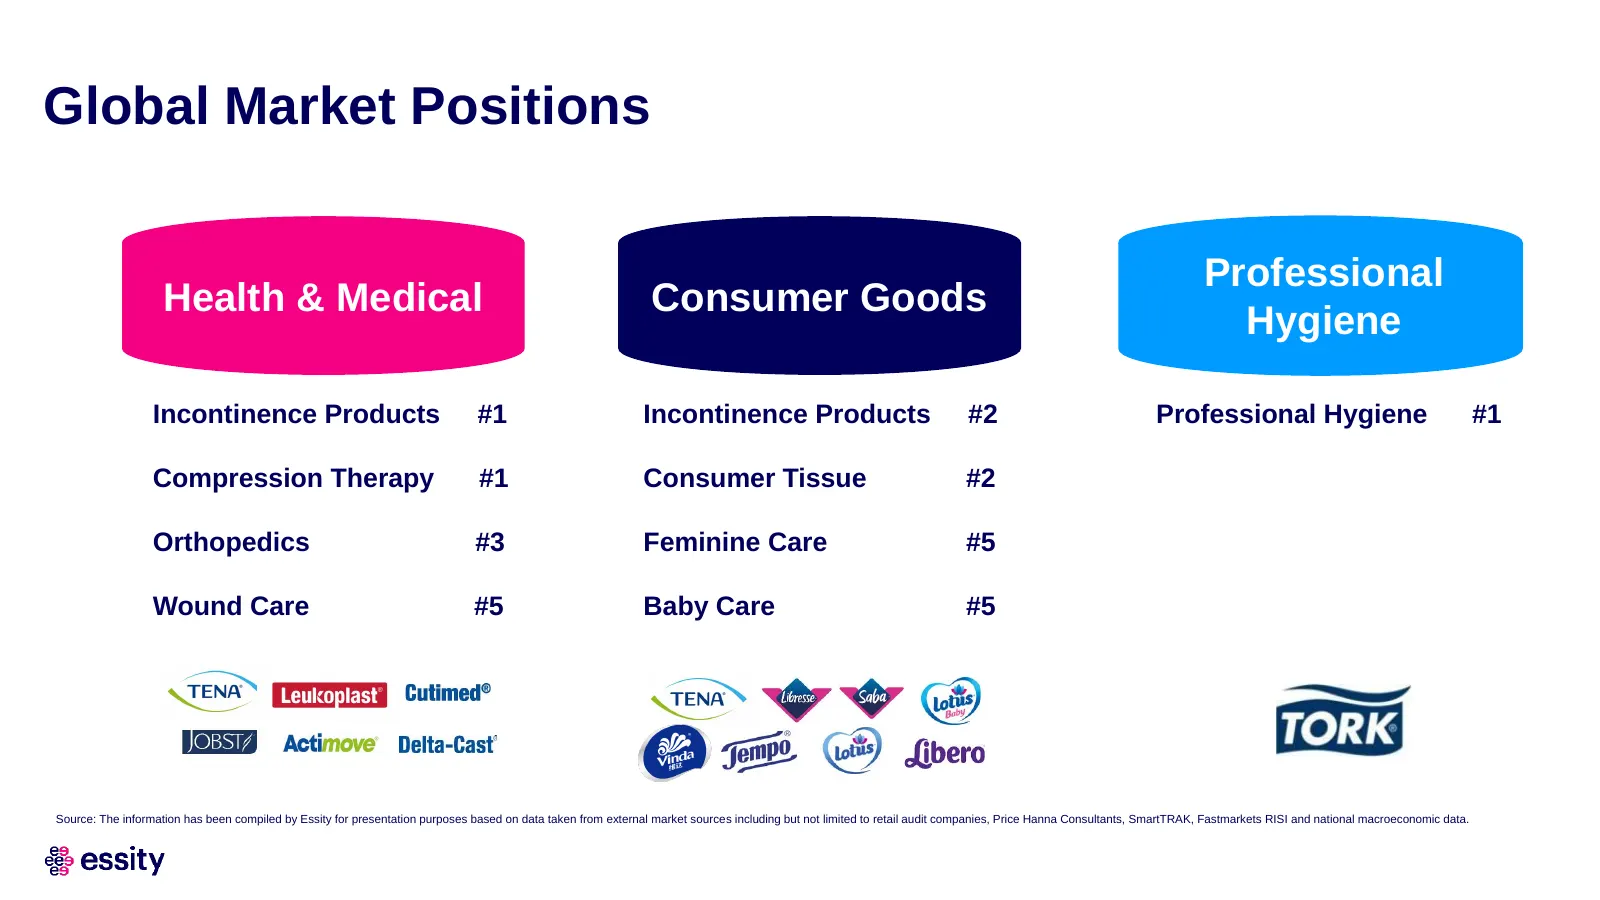
Global Market Positions Professional Health & Medical Consumer Goods Hygiene Incontinence Products #1 Incontinence Products #2 Professional Hygiene #1 Compression Therapy #1 Consumer Tissue #2 Orthopedics #3 Feminine Care #5 Wound Care #5 Baby Care #5 Source: The information has been compiled by Ess
Slide 17: Favourable Long-Term Trends
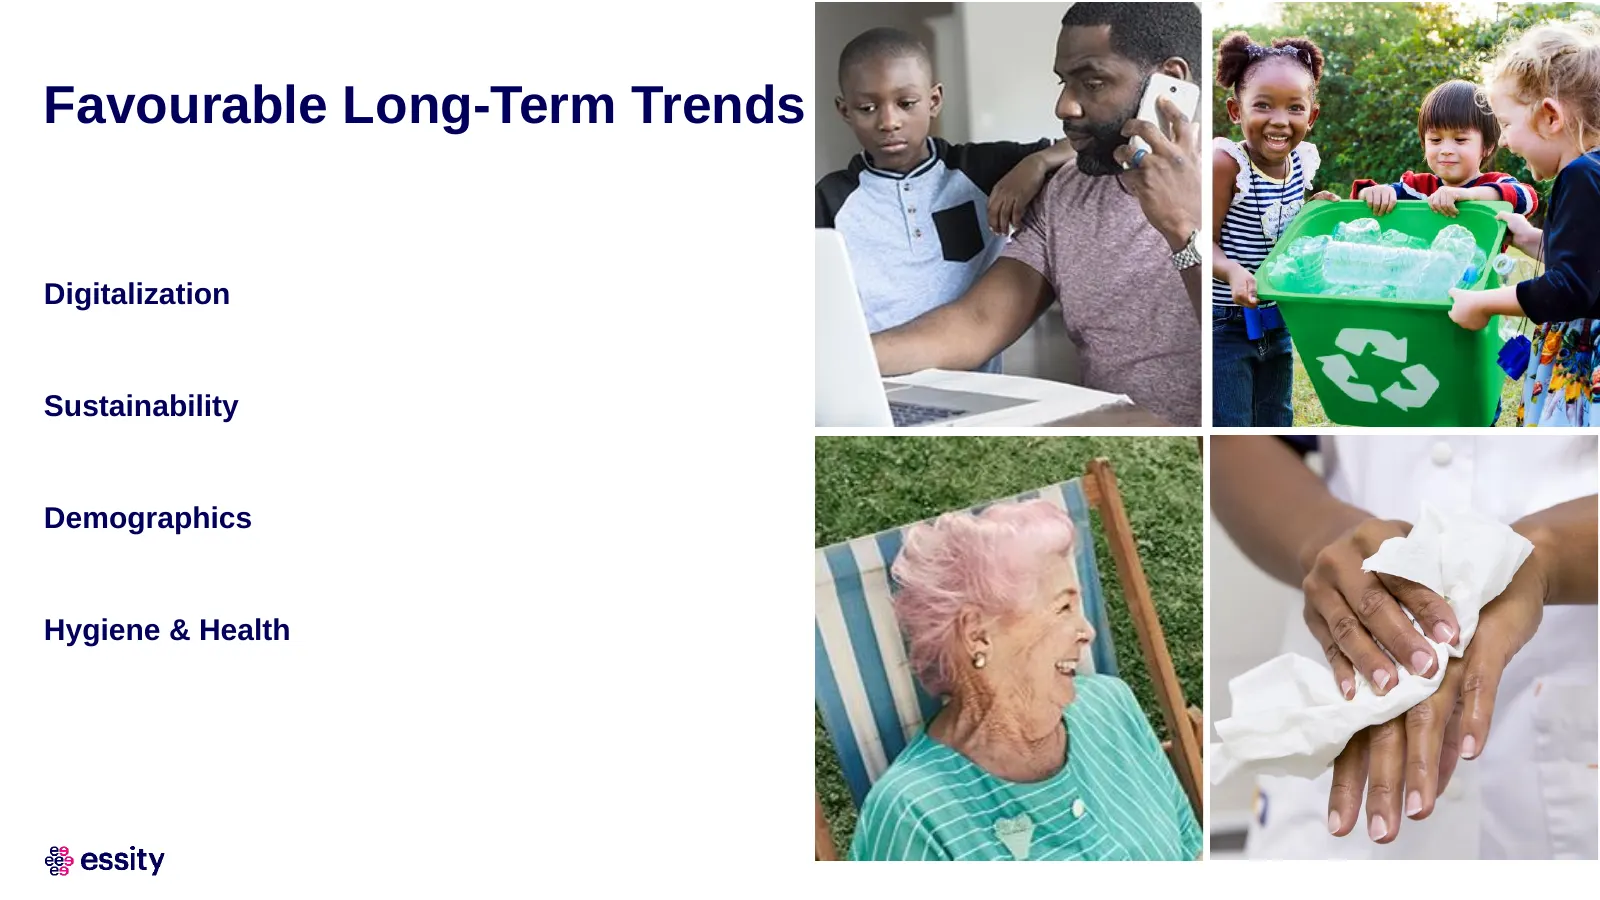
Favourable Long-Term Trends Digitalization Sustainability Demographics Hygiene & Health
Slide 18: Health & Medical
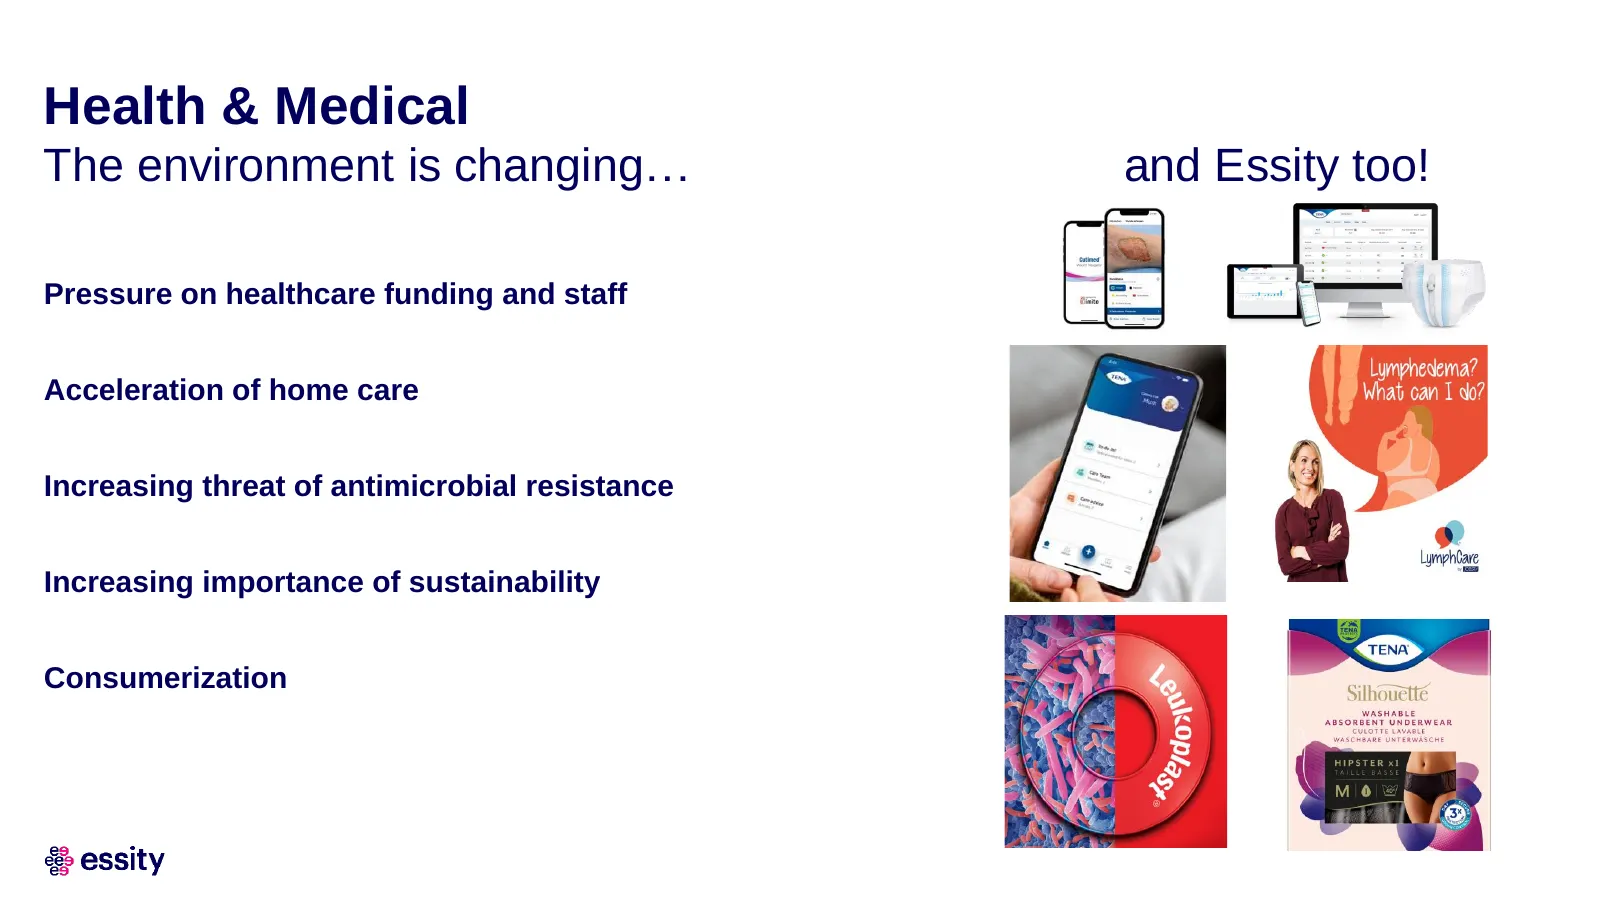
Health & Medical The environment is changing… and Essity too! Pressure on healthcare funding and staff Acceleration of home care Increasing threat of antimicrobial resistance Increasing importance of sustainability Consumerization
Slide 19: Consumer Goods
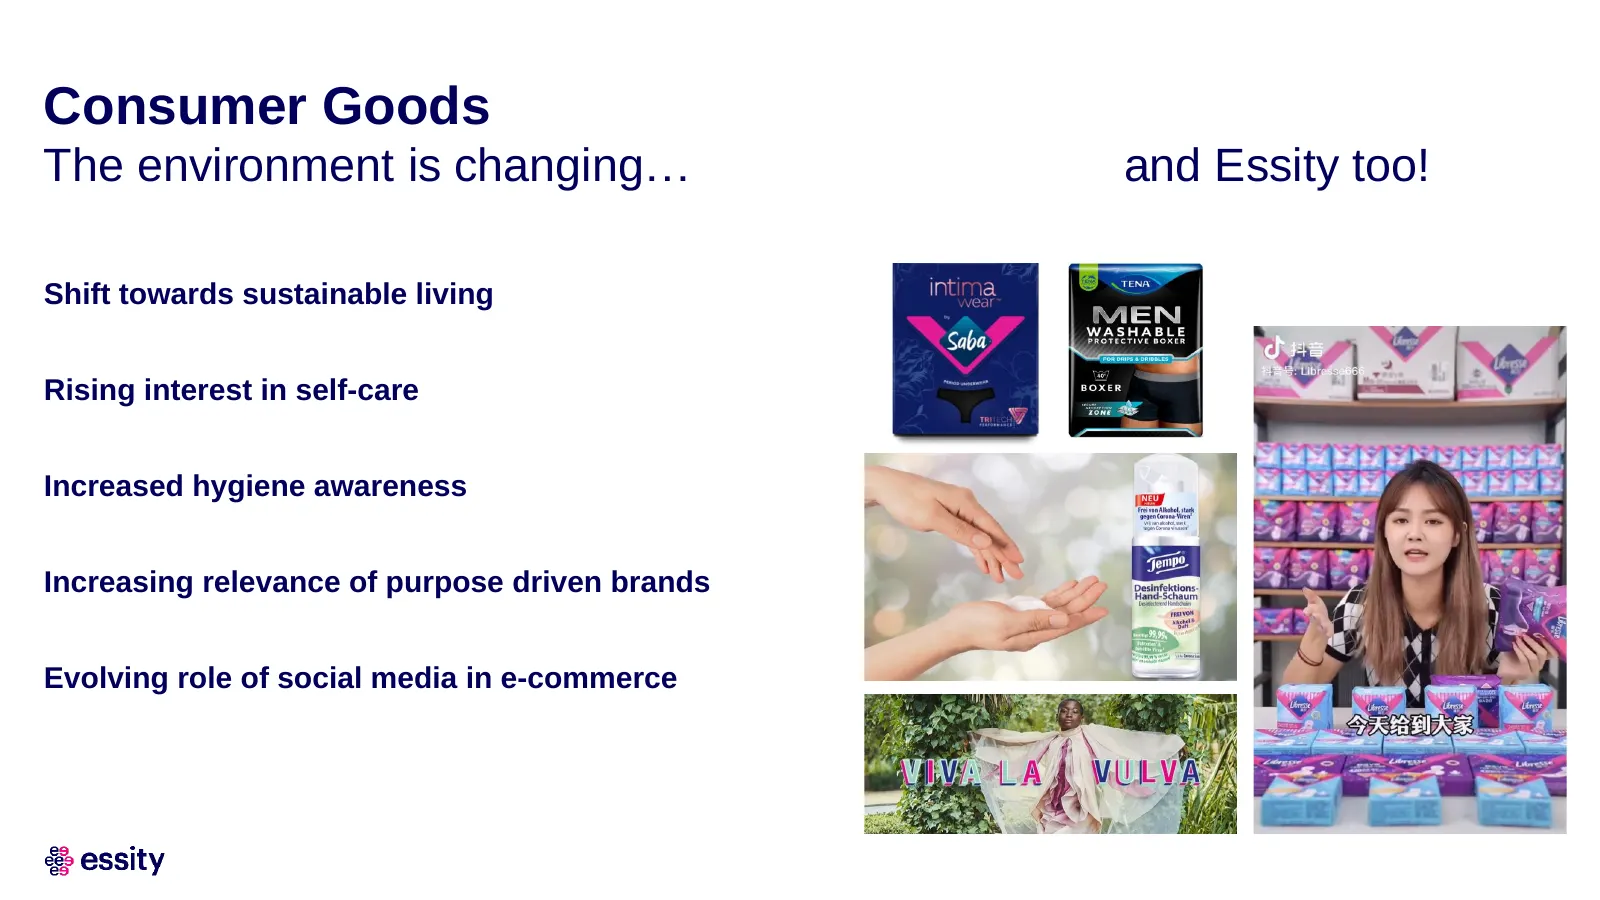
Consumer Goods The environment is changing… and Essity too! Shift towards sustainable living Rising interest in self-care Increased hygiene awareness Increasing relevance of purpose driven brands Evolving role of social media in e-commerce
Slide 20: Professional Hygiene
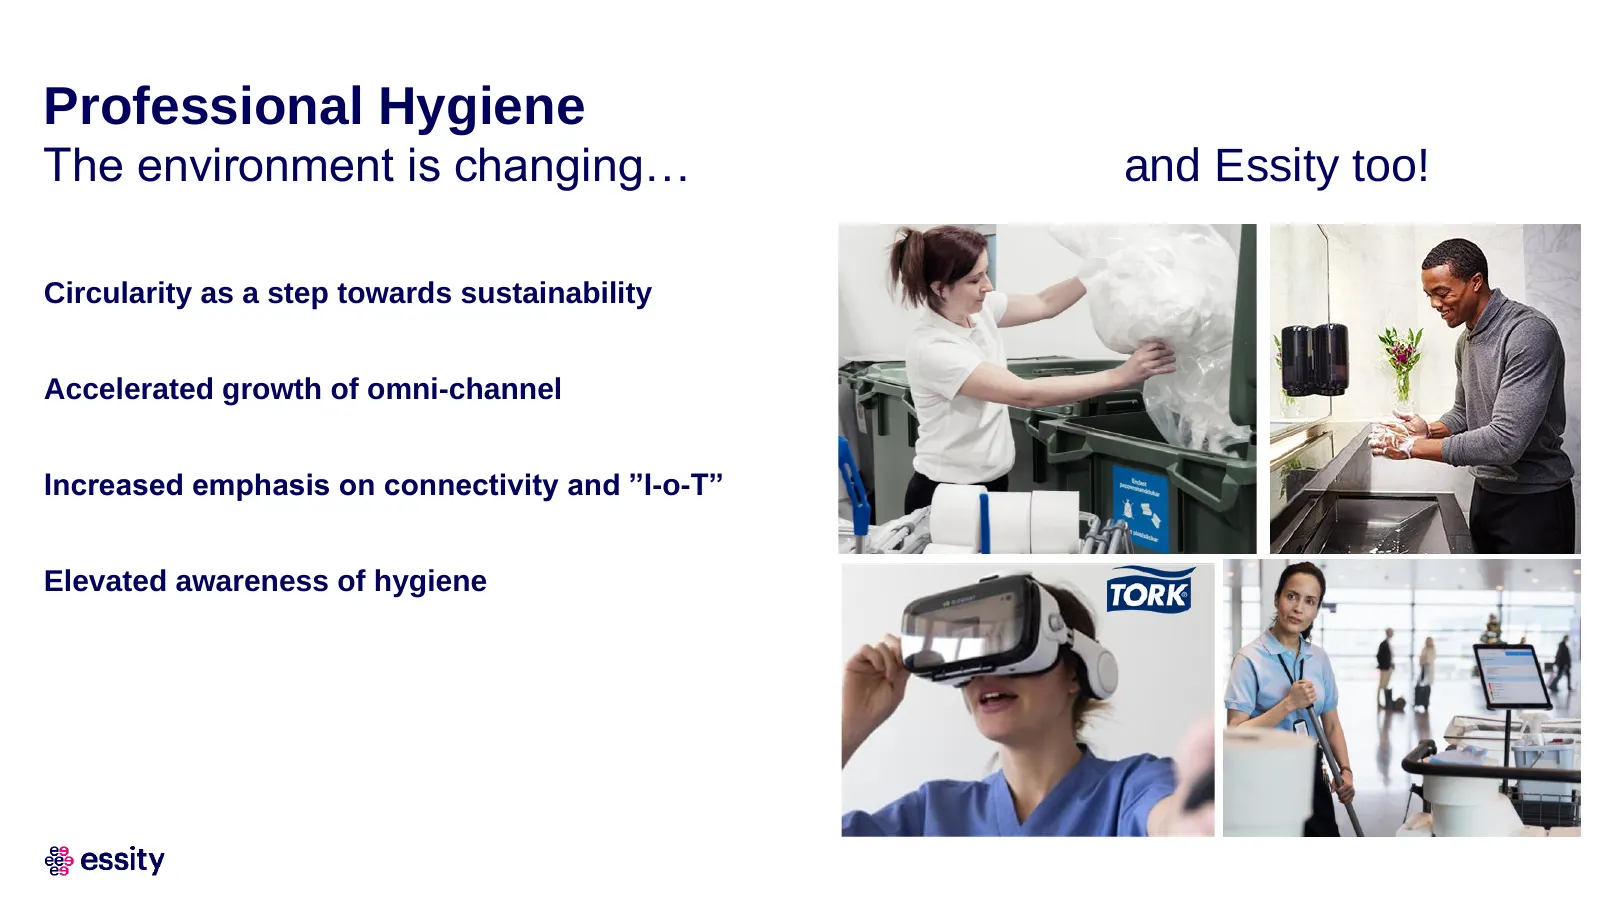
Professional Hygiene The environment is changing… and Essity too! Circularity as a step towards sustainability Accelerated growth of omni-channel Increased emphasis on connectivity and ”I-o-T” Elevated awareness of hygiene
Slide 21: Profitable Growth Opportunities in All Business Areas
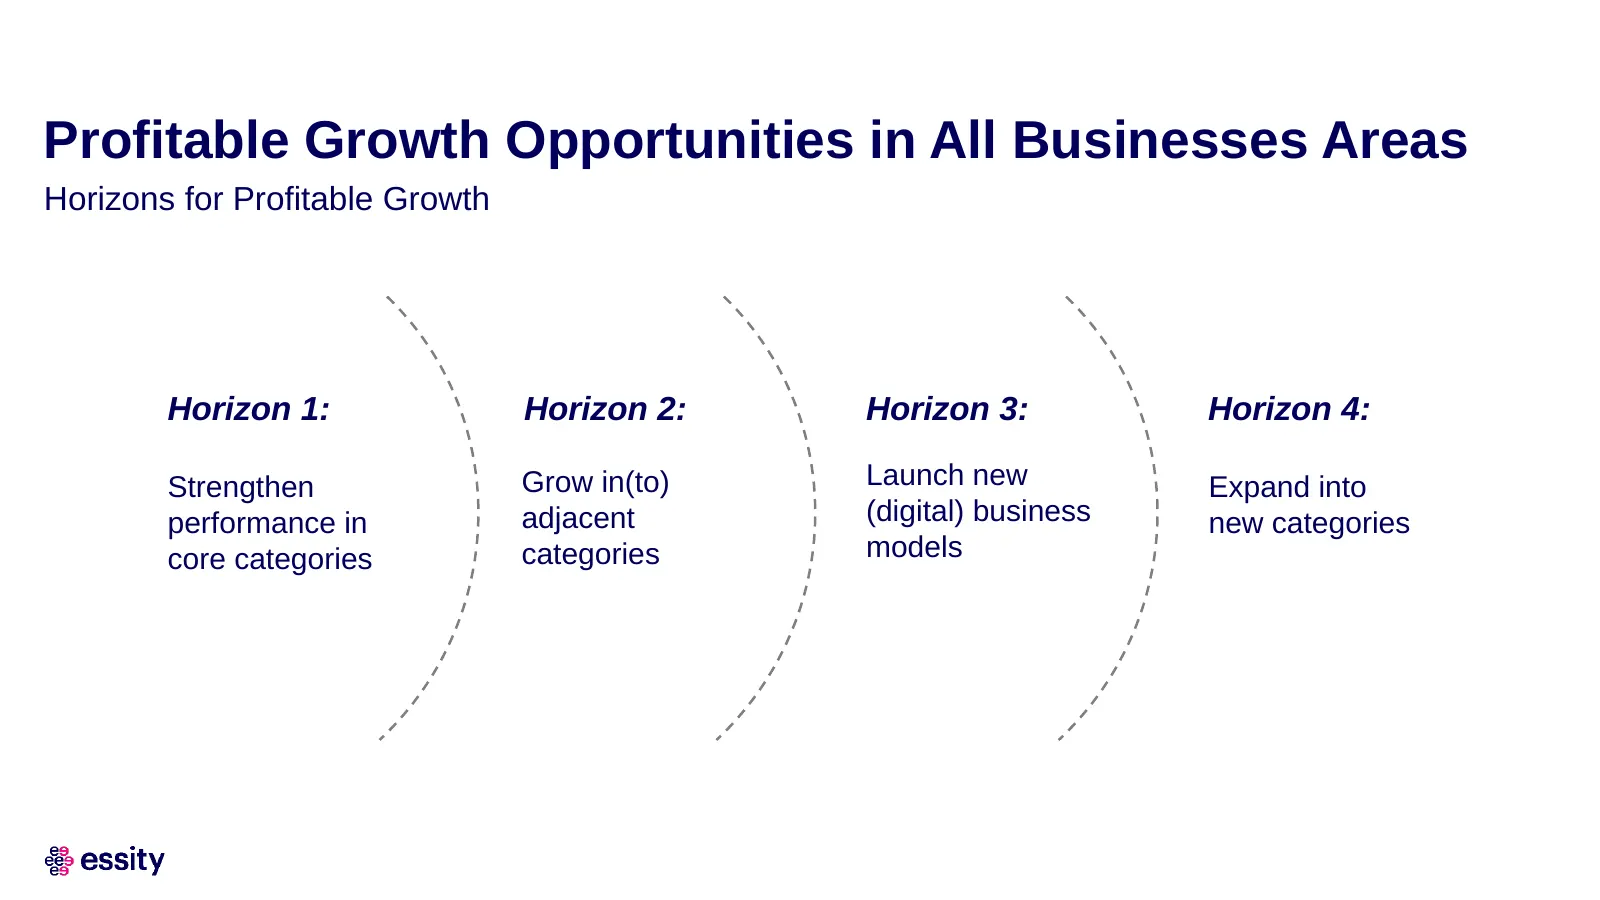
Profitable Growth Opportunities in All Businesses Areas Horizons for Profitable Growth Horizon 1: Horizon 2: Horizon 3: Horizon 4: Strengthen Grow in(to) Launch new Expand into performance in adjacent (digital) business new categories core categories categories models
Slide 22: Health & Medical – Profitable Growth Opportunities
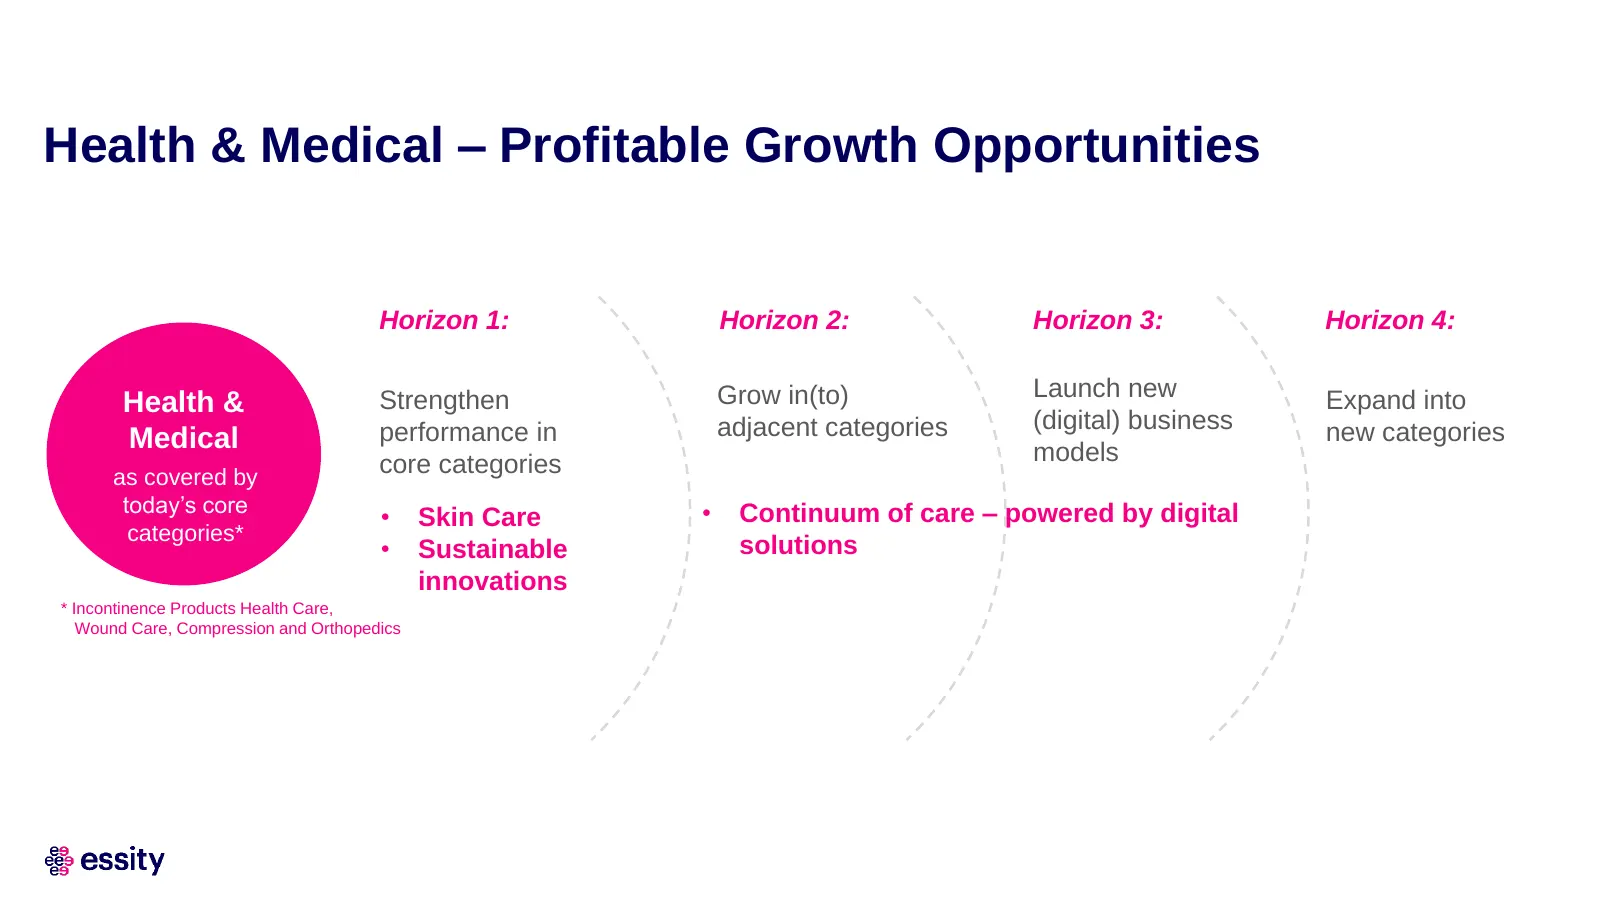
Health & Medical – Profitable Growth Opportunities Horizon 1: Horizon 2: Horizon 3: Horizon 4: Strengthen Grow in(to) Launch new Expand into Health & performance in adjacent categories (digital) business new categories Medical models as covered by core categories today’s core • Continuum of care – p
Slide 23: Consumer Goods – Profitable Growth Opportunities
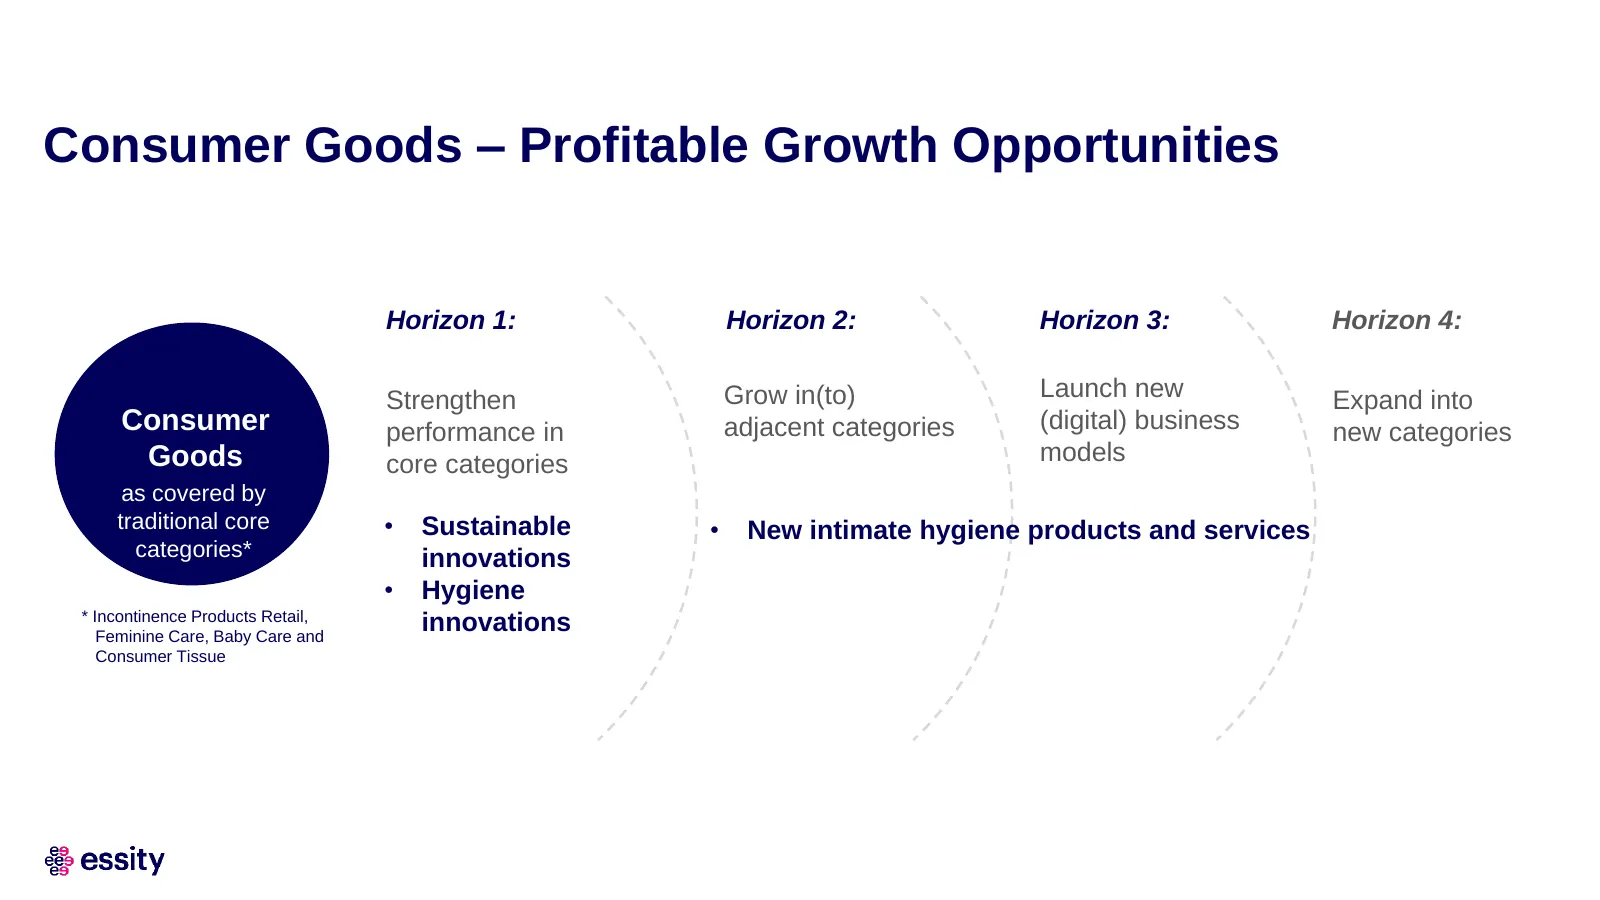
Consumer Goods – Profitable Growth Opportunities Horizon 1: Horizon 2: Horizon 3: Horizon 4: Strengthen Grow in(to) Launch new Expand into Consumer performance in adjacent categories (digital) business new categories Goods core categories models as covered by traditional core • Sustainable • New int
Slide 24: Professional Hygiene – Profitable Growth Opportunities
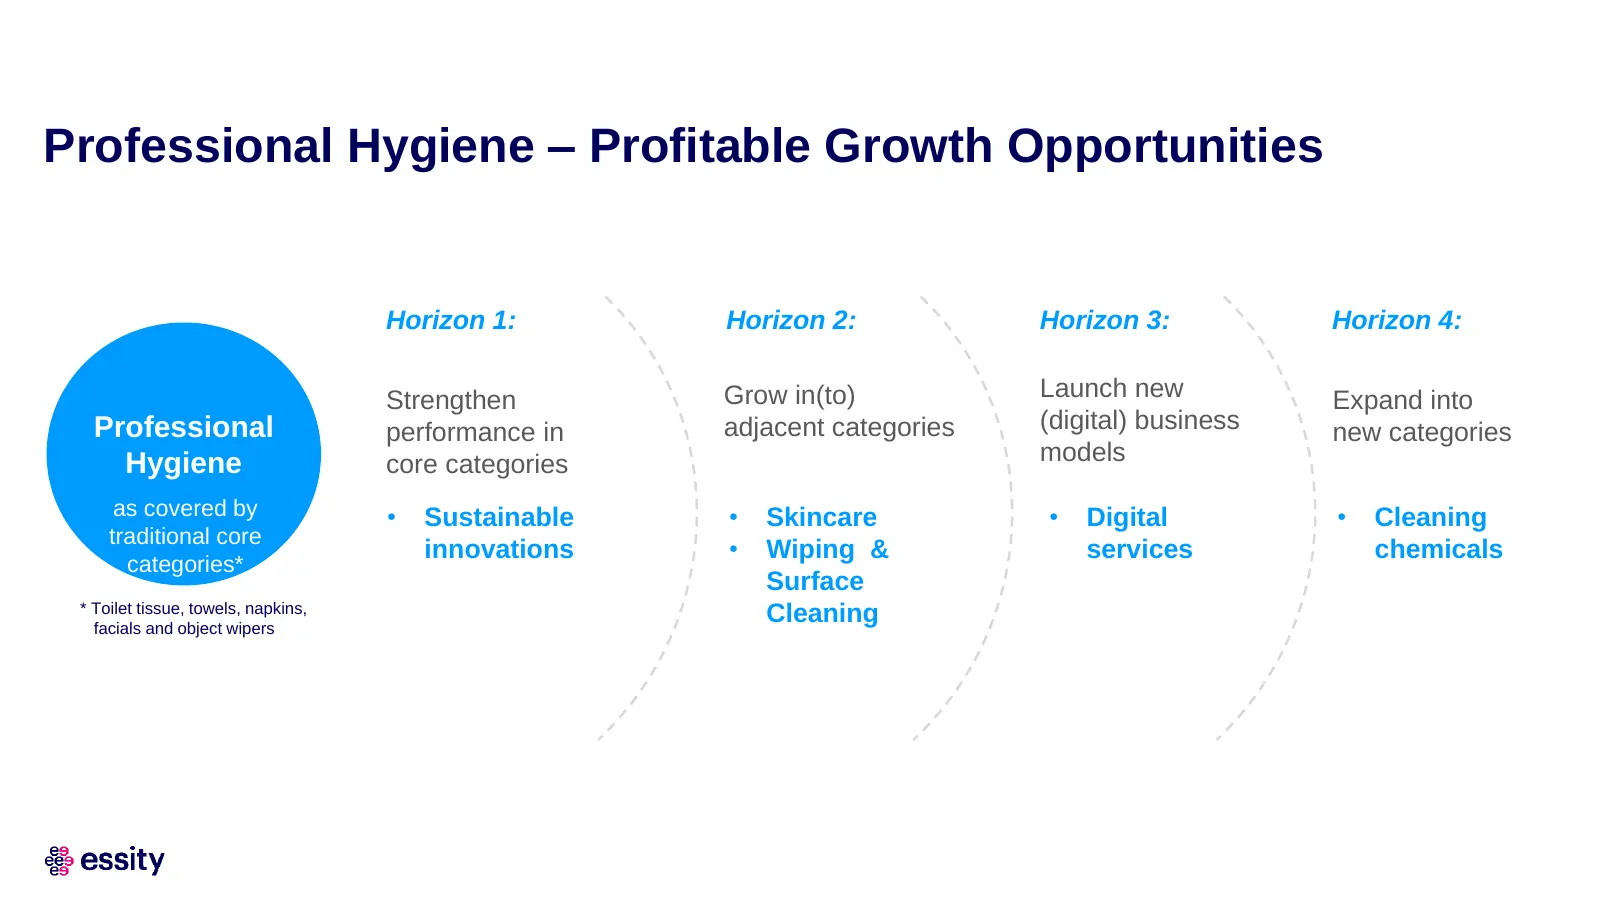
Professional Hygiene – Profitable Growth Opportunities Horizon 1: Horizon 2: Horizon 3: Horizon 4: Strengthen Grow in(to) Launch new Expand into Professional performance in adjacent categories (digital) business new categories Hygiene core categories models as covered by • Sustainable • Skincare • D
Slide 25: Value Creating Acquisitions Positioning Essity for Profitable Growth
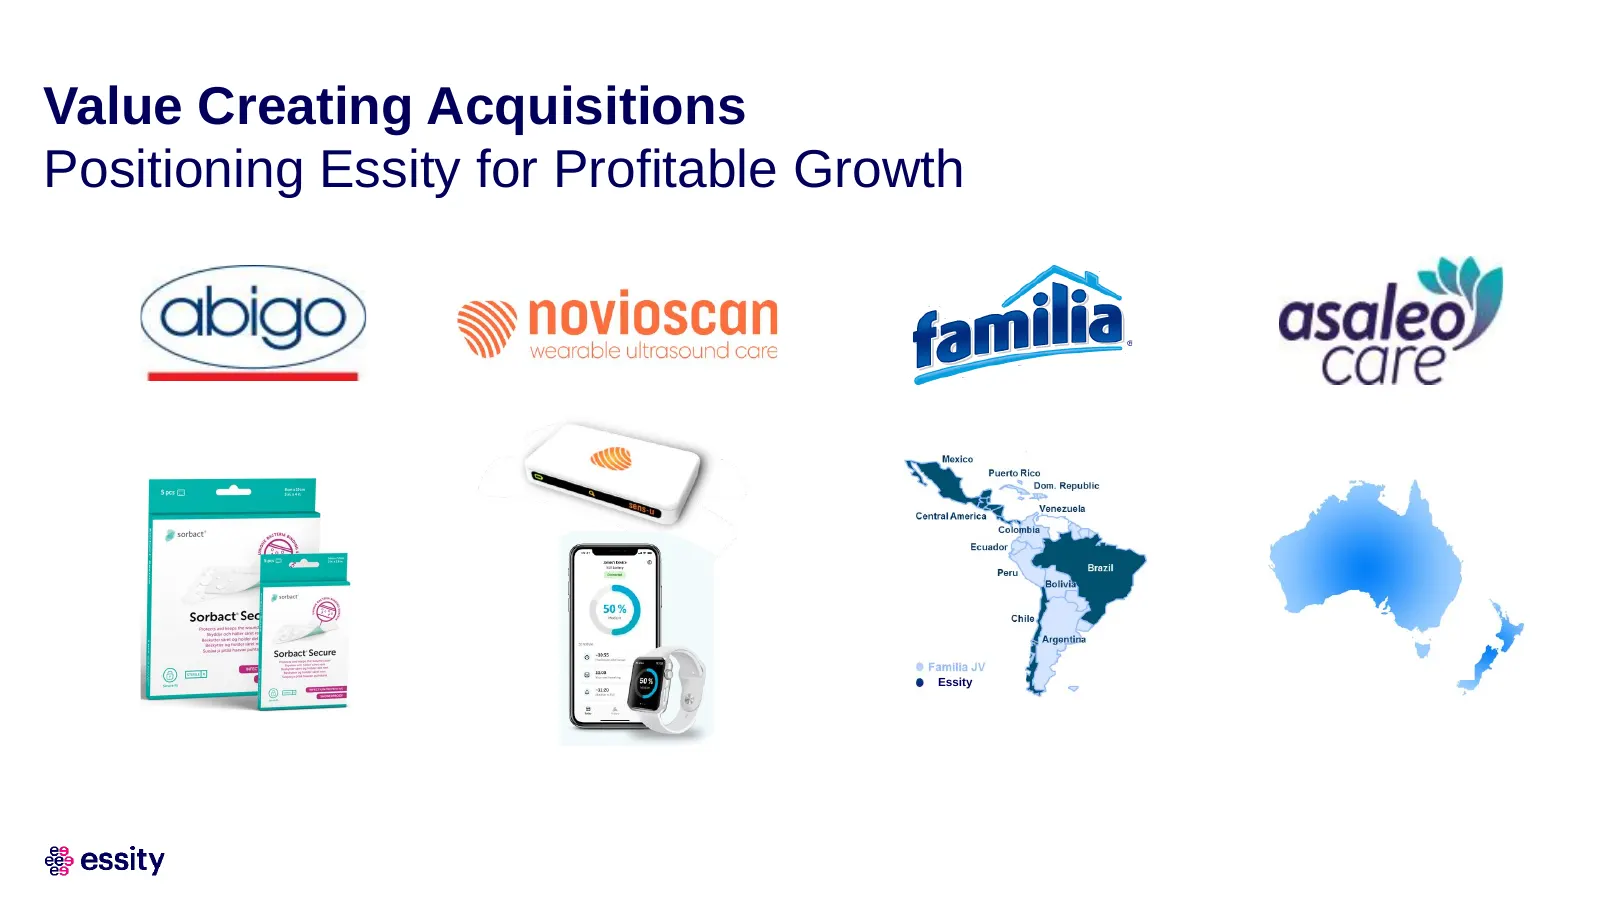
Value Creating Acquisitions Positioning Essity for Profitable Growth Essity
Slide 26: The Transformation Journey in Australasia
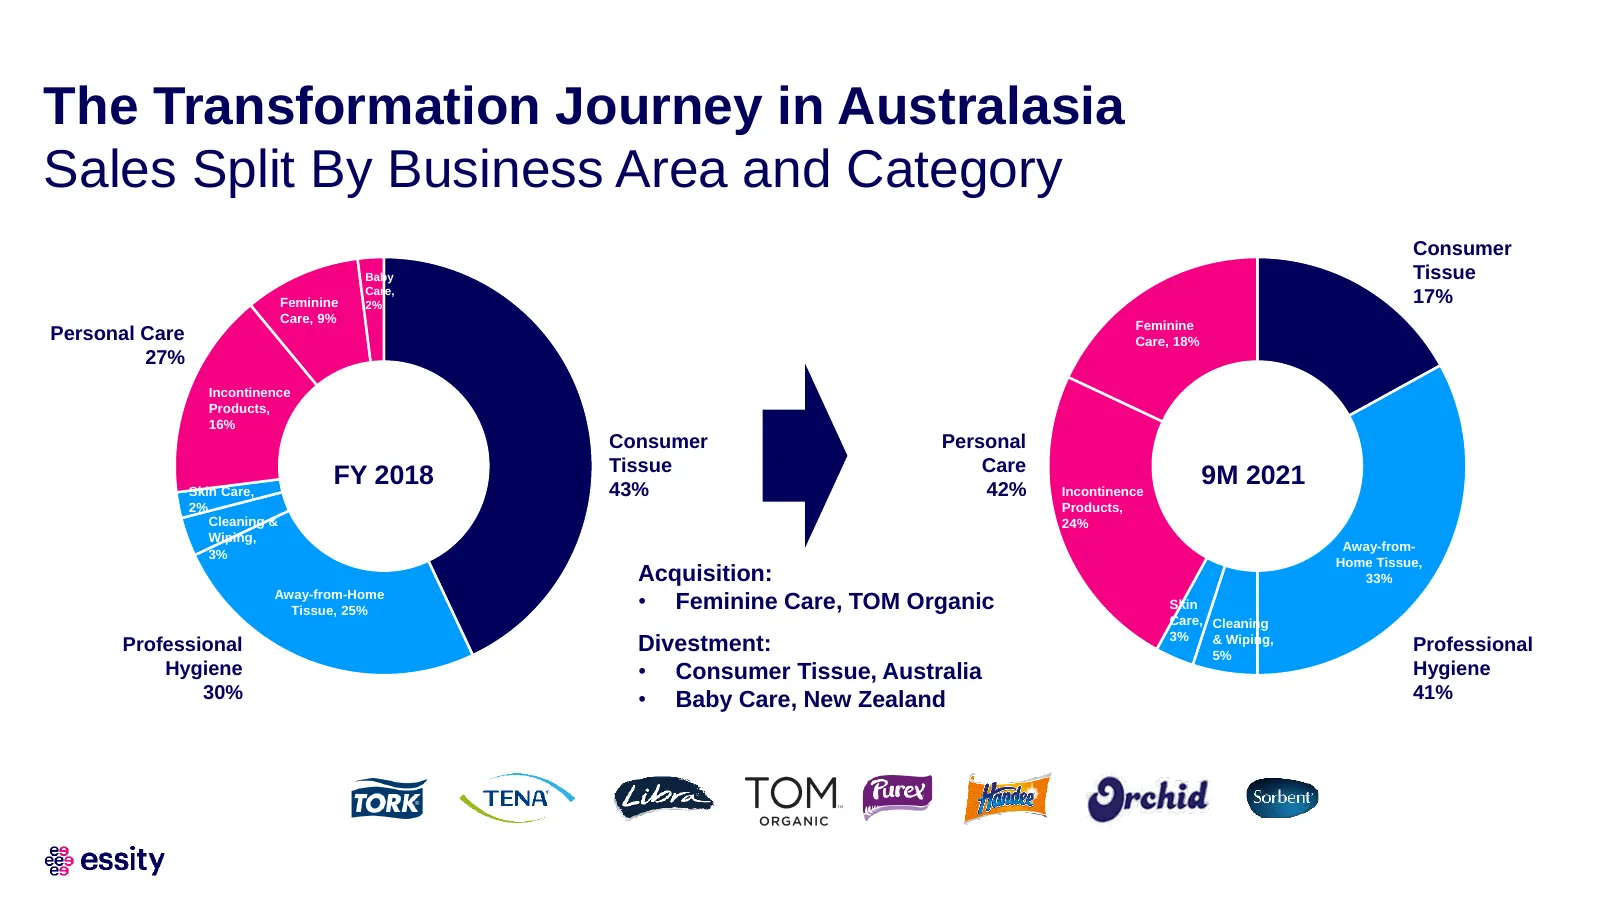
The Transformation Journey in Australasia Sales Split By Business Area and Category Consumer Baby Tissue Care, Feminine 2% 17% Care, 9% Feminine Personal Care Care, 18% 27% Incontinence Products, 16% Consumer Personal Tissue Care Skin Care, FY 2018 43% 42% Incontinence 9M 2021 2% Products, Cleaning
Slide 27: The Transformation Journey in Australasia
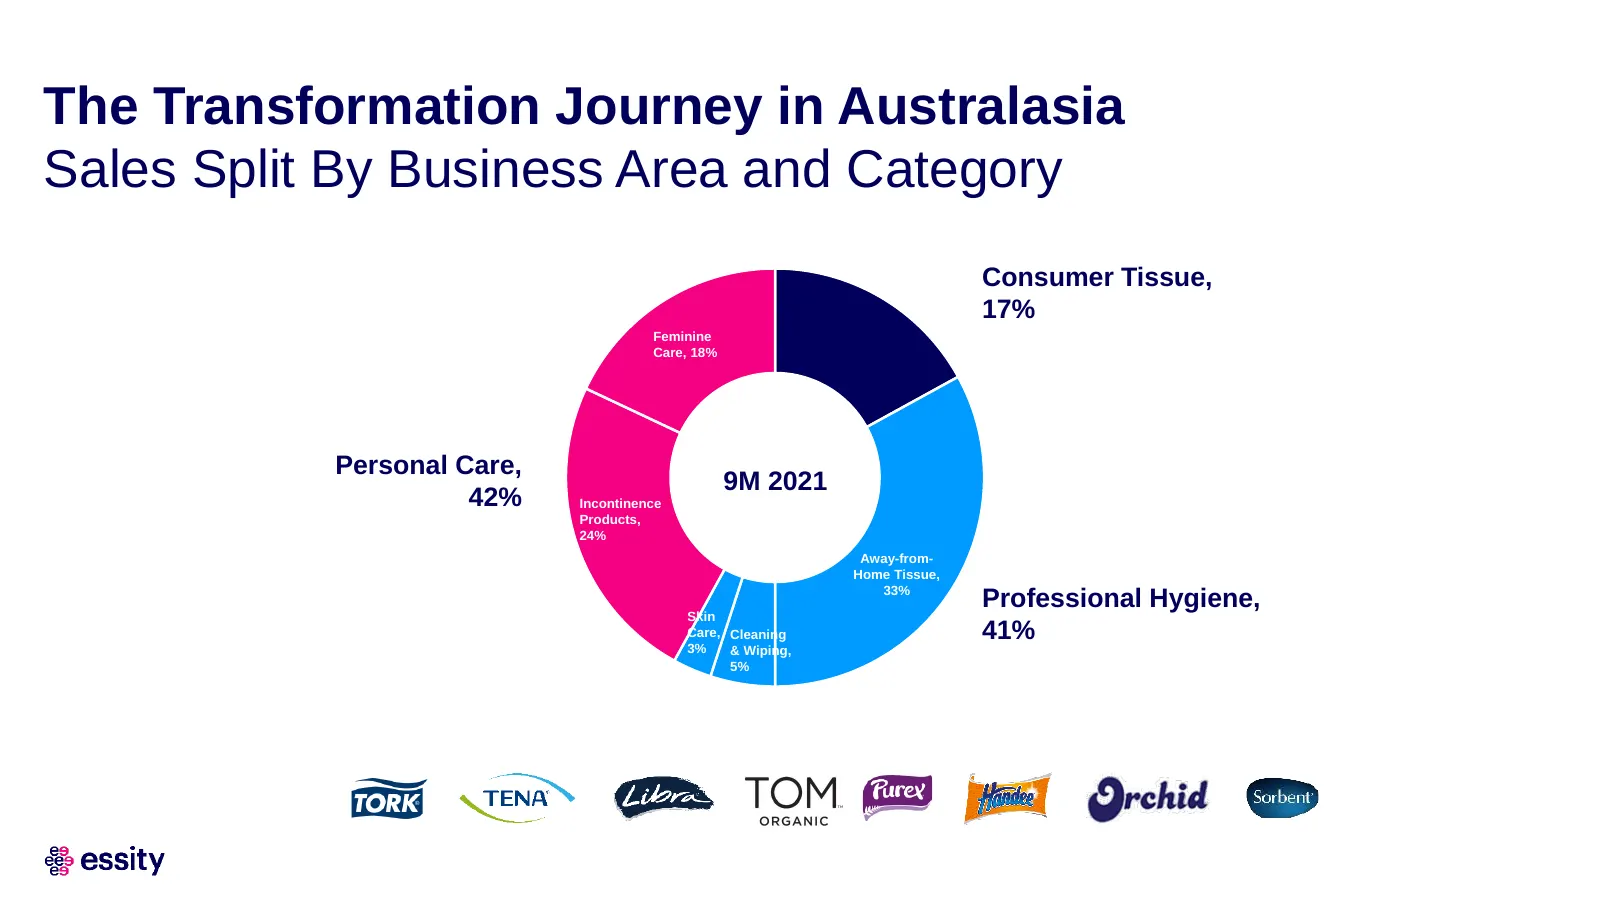
The Transformation Journey in Australasia Sales Split By Business Area and Category Consumer Tissue, 17% Feminine Care, 18% Personal Care, 9M 2021 42% Incontinence Products, 24% Away-from- Home Tissue, 33% Professional Hygiene, Skin Care, Cleaning 41% 3% & Wiping, 5%
Slide 28: Better-for-You, Better-for-Planet
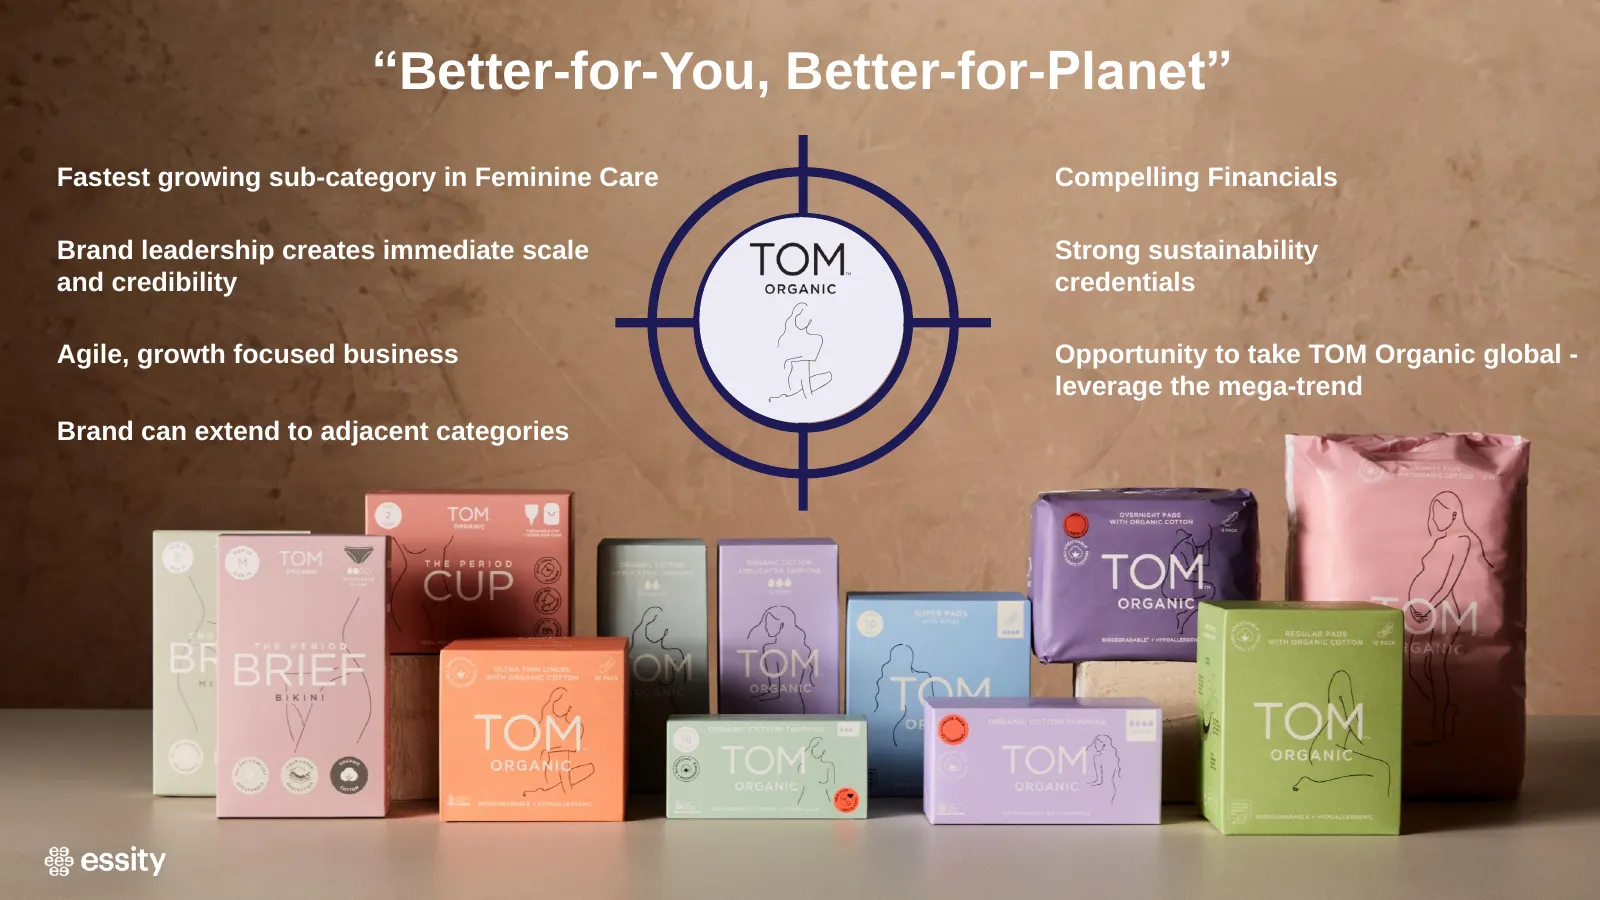
“Better-for-You, Better-for-Planet” Fastest growing sub-category in Feminine Care Compelling Financials Brand leadership creates immediate scale Strong sustainability and credibility credentials Agile, growth focused business Opportunity to take TOM Organic global - leverage the mega-trend Brand can
Slide 29: M&A Opportunities
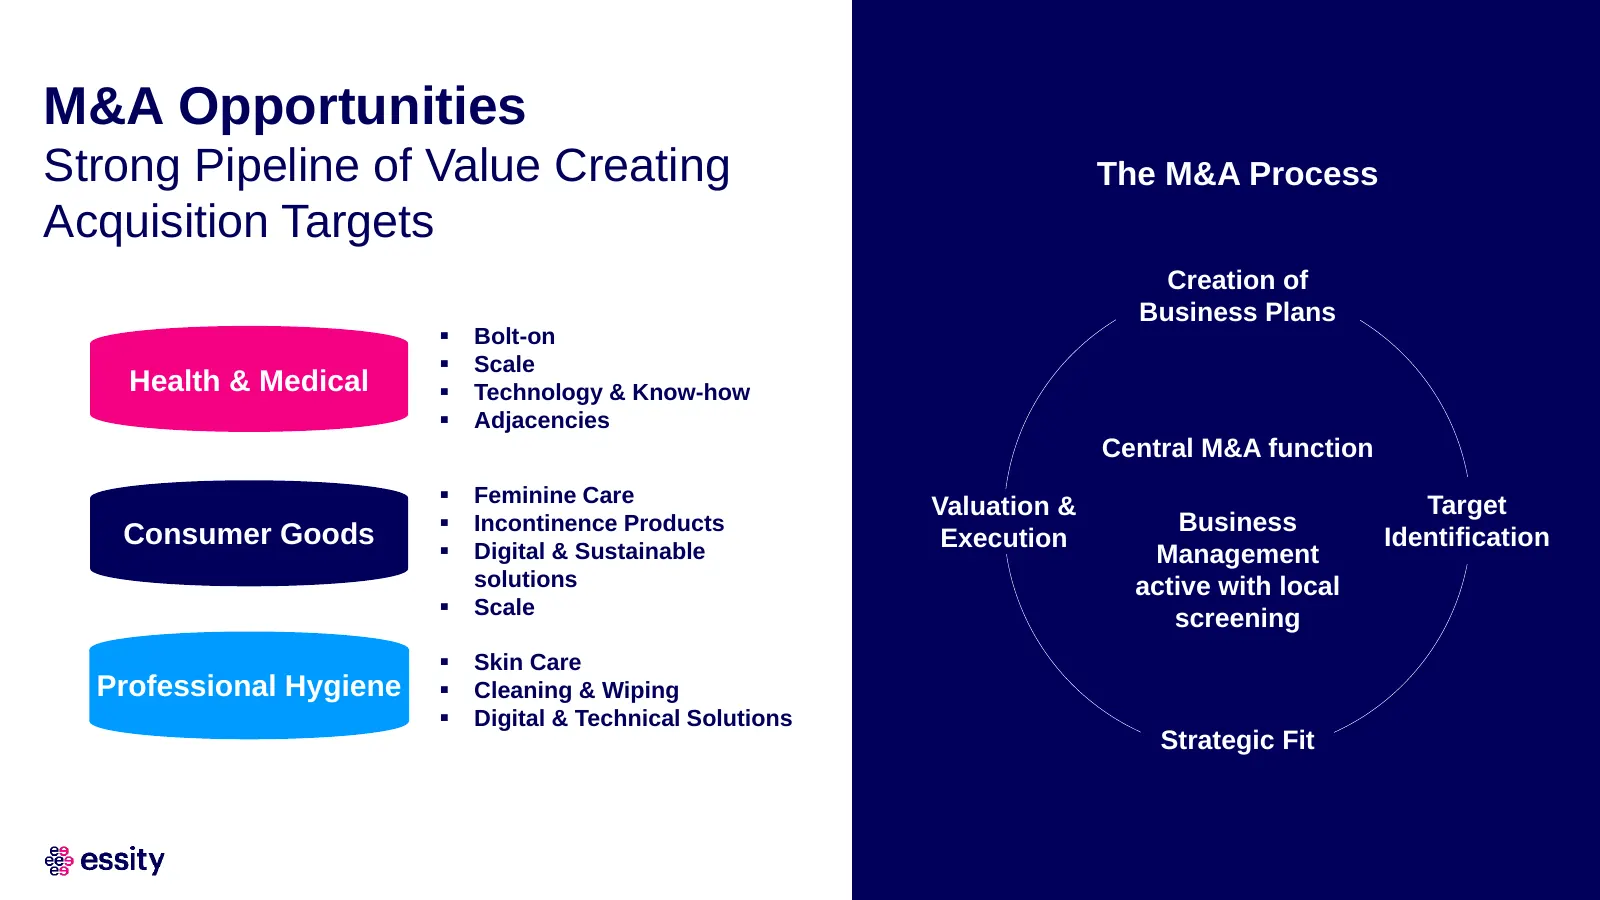
M&A Opportunities Strong Pipeline of Value Creating The M&A Process Acquisition Targets Creation of Business Plans ▪ Bolt-on ▪ Scale Health & Medical ▪ Technology & Know-how ▪ Adjacencies Central M&A function ▪ Feminine Care Target Valuation & ▪ Incontinence Products Business Consumer Goods Executio

Slide 30: Acquisition of Professional Sports Tape Brands
Acquisition of Professional Sports Tape Brands
Slide 31: Strategic Priorities for Profitable Growth
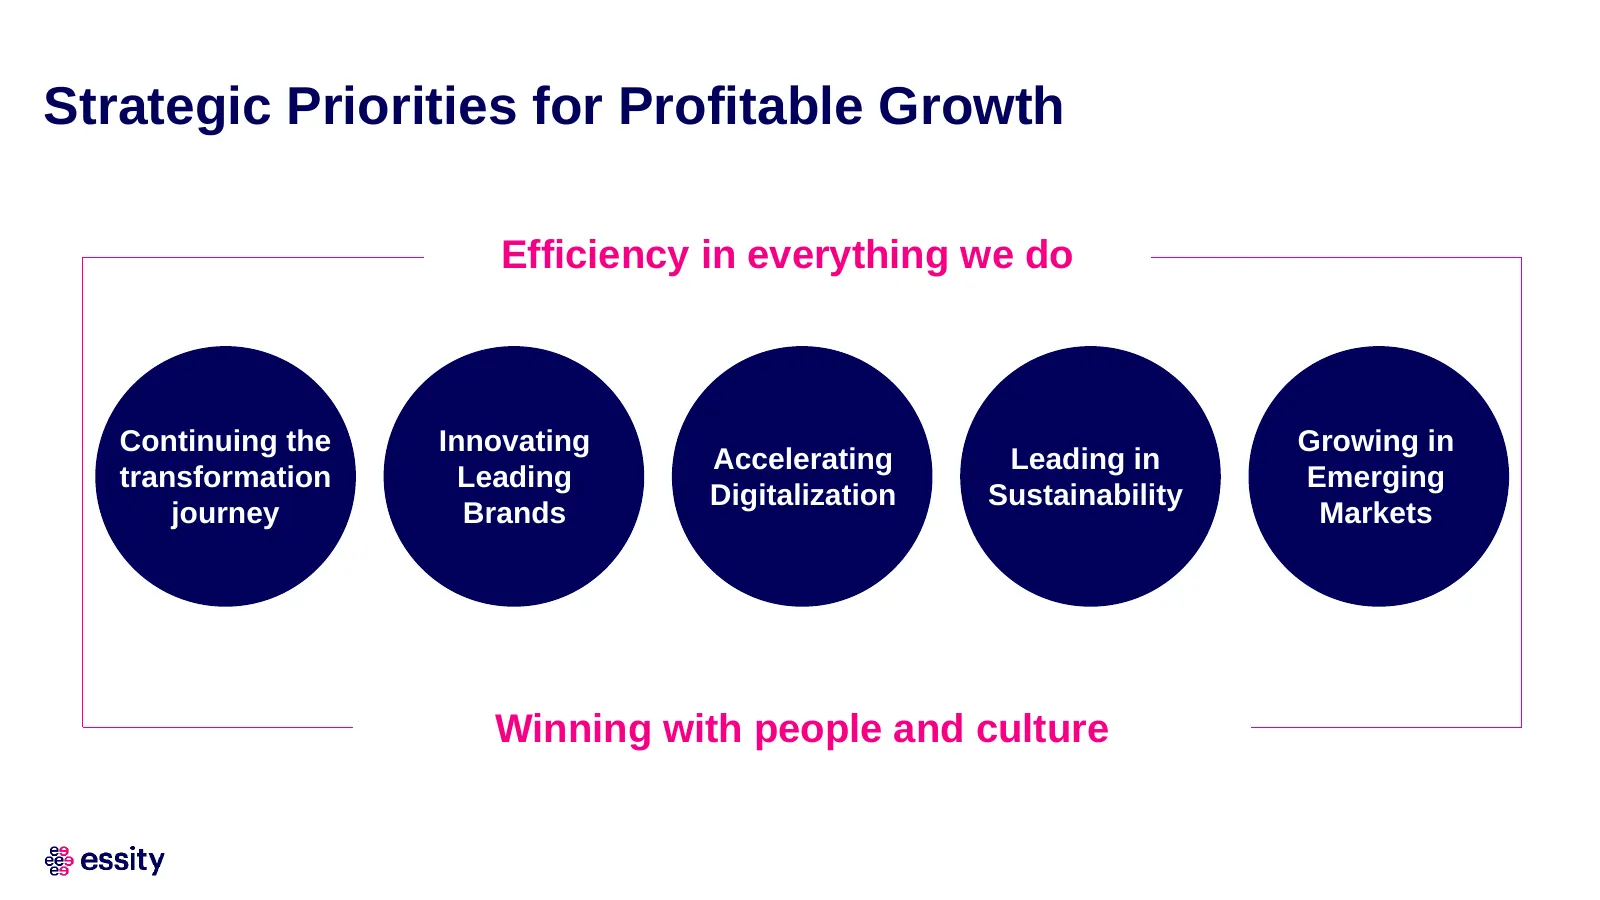
Strategic Priorities for Profitable Growth Efficiency in everything we do Continuing the Innovating Growing in Accelerating Leading in transformation Leading Emerging Digitalization Sustainability journey Brands Markets Winning with people and culture
Slide 32: Delivering Profitable Growth
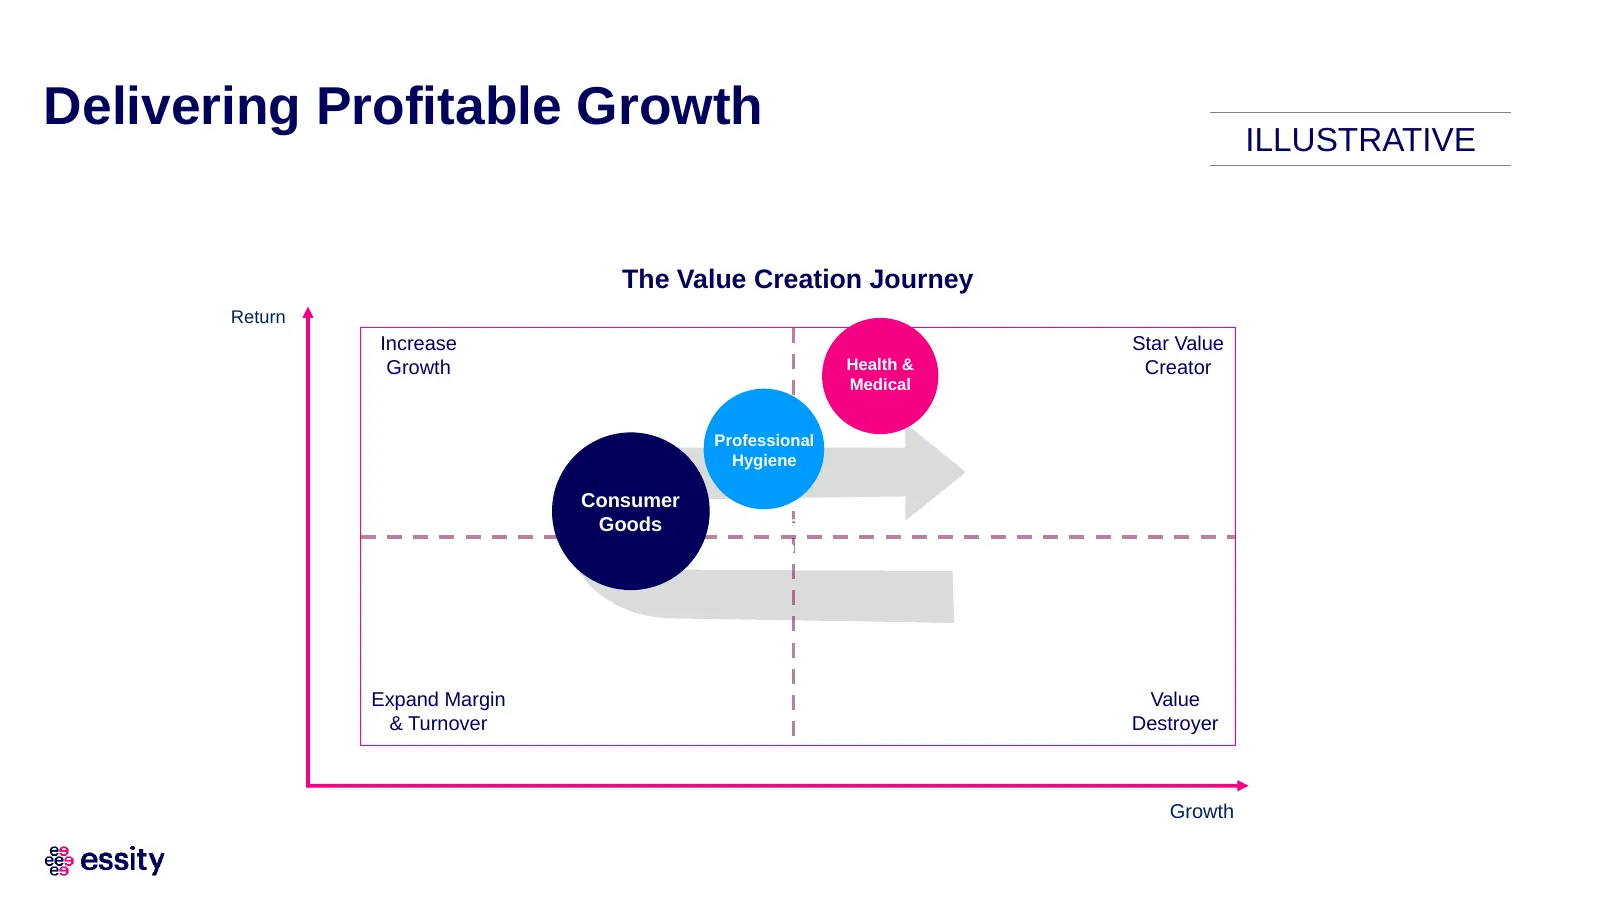
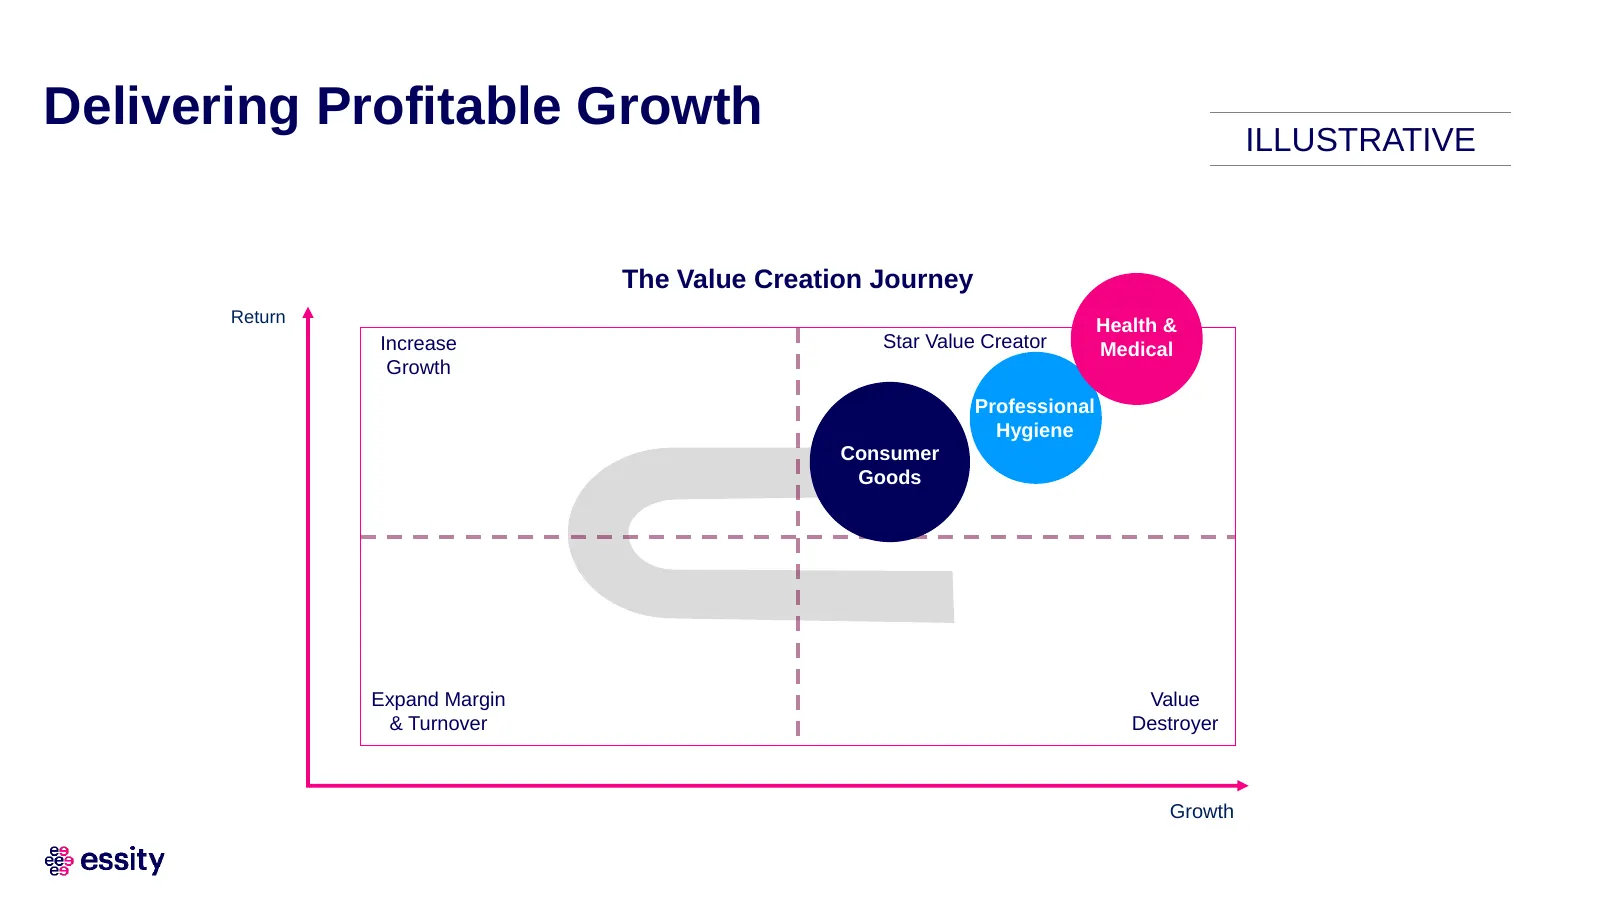
Delivering Profitable Growth ILLUSTRATIVE The Value Creation Journey Return Increase Star Value Growth Health & Creator Medical Professional Hygiene Consumer Goods Consumer Goods Expand Margin Value & Turnover Destroyer Growth
Slide 33: Delivering Profitable Growth
Delivering Profitable Growth ILLUSTRATIVE The Value Creation Journey Return Health & Increase Star Value Creator Medical Growth Professional Hygiene Consumer Goods Expand Margin Value & Turnover Destroyer Growth
Slide 34: Innovating Leading Brands
Innovating Leading Brands Text
Slide 35: Sustainable Innovations
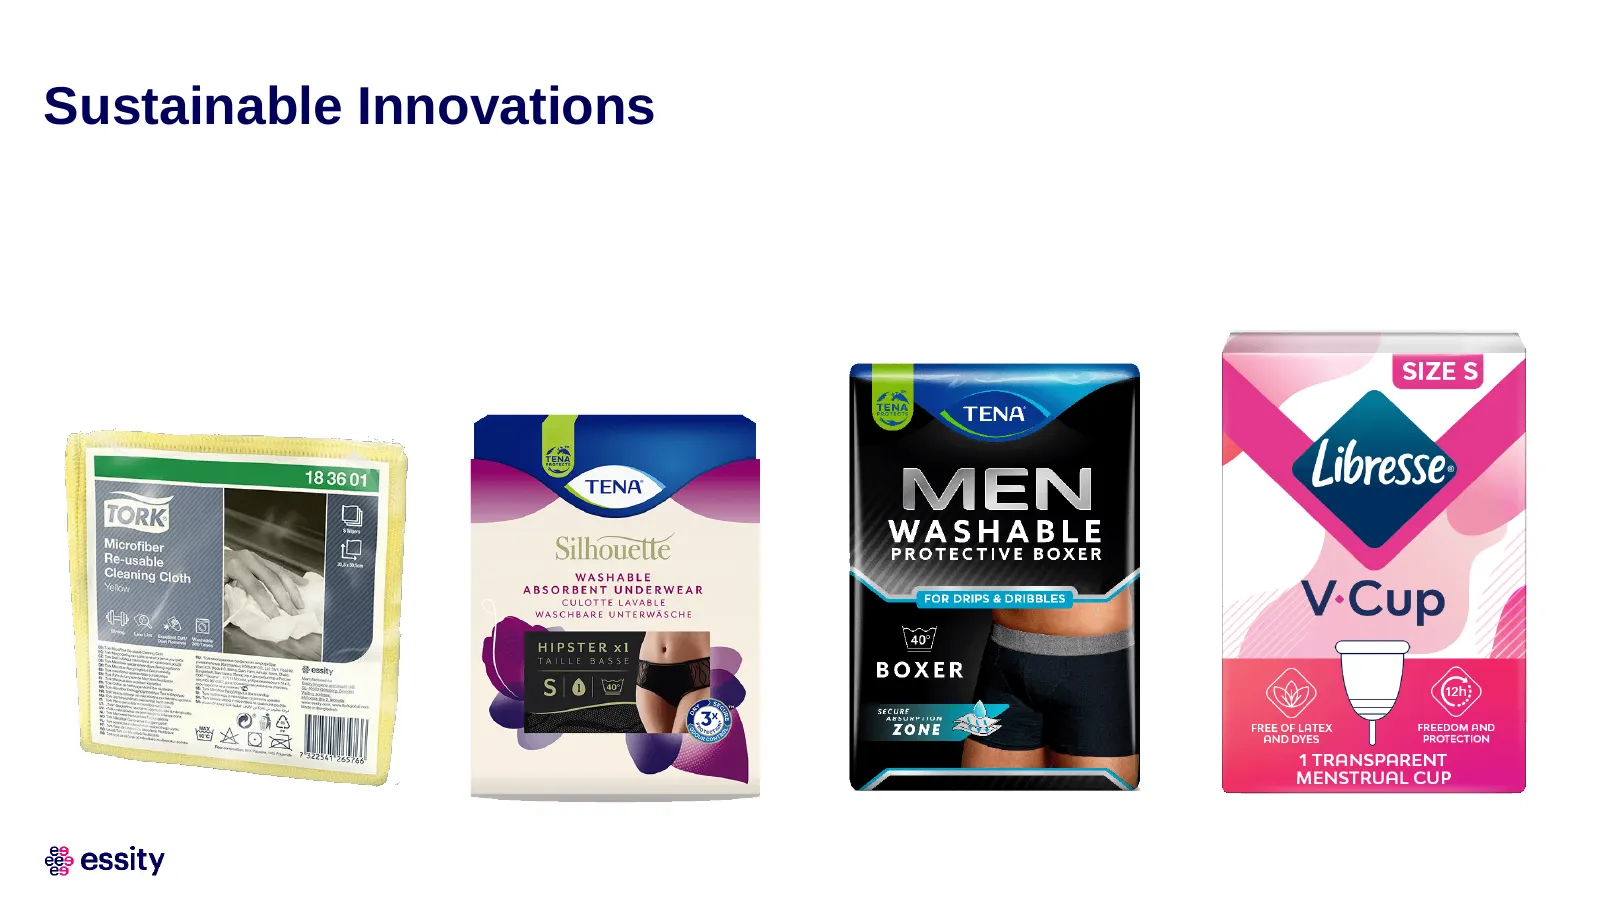
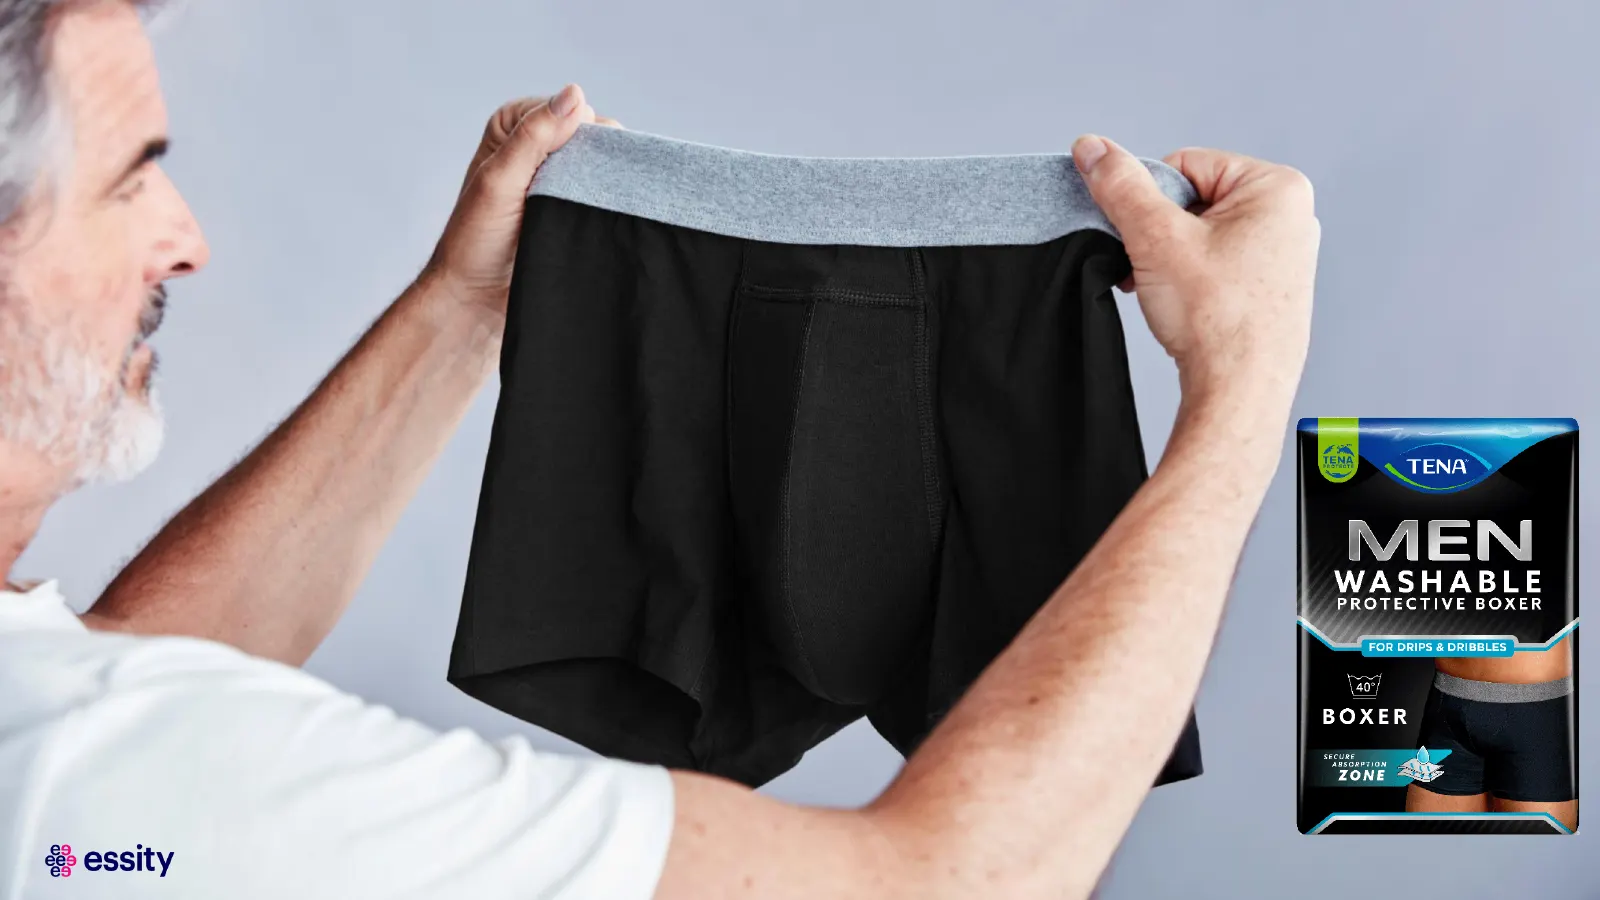
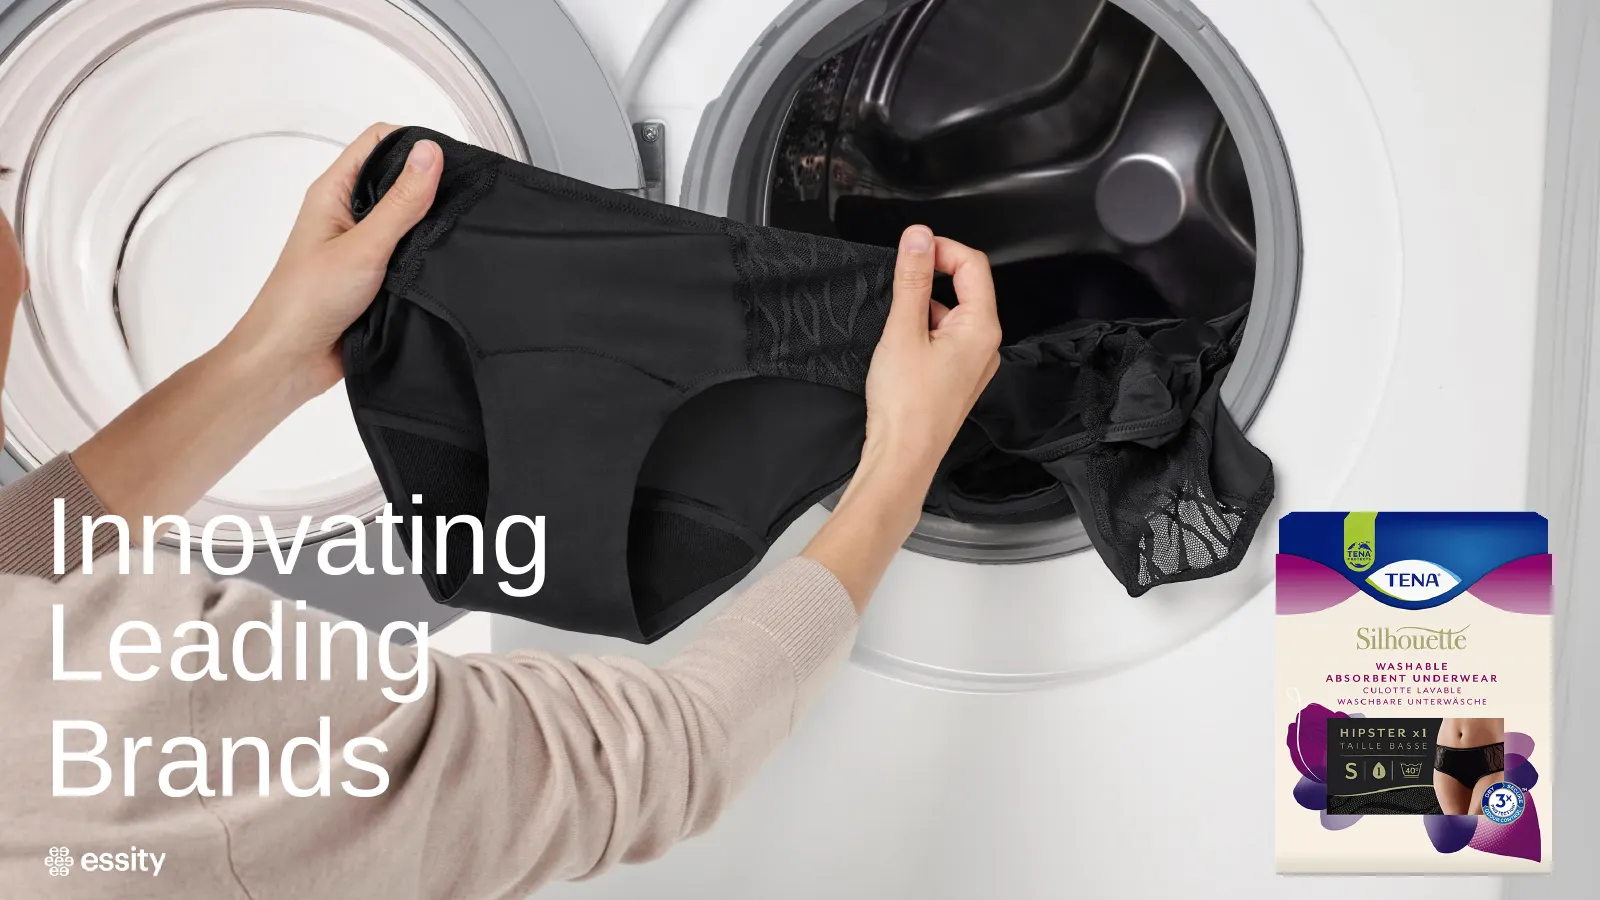
Sustainable Innovations TENA MEN | WASHABLE PROTECTIVE BOXER Silhouetté WASHABLE ©U FREE OF LATEX ‘AND DYES. 1 TRANSPARI MENSTRUAL CUP & essity
Slide 36: Branded Market Shares
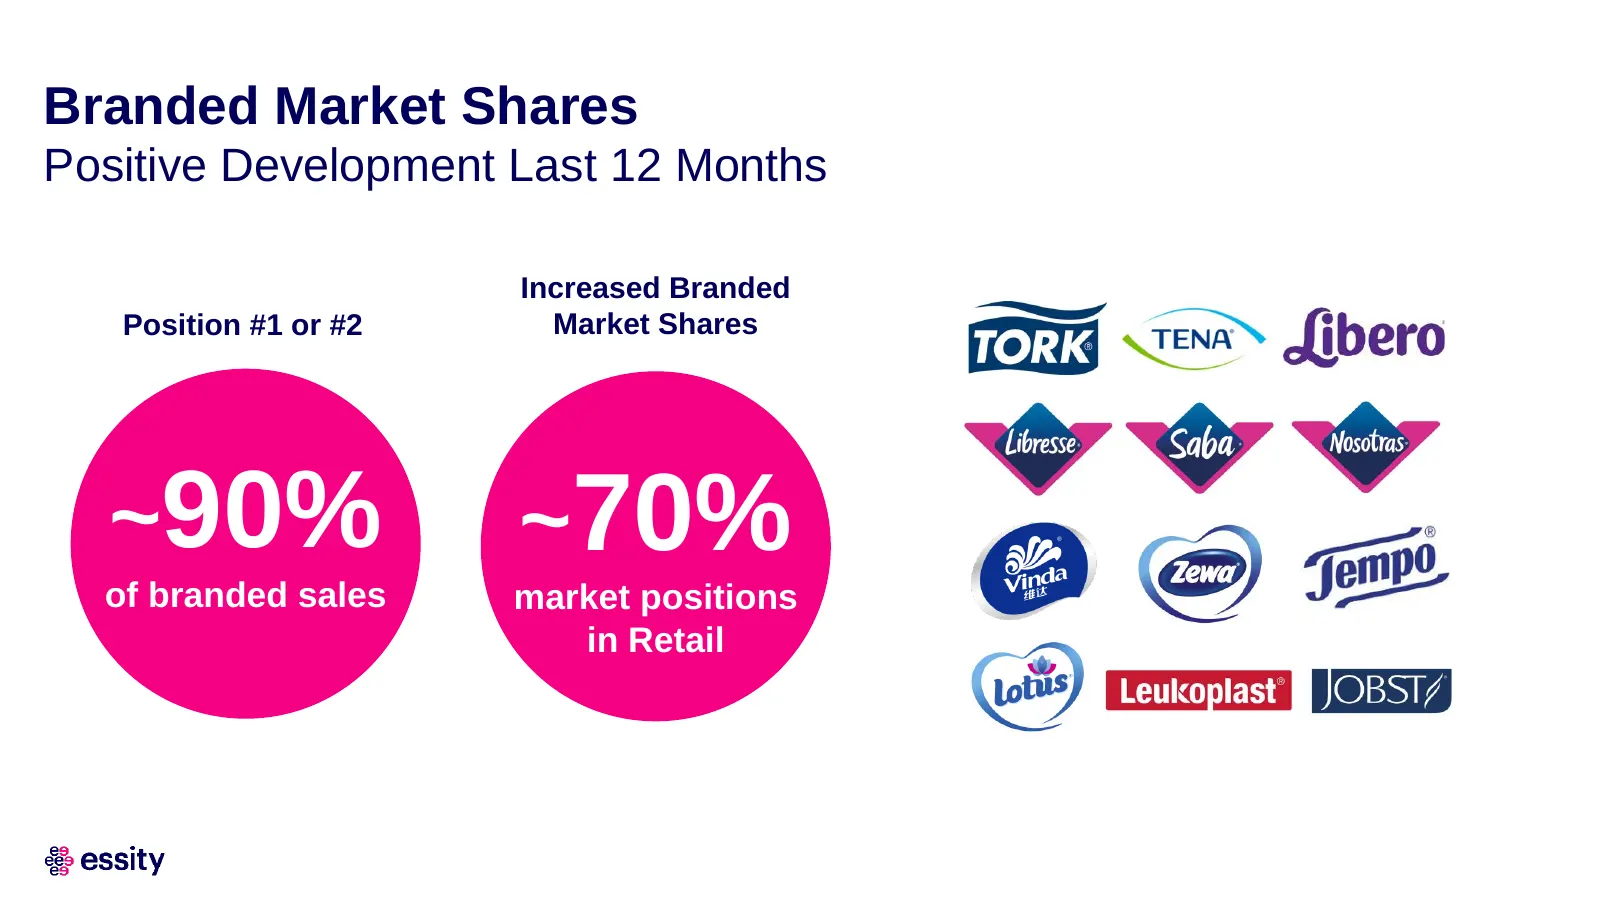
Branded Market Shares Positive Development Last 12 Months Increased Branded Position #1 or #2 Market Shares ~90% ~70% of branded sales market positions in Retail
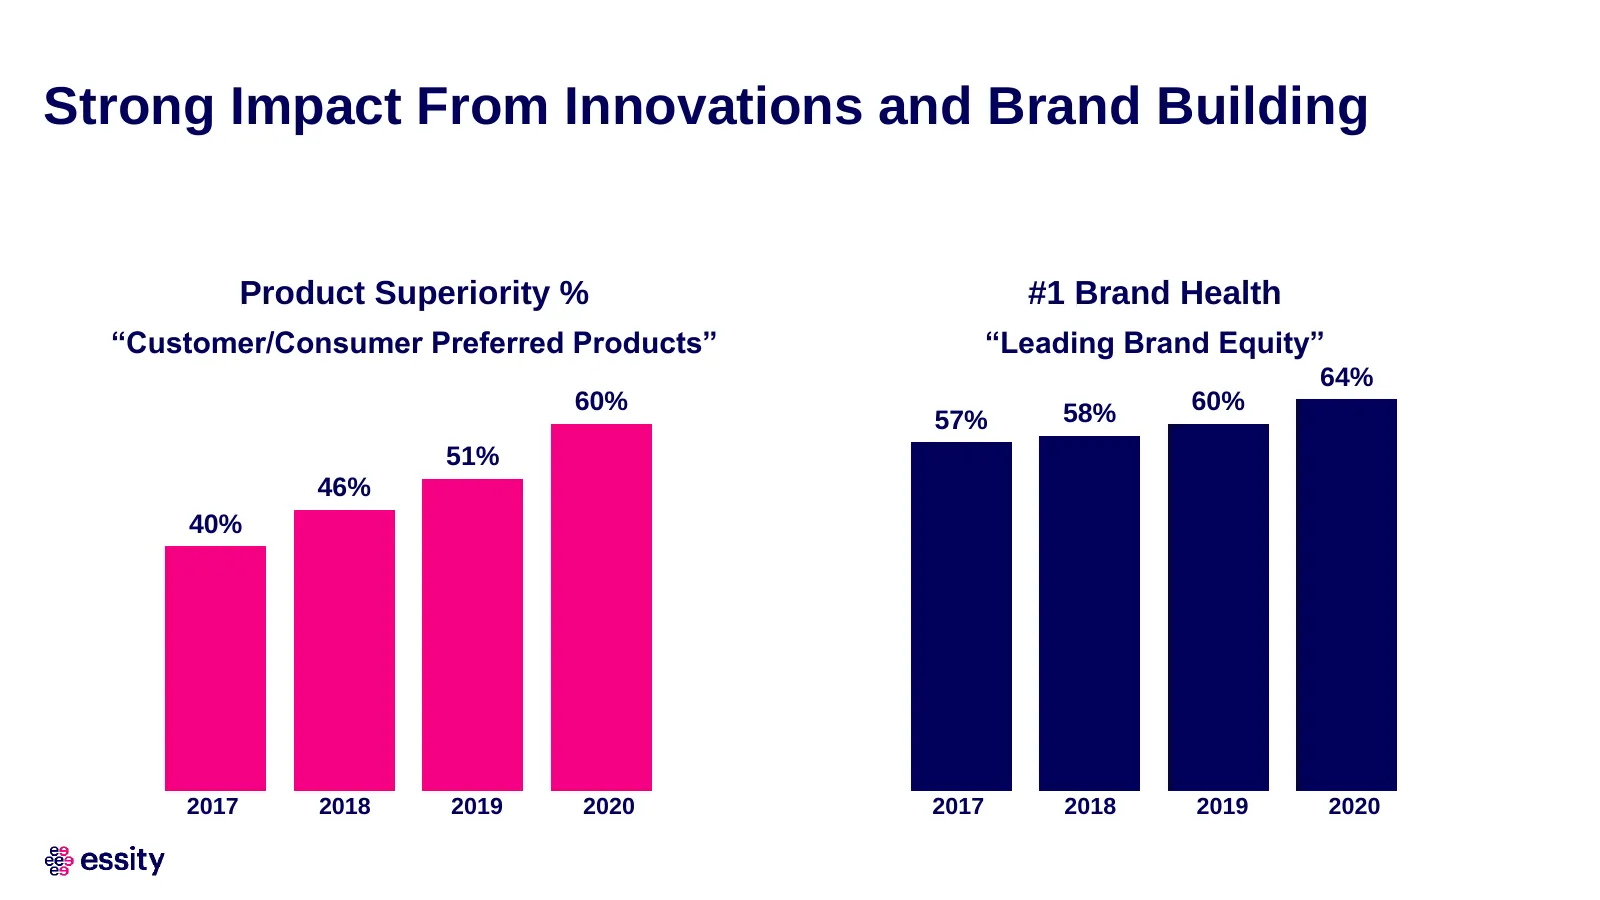
Slide 37: Strong Impact From Innovations and Brand Building
Strong Impact From Innovations and Brand Building Product Superiority % #1 Brand Health “Customer/Consumer Preferred Products” “Leading Brand Equity” 64% 60% 58% 60% 57% 51% 46% 40% 2017 2018 2019 2020 2017 2018 2019 2020
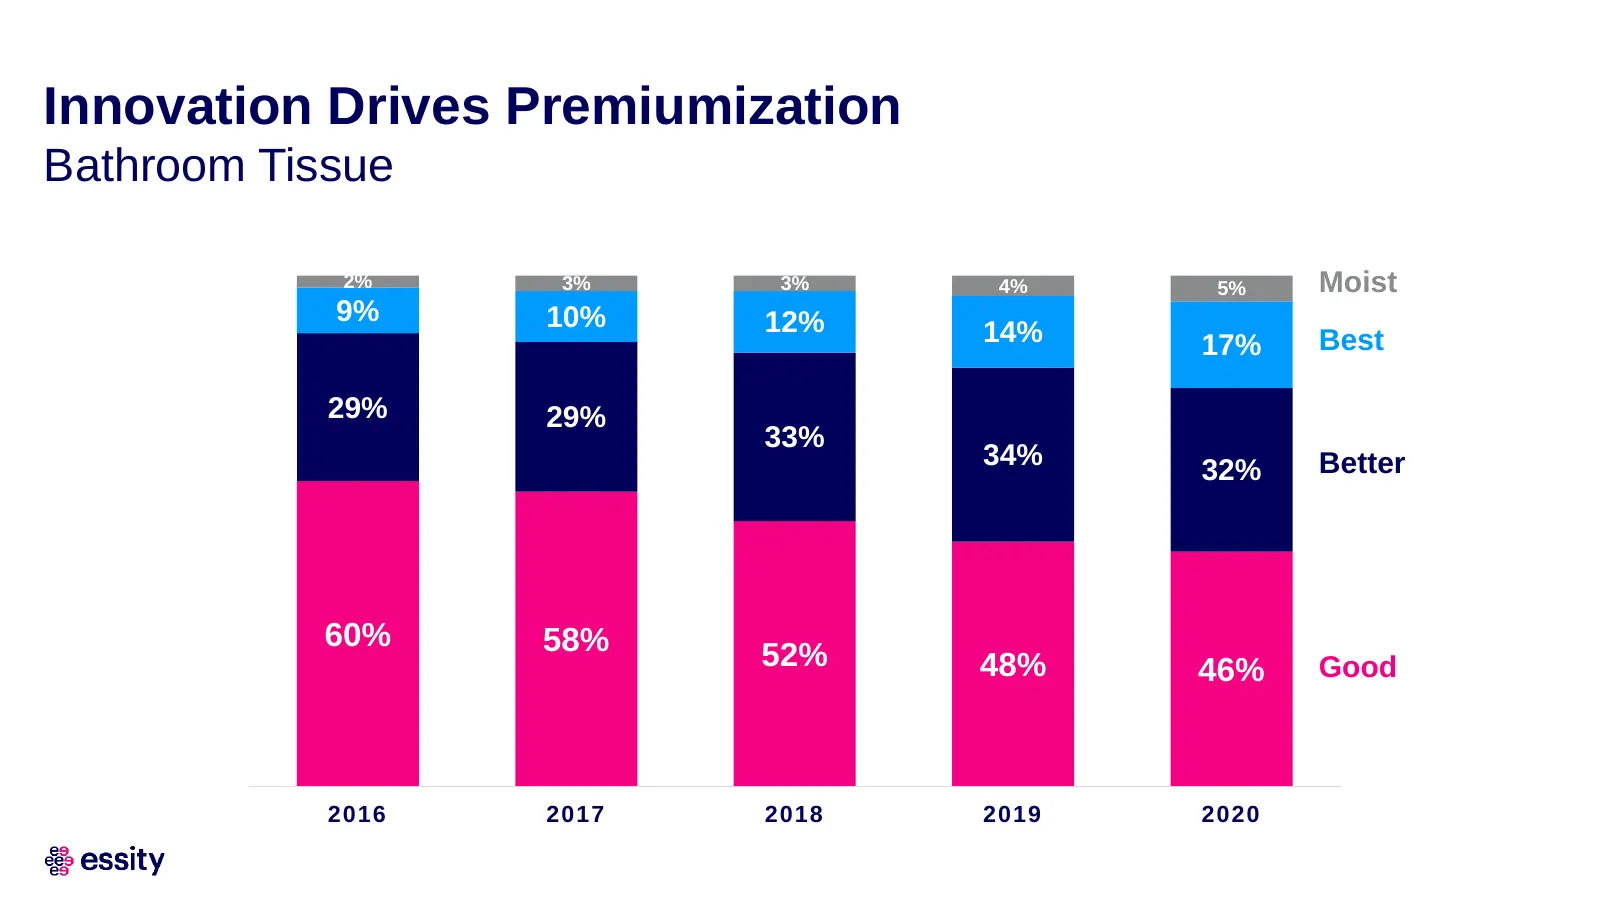
Slide 38: Innovation Drives Premiumization
Innovation Drives Premiumization Bathroom Tissue 2% 3% 3% 4% 5% Moist 9% 10% 12% 14% 17% Best 29% 29% 33% 34% Better 32% 60% 58% 52% 48% 46% Good 2016 2017 2018 2019 2020
Slide 39
Slide 40
Slide 41: Innovation Drives Premiumization
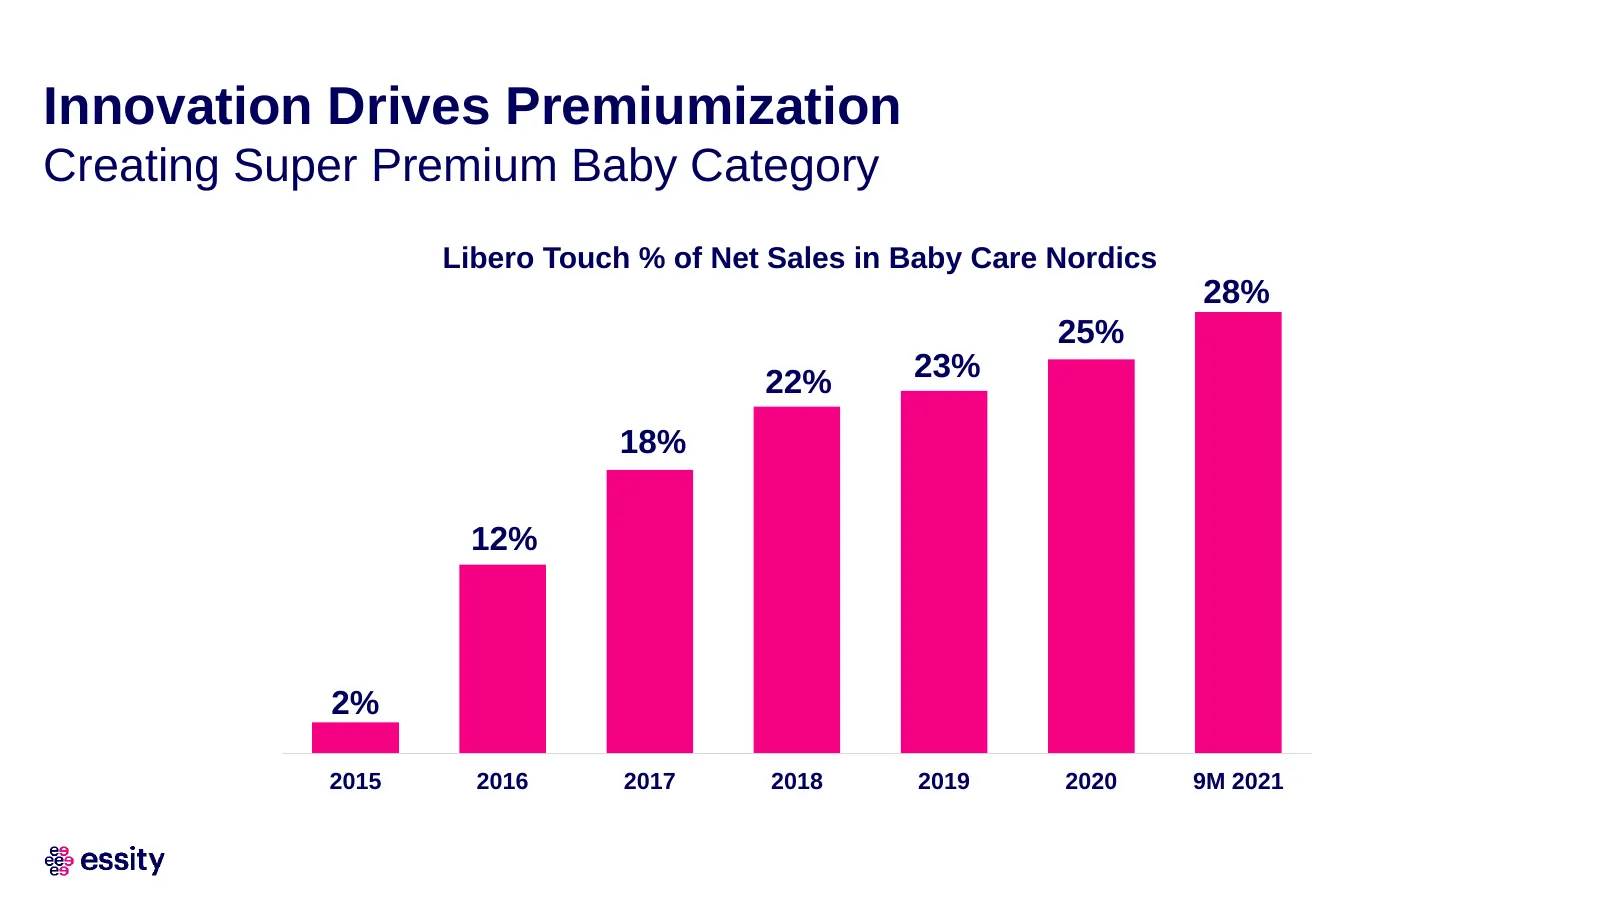
Innovation Drives Premiumization Creating Super Premium Baby Category Libero Touch % of Net Sales in Baby Care Nordics 28% 25% 22% 23% 18% 12% 2% 2015 2016 2017 2018 2019 2020 9M 2021
Slide 42: Driving Profitable Share Growth
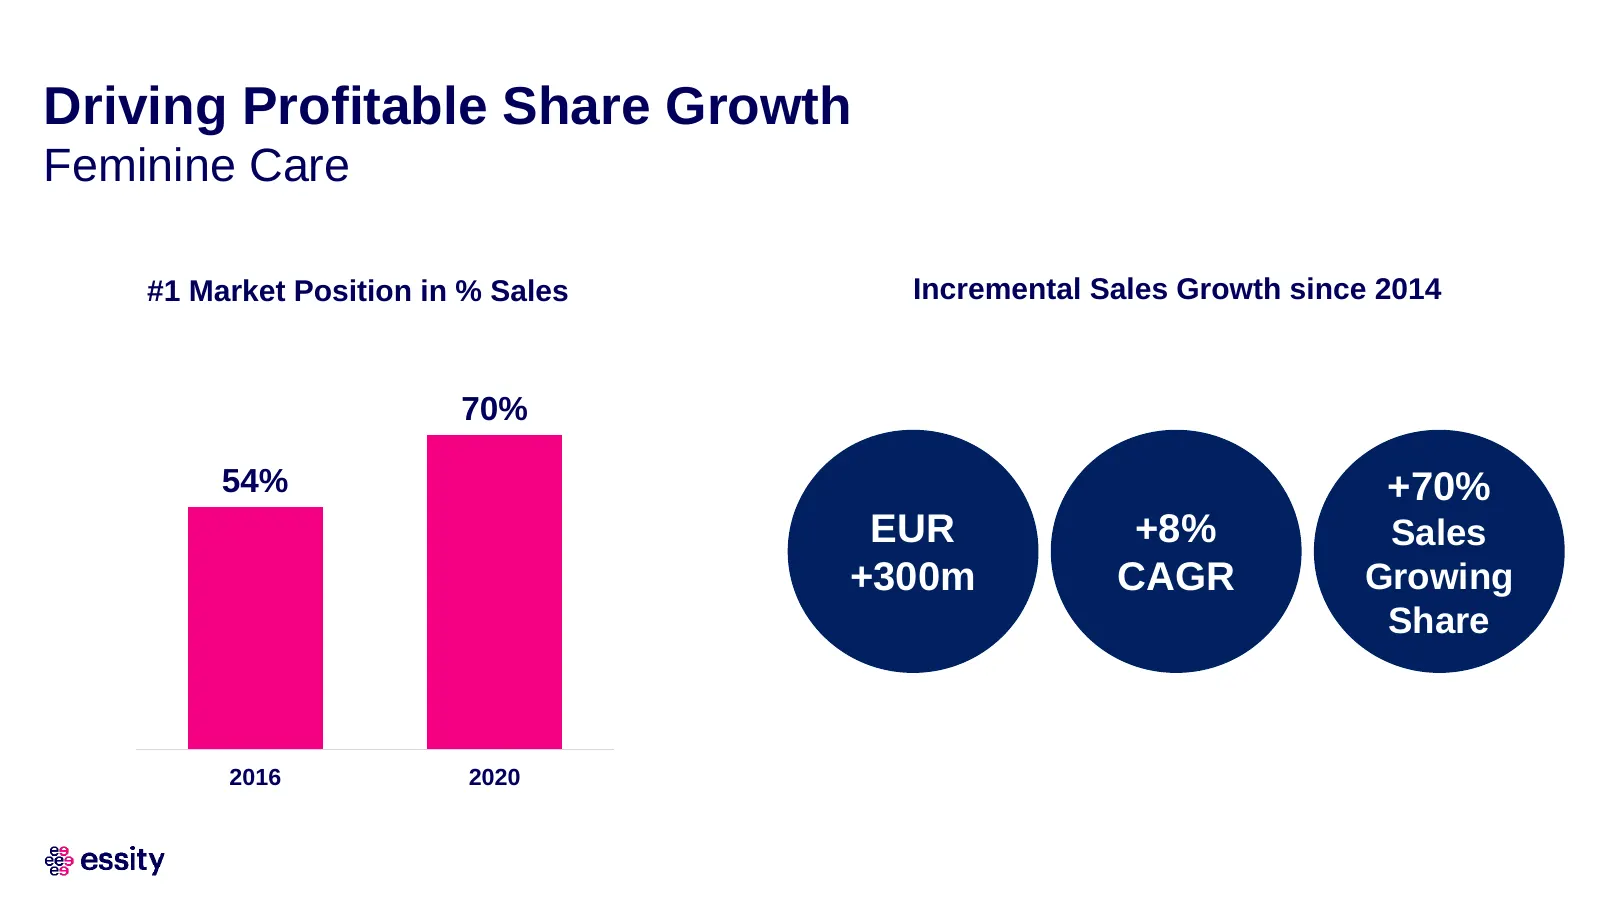
Driving Profitable Share Growth Feminine Care #1 Market Position in % Sales Incremental Sales Growth since 2014 70% 54% +70% EUR +8% Sales +300m CAGR Growing Share 2016 2020
Slide 43: Text
Text
Slide 44: Text
Text
Slide 45: MEN
MEN WASHABLE PROTECTIVE BOXER & essity
Slide 46: Innovating Leading Brands
Innovating Leading Text Brands
Slide 47: Text
& essity

Slide 48: #HealingMeSoftly
& essity #HealingMeSoftly The Leukoplast skin sensitive family - Reliable, loving grip yet gentle removal. DESIGNED FOR FRAGILE SKIN Leukomed ZN skin sensitive

Slide 49

Slide 50

Slide 51: Text
Text

Slide 52: Accelerating Digitalization
Text Accelerating Digitalization
Slide 53: Accelerating Digitalization
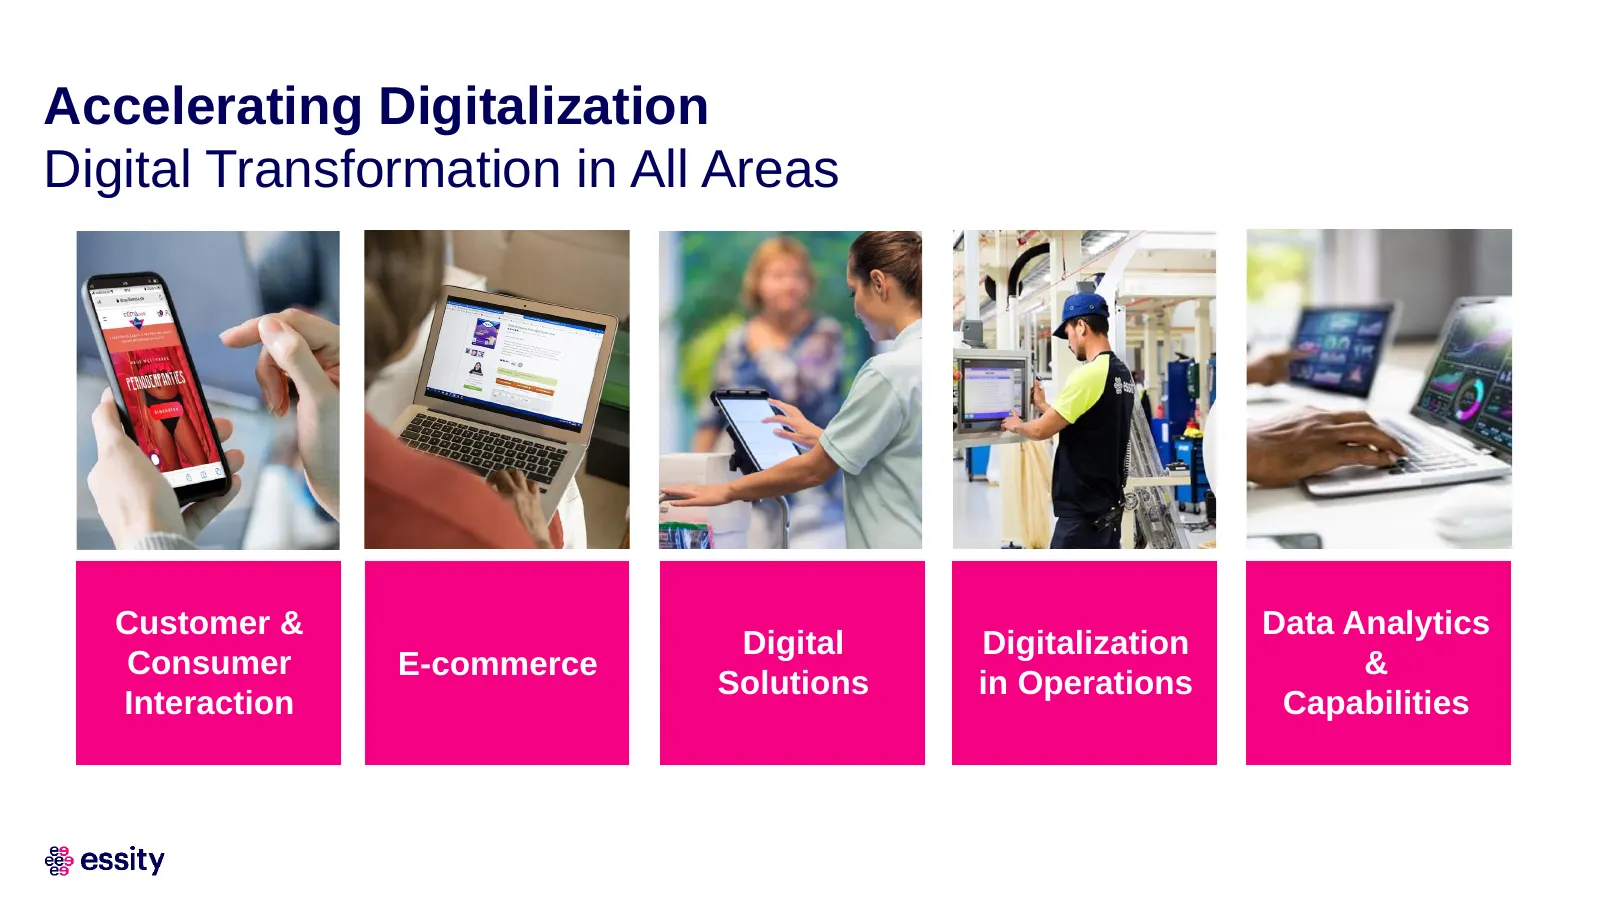
Accelerating Digitalization Digital Transformation in All Areas Customer & Data Analytics Digital Digitalization Consumer E-commerce & Solutions in Operations Interaction Capabilities
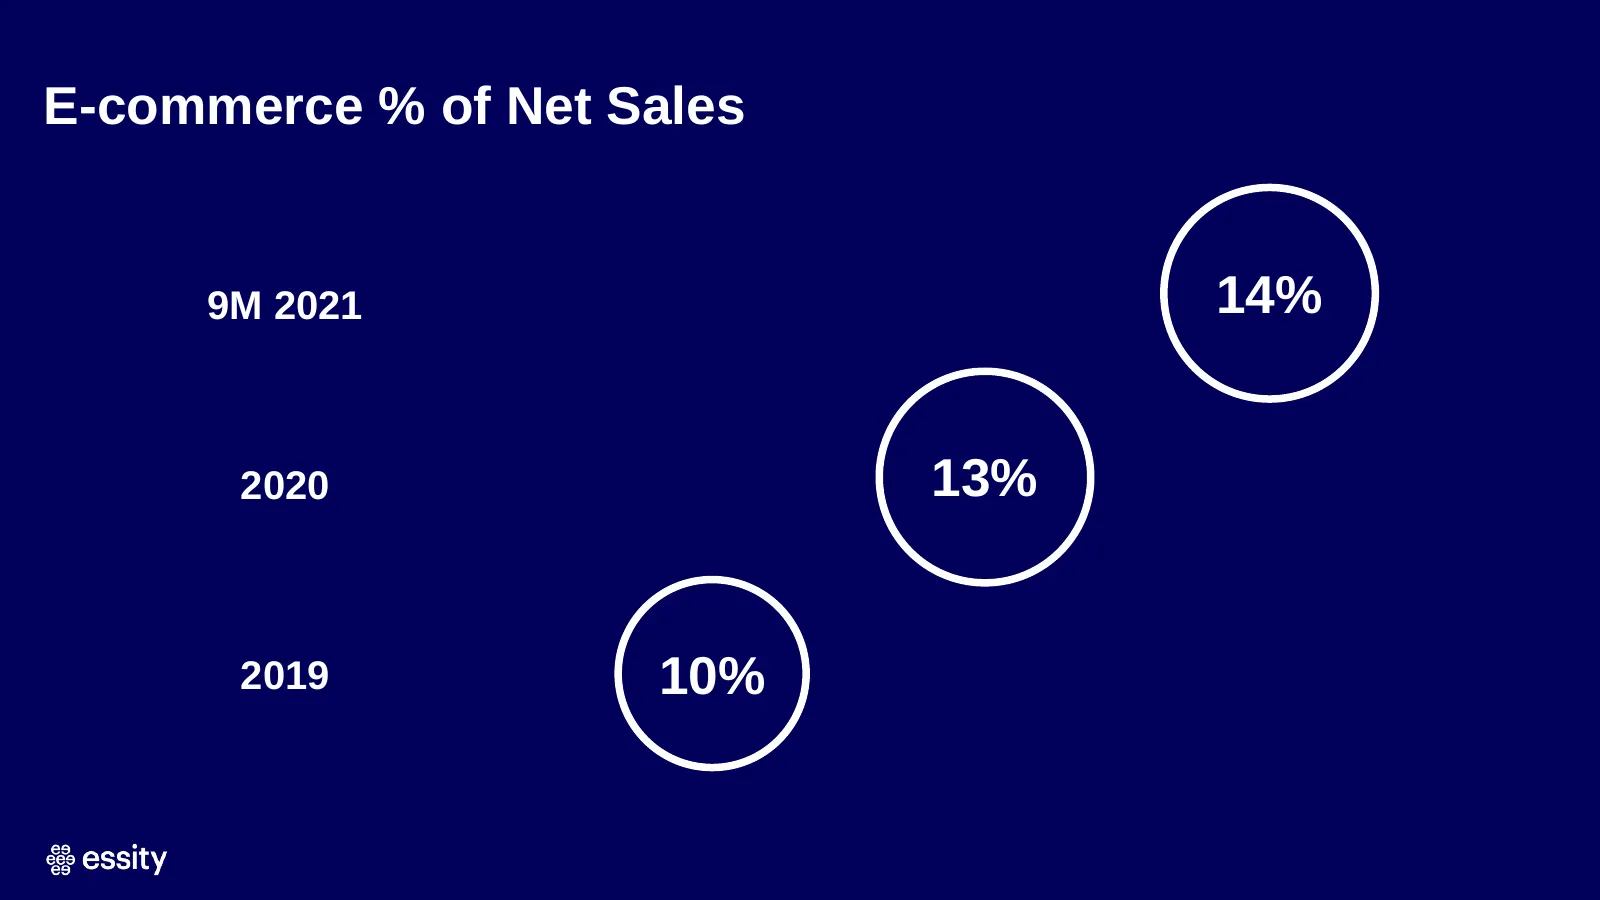
Slide 54: E-commerce % of Net Sales
E-commerce % of Net Sales 9M 2021 14% 2020 13% 2019 10%

Slide 55: Text
Text

Slide 56: Text
Text
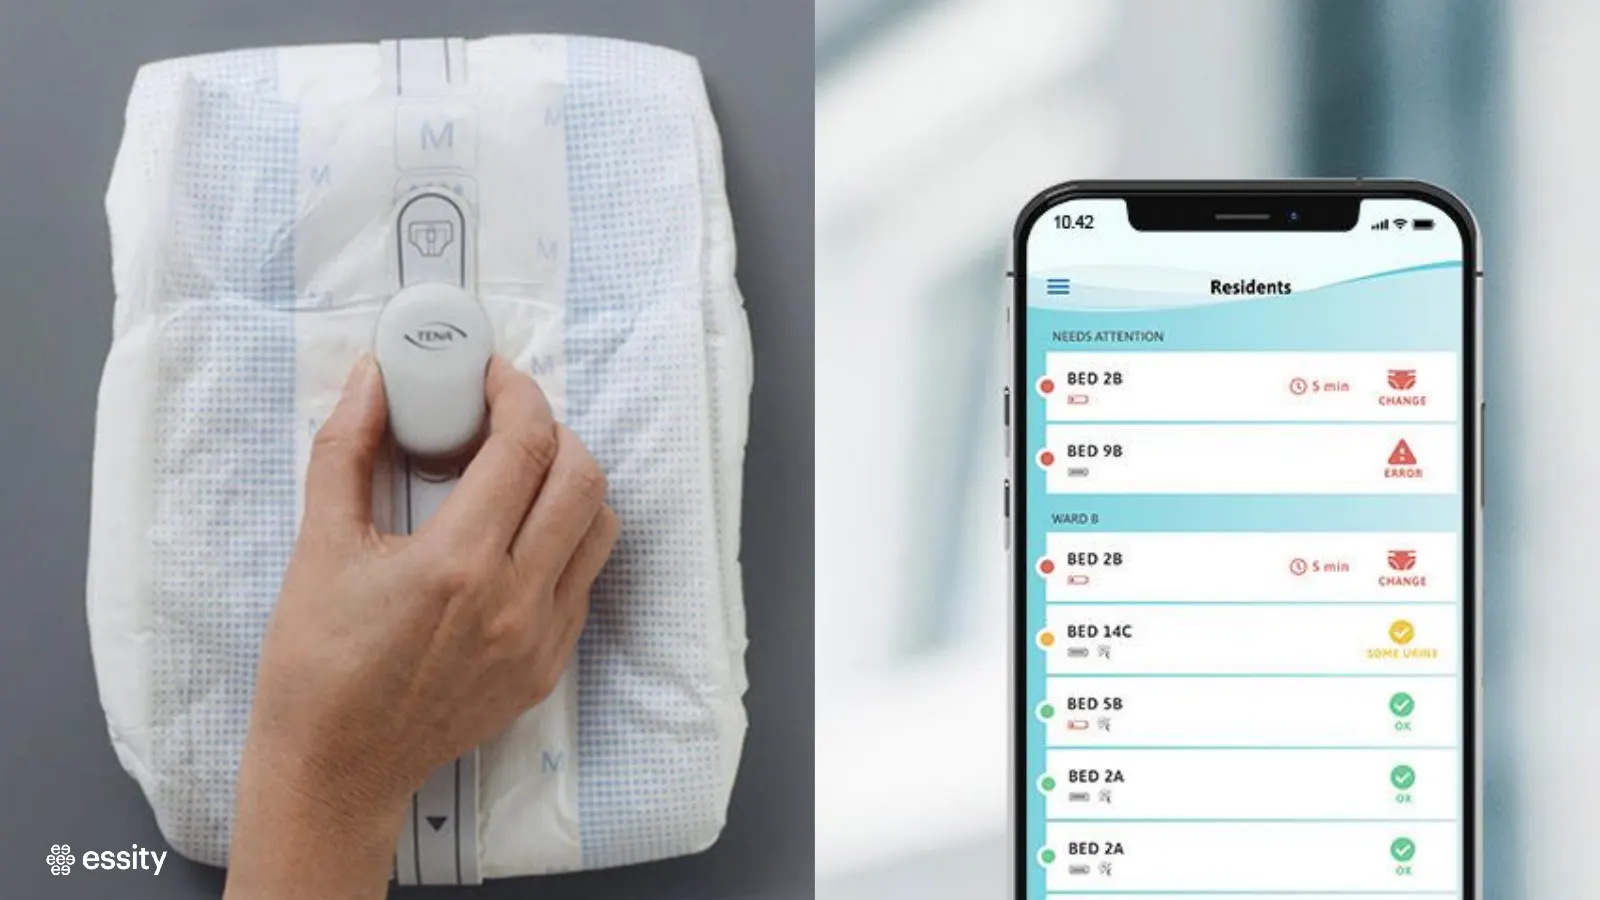
Slide 57: Residents
Residents BEO 14C

Slide 58: Cutimed Wound Navigator
Cutimed’ Wound Navigator Solutions & essity

Slide 59: Text
Text

Slide 60: Tork Vision Cleaning
Tork Vision Cleaning Text
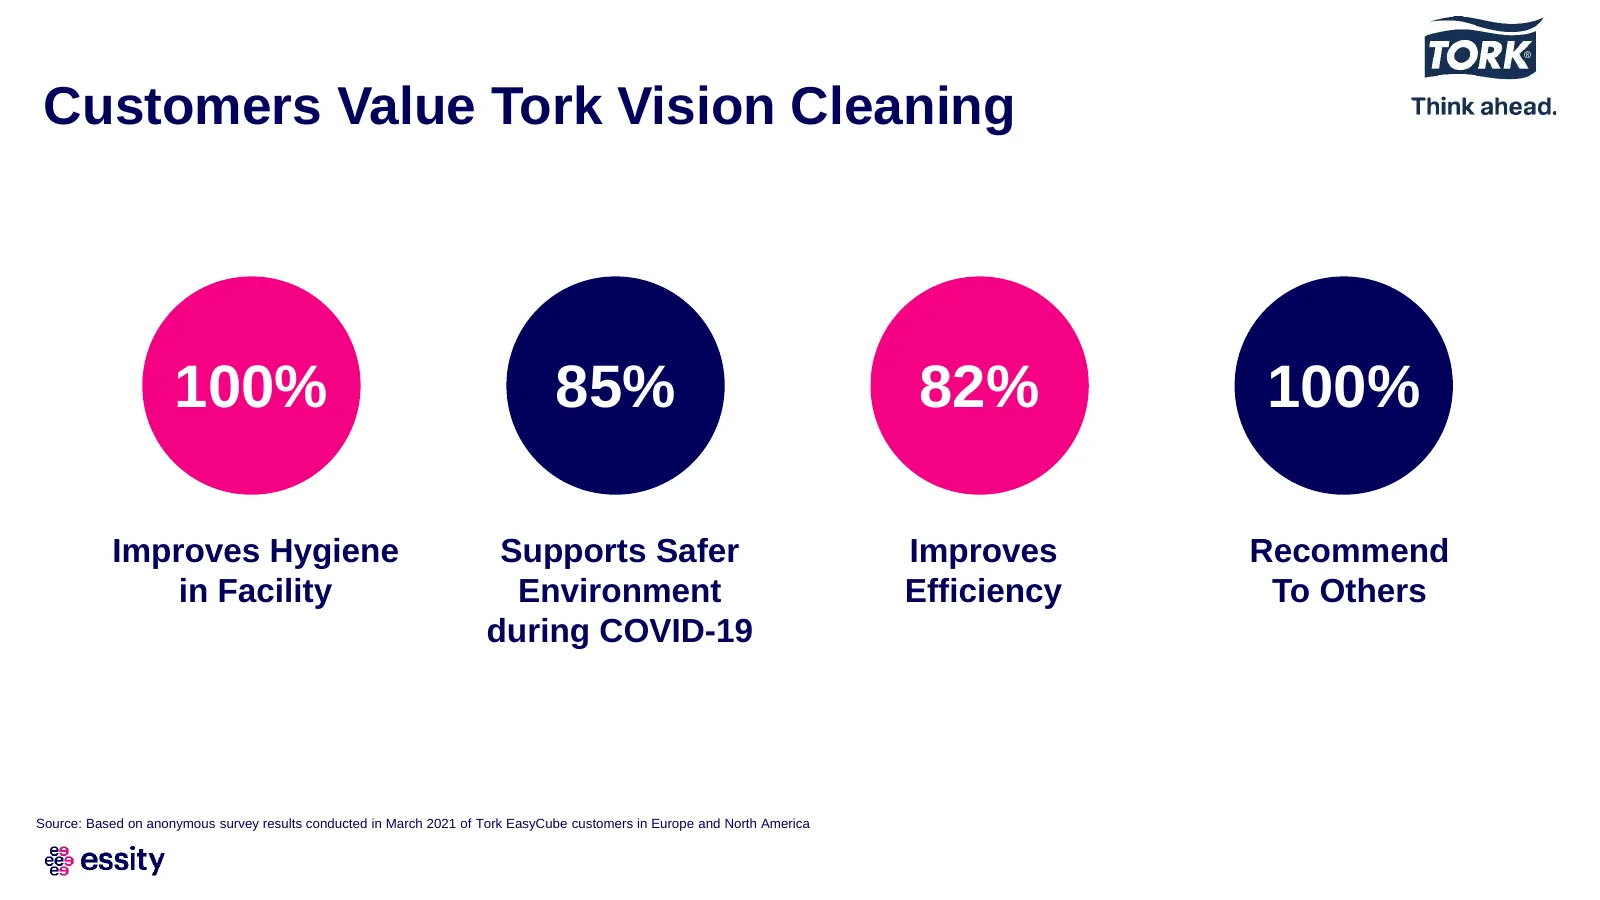
Slide 61: Customers Value Tork Vision Cleaning
Customers Value Tork Vision Cleaning 100% 85% 82% 100% Improves Hygiene Supports Safer Improves Recommend in Facility Environment Efficiency To Others during COVID-19 Source: Based on anonymous survey results conducted in March 2021 of Tork EasyCube customers in Europe and North America

Slide 62
Slide 63: Text
Text

Slide 64: Text
Text

Slide 65: Leading in Sustainability
Leading in Text Sustainability
Slide 66: Sustainability Targets
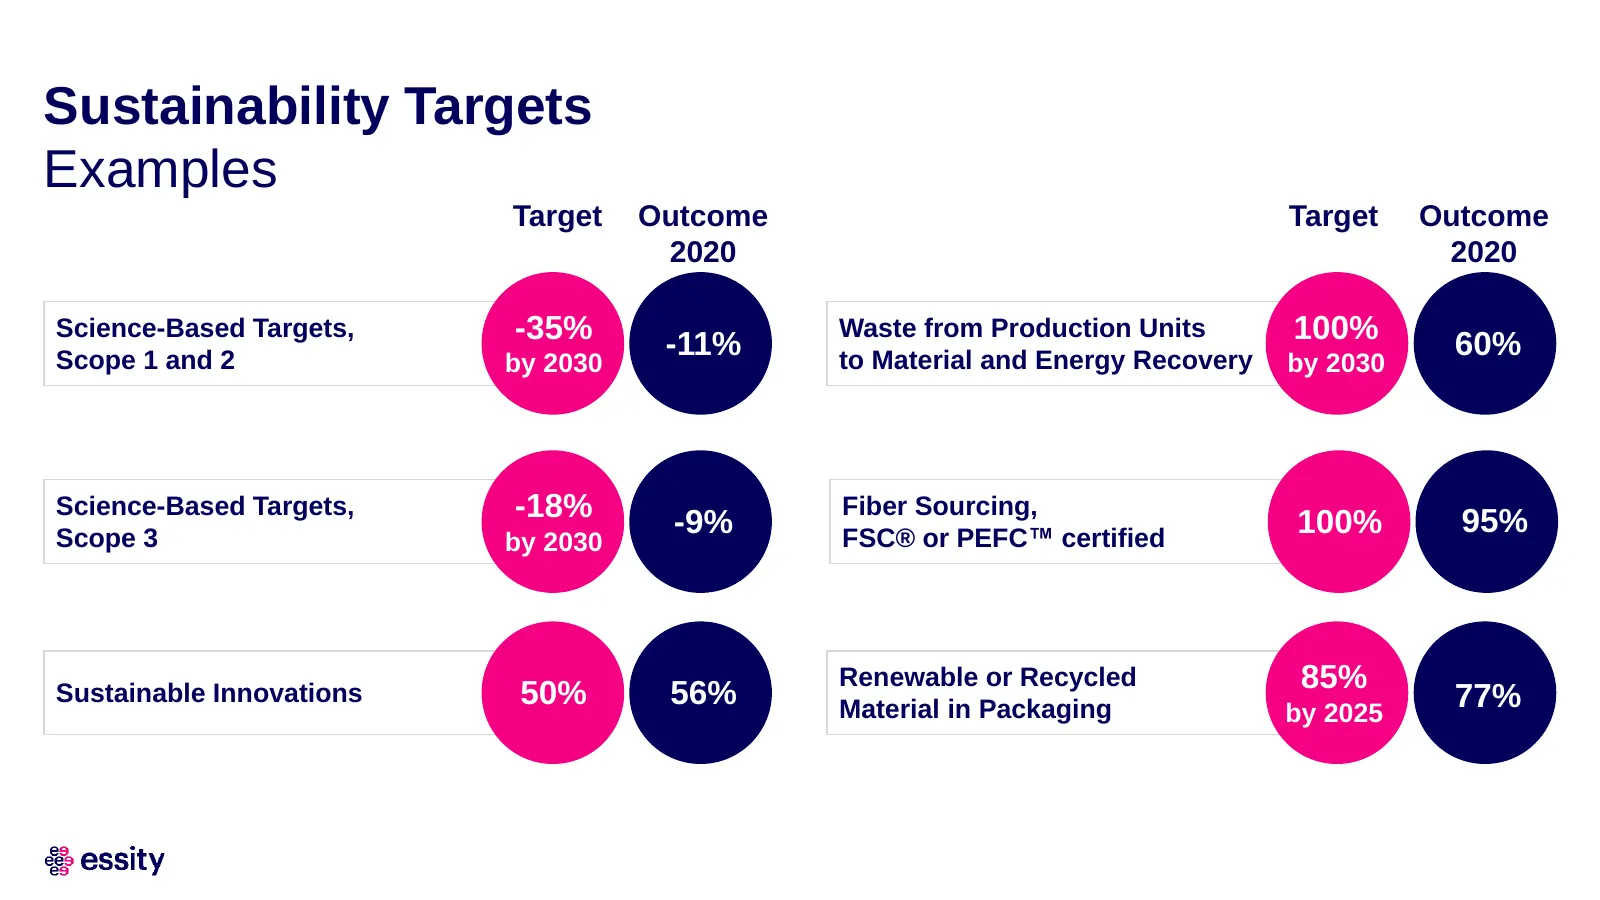
Sustainability Targets Examples Target Outcome Target Outcome 2020 2020 Science-Based Targets, -35% -11% Waste from Production Units 100% 60% Scope 1 and 2 by 2030 to Material and Energy Recovery by 2030 Science-Based Targets, -18% -9% Fiber Sourcing, 100% 95% Scope 3 by 2030 FSC® or PEFC™ certified
Slide 67: Recognitions and Memberships in Sustainability
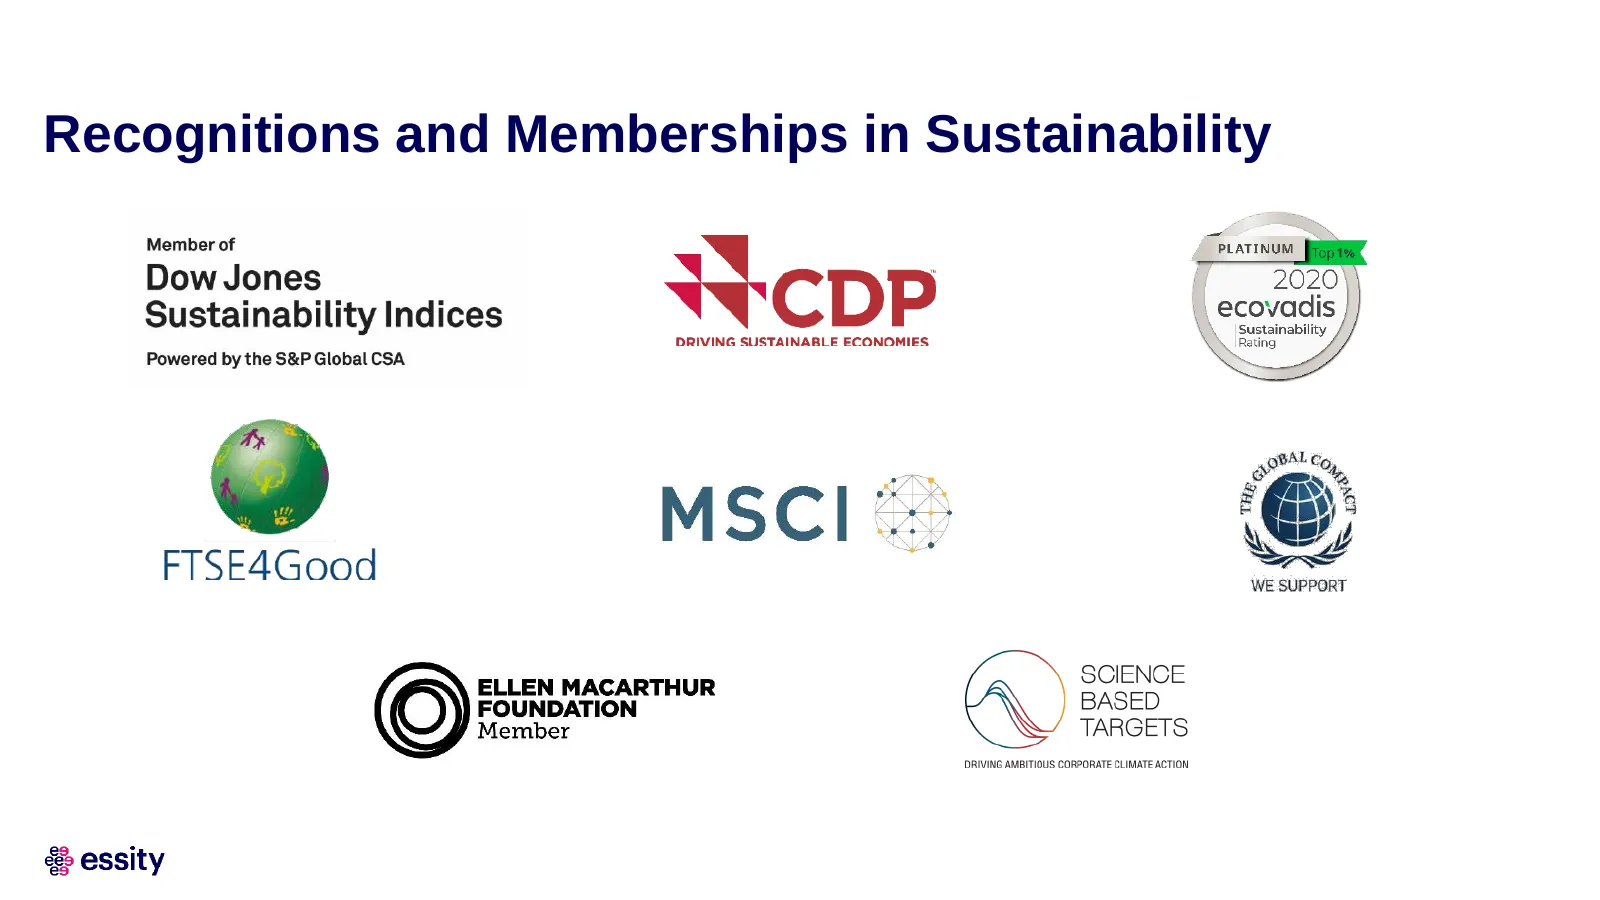
Recognitions and Memberships in Sustainability
Slide 68: Essity commits to net-zero greenhouse gas emissions by 2050
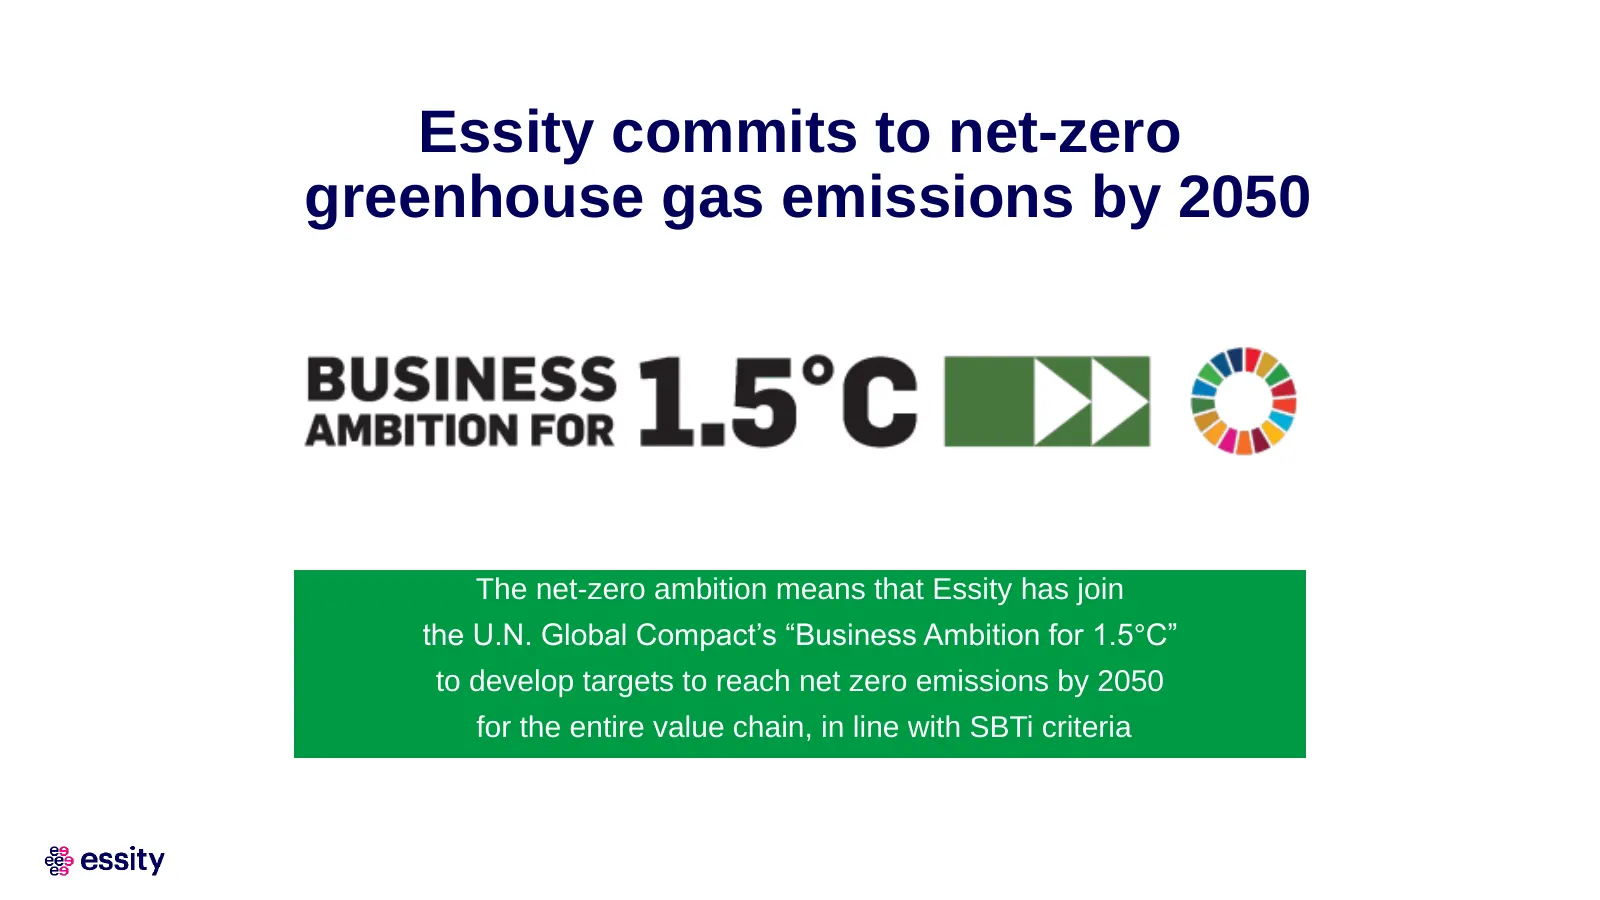
Essity commits to net-zero greenhouse gas emissions by 2050 The net-zero ambition means that Essity has join the U.N. Global Compact’s “Business Ambition for 1.5°C” to develop targets to reach net zero emissions by 2050 for the entire value chain, in line with SBTi criteria
Slide 69: Net Zero 2050 – Key Action Areas
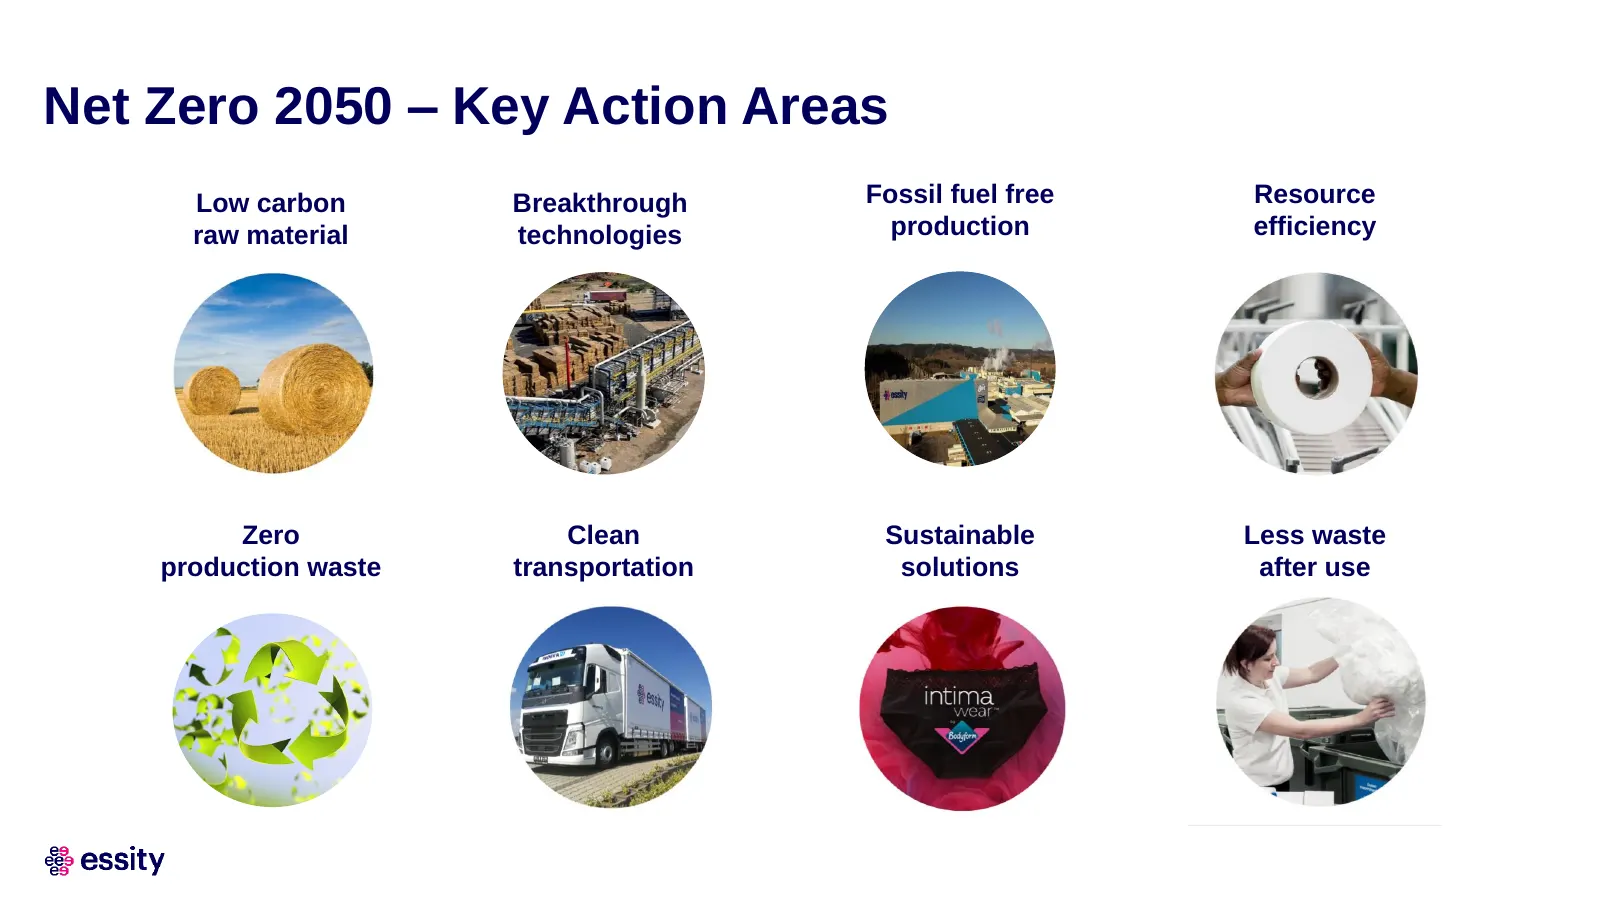
Net Zero 2050 – Key Action Areas Low carbon Breakthrough Fossil fuel free Resource raw material technologies production efficiency Zero Clean Sustainable Less waste production waste transportation solutions after use
Slide 70: Text
Text

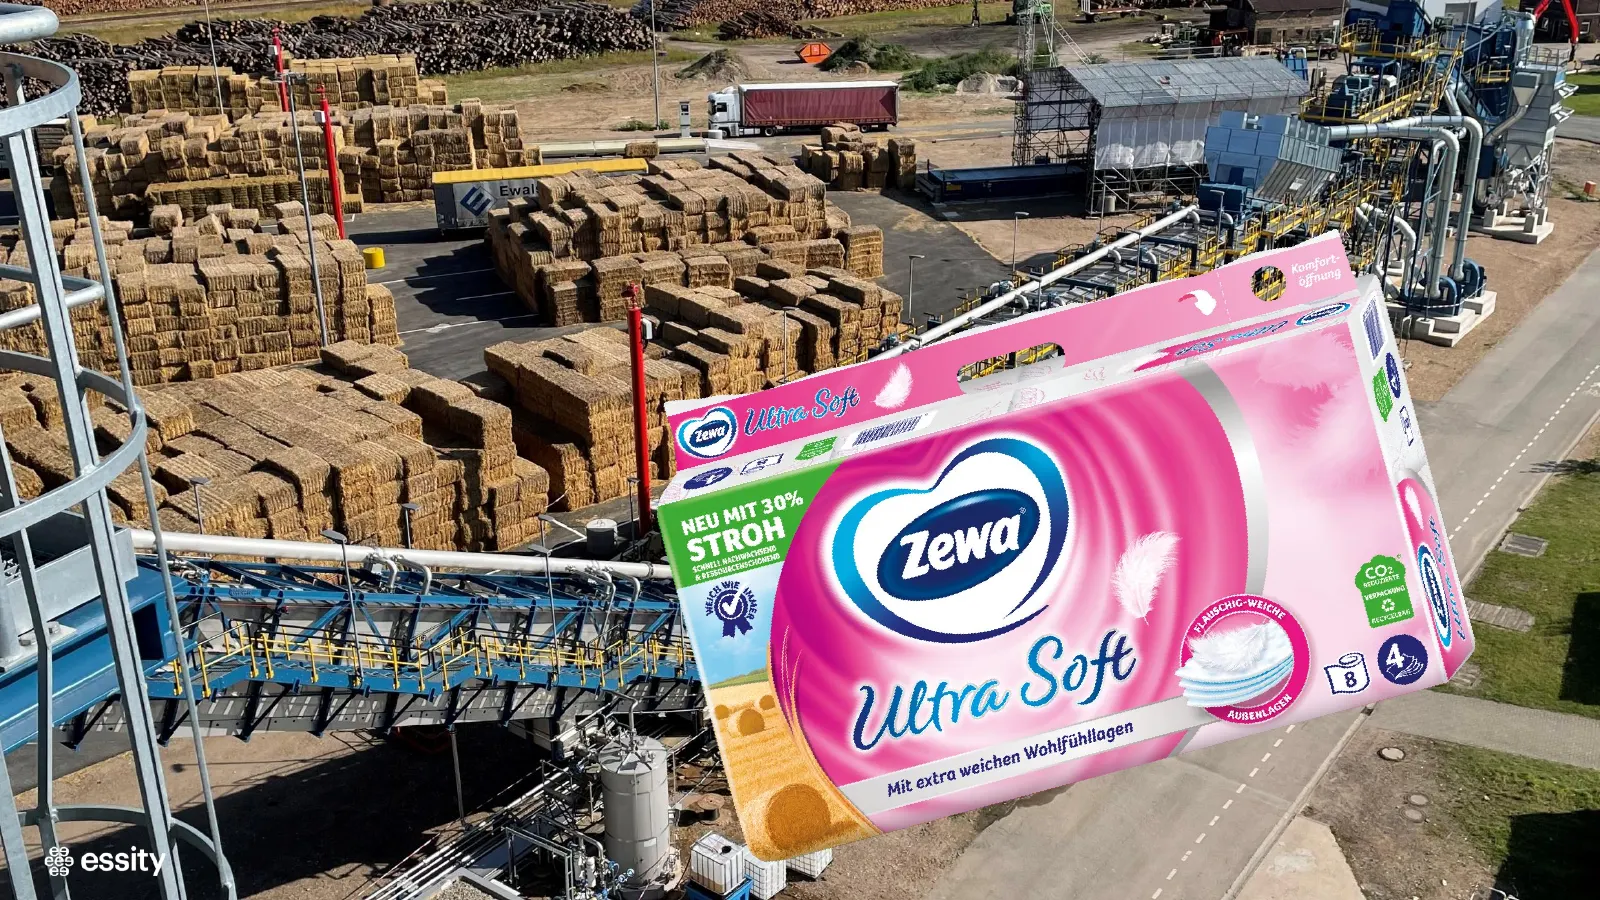
Slide 71: Fossil fuel free production
Fossil fuel Text free production

Slide 72: Made with Renewable Energy
Made with Renewable Text Energy
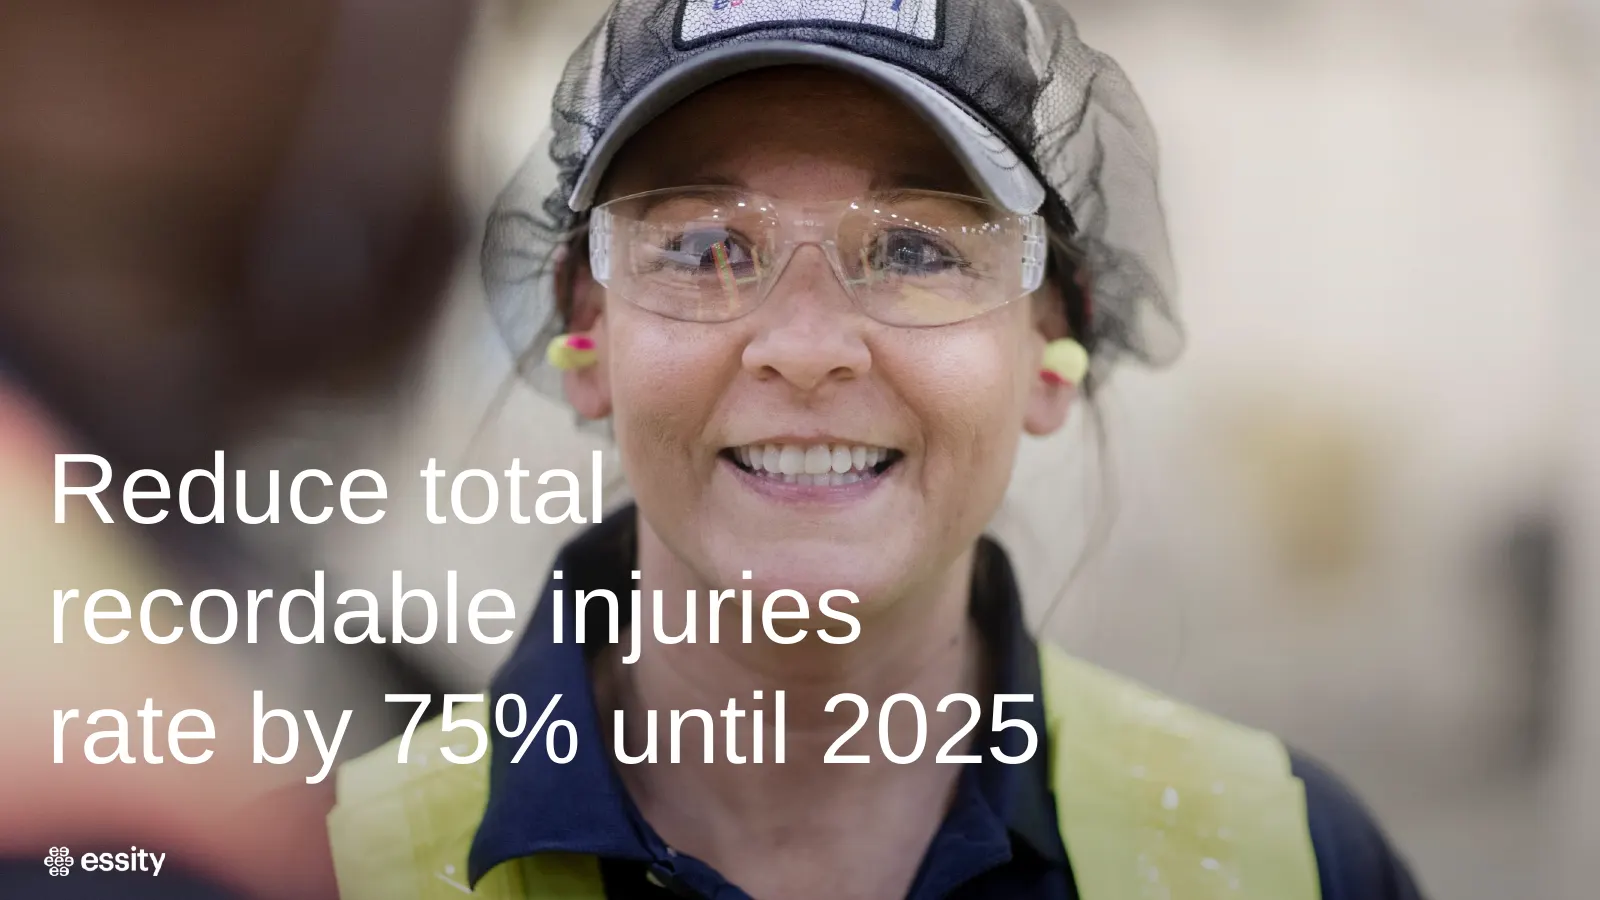
Slide 73: Reduce total recordable injuries rate by 75% until 2025
Reduce total Text recordable injuries rate by 75% until 2025
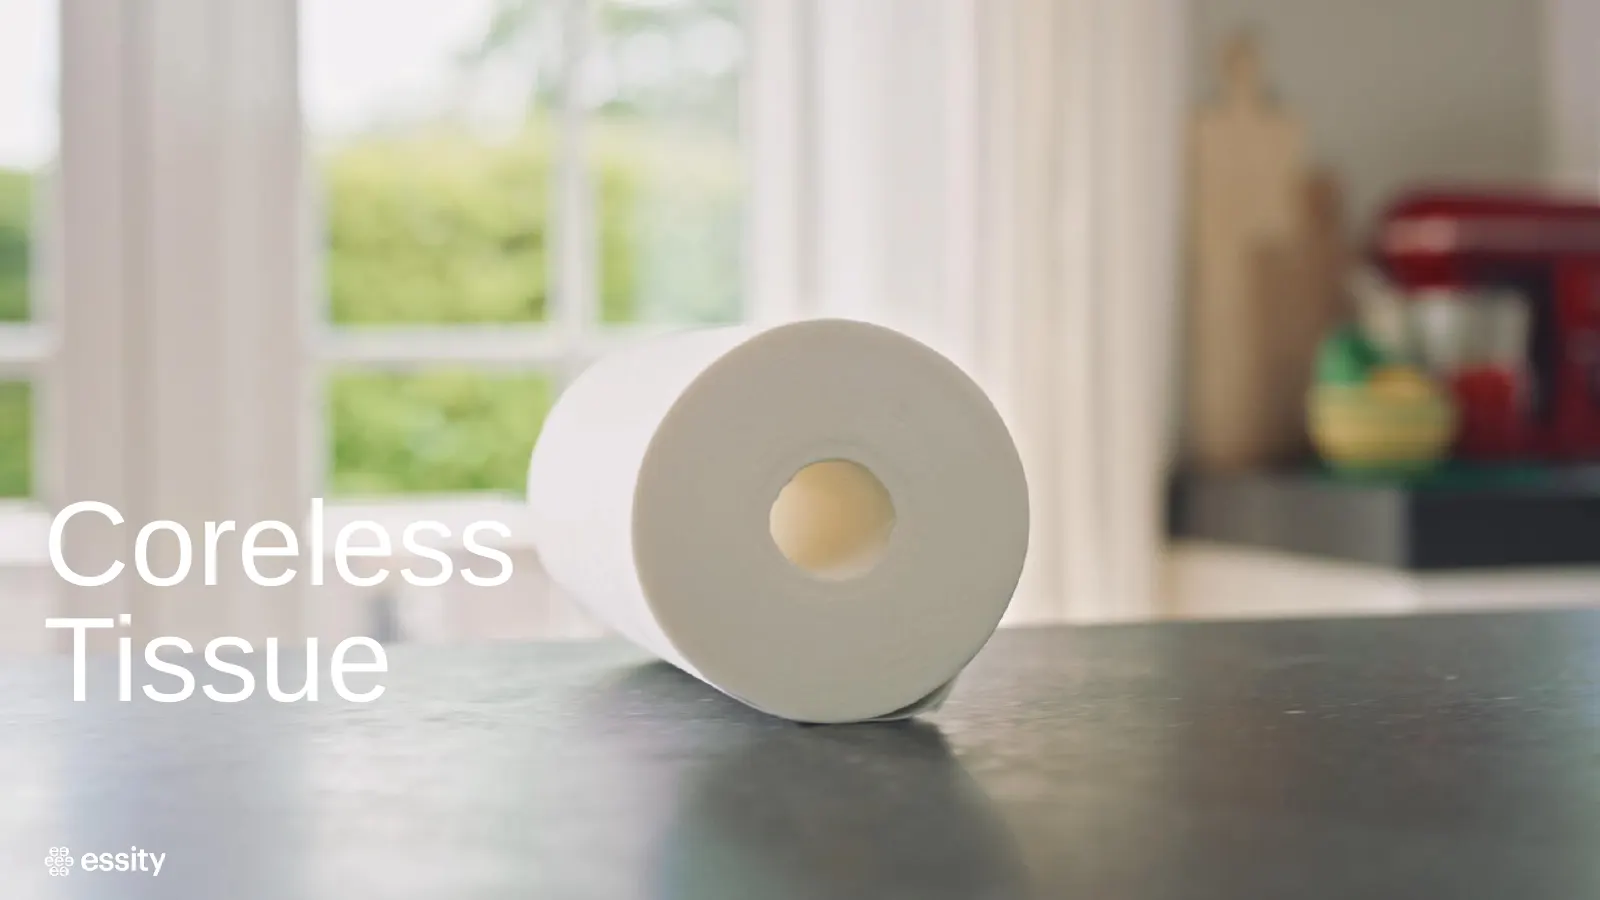
Slide 74: Coreless Tissue
Coreless Tissue Text
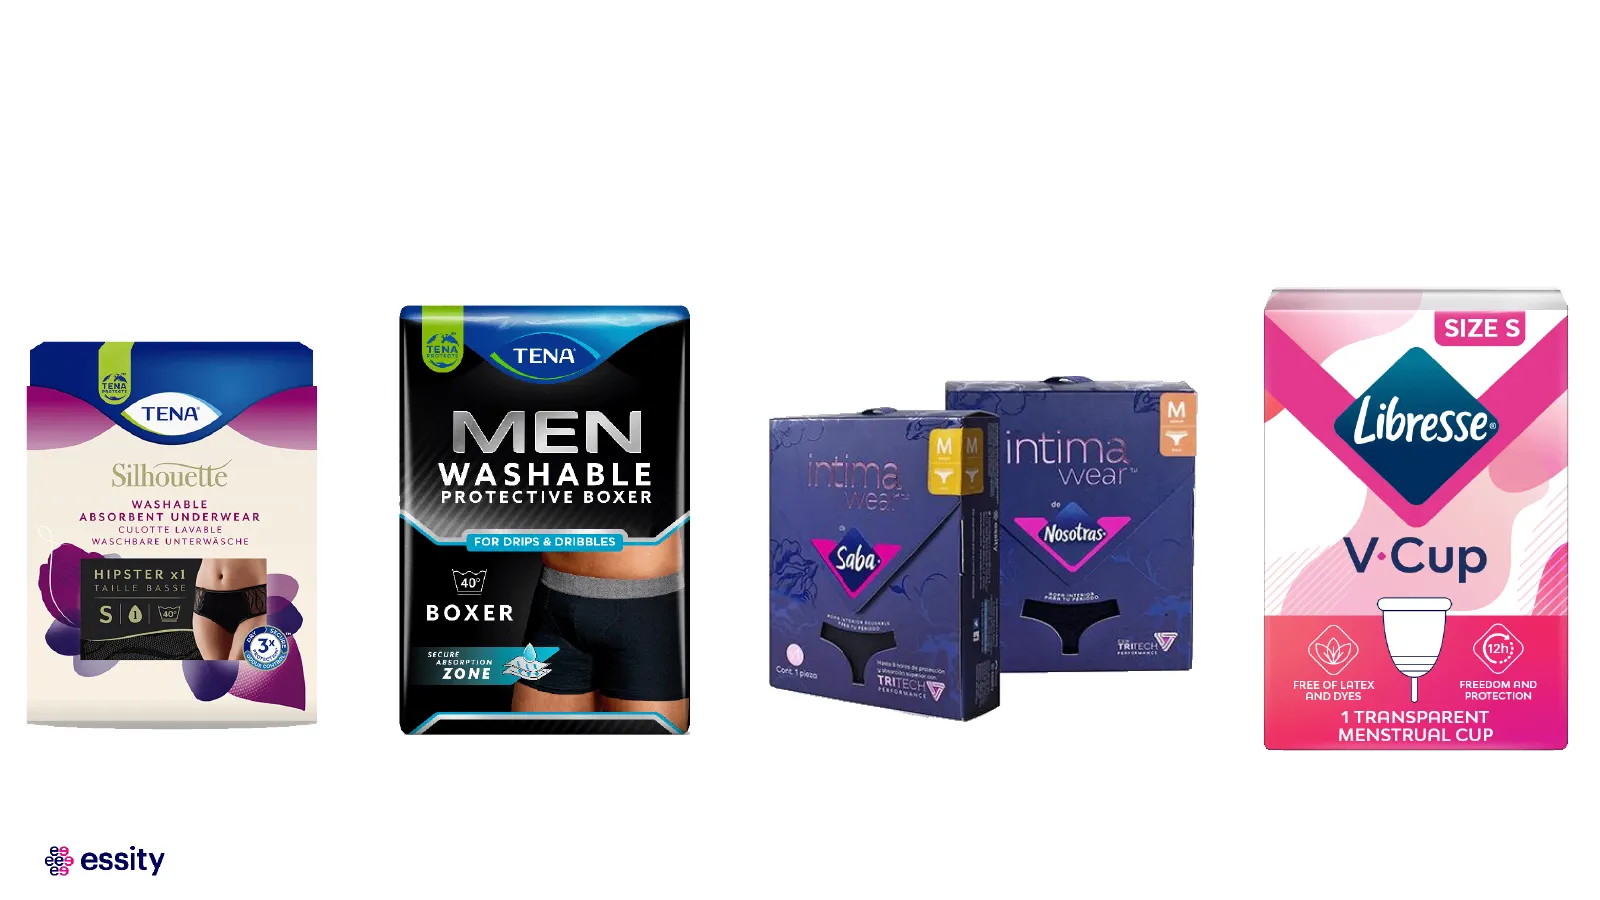
Slide 75: MEN
< MEN Silhouetté WASHABLE WASHABLE } PROTECTIVE BOXER ABSORBENT UNDERWEAR CULOTTE LAVABLE WASCHBARE UNTERWASCHE FOR DRIPS & DRIBBLES \40 BOXER & essity ©U reg ortevex ] FREEDOM AND ‘AND DYES. PROTECTION 1 TRANSPARENT MENSTRUAL CUP
Slide 76: Sustainability Drives Profitable Growth
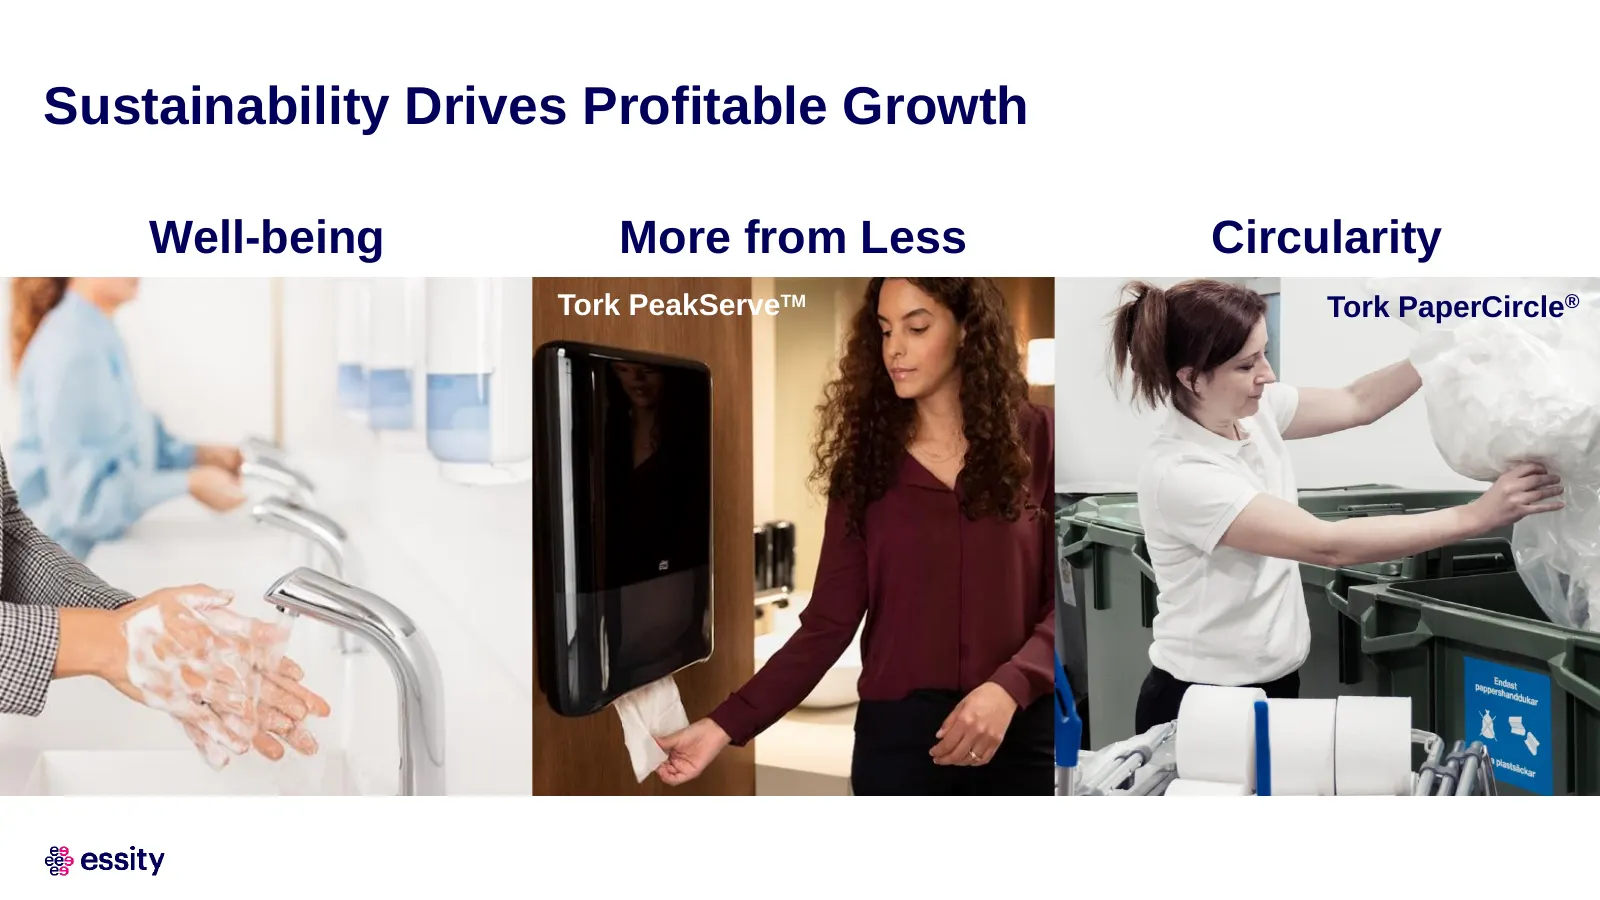
Sustainability Drives Profitable Growth Well-being More from Less Circularity Tork PeakServeTM Tork PaperCircle®
Slide 77: Tork PaperCircle
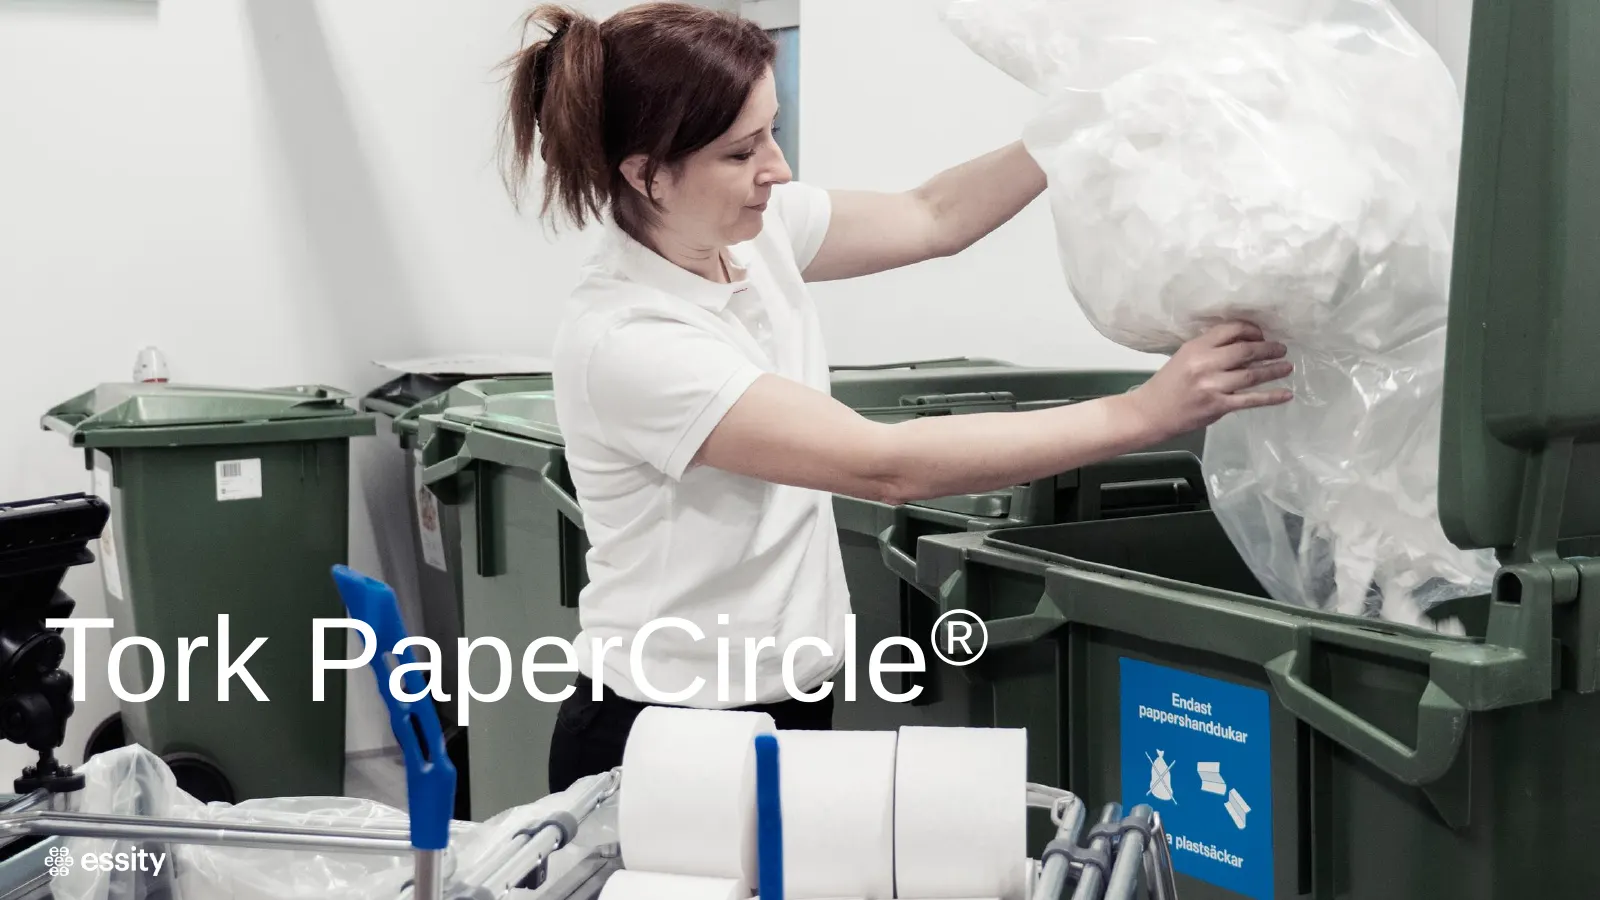
Text ® Tork PaperCircle
Slide 78: Tork PaperCircle
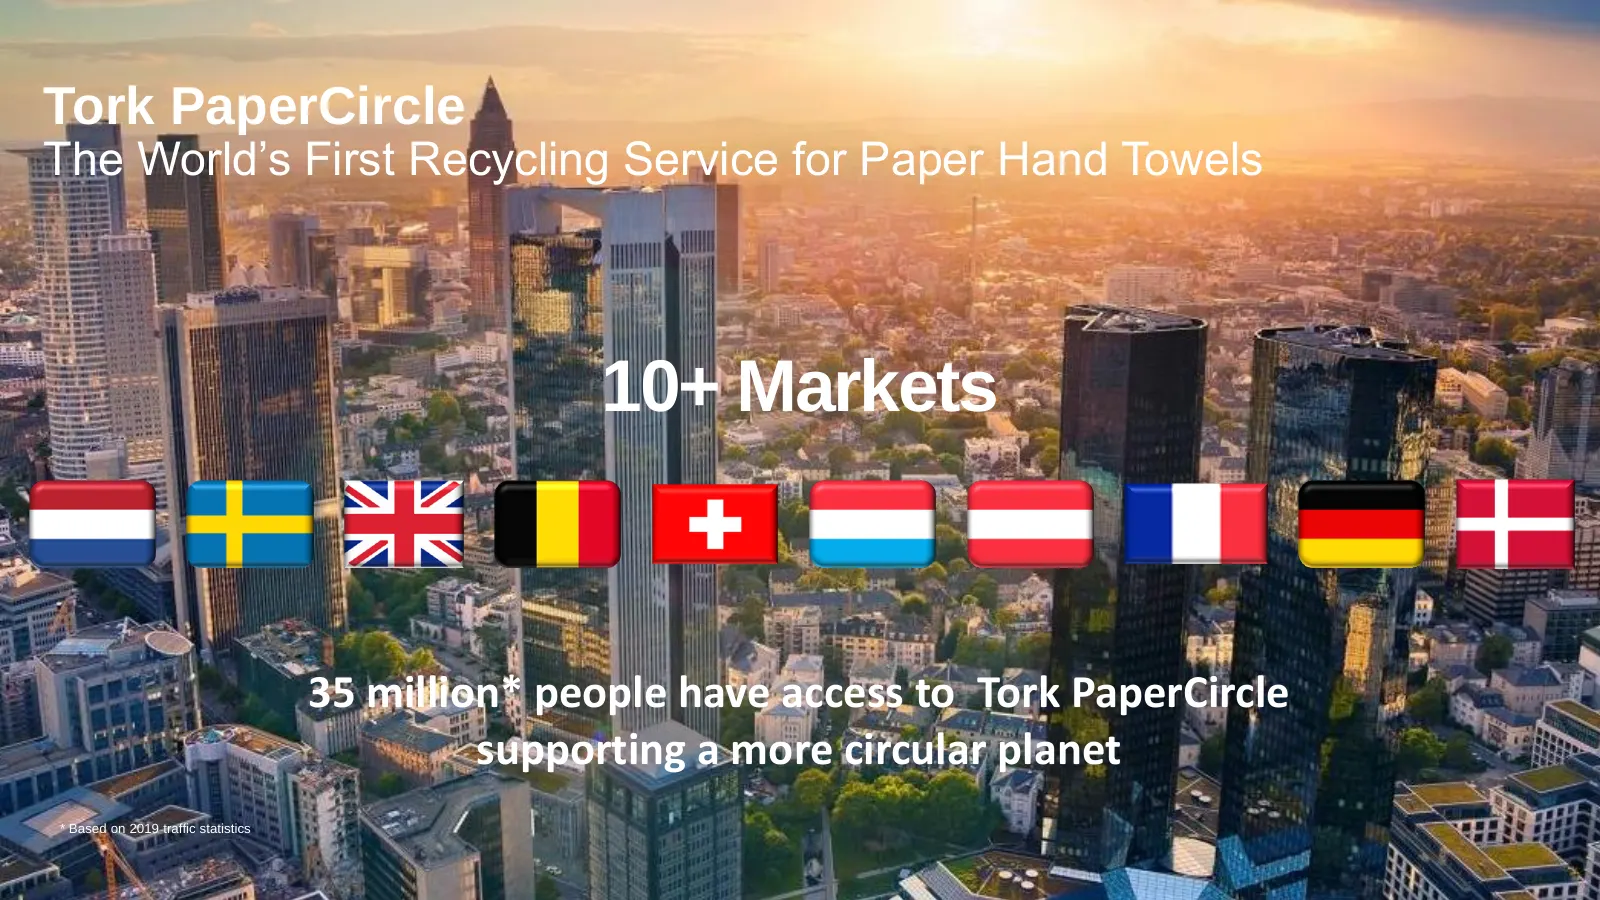
Tork PaperCircle The World’s First Recycling Service for Paper Hand Towels 10+ Markets 35 million* people have access to Tork PaperCircle supporting a more circular planet * Based on 2019 traffic statistics

Slide 79: Winning with People & Culture
Winning with Text People & Culture

Slide 80: Our Purpose: Breaking Barriers to Well-being
Our Purpose Breaking Barriers to Well-being Text

Slide 81: Culture & Employee Engagement
Culture & Text Employee Engagement
Slide 82: Beliefs
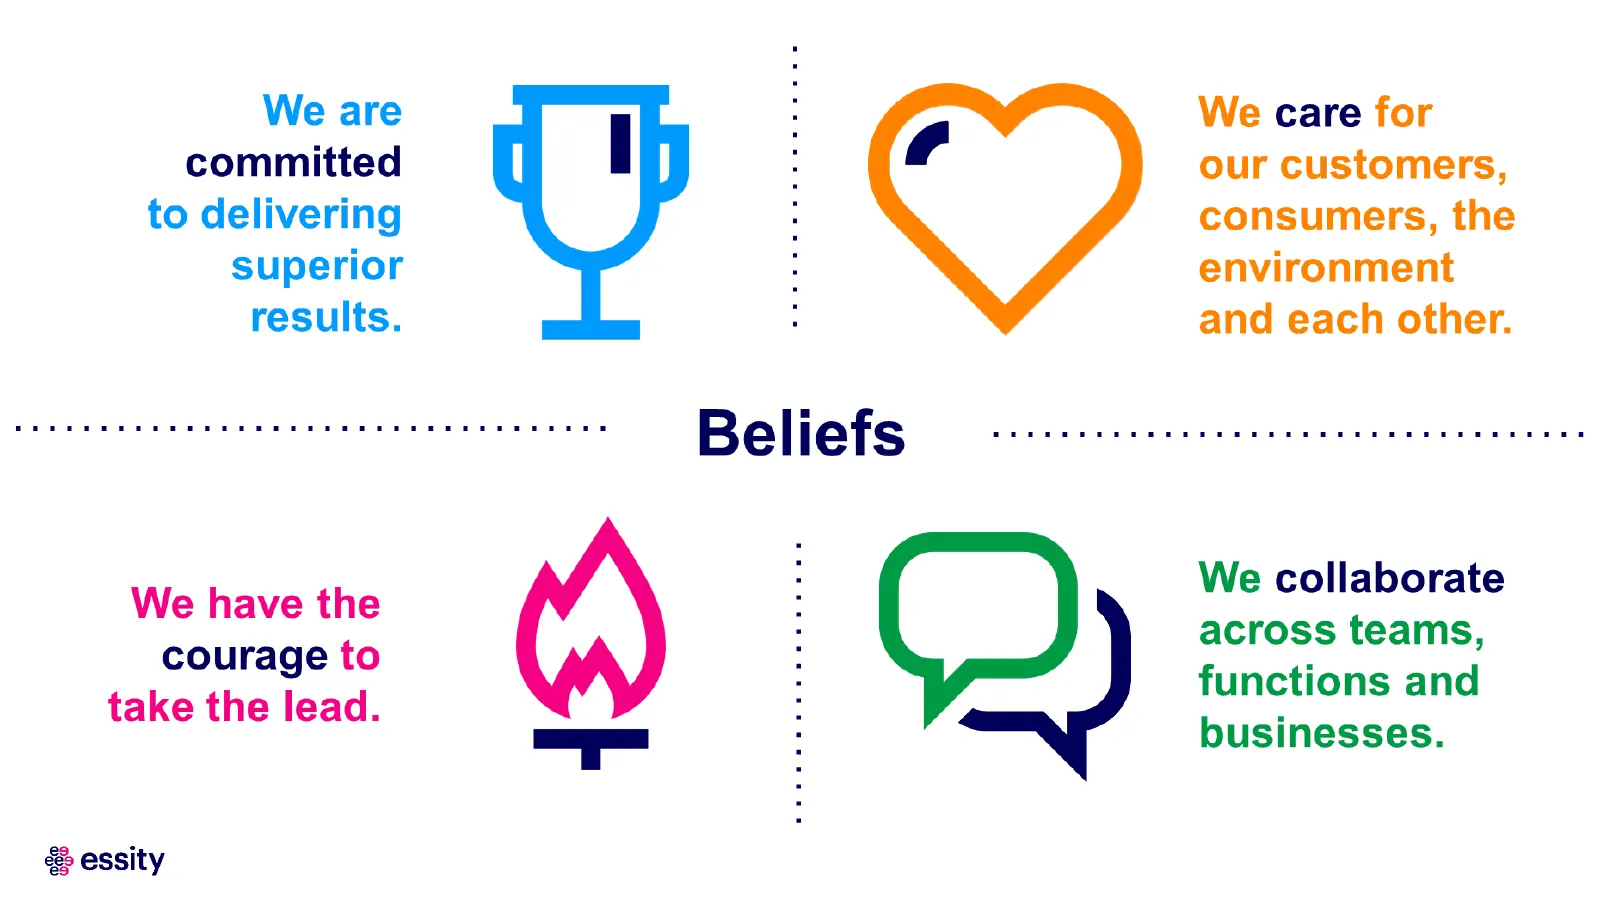
We are We care for committed : our customers, to delivering consumers, the superior environment results. : and each other. beeen eee eect eee eeee eee Beliefs beeen eee eee e eee e teen nena We have the We collaborate across teams, : functions and as : businesses. courage to take the lead. & essity

Slide 83: Sustainable Working Life
Sustainable Text Working Life

Slide 84: Diversity, Equity and Inclusion
Text Diversity, Equity and Inclusion

Slide 85: Educating children in collaboration with UNICEF Mexico
Educating children Text in collaboration with UNICEF Mexico

Slide 86: Diversity, Equity & Inclusion – Our Commitment
Diversity, Equity & Inclusion Our Commitment ▪ Provide an inclusive working environment for all ▪ Achieve gender balanced leadership everywhere - at least 40/60 gender distribution on all leadership levels by 2025 ▪ Accelerate transition to reflect under-represented groups

Slide 87: Growing in Emerging Markets
Growing inText Emerging Markets
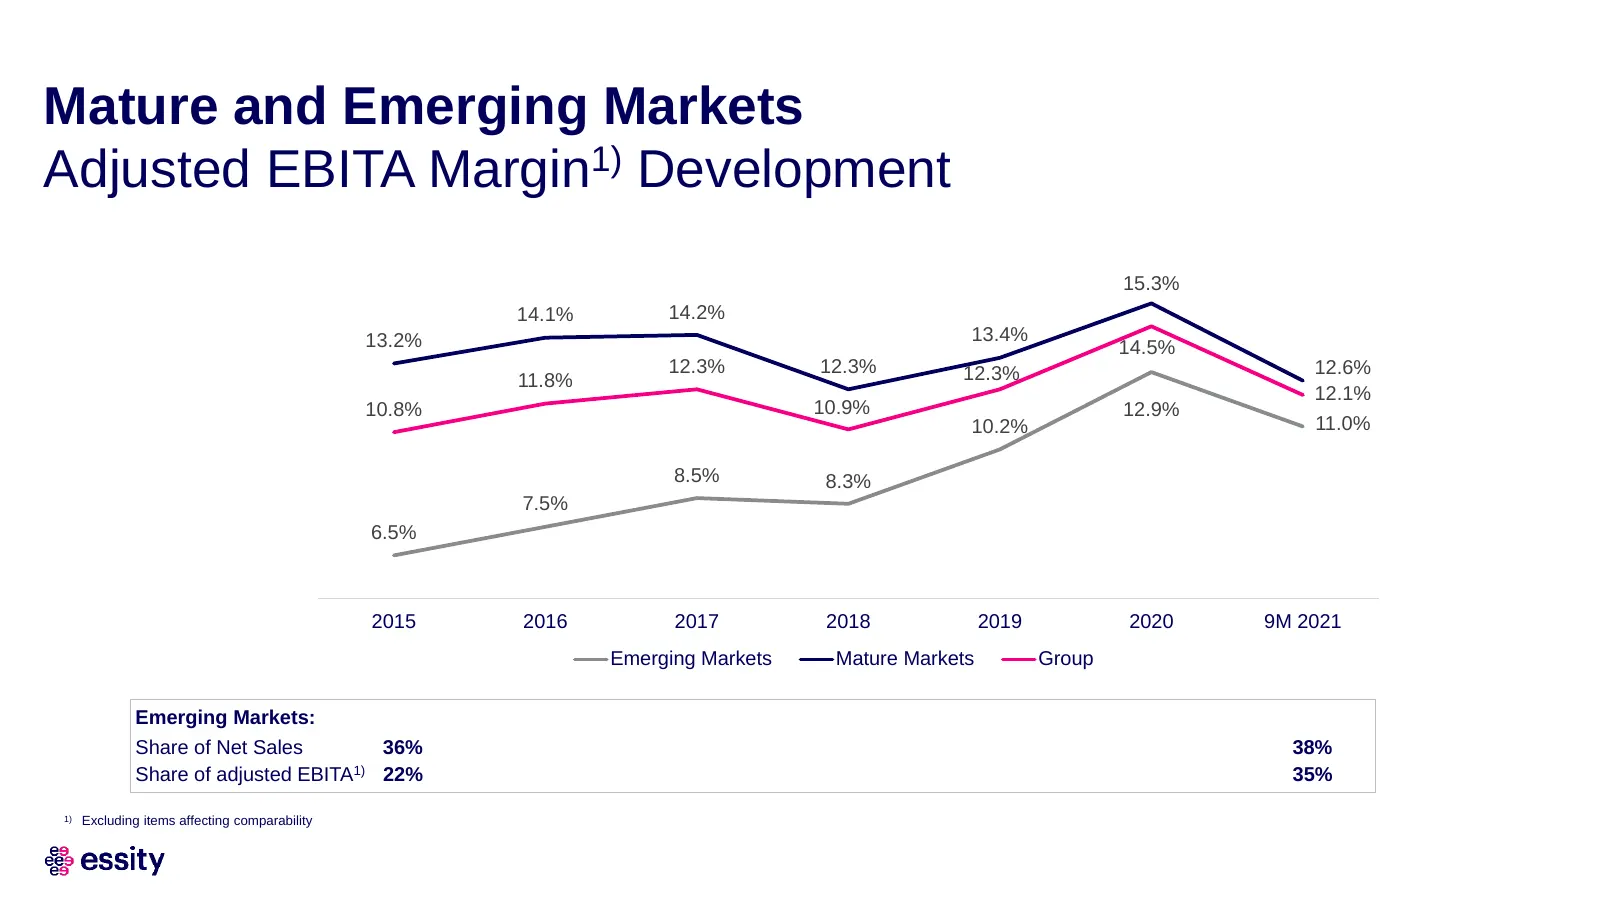
Slide 88: Mature and Emerging Markets Adjusted EBITA Margin Development
Mature and Emerging Markets Adjusted EBITA Margin1) Development 15.3% 14.1% 14.2% 13.2% 13.4% 14.5% 12.3% 12.3% 12.3% 12.6% 11.8% 12.1% 10.8% 10.9% 12.9% 10.2% 11.0% 8.5% 8.3% 7.5% 6.5% 2015 2016 2017 2018 2019 2020 9M 2021 Emerging Markets Mature Markets Group Emerging Markets: Share of Net Sales 3

Slide 89: Latin America
Text Latin America
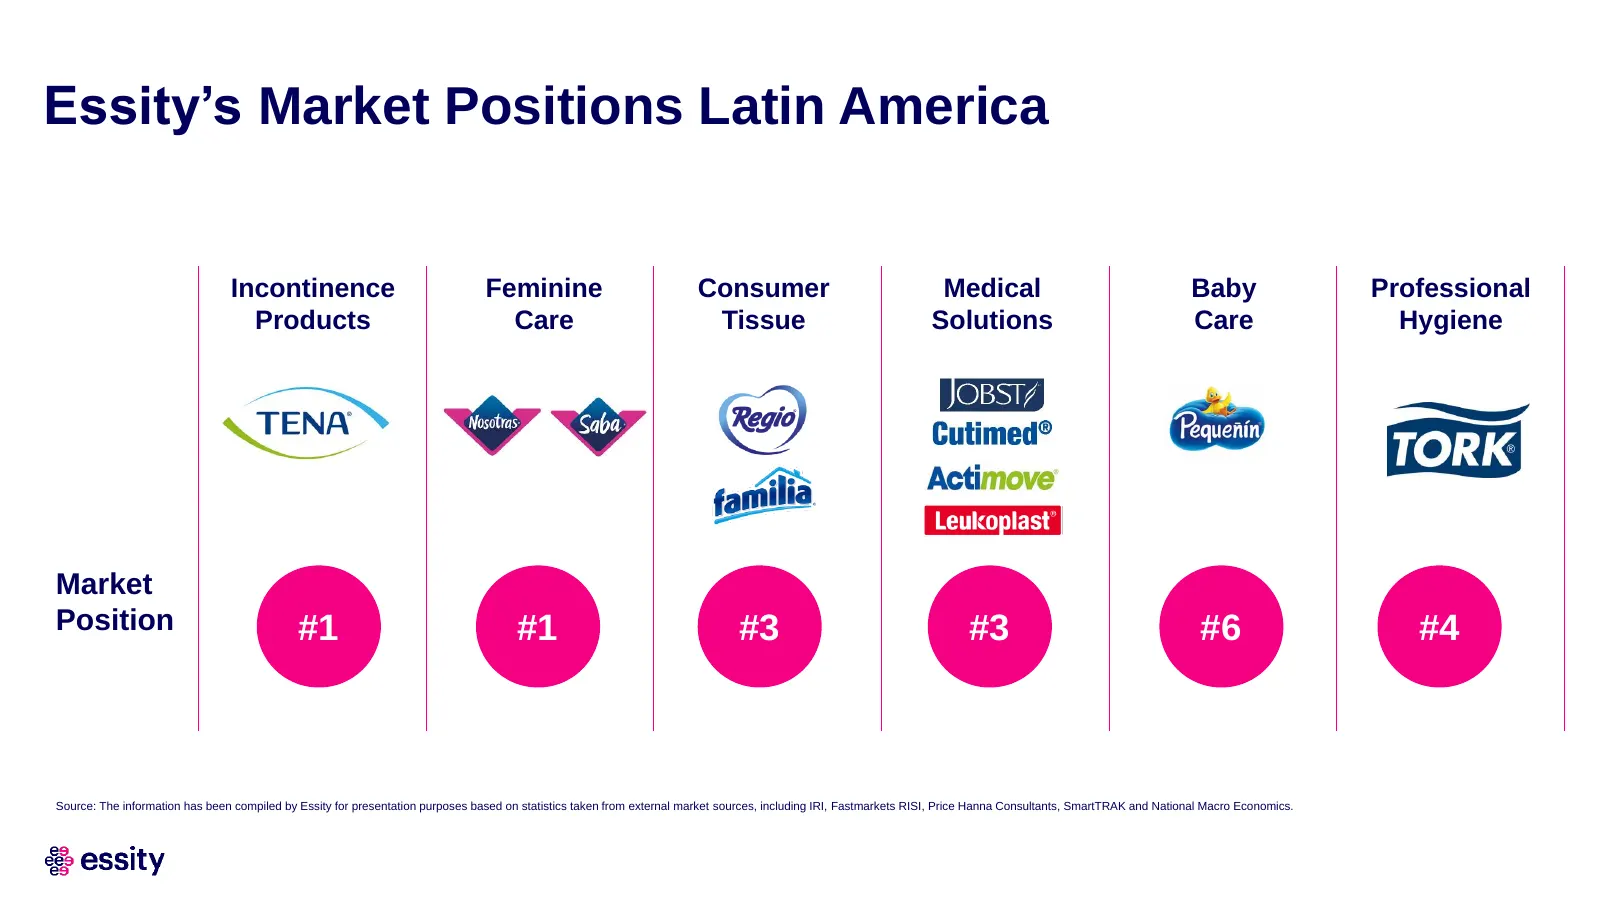
Slide 90: Essity's Market Positions Latin America
Essity’s Market Positions Latin America Incontinence Feminine Consumer Medical Baby Professional Products Care Tissue Solutions Care Hygiene Market Position #1 #1 #1 #1 #2 #3 #4 #3 #5 #6 #5 #4 Source: The information has been compiled by Essity for presentation purposes based on statistics taken fro
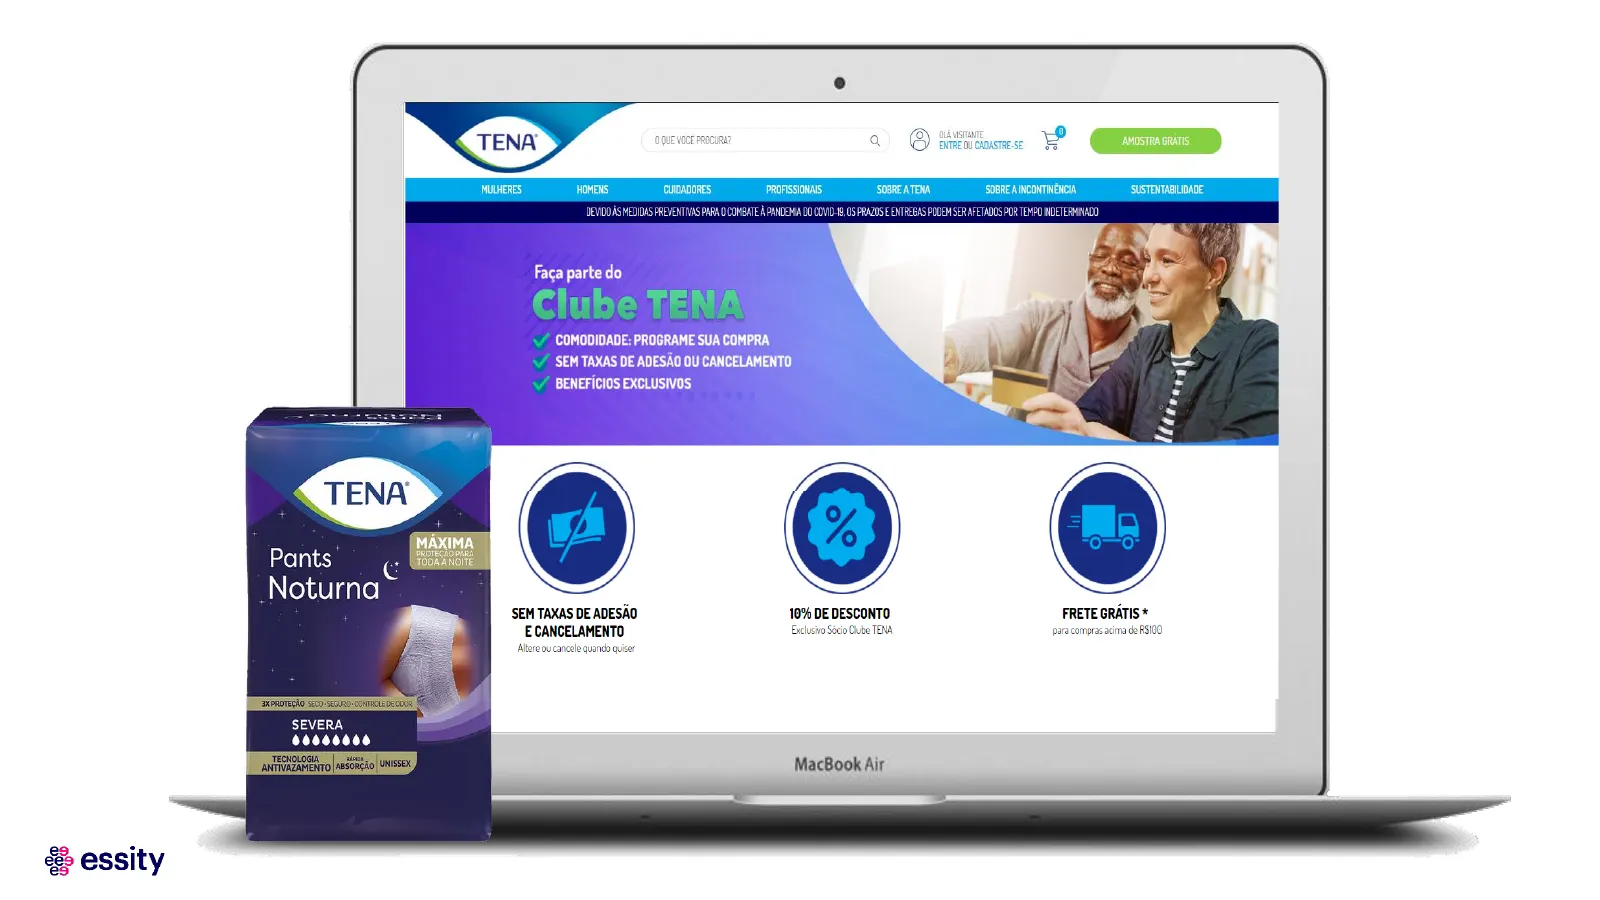
Slide 91: Tena subscription offering
" COMODIDADE: PROGRAME SUA COMPRA ‘SEM TAXAS DE ADESAO OU CANCELAMENTO BENEFICIOS EXCLUSIVOS ‘SEM TAXAS DE ADESAO 10% DE DESCONTO FRETE GRATIS * ECANCELAMENTO Exclusiva Socio Cube TENA ‘para compras acina de RSIG0_ tere ov cance undo ae SEVERA é Cys & essity
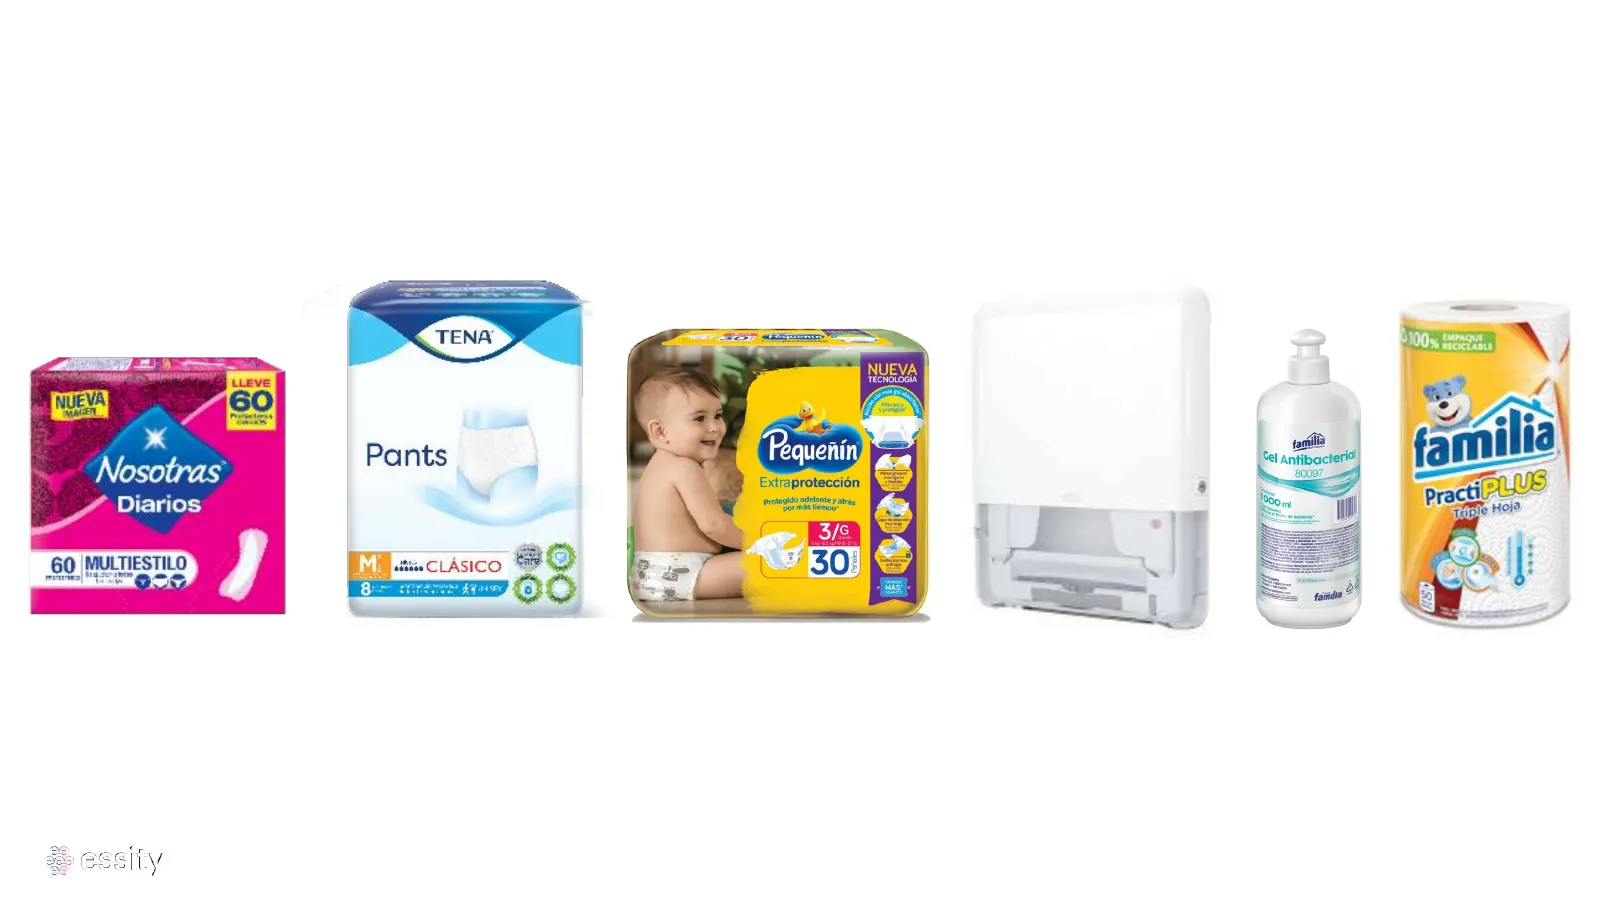
Slide 92: Text
Pants ‘Requenin —_
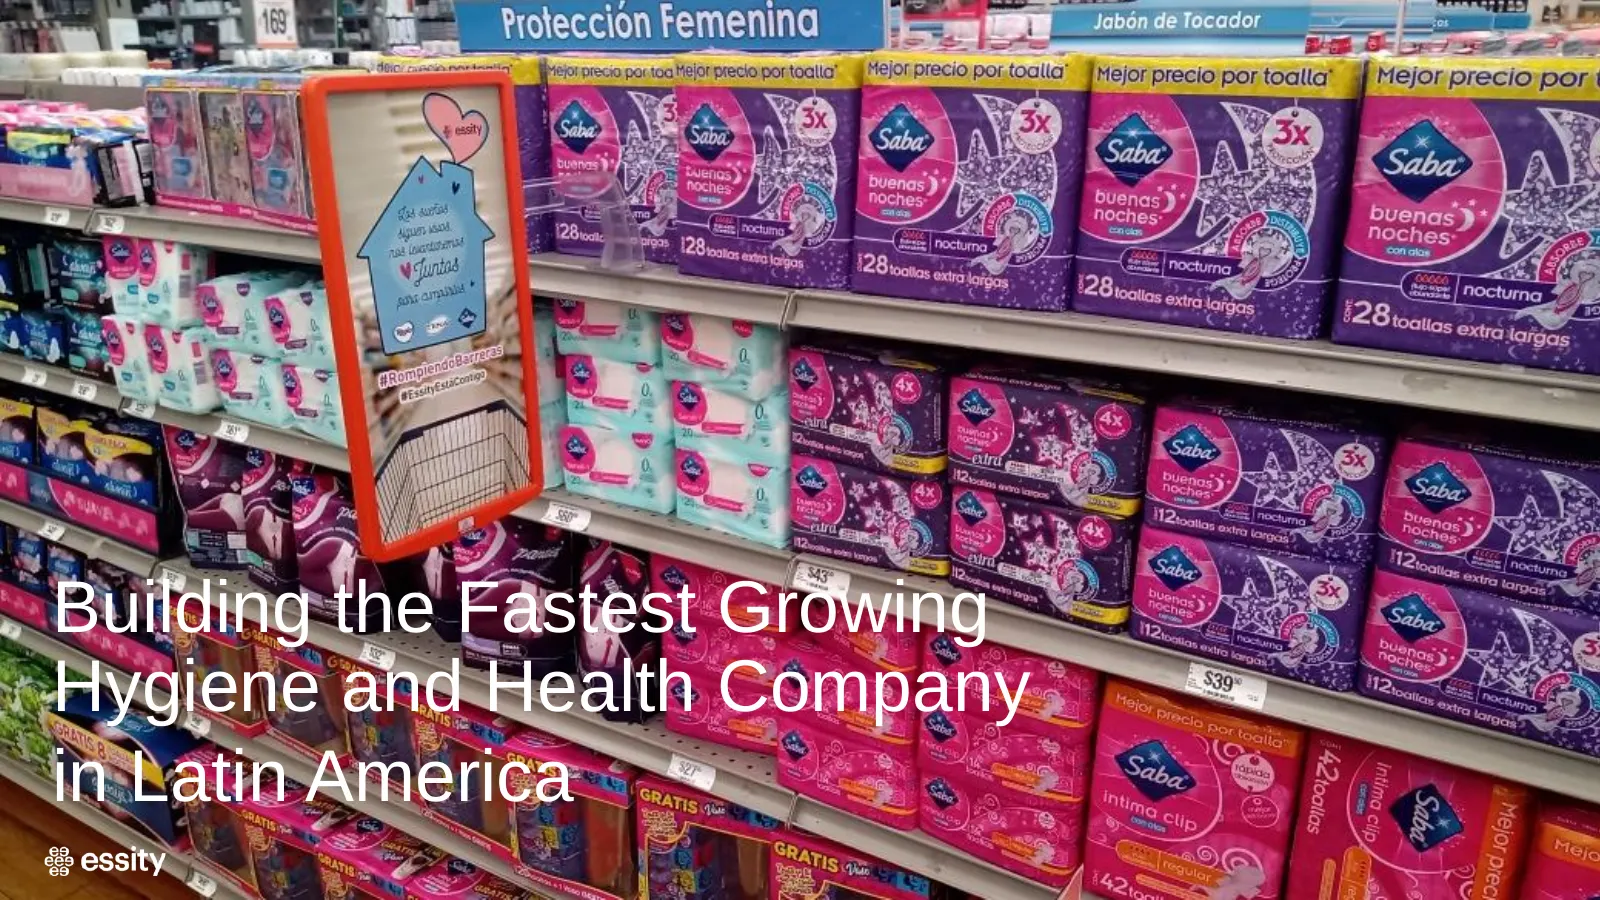
Slide 93: Building the Fastest Growing Hygiene and Health Company in Latin America
Text Building the Fastest Growing Hygiene and Health Company in Latin America

Slide 94: Welcome to Vinda
Welcome to Vinda A Leading, High-Growth Hygiene Company in Asia
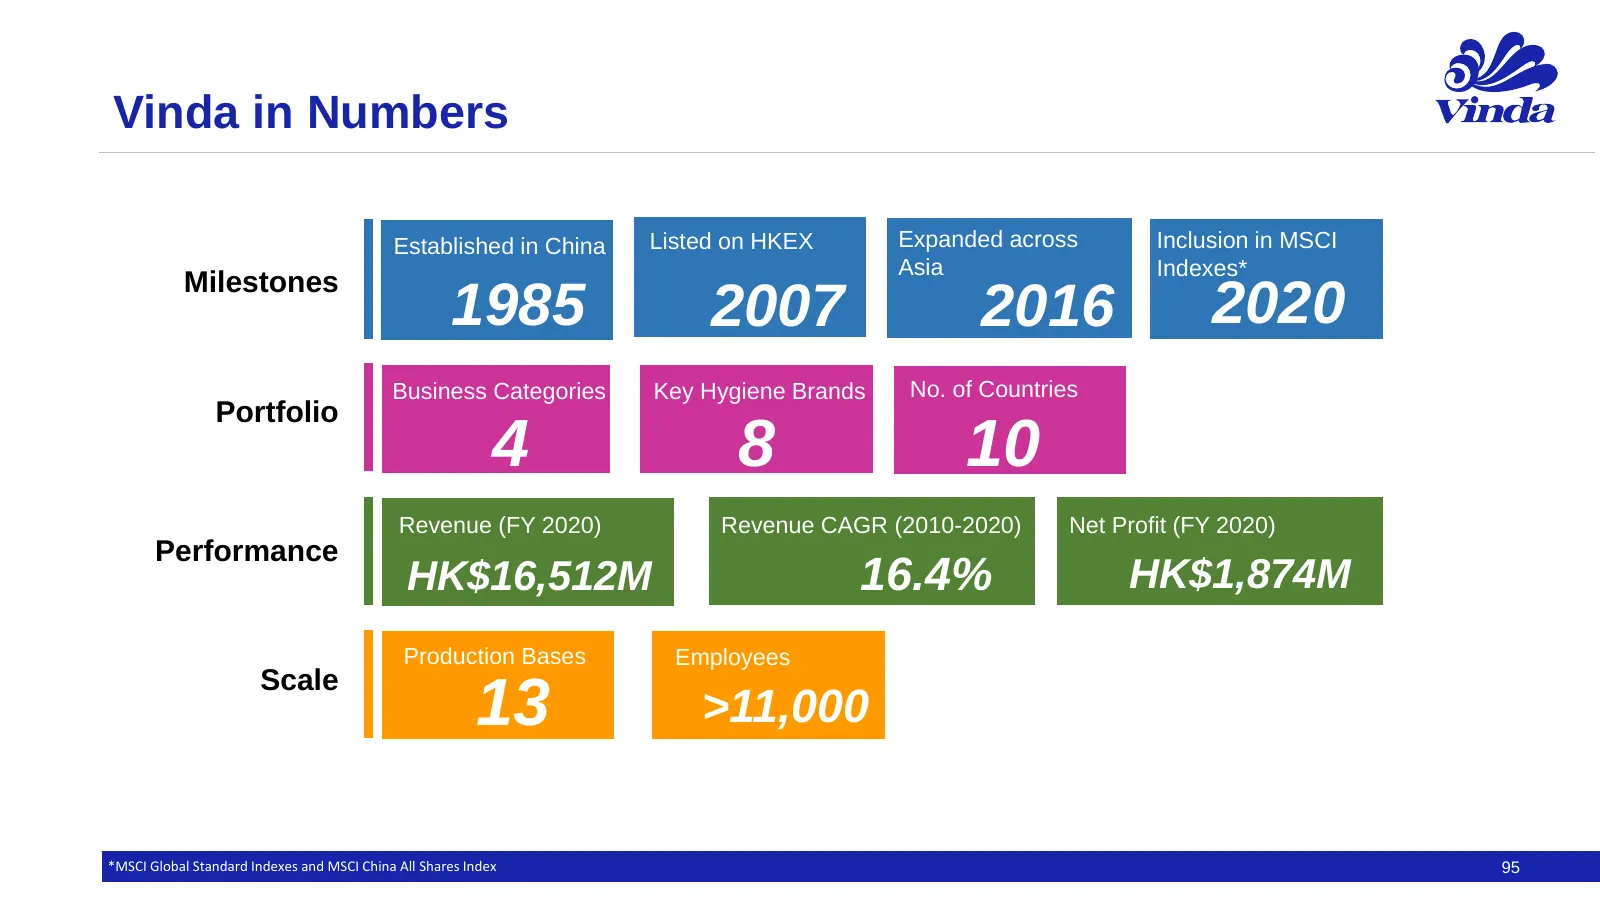
Slide 95: Vinda in Numbers
Vinda in Numbers Established in China Listed on HKEX Expanded across Inclusion in MSCI Asia Indexes* Milestones 1985 2007 2016 2020 Business Categories Key Hygiene Brands No. of Countries Portfolio 4 8 10 Revenue (FY 2020) Revenue CAGR (2010-2020) Net Profit (FY 2020) Performance HK$16,512M 16.4% HK
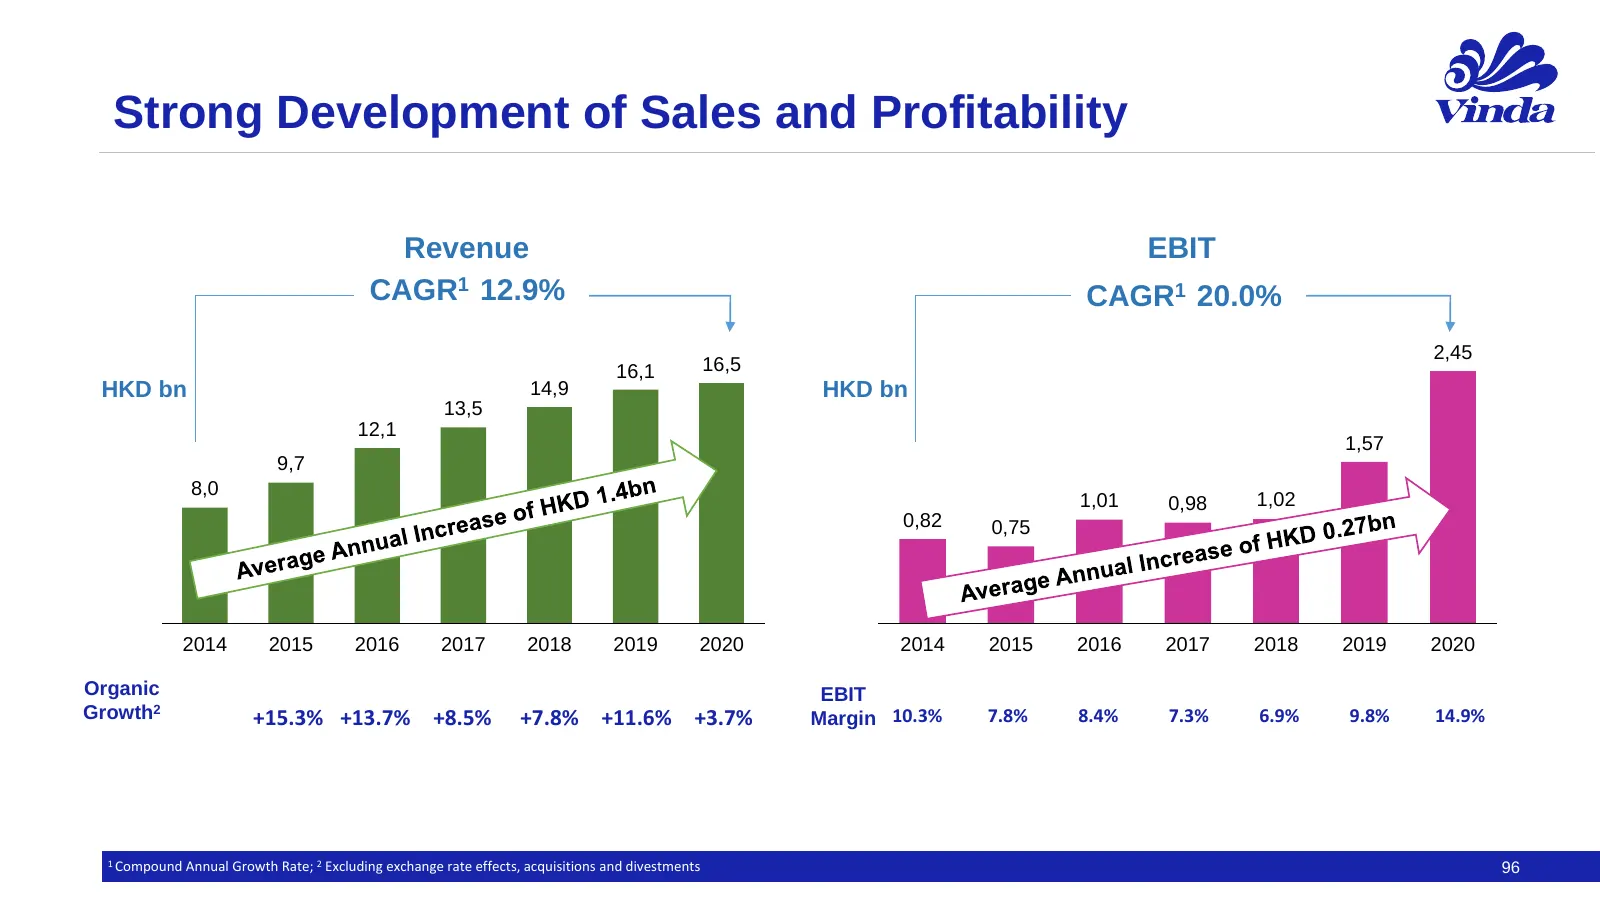
Slide 96: Strong Development of Sales and Profitability
Strong Development of Sales and Profitability Revenue EBIT CAGR1 12.9% CAGR1 20.0% 2,45 16,1 16,5 HKD bn 14,9 HKD bn 13,5 12,1 1,57 9,7 8,0 1,01 0,98 1,02 0,82 0,75 2014 2015 2016 2017 2018 2019 2020 2014 2015 2016 2017 2018 2019 2020 Organic EBIT Growth2 +15.3% +13.7% +8.5% +7.8% +11.6% +3.7% Margi
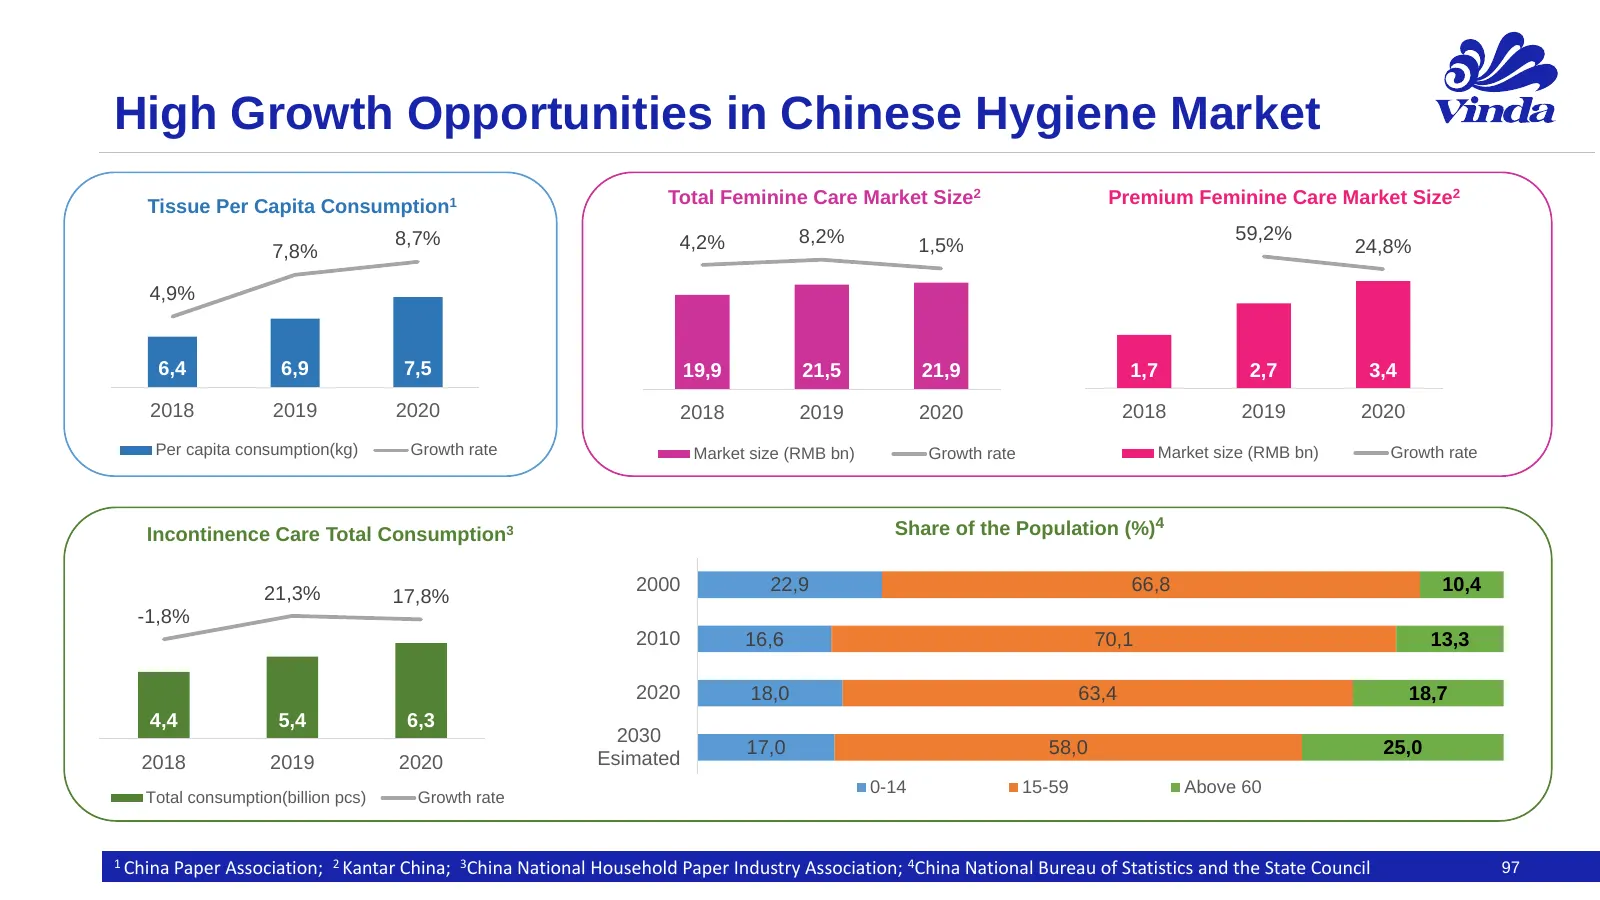
Slide 97: High Growth Opportunities in Chinese Hygiene Market
High Growth Opportunities in Chinese Hygiene Market Tissue Per Capita Consumption1 Total Feminine Care Market Size2 Premium Feminine Care Market Size2 8,7% 30,0 8,2% 5 59,2% 9 10% 4,2% 1,5% 24,8% 100% 7,8% 25,0 10% 4 8 8% 0% 4,9% 6% 20,0 3 7 -40%2 -100% 4% 15,0 6 2% 10,0 1 -200% 6,4 6,9 7,5 19,9 21,
Slide 98: Feminine Care Launch in Mainland China
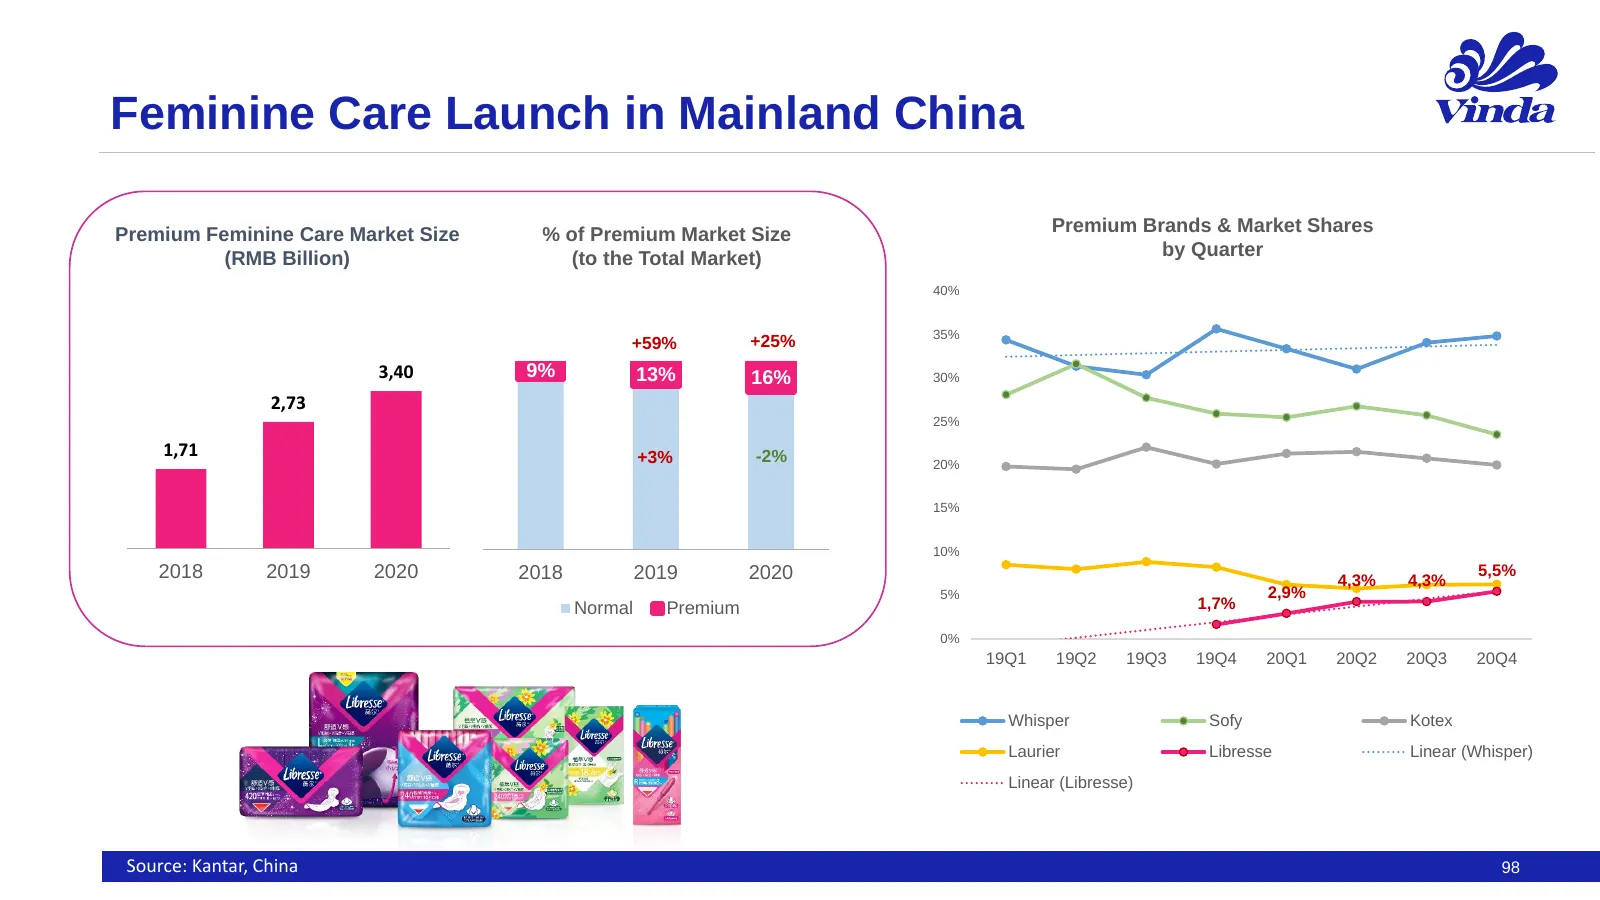
Feminine Care Launch in Mainland China Premium Feminine Care Market Size % of Premium Market Size Premium Brands & Market Shares (RMB Billion) (to the Total Market) by Quarter 40% 35% +59% +25% 3,40 9% 13% 16% 30% 2,73 25% 1,71 +3% -2% 20% 15% 10% 2018 2019 2020 2018 2019 2020 4,3% 4,3% 5,5% 5% 2,9%
Slide 99: Impactful Product and Marketing Innovation
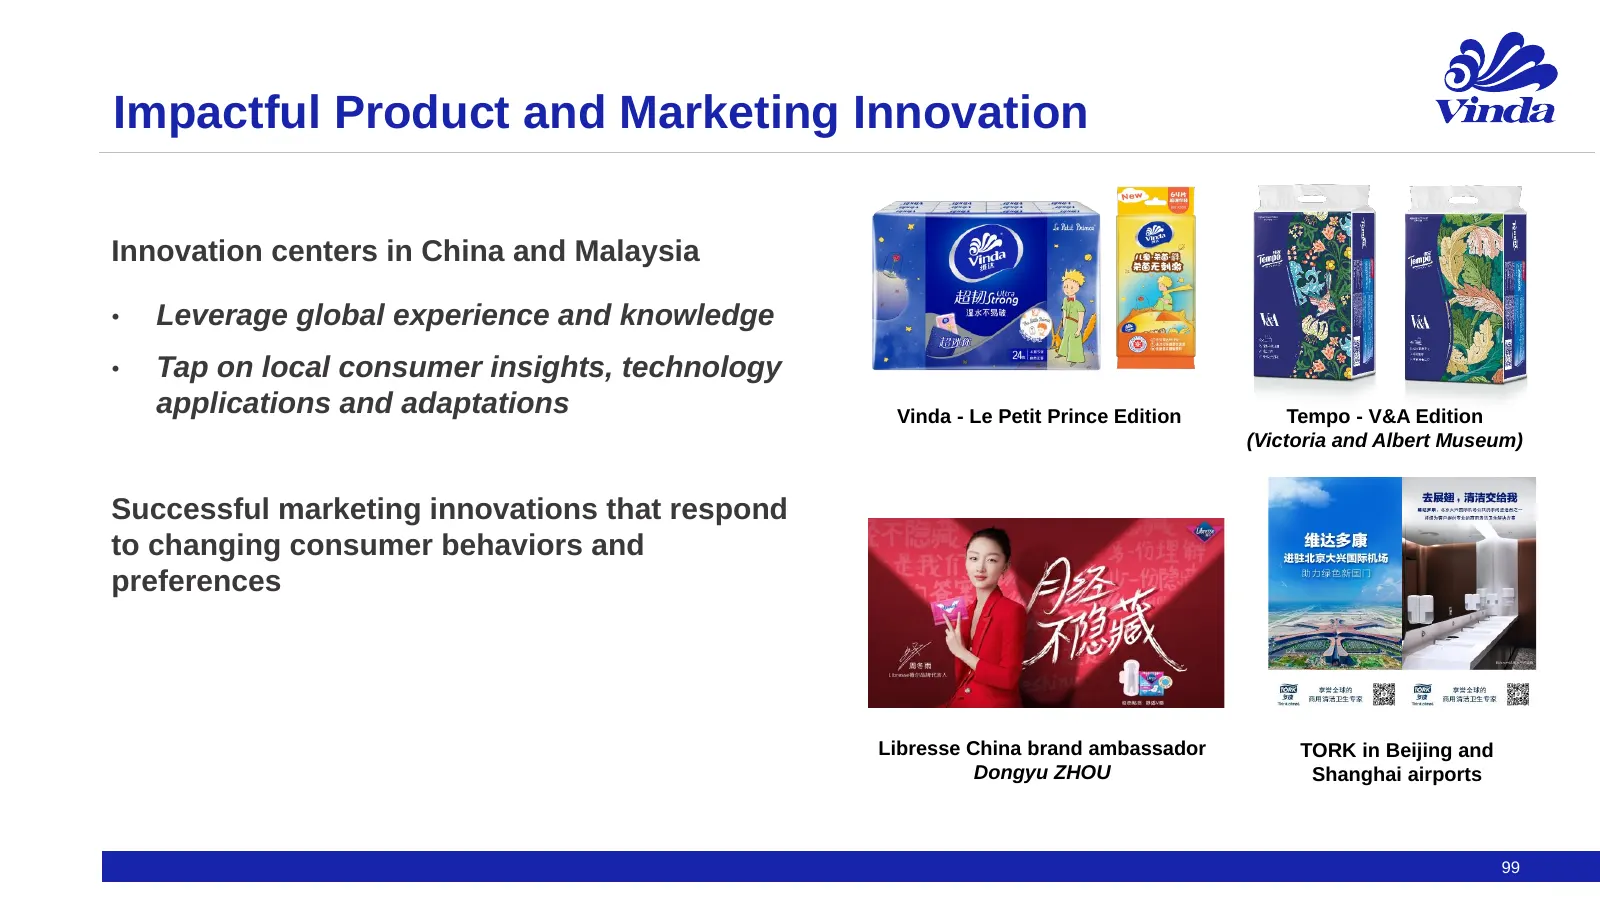
Impactful Product and Marketing Innovation Innovation centers in China and Malaysia • Leverage global experience and knowledge • Tap on local consumer insights, technology applications and adaptations Vinda - Le Petit Prince Edition Tempo - V&A Edition (Victoria and Albert Museum) Successful marketi
Slide 100: High Margin Products driven by Strong Brands
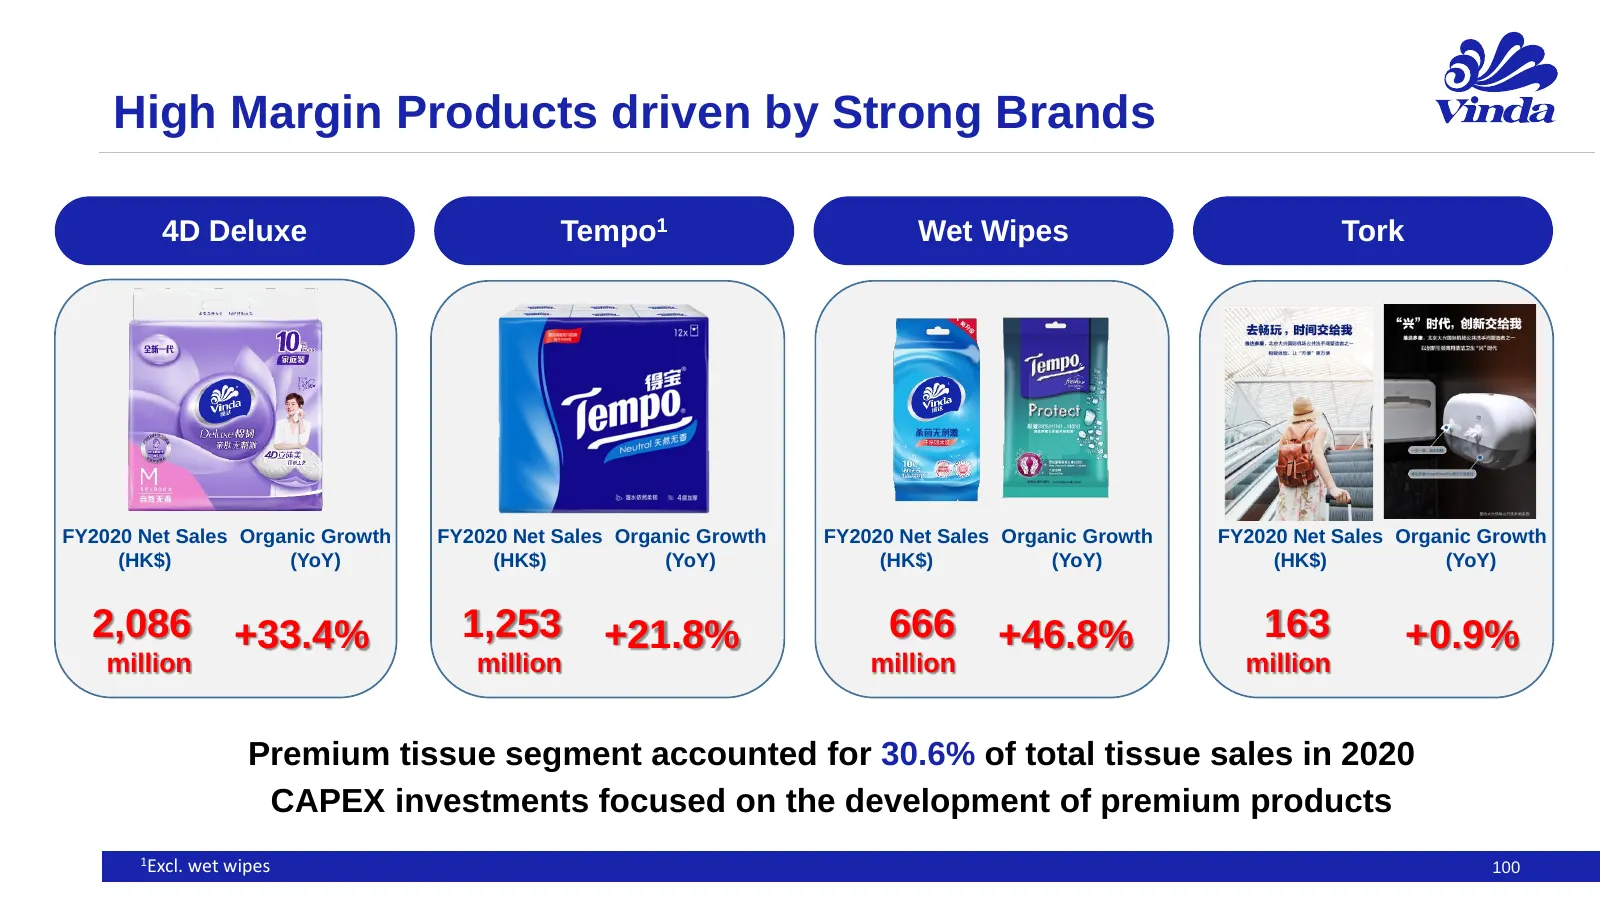
High Margin Products driven by Strong Brands 4D Deluxe Tempo1 Wet Wipes Tork FY2020 Net Sales Organic Growth FY2020 Net Sales Organic Growth FY2020 Net Sales Organic Growth FY2020 Net Sales Organic Growth (HK$) (YoY) (HK$) (YoY) (HK$) (YoY) (HK$) (YoY) 2,086 +33.4% 1,253 +21.8% 666 +46.8% 163 +0.9%
Slide 101: Strong E-commerce Growth and Channel Leadership
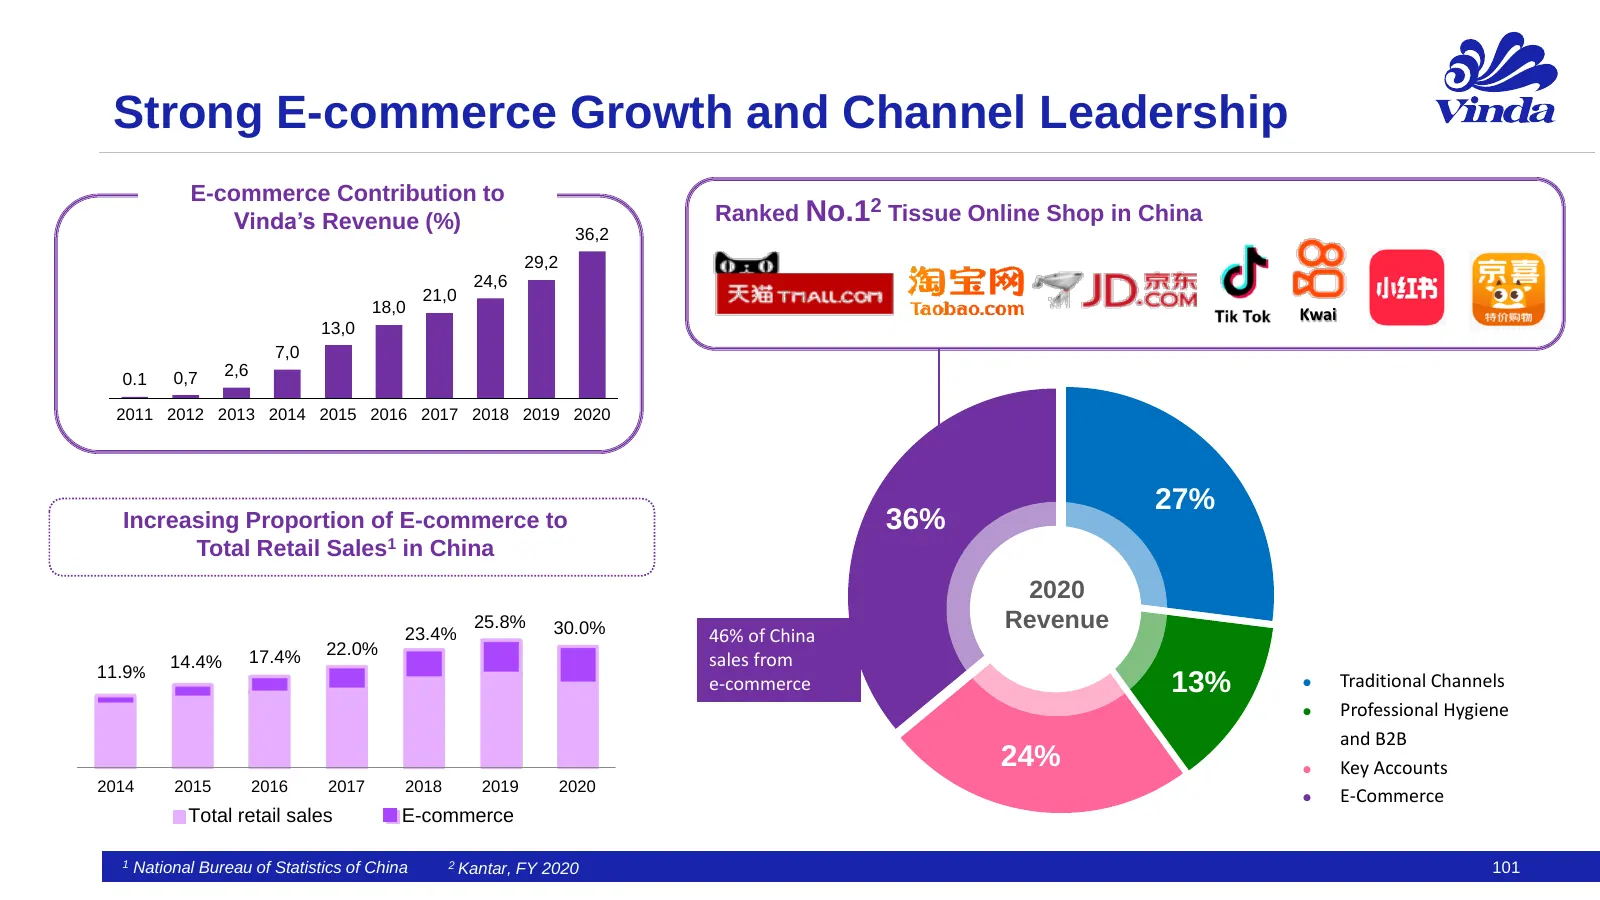
Strong E-commerce Growth and Channel Leadership E-commerce Contribution to Vinda’s Revenue (%) Ranked No.12 Tissue Online Shop in China 36,2 29,2 24,6 21,0 18,0 Kwai 13,0 7,0 0,7 2,6 0.1 2011 2012 2013 2014 2015 2016 2017 2018 2019 2020 27% Increasing Proportion of E-commerce to 36% Total Retail Sal
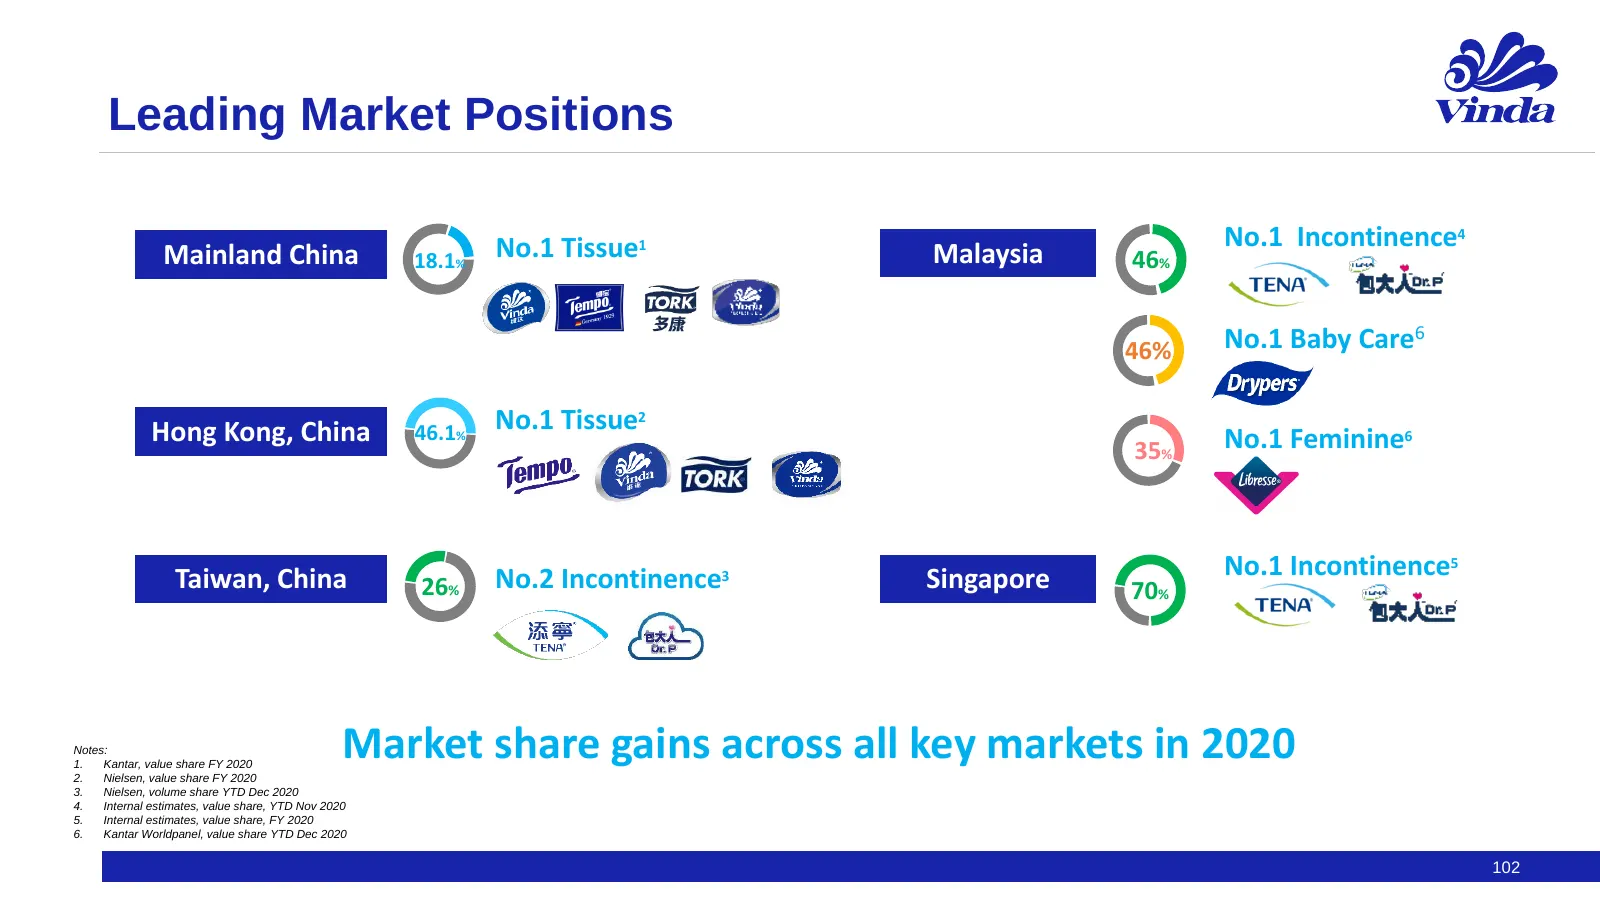
Slide 102: Leading Market Positions
Leading Market Positions No.1 Tissue1 No.1 Incontinence4 Mainland China 18.1% Malaysia 46% 46% No.1 Baby Care6 Hong Kong, China 46.1% No.1 Tissue2 35% No.1 Feminine6 Taiwan, China No.2 Incontinence3 Singapore No.1 Incontinence5 26% 70% Notes: 1. Kantar, value share FY 2020 Market share gains across
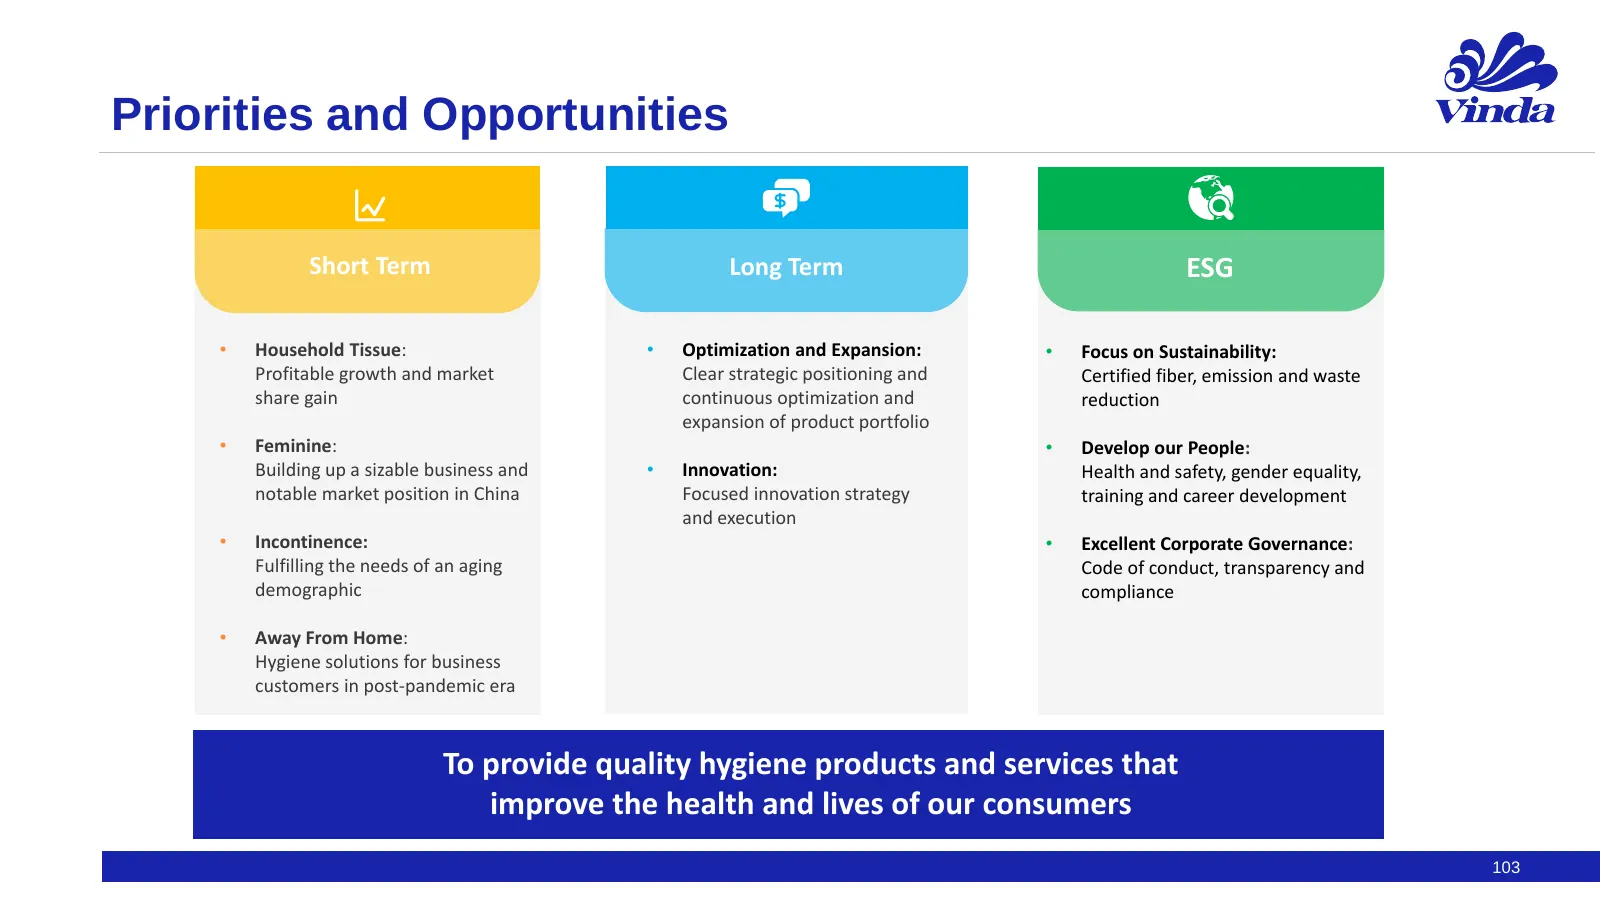
Slide 103: Priorities and Opportunities
Priorities and Opportunities Short Term Long Term ESG • Household Tissue: • Optimization and Expansion: • Focus on Sustainability: Profitable growth and market Clear strategic positioning and Certified fiber, emission and waste share gain continuous optimization and reduction expansion of product po
Slide 104: Forward-looking Statements
Forward-looking Statements Certain statements in this presentation includes forward-looking statements, including statements reflecting management’s current views relating to the growth of the market, future market conditions, future events, financial conditions, and expected operational performance

Slide 105: Investor Relations Contacts
Investor Relations Contacts Johan Karlsson Sandra Åberg Janet Östergren +46 8 788 51 30 +46 8 788 51 70 +46 8 788 51 63 johan.ir.karlsson@essity.com sandra.aberg@essity.com janet.ostergren@essity.com
Source: Internet Archive copy of essity.com
More decks from Essity AB Class A
 Q3 2026 Earnings Presentation28 slides · Oct 22, 2026
 Q2 2026 Earnings Presentation20 slides · Jul 16, 2026
 Investor Day (May 2026)122 slides · May 7, 2026
 Q1 2026 Earnings Presentation20 slides · Apr 23, 2026
 Q4 2025 Earnings Presentation22 slides · Jan 22, 2026
 Q3 2025 Earnings Presentation17 slides · Oct 23, 2025