Santander Holdings USA Inc · NYSE:SNUS/PH
Santander Holdings USA — Debt Investor Presentation (November 2023)
34 slides from Santander Holdings USA's debt investor presentation, Nov 3, 2023
Slide 1: Third Quarter 2023 Fixed Income Investor Presentation
November 3, 2023 Third Quarter 2023 Fixed Income Investor Presentation
Slide 2: Important Information
Important Information This presentation of Santander Holdings USA, Inc. (“SHUSA") contains “forward-looking statements" within the meaning of the Private Securities Litigation Reform Act of 1995 regarding the financial condition, results of operations, business plans and future performance of SHUSA.
Slide 3: Index
Index At a Glance F t Capital & ix Ss i= vas ~]
Slide 4: SHUSA Q3 2023 Highlights
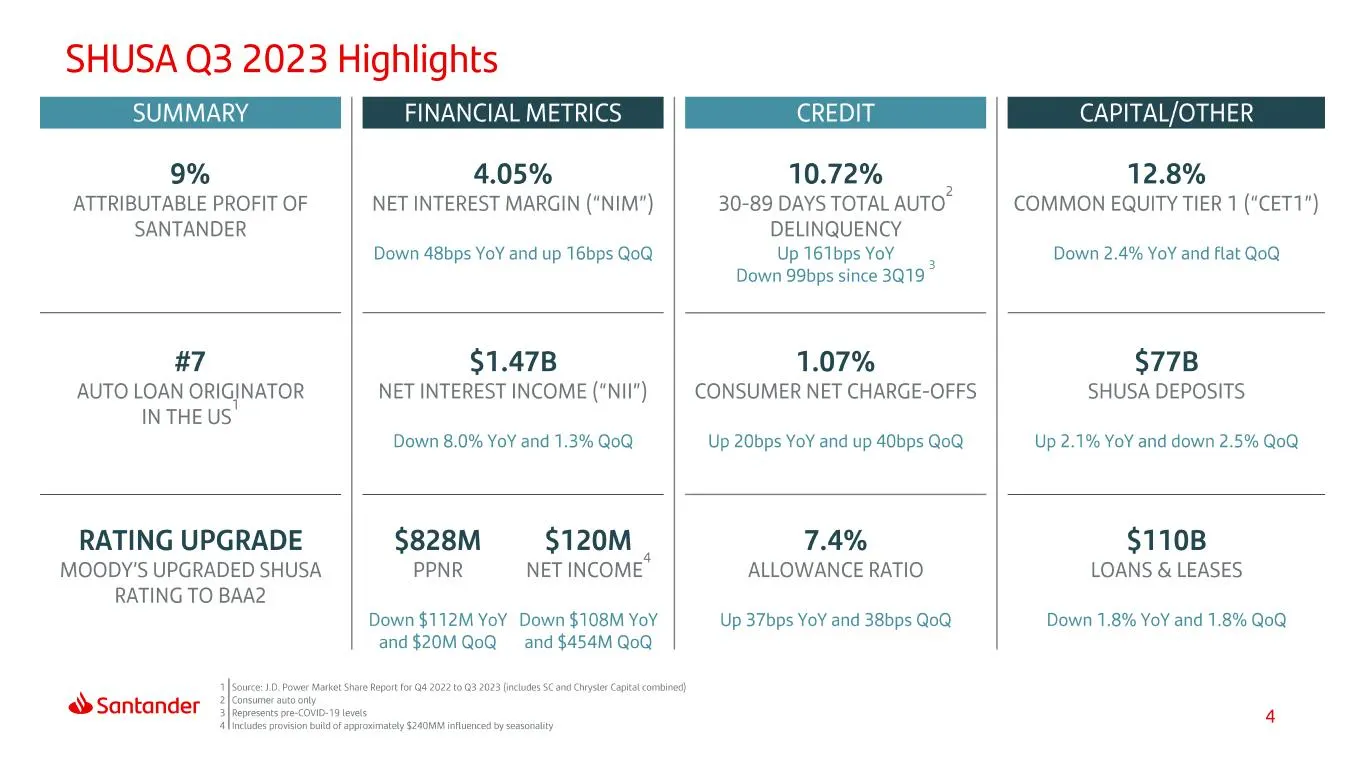
SHUSA Q3 2023 Highlights SUMMARY FINANCIAL METRICS CAPITAL/OTHER 9% 4.05% 10.72% 12.8% ATTRIBUTABLE PROFIT OF NET INTEREST MARGIN ("NIM") 30-89 DAYS TOTAL AUTO” COMMON EQUITY TIER 1 (“CET1") SANTANDER DELINQUENCY Down 48bps YoY and up 16bps QoQ Up 161bps YoY Down 2.4% YoY and flat QoQ Down 99bps sin
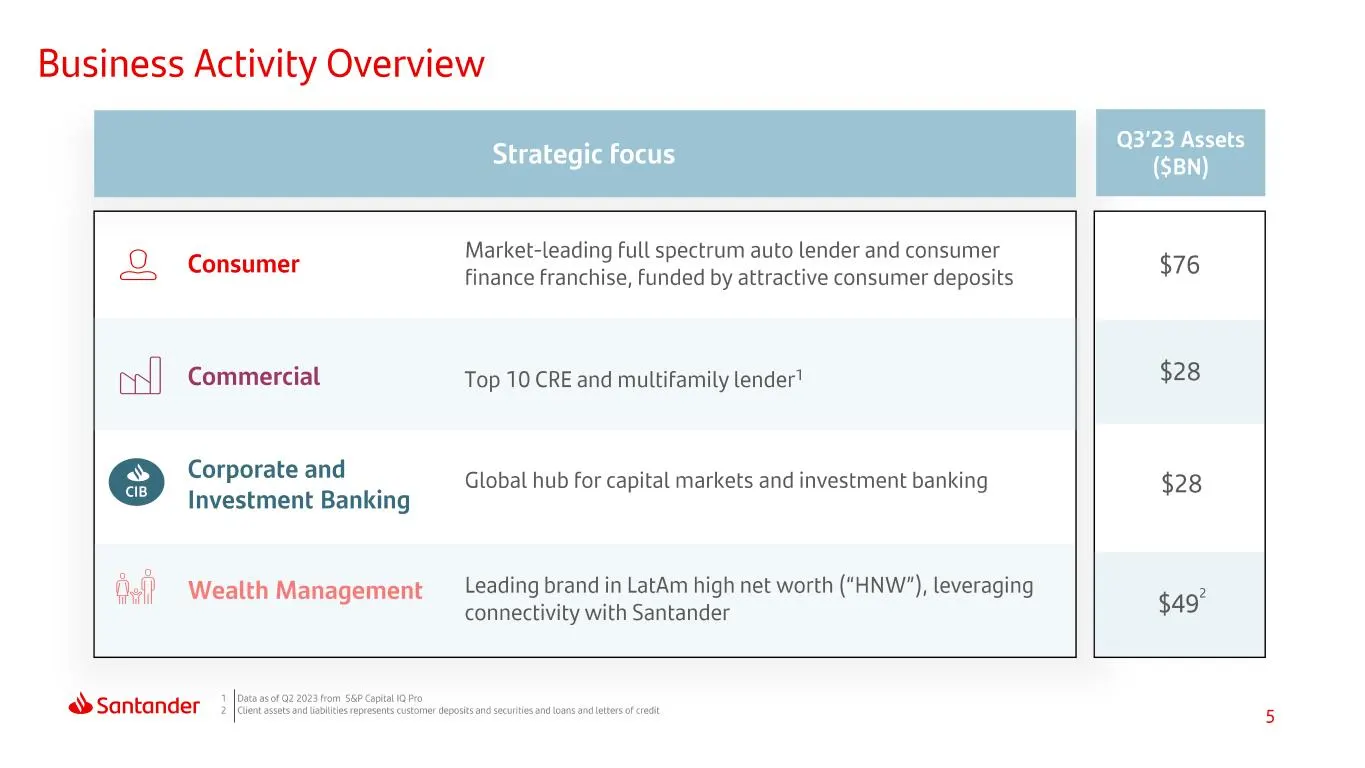
Slide 5: Business Activity Overview
Business Activity Overview i Q > Consumer e Corporate and Investment Banking Os Wealth Management _ Leading brand in LatAm high net worth ("HNW"), leveraging Market-leading Full spectrum auto lender and consumer finance Franchise, Funded by attractive consumer deposits wn] Commercial Top 10 CRE and
Slide 6: Index
Index At a Glance Results Capital & ix Ss i= vas ~]
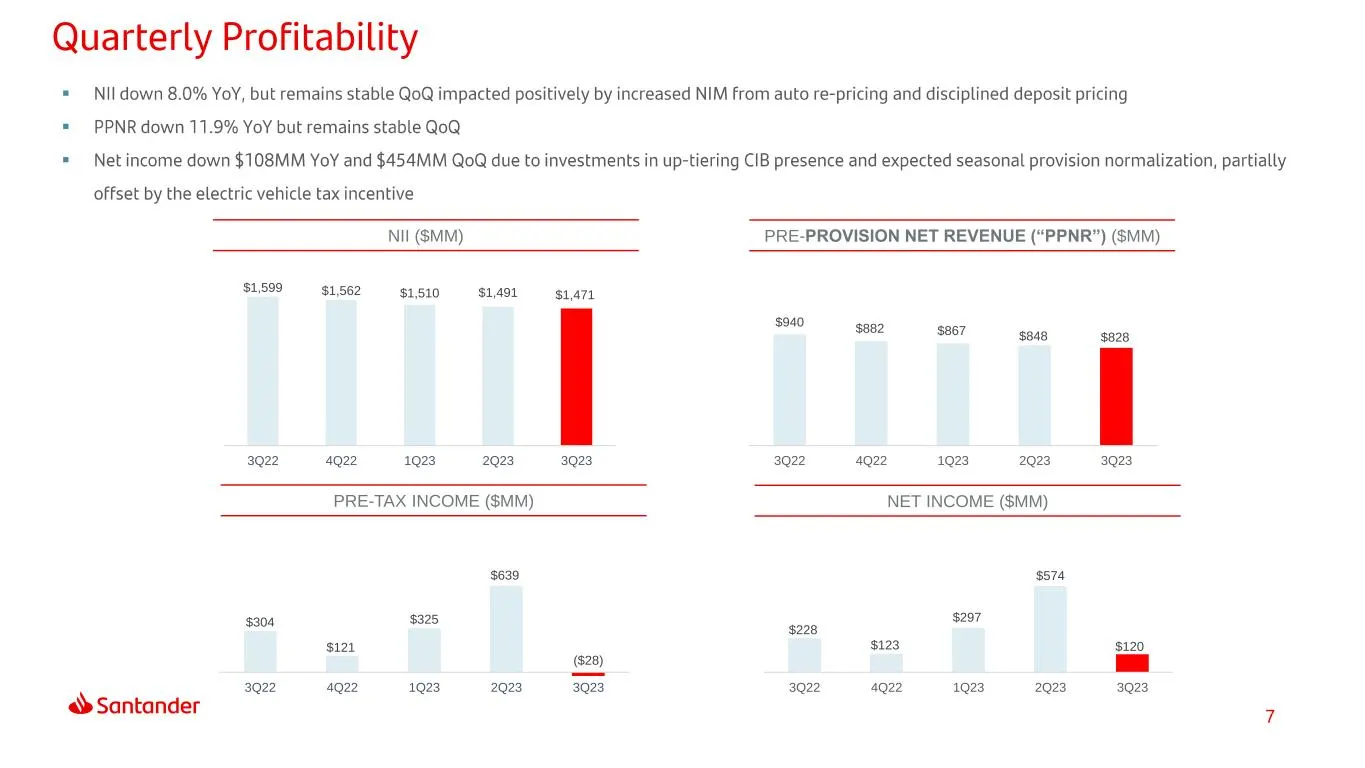
Slide 7: NII, Pre-Tax Income, Net Income and PPNR trends
$228 $123 $297 $574 $120 3Q22 4Q22 1Q23 2Q23 3Q23 $304 $121 $325 $639 ($28) 3Q22 4Q22 1Q23 2Q23 3Q23 NII ($MM) PRE-TAX INCOME ($MM) NET INCOME ($MM) PRE-PROVISION NET REVENUE (“PPNR”) ($MM) ▪ ▪ ▪ $940 $882 $867 $848 $828 3Q22 4Q22 1Q23 2Q23 3Q23 $1,599 $1,562 $1,510 $1,491 $1,471 3Q22 4Q22 1Q23 2Q23
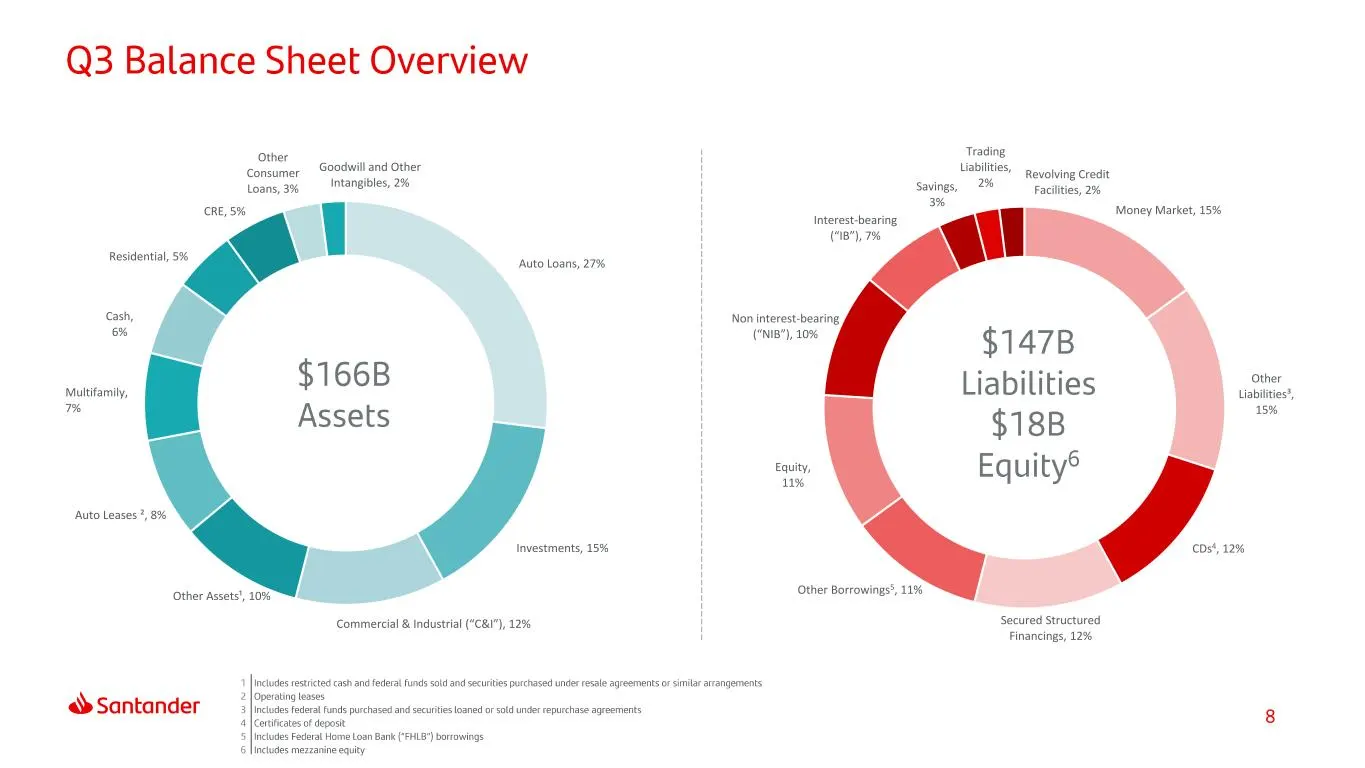
Slide 8: Liabilities and assets composition
Money Market, 15% Other Liabilities³, 15% CDs4, 12% Secured Structured Financings, 12% Other Borrowings5, 11% Equity, 11% Non interest-bearing (“NIB”), 10% Interest-bearing (“IB”), 7% Savings, 3% Trading Liabilities, 2% Revolving Credit Facilities, 2% Auto Loans, 27% Investments, 15% Commercial & In
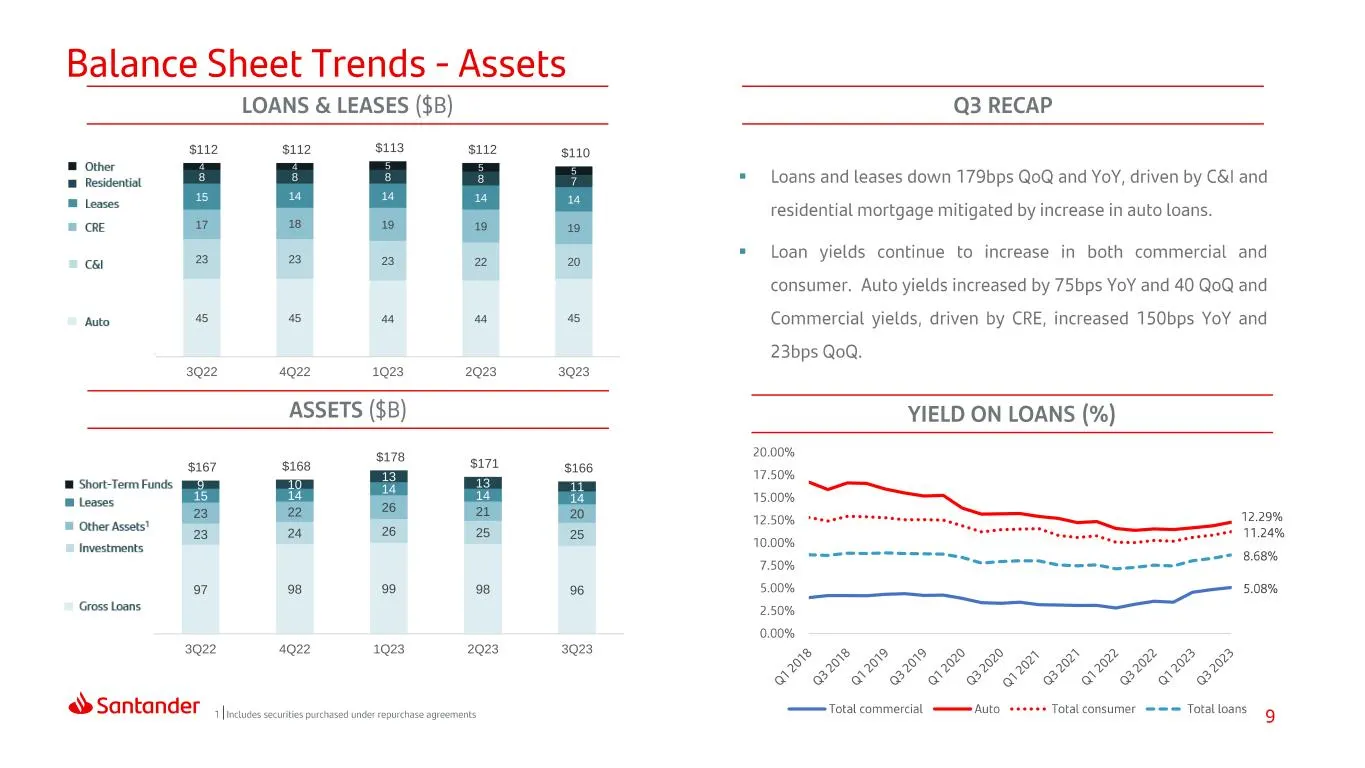
Slide 9: Loans and leases and total assets trends
▪ ▪ 45 45 44 44 45 23 23 23 22 20 17 18 19 19 19 15 14 14 14 14 8 8 8 8 7 4 4 5 5 5 $112 $112 $113 $112 $110 3Q22 4Q22 1Q23 2Q23 3Q23 97 98 99 98 96 23 24 26 25 25 23 22 26 21 20 15 14 14 14 14 9 10 13 13 11 $167 $168 $178 $171 $166 3Q22 4Q22 1Q23 2Q23 3Q23
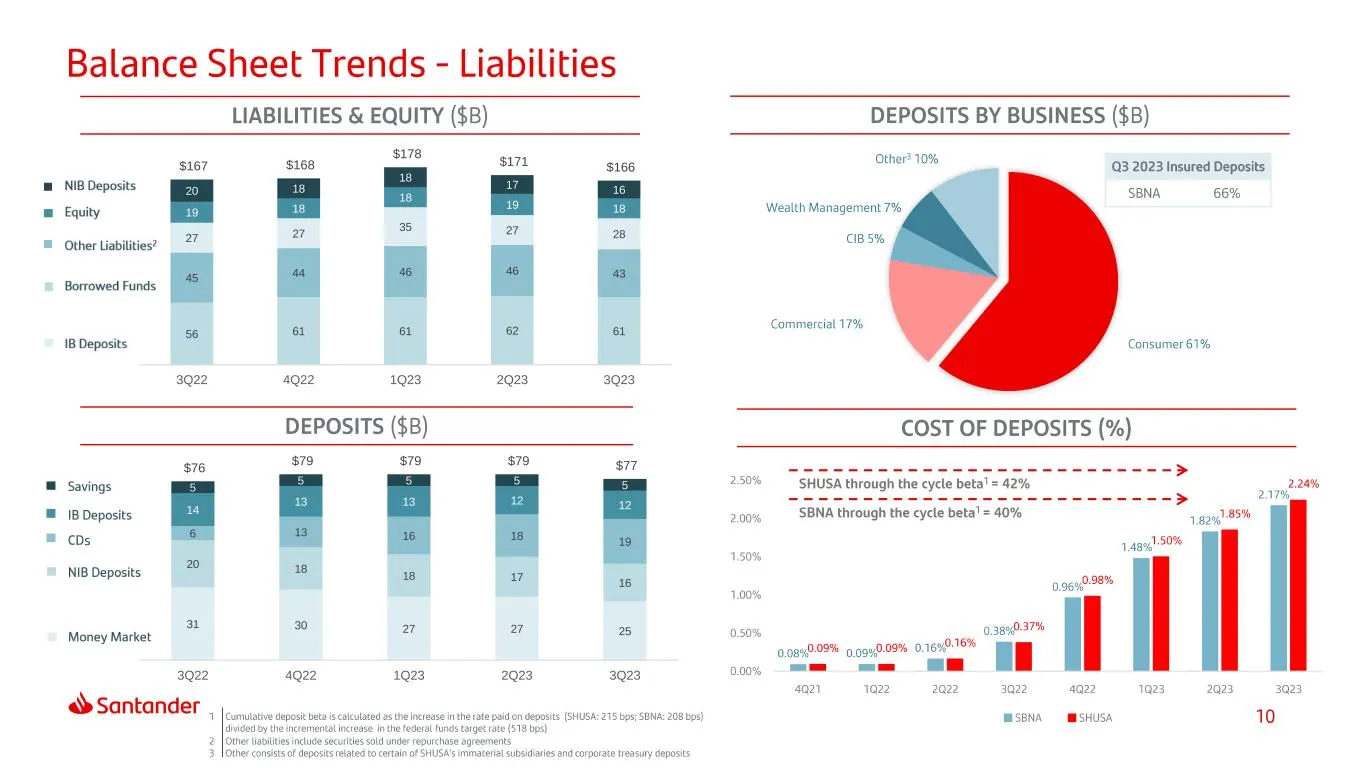
Slide 10: Deposits and funding trends
56 61 61 62 61 45 44 46 46 43 27 27 35 27 28 19 18 18 19 18 20 18 18 17 16 $167 $168 $178 $171 $166 3Q22 4Q22 1Q23 2Q23 3Q23 31 30 27 27 25 20 18 18 17 16 6 13 16 18 19 14 13 13 12 12 5 5 5 5 5 $76 $79 $79 $79 $77 3Q22 4Q22 1Q23 2Q23 3Q23
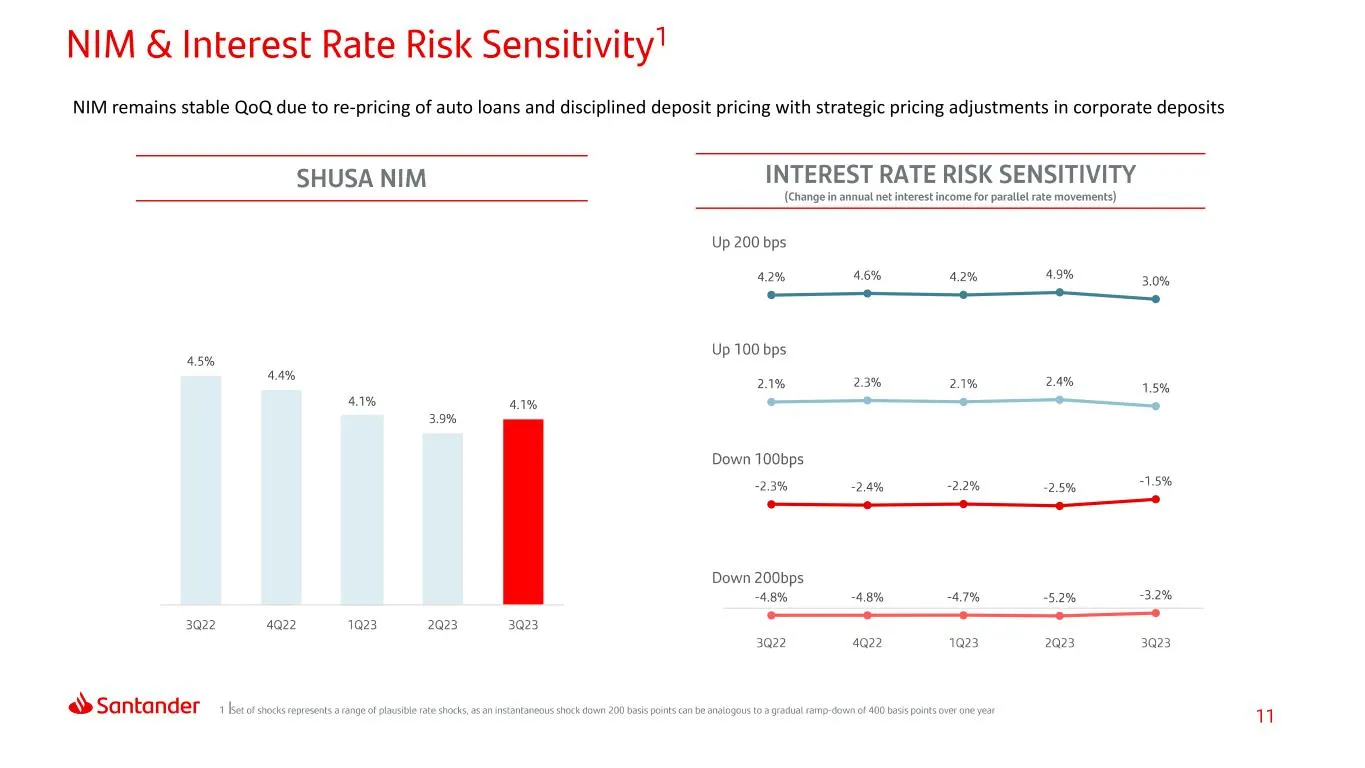
Slide 11: NIM remains stable QoQ due to re-pricing of auto loans
NIM remains stable QoQ due to re-pricing of auto loans and disciplined deposit pricing with strategic pricing adjustments in corporate deposits
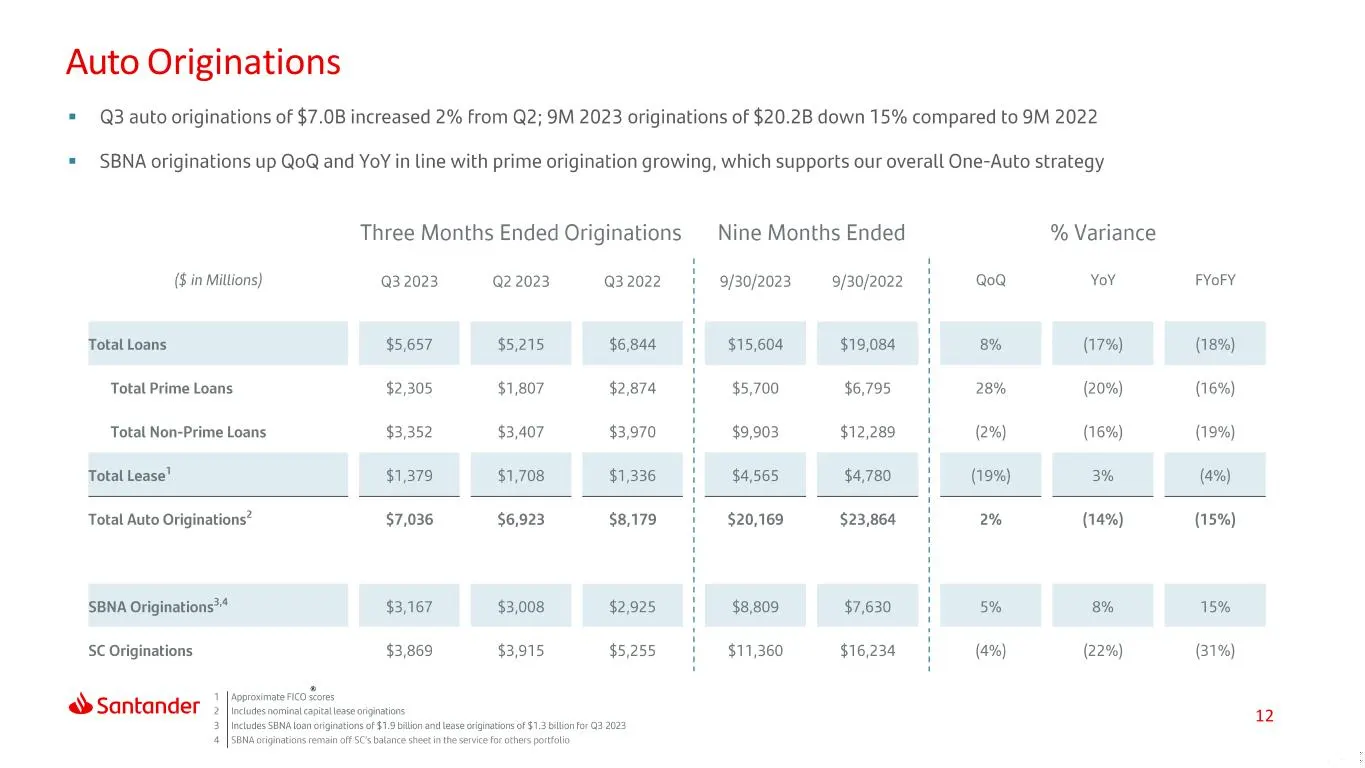
Slide 12: Auto Originations
Auto Originations = Q3 auto originations of $7.0B increased 2% from Q2; 9M 2023 originations of $20.2B down 15% compared to 9M 2022 = SBNA originations up QoQ and YoY in line with prime origination growing, which supports our overall One-Auto strategy Three Months Ended Originations = Nine Months En
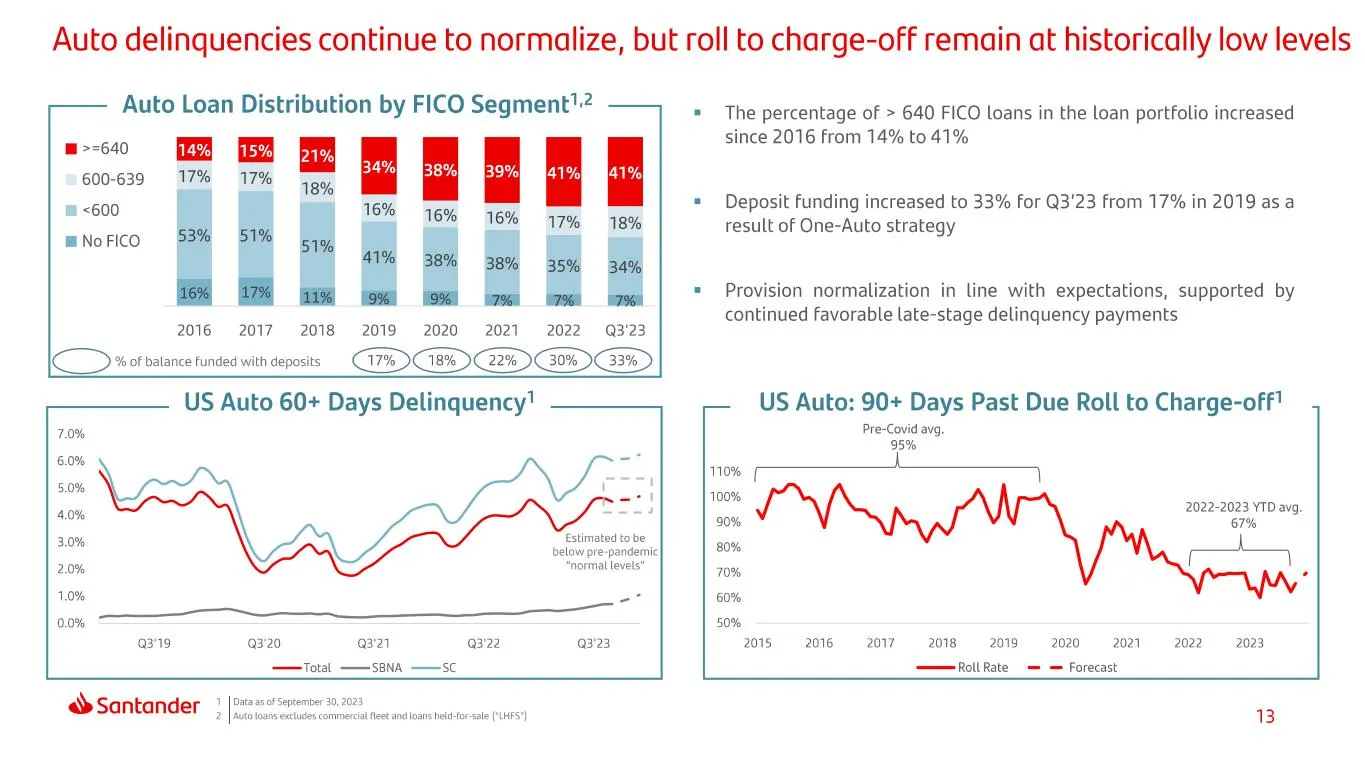
Slide 13: Auto delinquencies continue to normalize
Auto delinquencies continue to normalize, but roll to charge-off remain at historically low levels Auto Loan Distribution by FICO Segment? 3} 600-639 17% 17% 18% «The percentage of > 640 FICO loans in the loan portfolio increased since 2016 from 14% to 41% = Deposit funding increased to 33% For Q3'2
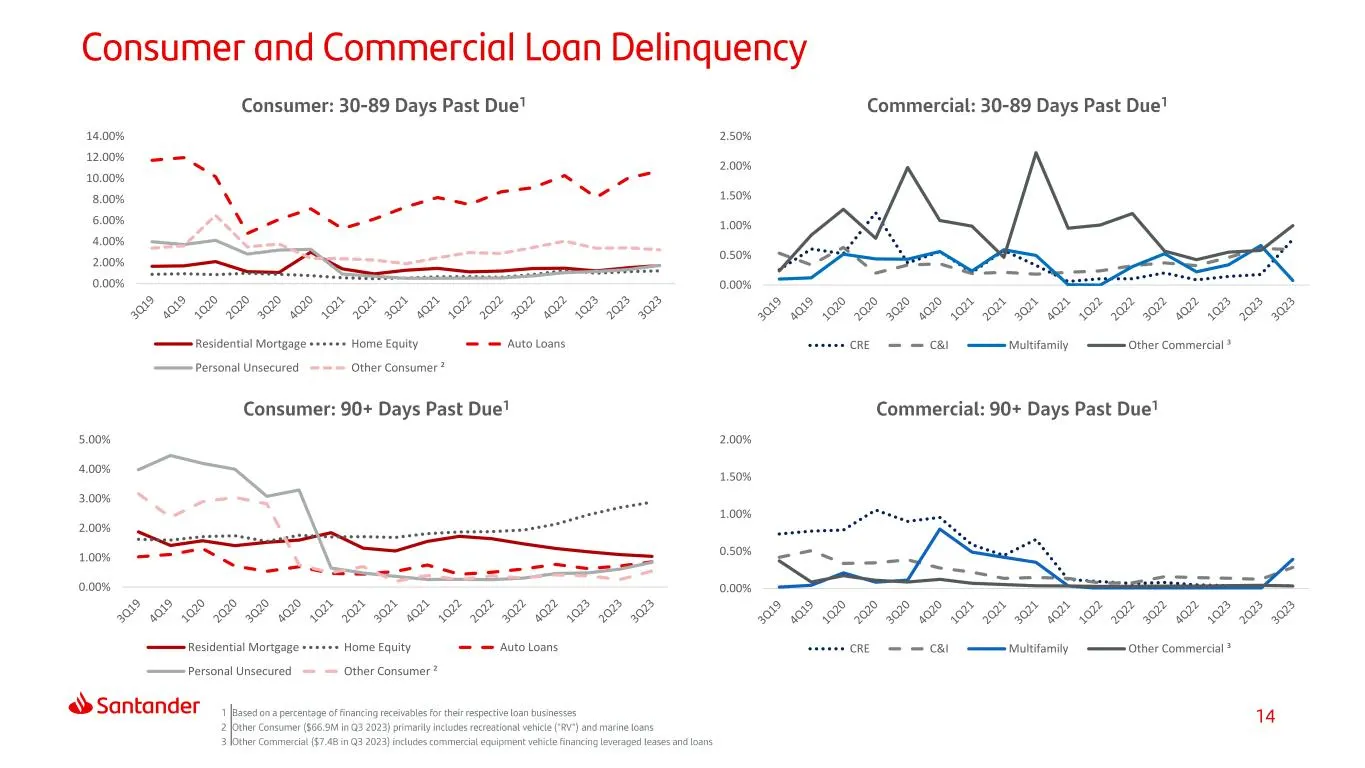
Slide 14: Delinquency and charge-off rates by loan type
0.00% 2.00% 4.00% 6.00% 8.00% 10.00% 12.00% 14.00% Residential Mortgage Home Equity Auto Loans Personal Unsecured Other Consumer ² 0.00% 1.00% 2.00% 3.00% 4.00% 5.00% Residential Mortgage Home Equity Auto Loans Personal Unsecured Other Consumer ² 0.00% 0.50% 1.00% 1.50% 2.00% CRE C&I Multifamily Oth
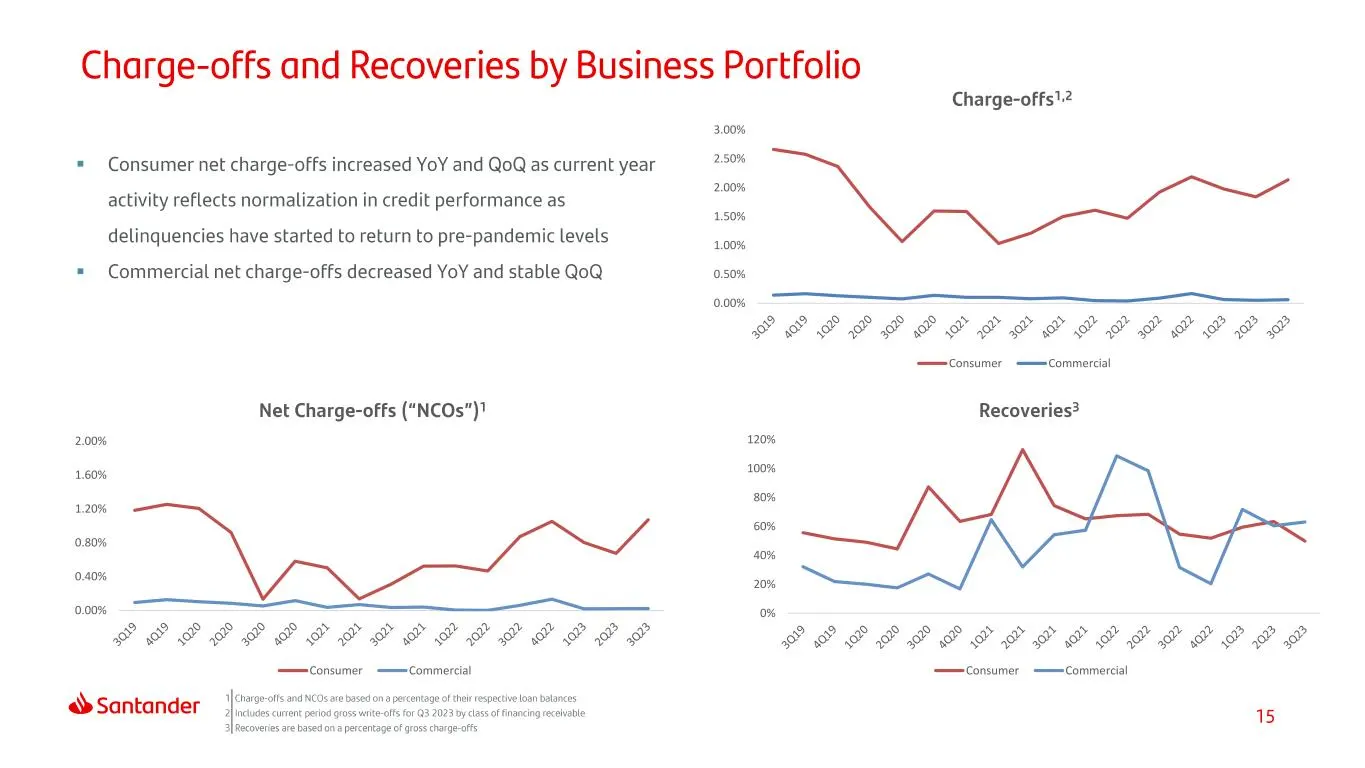
Slide 15: Consumer and commercial credit metrics
▪ ▪ 0.00% 0.40% 0.80% 1.20% 1.60% 2.00% Consumer Commercial 0% 20% 40% 60% 80% 100% 120% Consumer Commercial 0.00% 0.50% 1.00% 1.50% 2.00% 2.50% 3.00% Consumer Commercial
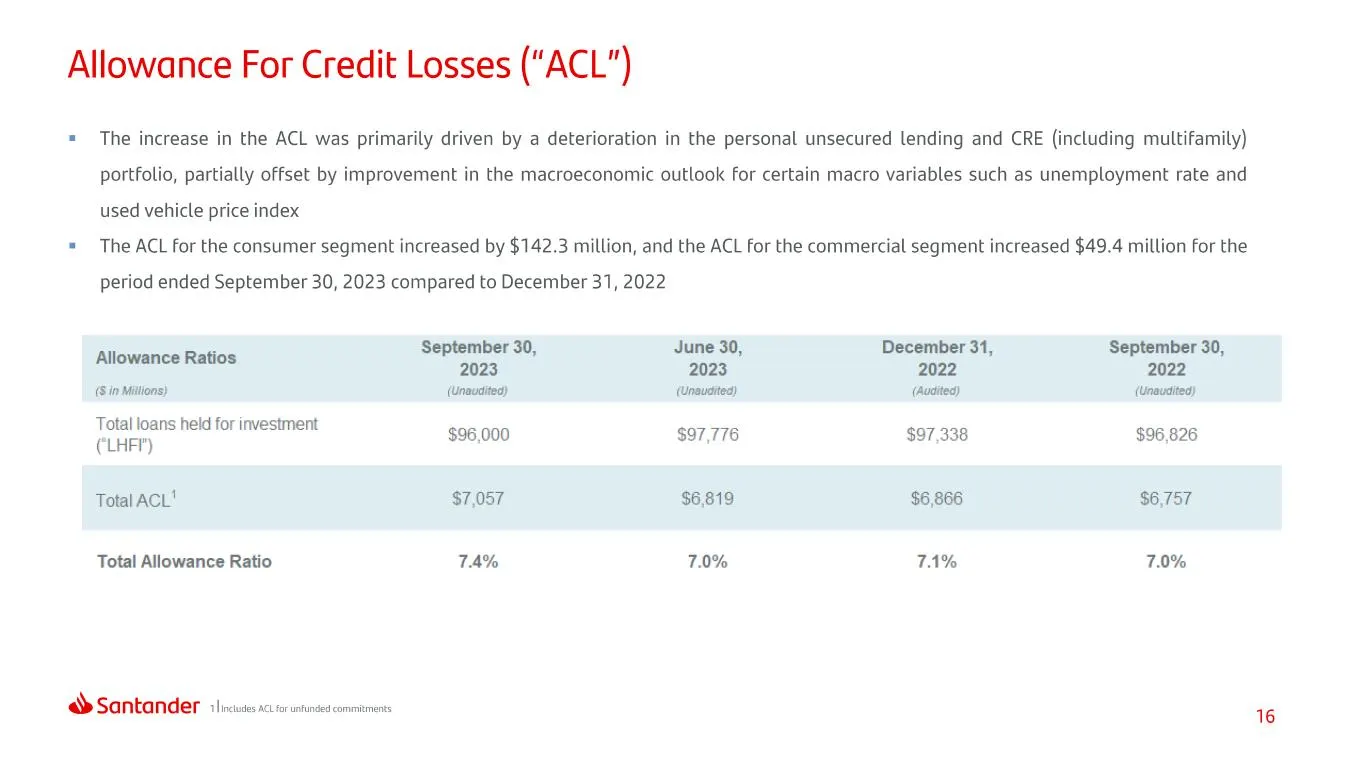
Slide 16: Allowance For Credit Losses ("ACL")
Allowance For Credit Losses ("ACL") = The increase in the ACL was primarily driven by a deterioration in the personal unsecured lending and CRE (including multifamily) portfolio, partially offset by improvement in the macroeconomic outlook for certain macro variables such as unemployment rate and us
Slide 17: Index
Index At a Glance Results Capital & ix Liquidity
Slide 18: Overall borrowings at SHUSA stable QoQ, contingent liquidity at SBNA increases
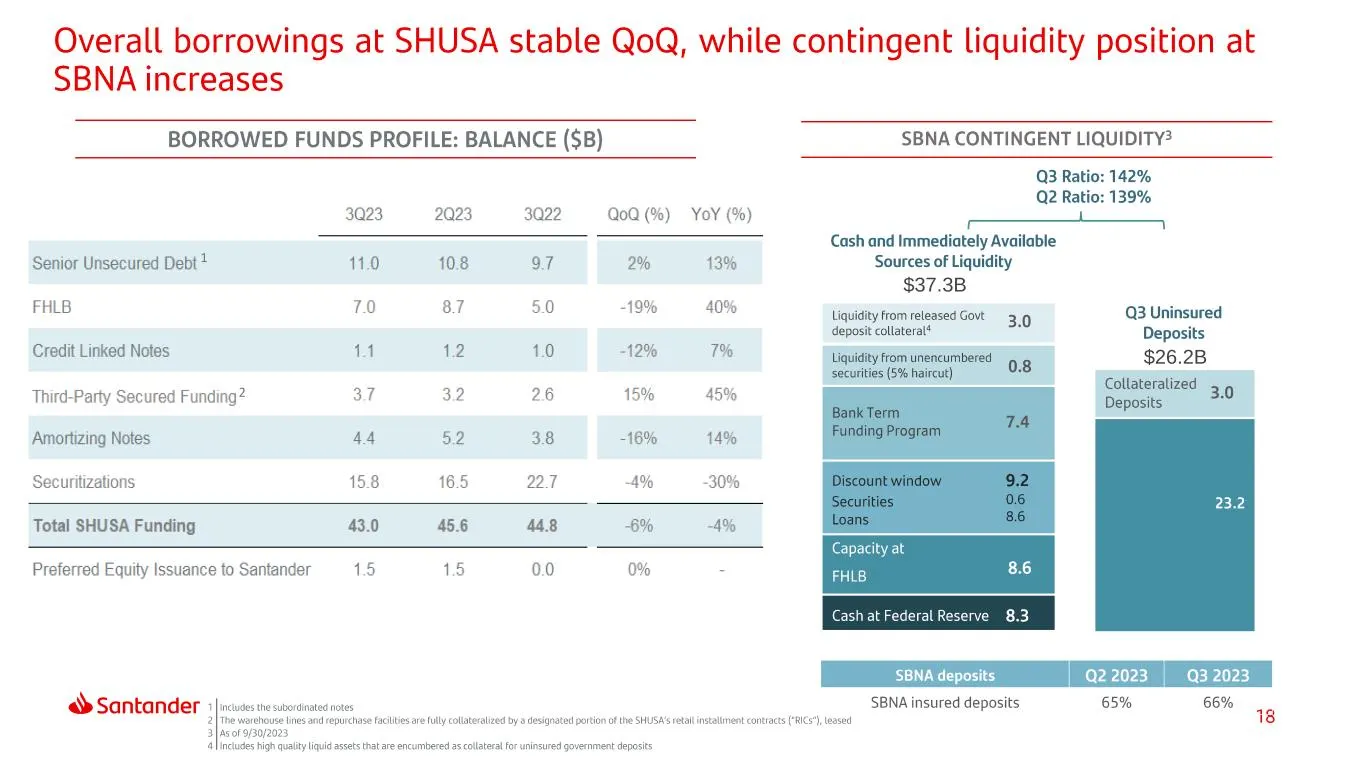
Overall borrowings at SHUSA stable QoQ, while contingent liquidity position at SBNA increases BORROWED FUNDS PROFILE: BALANCE ($B) SBNA CONTINGENT LIQUIDITY? Q3 Ratio: 142% Q2 Ratio: 139% 3023 2023 3022 Q0Q (%) YoY (%) Cash and Immediately Available Senior Unsecured Debt? 11.0 10.8 97 2% 13% Sources
Slide 19: Debt & Total Loss-Absorbing Capacity ("TLAC")
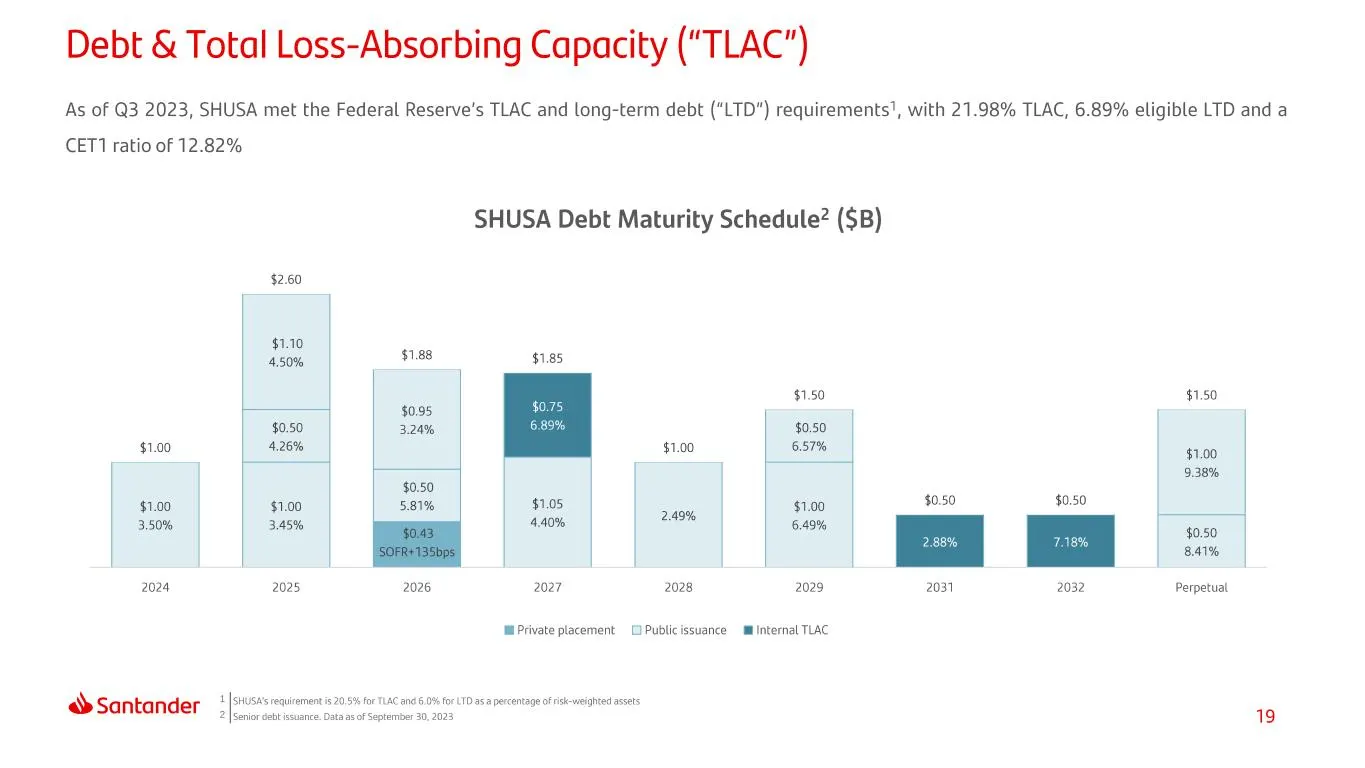
Debt & Total Loss-Absorbing Capacity (“TLAC") As of Q3 2023, SHUSA met the Federal Reserve's TLAC and long-term debt ("LTD") requirements’, with 21.98% TLAC, 6.89% eligible LTD and a CET1 ratio of 12.82% SHUSA Debt Maturity Schedule? ($B) $2.60 $1.10 4.50% $1.88 $1.85 $1.50 $1.50 $0.95 1 $0.50 | 3.2
Slide 20: Capital ratios trends
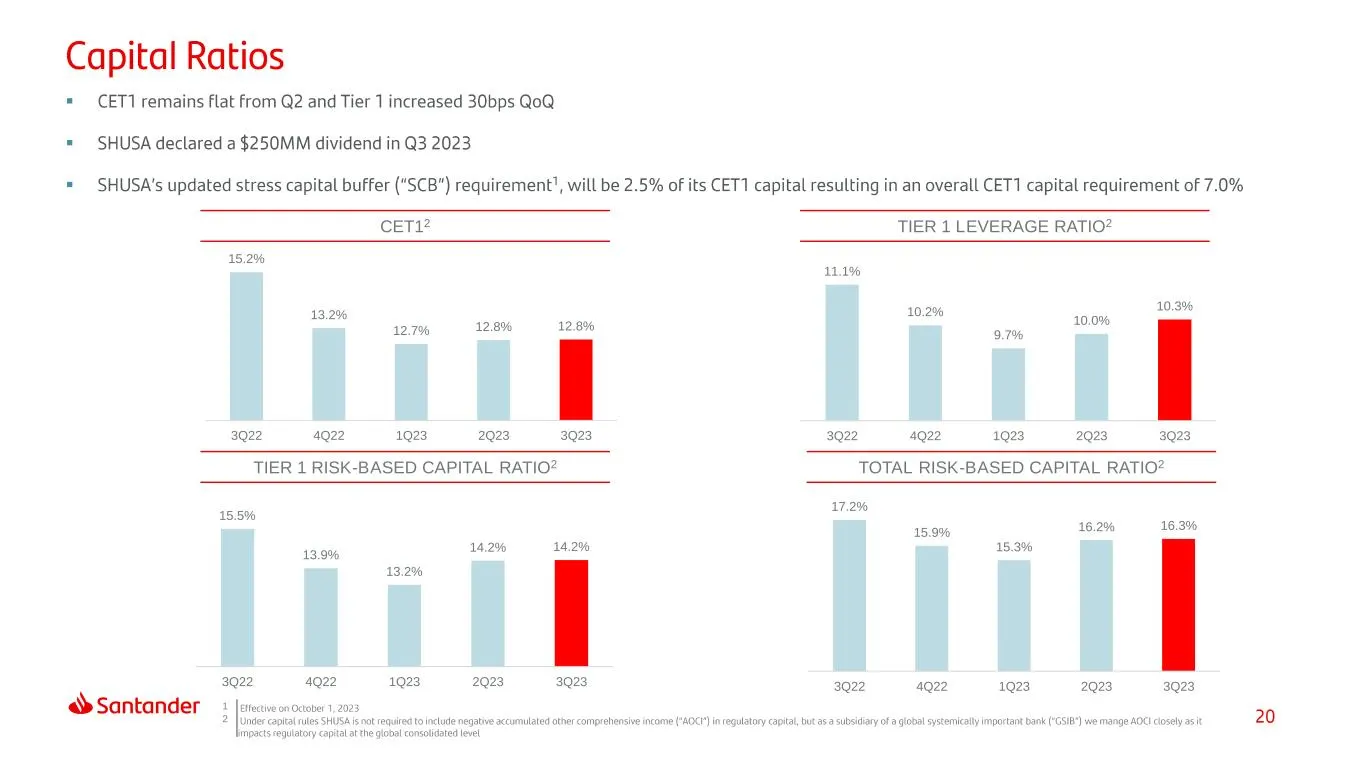
▪ ▪ ▪ CET12 TIER 1 RISK-BASED CAPITAL RATIO2 TOTAL RISK-BASED CAPITAL RATIO2 TIER 1 LEVERAGE RATIO2 1 2 15.2% 13.2% 12.7% 12.8% 12.8% 3Q22 4Q22 1Q23 2Q23 3Q23 11.1% 10.2% 9.7% 10.0% 10.3% 3Q22 4Q22 1Q23 2Q23 3Q23 15.5% 13.9% 13.2% 14.2% 14.2% 3Q22 4Q22 1Q23 2Q23 3Q23 17.2% 15.9% 15.3% 16.2% 16.3% 3Q
Slide 21: SHUSA Capital Ratios vs. Peer Group
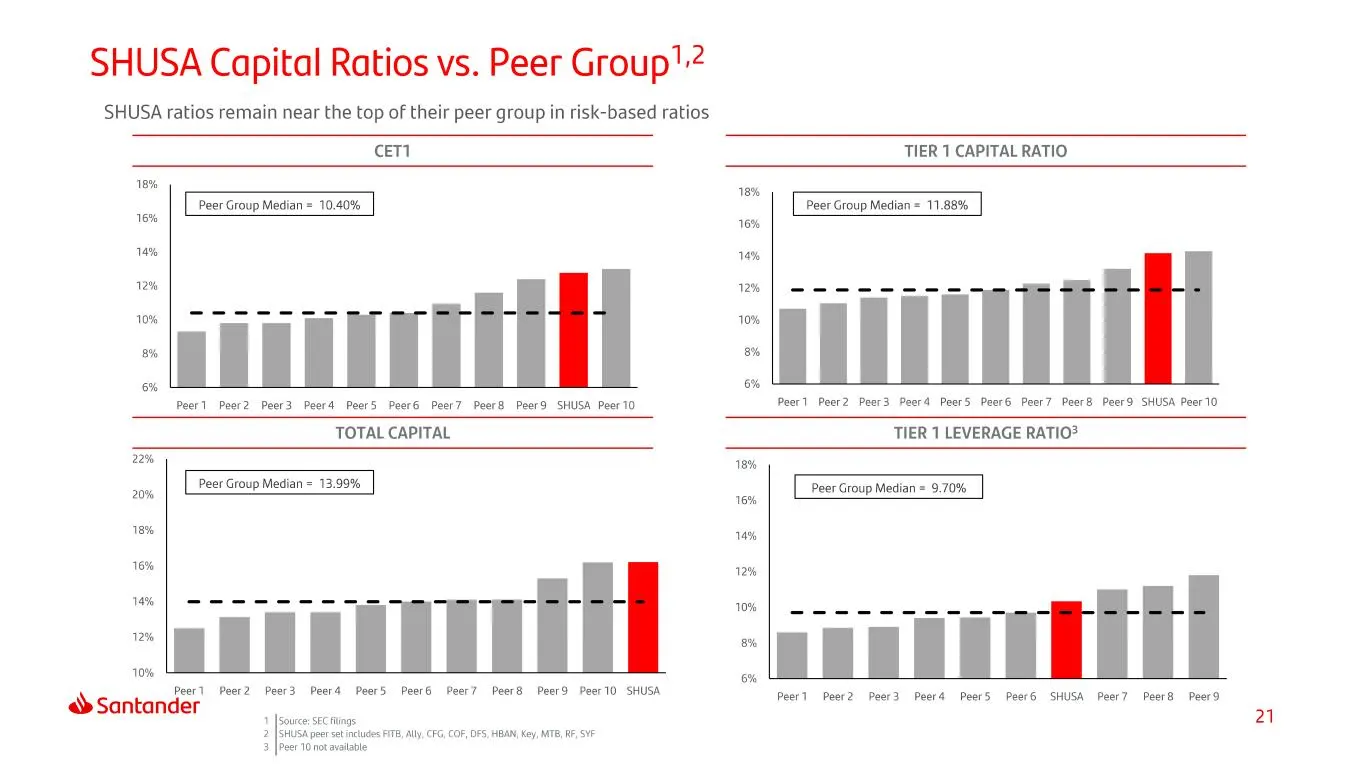
SHUSA Capital Ratios vs. Peer Group! SHUSA ratios remain near the top of their peer group in risk-based ratios CET TIER 1 CAPITAL RATIO 18% 16% 10% 12% 10% 8% 8% Peer Group Median = 10.40% Peerl Peer2 Peer3 Peer4 PeerS Peer6 Peer7 Peer8 Peer SHUSA Peer 10 18% 16% 14% 12% 10% 8% 6% Peer Group Median
Slide 22: Senior debt ratings by Santander entity
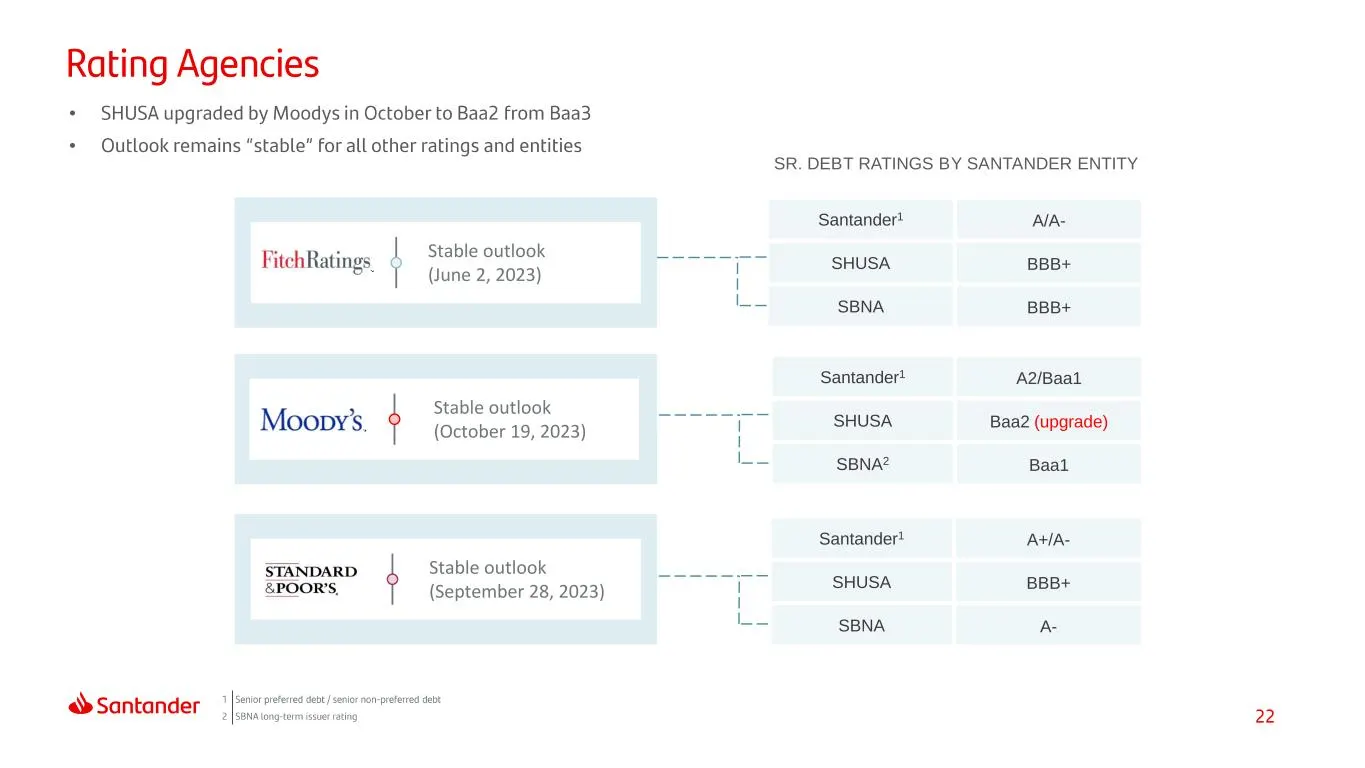
Santander1 A2/Baa1 SHUSA Baa2 (upgrade) SBNA2 Baa1 Santander1 A+/A- SHUSA BBB+ SBNA A- Stable outlook (June 2, 2023) • • SR. DEBT RATINGS BY SANTANDER ENTITY Santander1 A/A- SHUSA BBB+ SBNA BBB+ Stable outlook (October 19, 2023) Stable outlook (September 28, 2023)
Slide 23: Index
Index At a Glance Results Capital & Appendix Liquidity
Slide 24: SHUSA subsidiaries and locations
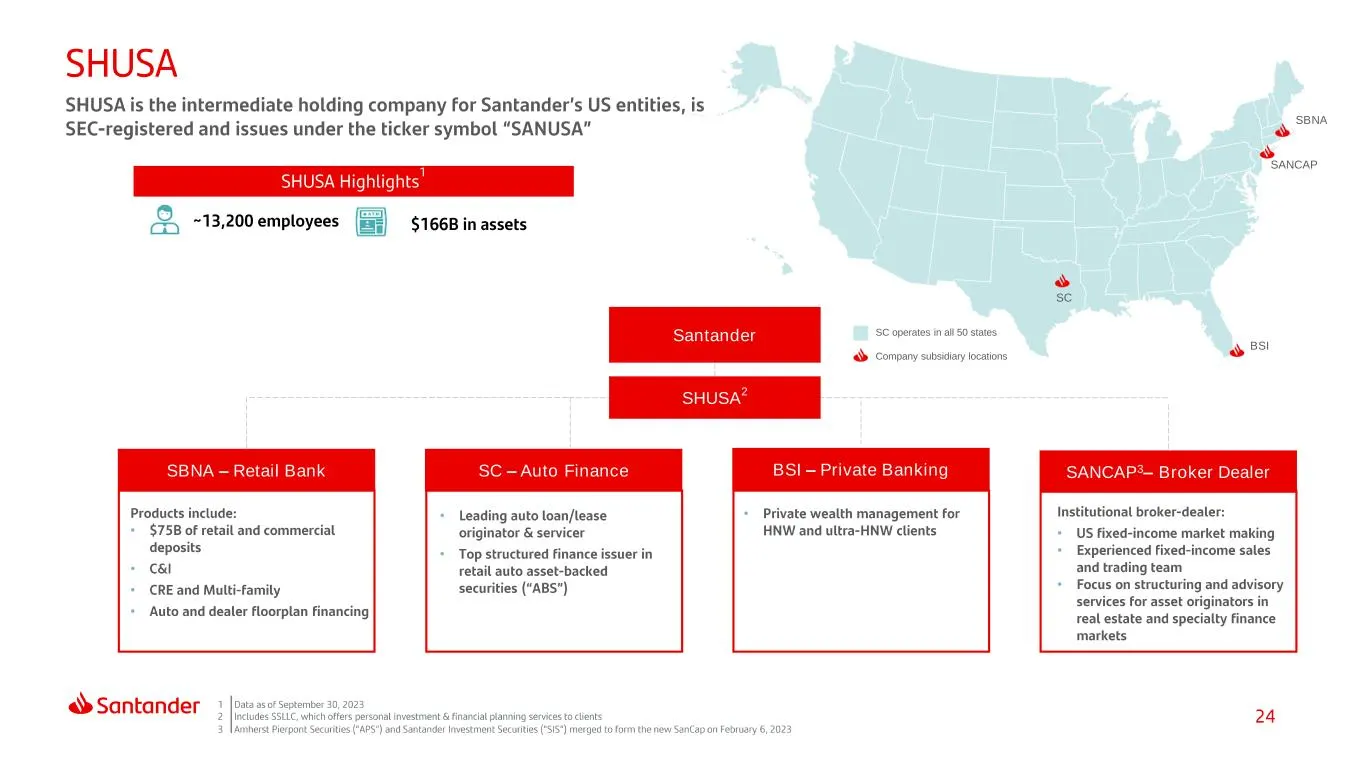
SBNA – Retail Bank SC – Auto Finance BSI – Private Banking SANCAP3– Broker Dealer • • • • • • • • • • SHUSA 2 Santander SC operates in all 50 states Company subsidiary locations SC BSI SBNA SANCAP
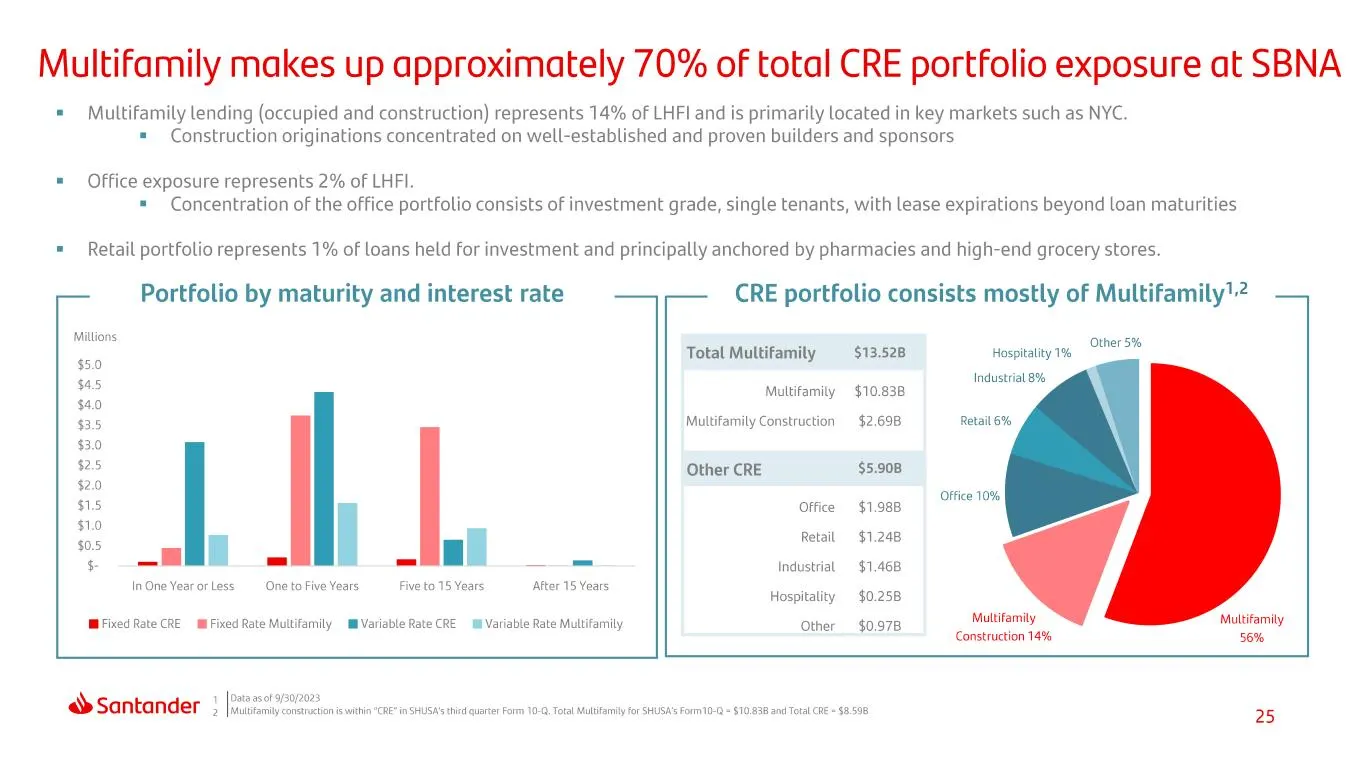
Slide 25: Multifamily makes up approximately 70% of total CRE portfolio exposure at SBNA
Multifamily makes up approximately 70% of total CRE portfolio exposure at SBNA = Multifamily lending (occupied and construction) represents 14% of LHFI and is primarily located in key markets such as NYC. = Construction originations concentrated on well-established and proven builders and sponsors *
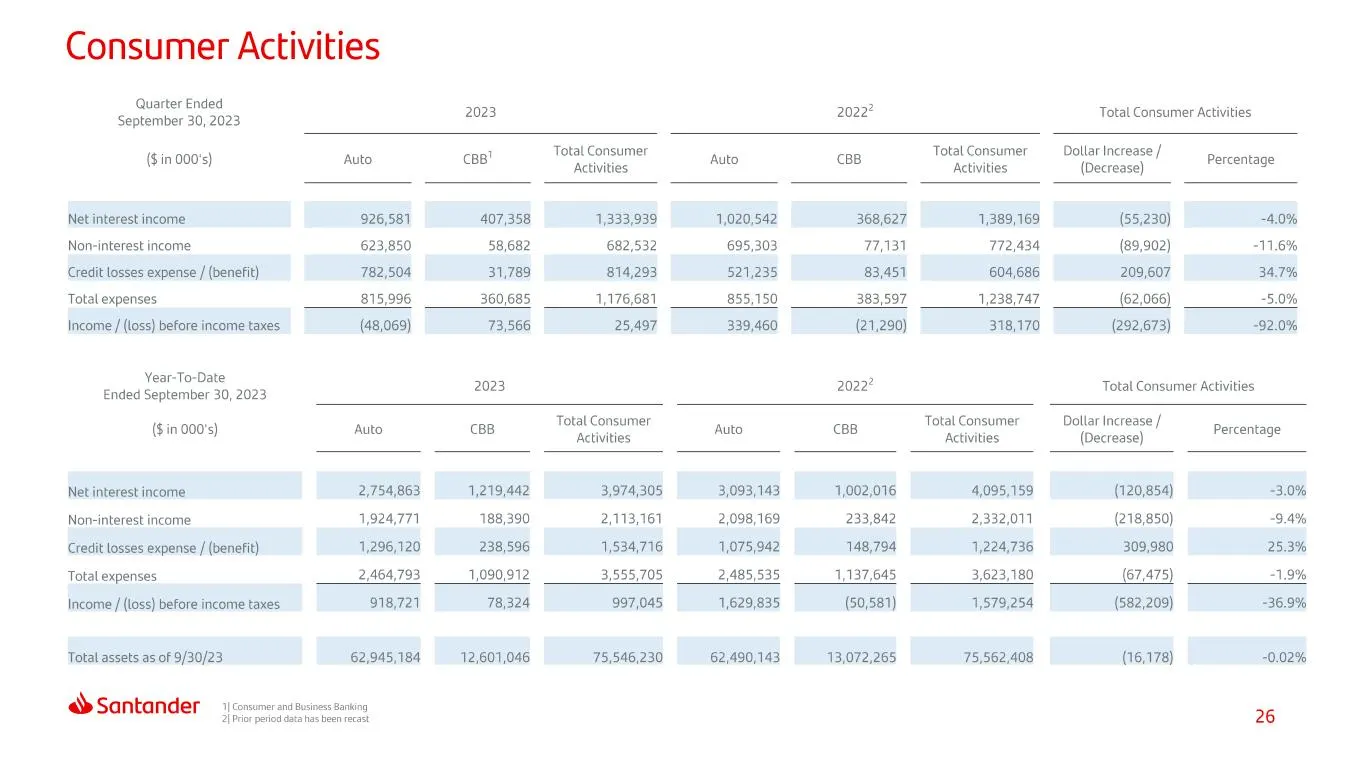
Slide 26: Consumer Activities
Consumer Activities Quarter Ended September 30, 2023 ($in 000's) Net interest income Non-interest income Credit losses expense / (benefit) Total expenses Income / (loss) before income taxes Year-To-Date Ended September 30, 2023 ($in 00's) Net interest income Non-interest income Credit losses expense
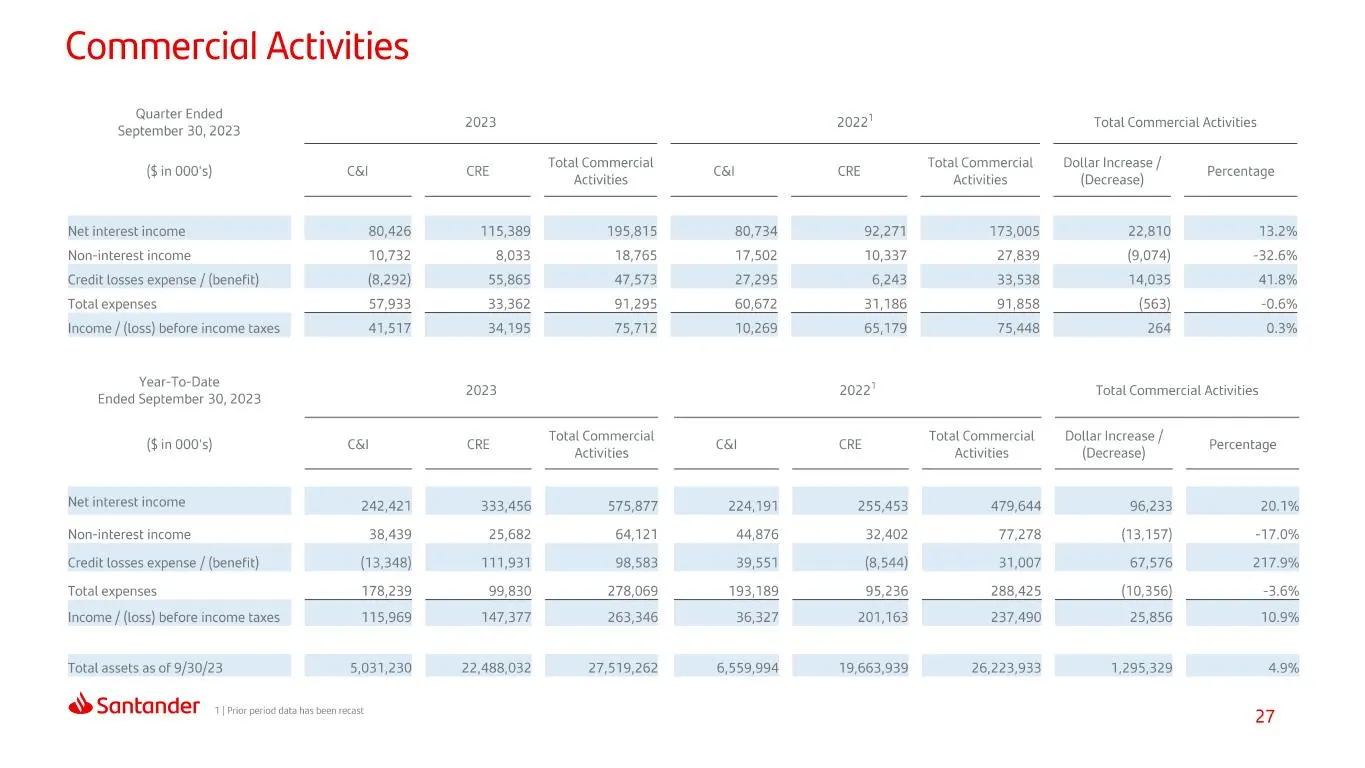
Slide 27: Commercial Activities
Commercial Activities Quarter Ended September 30, 2023 ($ in 000's) Net interest income Non-interest income Credit losses expense / (benefit) Total expenses Income / (loss) before income taxes Year-To-Date Ended September 30, 2023 ($in 000's) Net interest income Non-interest income Credit losses exp
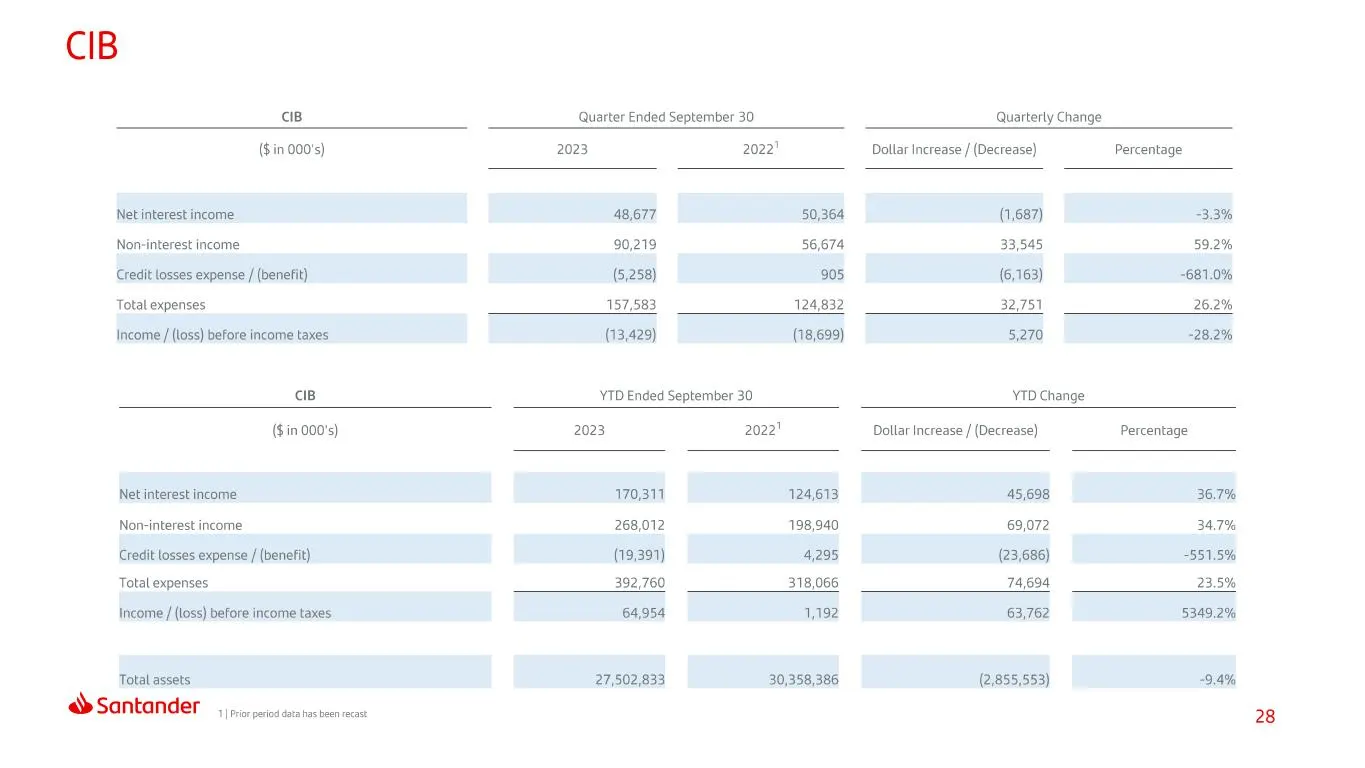
Slide 28: CIB
CIB cB Quarter Ended September 30 Quarterly Change ($in 00's) 2023 2022" Dollar increase / (Decrease) Percentage Non-interest income 90,219 56,674 33,545 59.2% Total ~~ 157,583 124,832 32,751 26.2% cB YTD Ended September 30 YTD Change, (Sin 000's) 2023 2022" Dollar Increase / (Decrease) Percentage N
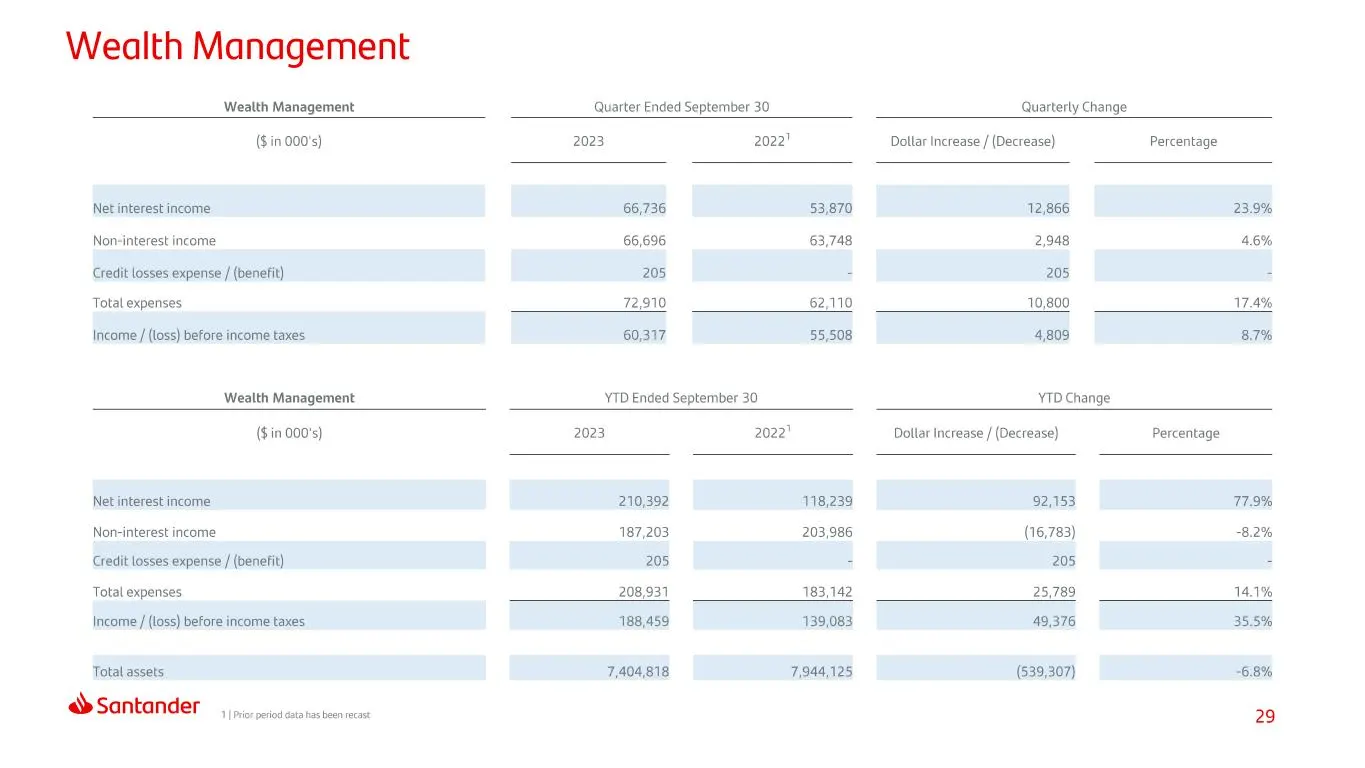
Slide 29: Wealth Management
Wealth Management Wealth Management Quarter Ended September 30 Quarterly Change ($in 00's) 2023 2022" Doltar Increase / (Decrease) Percentage Non-interest income 66,696 63,748 2,948 46% Total: ~~ 72,910 62,110 10,800 17.4% Wealth Management YTD Ended September 30 YTD Change ($in 00's) 2023 2022" Dol
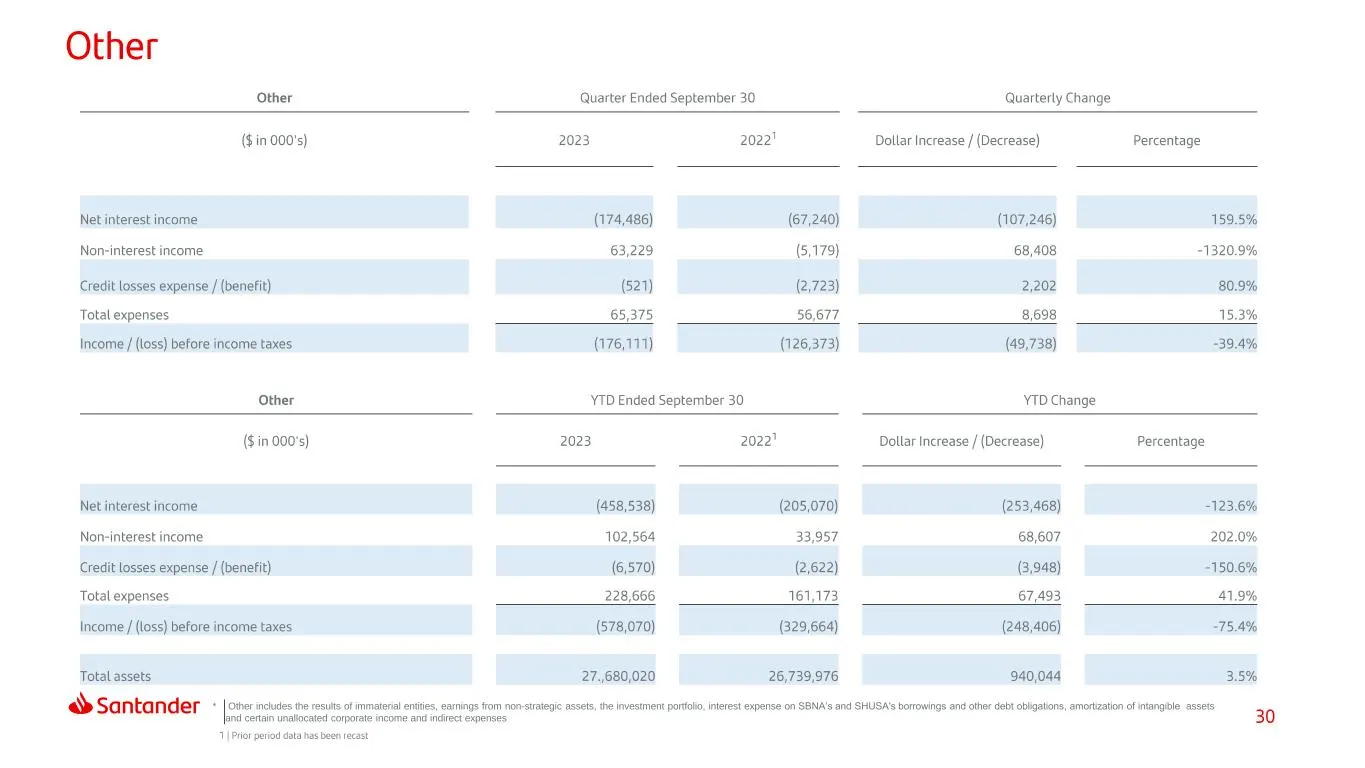
Slide 30: Other segment definition
* Other includes the results of immaterial entities, earnings from non-strategic assets, the investment portfolio, interest expense on SBNA’s and SHUSA's borrowings and other debt obligations, amortization of intangible .assets and certain unallocated corporate income and indirect expenses
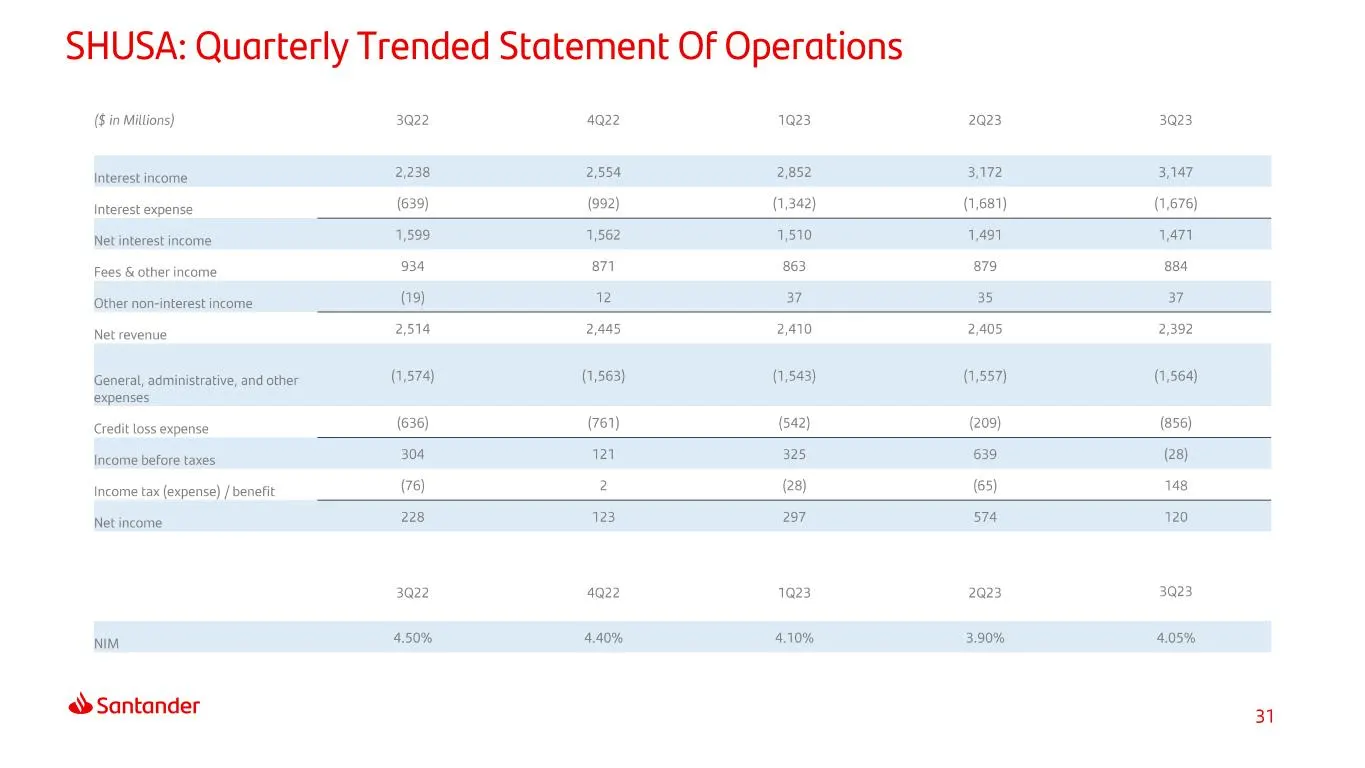
Slide 31: SHUSA: Quarterly Trended Statement Of Operations
SHUSA: Quarterly Trended Statement Of Operations ( in Mitions) Interest income Interest expense Net interest income Fees & other income Other non-interest income Net revenue General, administrative, and other expenses Credit loss expense Income before taxes Income tax (expense) / benefit Net income
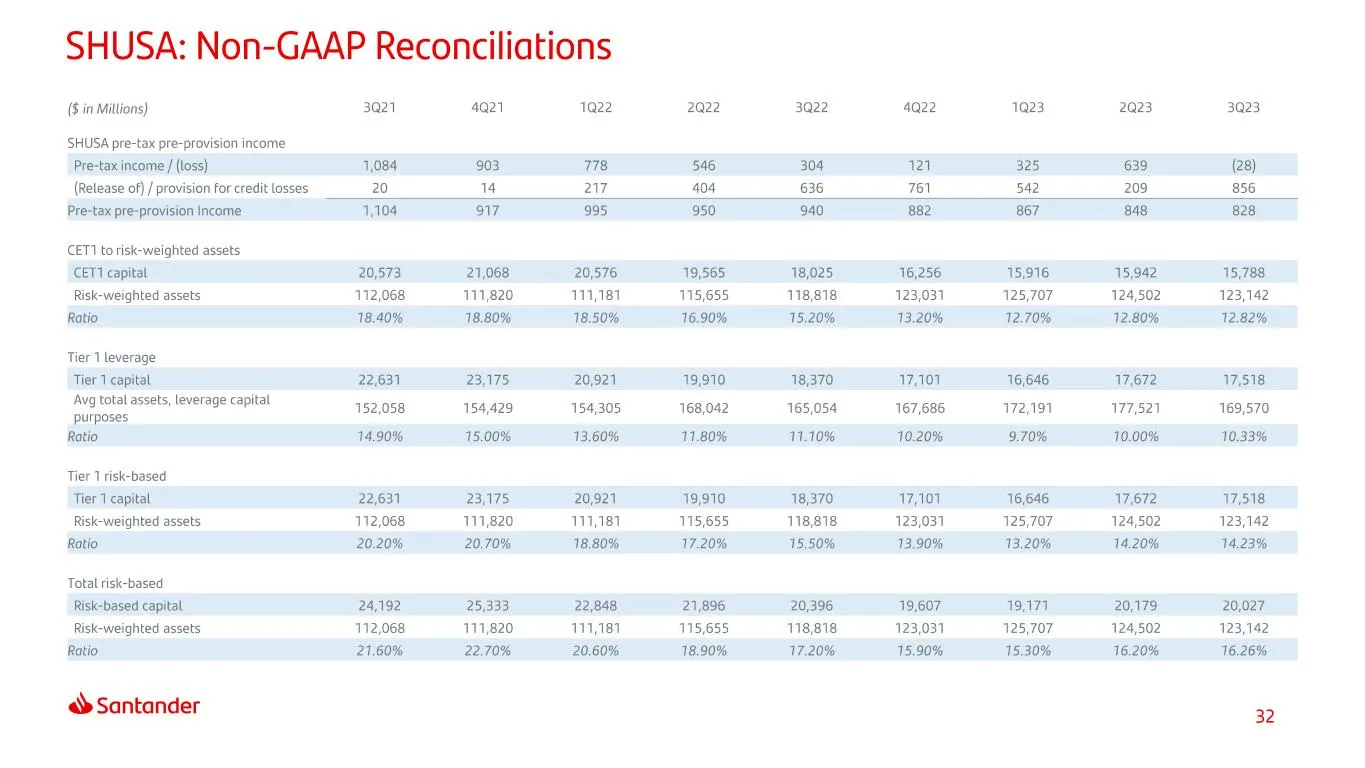
Slide 32: SHUSA: Non-GAAP Reconciliations
SHUSA: Non-GAAP Reconciliations (in Mitions) 3021 421 1922 2022 3022 4022 1023 2023 3023 SHUSA pre-tax pre-provision income Pretax income / (loss) 7,084 903 78 546 304 71 325 639 (28) (Release of) / provision for credit losses 20 4 217 404 636 761 542 209 856 Pre-tax pre-provision Income 7,104 917 9
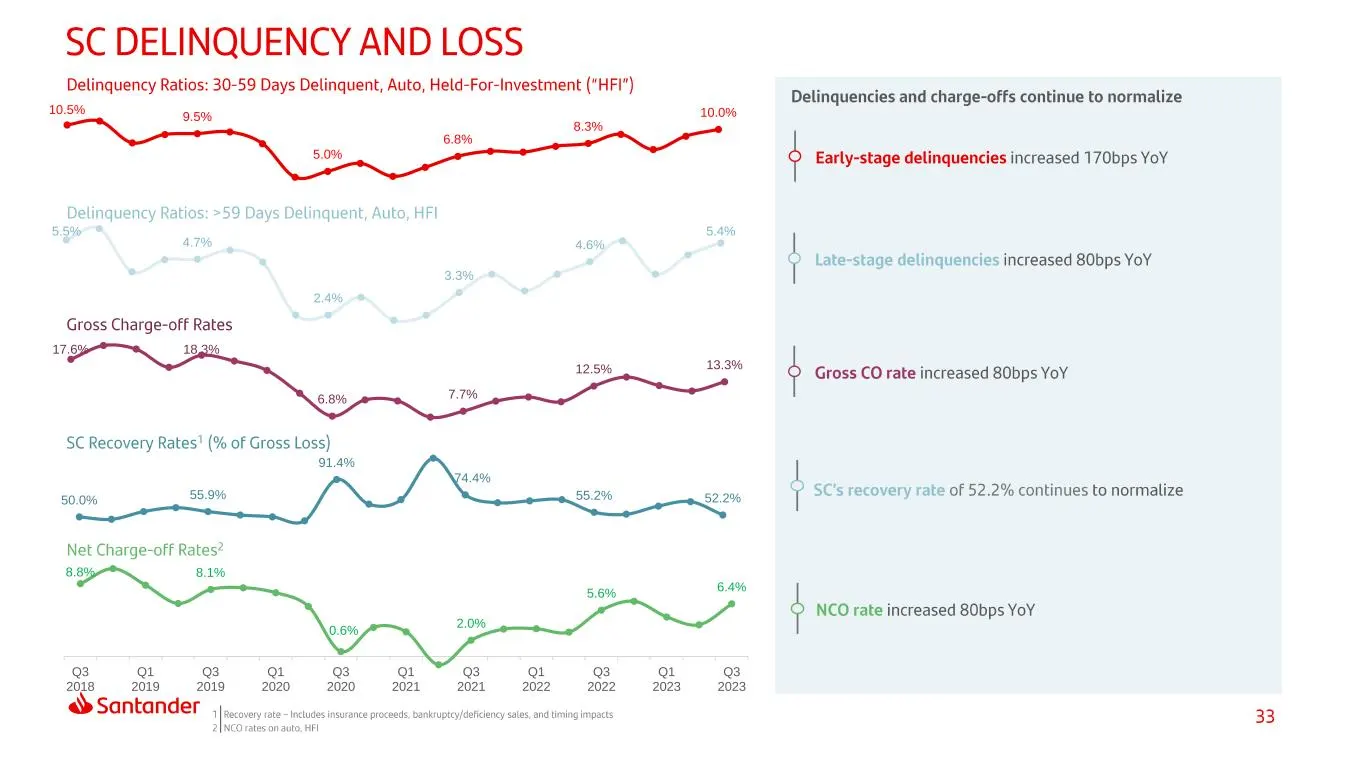
Slide 33: 10.5% 9.5% 5.0% 6.8% 8.3% 10.0% 5.5% 4.7% 2.4% 3.3% 4.6% 5.4% 17.6% 18.3%
10.5% 9.5% 5.0% 6.8% 8.3% 10.0% 5.5% 4.7% 2.4% 3.3% 4.6% 5.4% 17.6% 18.3% 6.8% 7.7% 12.5% 13.3% 50.0% 55.9% 91.4% 74.4% 55.2% 52.2% 8.8% 8.1% 0.6% 2.0% 5.6% 6.4% Q3 2018 Q1 2019 Q3 2019 Q1 2020 Q3 2020 Q1 2021 Q3 2021 Q1 2022 Q3 2022 Q1 2023 Q3 2023

Slide 34: Thank You.
Thank You. Our purpose is to help people and businesses prosper. Our culture is based on believing that everything we do should be: Simple Personal Fair, «Santander Dow Jones Sustainability Indices Incotiaboration with RobecoSAM «> FTSE4Good
Source: SEC EDGAR · 8-K filed Nov 3, 2023
More decks from Santander Holdings USA Inc
 Debt Investor Presentation (August 2026)30 slides · Aug 12, 2026
 Debt Investor Presentation (August 2026)30 slides · Aug 12, 2026
 Debt Investor Presentation (June 2026)29 slides · Jun 12, 2026
 Debt Investor Presentation (June 2026)29 slides · Jun 12, 2026
 Debt Investor Presentation (March 2026)36 slides · Mar 6, 2026
 Debt Investor Presentation (March 2026)36 slides · Mar 6, 2026