Altabancorp — People's Utah Bancorp — Investor Presentation (February 2017)
28 slides from Altabancorp's investor presentation, Feb 1, 2017

Slide 1: Investor Presentation February 2017
Investor Presentation February 2017 Richard Beard, President & CEO Wolf Muelleck, EVP & CFO
Slide 2: Safe Harbor
This presentation contains forward-looking statements within the meaning of the Private Securities Litigation Reform Act of 1995. These forward-looking statements are subject to risks and uncertainties, including, but not limited to: •The credit and concentration risks of our lending activities; •Ch
Slide 3: People's Utah Bancorp Overview
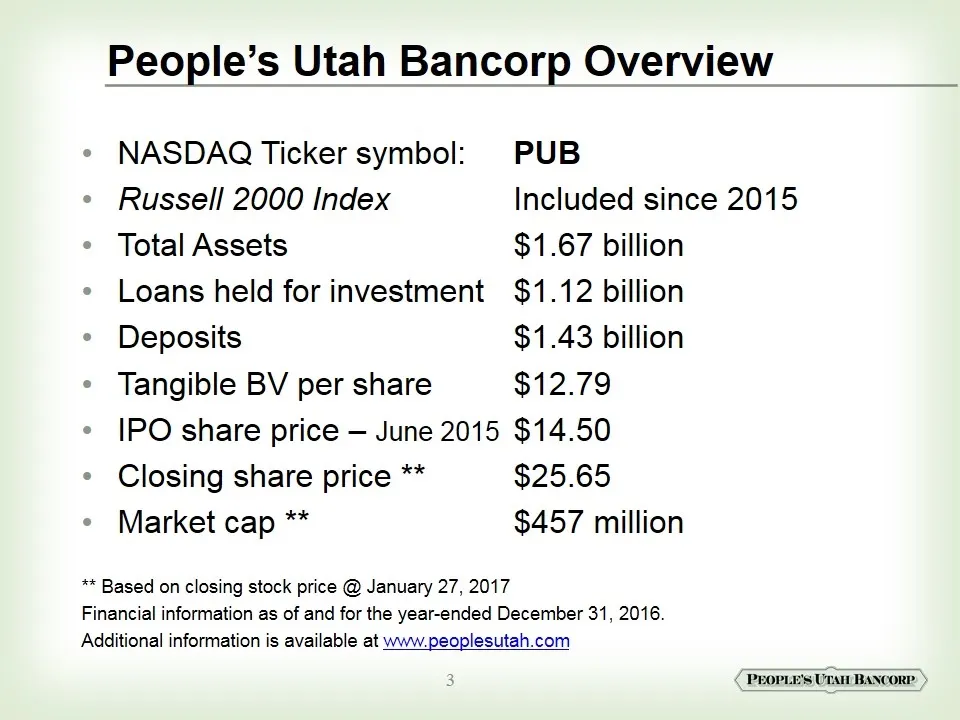
NASDAQ Ticker symbol: PUB Russell 2000 IndexIncluded since 2015 Total Assets$1.67 billion Loans held for investment$1.12 billion Deposits$1.43 billion Tangible BV per share$12.79 IPO share price – June 2015$14.50 Closing share price **$25.65 Market cap **$457 million ** Based on closing stock price
Slide 4: Franchise Overview
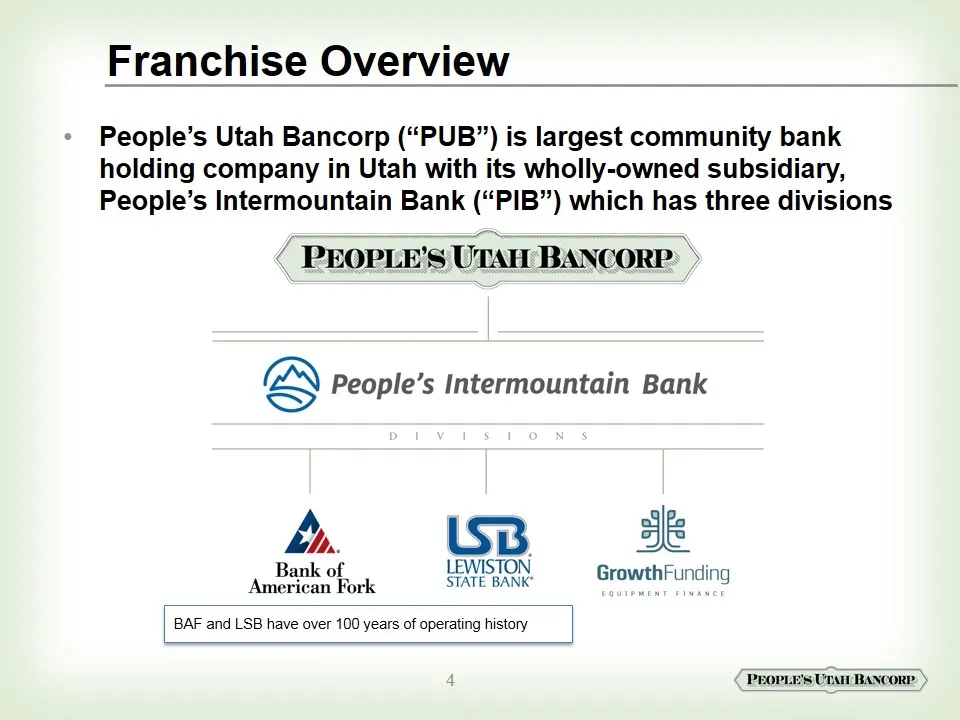
People’s Utah Bancorp (“PUB”) is largest community bank holding company in Utah with its wholly-owned subsidiary, People’s Intermountain Bank (“PIB”) which has three divisions Franchise Overview BAF and LSB have over 100 years of operating history
Slide 5: Franchise Overview - Continued
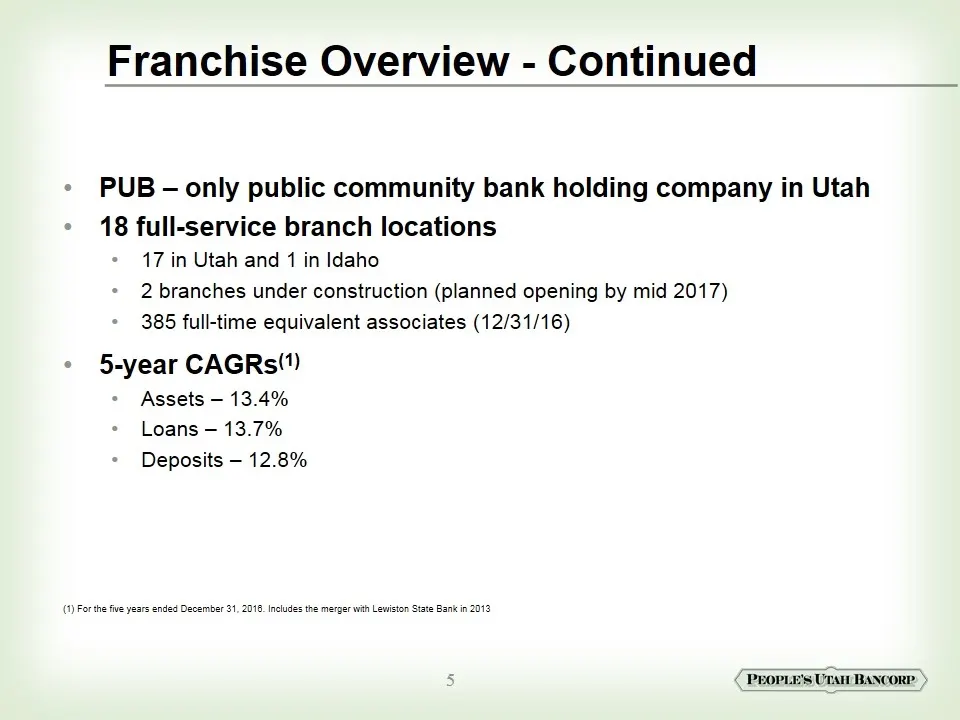
PUB – only public community bank holding company in Utah 18 full-service branch locations 17 in Utah and 1 in Idaho 2 branches under construction (planned opening by mid 2017) 385 full-time equivalent associates (12/31/16) 5-year CAGRs(1) Assets – 13.4% Loans – 13.7% Deposits – 12.8% Franchise Overv
Slide 6: Our Target Markets
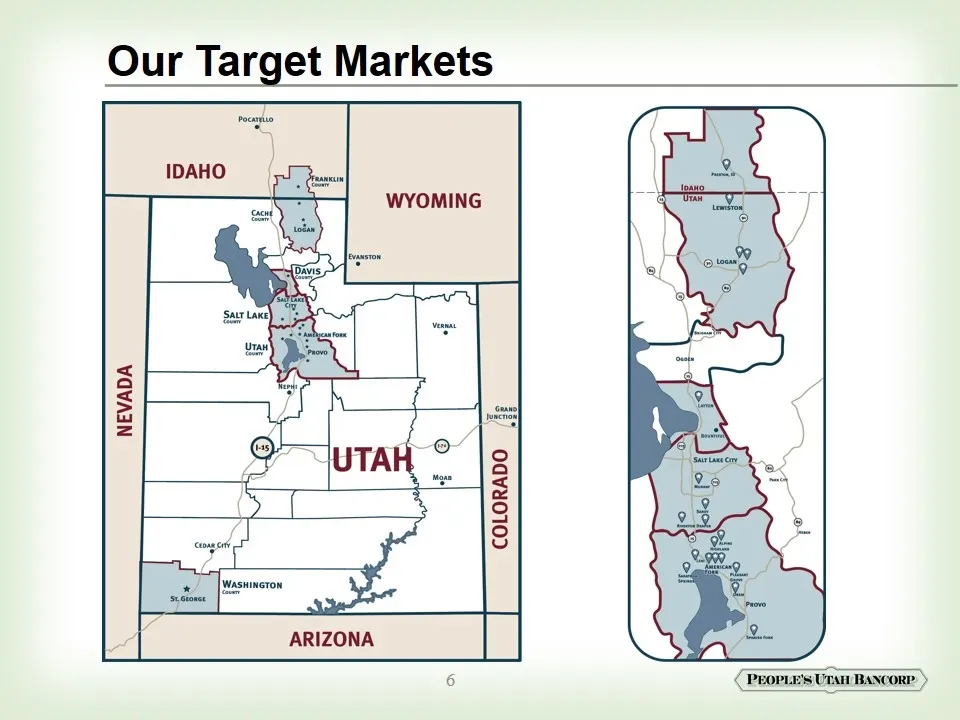
Our Target Markets IDAHO (ar a WYoMING a <= é s z © UTAH © |e “$s g sed 8 a |. ARIZONA 6 PEOPLE's Una BaNcorP
Slide 7: Utah Deposit Market Share
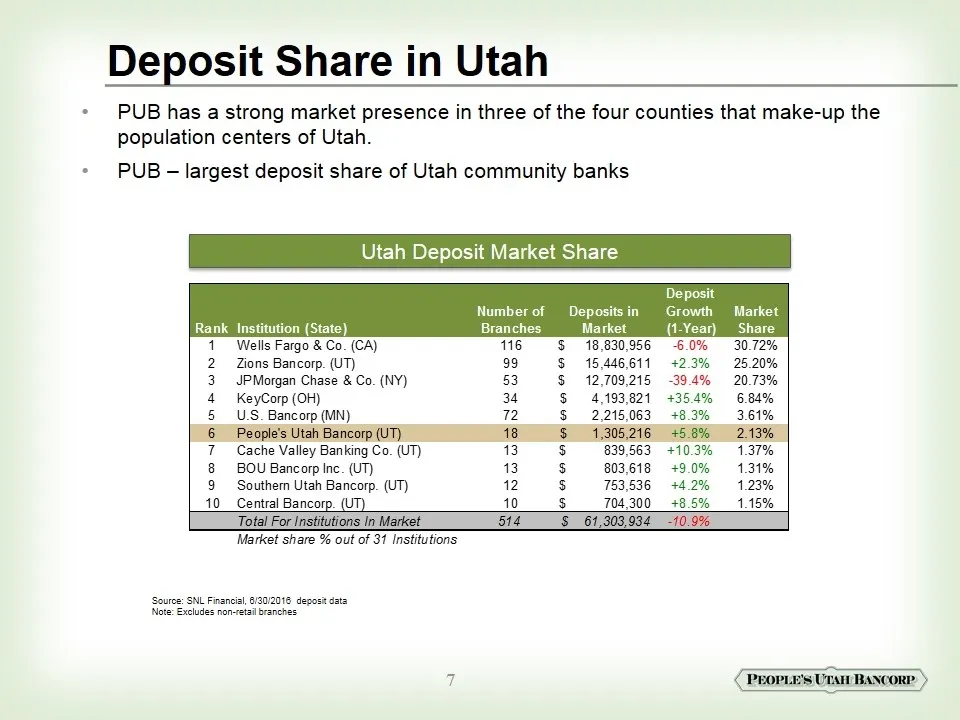
PUB has a strong market presence in three of the four counties that make-up the population centers of Utah. PUB – largest deposit share of Utah community banks Deposit Share in Utah Utah Deposit Market Share Source: SNL Financial, 6/30/2016 deposit data Note: Excludes non-retail branches
Slide 8: Strong Dynamics in Utah
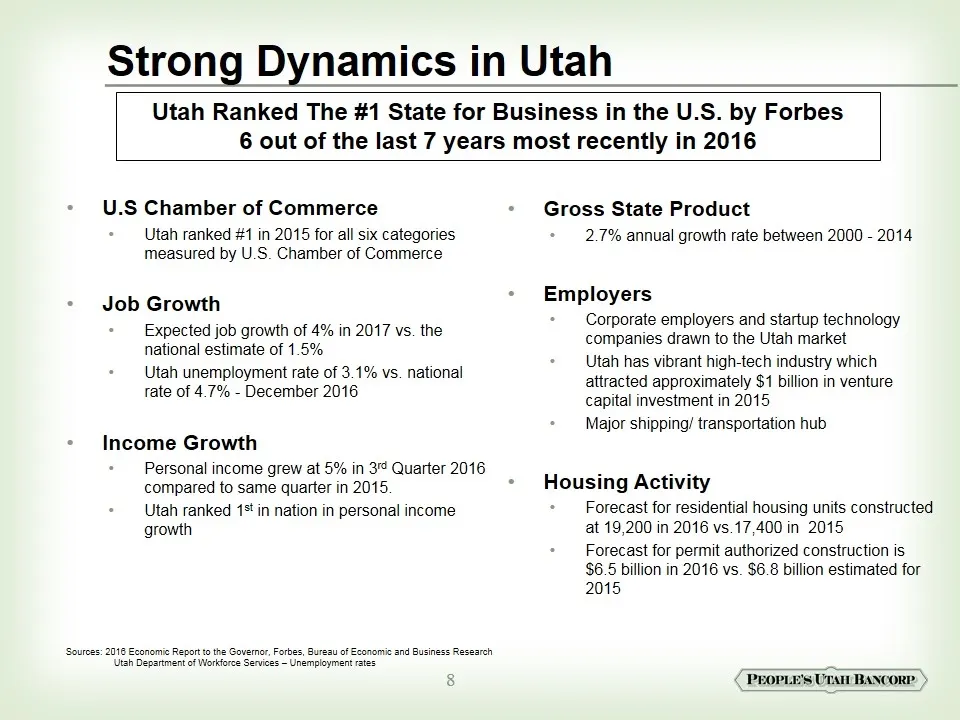
U.S Chamber of Commerce Utah ranked #1 in 2015 for all six categories measured by U.S. Chamber of Commerce Job Growth Expected job growth of 4% in 2017 vs. the national estimate of 1.5% Utah unemployment rate of 3.1% vs. national rate of 4.7% - December 2016 Income Growth Personal income grew at 5%
Slide 9: Strong Dynamics in Utah (Cont.)
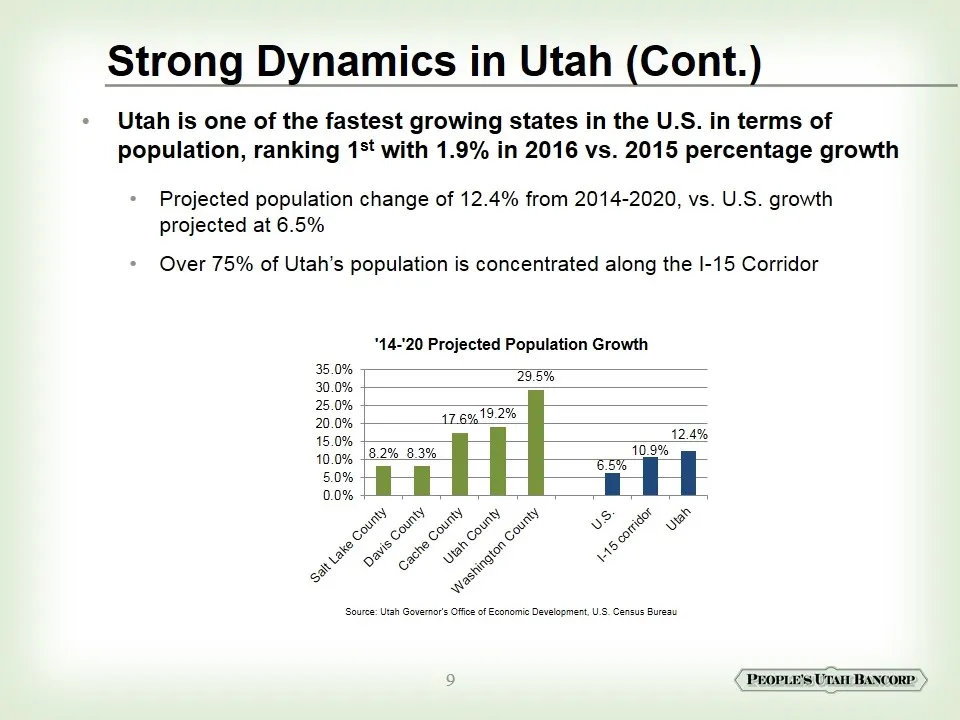
Utah is one of the fastest growing states in the U.S. in terms of population, ranking 1st with 1.9% in 2016 vs. 2015 percentage growth Projected population change of 12.4% from 2014-2020, vs. U.S. growth projected at 6.5% Over 75% of Utah’s population is concentrated along the I-15 Corridor Strong D
Slide 10: Utah's High Growth Corridor
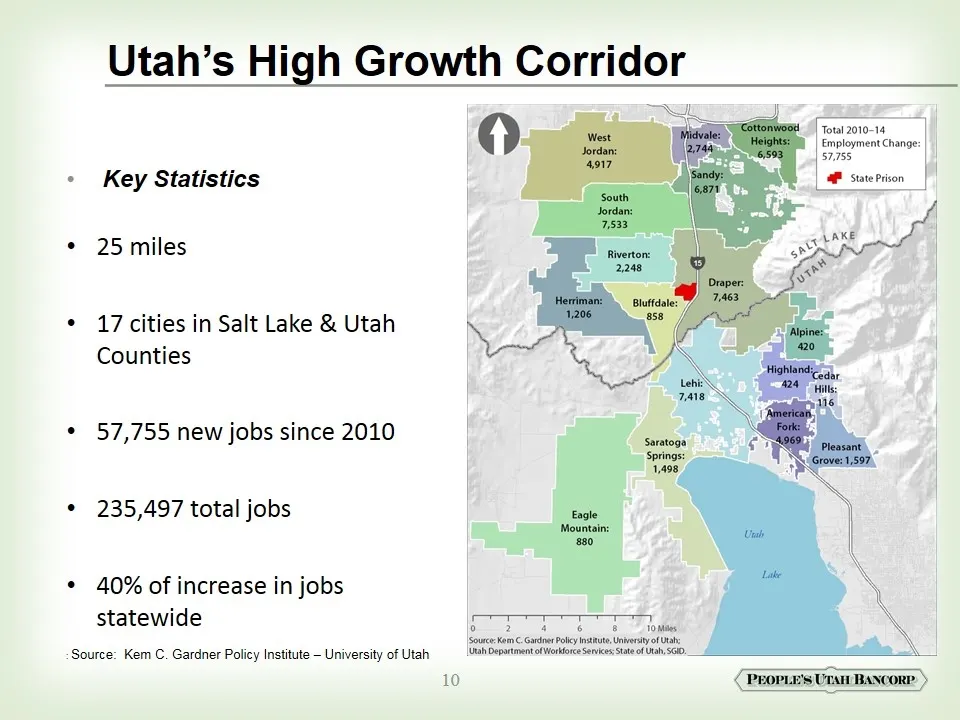
Key Statistics 25 miles 17 cities in Salt Lake & Utah Counties 57,755 new jobs since 2010 235,497 total jobs 40% of increase in jobs statewide Utah’s High Growth Corridor : Source: Kem C. Gardner Policy Institute – University of Utah
Slide 11: Companies with Utah Operations
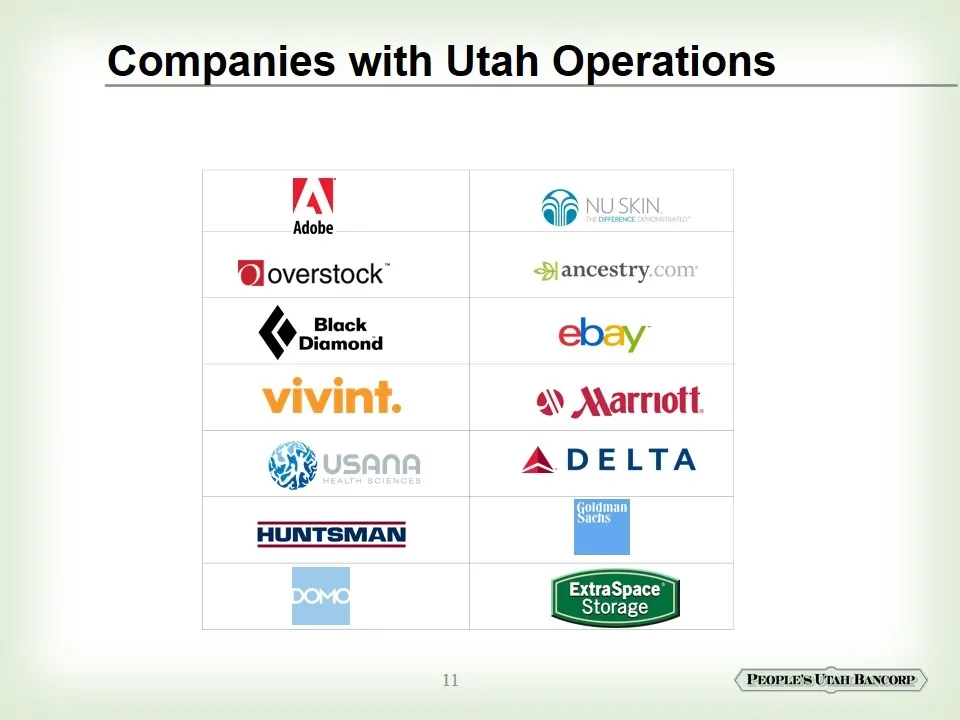
Companies with Utah Operations
Slide 12: Strategy / Model - Moving Forward
PUB’s Strategy is to preserve the community banking model with legacy bank names and people while consolidating regulatory and back-office functions to gain efficiencies. Continue to Grow Organically Increase share in current markets and enter new markets (converted LPOs into branches in St. George
Slide 13: Strategy / Model - Moving Forward (Cont.)
Manage Operating Efficiencies Balancing organic growth with cost structure to further enhance earnings Invest in future growth opportunities Operation model is scalable Up-to-date technology and experienced team Hire Additional Motivated and Service-Oriented Personnel Seek talented individuals livin
Slide 14: Growth through Mergers and Acquisitions
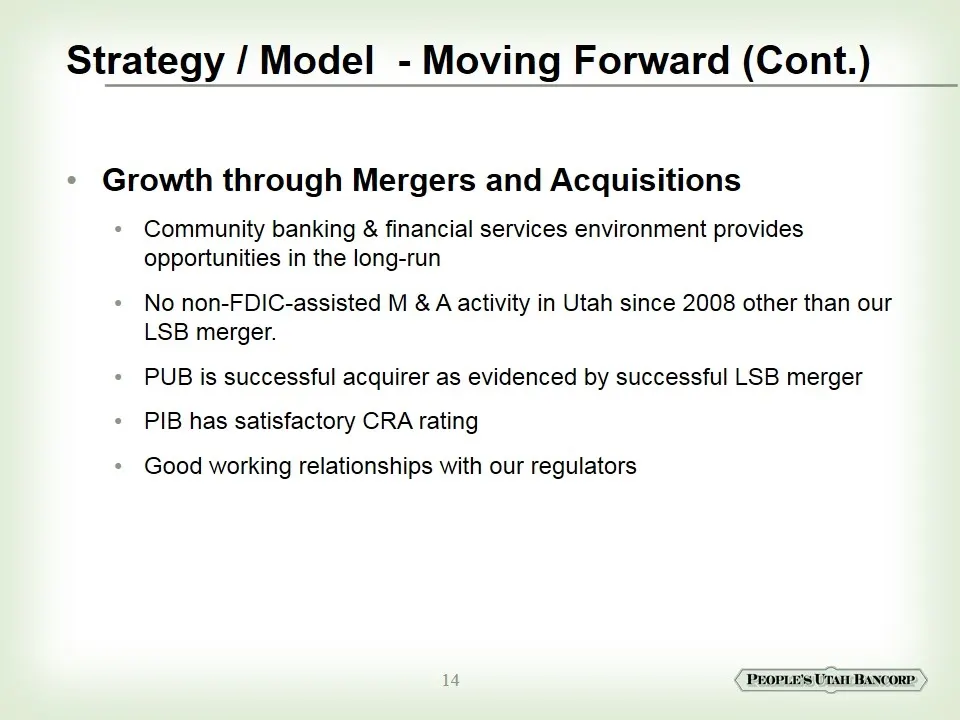
Growth through Mergers and Acquisitions Community banking & financial services environment provides opportunities in the long-run No non-FDIC-assisted M & A activity in Utah since 2008 other than our LSB merger. PUB is successful acquirer as evidenced by successful LSB merger PIB has satisfactory CR
Slide 15: Growth Opportunities
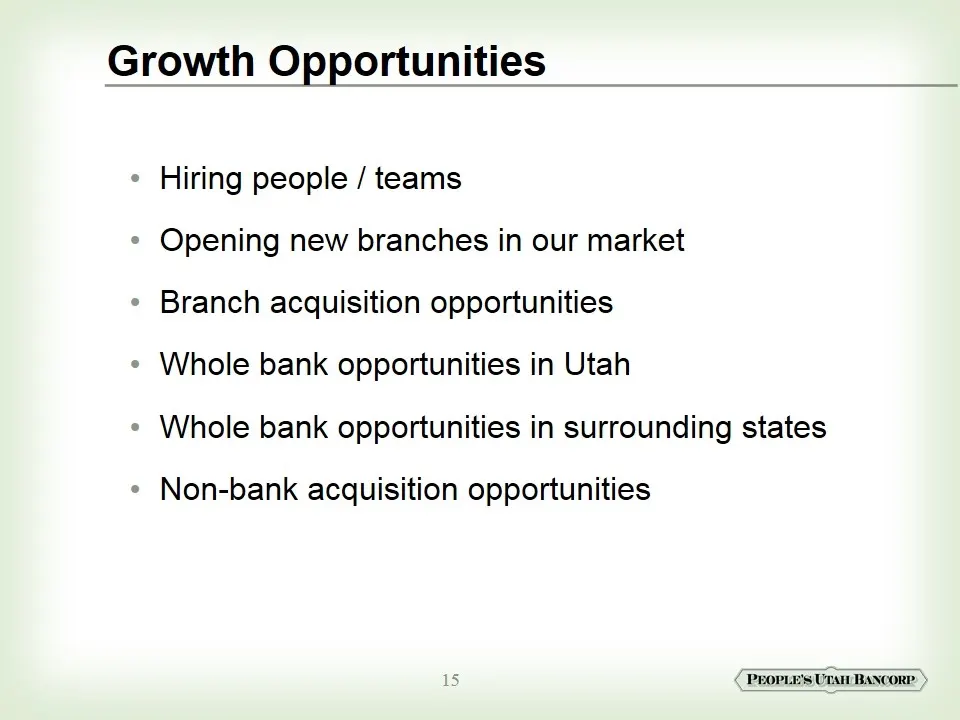
Growth Opportunities Hiring people / teams Opening new branches in our market Branch acquisition opportunities Whole bank opportunities in Utah Whole bank opportunities in surrounding states Non-bank acquisition opportunities
Slide 16: Financial / Operating Highlights
Financial / Operating Highlights Note: Financial information as of and for the quarters are unaudited.
Slide 17: Net Income
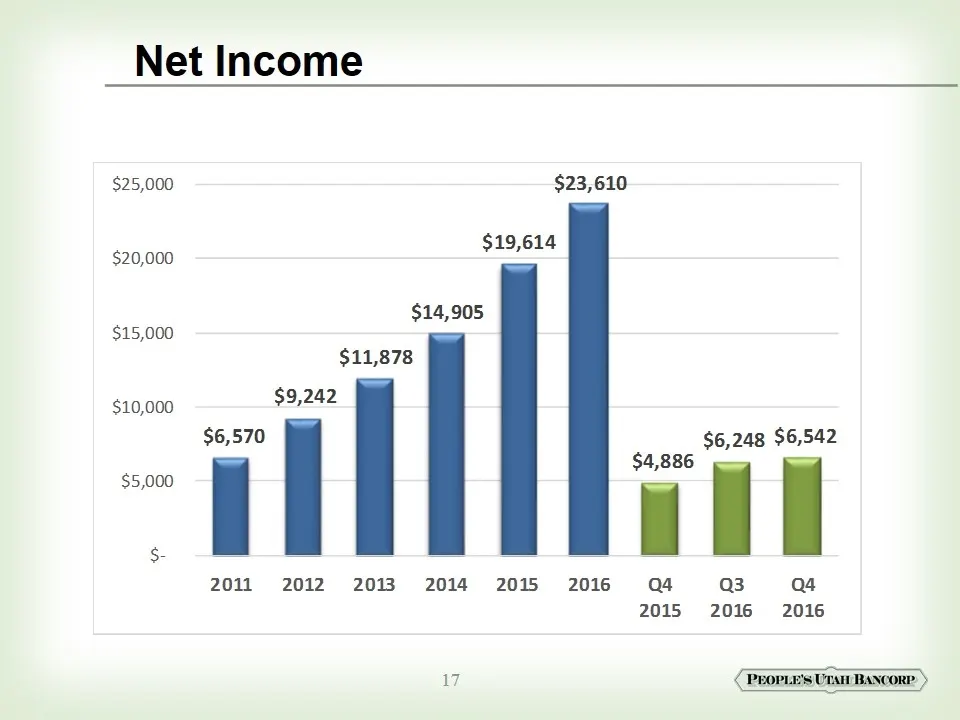
Net Income $25,000 $20,000 $15,000 $10,000 $5,000 $23,610 $19,614 $14,905 $11,878 $9,242 $6,570 $6,248 $6,542 $4,886 2011 2012 2013 2014 2015 2016 Q4 Q3 Q4 2015 2016 2016 uv
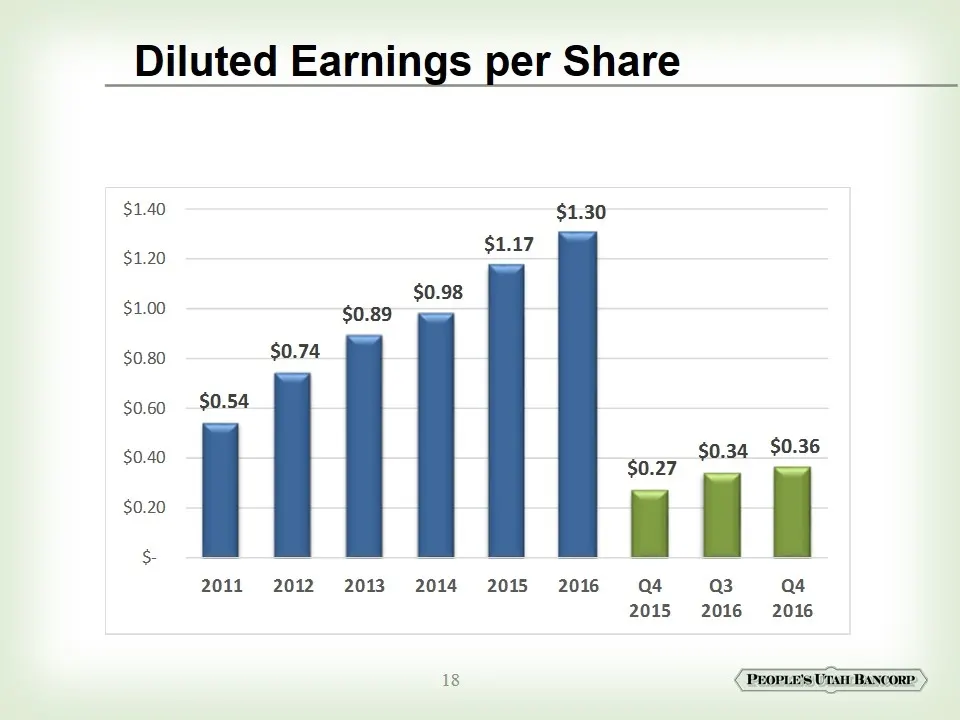
Slide 18: Diluted Earnings per Share
Diluted Earnings per Share $1.30 $1.17 $0.98 $0.89 $0.74 $0.54 057 $0.34 $0.36 2011 2012 2013 2014 2015 2016 a4 Q3 a4 2015 2016 2016
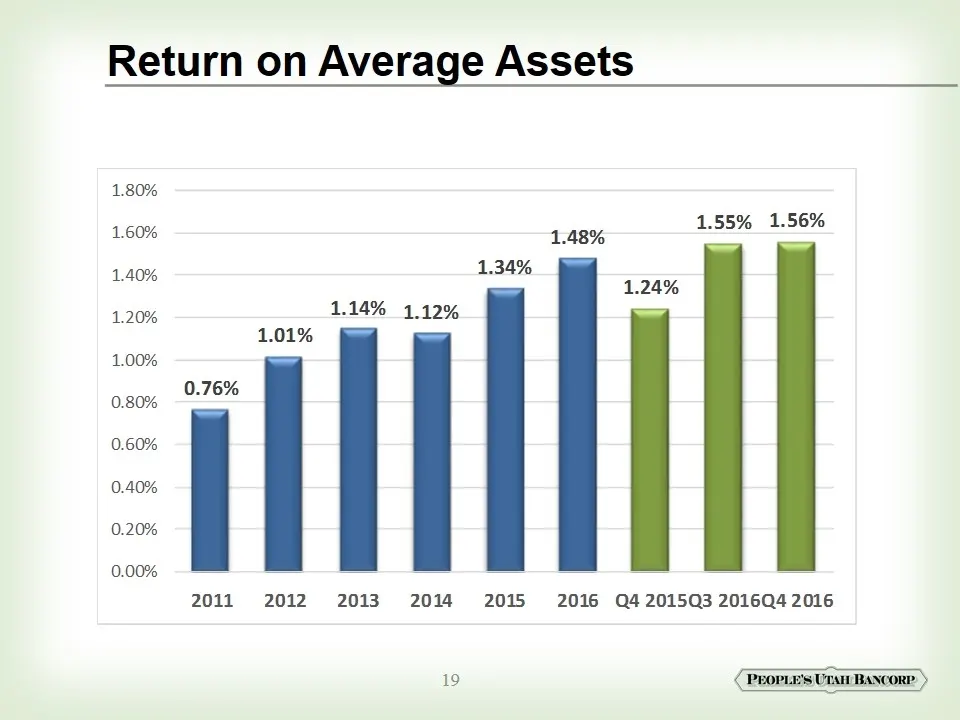
Slide 19: Return on Average Assets
Return on Average Assets 1.80% 1.60% 1.40% 1.20% 1.00% 0.80% 0.60% 0.40% 0.20% 0.00% 1.55% 1.56% 1.48% 1.34% 1.24% 1.14% 1.12% 1.01% 0.76% 2011 2012 2013 2014 2015 2016 Q42015Q3 2016Q4 2016 19
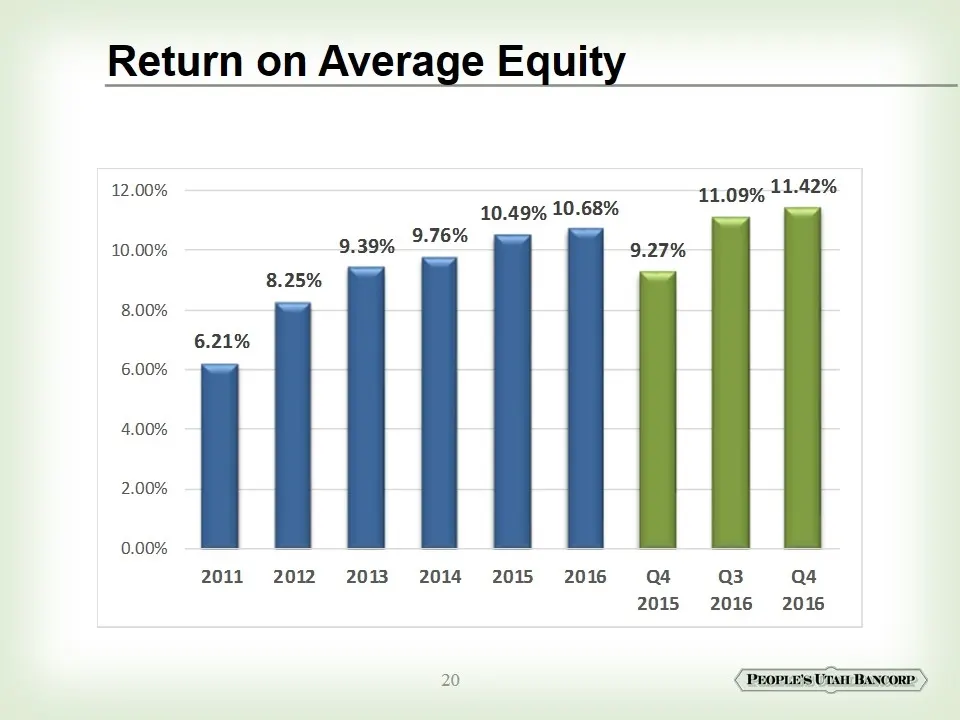
Slide 20: Return on Average Equity
Return on Average Equity 12.00% 10.00% 8.00% 6.00% 4.00% 2.00% 0.00% 10.49% 10.68% ee 9.39% a/6% 9.27% 8.25% 6.21% a4 Q3 2011 2012 2013 2014 #2015 2016 2015 2016 2016
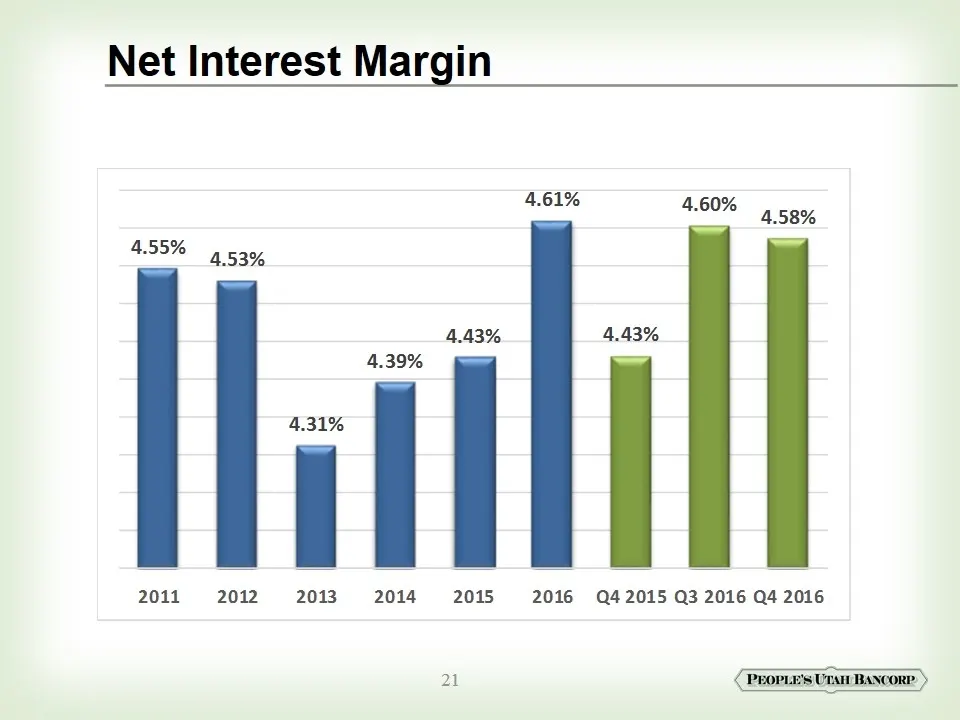
Slide 21: Net Interest Margin
Net Interest Margin 4.61% 4.60% 4.58% 4.55% 4.53% 4.43% 4.43% 4.39% i i 2011 2012 2013 2014 2015 2016 Q42015 Q3 2016 Q4 2016 21
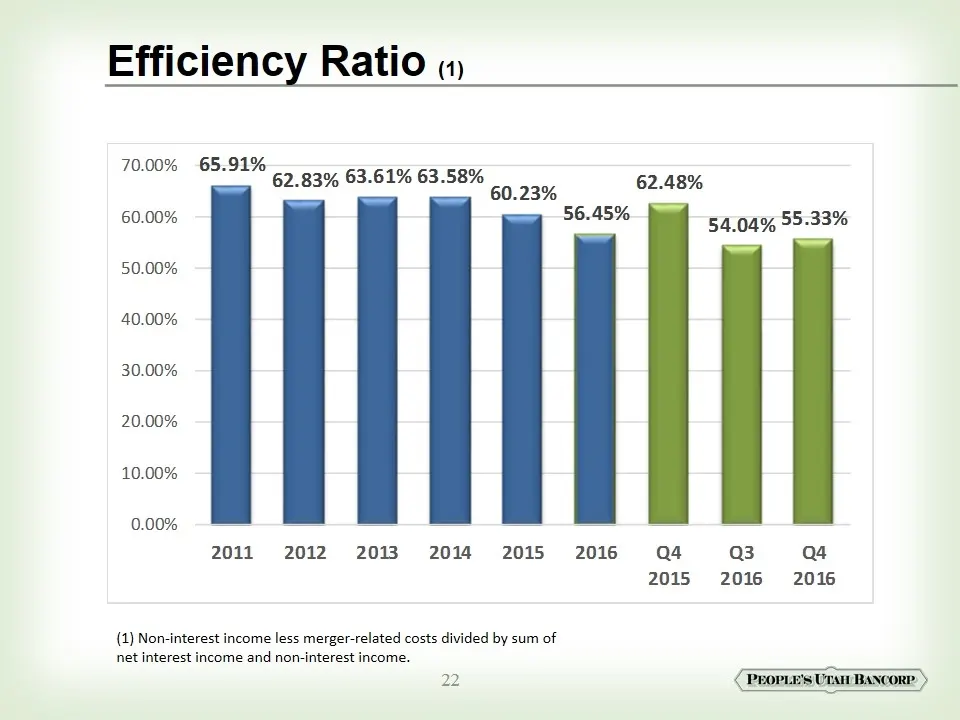
Slide 22: Efficiency Ratio
Efficiency Ratio (1) (1) Non-interest income less merger-related costs divided by sum of net interest income and non-interest income.
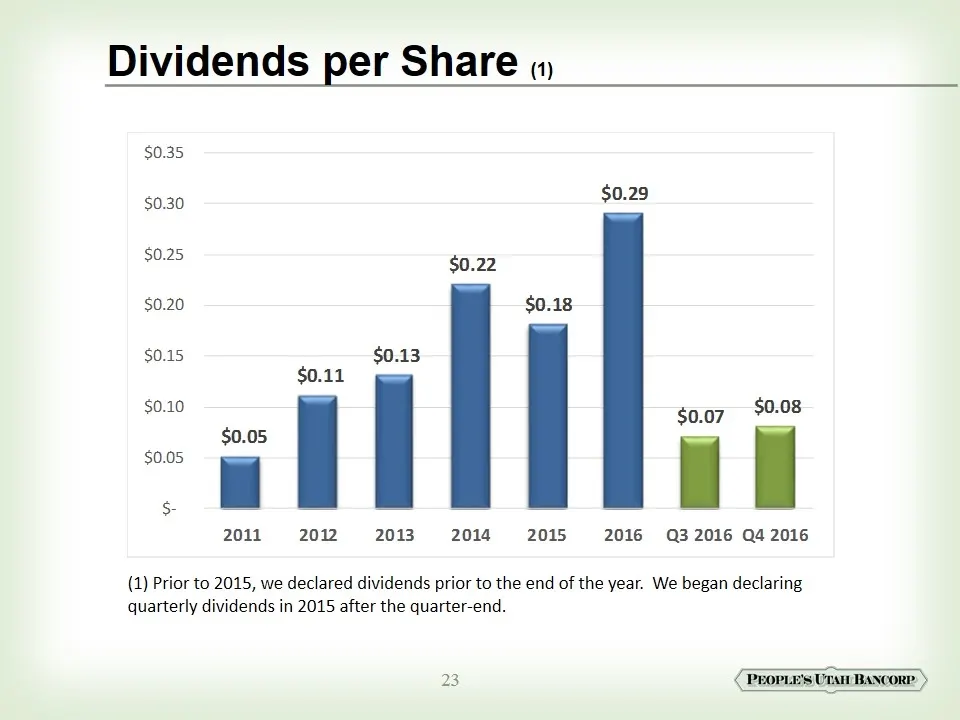
Slide 23: Dividends per Share
Dividends per Share (1) (1) Prior to 2015, we declared dividends prior to the end of the year. We began declaring quarterly dividends in 2015 after the quarter-end.
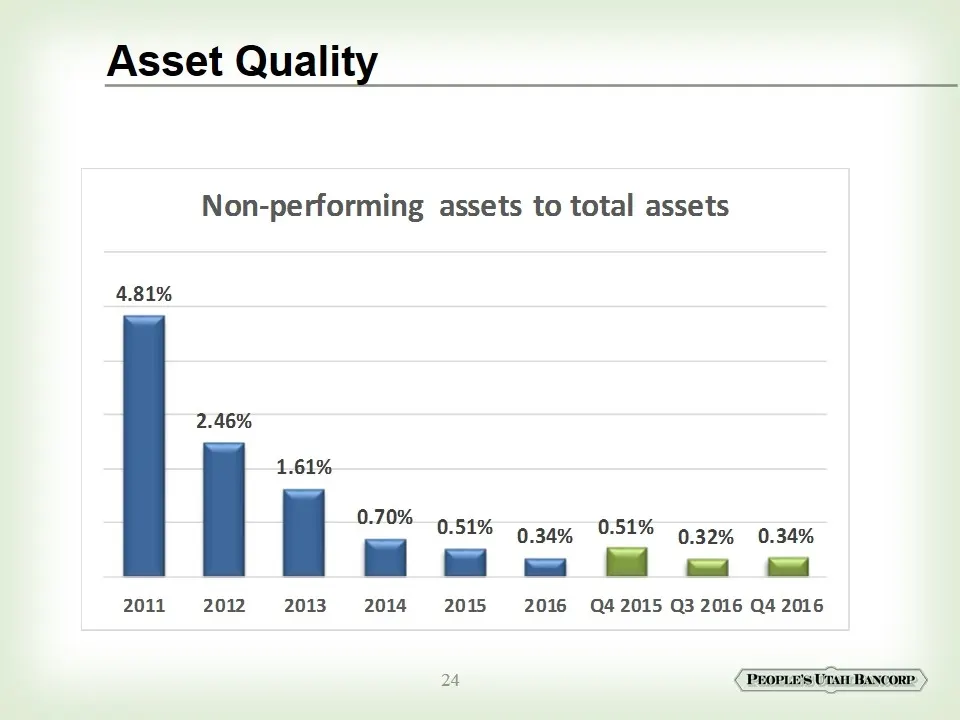
Slide 24: Asset Quality
Asset Quality Non-performing assets to total assets 4.81% 2.46% 1.61% 0.70% Fr 0.51% 9.34% 951% 939% 0.34% a | 2011 2012 2013 2014 2015 2016 Q42015 Q3 2016 Q4 2016
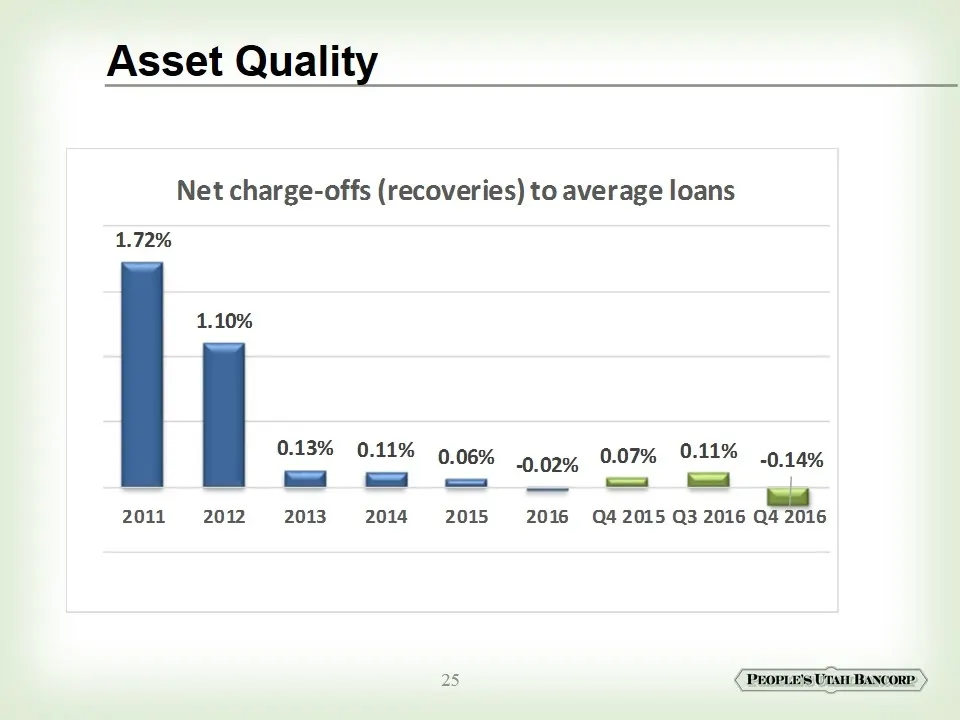
Slide 25: Asset Quality
Asset Quality Net charge-offs (recoveries) to average loans 1.72% 1.10% | 0.13% 0.11% 9.06% 9 ga 0.07% 9-11% 9 149% 2011 2012 2013 2014 2015 2016 Q42015 Q3 2016 Q4 2016 25 PEOPLE'S Ural BANCORP
Slide 26: Loan Composition & Growth Trend
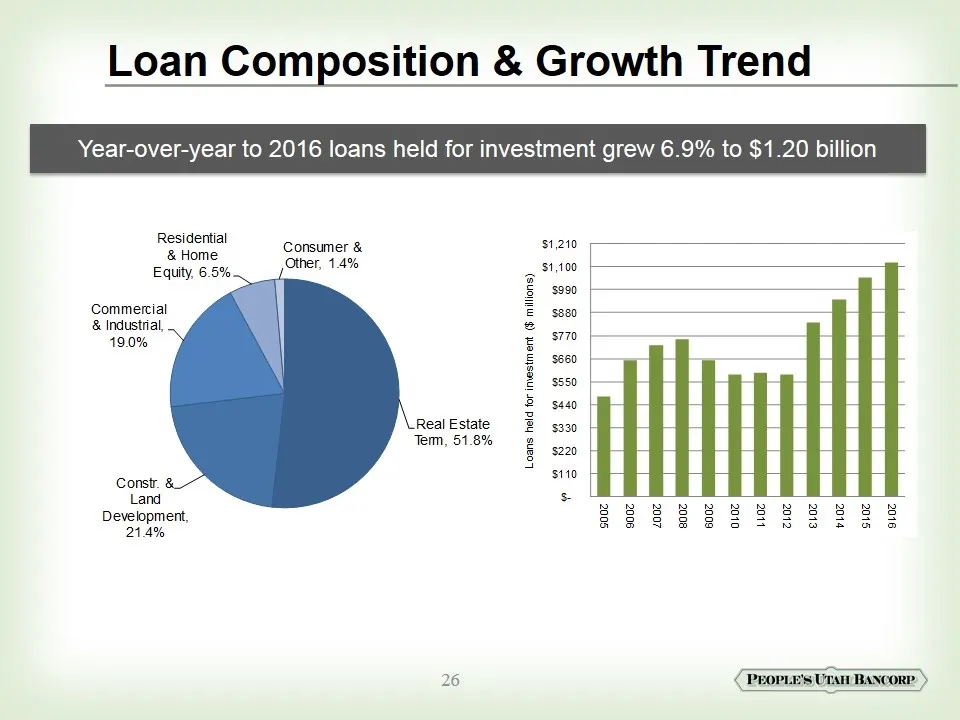
Loan Composition & Growth Trend Year-over-year to 2016 loans held for investment grew 6.9% to $1.20 billion
Slide 27: Deposit Composition & Growth Trend
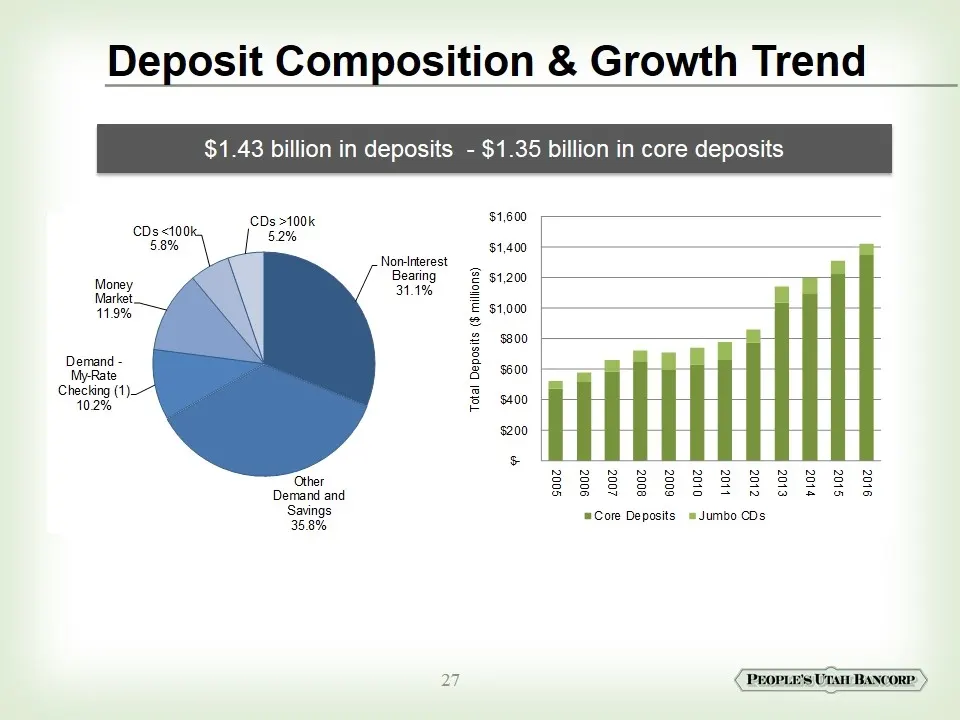
Deposit Composition & Growth Trend $1.43 billion in deposits - $1.35 billion in core deposits
Slide 28
Source: SEC EDGAR · 8-K filed Feb 1, 2017
More decks from Altabancorp
 Merger or Acquisition (May 2021)19 slides · May 19, 2021
 Q1 2021 Earnings Presentation48 slides · Apr 28, 2021
 Q4 2020 Earnings Presentation51 slides · Jan 27, 2021
 Q3 2020 Earnings Presentation52 slides · Oct 28, 2020
 Q2 2020 Earnings Presentation46 slides · Jul 30, 2020
 People's Utah Bancorp — Shareholder Meeting (May 2020)31 slides · May 28, 2020