Meadowbrook Insurance Group Inc
Meadowbrook Insurance — Investor Presentation (February 2011)
21 slides from Meadowbrook Insurance's investor presentation, Feb 22, 2011
Slide 1: Investor Presentation February 2011
Investor Presentation February 2011 Bob Cubbin, CEO Karen Spaun, CFO

Slide 2: Forward-Looking Statements
2 Forward-Looking Statements Certain statements made by Meadowbrook Insurance Group, Inc. in this presentation may constitute forward-looking statements including, but not limited to, those statements that include the words "believes," "expects," "anticipates," "estimates," or similar expressions. P
Slide 3: The Meadowbrook Approach
3 The Meadowbrook Approach Our objective is to generate predictable results across the market cycle, with a target return on average equity of 10% - 17% To achieve these results we seek to leverage the unique characteristics of our balanced business model to generate: Consistent, profitable underwri

Slide 4: Meadowbrook Vitals
4 Meadowbrook Vitals Current market cap (at 2/18/11): $559.5 million Outstanding shares at 12/31/10: 53.2 million Weighted average shares (At 12/31/10): 54.3 million Book value (12/31/2010): $547.1 million Book value per share: $10.28 (TTM Dec -10 ROAE 11.4%) – Excluding unrealized gain / loss, net
Slide 5: Diverse Revenue Sources Positioned to Manage Insurance Cycles
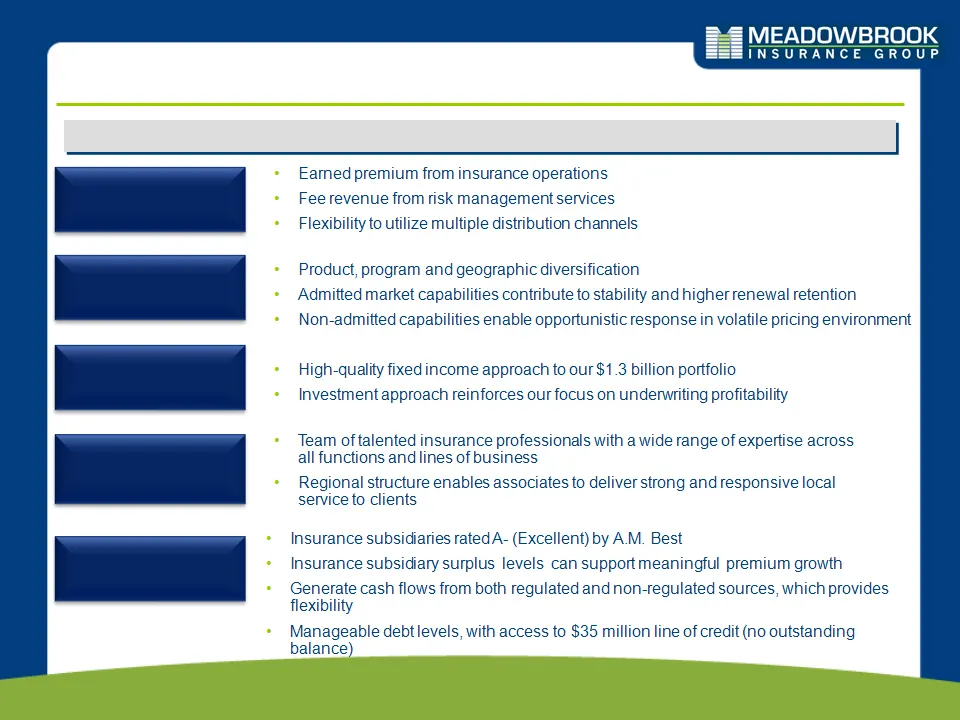
5 Diverse Revenue Sources Positioned to Manage Insurance Cycles Conservative Investment Philosophy Ability to Attract and Retain Talented Professionals Strong Capital and Liquidity Position Earned premium from insurance operations Fee revenue from risk management services Flexibility to utilize mult
Slide 6: Our Approach Has Delivered Results Over Time
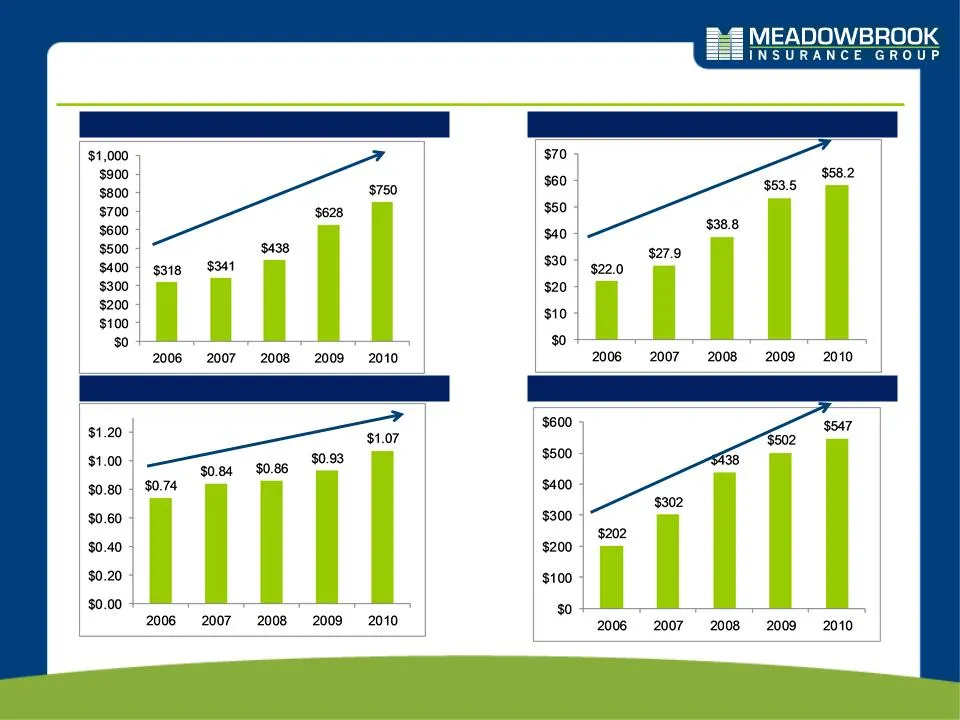
6 Total Revenue ($M) Net Operating Income ($M) Shareholders’ Equity ($M) Net Operating Income per Share Our Approach Has Delivered Results Over Time CAGR (2006 to 2010) = 24% CAGR (2006 to 2010) = 28% CAGR (2006 to 2010) = 28% CAGR (2006 to 2010) = 10%
Slide 7: Capability Building Through Successful Acquisitions
7 Meadowbrook actively reviews acquisition prospects on a strategic basis and enters into transactions that will increase long-term shareholder value We consider a range of strategic factors when looking at acquisitions including: Capability Building Through Successful Acquisitions Retail Agency Onl
Slide 8: Insurance Operations: Diverse Revenue Sources
8 Insurance Operations Diverse Revenue Sources Commission Revenue Fee Revenue Our most prominent source of revenue and income comes from our insurance operation; commission revenue and fee-for-service revenue generate unregulated free cash flow Admitted and non-admitted products and programs Risk sh
Slide 9: Diversified Commercial Positions Built to Manage Across Cycles
9 Admitted Programs Non-Admitted Programs Specialty Markets Insurance Operations Diversified Commercial Positions Built to Manage Across Cycles Main Street Excess and Surplus Lines Homogeneous specialized programs Heterogeneous geographic centers Product focused Promotes specialty agents Broad class
Slide 10: National Scope with Regional Perspective
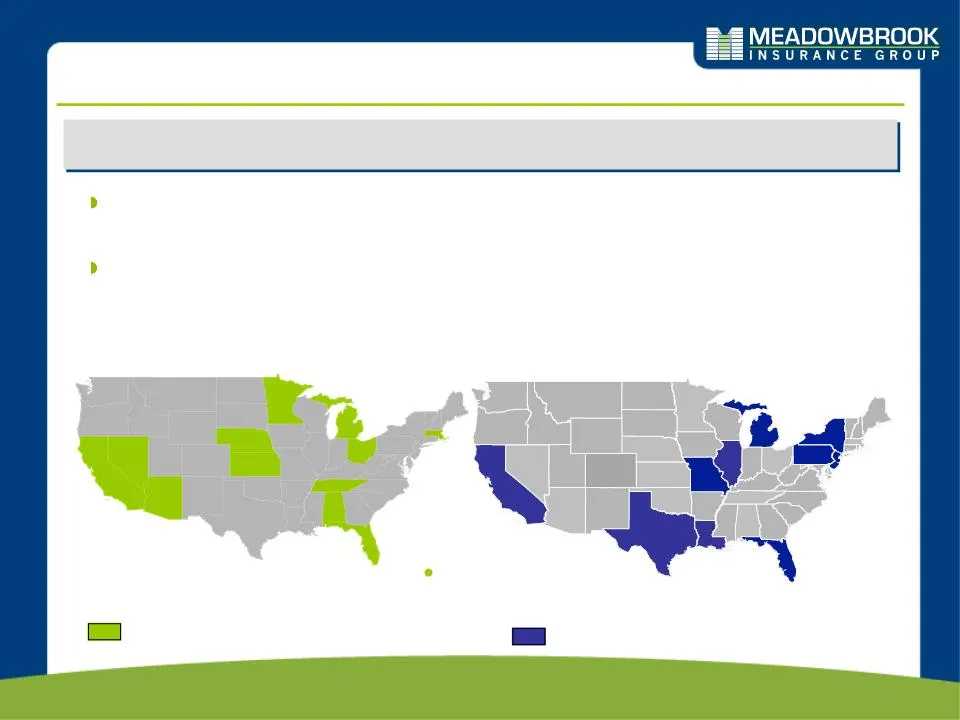
10 1 2 6 3 1 2 7 5 10 8 9 National Scope with Regional Perspective Bermuda Talented associates are located throughout the country to serve the needs of regional clients Support from headquarters enables efficient resource deployment and cross-unit coordination Balance of effective local touch, with
Slide 11: Diverse Mix of Business
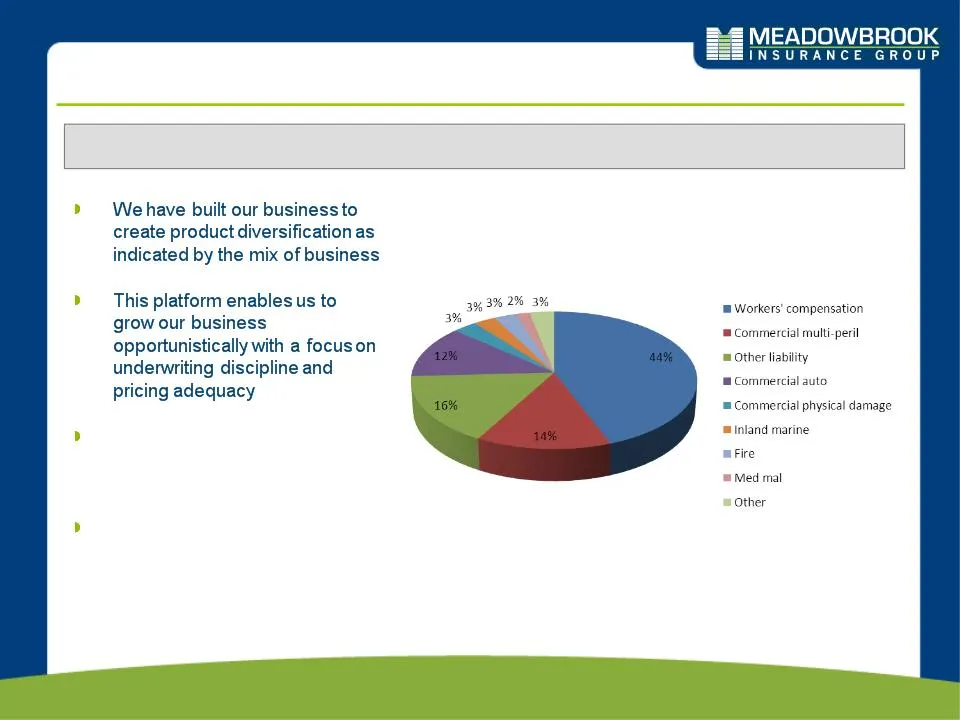
11 Diverse Mix of Business Full Year 2010 Gross Written Premium Business Mix Year Ended December 31, 2010 Our wide range of product expertise positions us well to support future growth Our new business is primarily rollover books of business with a proven track record of profitability
Slide 12: Loss and Expense Ratios
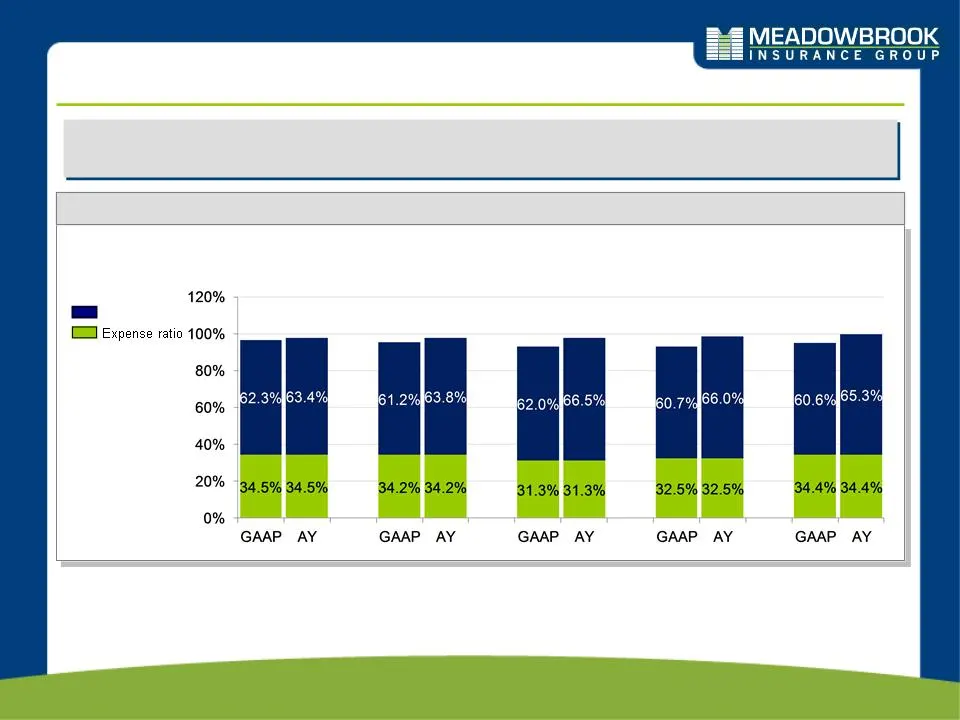
12 Loss and Expense Ratios Loss ratio 2006 - 2010 GAAP and Accident Year Combined Ratios 96.8% Our GAAP combined ratio has improved over time and our accident year combined ratio has remained profitable 2006 2007 2008 2009 # 2010 97.9% 95.4% 98.0% 93.3% 97.8% 93.2% 98.5% 95.0% 99.7% Re-estimated AY
Slide 13: Expense Ratio Analysis
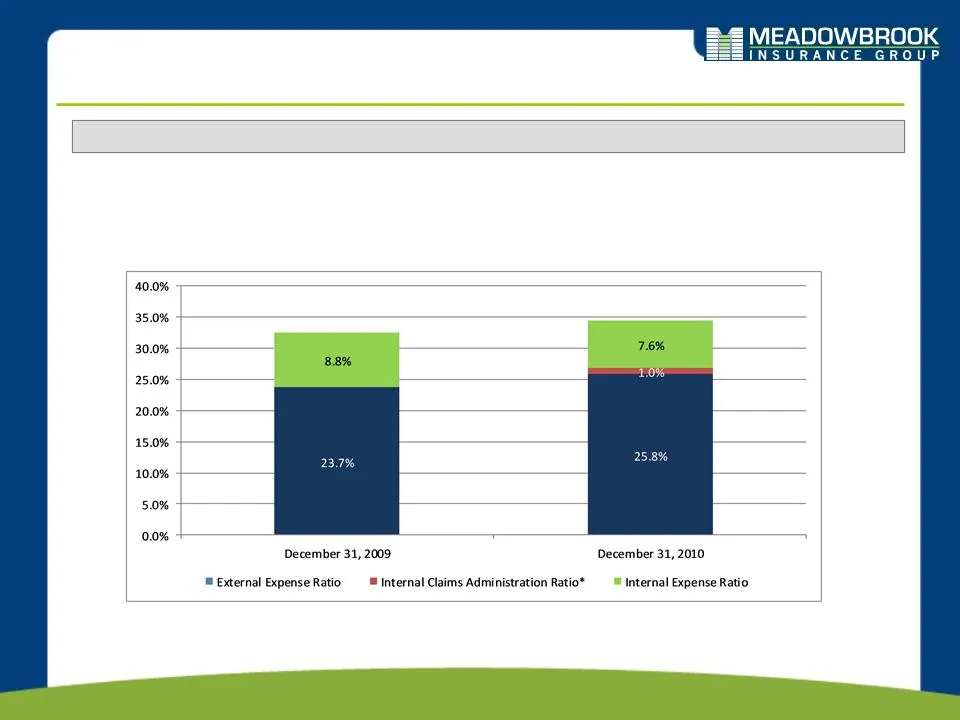
13 Expense Ratio Analysis Twelve Month Ended GAAP Expense Ratio Comparison Net earned premium $539.6M $659.8M Policy acquisition $175.1M $227.0M and other u/w expenses Expense ratio 32.5% 34.4% *As a result of our internal cost allocation study,1.0% of internal claims administration is included in t
Slide 14: Focus on Generating Consistent Investment Income
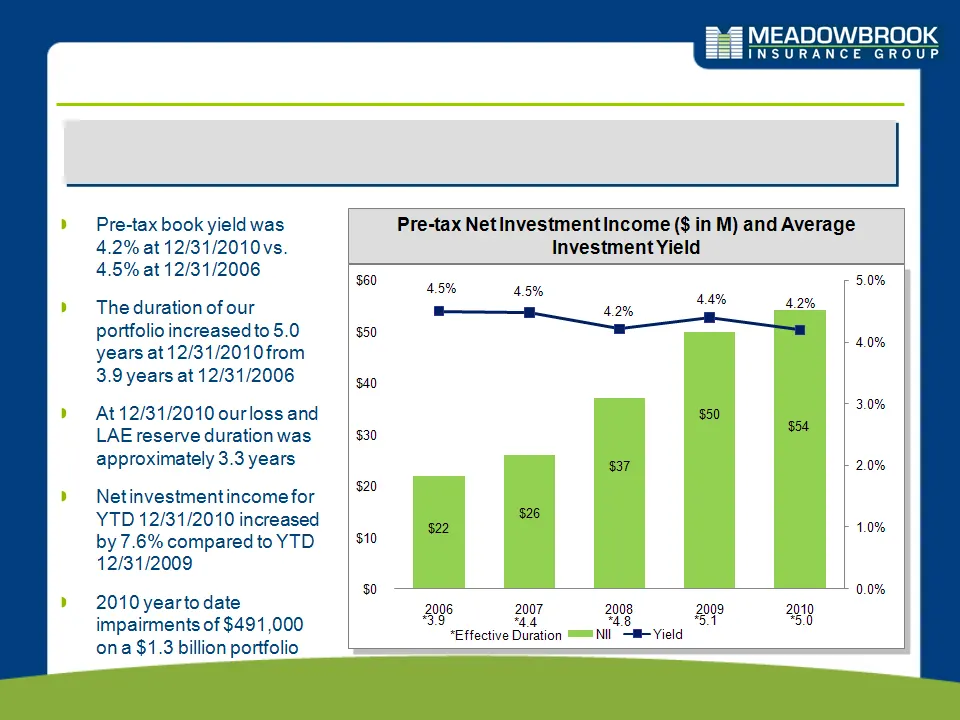
14 Pre-tax book yield was 4.2% at 12/31/2010 vs. 4.5% at 12/31/2006 The duration of our portfolio increased to 5.0 years at 12/31/2010 from 3.9 years at 12/31/2006 At 12/31/2010 our loss and LAE reserve duration was approximately 3.3 years Net investment income for YTD 12/31/2010 increased by 7.6% c
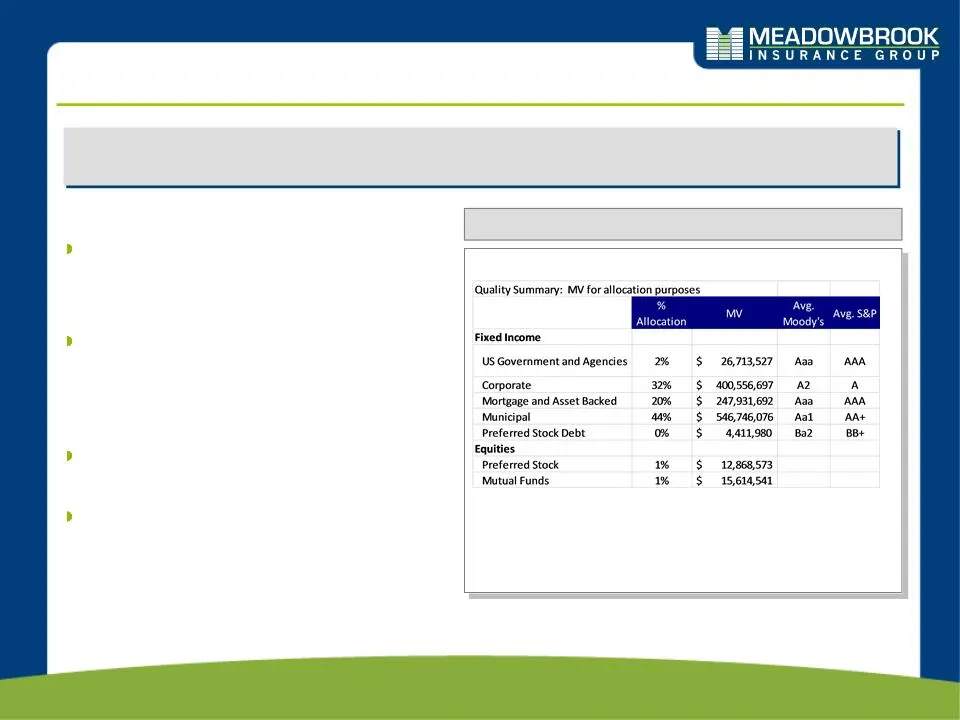
Slide 15: We Maintain a High Quality, Low Risk Investment Portfolio
15 We Maintain a High Quality, Low Risk Investment Portfolio We maintain a conservative investment portfolio Portfolio Allocation and Quality Allocation based on market value Low equity risk exposure – 98% fixed income and cash – 2% equity High credit quality – 98% of bonds are investment grade – Av
Slide 16: Fee-Based and Agency Operations Give Us Flexibility with Unregulated Cash Flow
16 Fee-Based and Agency Operations Give Us Flexibility with Unregulated Cash Flow We serve the self-insurance market for municipalities and associations – Sample clients include the Michigan Municipal League, the Minnesota County Insurance Trust and the Alabama Forest Fund We provides clients admini
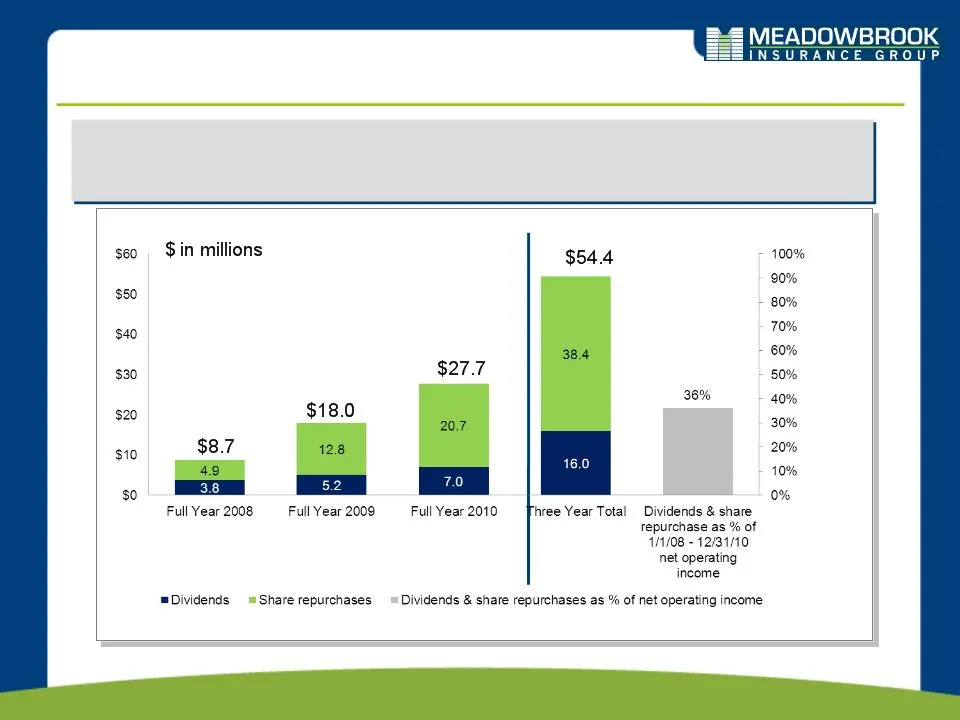
Slide 17: Capital Management
17 Capital Management Our goal is to be efficient managers of capital; we initiated a dividend during 2008 and since this time we have returned $54.4M to shareholders through dividends and share repurchases
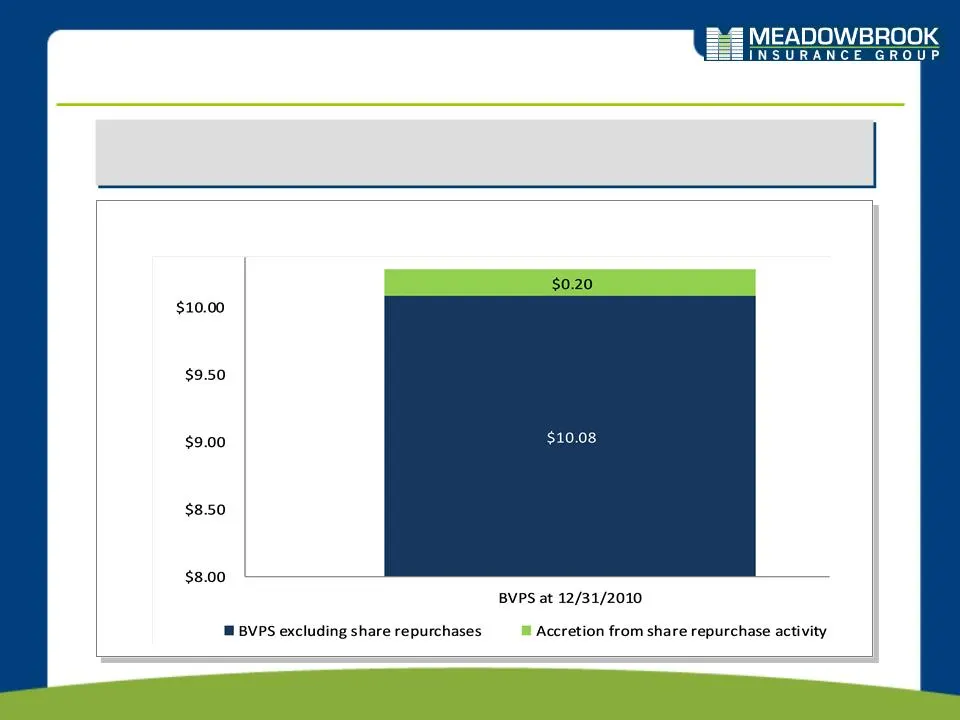
Slide 18: Capital Management
18 Capital Management Since 2008 our share repurchase activity has been accretive, increasing BVPS by $0.20 12/31/2010 BVPS: $10.28
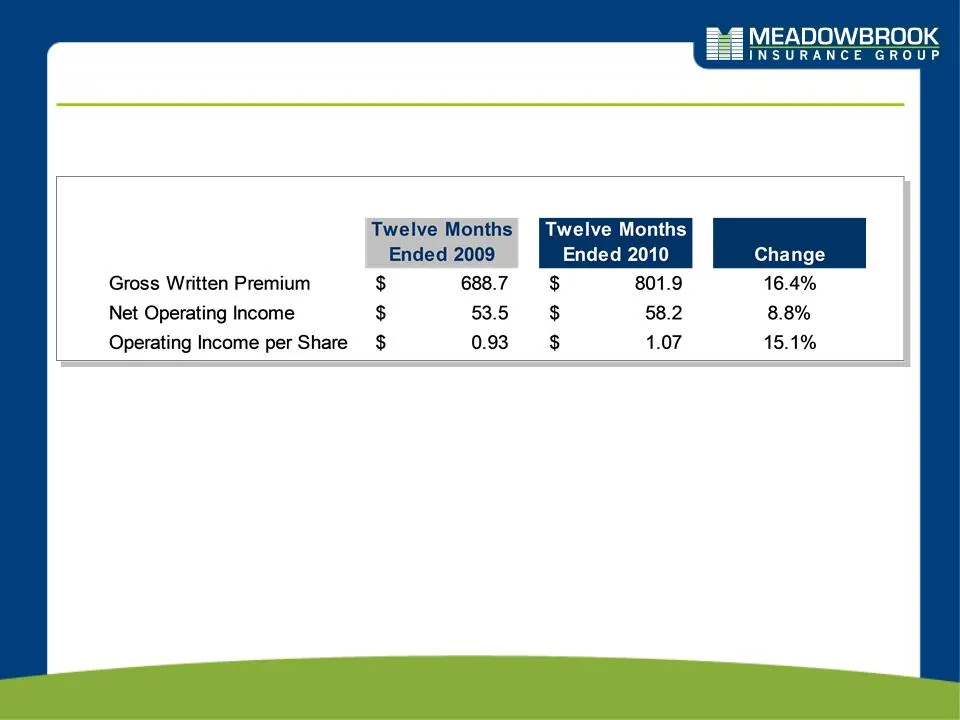
Slide 19: Recent Financial Highlights
19 Recent Financial Highlights: Highlights ($ in M)
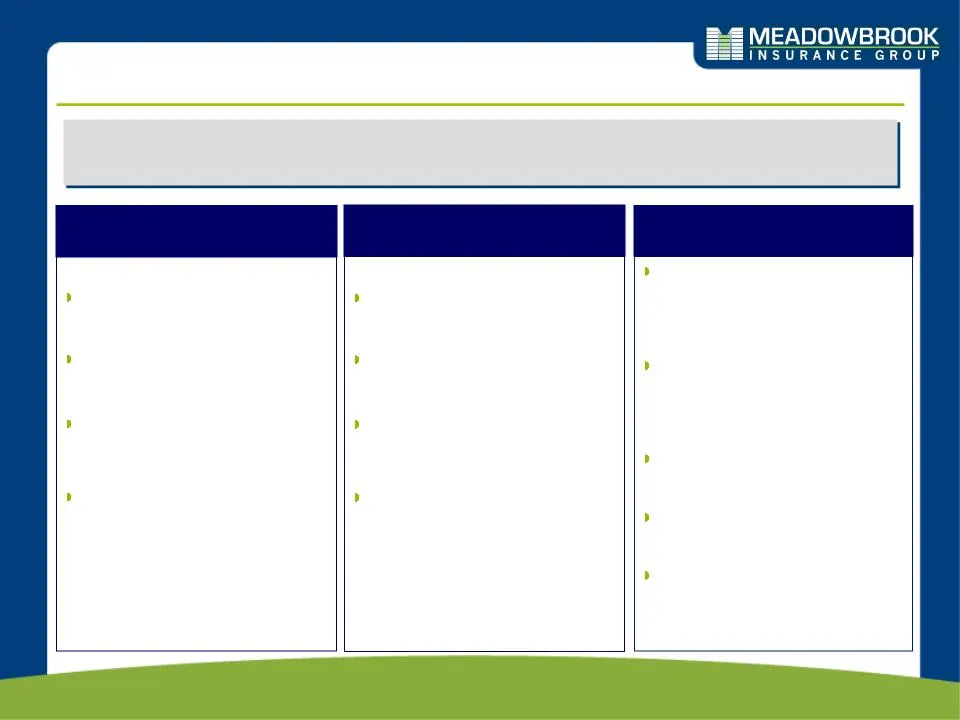
Slide 20: Full Year 2011 Guidance and Long Term Value Creation
20 2010 Results Driving Long-term Enterprise Value 2011 Guidance* Full Year 2011 Guidance and Long Term Value Creation Looking ahead to 2011, we expect a market similar to that which we have experienced during 2010 Gross Written Premium $802M Combined Ratio 95.0% Net income from operations $58.2M Ne
Slide 21
Source: SEC EDGAR · 8-K filed Feb 22, 2011
More decks from Meadowbrook Insurance Group Inc
 Q3 2014 Earnings Presentation26 slides · Nov 18, 2014
 Q3 2014 Earnings Presentation19 slides · Nov 18, 2014
 Q2 2014 Earnings Presentation21 slides · Aug 28, 2014
 Q2 2014 Earnings Presentation27 slides · Aug 28, 2014
 Investor Presentation (June 2014)31 slides · Jun 3, 2014
 Q1 2014 Earnings Presentation21 slides · Jun 3, 2014