Endurance Specialty Holdings Ltd
Endurance Specialty — Q1 2008 Earnings Presentation
16 slides from Endurance Specialty's earnings presentation, May 7, 2008

Slide 1: Endurance Specialty Holdings Ltd. First Quarter 2008
Endurance Specialty Holdings Ltd. First Quarter 2008
Slide 2: Forward Looking Statements
2 Forward Looking Statements Statements contained in this presentation that are not based on current or historical fact are forward-looking in nature. Such forward-looking statements are based on current plans, estimates and expectations and are made pursuant to the Private Securities Litigation Ref
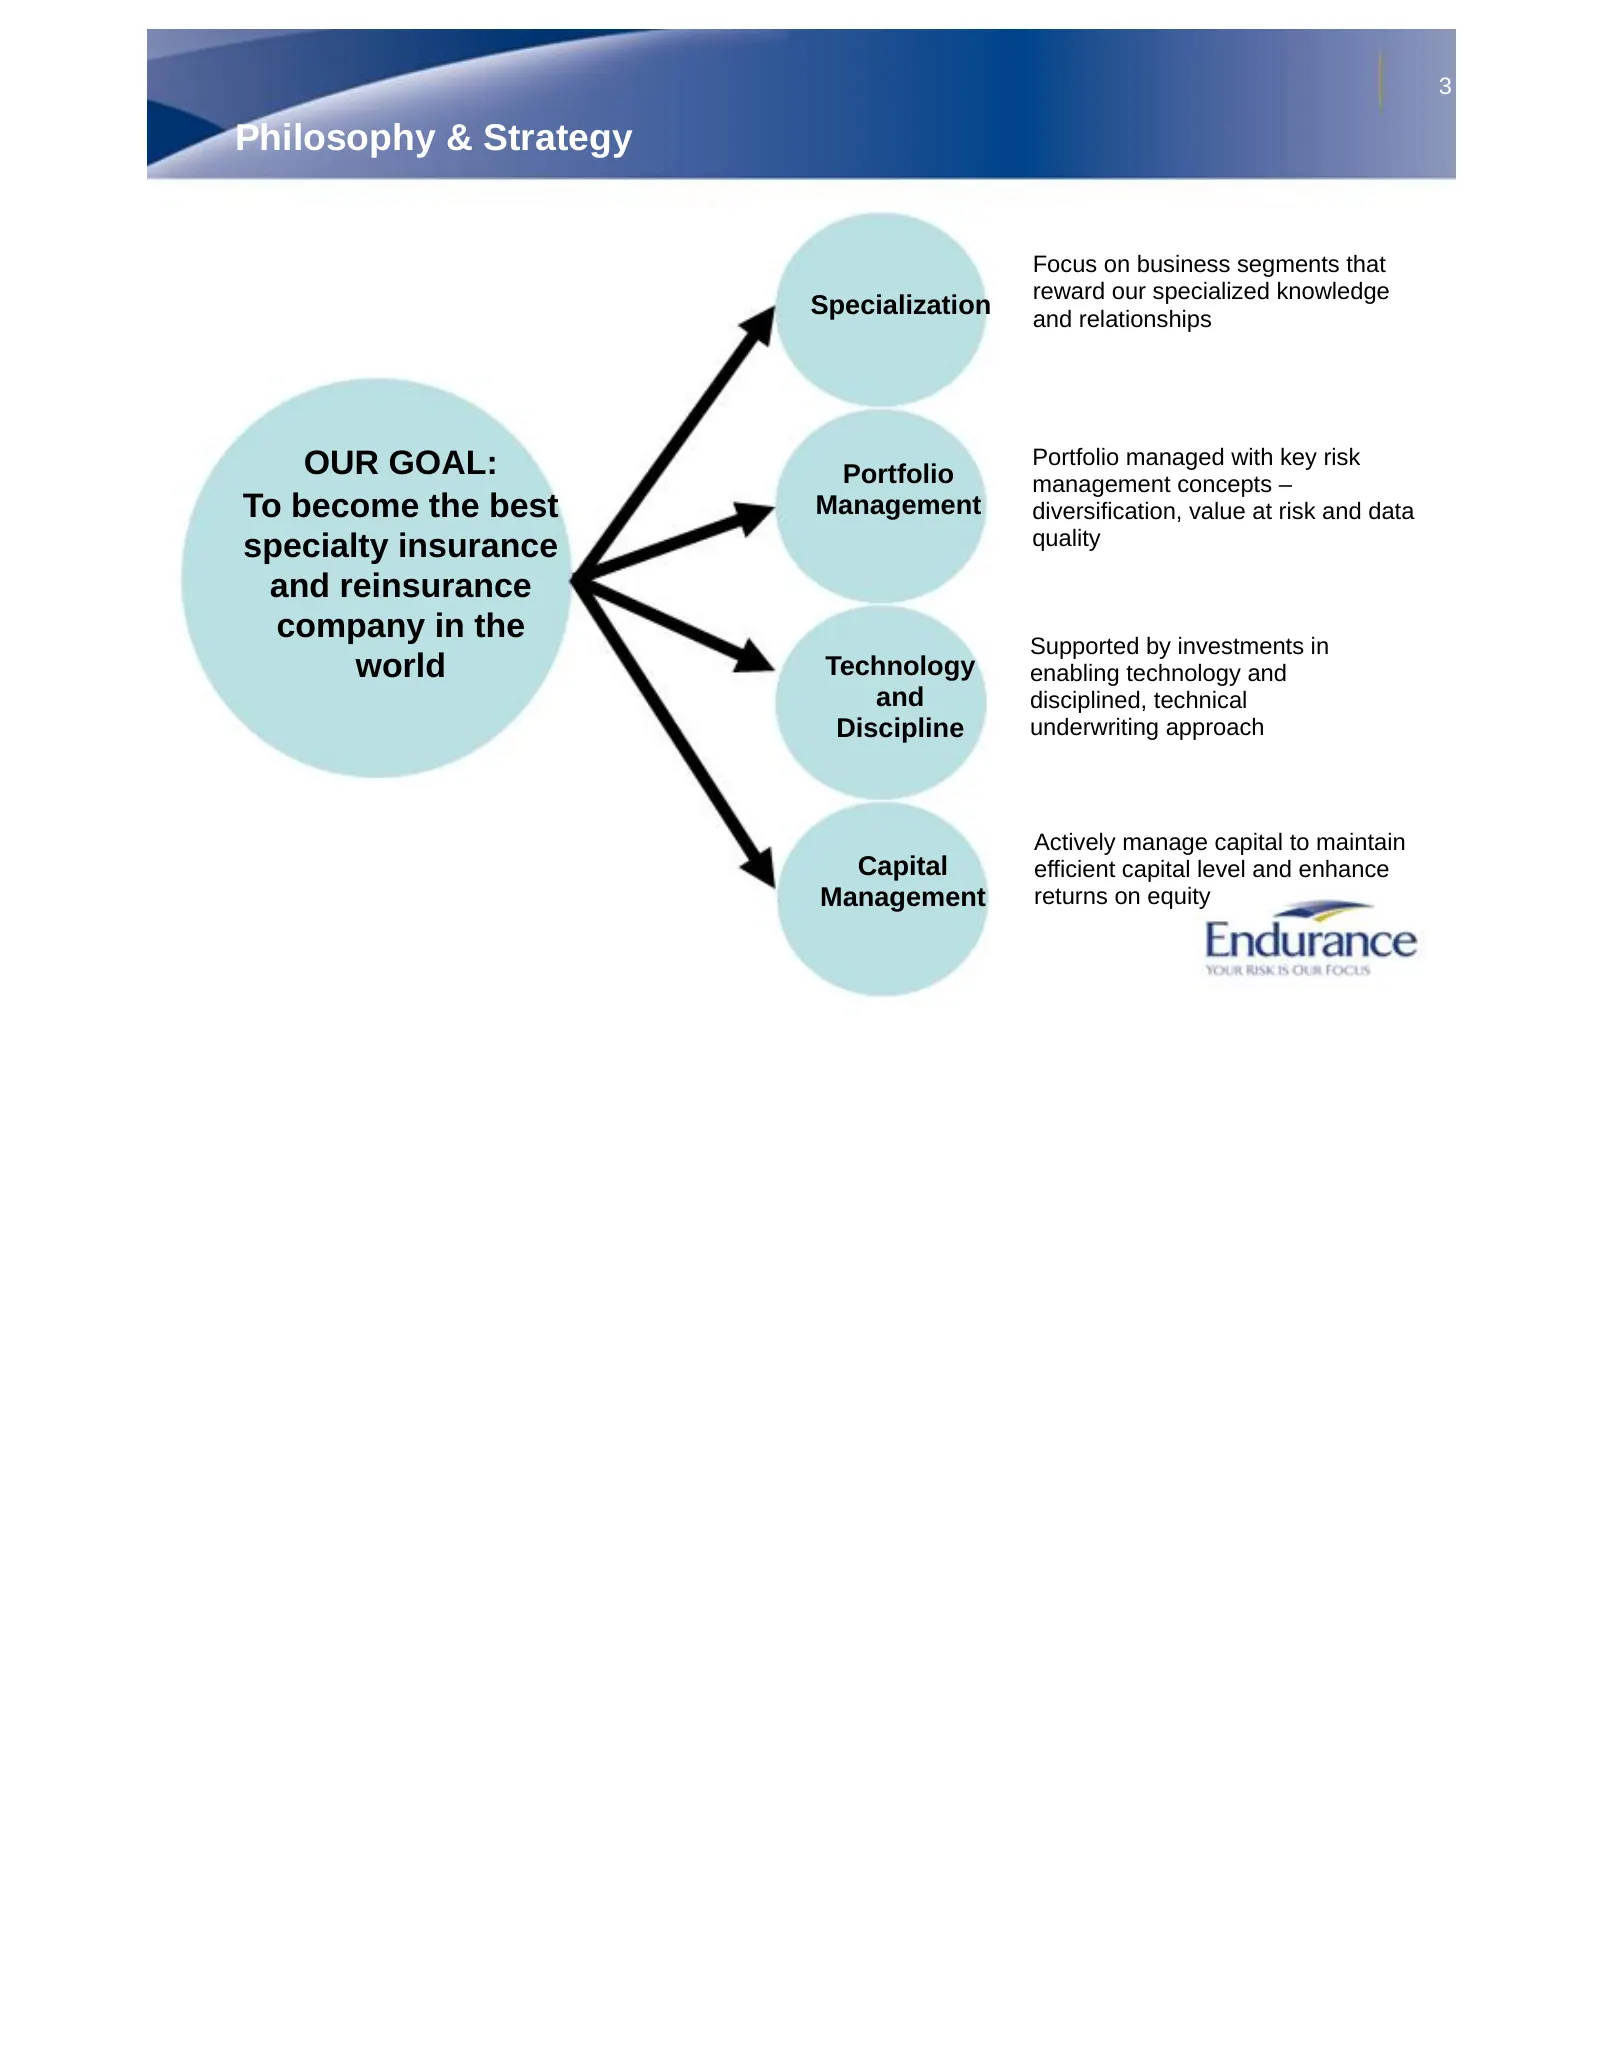
Slide 3: Philosophy & Strategy
3 Philosophy & Strategy Focus on business segments that reward our specialized knowledge Specialization and relationships OUR GOAL: Portfolio Portfolio managed with key risk management concepts – To become the best Management diversification, value at risk and data specialty insurance quality and re
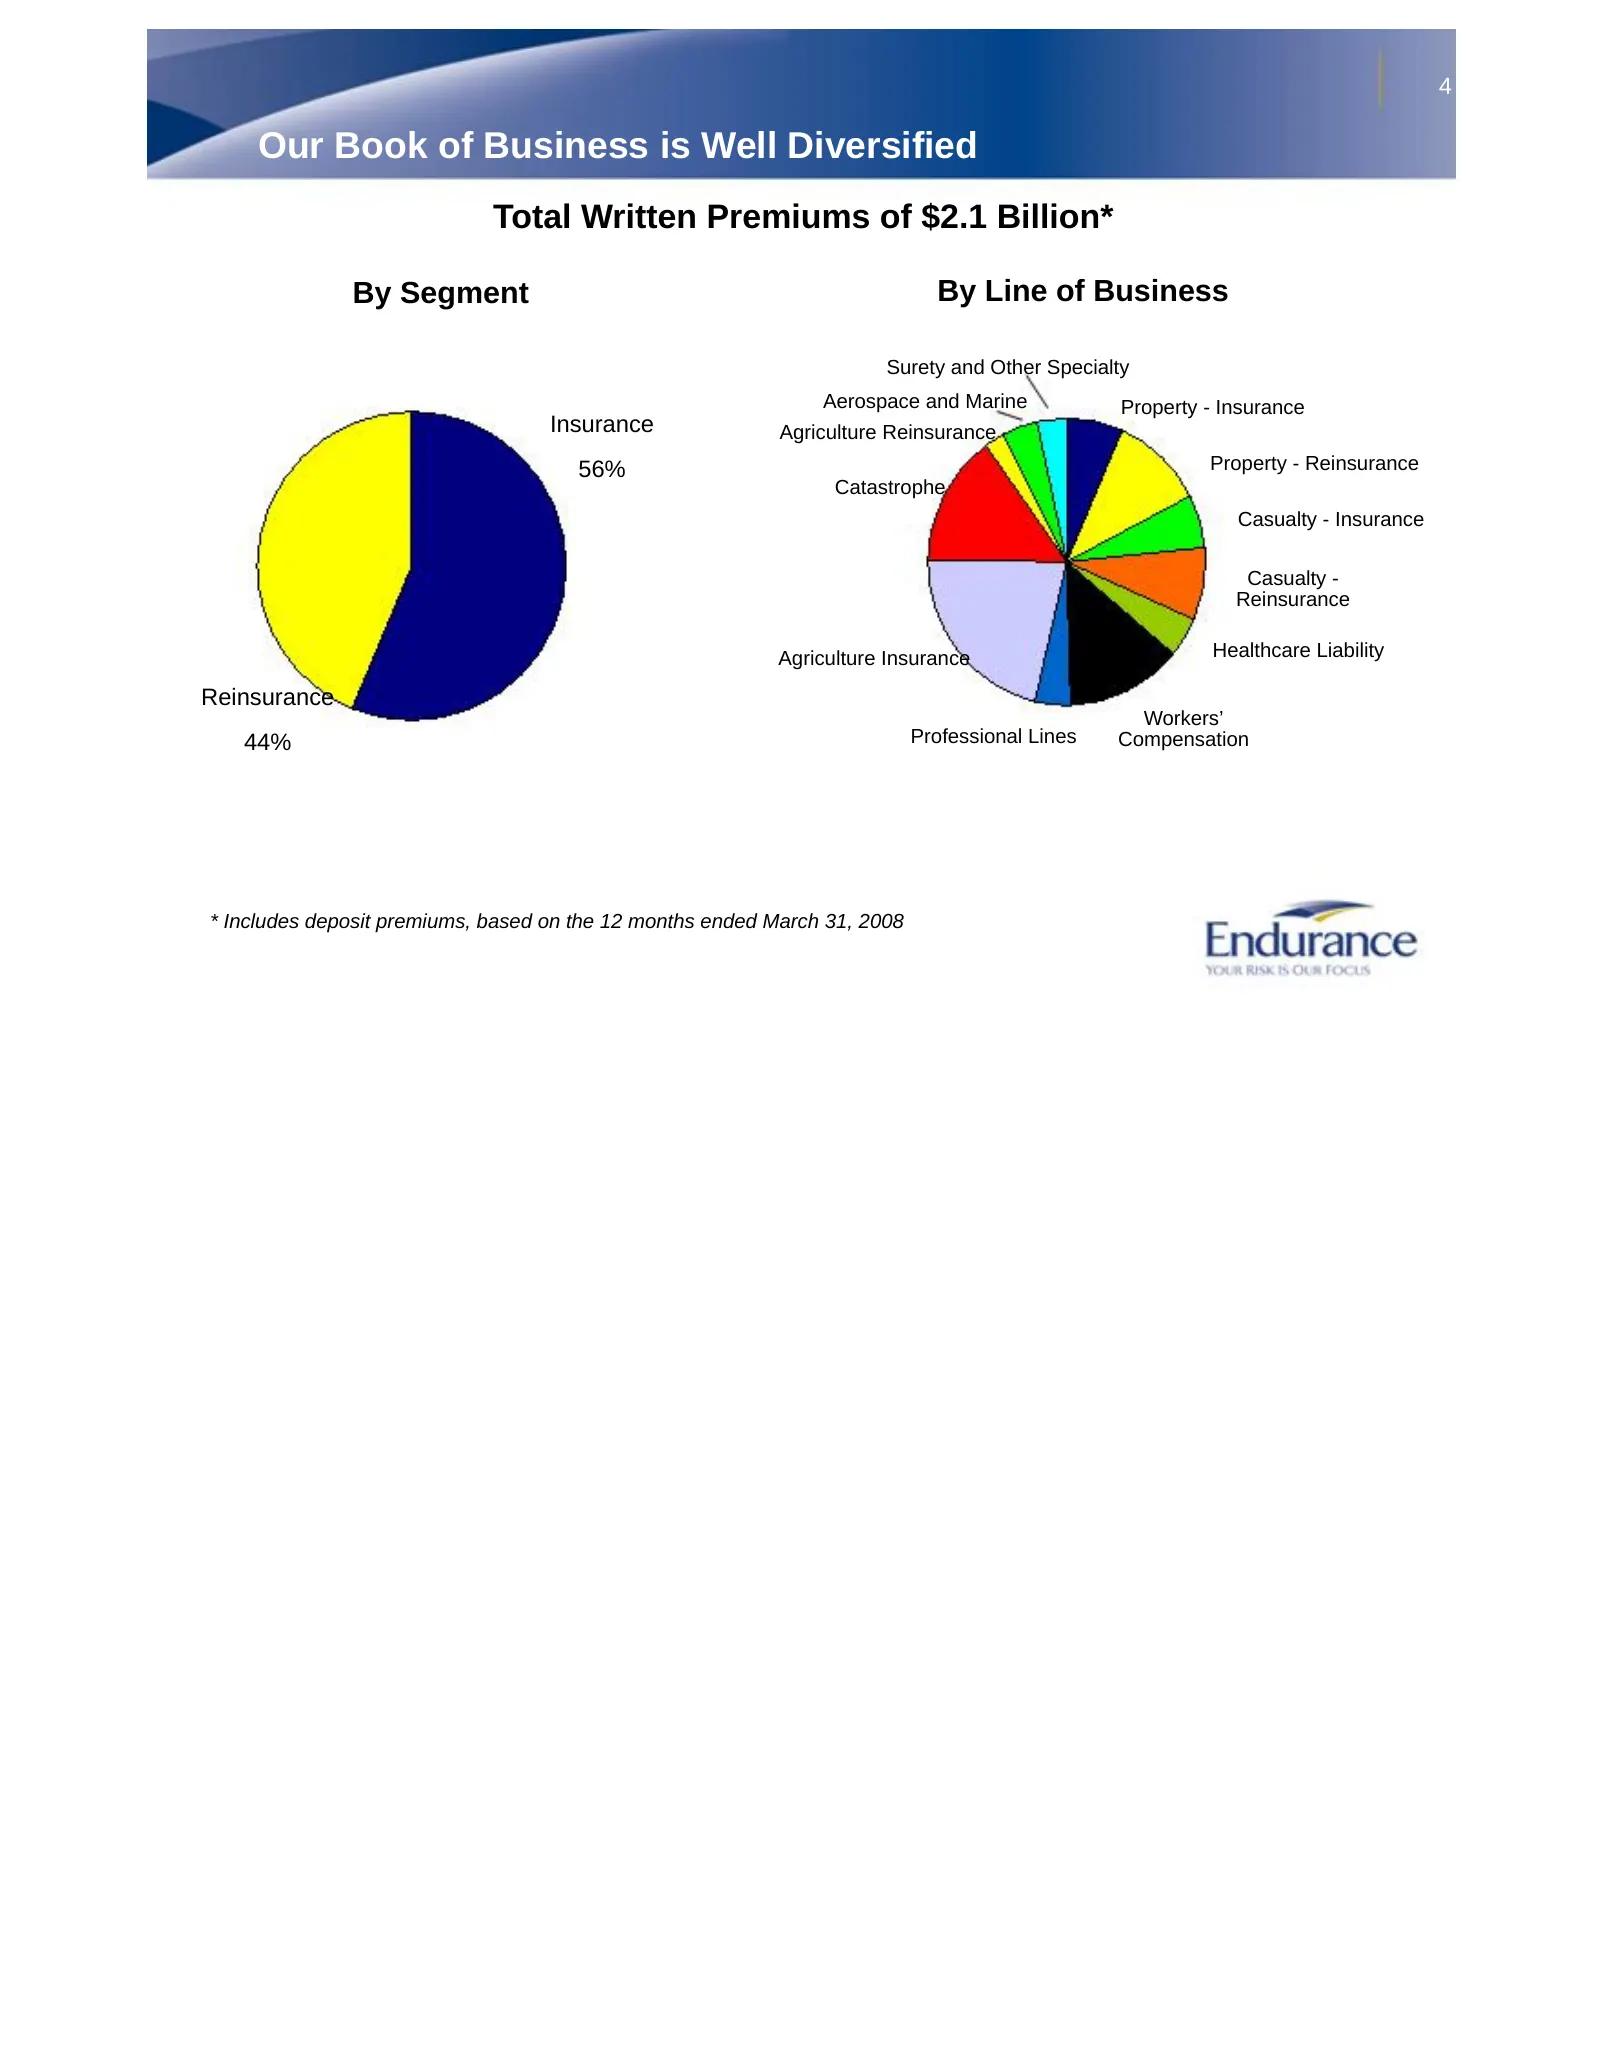
Slide 4: Our Book of Business is Well Diversified
4 Our Book of Business is Well Diversified Total Written Premiums of $2.1 Billion* By Segment By Line of Business Surety and Other Specialty Aerospace and Marine Property - Insurance Insurance Agriculture Reinsurance 56% Property - Reinsurance Catastrophe Casualty - Insurance Casualty - Reinsurance
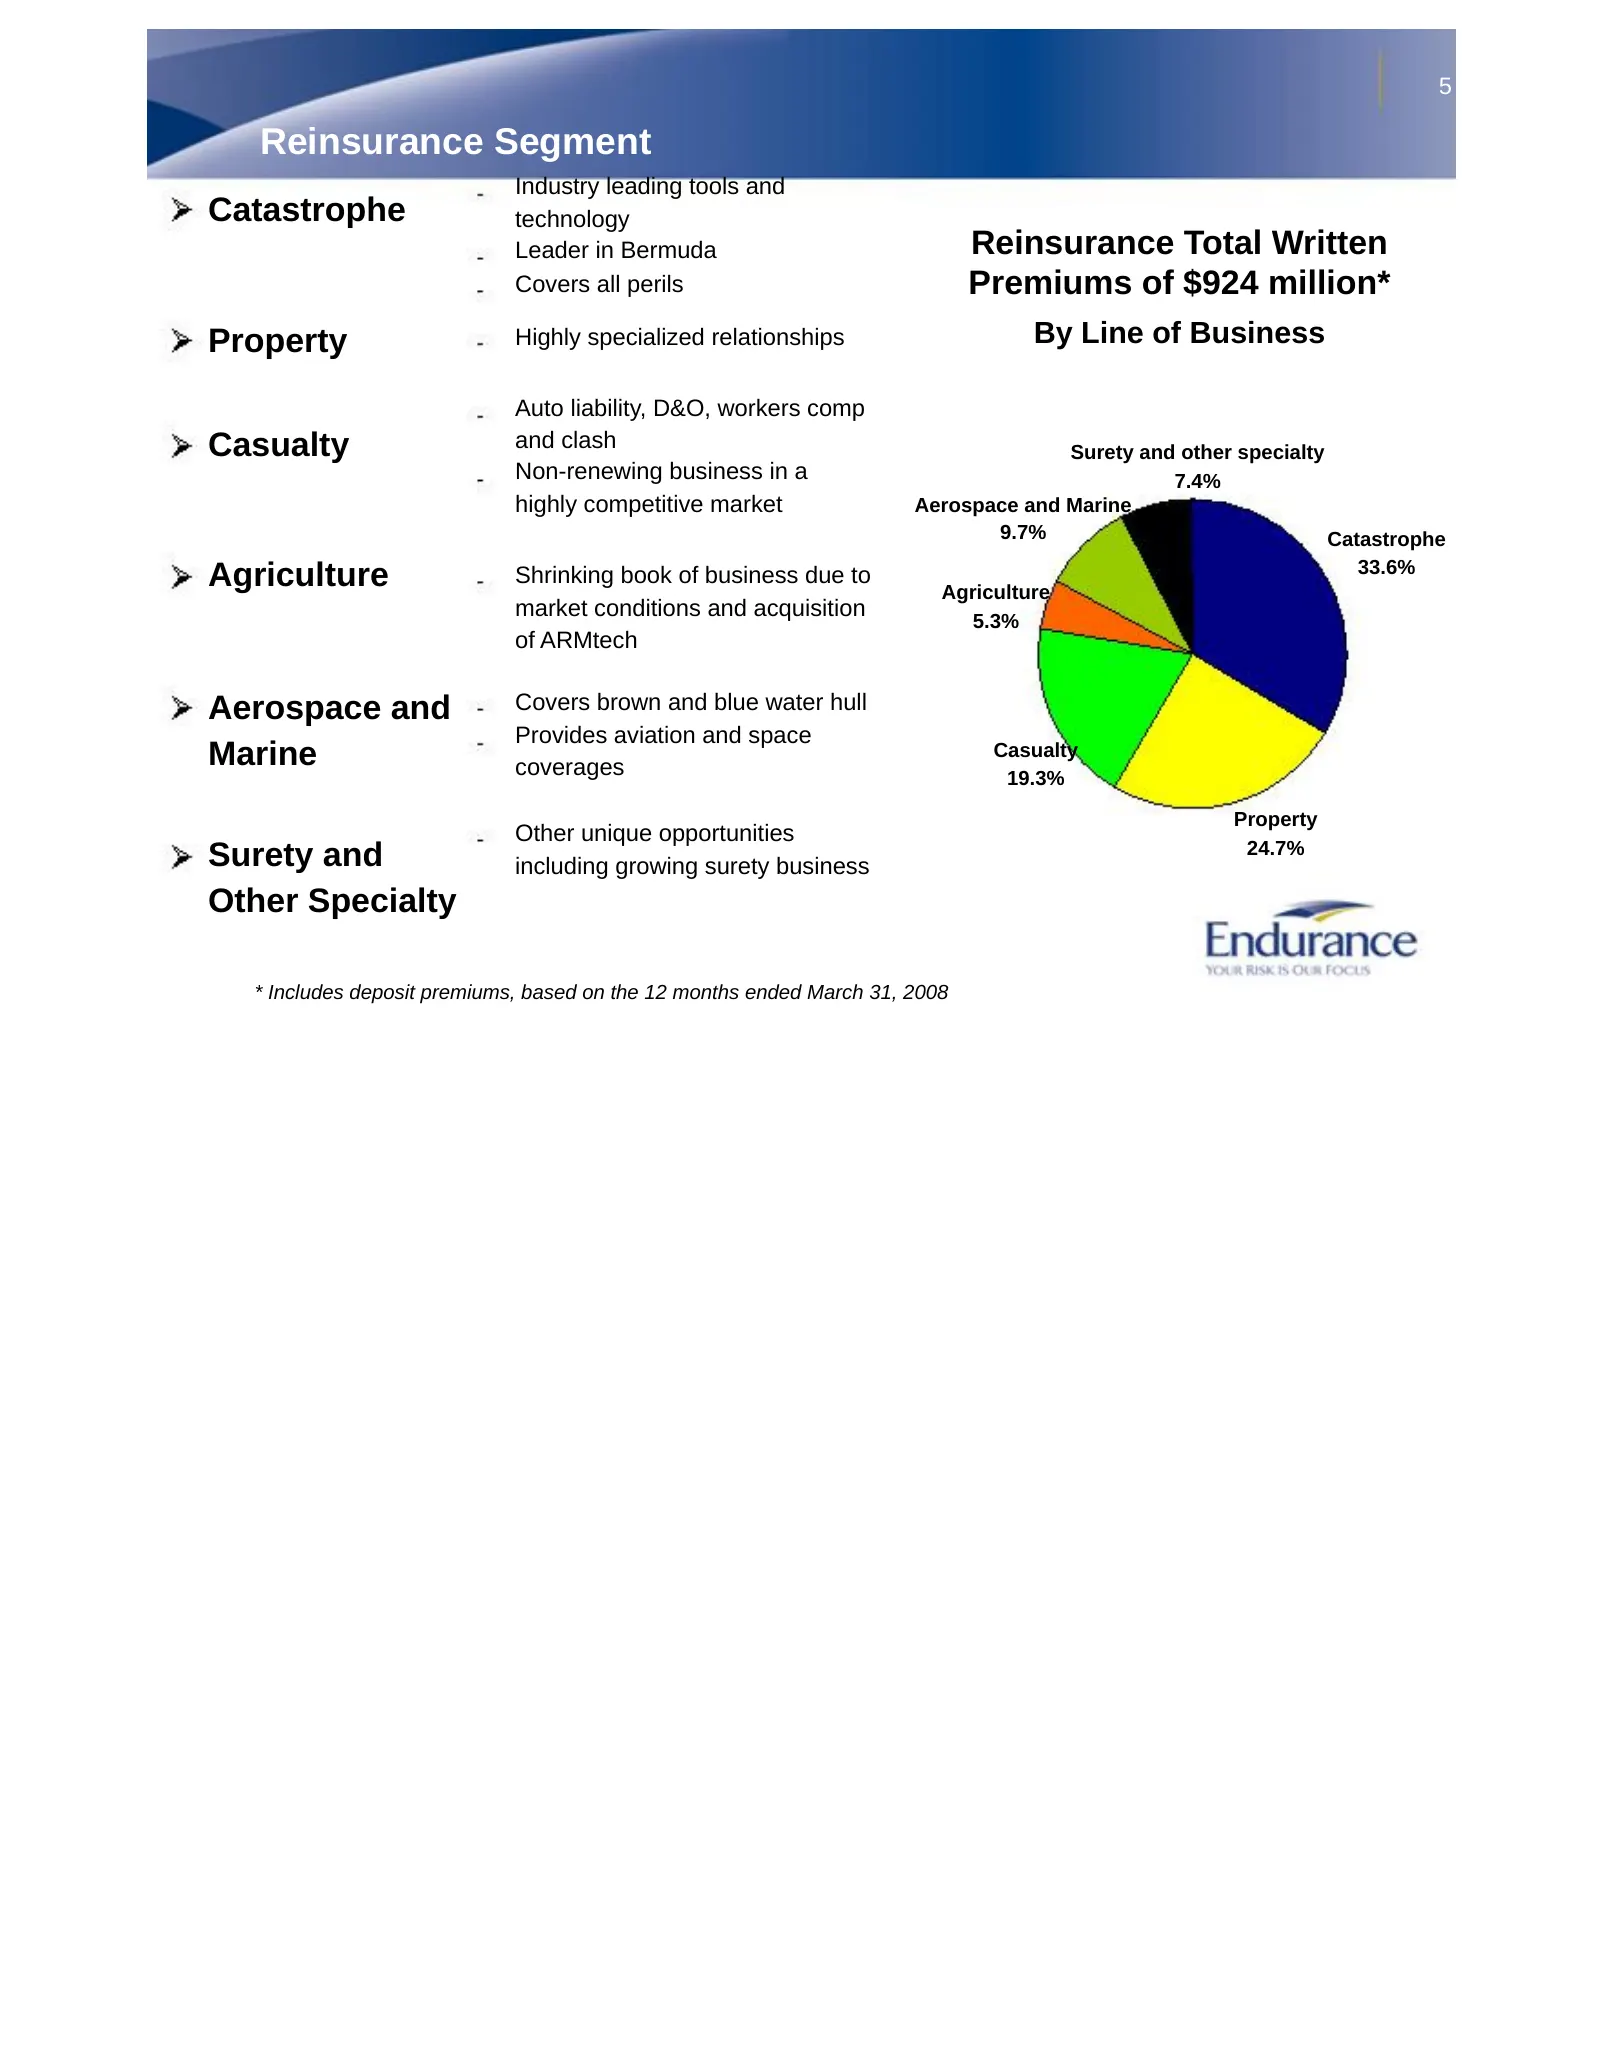
Slide 5: Reinsurance Segment
5 Reinsurance Segment Industry leading tools and Catastrophe technology Leader in Bermuda Reinsurance Total Written Covers all perils Premiums of $924 million* Property Highly specialized relationships By Line of Business Auto liability, D&O, workers comp Casualty and clash Surety and other specialt
Slide 6: Reinsurance – Maintaining Discipline While Exploring Opportunities
6 Reinsurance – Maintaining Discipline While Exploring Opportunities Disciplined approach to the softening market Active price monitoring and portfolio management Proactive non-renewal of business that does not meet standards (casualty, proportional agriculture, and international exposures) Continui
Slide 7: Insurance Segment
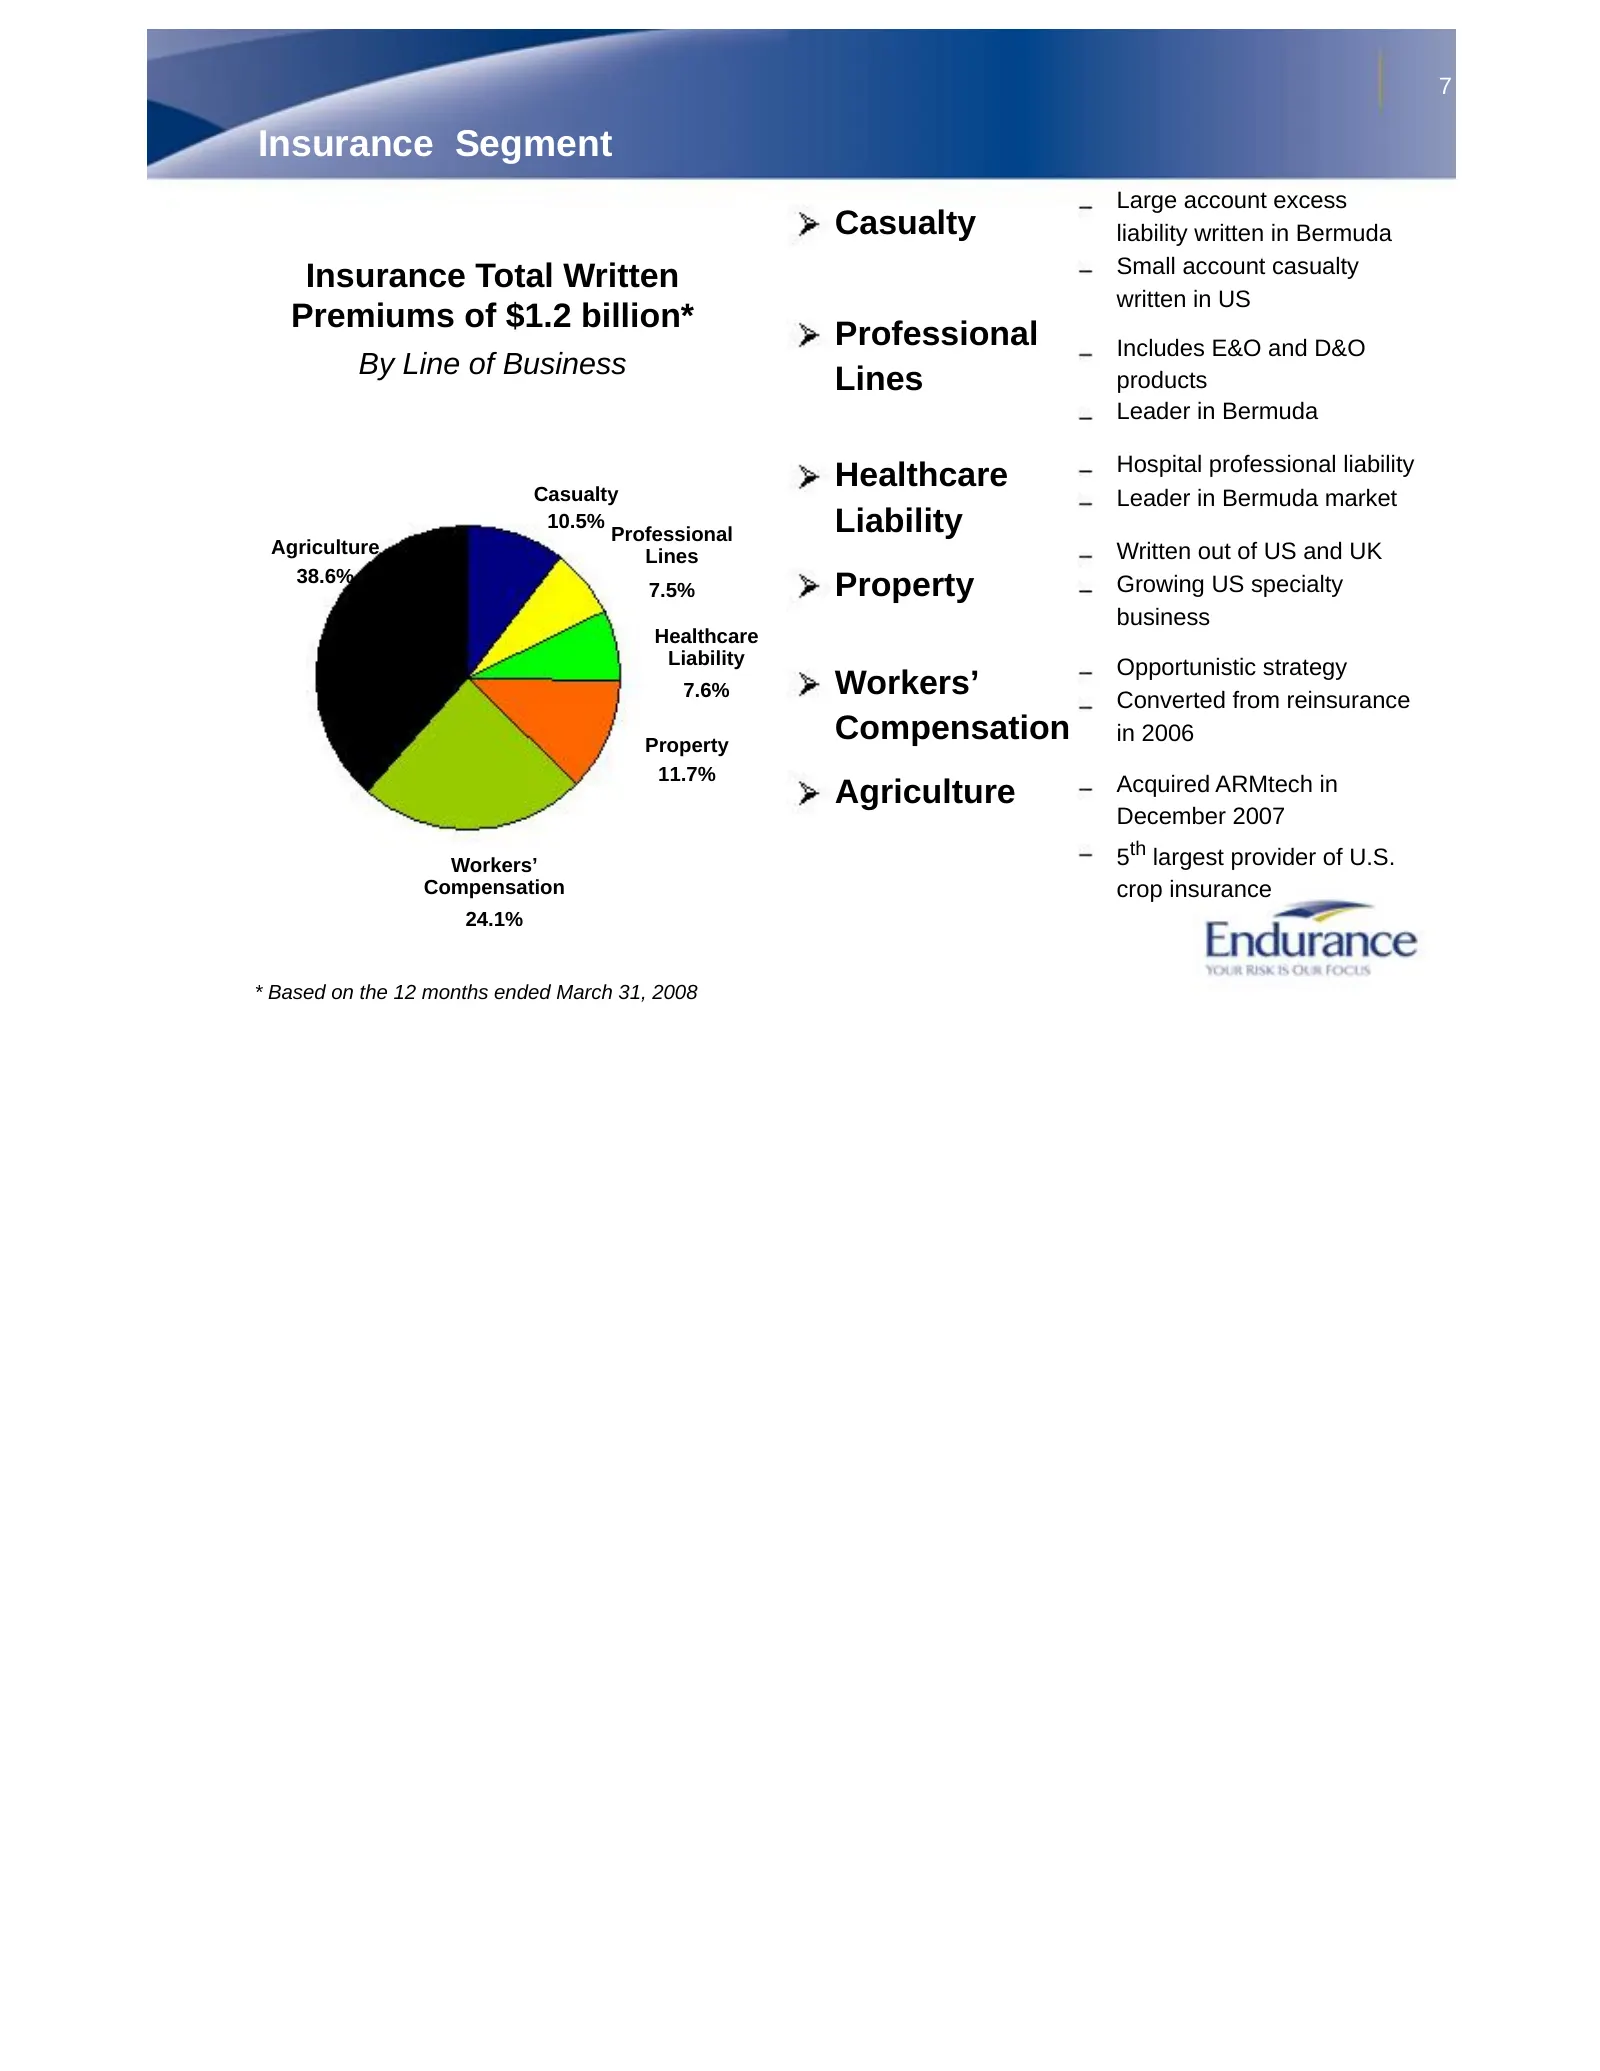
7 Insurance Segment Large account excess Casualty liability written in Bermuda Small account casualty Insurance Total Written written in US Premiums of $1.2 billion* Professional Includes E&O and D&O By Line of Business Lines products Leader in Bermuda Hospital professional liability Casualty Health
Slide 8: Insurance - Our Fastest Growing Segment
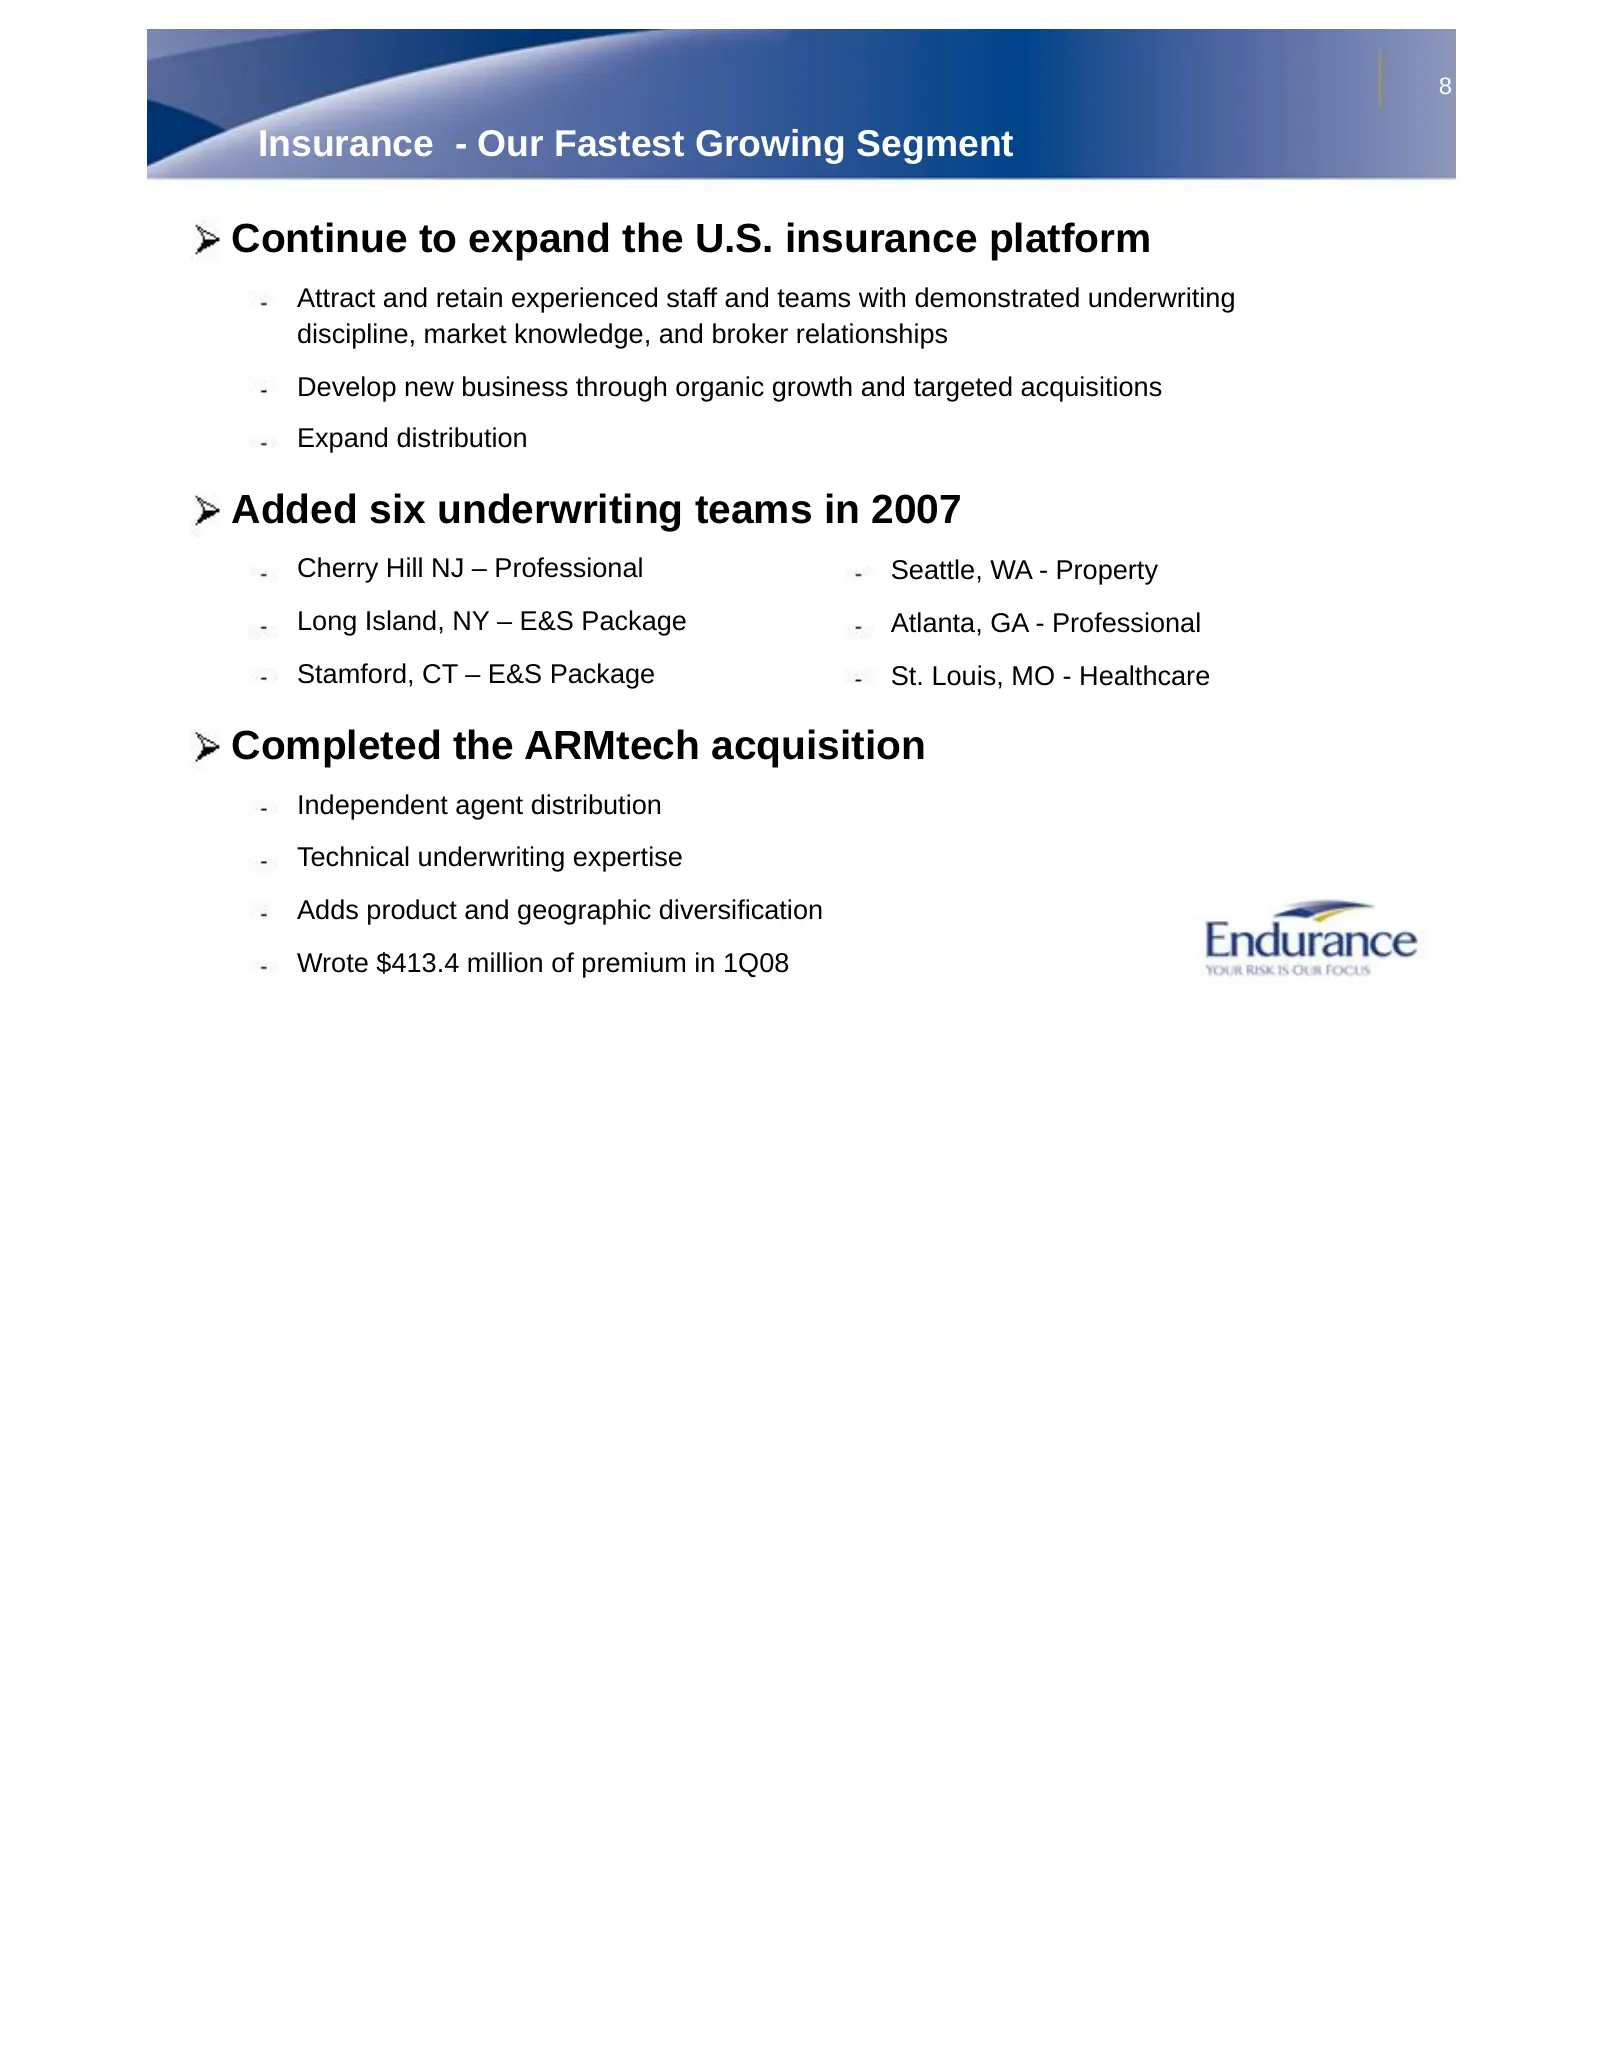
8 Insurance - Our Fastest Growing Segment Continue to expand the U.S. insurance platform Attract and retain experienced staff and teams with demonstrated underwriting discipline, market knowledge, and broker relationships Develop new business through organic growth and targeted acquisitions Expand d
Slide 9: Strong Risk Management Focus - Portfolio Expected Risk Curve
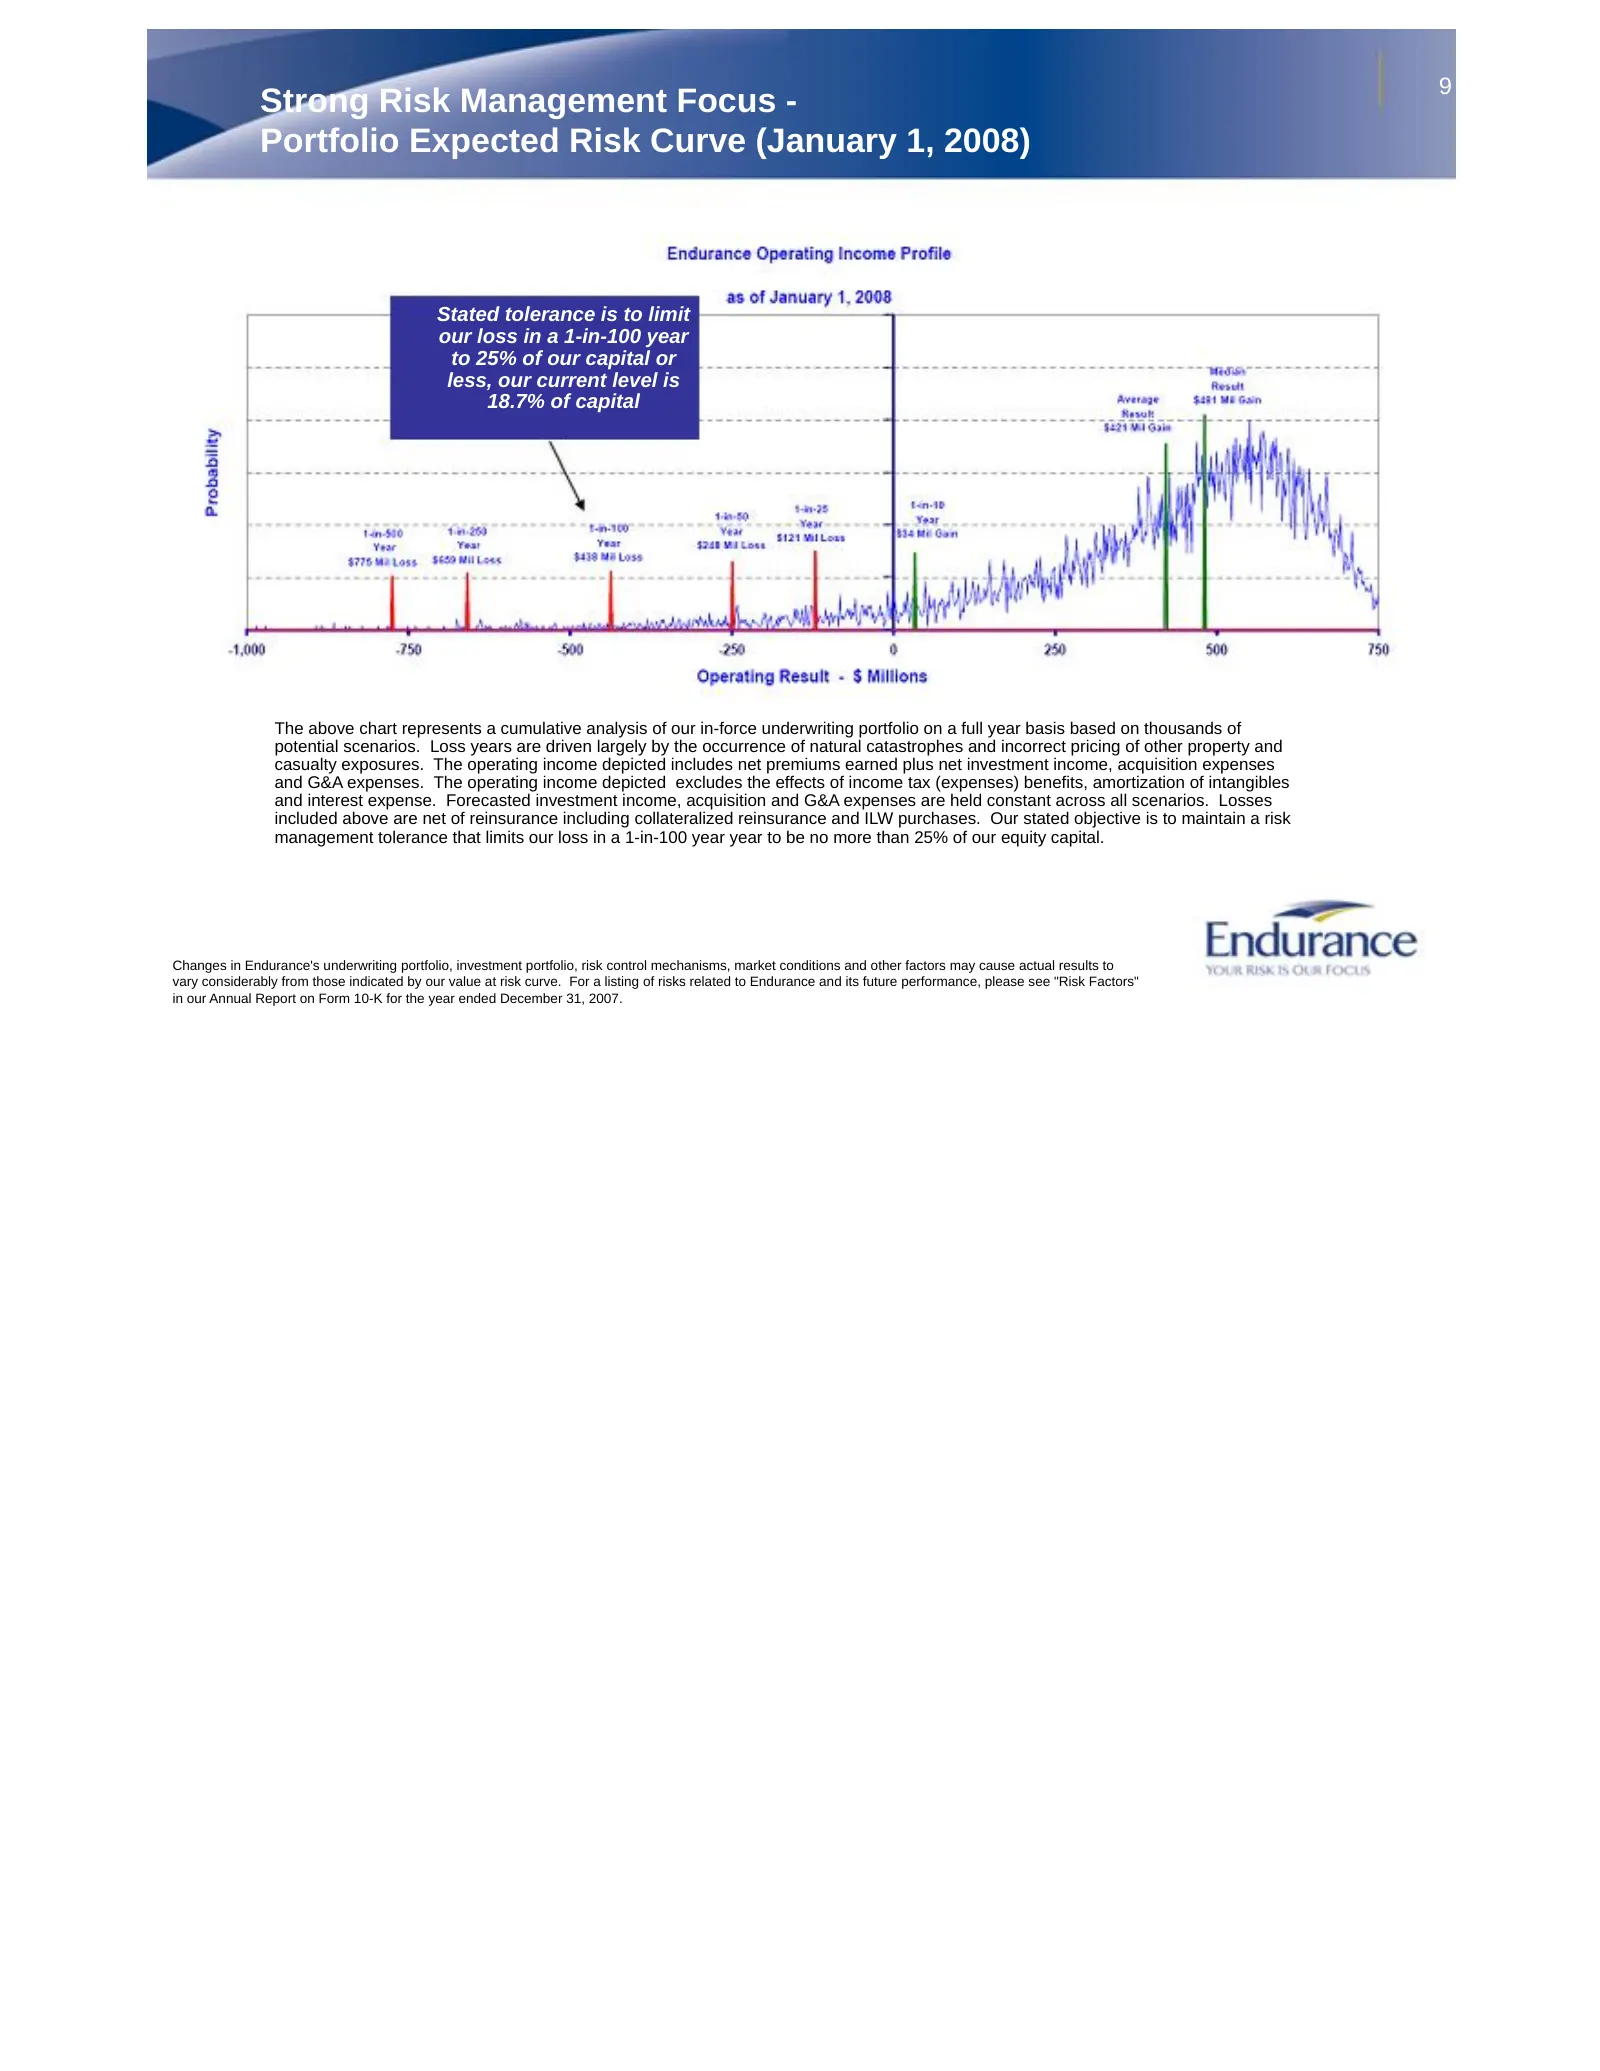
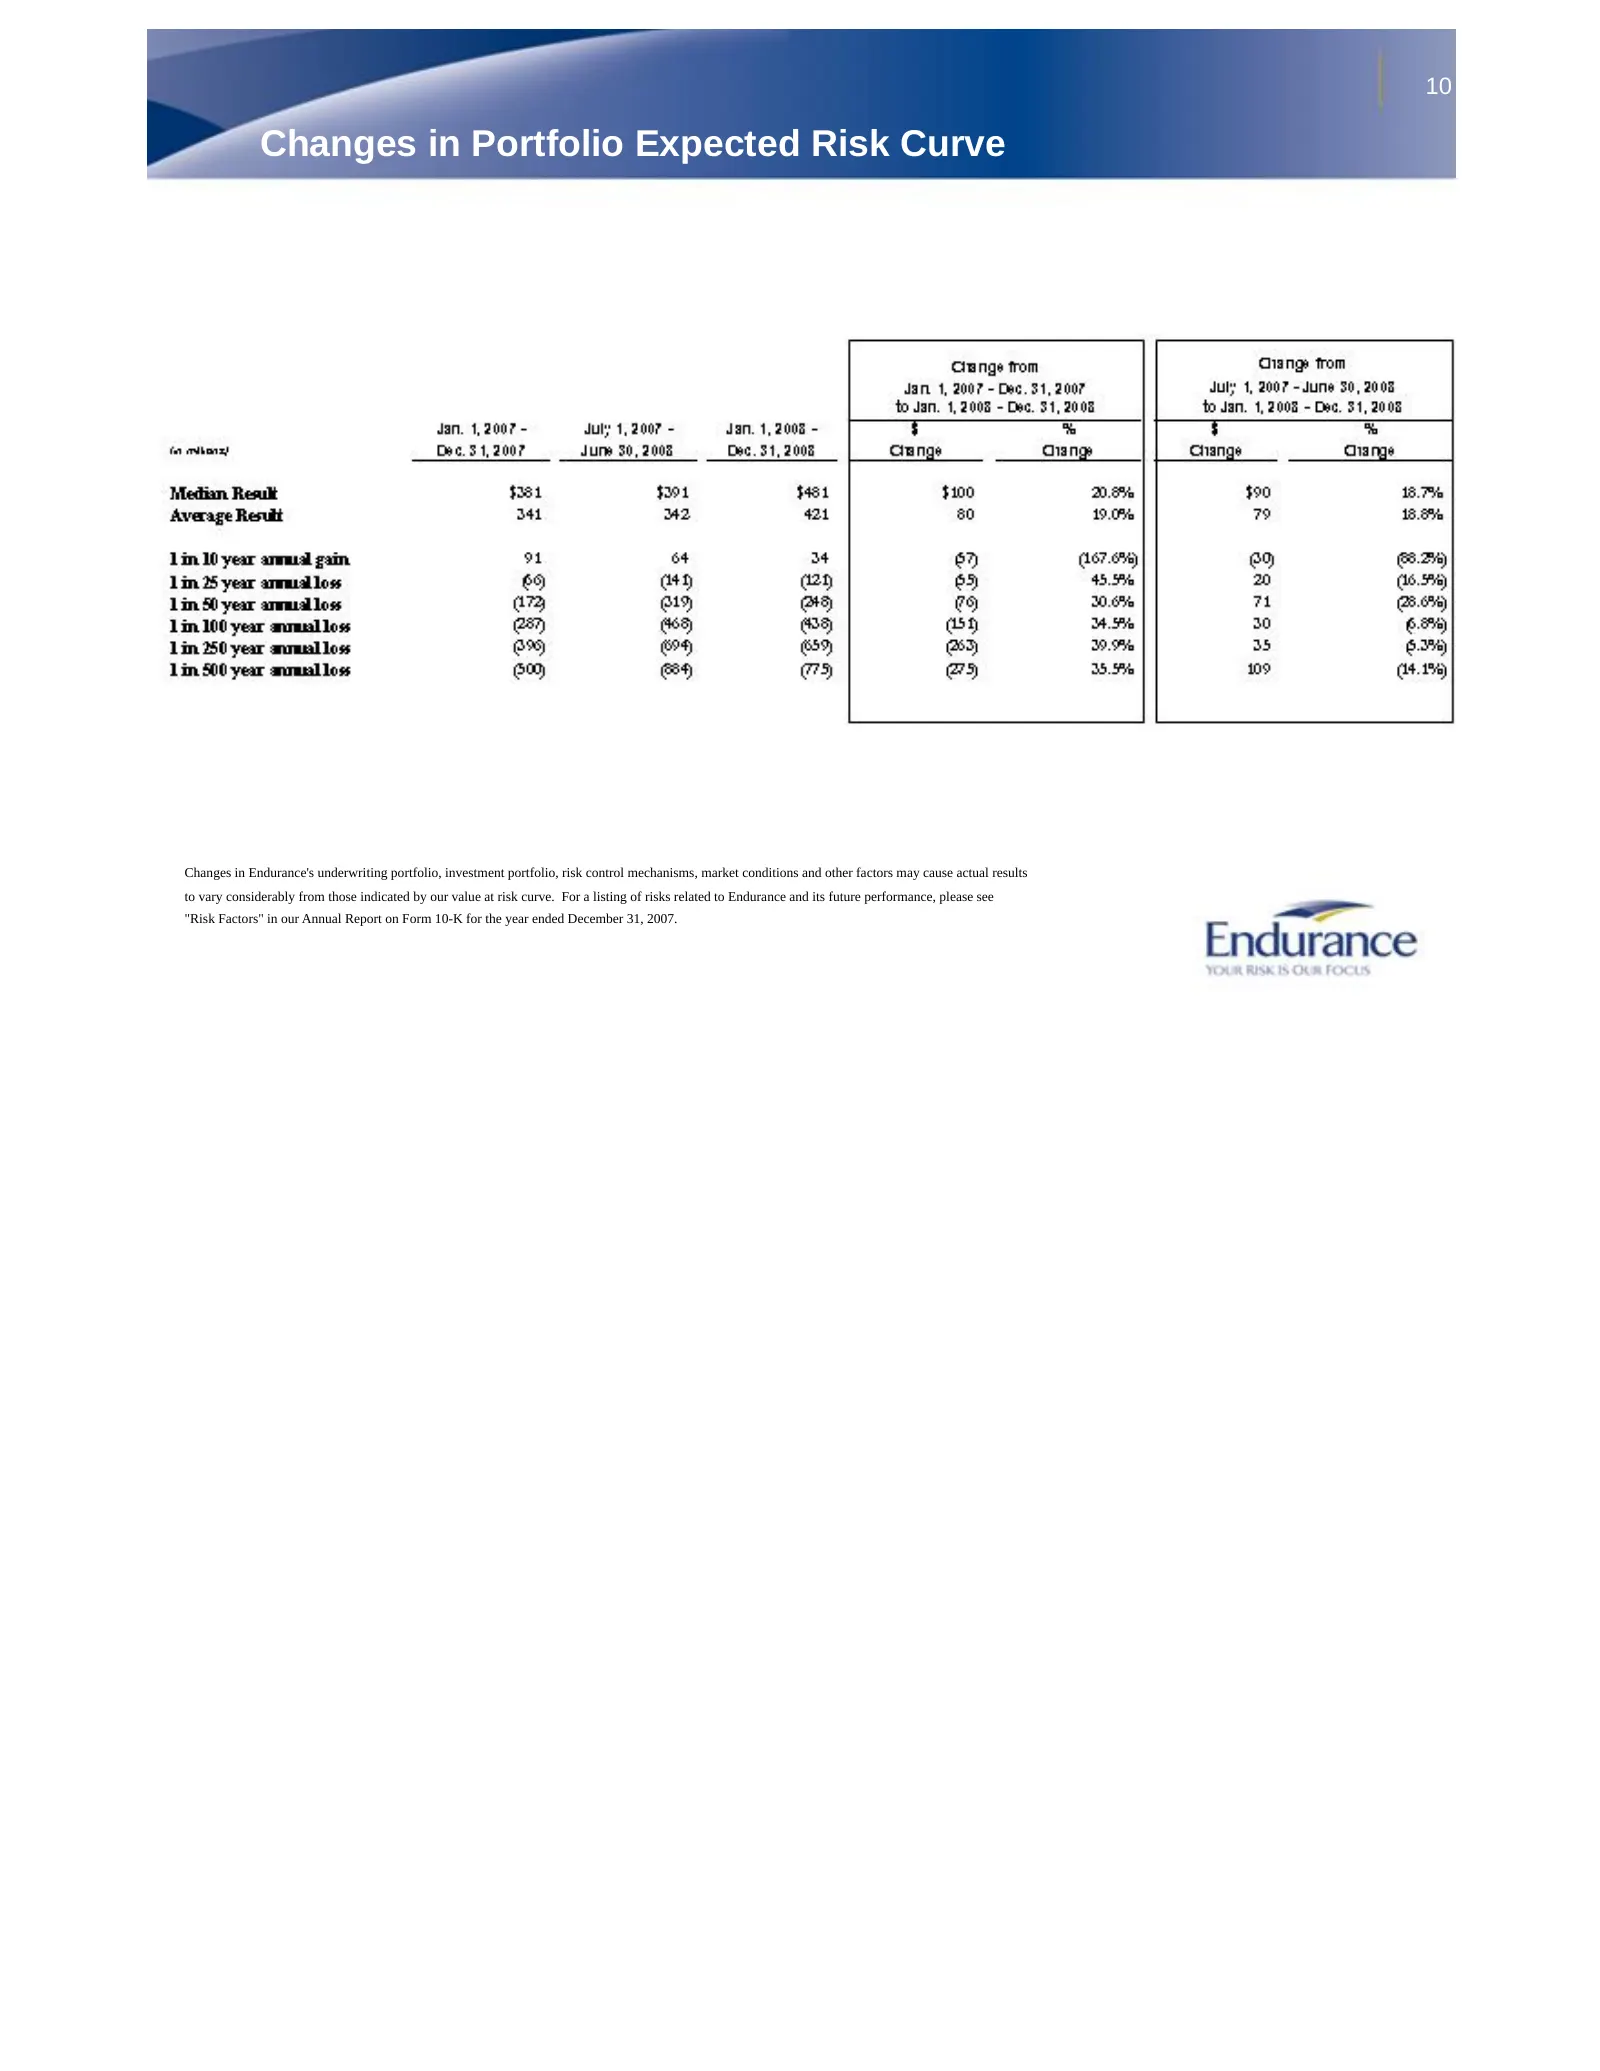
9 Strong Risk Management Focus - Portfolio Expected Risk Curve (January 1, 2008) Stated tolerance is to limit our loss in a 1-in-100 year to 25% of our capital or less, our current level is 18.7% of capital The above chart represents a cumulative analysis of our in-force underwriting portfolio on a
Slide 10: Changes in Portfolio Expected Risk Curve
10 Changes in Portfolio Expected Risk Curve Changes in Endurance's underwriting portfolio, investment portfolio, risk control mechanisms, market conditions and other factors may cause actual results to vary considerably from those indicated by our value at risk curve. For a listing of risks related
Slide 11: Portfolio Management Has Generated Stable Premiums
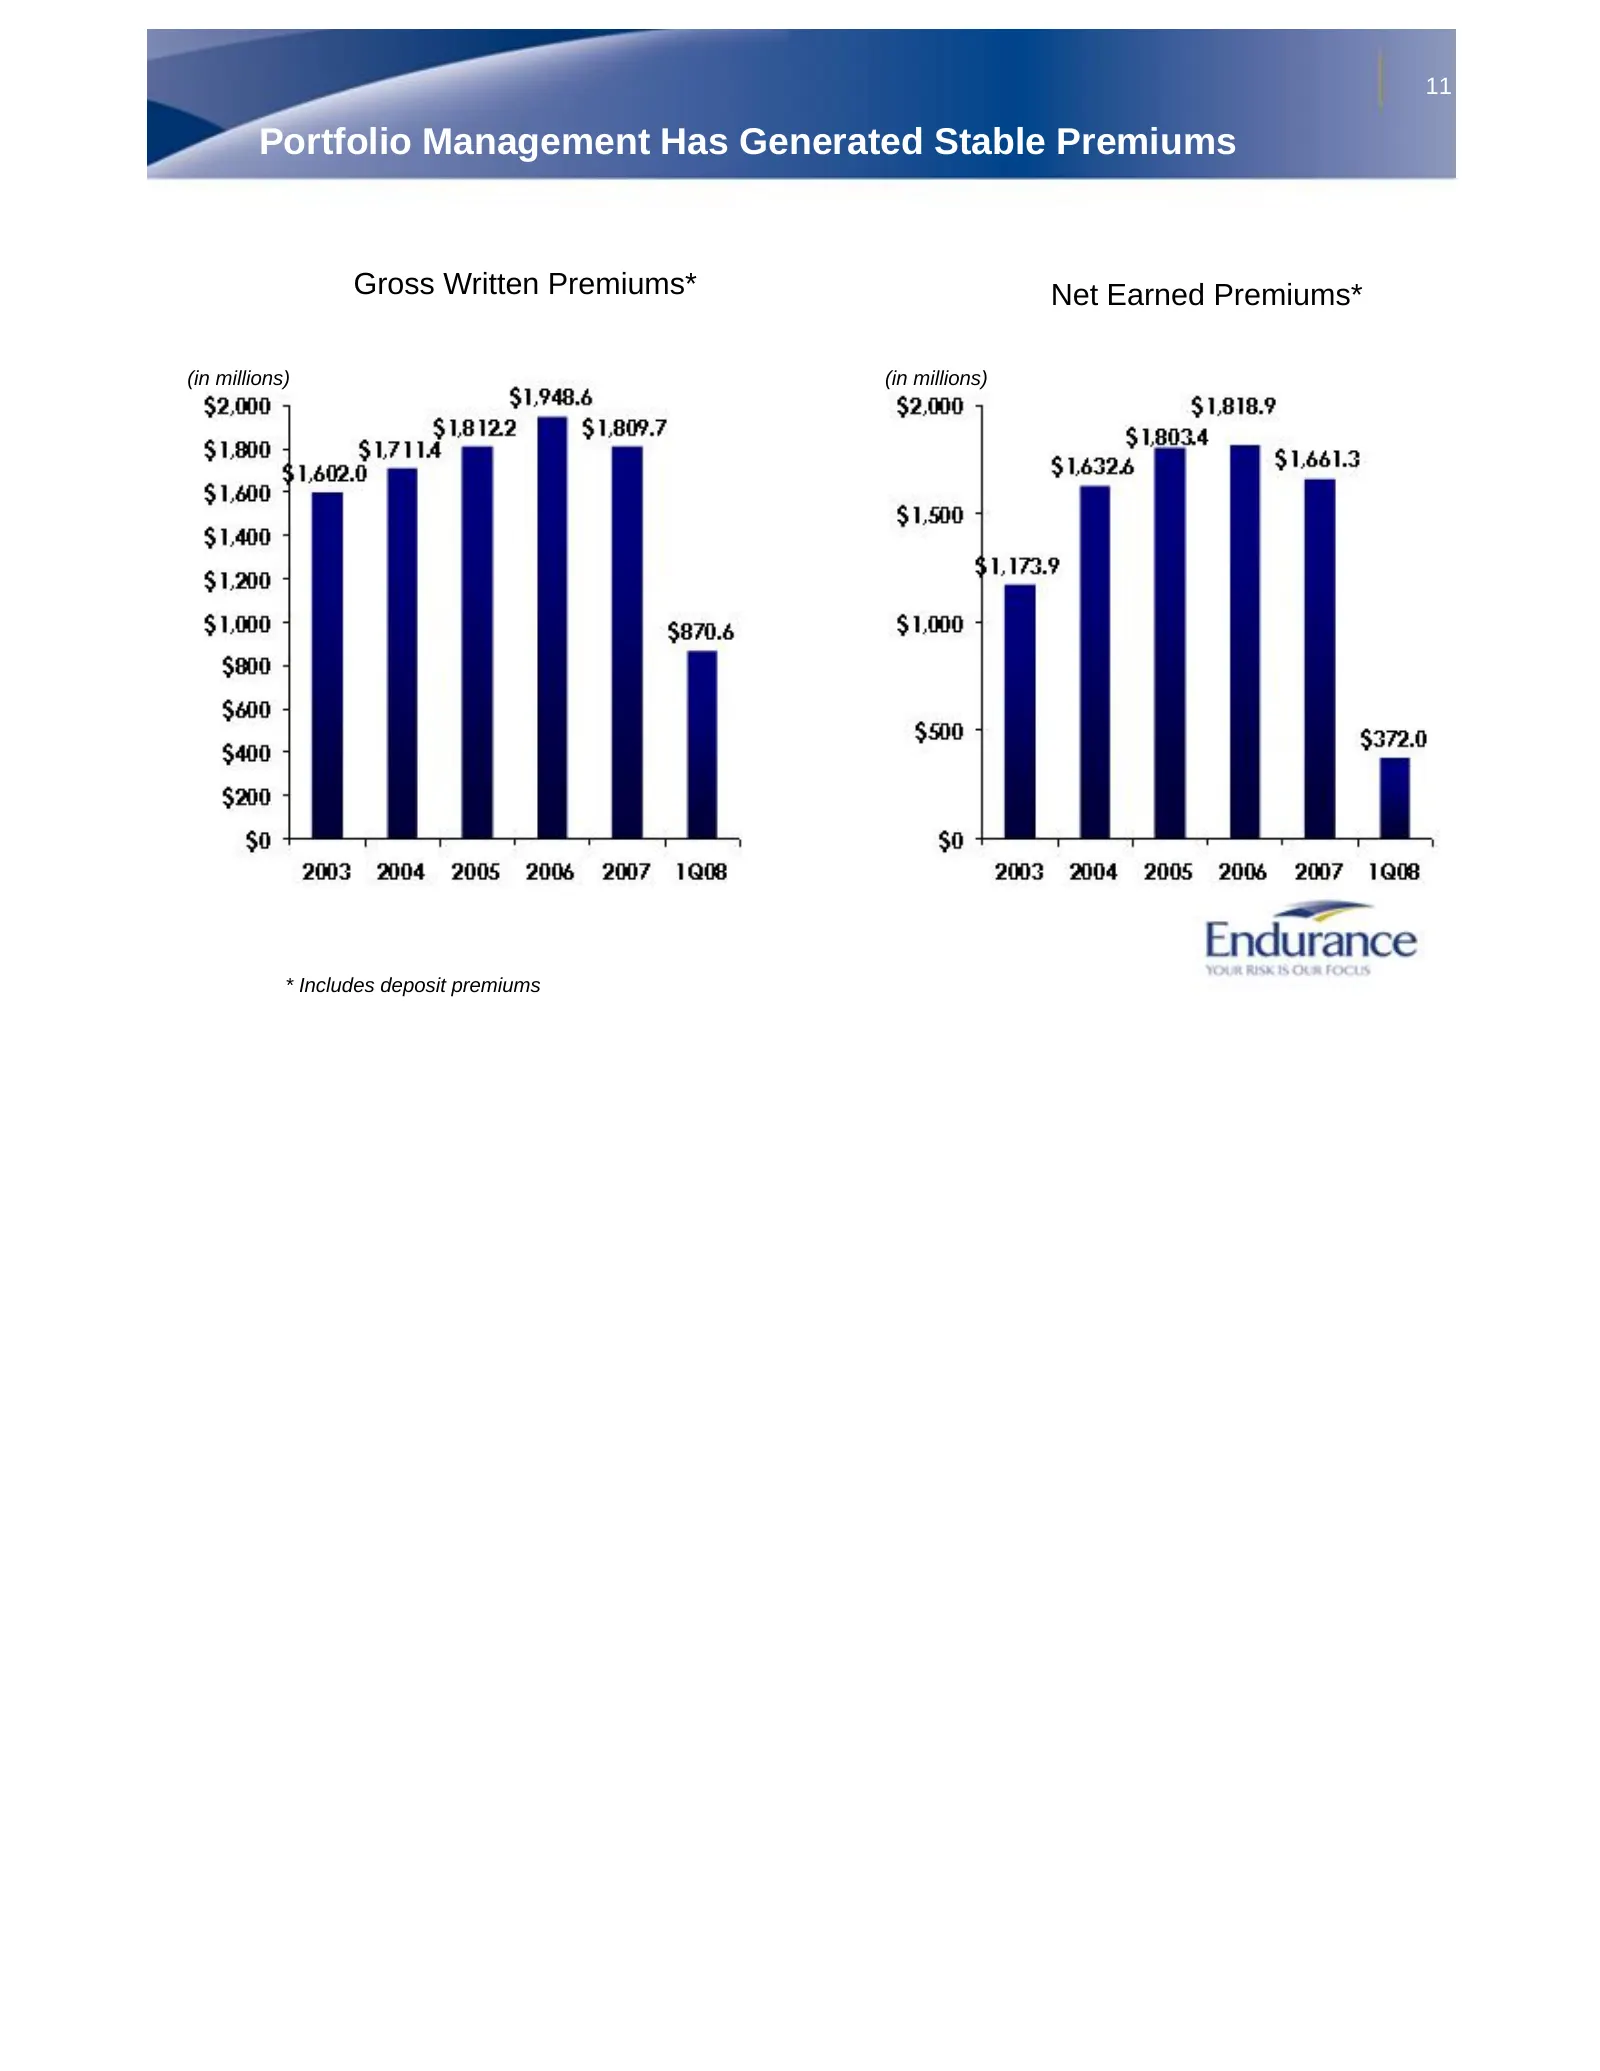
11 Portfolio Management Has Generated Stable Premiums Gross Written Premiums* Net Earned Premiums* (in millions) (in millions) * Includes deposit premiums
Slide 12: Overall Underwriting Has Been Strong
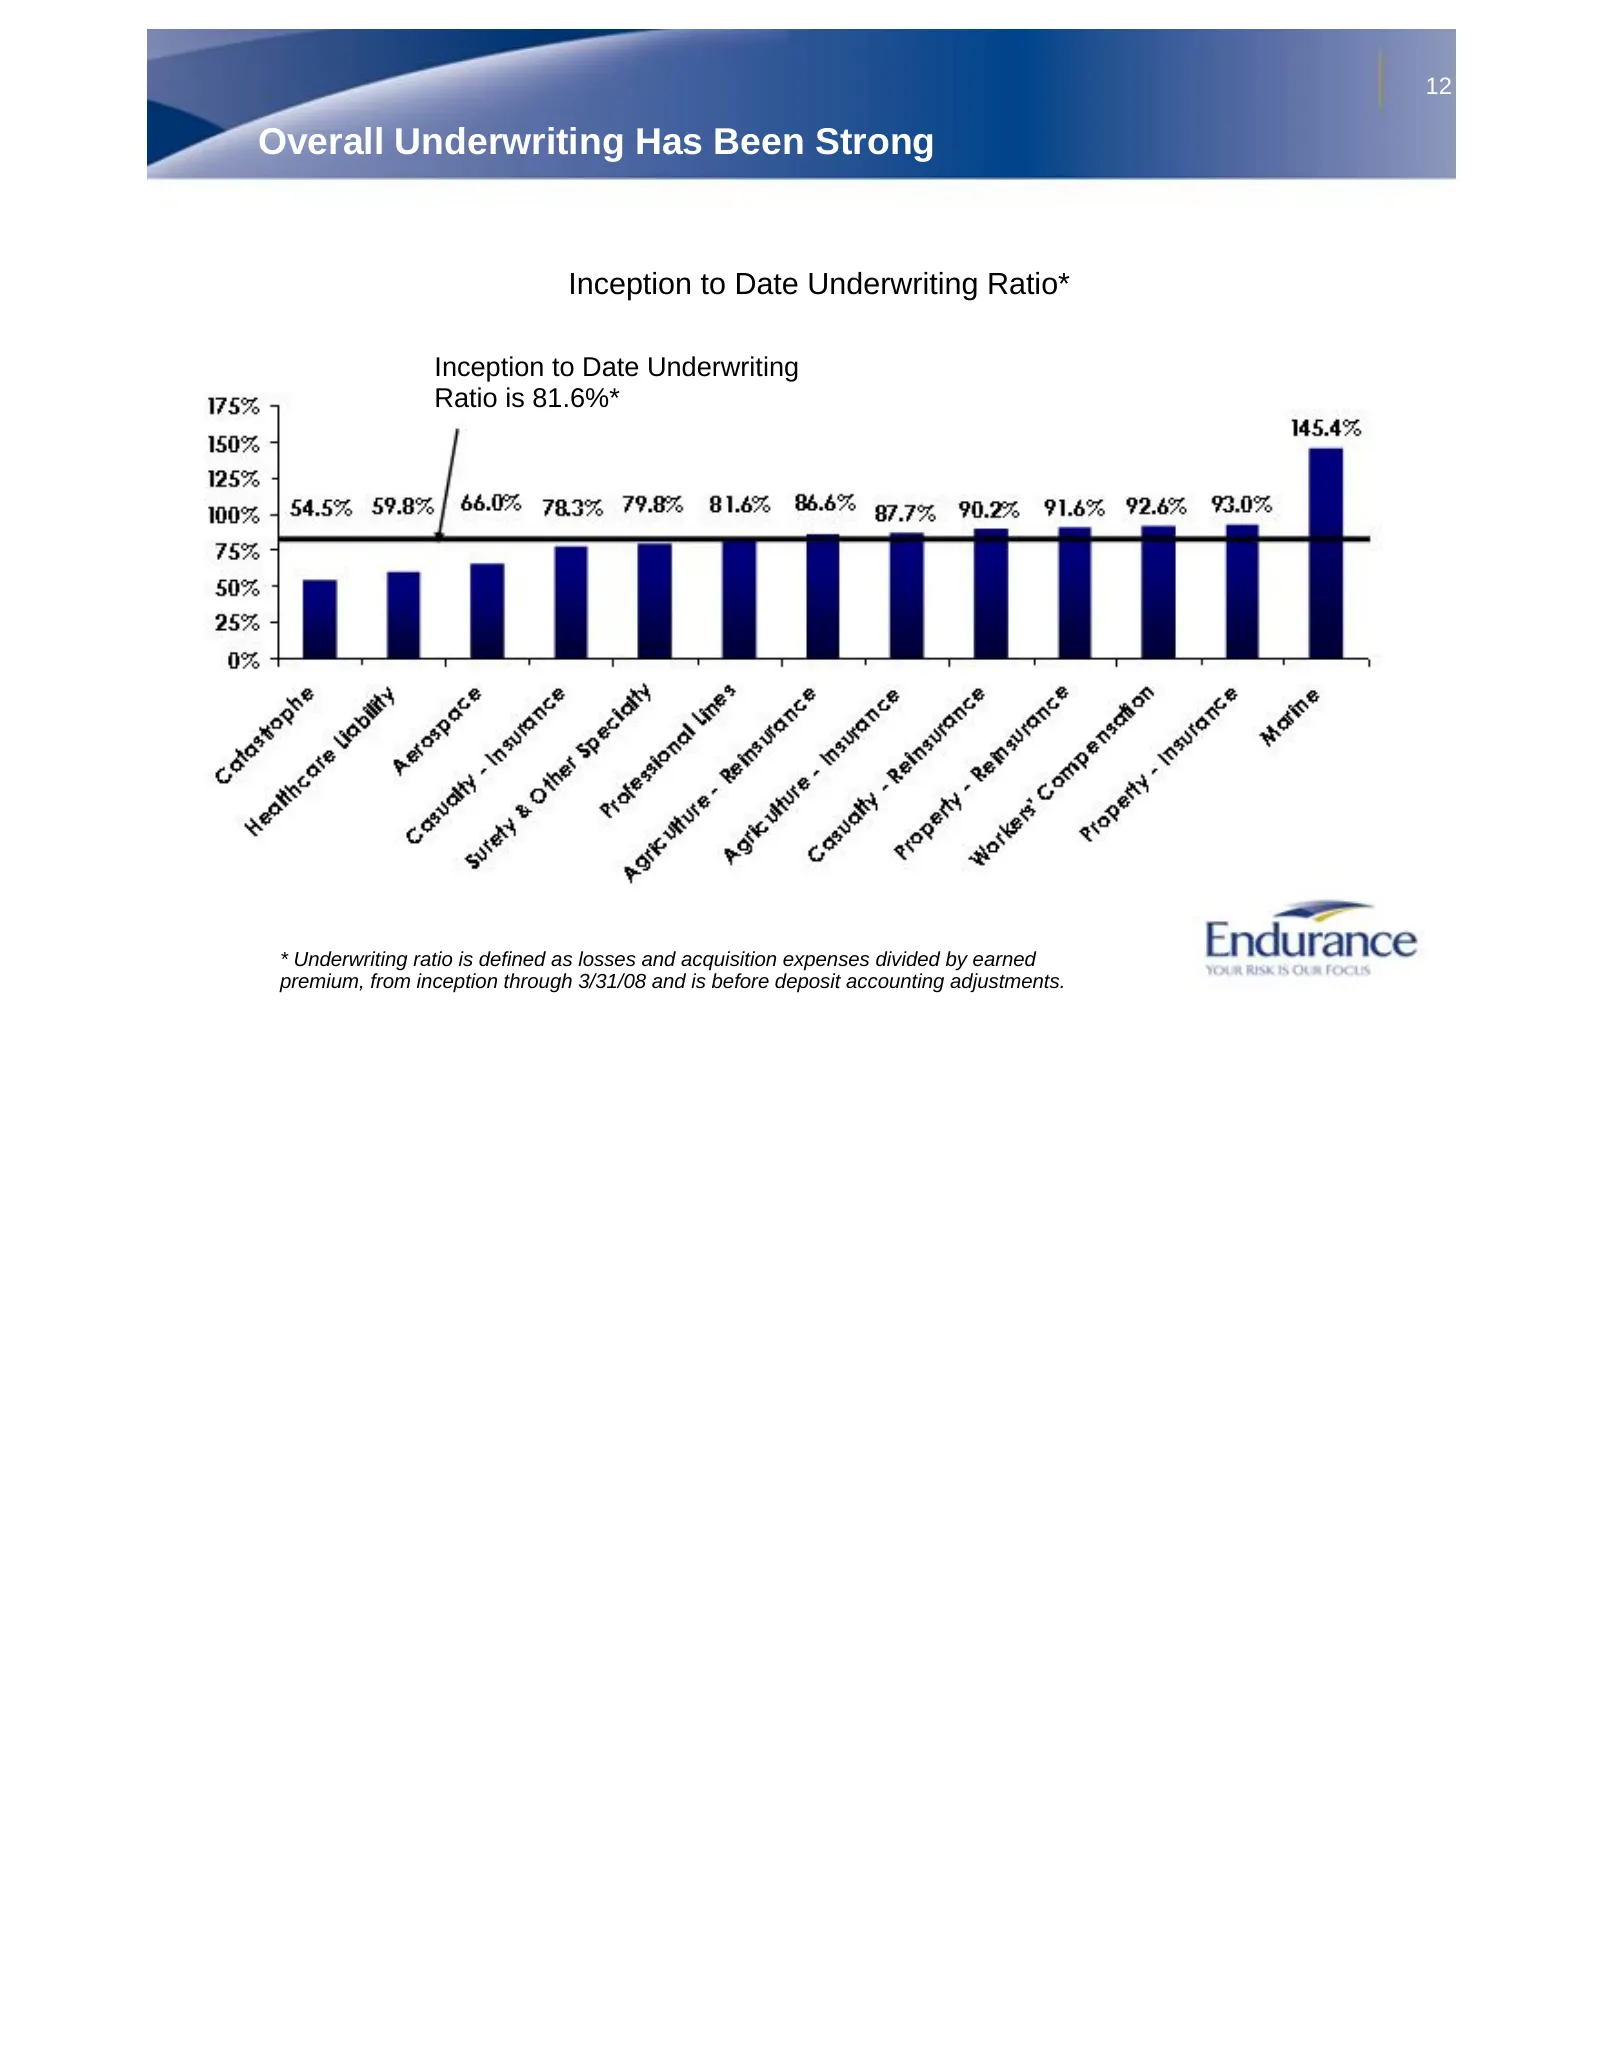
12 Overall Underwriting Has Been Strong Inception to Date Underwriting Ratio* Inception to Date Underwriting Ratio is 81.6%* * Underwriting ratio is defined as losses and acquisition expenses divided by earned premium, from inception through 3/31/08 and is before deposit accounting adjustments.
Slide 13: Strong Financial Performance
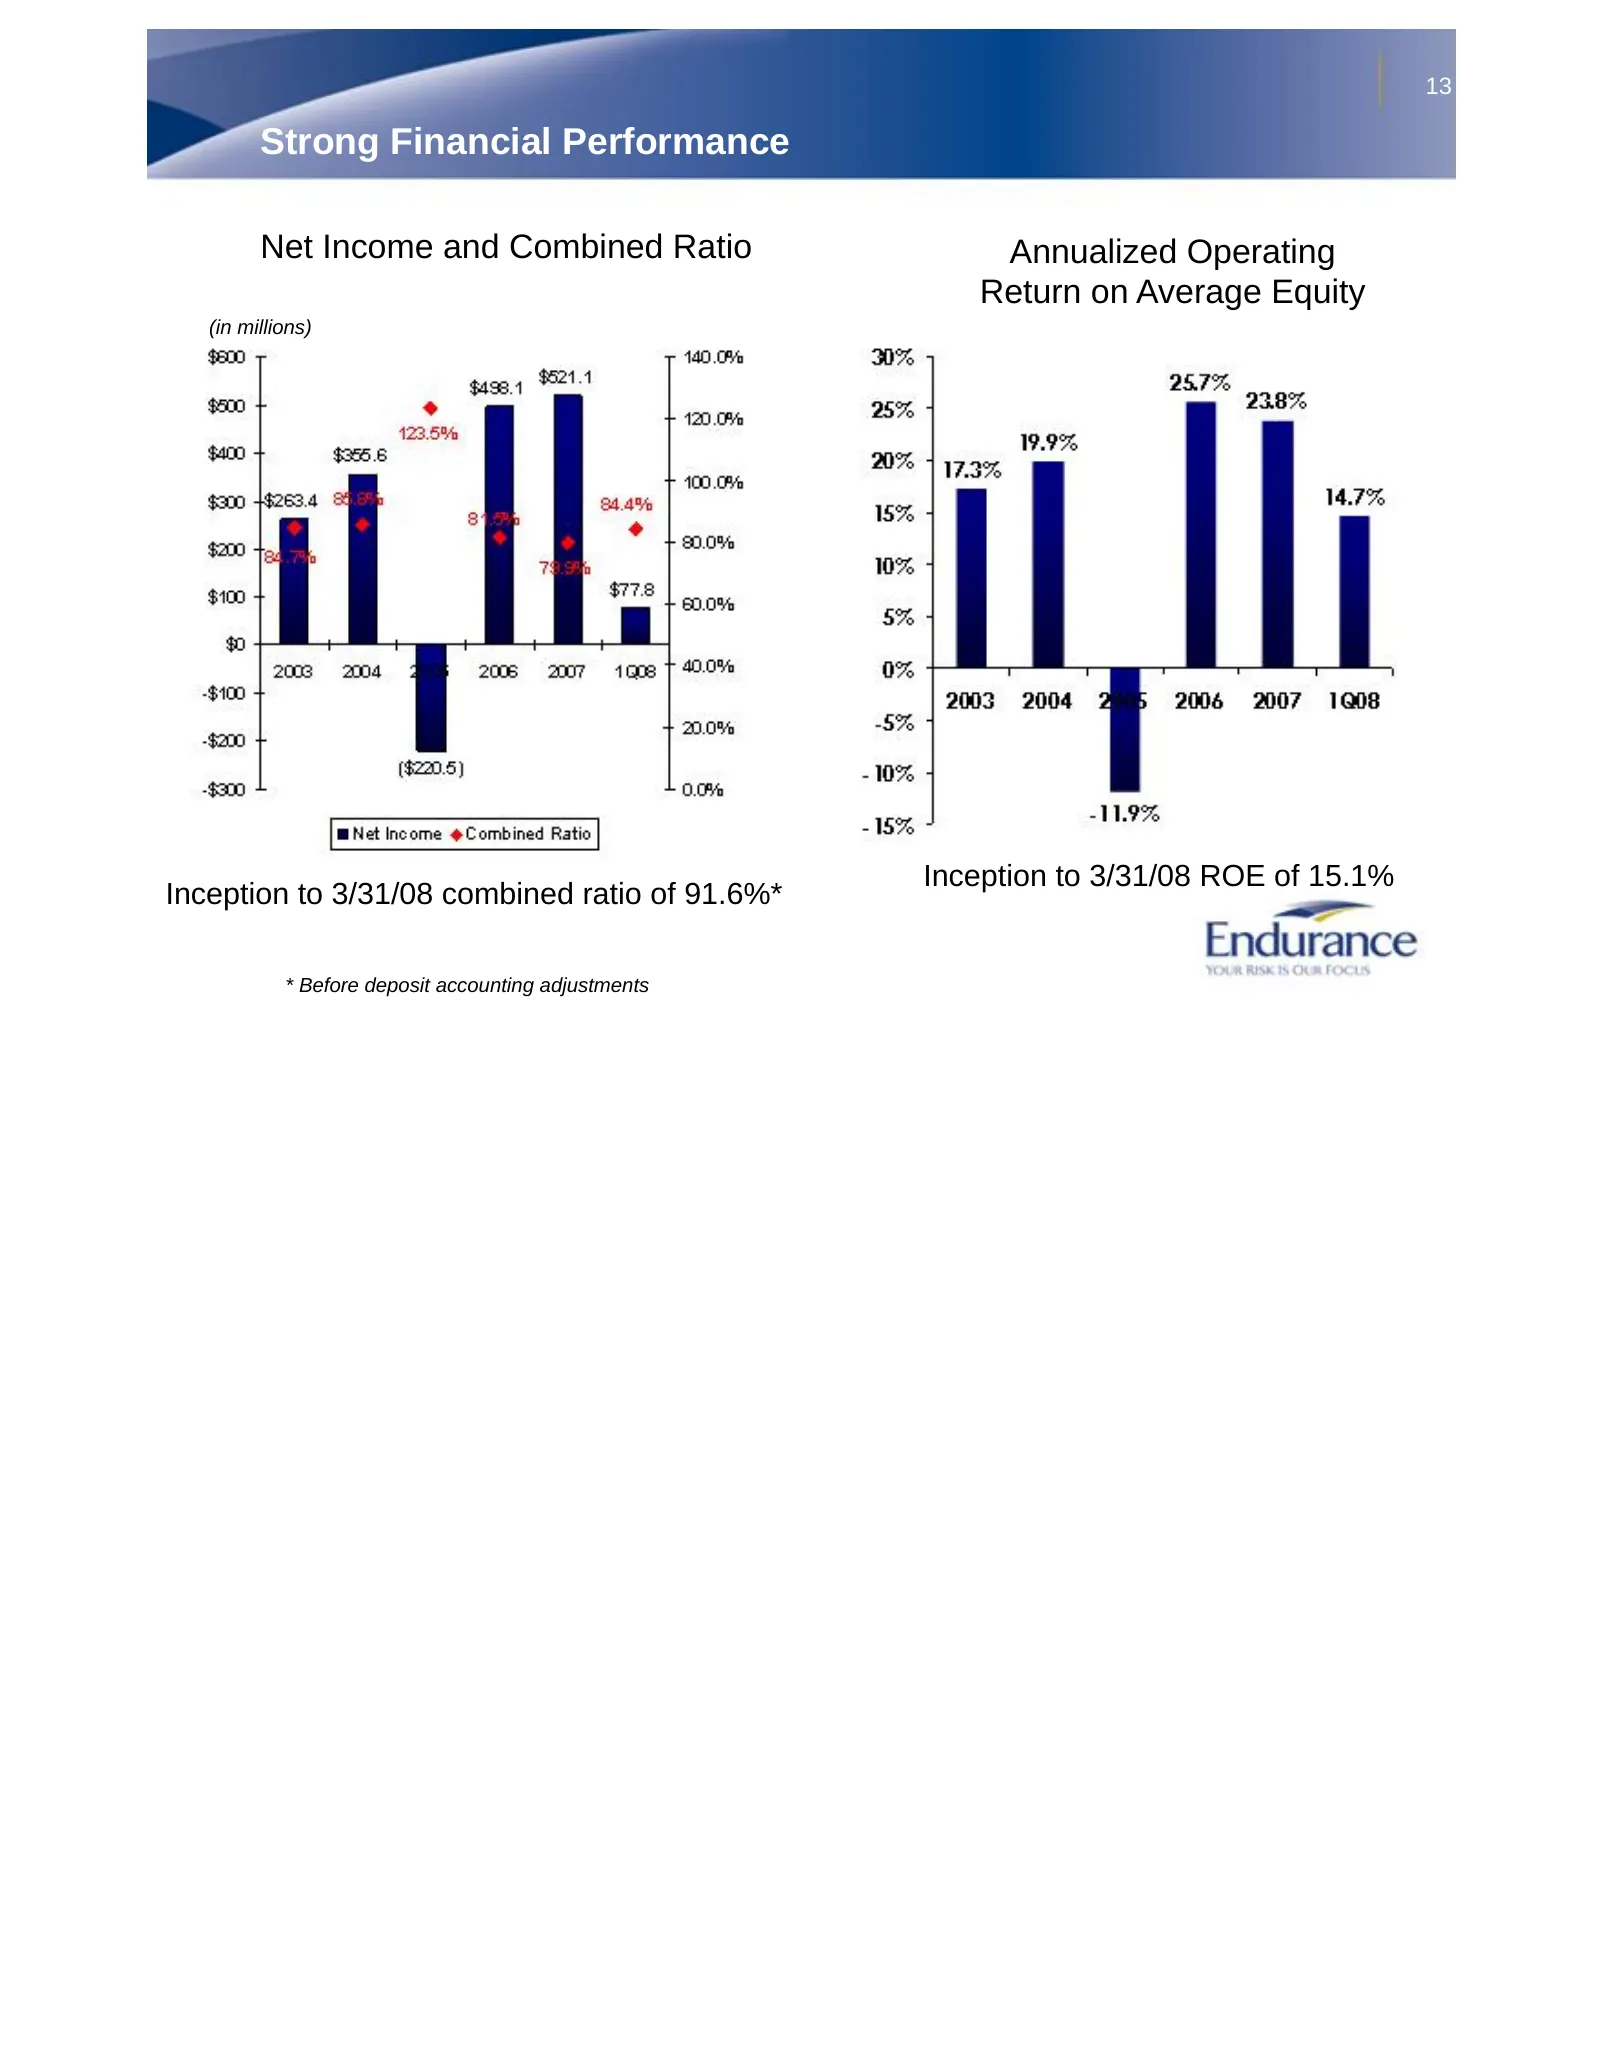
13 Strong Financial Performance Net Income and Combined Ratio Annualized Operating Return on Average Equity (in millions) Inception to 3/31/08 ROE of 15.1% Inception to 3/31/08 combined ratio of 91.6%* * Before deposit accounting adjustments
Slide 14: Results of Capital Management
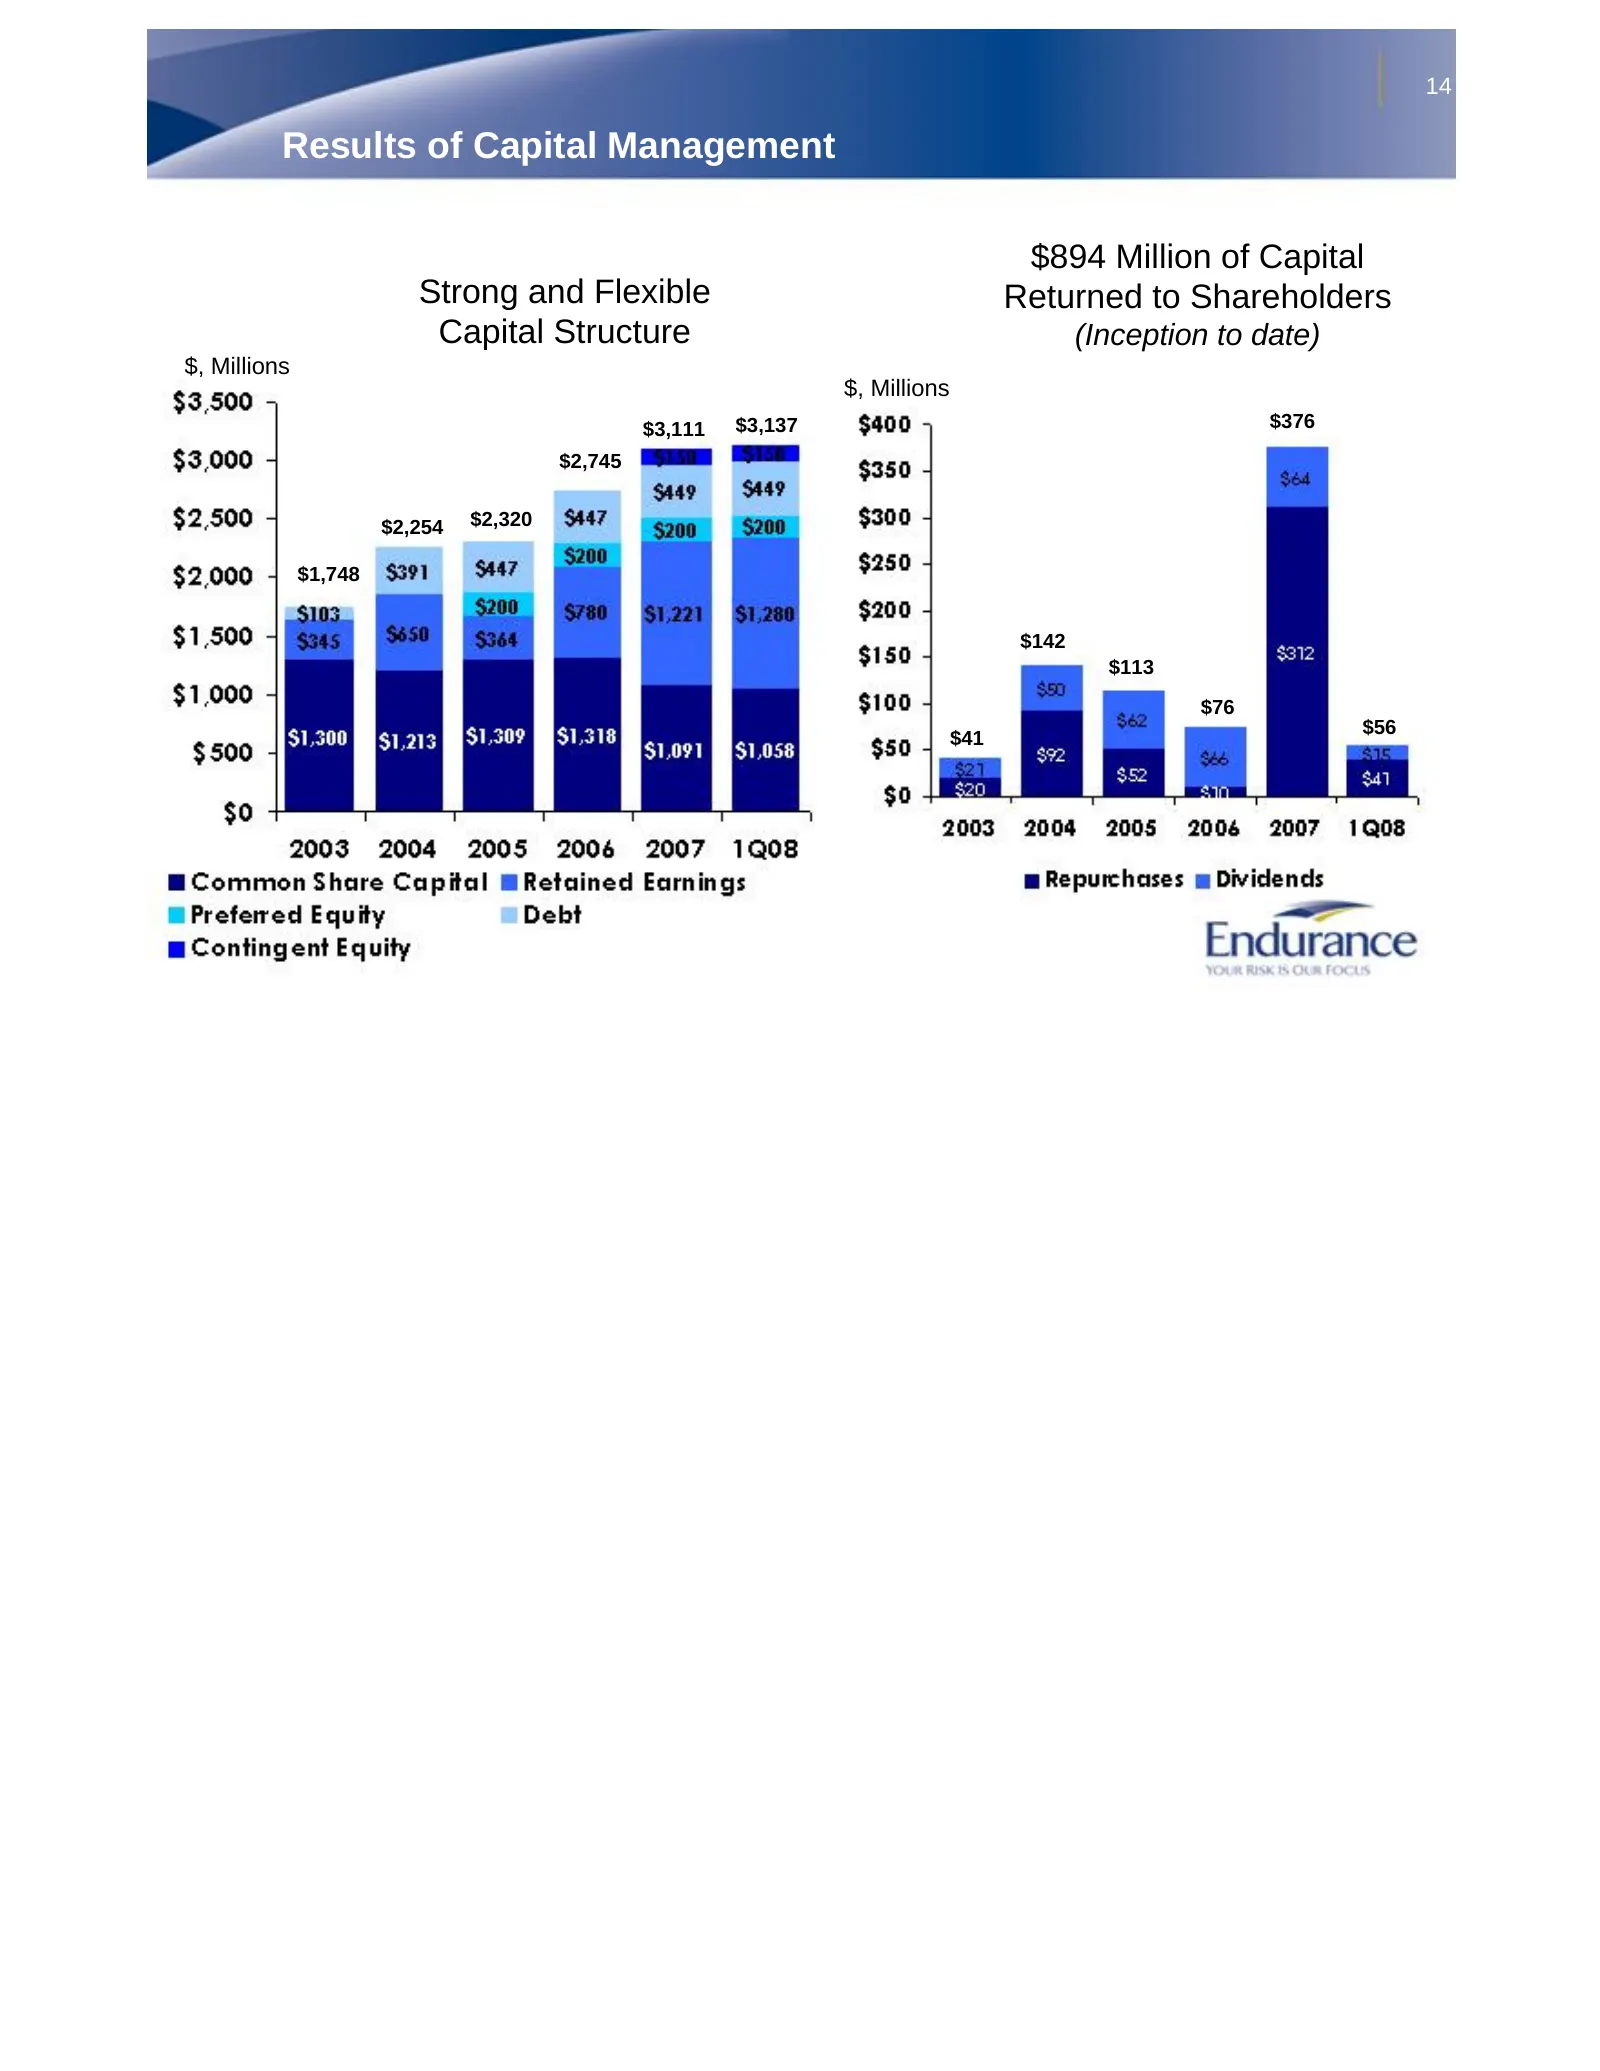
14 Results of Capital Management $894 Million of Capital Strong and Flexible Returned to Shareholders Capital Structure (Inception to date) $, Millions $, Millions $3,111 $3,137 $376 $2,745 $2,254 $2,320 $1,748 $142 $113 $76 $56 $41
Slide 15: High Quality Investment Portfolio
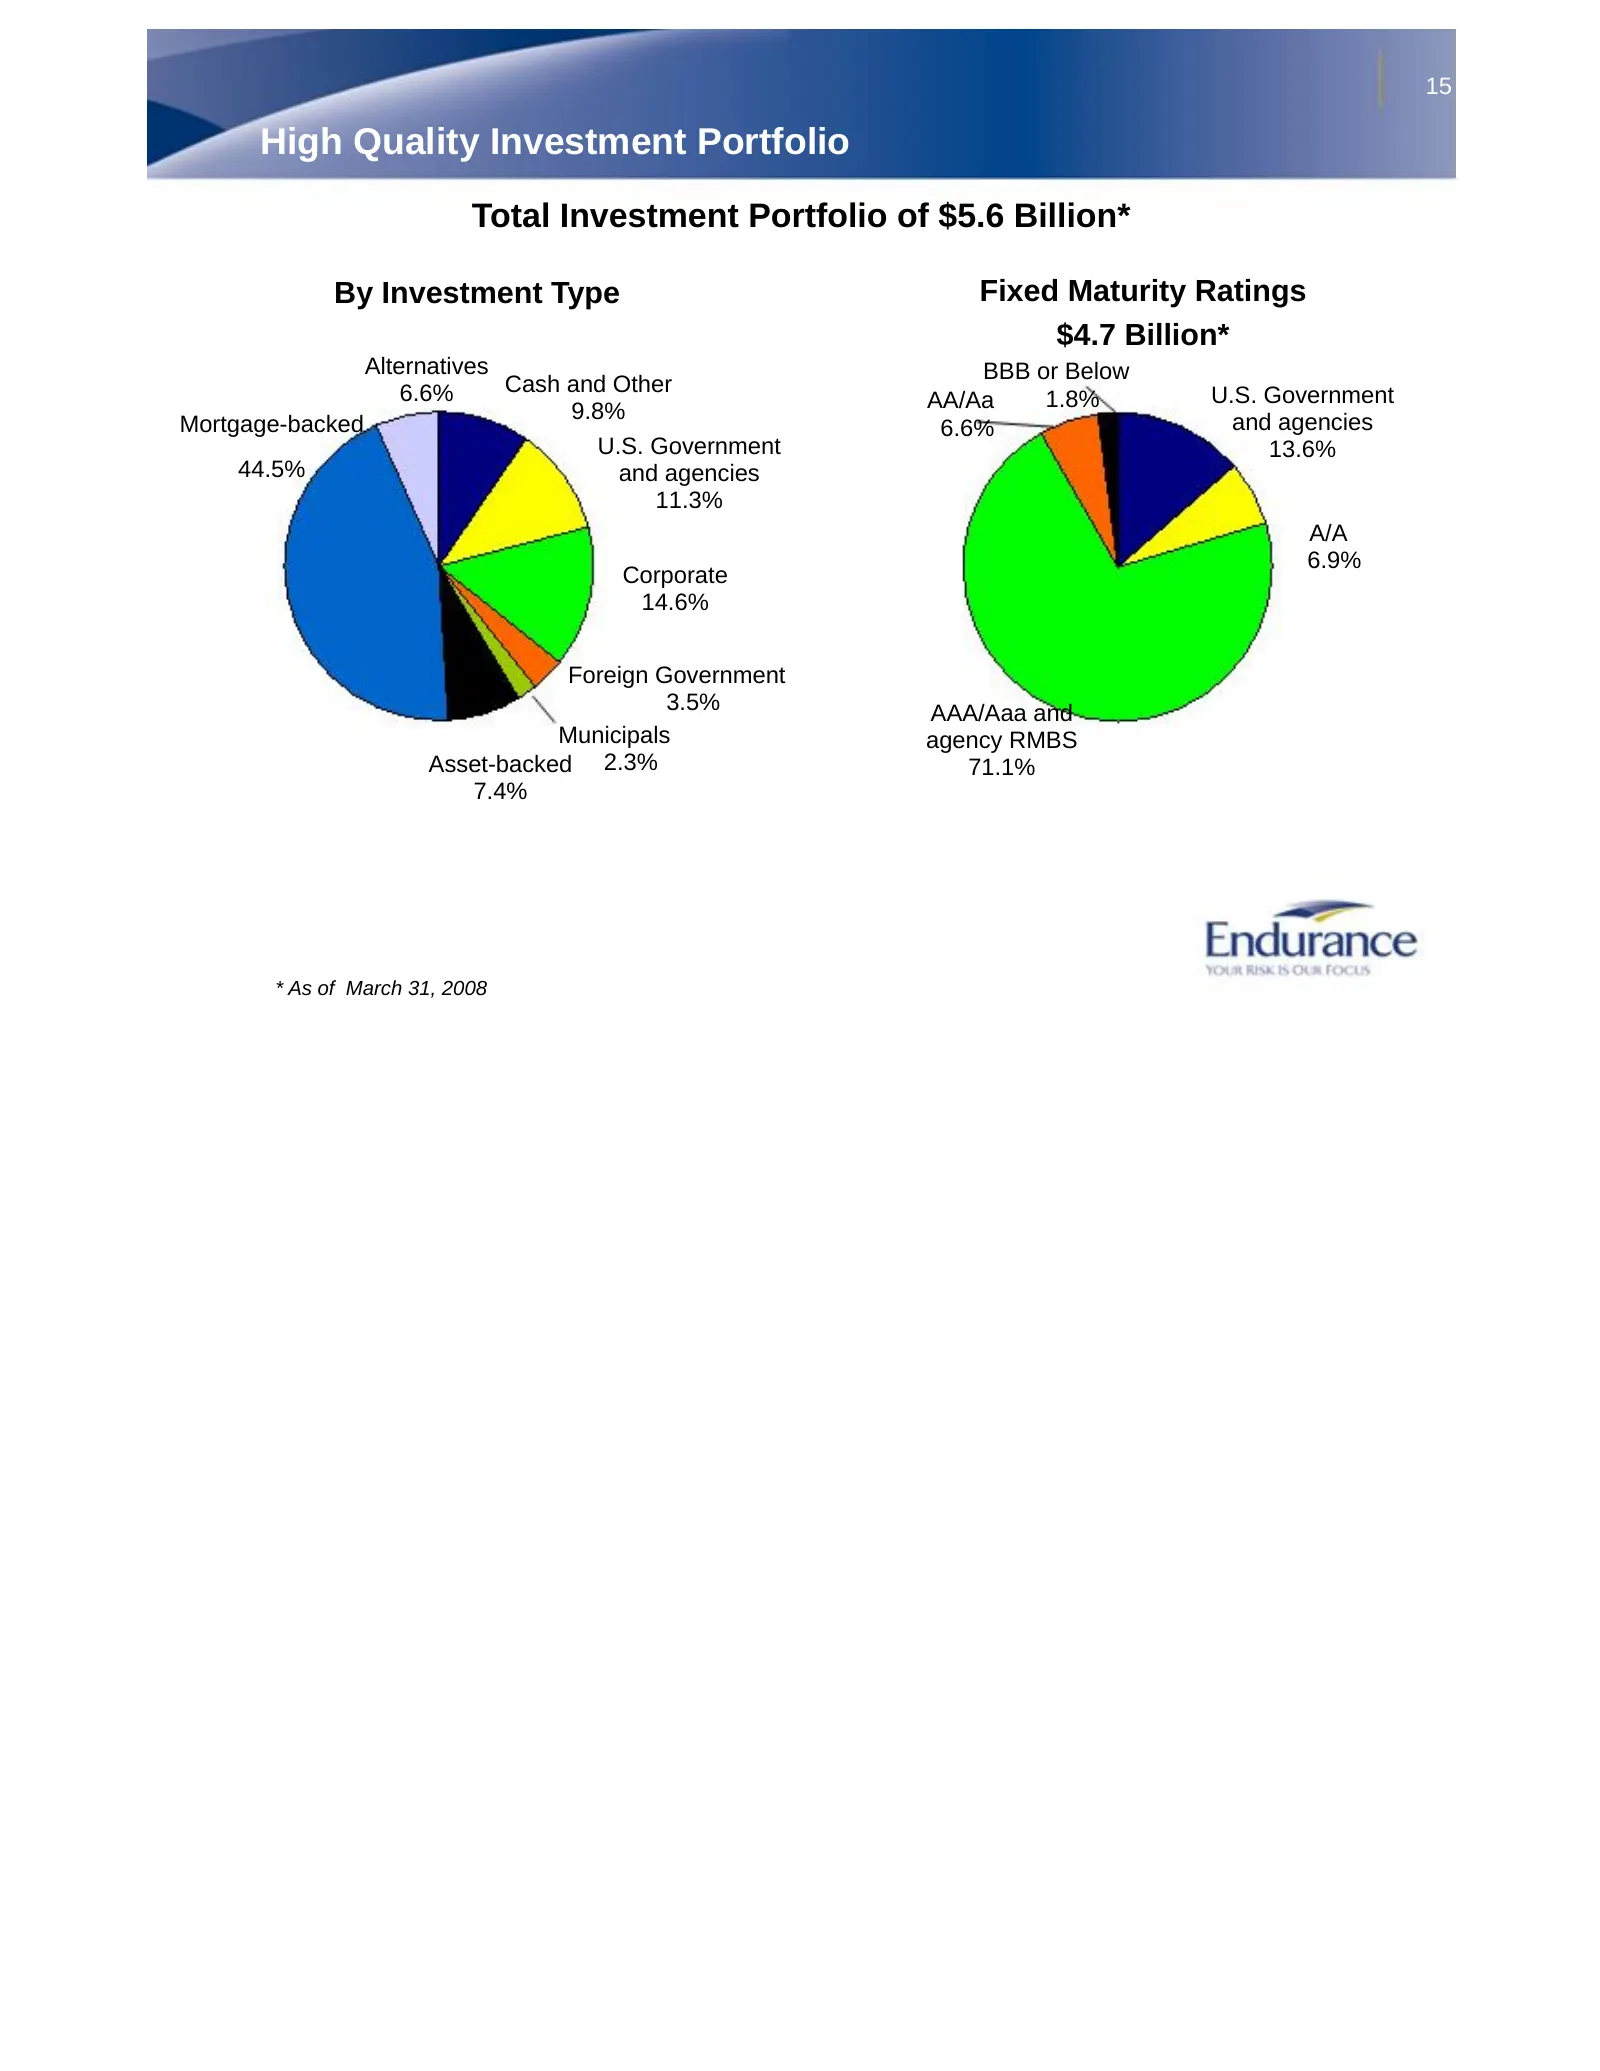
15 High Quality Investment Portfolio Total Investment Portfolio of $5.6 Billion* By Investment Type Fixed Maturity Ratings $4.7 Billion* Alternatives BBB or Below 6.6% Cash and Other U.S. Government AA/Aa 1.8% 9.8% and agencies Mortgage-backed 6.6% U.S. Government 13.6% 44.5% and agencies 11.3% A/A
Slide 16: Conclusion
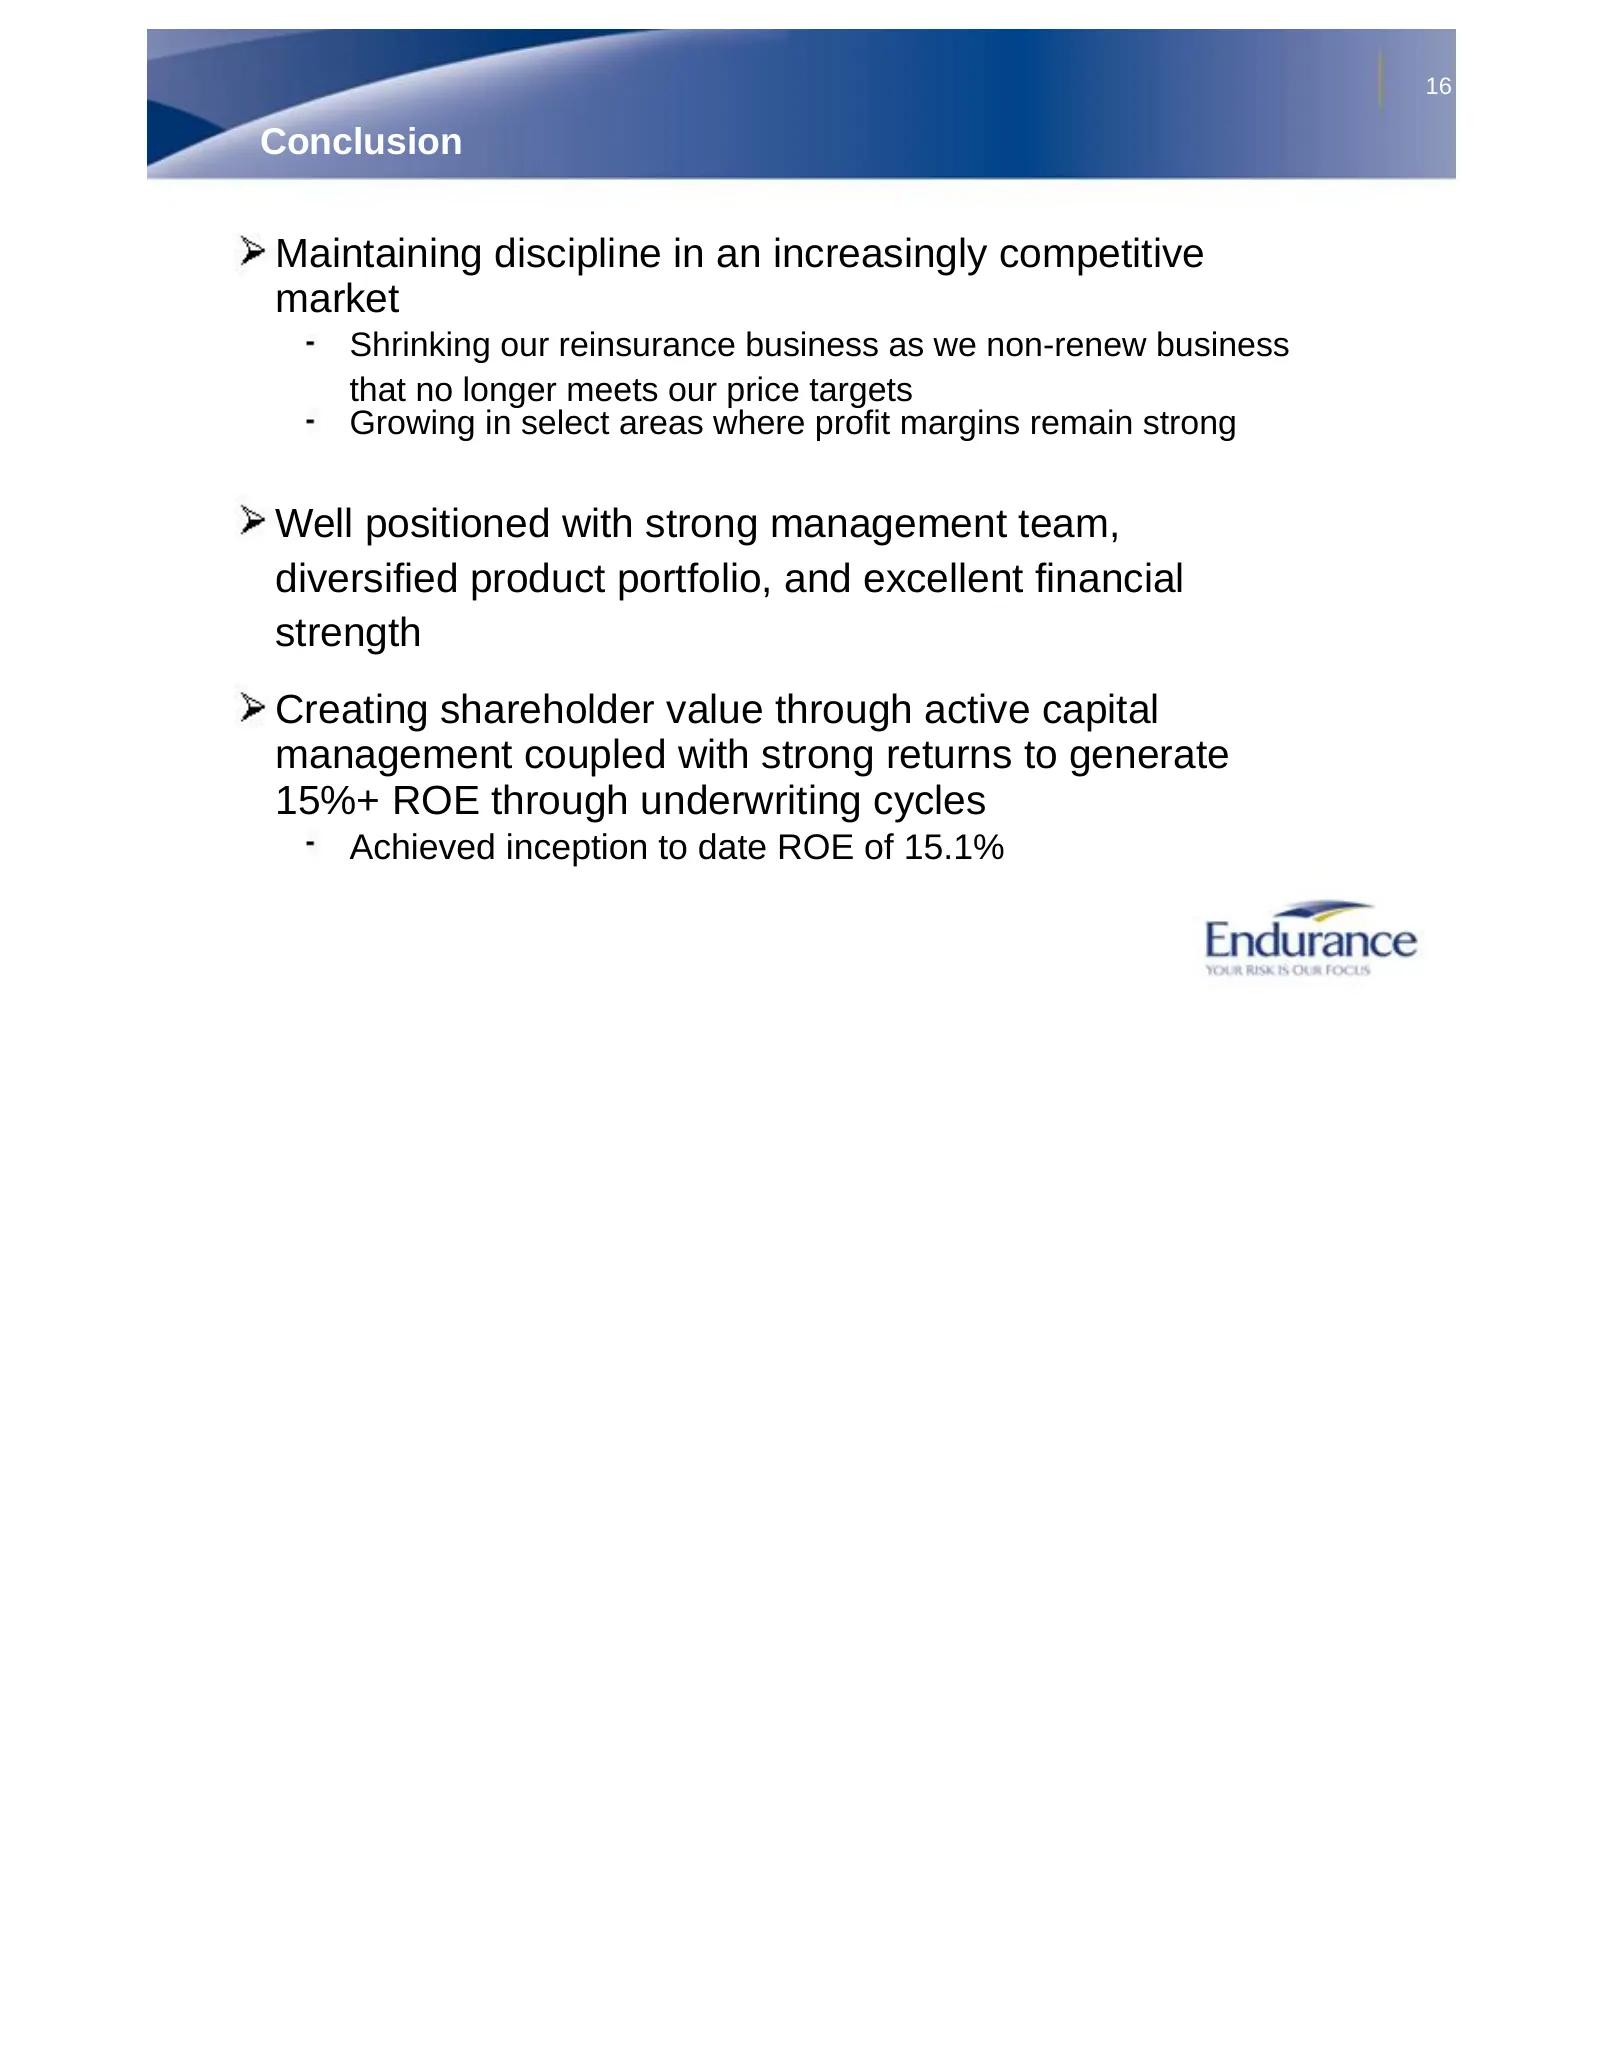
16 Conclusion Maintaining discipline in an increasingly competitive market Shrinking our reinsurance business as we non-renew business that no longer meets our price targets Growing in select areas where profit margins remain strong Well positioned with strong management team, diversified product po
Source: SEC EDGAR · 8-K filed May 7, 2008
More decks from Endurance Specialty Holdings Ltd
 Merger or Acquisition (October 2016)17 slides · Oct 12, 2016
 Investor Presentation (August 2016)29 slides · Aug 9, 2016
 Investor Presentation (May 2016)28 slides · May 10, 2016
 Investor Presentation (February 2016)29 slides · Feb 9, 2016
 Investor Presentation (February 2015)28 slides · Feb 11, 2015
 Merger or Acquisition (April 2014)22 slides · Apr 14, 2014