PacWest Bancorp — Investor Meetings with D.A. Davidson & Co., May 20-21, 2014
41 slides from PacWest Bancorp's conference presentation, May 19, 2014

Slide 1: Investor Meetings with D.A. Davidson & Co.
INVESTOR MEETINGS WITH D.A. DAVIDSON & CO. Denver, Colorado and Chicago, Illinois May 20-21, 2014
Slide 2: Forward-Looking Statements
FORWARD-LOOKING STATEMENTS This communication contains certain forward-looking information about PacWest that is intended to be covered by the safe harbor for “forward-looking statements” provided by the Private Securities Litigation Reform Act of 1995. All references herein to PacWest are intended
Slide 3: PacWest Bancorp Stock Summary
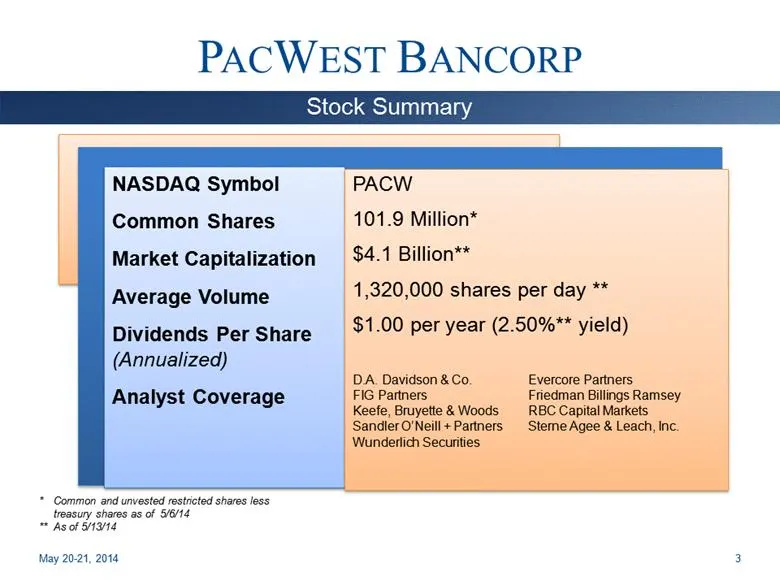
PACWEST BANCORP NASDAQ Symbol Common Shares Market Capitalization Average Volume Dividends Per Share (Annualized) Analyst Coverage PACW 101.9 Million* $4.1 Billion** 1,320,000 shares per day ** $1.00 per year (2.50%** yield) D.A. Davidson & Co. Evercore Partners FIG Partners Friedman Billings Ramsey
Slide 4: Presentation Index
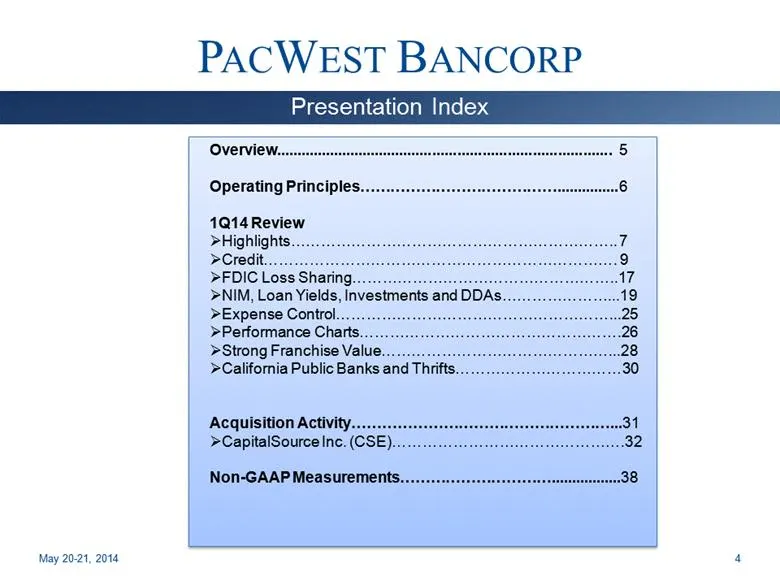
PACWEST BANCORP May 20-21, 2014 Presentation Index Overview 5 Operating Principles 6 1Q14 Review Highlights 7 Credit. 9 FDIC Loss Sharing17 NIM, Loan Yields, Investments and DDAs19 Expense Control25 Performance Charts.26 Strong Franchise Value28 California Public Banks and Thrifts30 Acquisition Acti
Slide 5: PACW Overview
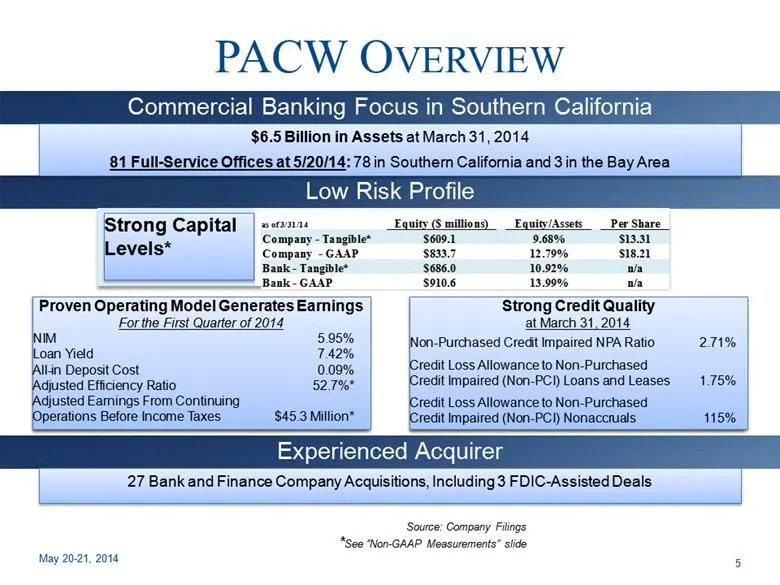
PACW OVERVIEW $6.5 Billion in Assets at March 31, 2014 81 Full-Service Offices at 5/20/14: 78 in Southern California and 3 in the Bay Area May 20-21, 2014 Commercial Banking Focus in Southern California Source: Company Filings *See “Non-GAAP Measurements” slide Strong Capital Levels* Proven Operatin
Slide 6: Operating Principles
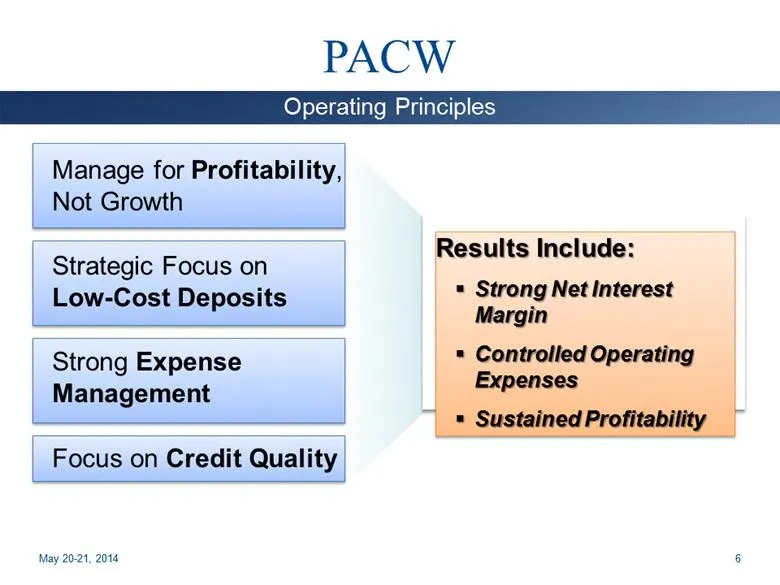
PACW Manage for Profitability, Not Growth Strategic Focus on Low-Cost Deposits Strong Expense Management Focus on Credit Quality Results Include: Strong Net Interest Margin Controlled Operating Expenses Sustained Profitability May 20-21, 2014 Operating Principles 6
Slide 7: Highlights
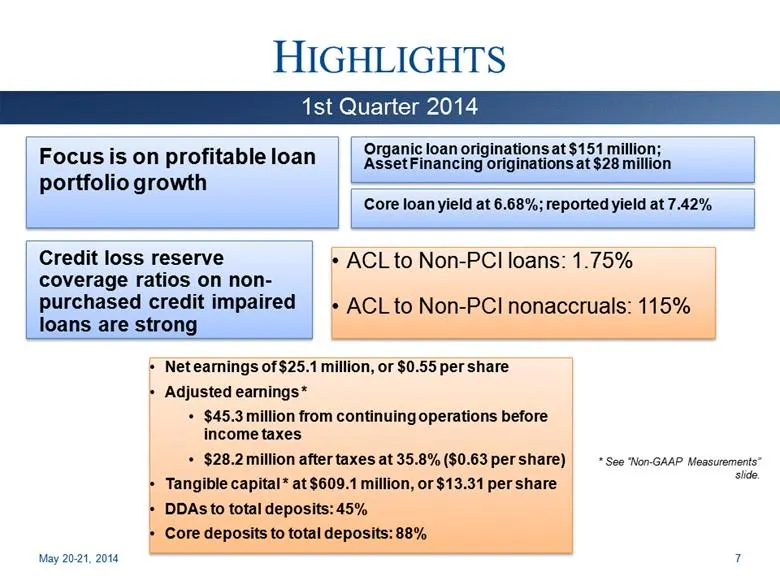
HIGHLIGHTS Focus is on profitable loan portfolio growth Organic loan originations at $151 million; Asset Financing originations at $28 million Core loan yield at 6.68%; reported yield at 7.42% May 20-21, 2014 1st Quarter 2014 Credit loss reserve coverage ratios on non-purchased credit impaired loans
Slide 8: Solid Earnings Track Record
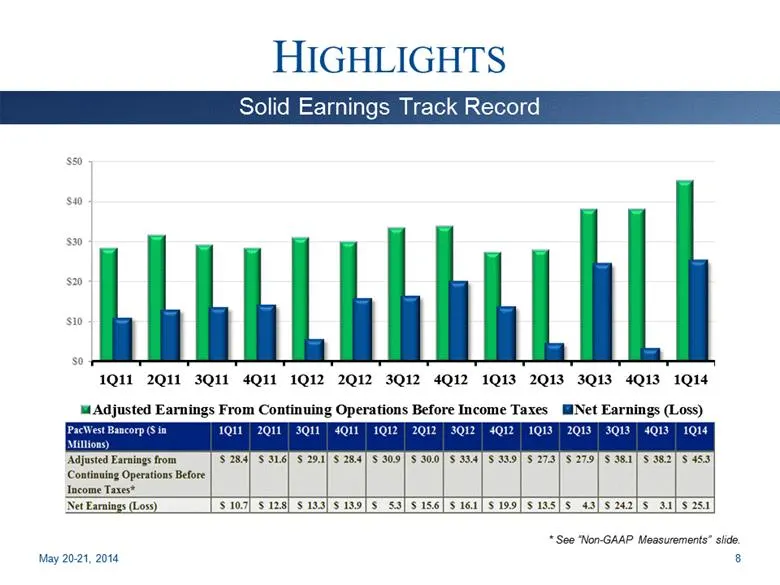
HIGHLIGHTS May 20-21, 2014 Solid Earnings Track Record * See “Non-GAAP Measurements” slide. 8
Slide 9: Credit Quality is Strong
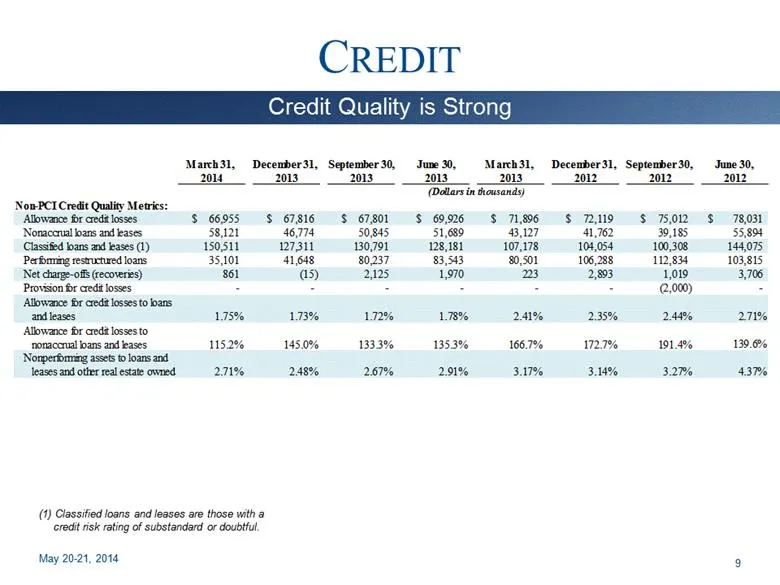
CREDIT May 20-21, 2014 Credit Quality is Strong (1) Classified loans and leases are those with a credit risk rating of substandard or doubtful. 9 March 31, December 31, September 30, June 30, March 31, December 31, September 30, June 30, 2014 2013 2013 2013 2013 2012 2012 2012 (Dollars in thousands)
Slide 10: Strong Credit Coverage Ratios
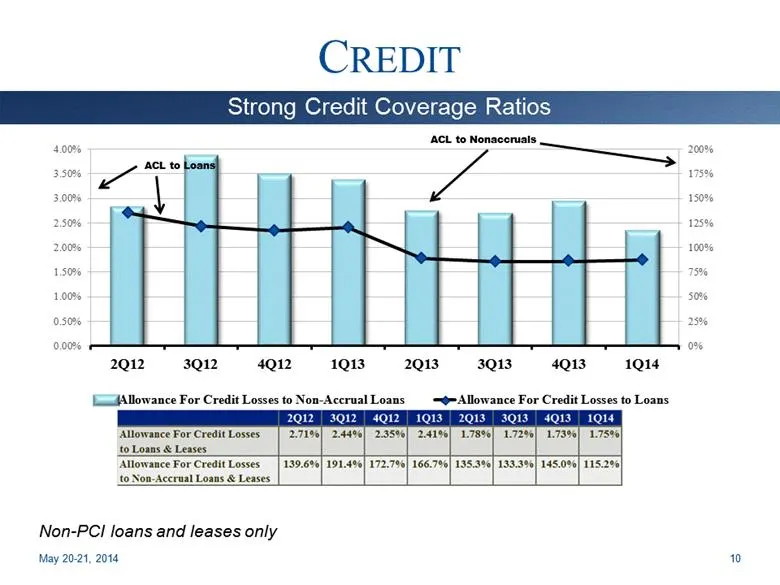
CREDIT May 20-21, 2014 Strong Credit Coverage Ratios Non-PCI loans and leases only ACL to Loans 10
Slide 11: Largest Non-PCI Nonaccrual Loans
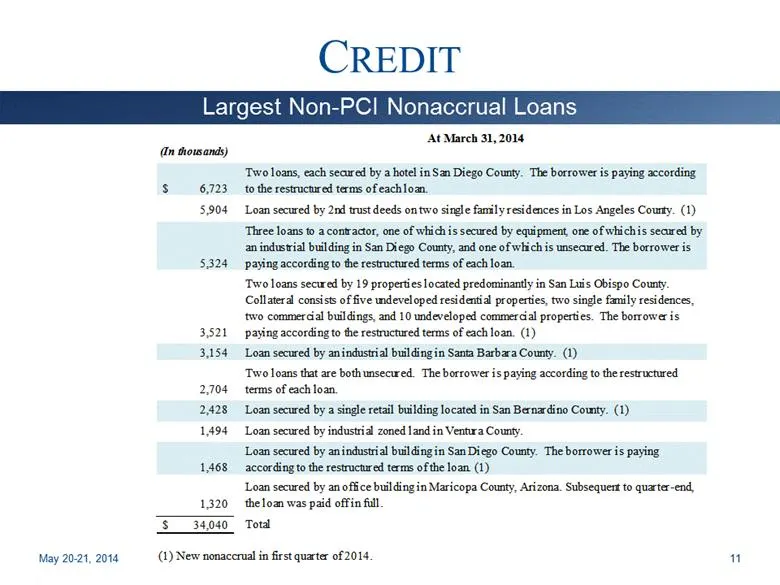
CREDIT May 20-21, 2014 Largest Non-PCI Nonaccrual Loans 11 At March 31, 2014 (In thousands) For Info Only - not for Print 6,723 $ Two loans, each secured by a hotel in San Diego County. The borrower is paying according to the restructured terms of each loan. 5,904 Loan secured by 2nd trust deeds on
Slide 12: Non-Covered Loan Charge-Off History
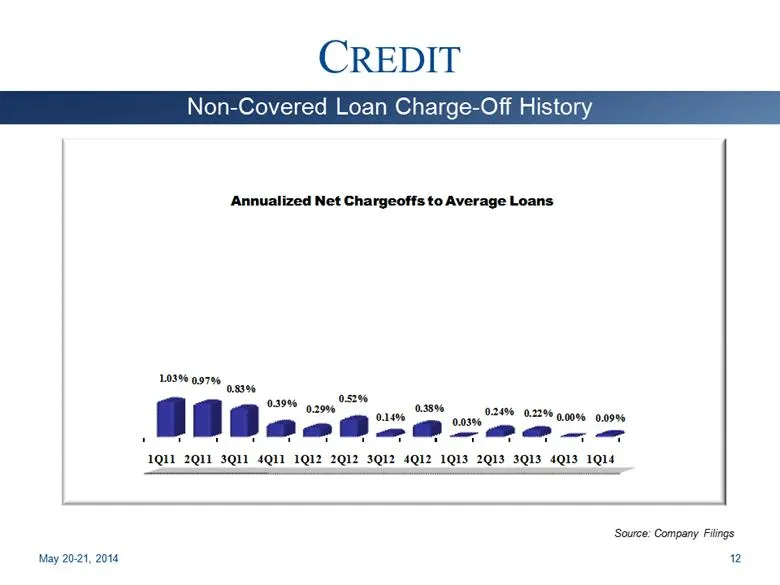
CREDIT May 20-21, 2014 Non-Covered Loan Charge-Off History Source: Company Filings 12 1Q11 2Q11 3Q11 4Q11 1Q12 2Q12 3Q12 4Q12 1Q13 2Q13 3Q13 4Q13 1Q14 1.03% 0.97% 0.83% 0.39% 0.29% 0.52% 0.14% 0.38% 0.03% 0.24% 0.22% 0.00% 0.09% Annualized Net Chargeoffs to Average Loans
Slide 13: Loan Portfolio Concentrations
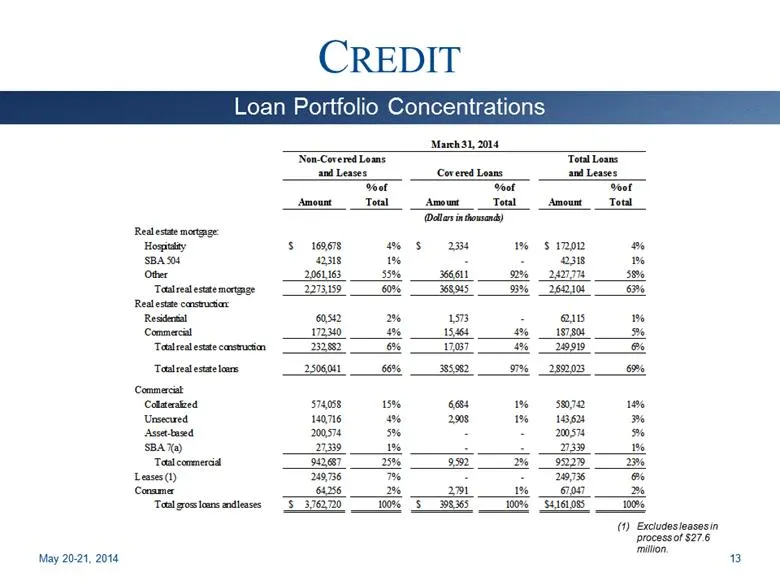
CREDIT May 20-21, 2014 Loan Portfolio Concentrations Excludes leases in process of $27.6 million. 13 March 31, 2014 Non-Covered Loans Total Loans and Leases Covered Loans and Leases Rounding %'s % of % of % of Amount Total Amount Total Amount Total (Dollars in thousands) Real estate mortgage: Hospit
Slide 14: Non-Covered Real Estate Mortgage Exposure
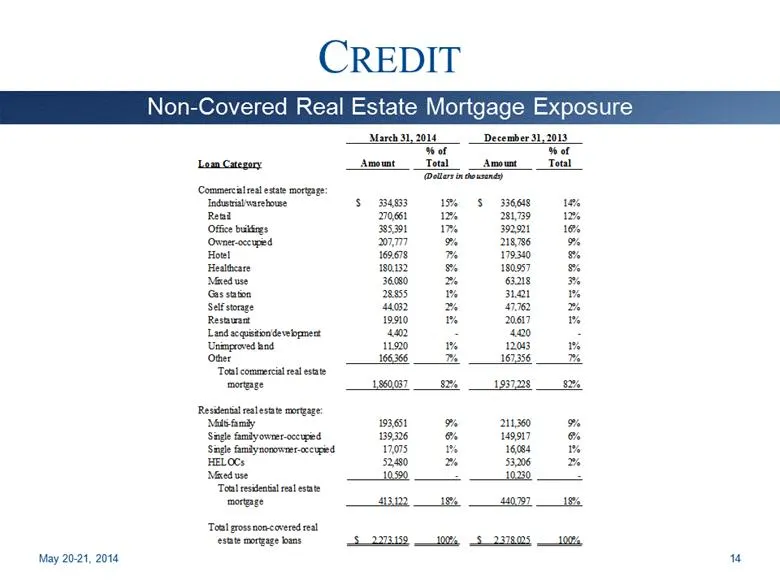
CREDIT May 20-21, 2014 Non-Covered Real Estate Mortgage Exposure 14 March 31, 2014 December 31, 2013 % of % of Loan Category Amount Total Amount Total (Dollars in thousands) Commercial real estate mortgage: Industrial/warehouse $ 334,833 15% $ 336,648 14% Retail 270,661 12% 281,739 12% Office buildi
Slide 15: Covered Real Estate Loan Exposure
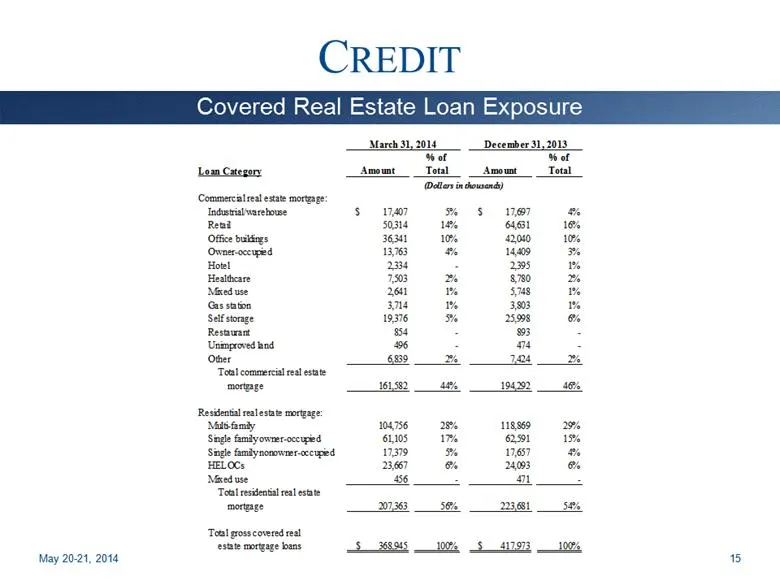
CREDIT May 20-21, 2014 Covered Real Estate Loan Exposure 15 March 31, 2014 December 31, 2013 % of % of Loan Category Amount Total Amount Total (Dollars in thousands) Commercial real estate mortgage: Industrial/warehouse $ 17,407 5% $ 17,697 4% Retail 50,314 14% 64,631 16% Office buildings 36,341 10%
Slide 16: Other Real Estate Owned
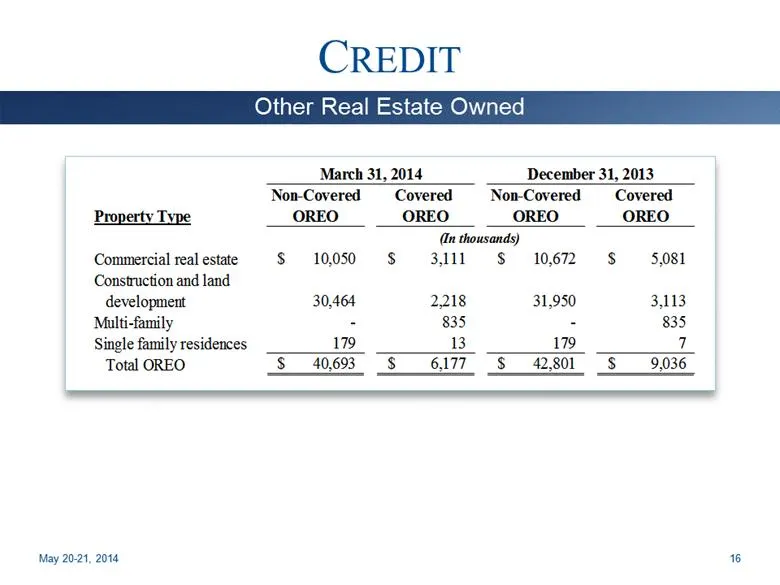
CREDIT May 20-21, 2014 Other Real Estate Owned 16 March 31, 2014 December 31, 2013 Non-Covered Covered Non-Covered Covered Property Type OREO OREO OREO OREO (In thousands) Commercial real estate 10,050 $ 3,111 $ 10,672 $ 5,081 $ Construction and land development 30,464 2,218 31,950 3,113 Multi-famil
Slide 17: FDIC Loss Sharing Income (Expense)
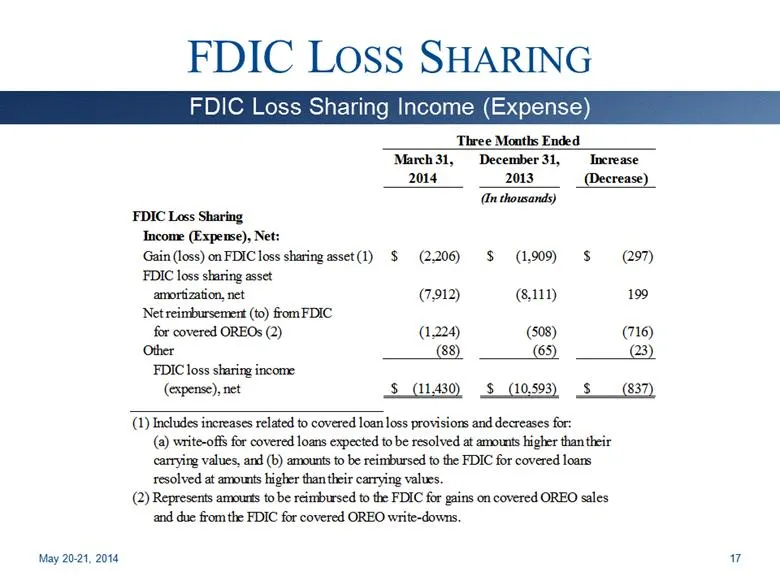
FDIC LOSS SHARING May 20-21, 2014 FDIC Loss Sharing Income (Expense) 17 Three Months Ended March 31, December 31, Increase 2014 2013 (Decrease) (In thousands) FDIC Loss Sharing Income (Expense), Net: Gain (loss) on FDIC loss sharing asset (1) (2,206) $ (1,909) $ (297) $ FDIC loss sharing asset amort
Slide 18: Loss Share Assets by Entity
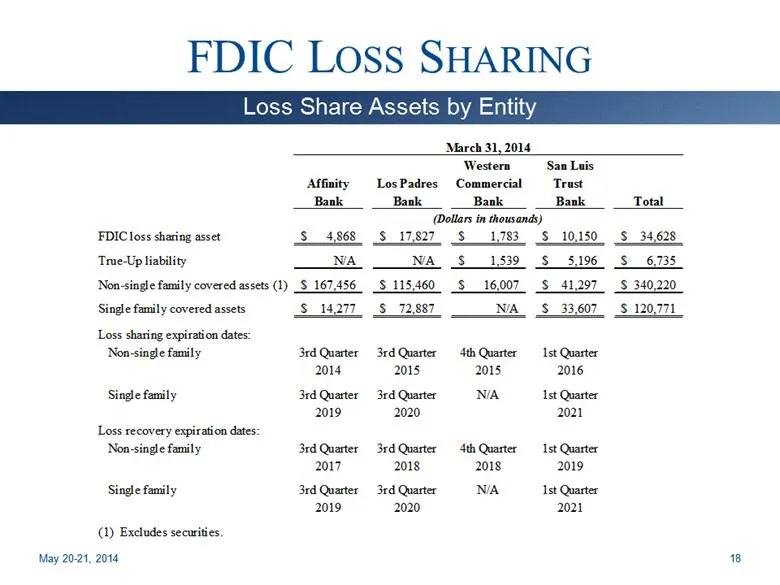
FDIC LOSS SHARING May 20-21, 2014 18 Loss Share Assets by Entity March 31, 2014 Rounding Western San Luis Affinity Los Padres Commercial Trust Bank Bank Bank Bank Total (Dollars in thousands) (In thousands) FDIC loss sharing asset 4,868 $ 17,827 $ 1,783 $ 10,150 $ 34,628 $ True-Up liability N/A N/A
Slide 19: Strong Net Interest Margin Versus Peers
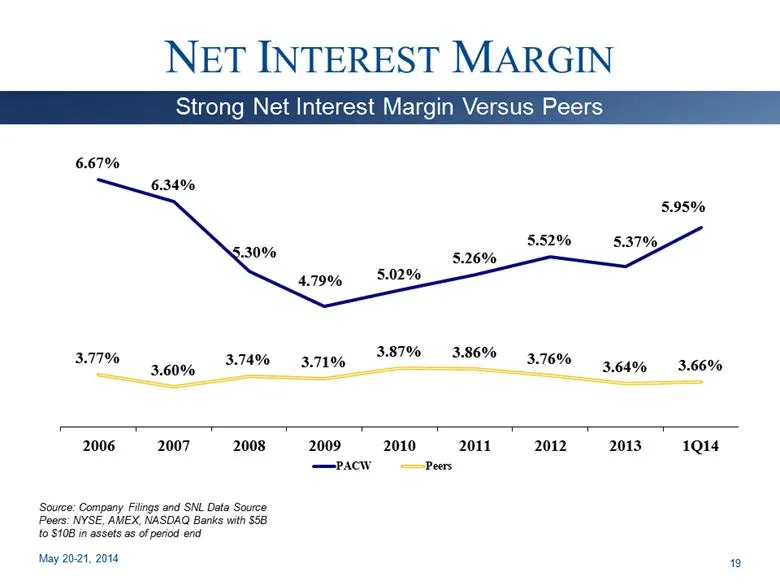
NET INTEREST MARGIN May 20-21, 2014 Strong Net Interest Margin Versus Peers Source: Company Filings and SNL Data Source Peers: NYSE, AMEX, NASDAQ Banks with $5B to $10B in assets as of period end 19
Slide 20: Volatile Item Impacts the NIM
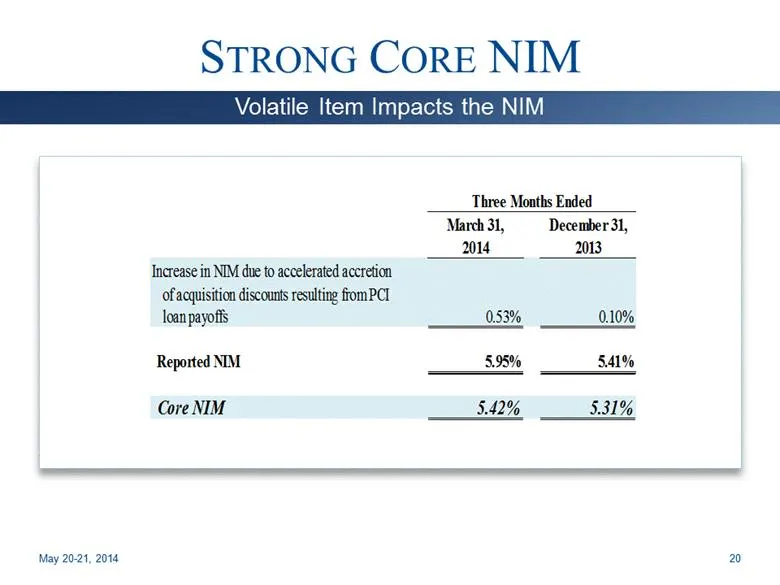
STRONG CORE NIM May 20-21, 2014 Volatile Item Impacts the NIM 20 Three Months Ended March 31, December 31, 2014 2013 Increase in NIM due to accelerated accretion of acquisition discounts resulting from PCI loan payoffs 0.53% 0.10% Reported NIM 5.95% 5.41% Core NIM 5.42% 5.31%
Slide 21: Loan and Lease Yields
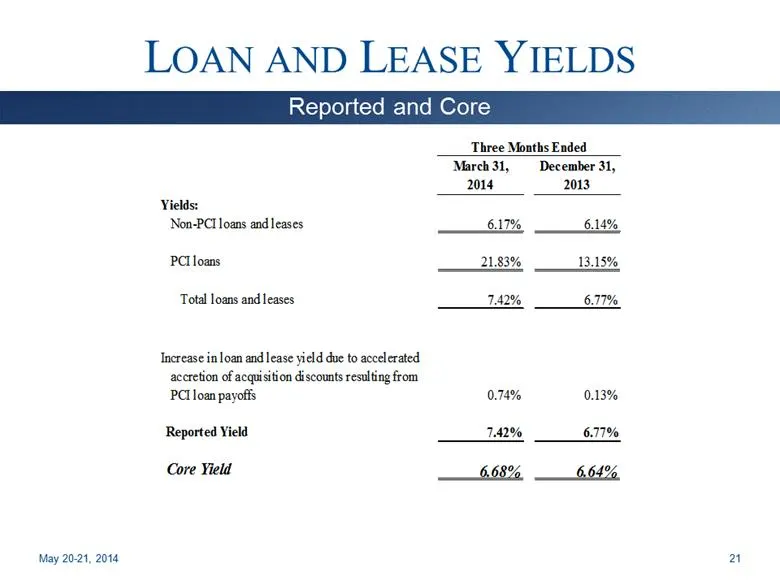
LOAN AND LEASE YIELDS May 20-21, 2014 21 Reported and Core Three Months Ended March 31, December 31, 2014 2013 Yields: Non-PCI loans and leases 6.17% 6.14% PCI loans 21.83% 13.15% Total loans and leases 7.42% 6.77% Increase in loan and lease yield due to accelerated accretion of acquisition discount
Slide 22: Investment Yields and Durations
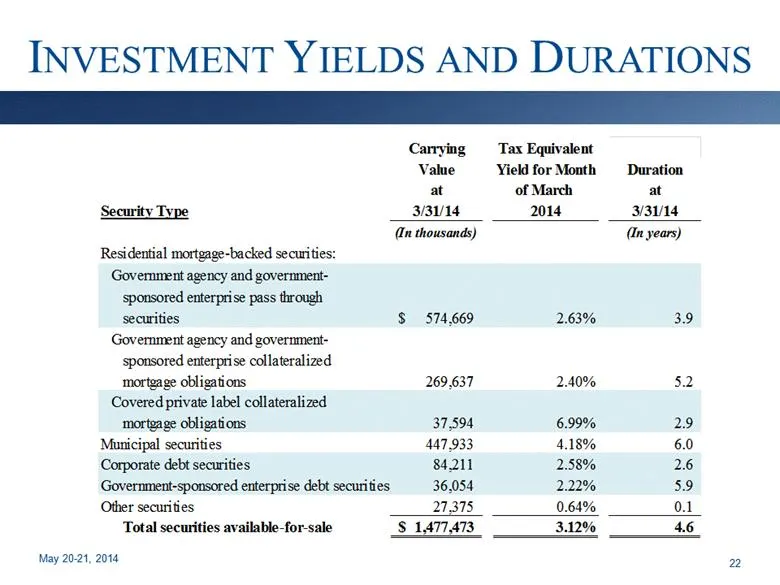
INVESTMENT YIELDS AND DURATIONS May 20-21, 2014 22 Carrying Tax Equivalent Value Yield for Month Duration at of March at Security Type 3/31/14 2014 3/31/14 (In thousands) (In years) Residential mortgage-backed securities: Government agency and government- sponsored enterprise pass through securities
Slide 23: Municipal Bond Portfolio
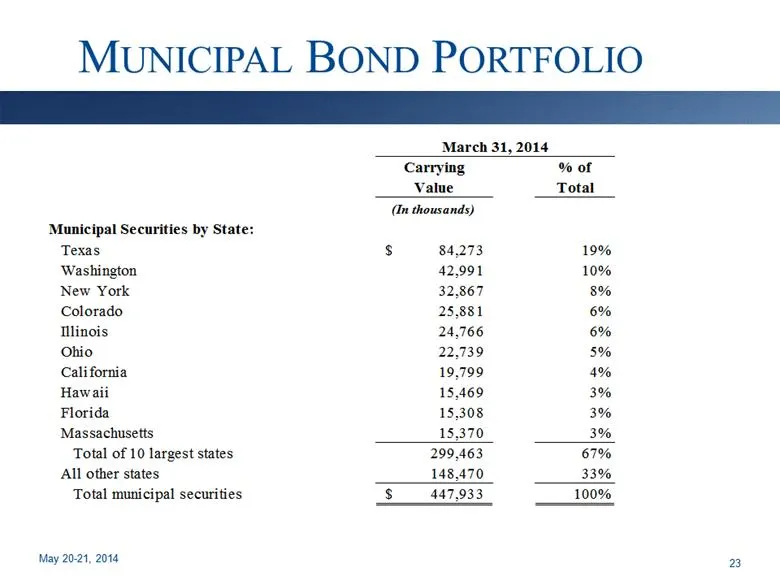
MUNICIPAL BOND PORTFOLIO May 20-21, 2014 23 March 31, 2014 Carrying % of Value Total (In thousands) Municipal Securities by State: Texas 84,273 $ 19% Washington 42,991 10% New York 32,867 8% Colorado 25,881 6% Illinois 24,766 6% Ohio 22,739 5% California 19,799 4% Hawaii 15,469 3% Florida 15,308 3%
Slide 24: Noninterest-Bearing Deposits Support NIM
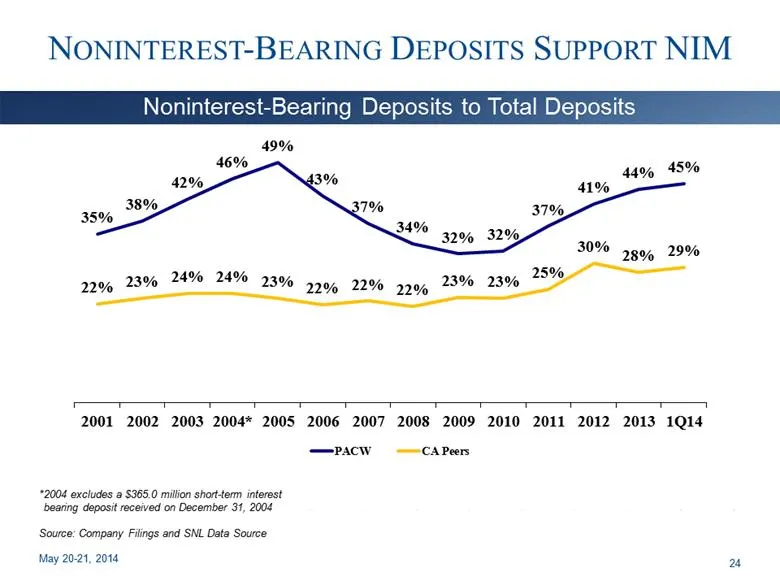
NONINTEREST-BEARING DEPOSITS SUPPORT NIM May 20-21, 2014 Noninterest-Bearing Deposits to Total Deposits * 2004 excludes a $365.0 million short-term interest bearing deposit received on December 31, 2004 Source: Company Filings and SNL Data Source 24
Slide 25: Expense Control
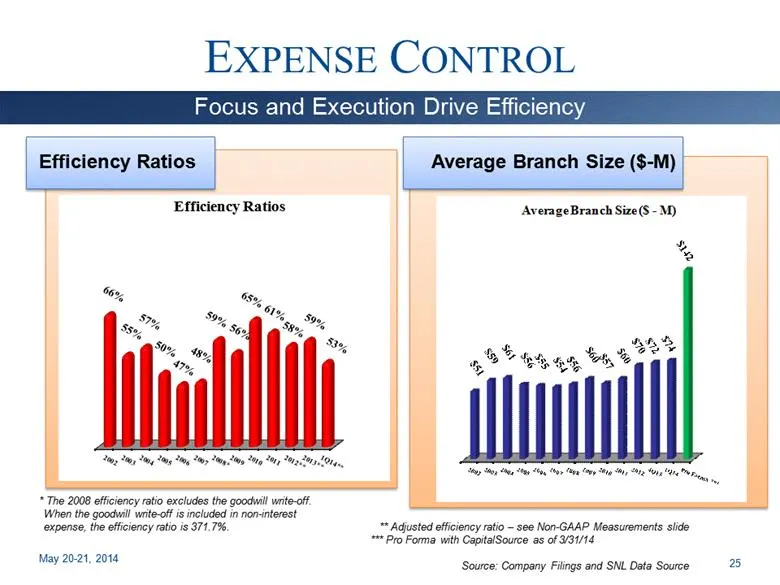
Efficiency Ratios Average Branch Size ($-M) EXPENSE CONTROL May 20-21, 2014 Focus and Execution Drive Efficiency * The 2008 efficiency ratio excludes the goodwill write-off. When the goodwill write-off is included in non-interest expense, the efficiency ratio is 371.7%. ** Adjusted efficiency ratio
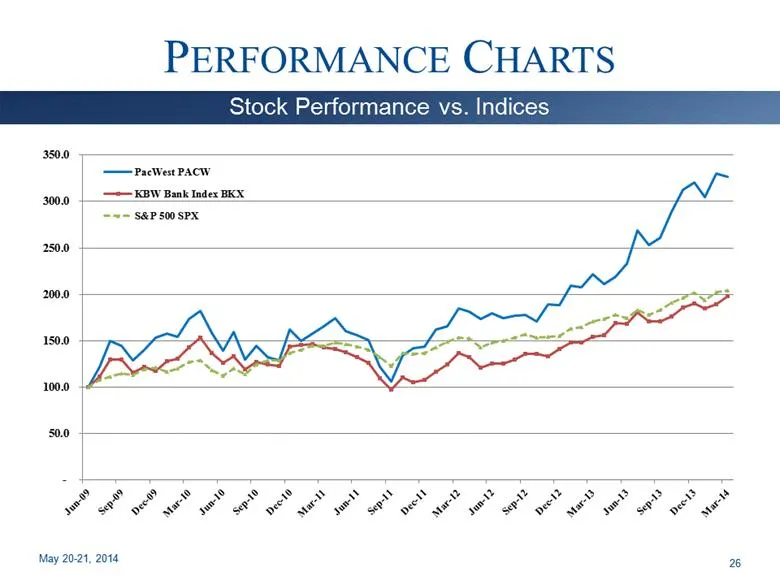
Slide 26: Stock Performance vs. Indices
PERFORMANCE CHARTS May 20-21, 2014 Stock Performance vs. Indices 26
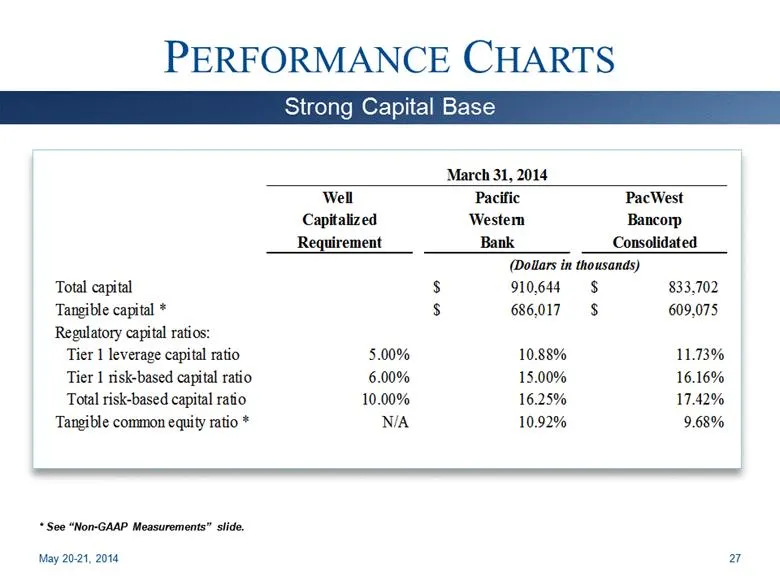
Slide 27: Strong Capital Base
PERFORMANCE CHARTS May 20-21, 2014 Strong Capital Base * See “Non-GAAP Measurements” slide. 27 March 31, 2014 Well Pacific PacWest Capitalized Western Bancorp Requirement Bank Consolidated (Dollars in thousands) Total capital 910,644 $ 833,702 $ Tangible capital * 686,017 $ 609,075 $ Regulatory capi
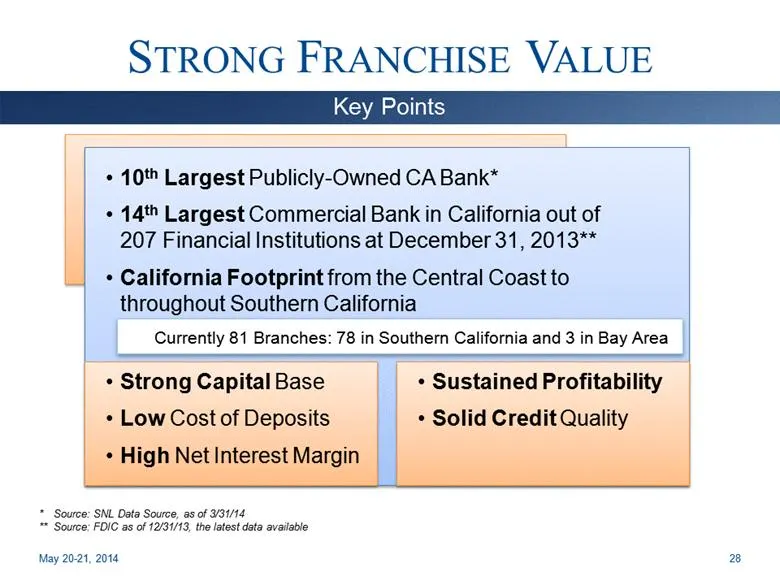
Slide 28: Strong Franchise Value
STRONG FRANCHISE VALUE 10th Largest Publicly-Owned CA Bank* 14th Largest Commercial Bank in California out of 207 Financial Institutions at December 31, 2013** California Footprint from the Central Coast to throughout Southern California Currently 81 Branches: 78 in Southern California and 3 in Bay
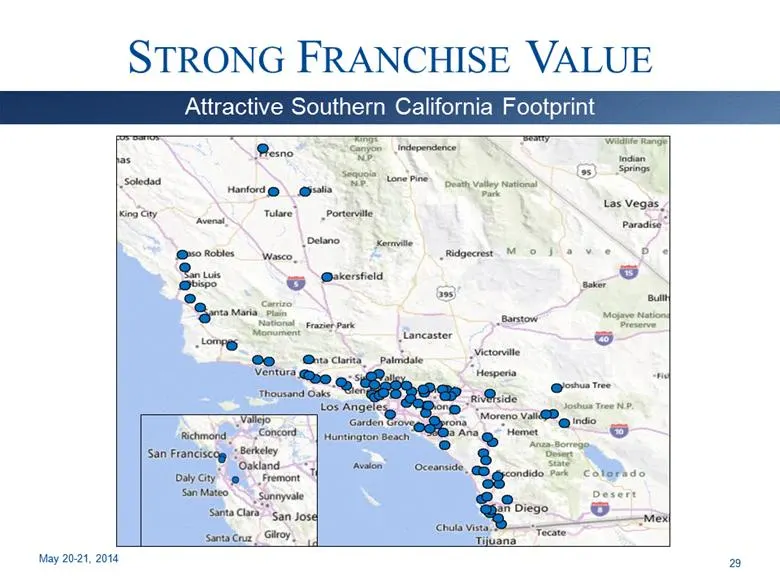
Slide 29: Attractive Southern California Footprint
STRONG FRANCHISE VALUE May 20-21, 2014 Attractive Southern California Footprint 29
Slide 30: California Public Banks and Thrifts
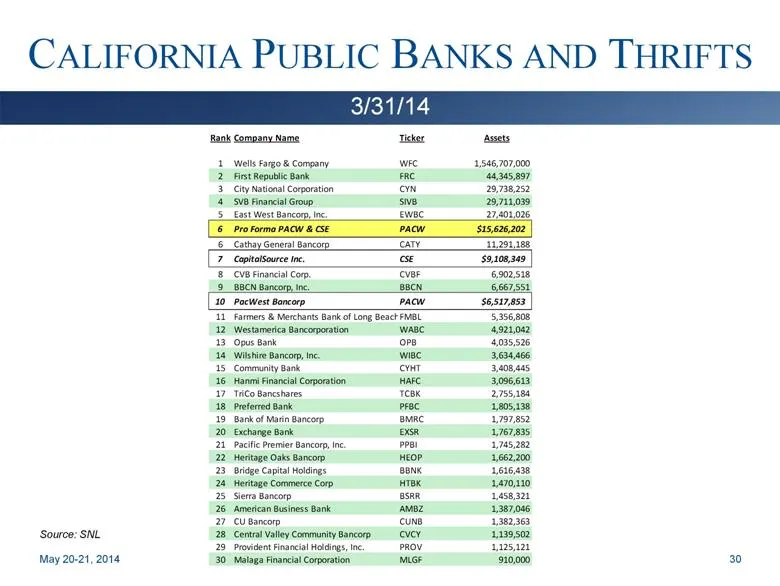
CALIFORNIA PUBLIC BANKS AND THRIFTS May 20-21, 2014 3/31/14 Source: SNL Rank Company Name Ticker Assets 1 Wells Fargo & Company WFC 1,546,707,000 2 First Republic Bank FRC 44,345,897 3 City National Corporation CYN 29,738,252 4 SVB Financial Group SIVB 29,711,039 5 East West Bancorp, Inc. EWBC 27,40
Slide 31: Acquisition Activity
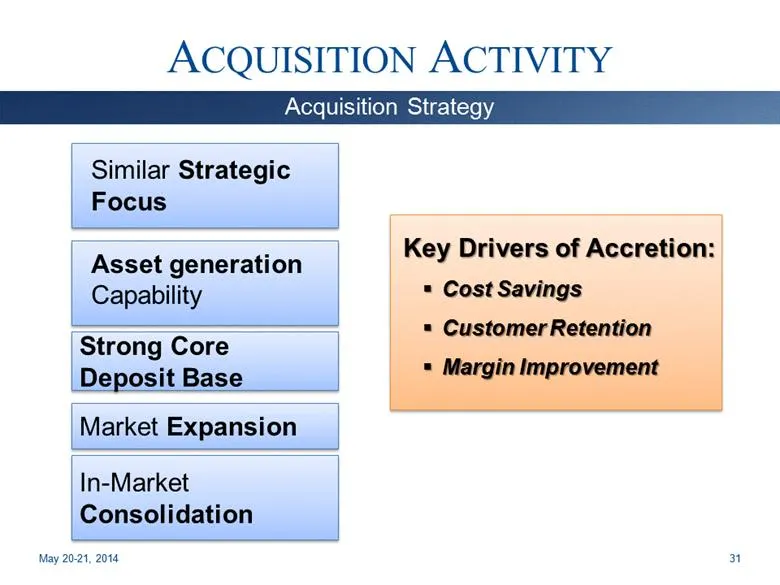
In-Market Consolidation Strong Core Deposit Base ACQUISITION ACTIVITY Similar Strategic Focus Asset generation Capability Key Drivers of Accretion: Cost Savings Customer Retention Margin Improvement May 20-21, 2014 Acquisition Strategy 31 Market Expansion
Slide 32: The CapitalSource Merger
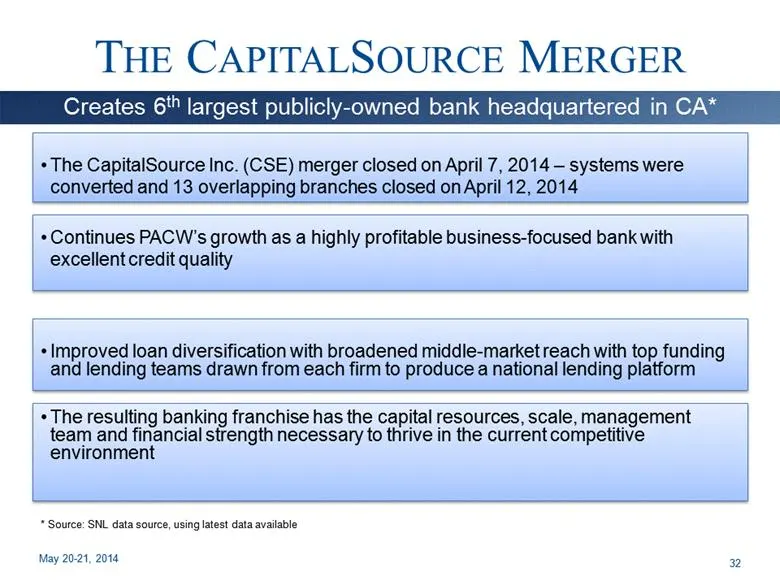
THE CAPITALSOURCE MERGER The CapitalSource Inc. (CSE) merger closed on April 7, 2014 – systems were converted and 13 overlapping branches closed on April 12, 2014 Continues PACW’s growth as a highly profitable business-focused bank with excellent credit quality Improved loan diversification with bro
Slide 33: CapitalSource Overview
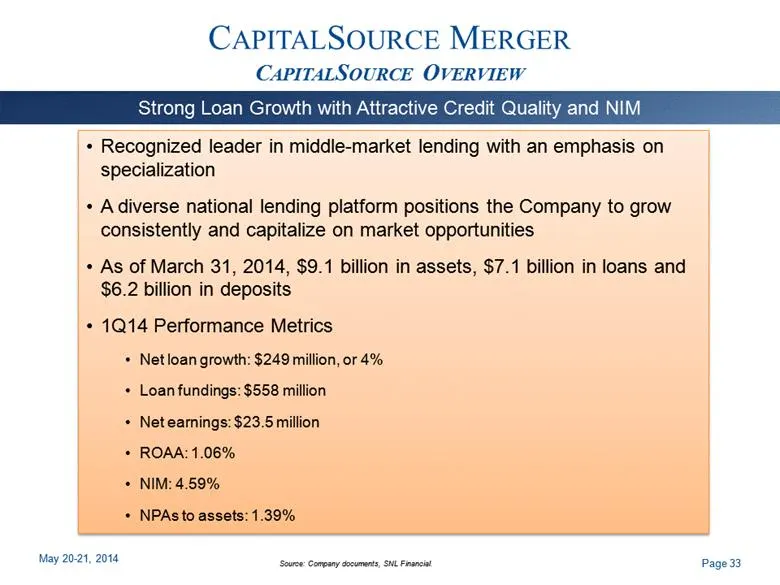
CAPITALSOURCE MERGER CAPITALSOURCE OVERVIEW Page 33 Strong Loan Growth with Attractive Credit Quality and NIM Recognized leader in middle-market lending with an emphasis on specialization A diverse national lending platform positions the Company to grow consistently and capitalize on market opportun
Slide 34: CapitalSource Deposit Platform
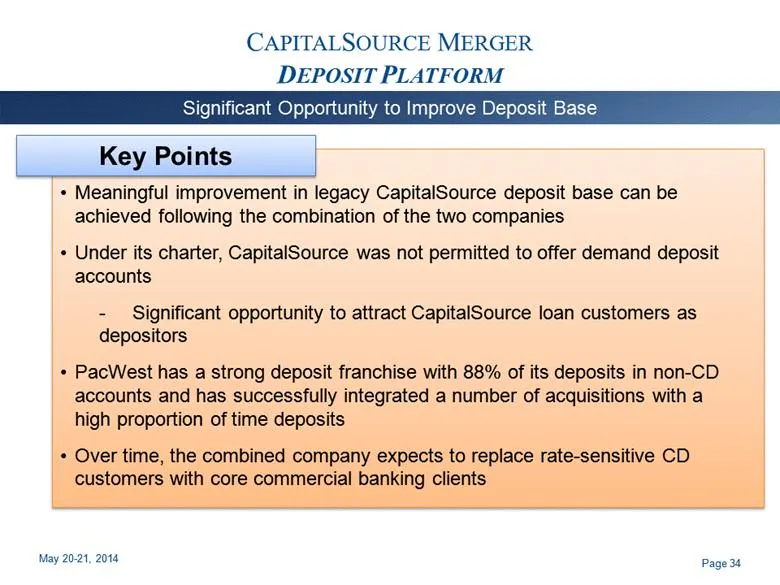
CAPITALSOURCE MERGER DEPOSIT PLATFORM Page 34 Significant Opportunity to Improve Deposit Base Key Points Meaningful improvement in legacy CapitalSource deposit base can be achieved following the combination of the two companies Under its charter, CapitalSource was not permitted to offer demand depos
Slide 35: Purchase Accounting Adjustments
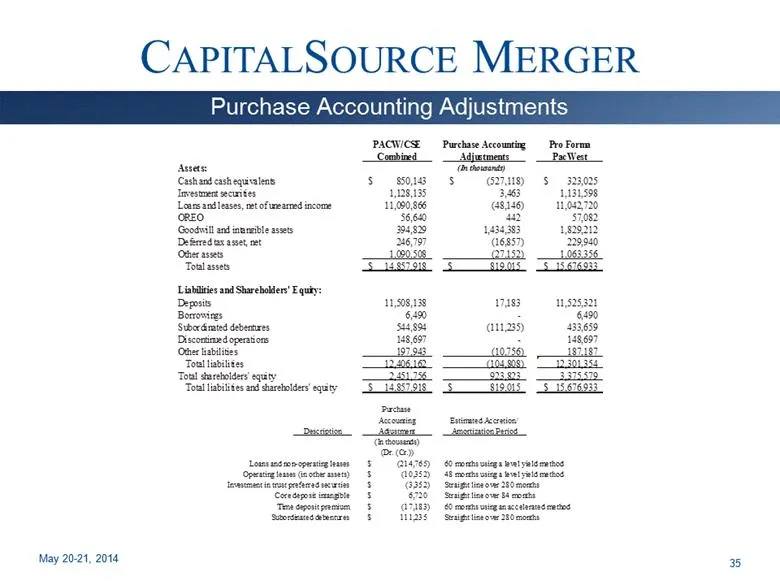
CAPITALSOURCE MERGER May 20-21, 2014 35 Purchase Accounting Adjustments PACW/CSE Purchase Accounting Pro Forma Combined Adjustments PacWest Assets: (In thousands) Cash and cash equivalents 850,143 $ (527,118) $ 323,025 $ Investment securities 1,128,135 3,463 1,131,598 Loans and leases, net of unearn
Slide 36: Loan Composition at 3/31/2014
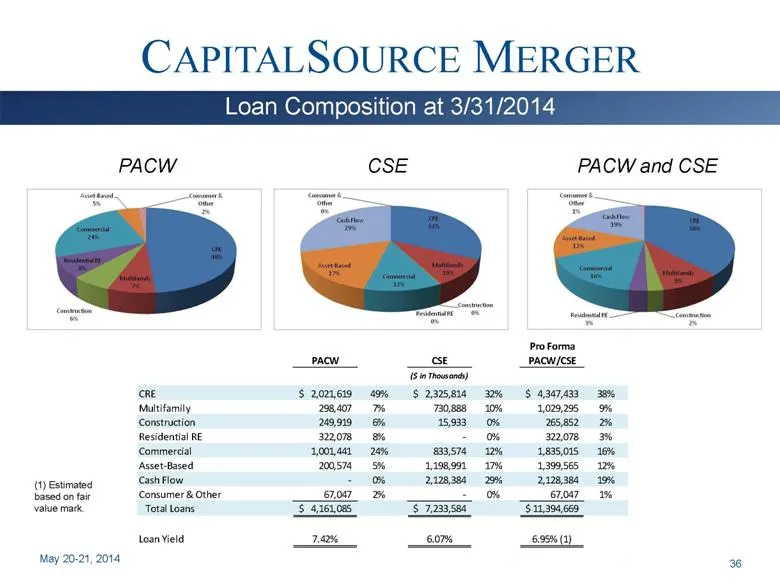
CAPITALSOURCE MERGER May 20-21, 2014 36 Loan Composition at 3/31/2014 PACW CSE PACW and CSE (1) Estimated based on fair value mark. Pro Forma PACW CSE PACW/CSE ($ in Thousands) CRE 2,021,619 $ 49% 2,325,814 $ 32% 4,347,433 $ 38% Multifamily 298,407 7% 730,888 10% 1,029,295 9% Construction 249,919 6%
Slide 37: Deposit Composition at 3/31/2014
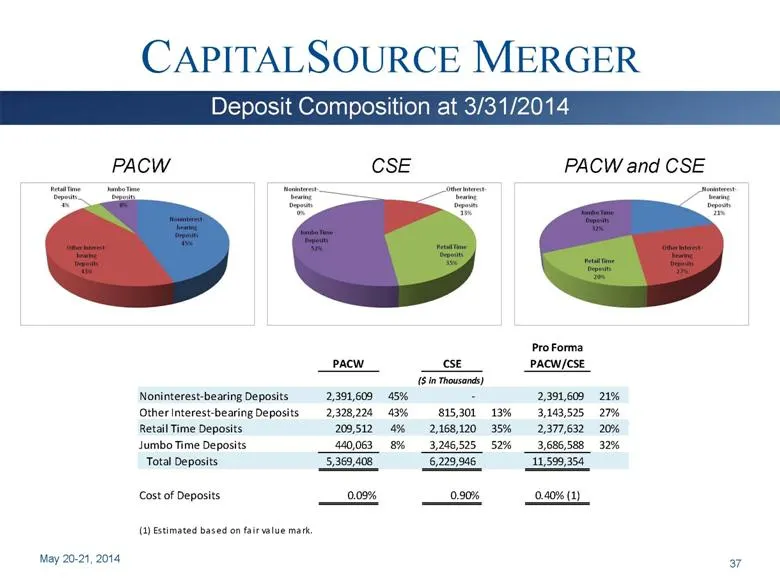
CAPITALSOURCE MERGER May 20-21, 2014 37 Deposit Composition at 3/31/2014 PACW CSE PACW and CSE Pro Forma PACW CSE PACW/CSE ($ in Thousands) Noninterest-bearing Deposits 2,391,609 45% - 2,391,609 21% Other Interest-bearing Deposits 2,328,224 43% 815,301 13% 3,143,525 27% Retail Time Deposits 209,512
Slide 38: Non-GAAP Measurements
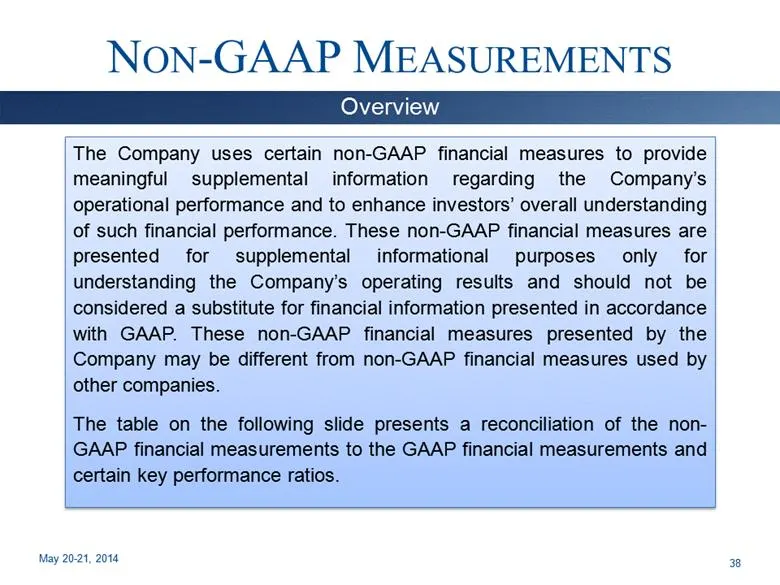
NON-GAAP MEASUREMENTS The Company uses certain non-GAAP financial measures to provide meaningful supplemental information regarding the Company’s operational performance and to enhance investors’ overall understanding of such financial performance. These non-GAAP financial measures are presented for
Slide 39: Adjusted Earnings From Continuing Operations Before Income Taxes
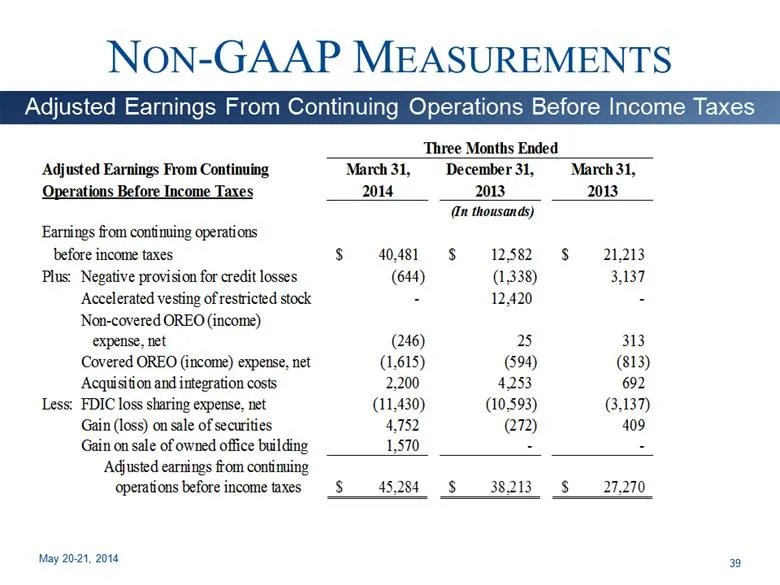
NON-GAAP MEASUREMENTS May 20-21, 2014 Adjusted Earnings From Continuing Operations Before Income Taxes 39 Adjusted Earnings From Continuing March 31, December 31, March 31, Operations Before Income Taxes 2014 2013 2013 (In thousands) Earnings from continuing operations before income taxes 40,481 $ 1
Slide 40: Tangible Equity
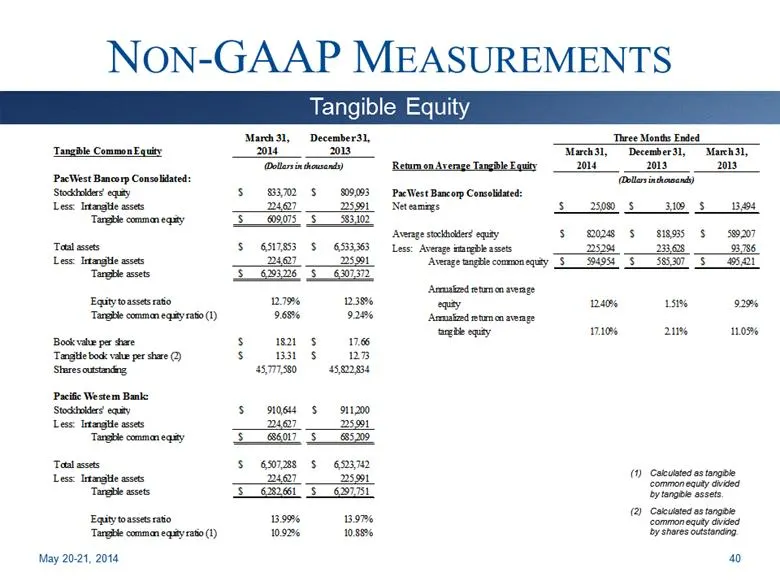
NON-GAAP MEASUREMENTS May 20-21, 2014 Tangible Equity Calculated as tangible common equity divided by tangible assets. Calculated as tangible common equity divided by shares outstanding. 40 March 31, December 31, March 31, Return on Average Tangible Equity 2014 2013 2013 (Dollars in thousands) PacWe
Slide 41: Adjusted Efficiency Ratio
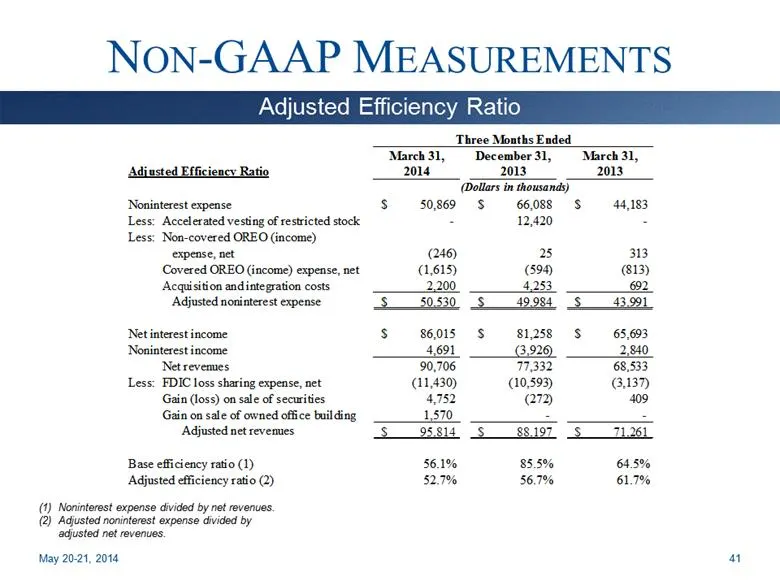
NON-GAAP MEASUREMENTS May 20-21, 2014 Adjusted Efficiency Ratio Noninterest expense divided by net revenues. Adjusted noninterest expense divided by adjusted net revenues. 41 March 31, December 31, March 31, Adjusted Efficiency Ratio 2014 2013 2013 (Dollars in thousands) Noninterest expense $ 50,869
Source: SEC EDGAR · 8-K filed May 19, 2014
More decks from PacWest Bancorp
 Q3 2023 Earnings Presentation27 slides · Oct 24, 2023
 Merger or Acquisition (July 2023)24 slides · Jul 25, 2023
 Q1 2023 Earnings Presentation22 slides · Apr 25, 2023
 Q4 2022 Earnings Presentation17 slides · Jan 26, 2023
 Q3 2022 Earnings Presentation33 slides · Oct 19, 2022
 Investor Presentation (September 2022)23 slides · Sep 19, 2022