JinkoSolar Holding Co., Ltd. · NYSE:JKS
JinkoSolar — FY2010 Earnings Presentation
10 slides from JinkoSolar's earnings presentation, Feb 28, 2011
Slide 1: Q4 and Full Year 2010 Earnings Call Presentation
JinkoSolar Holding Co., Ltd. Q4 and Full Year 2010 Earnings Call Presentation February 28, 2011
Slide 2: Disclaimer
Disclaimer This presentation does not constitute an offer to sell or issue or the solicitation of an offer to buy or acquire securities of JinkoSolar Holding Co., Ltd. (the “Company”) in any jurisdiction or an inducement to enter into investment activity, nor may it or any part of it form the basis
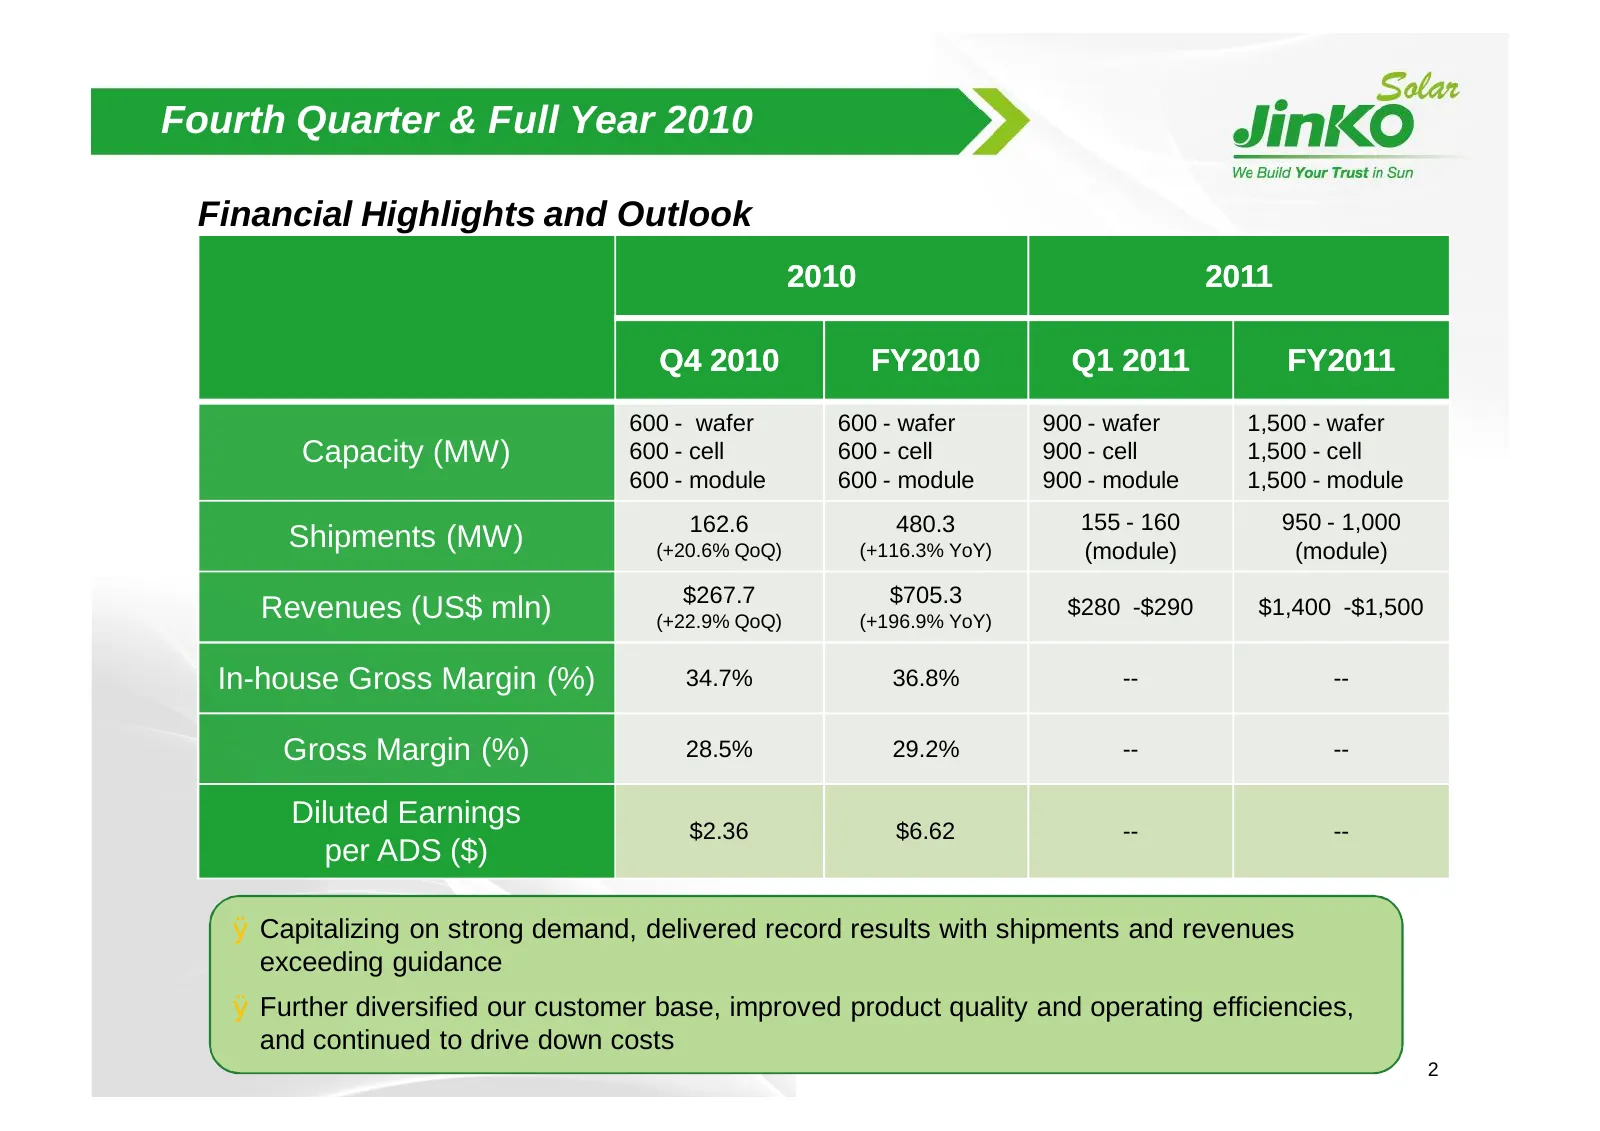
Slide 3: Fourth Quarter & Full Year 2010 Financial Highlights and Outlook
Fourth Quarter & Full Year 2010 Financial Highlights and Outlook 2010 2011 Q4 2010 FY2010 Q1 2011 FY2011 600 - wafer 600 - wafer 900 - wafer 1,500 - wafer Capacity (MW) 600 - cell 600 - cell 900 - cell 1,500 - cell 600 - module 600 - module 900 - module 1,500 - module 162.6 480.3 155 - 160 950 - 1,0
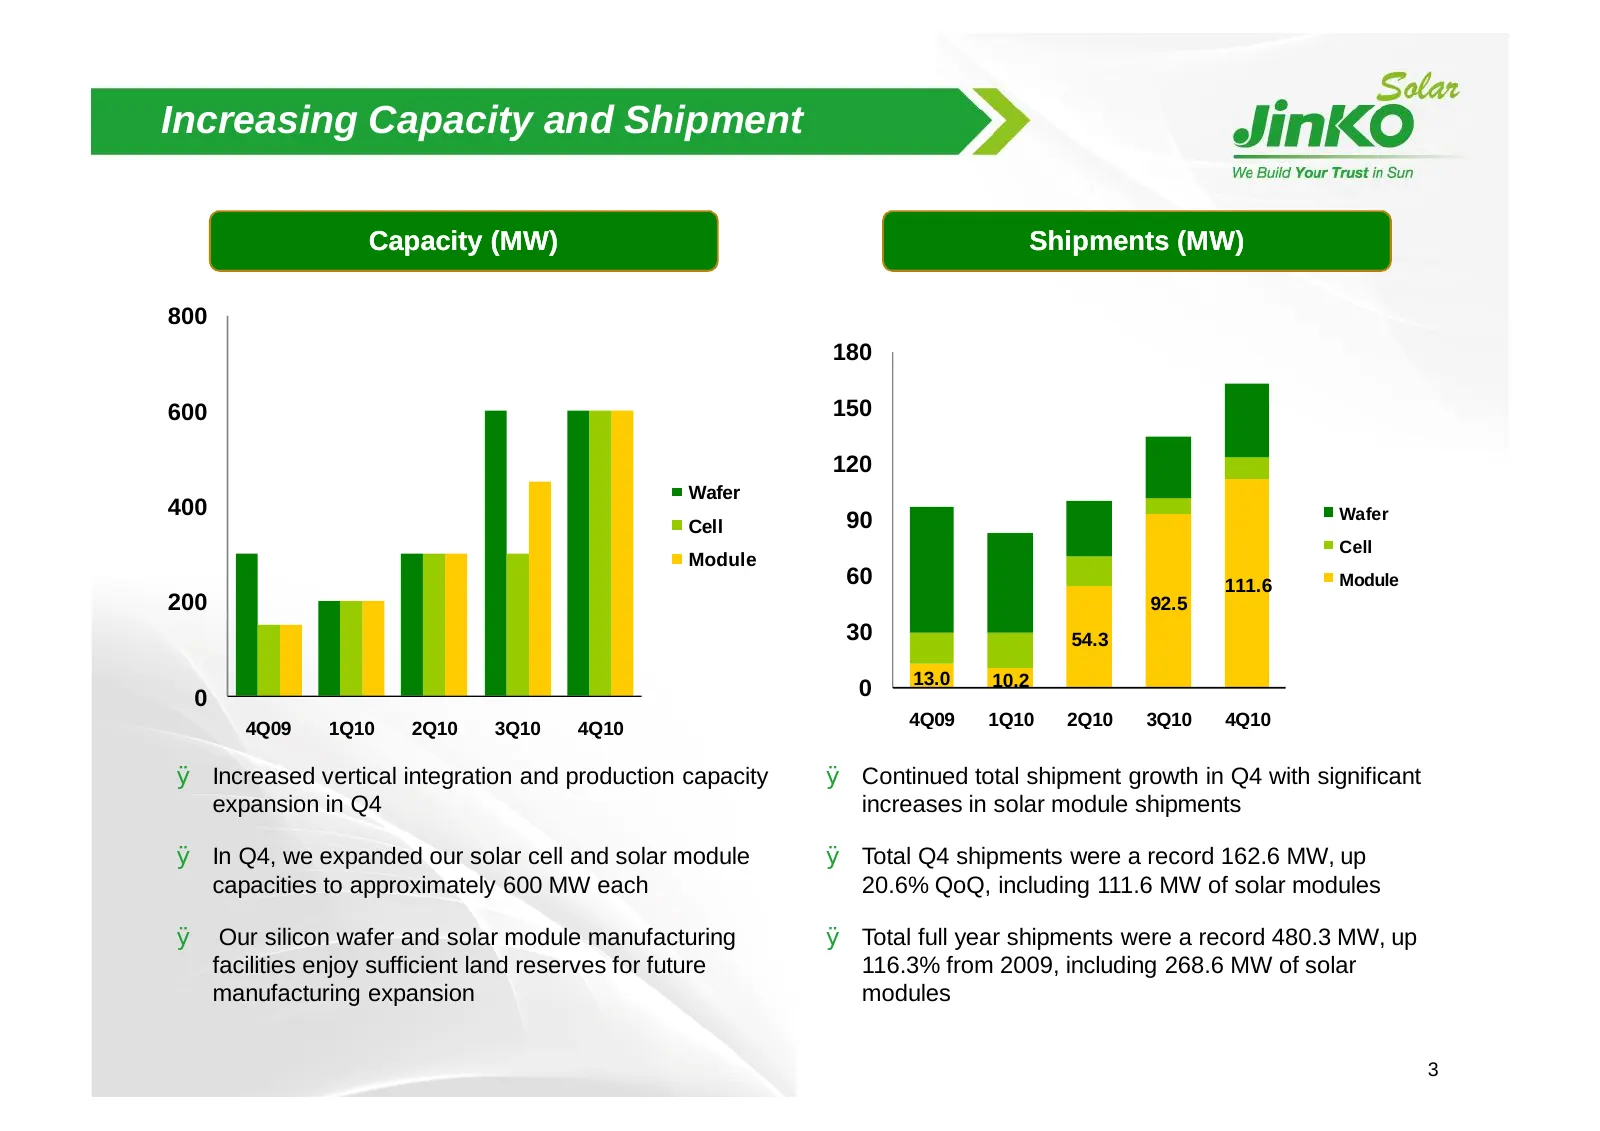
Slide 4: Increasing Capacity and Shipment
Increasing Capacity and Shipment Capacity (MW) Shipments (MW) 800 180 600 150 120 Wafer 400 Wafer Cell 90 Cell Module 60 111.6 Module 200 92.5 30 54.3 13.0 10.2 0 0 4Q09 1Q10 2Q10 3Q10 4Q10 4Q09 1Q10 2Q10 3Q10 4Q10 Ø Increased vertical integration and production capacity Ø Continued total shipment g
Slide 5: Significant Cost per Watt Reduction
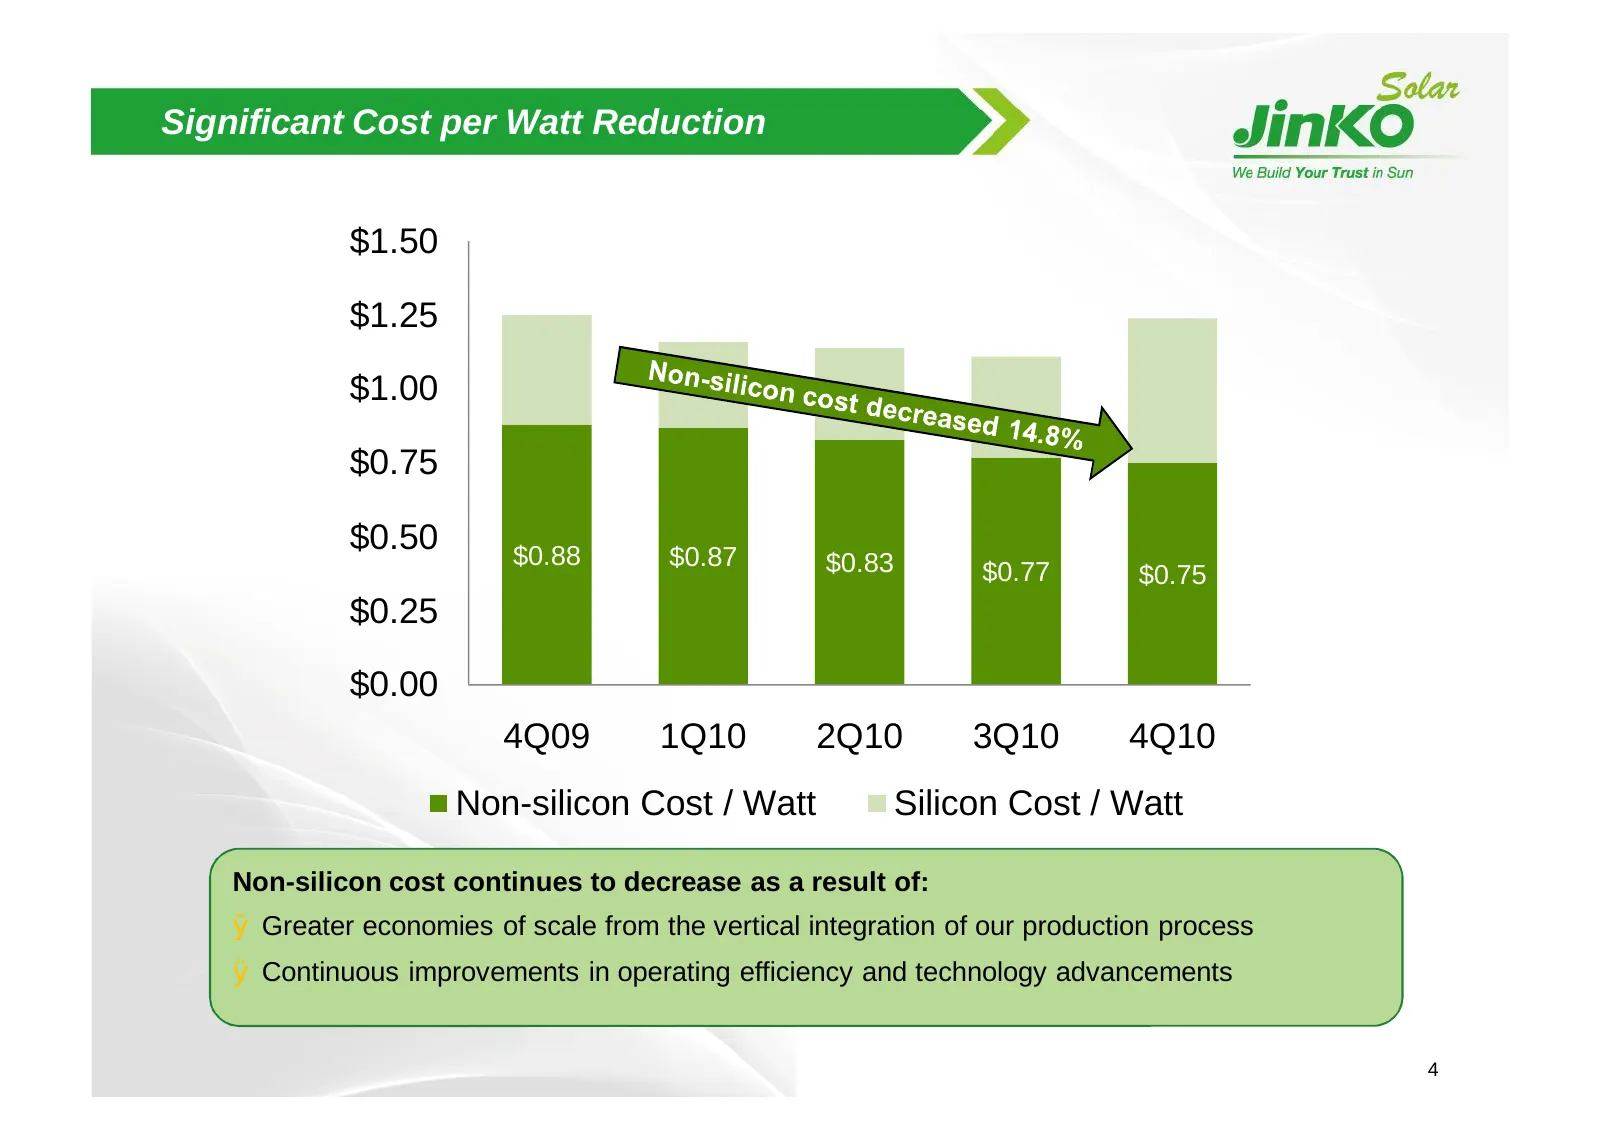
Significant Cost per Watt Reduction $1.50 $1.25 $1.00 $0.75 $0.50 $0.88 $0.87 $0.83 $0.77 $0.75 $0.25 $0.00 4Q09 1Q10 2Q10 3Q10 4Q10 Non-silicon Cost / Watt Silicon Cost / Watt Non-silicon cost continues to decrease as a result of: Ø Greater economies of scale from the vertical integration of our pr
Slide 6: Quarterly Financial Highlights
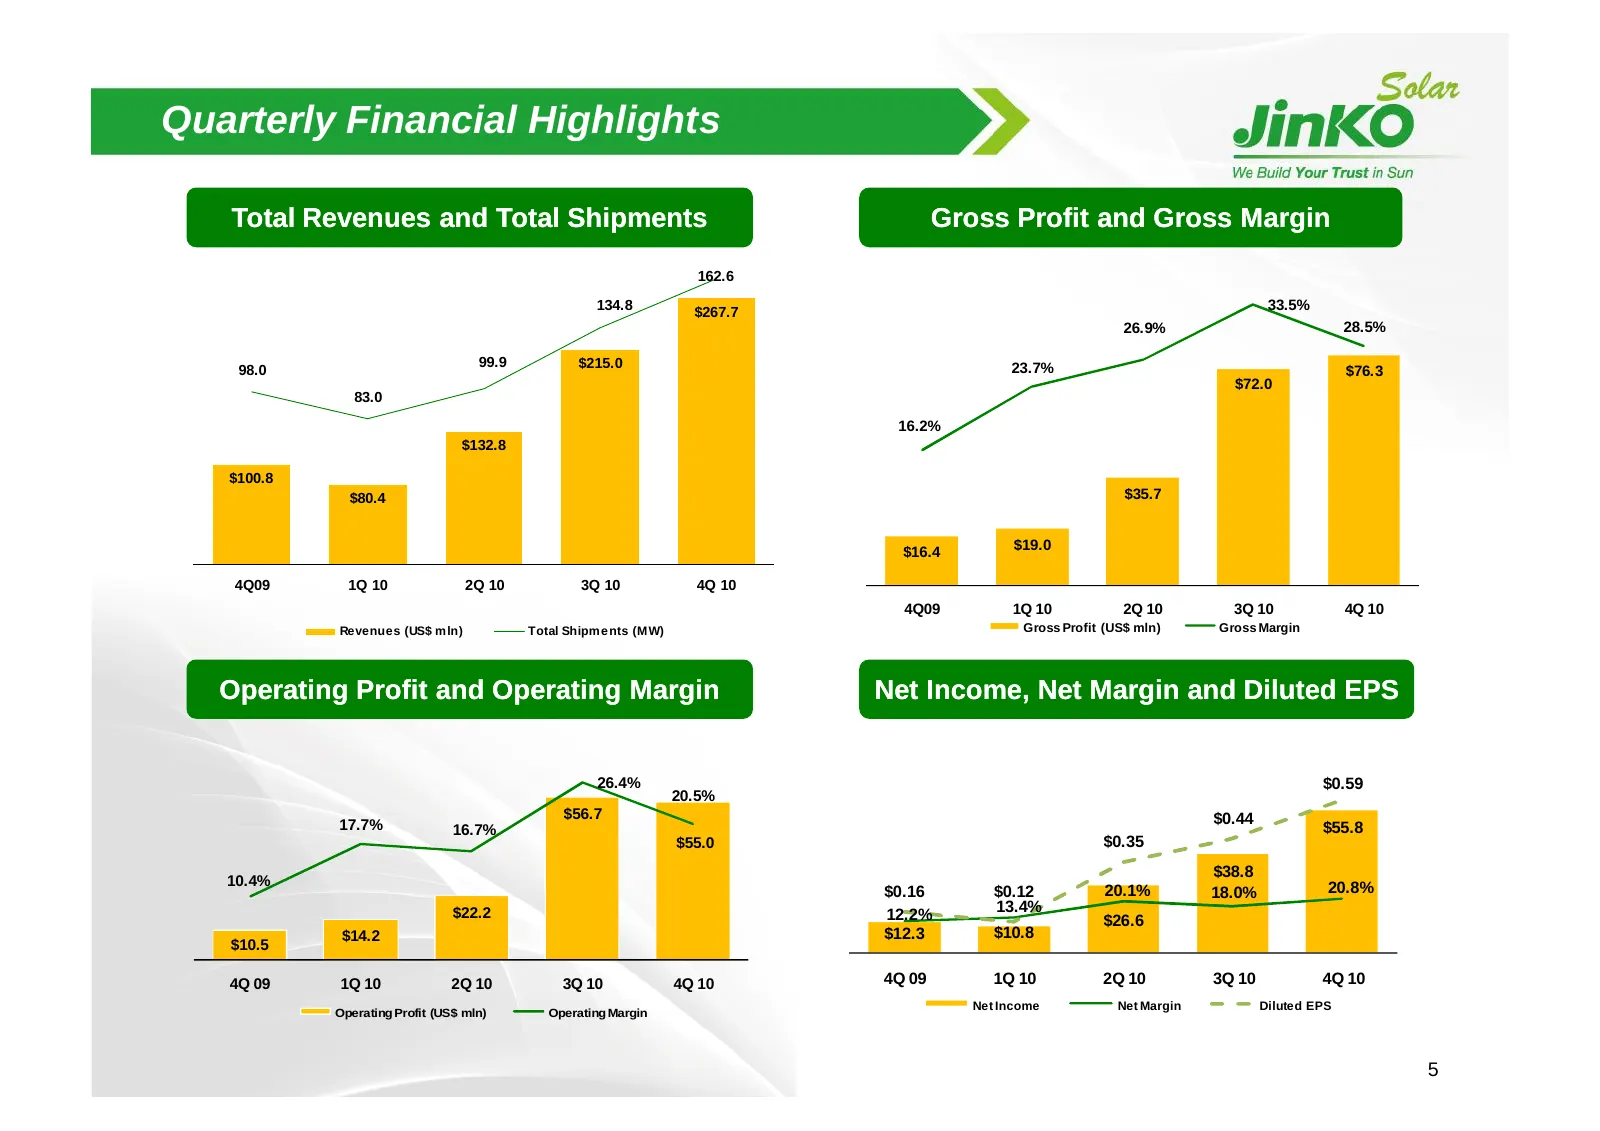
Quarterly Financial Highlights Total Revenues and Total Shipments Gross Profit and Gross Margin 162.6 134.8 $267.7 33.5% 26.9% 28.5% 99.9 $215.0 23.7% 98.0 $76.3 $72.0 83.0 16.2% $132.8 $100.8 $80.4 $35.7 $19.0 $16.4 4Q09 1Q 10 2Q 10 3Q 10 4Q 10 4Q09 1Q 10 2Q 10 3Q 10 4Q 10 Revenues (US$ m ln) Total
Slide 7: Yearly Financial Highlights
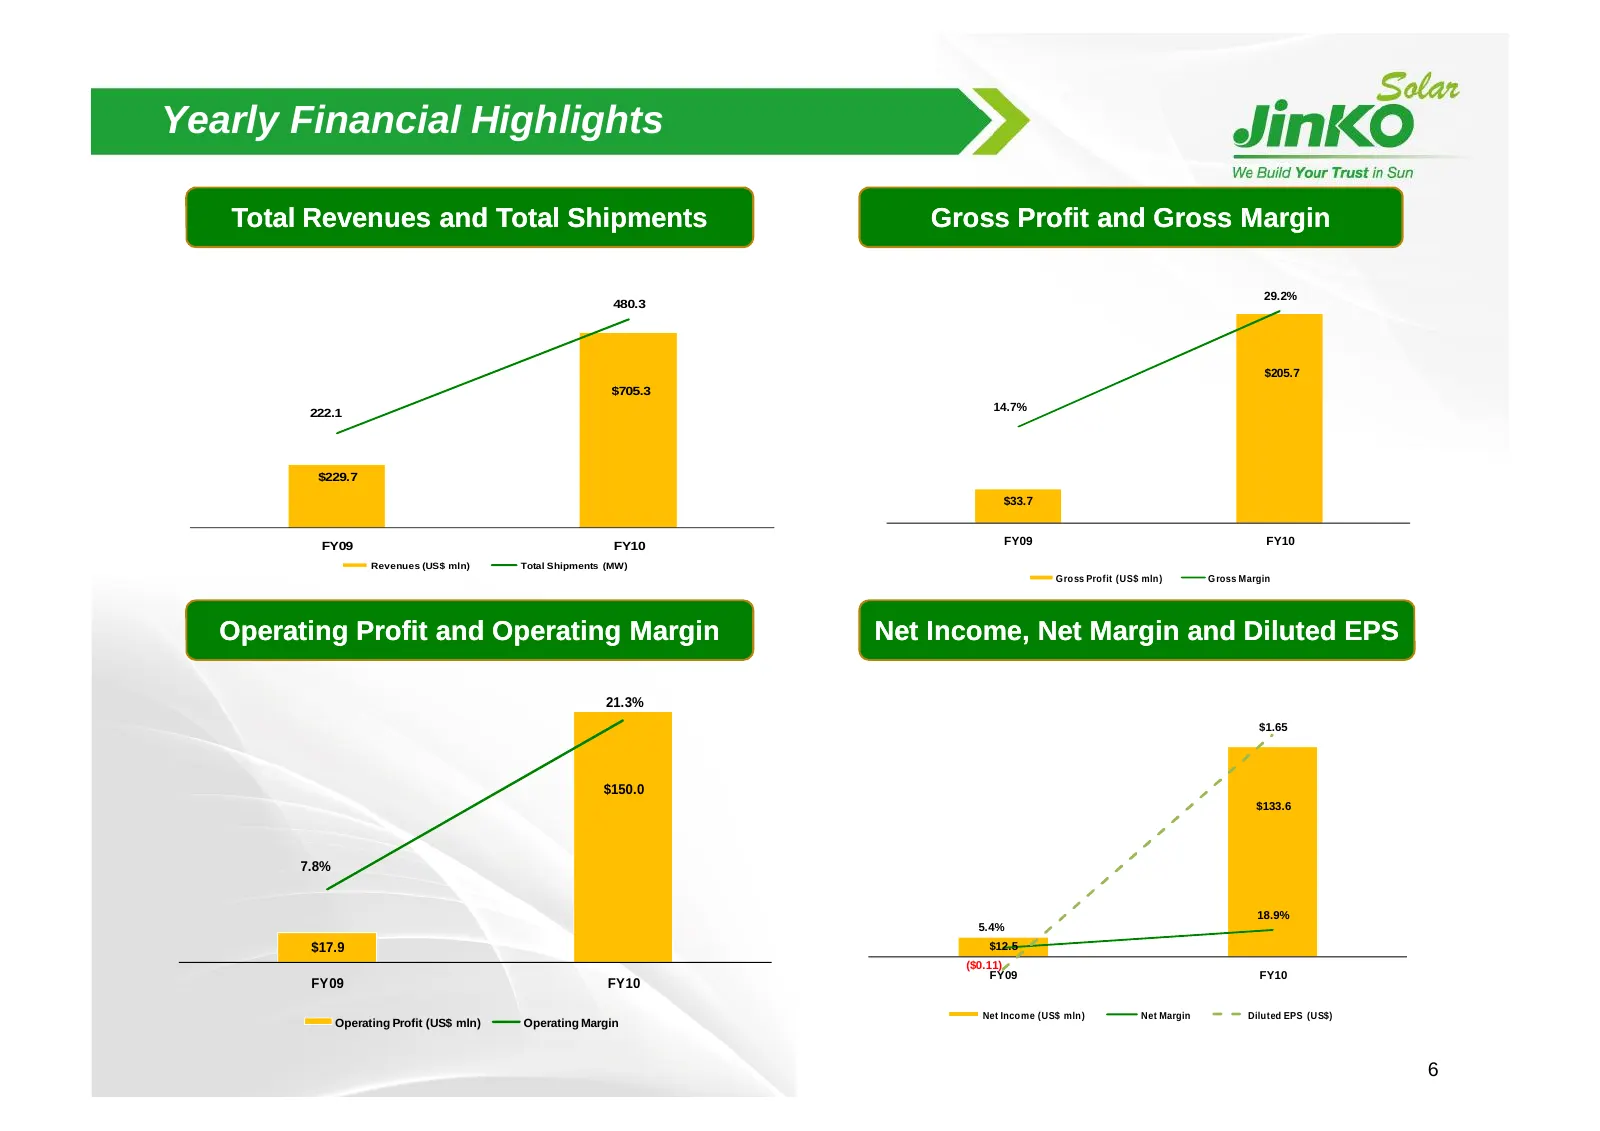
Yearly Financial Highlights Total Revenues and Total Shipments Gross Profit and Gross Margin 29.2% 480.3 $205.7 $705.3 14.7% 222.1 $229.7 $33.7 FY09 FY10 FY09 FY10 Revenues (US$ mln) Total Shipments (MW) G ross Profit (US$ mln) G ross Margin Operating Profit and Operating Margin Net Income, Net Marg
Slide 8: P&L Summary
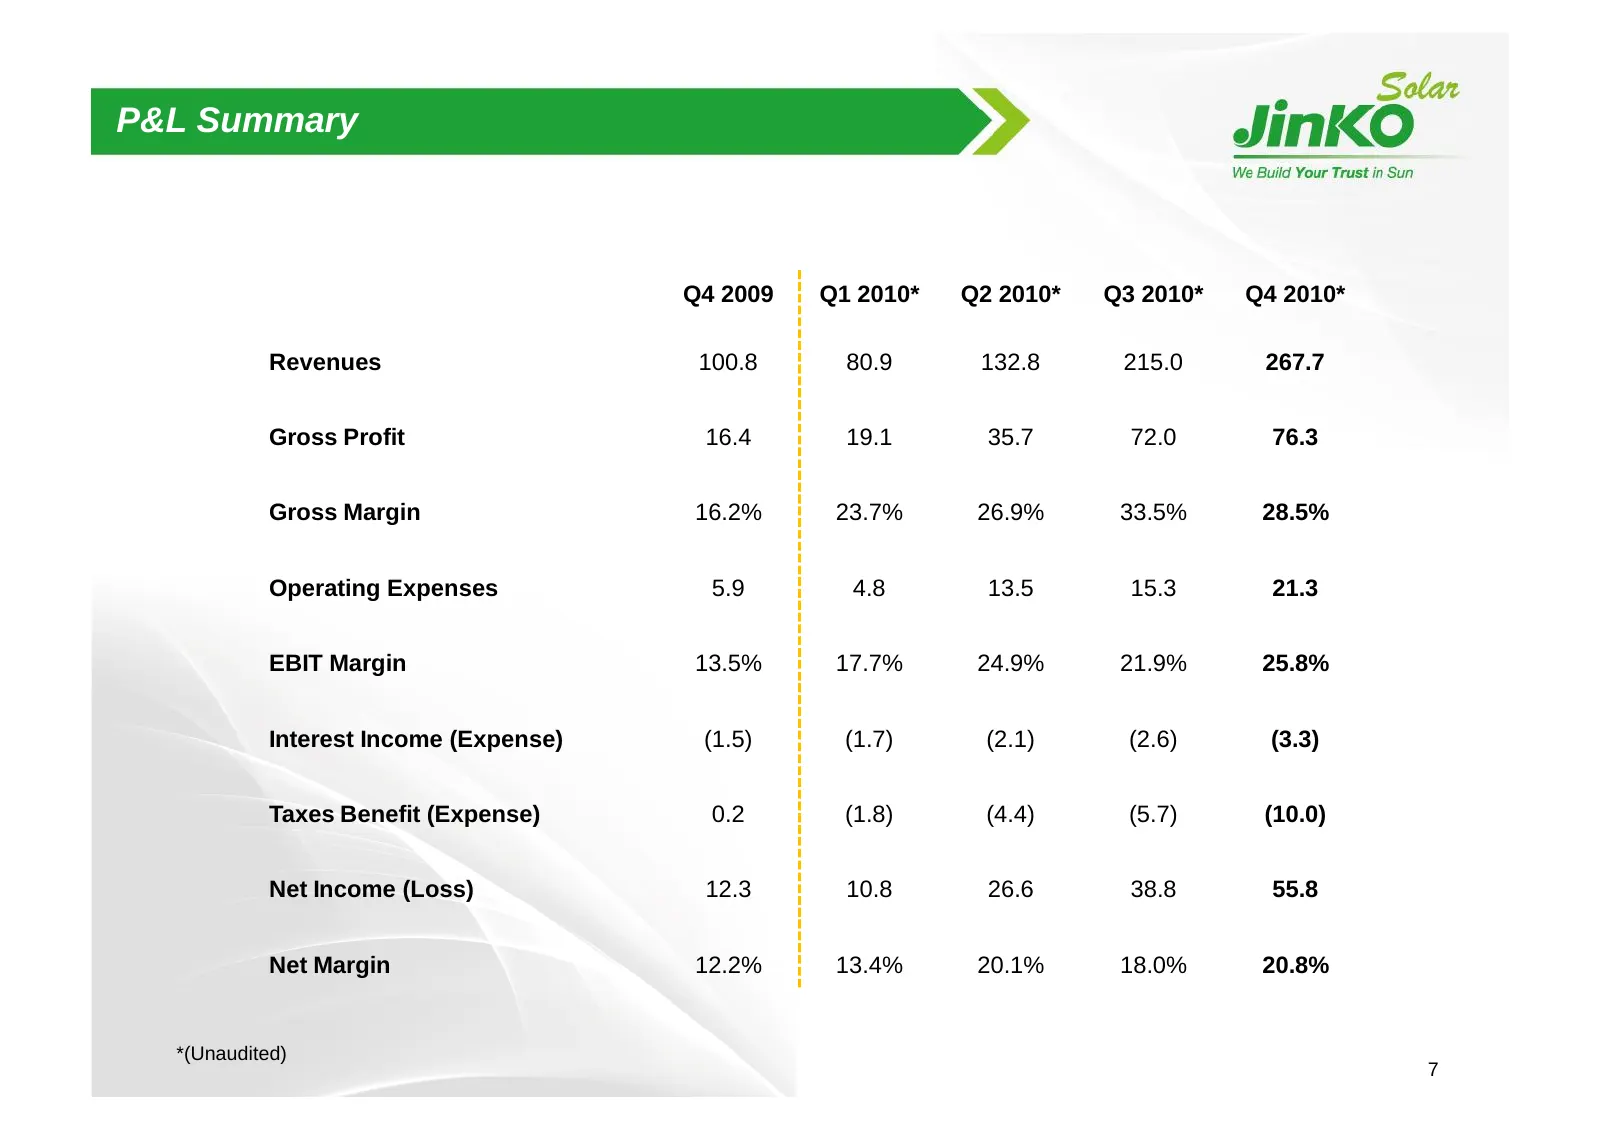
P&L Summary Q4 2009 Q1 2010* Q2 2010* Q3 2010* Q4 2010* Revenues 100.8 80.9 132.8 215.0 267.7 Gross Profit 16.4 19.1 35.7 72.0 76.3 Gross Margin 16.2% 23.7% 26.9% 33.5% 28.5% Operating Expenses 5.9 4.8 13.5 15.3 21.3 EBIT Margin 13.5% 17.7% 24.9% 21.9% 25.8% Interest Income (Expense) (1.5) (1.7) (2.
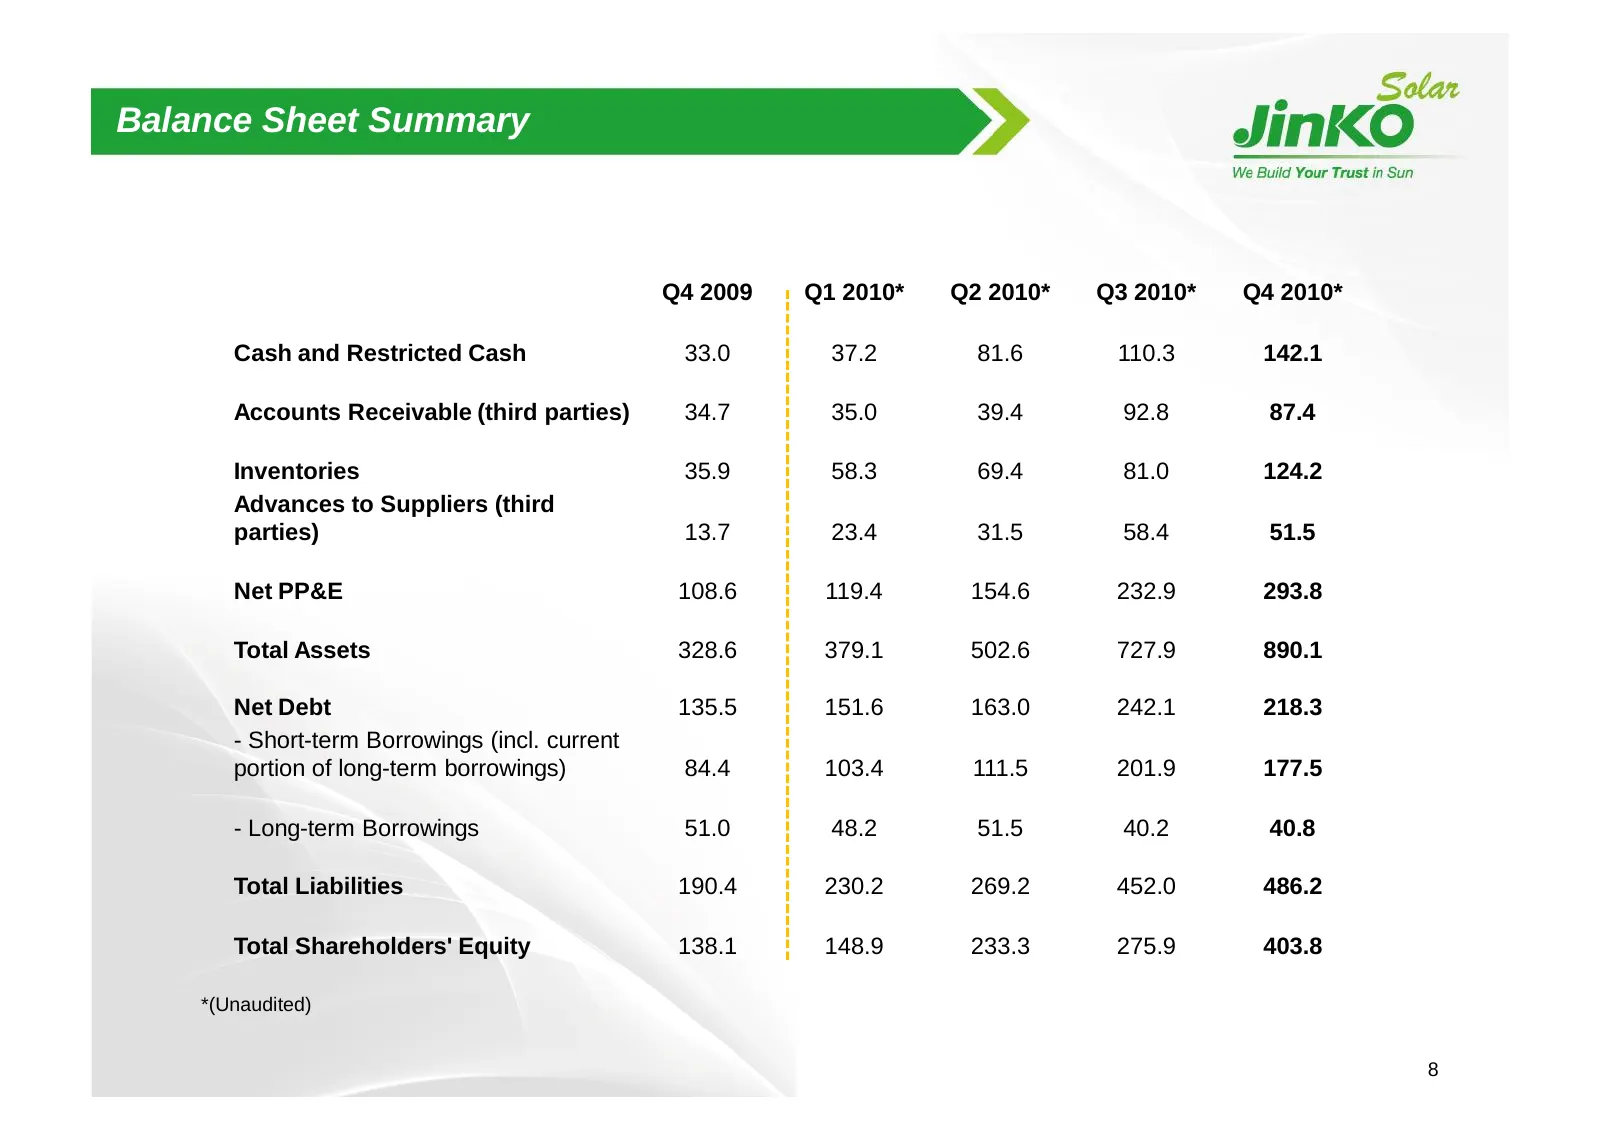
Slide 9: Balance Sheet Summary
Balance Sheet Summary Q4 2009 Q1 2010* Q2 2010* Q3 2010* Q4 2010* Cash and Restricted Cash 33.0 37.2 81.6 110.3 142.1 Accounts Receivable (third parties) 34.7 35.0 39.4 92.8 87.4 Inventories 35.9 58.3 69.4 81.0 124.2 Advances to Suppliers (third parties) 13.7 23.4 31.5 58.4 51.5 Net PP&E 108.6 119.4

Slide 10: Thank you!
Thank you! www.jinkosolar.com 9
Source: company website
More decks from JinkoSolar Holding Co., Ltd.
 Q2 2026 Earnings Presentation15 slides · Aug 26, 2026
 Q4 2025 Earnings Presentation15 slides · Apr 16, 2026
 Q4 2024 Earnings Presentation16 slides · Mar 26, 2025
 Q4 2022 Earnings Presentation17 slides · Mar 10, 2023
 Q3 2022 Earnings Presentation14 slides · Oct 28, 2022
 Q2 2022 Earnings Presentation14 slides · Aug 26, 2022