Umpqua — DA Davidson Financial Institutions Conference 2015
25 slides from Umpqua's conference presentation, May 11, 2015
Slide 1: Umpqua Holdings Corporation – DA Davidson Financial Institutions Conference
UMPQUA HOLDINGS CORPORATION DA Davidson Financial Institutions Conference May 12, 2015
Slide 2: Forward-looking Statements
Forward-looking Statements 2 This presentation includes forward-looking statements within the meaning of the “Safe-Harbor” provisions of the Private Securities Litigation Reform Act of 1995, which management believes are a benefit to shareholders. These statements are necessarily subject to risk and
Slide 3: The World's Greatest Bank
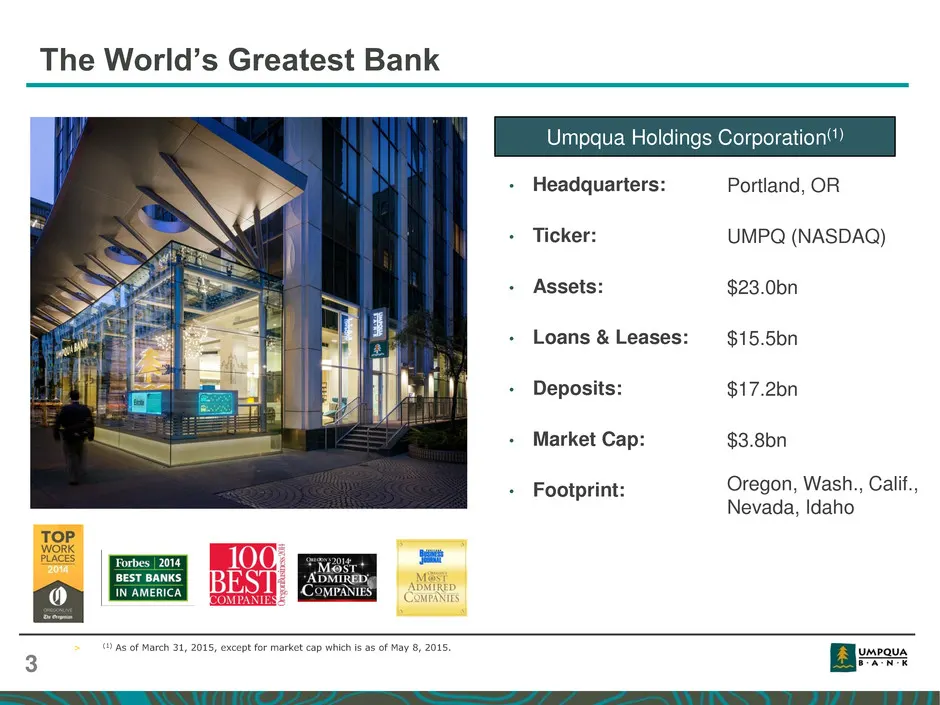
The World’s Greatest Bank 3 • Headquarters: • Ticker: • Assets: • Loans & Leases: • Deposits: • Market Cap: • Footprint: Portland, OR UMPQ (NASDAQ) $23.0bn $15.5bn $17.2bn $3.8bn Oregon, Wash., Calif., Nevada, Idaho Umpqua Holdings Corporation(1) > (1) As of March 31, 2015, except for market cap whi
Slide 4: Uniquely Positioned Geographic Footprint
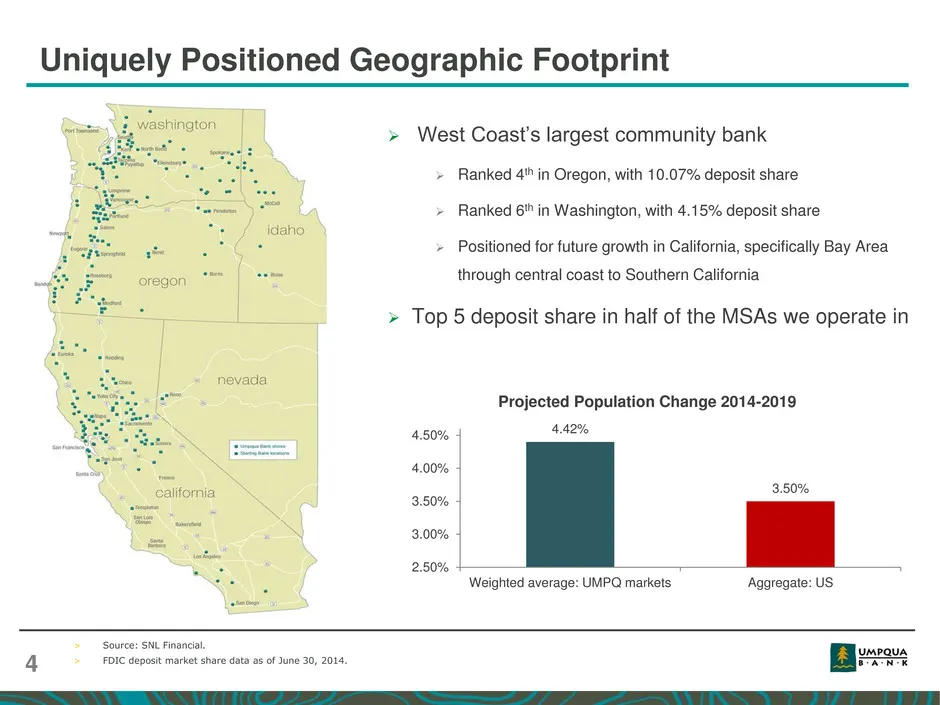
Uniquely Positioned Geographic Footprint 4 West Coast’s largest community bank Ranked 4th in Oregon, with 10.07% deposit share Ranked 6th in Washington, with 4.15% deposit share Positioned for future growth in California, specifically Bay Area through central coast to Southern California T
Slide 5: Diversified Business Model
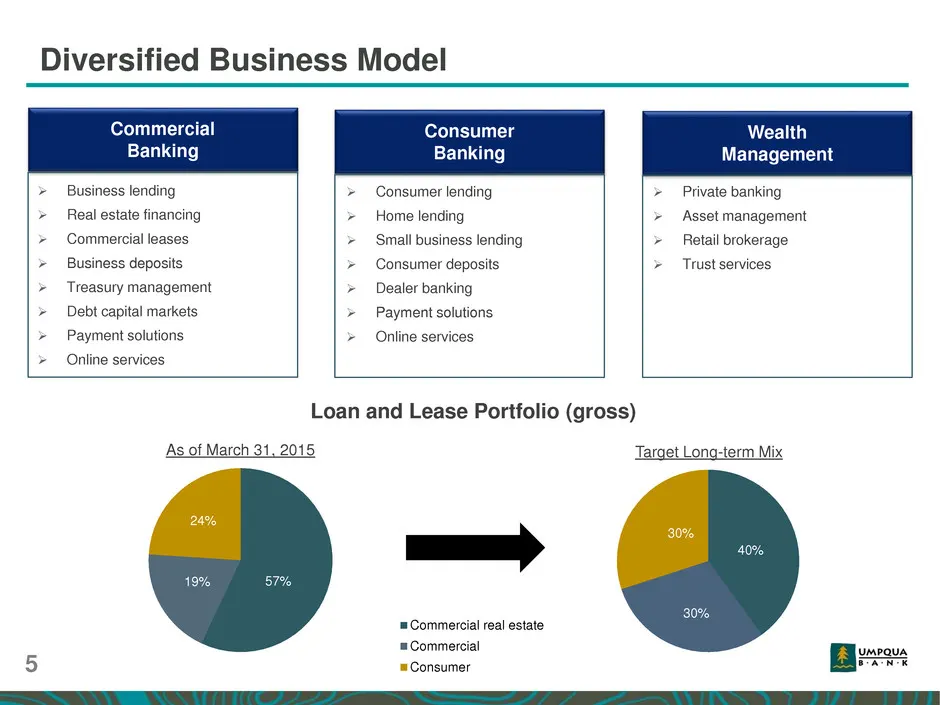
57% 19% 24% Commercial real estate Commercial Consumer Diversified Business Model Commercial Banking Consumer Banking Wealth Management Business lending Real estate financing Commercial leases Business deposits Treasury management Debt capital markets Payment solutions Online service
Slide 6: What Makes Umpqua a Different Kind of Bank
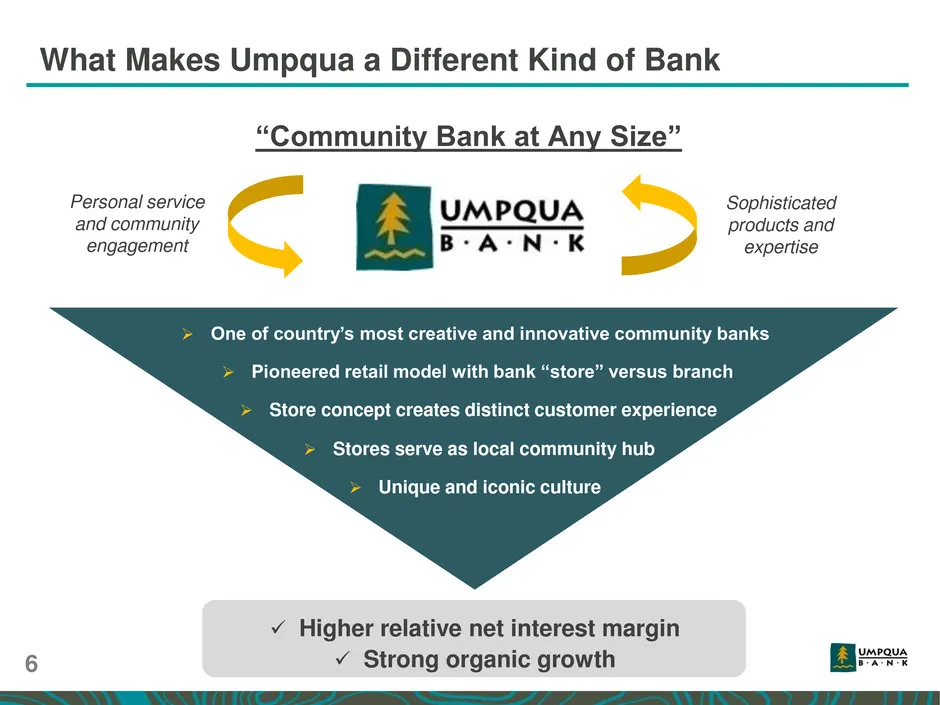
What Makes Umpqua a Different Kind of Bank 6 “Community Bank at Any Size” Personal service and community engagement Sophisticated products and expertise One of country’s most creative and innovative community banks Pioneered retail model with bank “store” versus branch Unique and iconic cultur
Slide 7: Net Interest Margin Outperforming Peers
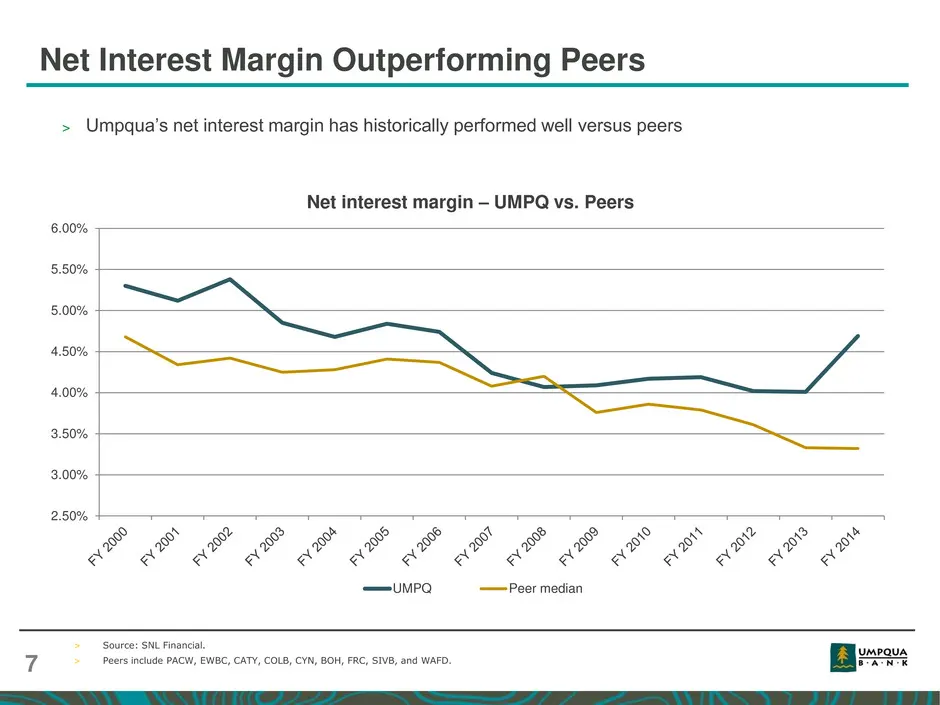
Net Interest Margin Outperforming Peers > Umpqua’s net interest margin has historically performed well versus peers 7 > Source: SNL Financial. > Peers include PACW, EWBC, CATY, COLB, CYN, BOH, FRC, SIVB, and WAFD. 2.50% 3.00% 3.50% 4.00% 4.50% 5.00% 5.50% 6.00% Net interest margin – UMPQ vs. Peers U
Slide 8: Loan Portfolio
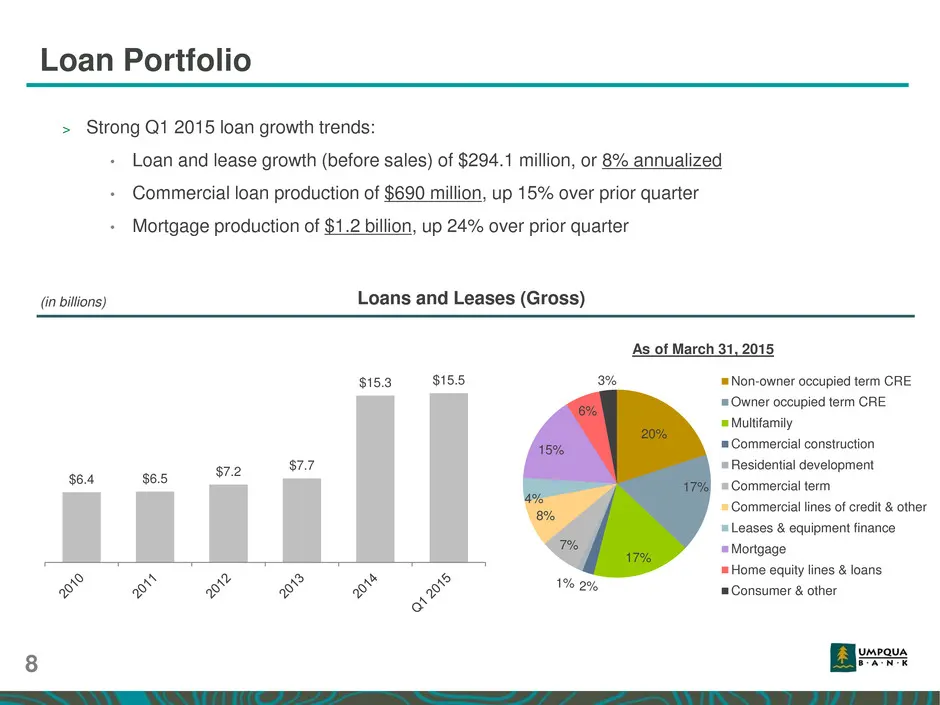
Loan Portfolio 8 Loans and Leases (Gross) $6.4 $6.5 $7.2 $7.7 $15.3 $15.5 (in billions) 20% 17% 17% 2% 1% 7% 8% 4% 15% 6% 3% Non-owner occupied term CRE Owner occupied term CRE Multifamily Commercial construction Residential development Commercial term Commercial lines of credit & other Leases & equ
Slide 9: Deposit Portfolio
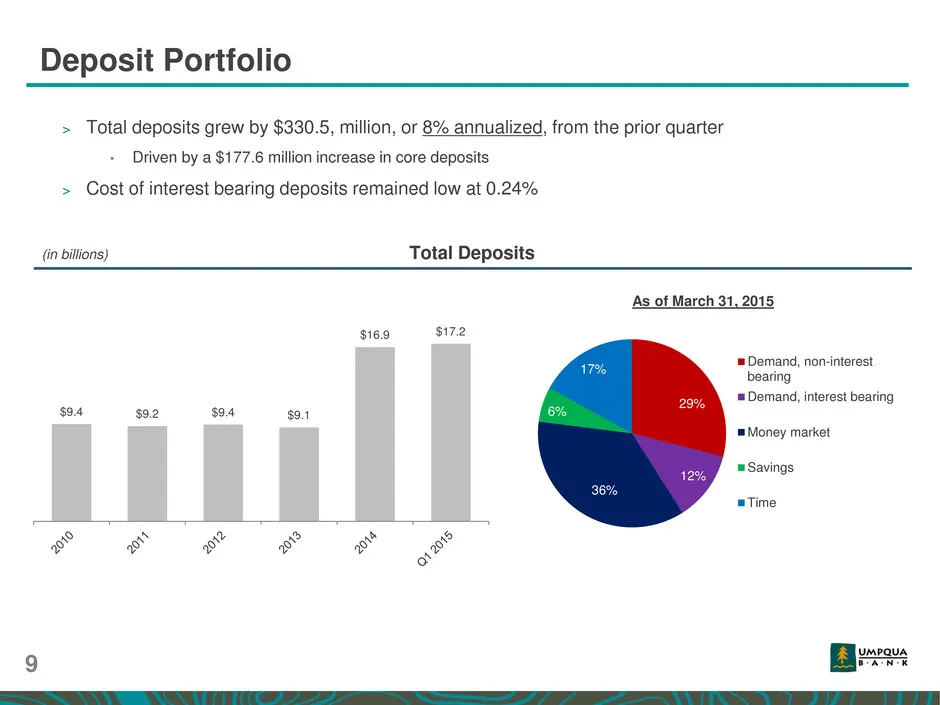
29% 12% 36% 6% 17% Demand, non-interest bearing Demand, interest bearing Money market Savings Time Deposit Portfolio $9.4 $9.2 $9.4 $9.1 $16.9 $17.2 (in billions) Total Deposits As of March 31, 2015 > Total deposits grew by $330.5, million, or 8% annualized, from the prior quarter • Driven by a $177
Slide 10: Strong Loan Growth in Ancillary Business Lines
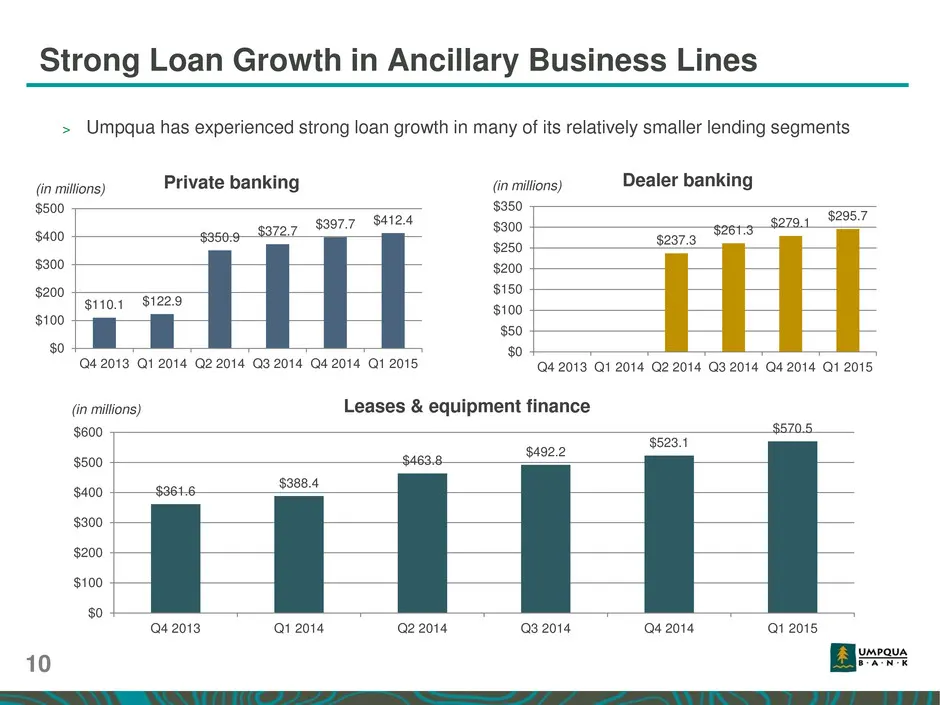
Strong Loan Growth in Ancillary Business Lines 10 > Umpqua has experienced strong loan growth in many of its relatively smaller lending segments $361.6 $388.4 $463.8 $492.2 $523.1 $570.5 $0 $100 $200 $300 $400 $500 $600 Q4 2013 Q1 2014 Q2 2014 Q3 2014 Q4 2014 Q1 2015 Leases & equipment finance $110.
Slide 11: Improved Profitability Metrics and Shareholder Returns
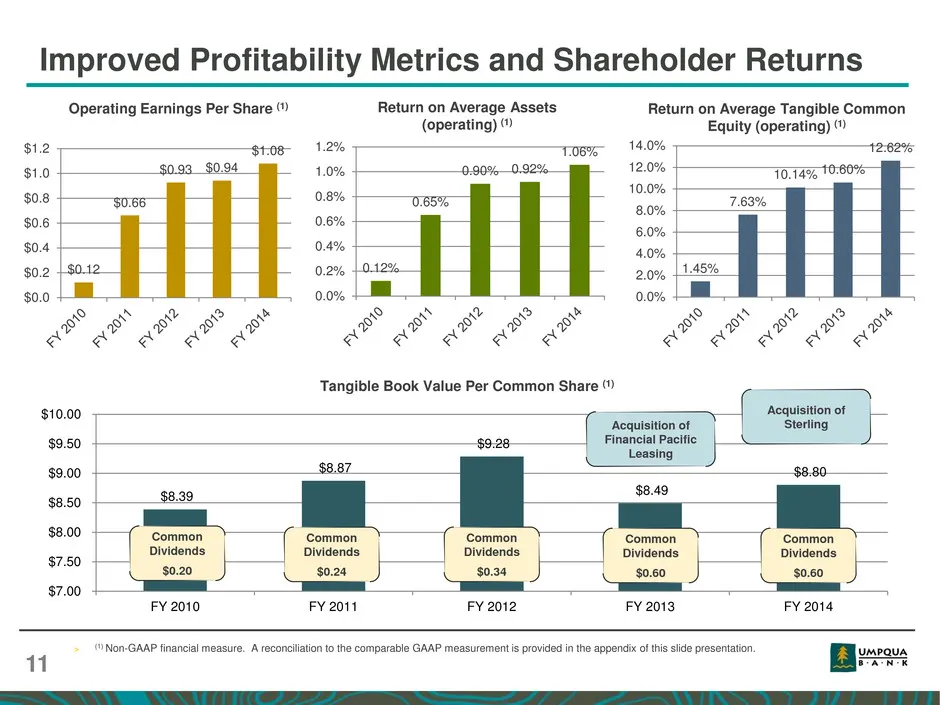
Improved Profitability Metrics and Shareholder Returns 11 $0.12 $0.66 $0.93 $0.94 $1.08 $0.0 $0.2 $0.4 $0.6 $0.8 $1.0 $1.2 1.45% 7.63% 10.14% 10.60% 12.62% 0.0% 2.0% 4.0% 6.0% 8.0% 10.0% 12.0% 14.0% Operating Earnings Per Share (1) Return on Average Tangible Common Equity (operating) (1) Tangible Bo
Slide 12: First Quarter 2015 Highlights
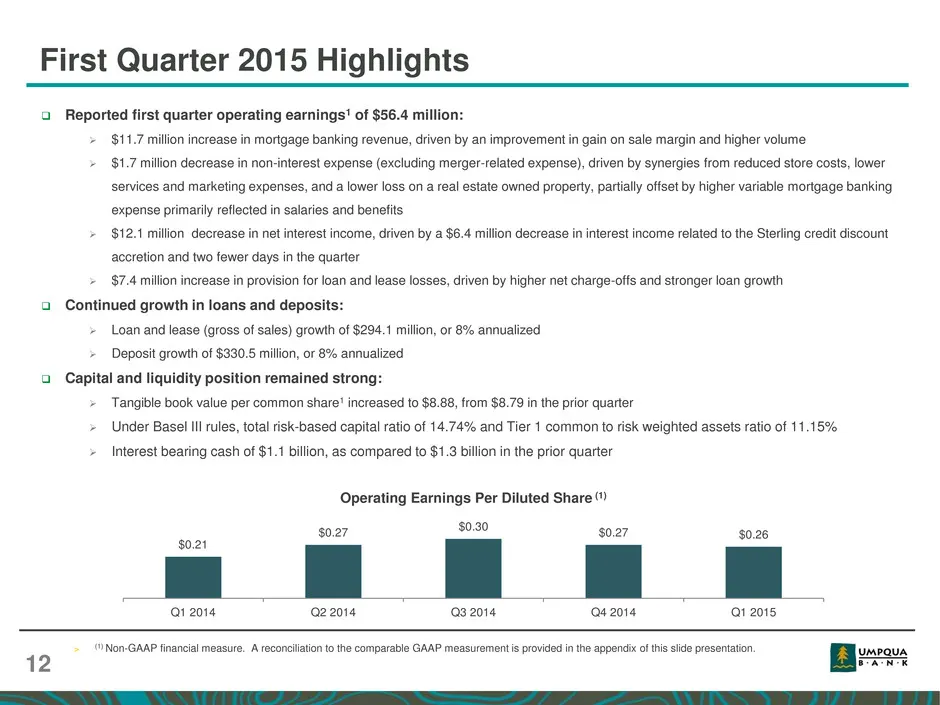
First Quarter 2015 Highlights 12 > (1) Non-GAAP financial measure. A reconciliation to the comparable GAAP measurement is provided in the appendix of this slide presentation. Reported first quarter operating earnings1 of $56.4 million: $11.7 million increase in mortgage banking revenue, driven b
Slide 13: Net Interest Income and Margin
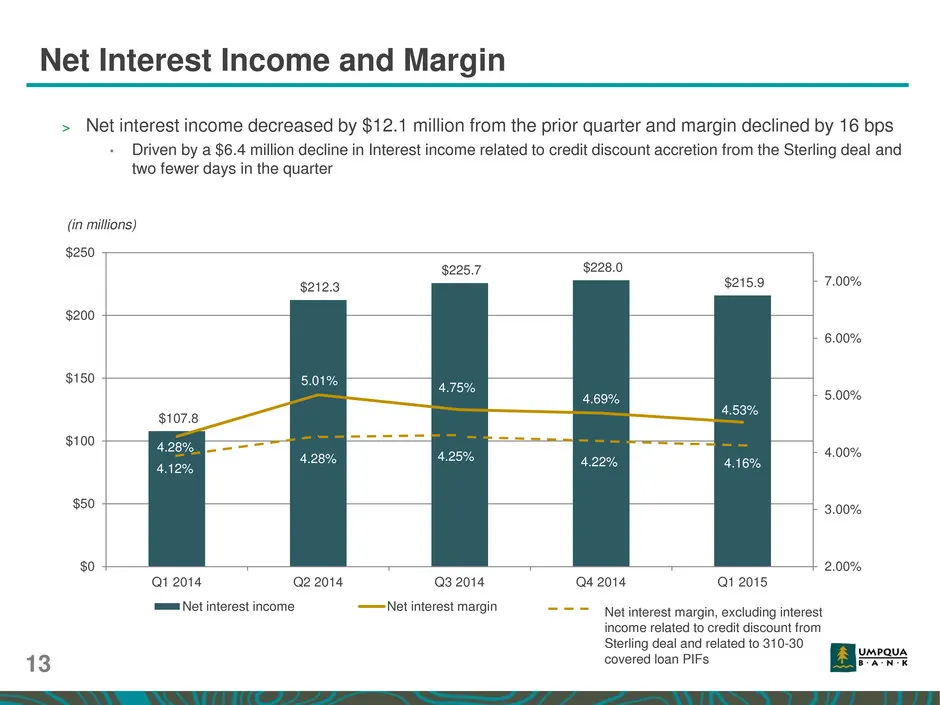
Net Interest Income and Margin 13 $107.8 $212.3 $225.7 $228.0 $215.9 4.28% 5.01% 4.75% 4.69% 4.53% 2.00% 3.00% 4.00% 5.00% 6.00% 7.00% $0 $50 $100 $150 $200 $250 Q1 2014 Q2 2014 Q3 2014 Q4 2014 Q1 2015 Net interest income Net interest margin > Net interest income decreased by $12.1 million from the
Slide 14: Provision for Loan and Lease Losses
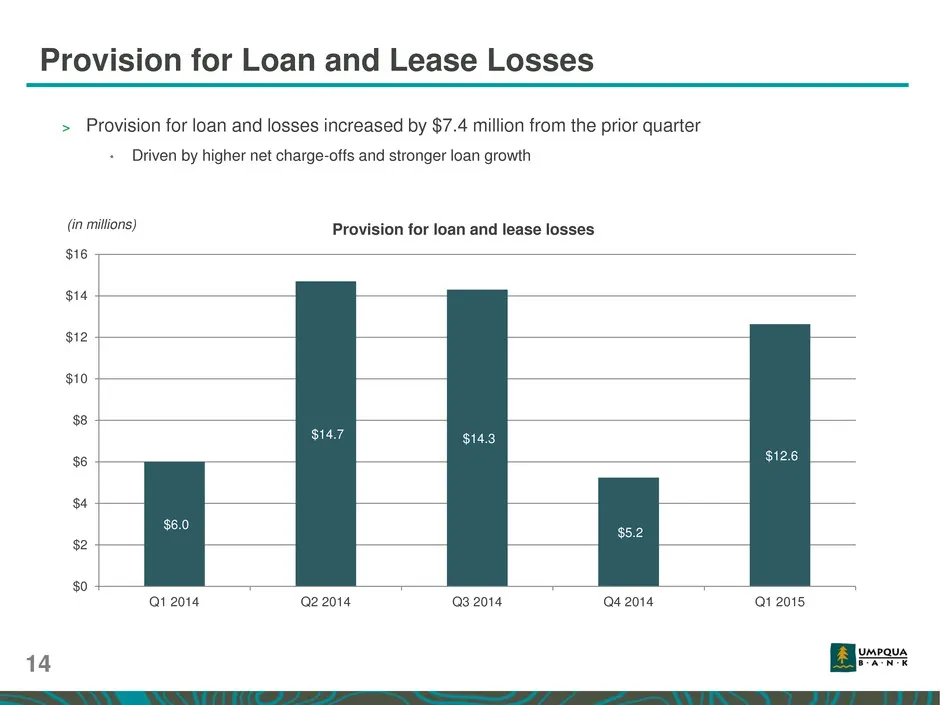
Provision for Loan and Lease Losses 14 > Provision for loan and losses increased by $7.4 million from the prior quarter • Driven by higher net charge-offs and stronger loan growth $6.0 $14.7 $14.3 $5.2 $12.6 $0 $2 $4 $6 $8 $10 $12 $14 $16 Q1 2014 Q2 2014 Q3 2014 Q4 2014 Q1 2015 Provision for loan an
Slide 15: Non-interest Income
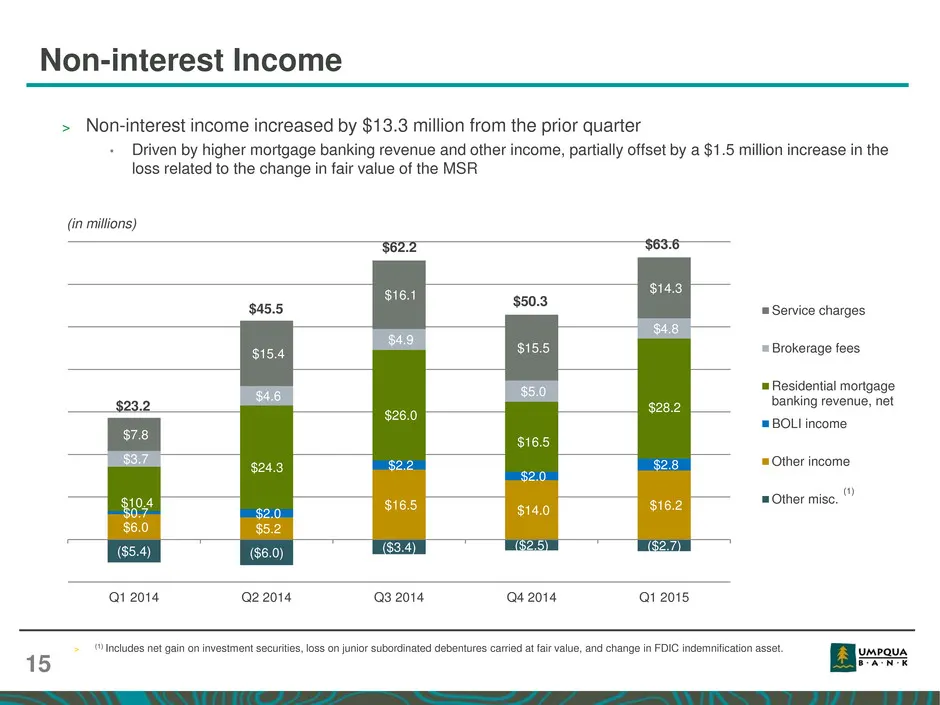
Non-interest Income 15 > Non-interest income increased by $13.3 million from the prior quarter • Driven by higher mortgage banking revenue and other income, partially offset by a $1.5 million increase in the loss related to the change in fair value of the MSR (in millions) ($5.4) ($6.0) ($3.4) ($2.5
Slide 16: Mortgage Banking Revenue
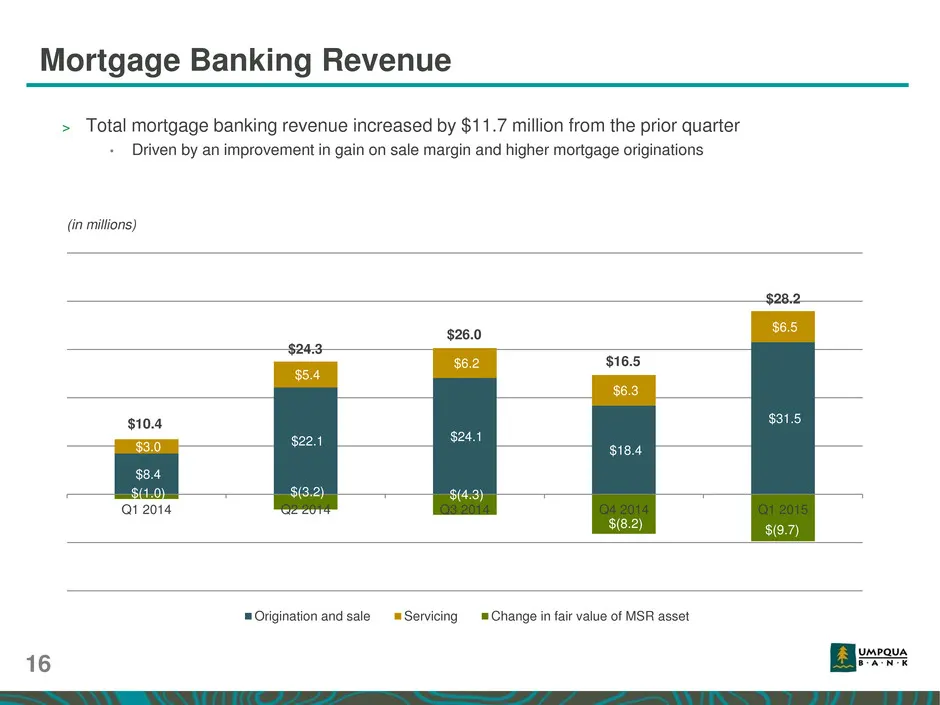
Mortgage Banking Revenue 16 $8.4 $22.1 $24.1 $18.4 $31.5 $3.0 $5.4 $6.2 $6.3 $6.5 $(1.0) $(3.2) $(4.3) $(8.2) $(9.7) Q1 2014 Q2 2014 Q3 2014 Q4 2014 Q1 2015 Origination and sale Servicing Change in fair value of MSR asset > Total mortgage banking revenue increased by $11.7 million from the prior qua
Slide 17: Mortgage Originations and Gain on Sale Margin
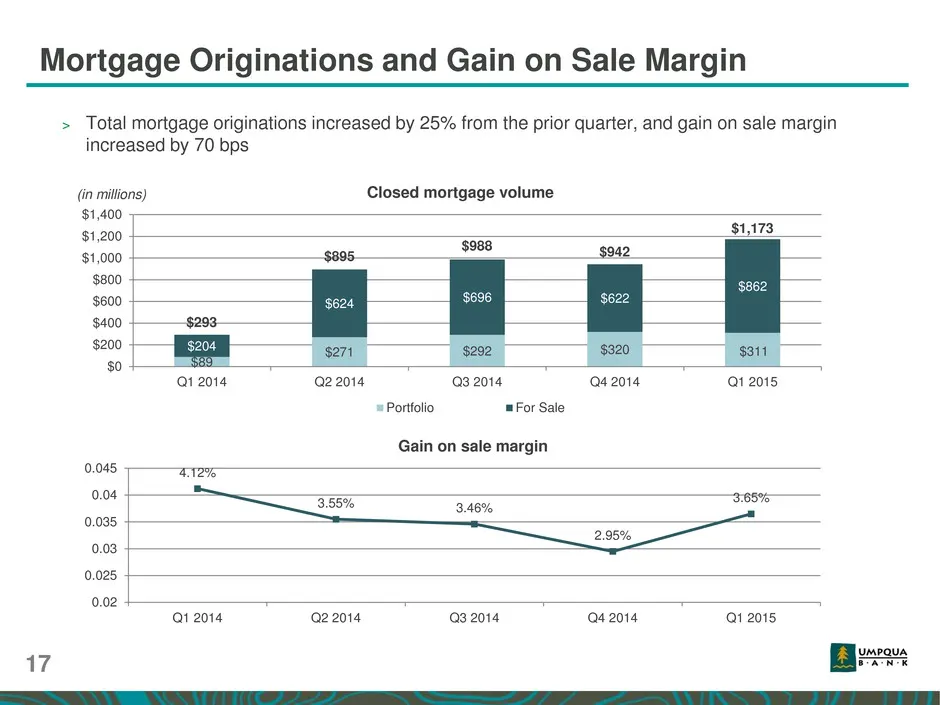
> Total mortgage originations increased by 25% from the prior quarter, and gain on sale margin increased by 70 bps 17 $89 $271 $292 $320 $311 $204 $624 $696 $622 $862 $0 $200 $400 $600 $800 $1,000 $1,200 $1,400 Q1 2014 Q2 2014 Q3 2014 Q4 2014 Q1 2015 Closed mortgage volume Portfolio For Sale (in mil
Slide 18: Non-interest Expense
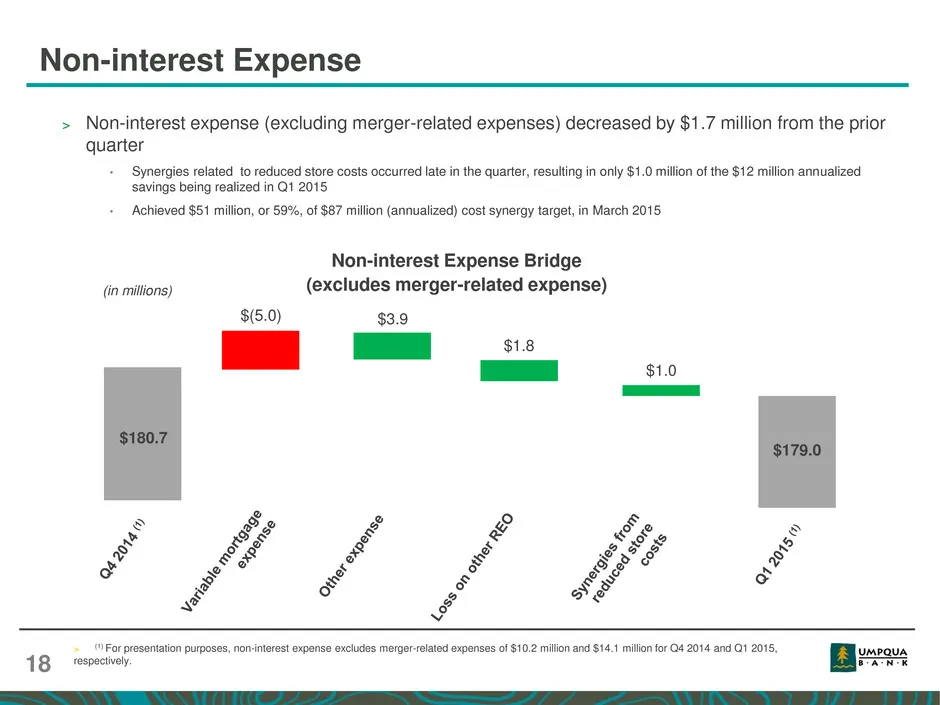
Non-interest Expense 18 Non-interest Expense Bridge (excludes merger-related expense) > Non-interest expense (excluding merger-related expenses) decreased by $1.7 million from the prior quarter • Synergies related to reduced store costs occurred late in the quarter, resulting in only $1.0 million of
Slide 19: Credit Quality
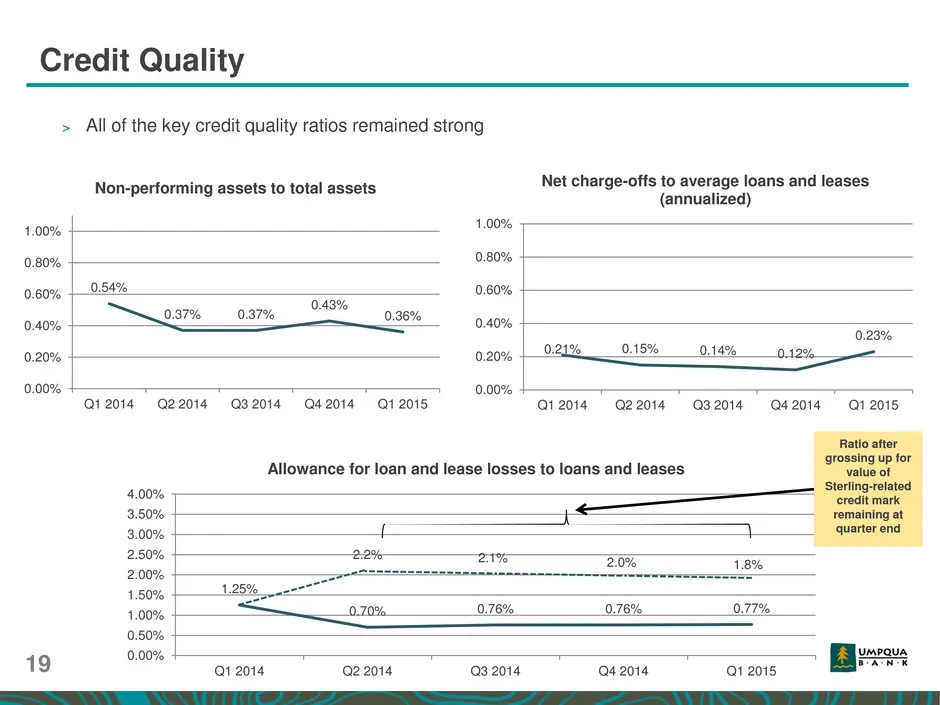
Credit Quality 19 > All of the key credit quality ratios remained strong 1.25% 0.70% 0.76% 0.76% 0.77% 0.00% 0.50% 1.00% 1.50% 2.00% 2.50% 3.00% 3.50% 4.00% Q1 2014 Q2 2014 Q3 2014 Q4 2014 Q1 2015 Allowance for loan and lease losses to loans and leases 0.54% 0.37% 0.37% 0.43% 0.36% 0.00% 0.20% 0.40%
Slide 20: Capital Ratios
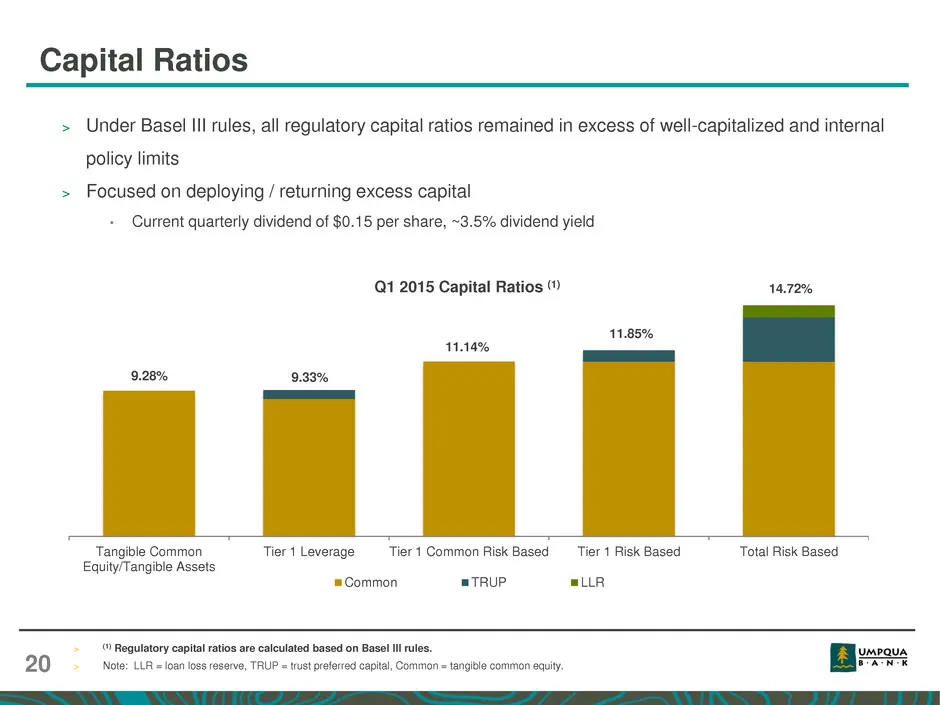
Capital Ratios 20 > Under Basel III rules, all regulatory capital ratios remained in excess of well-capitalized and internal policy limits > Focused on deploying / returning excess capital • Current quarterly dividend of $0.15 per share, ~3.5% dividend yield Tangible Common Equity/Tangible Assets Ti
Slide 21: Why Invest in Umpqua?
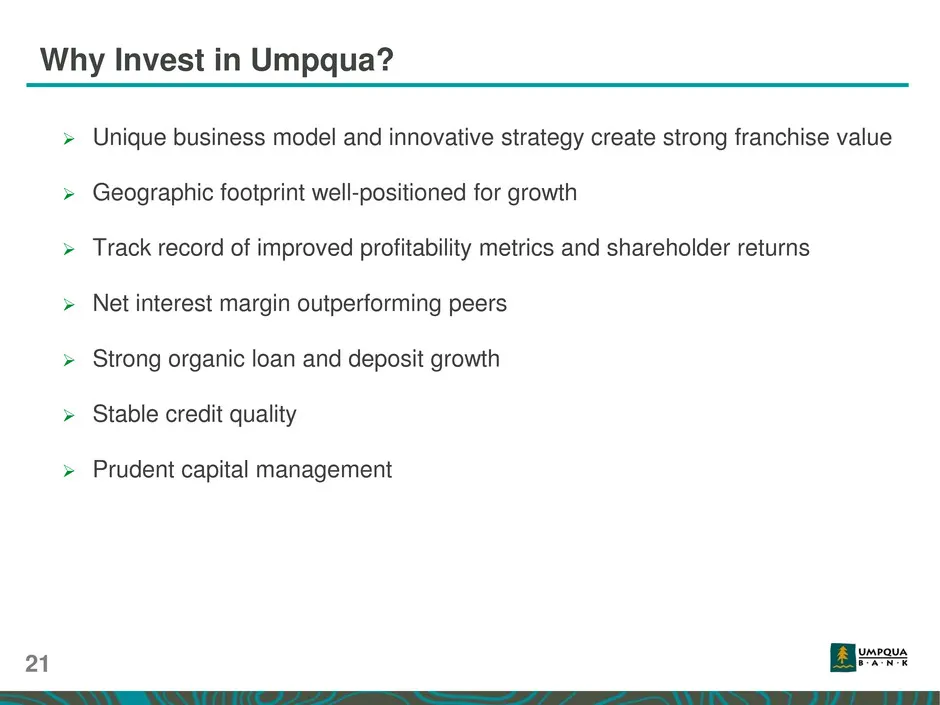
Unique business model and innovative strategy create strong franchise value Geographic footprint well-positioned for growth Track record of improved profitability metrics and shareholder returns Net interest margin outperforming peers Strong organic loan and deposit growth Stable credit
Slide 22: Questions?
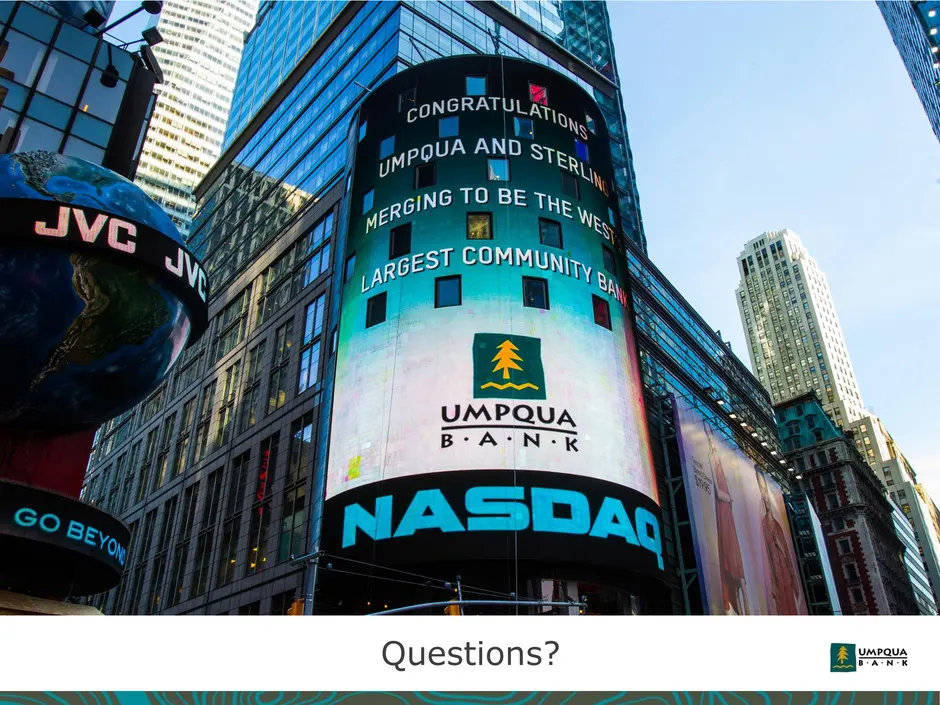
Nn S : ta cONGRATUL Ay, Oye \ surouA y STE , j_gsino 10 BE THE Wg pasest COMMUN, %, ‘ \\ umpaua Questions?
Slide 23: Appendix
Appendix
Slide 24: Non-GAAP Reconciliation – Operating Earnings
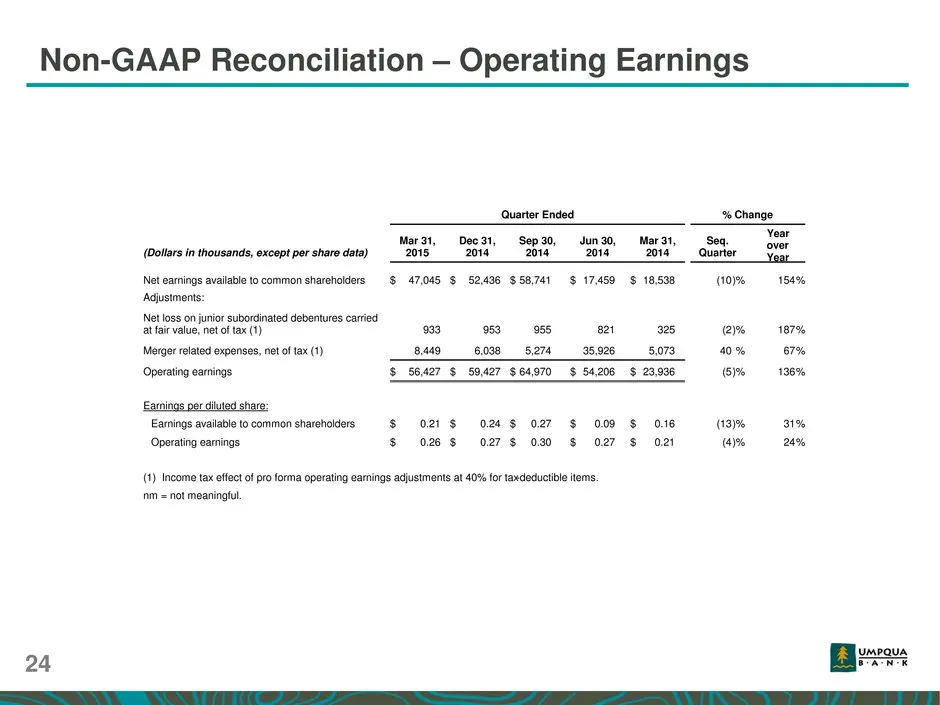
Non-GAAP Reconciliation – Operating Earnings 24 Quarter Ended % Change (Dollars in thousands, except per share data) Mar 31, 2015 Dec 31, 2014 Sep 30, 2014 Jun 30, 2014 Mar 31, 2014 Seq. Quarter Year over Year Net earnings available to common shareholders $ 47,045 $ 52,436 $ 58,741 $ 17,459 $ 18,538
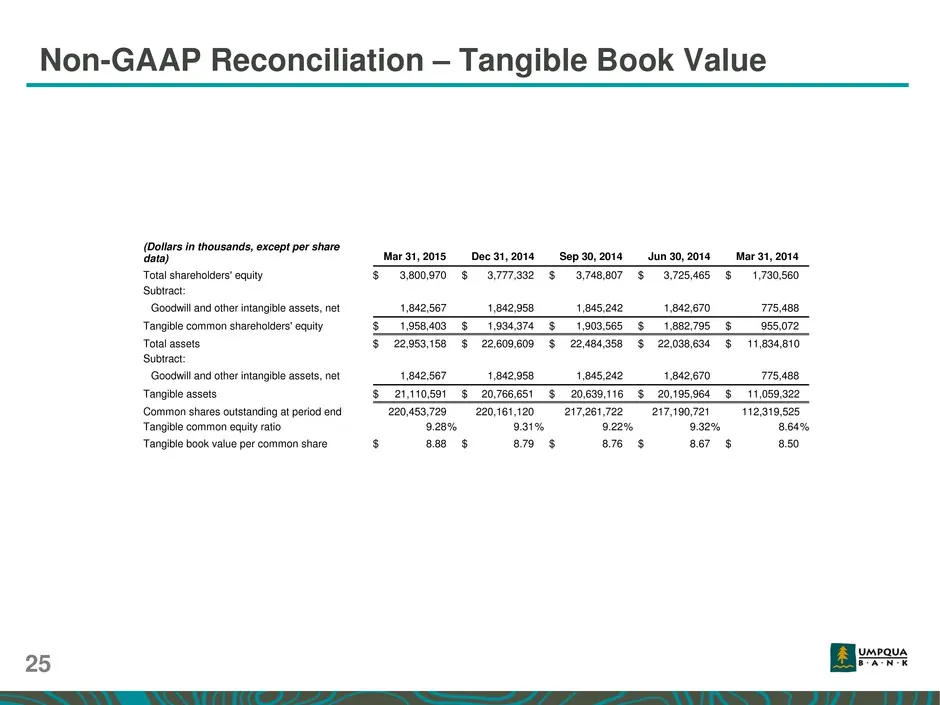
Slide 25: Non-GAAP Reconciliation – Tangible Book Value
Non-GAAP Reconciliation – Tangible Book Value 25 (Dollars in thousands, except per share data) Mar 31, 2015 Dec 31, 2014 Sep 30, 2014 Jun 30, 2014 Mar 31, 2014 Total shareholders' equity $ 3,800,970 $ 3,777,332 $ 3,748,807 $ 3,725,465 $ 1,730,560 Subtract: Goodwill and other intangible assets, net 1
Source: SEC EDGAR · 8-K filed May 11, 2015
More decks from Umpqua Holdings Corporation
 Q4 2022 Earnings Presentation33 slides · Jan 24, 2023
 Q3 2022 Earnings Presentation35 slides · Oct 19, 2022
 Q2 2022 Earnings Presentation37 slides · Sep 2, 2022
 Q2 2022 Earnings Presentation37 slides · Jul 20, 2022
 Q1 2022 Earnings Presentation37 slides · May 26, 2022
 Q1 2022 Earnings Presentation36 slides · Apr 20, 2022