PT Bank Negara Indonesia (Persero) Tbk Class B · IDX:BBNI
PT Bank Negara Indonesia (Persero) Tbk Class B — Q3 2016 Earnings Presentation
37 slides from PT Bank Negara Indonesia (Persero) Tbk Class B's earnings presentation, 2016
Slide 1: Corporate Presentation 3Q-2016
PT. BANK NEGARA INDONESIA (PERSERO) TBK CORPORATE PRESENTATION 3Q-2016 PT Bank Negara Indonesia (Persero) Tbk < BBNI.IJ >
Slide 2: Agenda
Agenda Page 2 Highlighted Results 3Q2016 BNI Updates Financial Performance 3Q2016 Business & Consumer Banking Appendices About BNI Macro Economy 5 years Financial Data
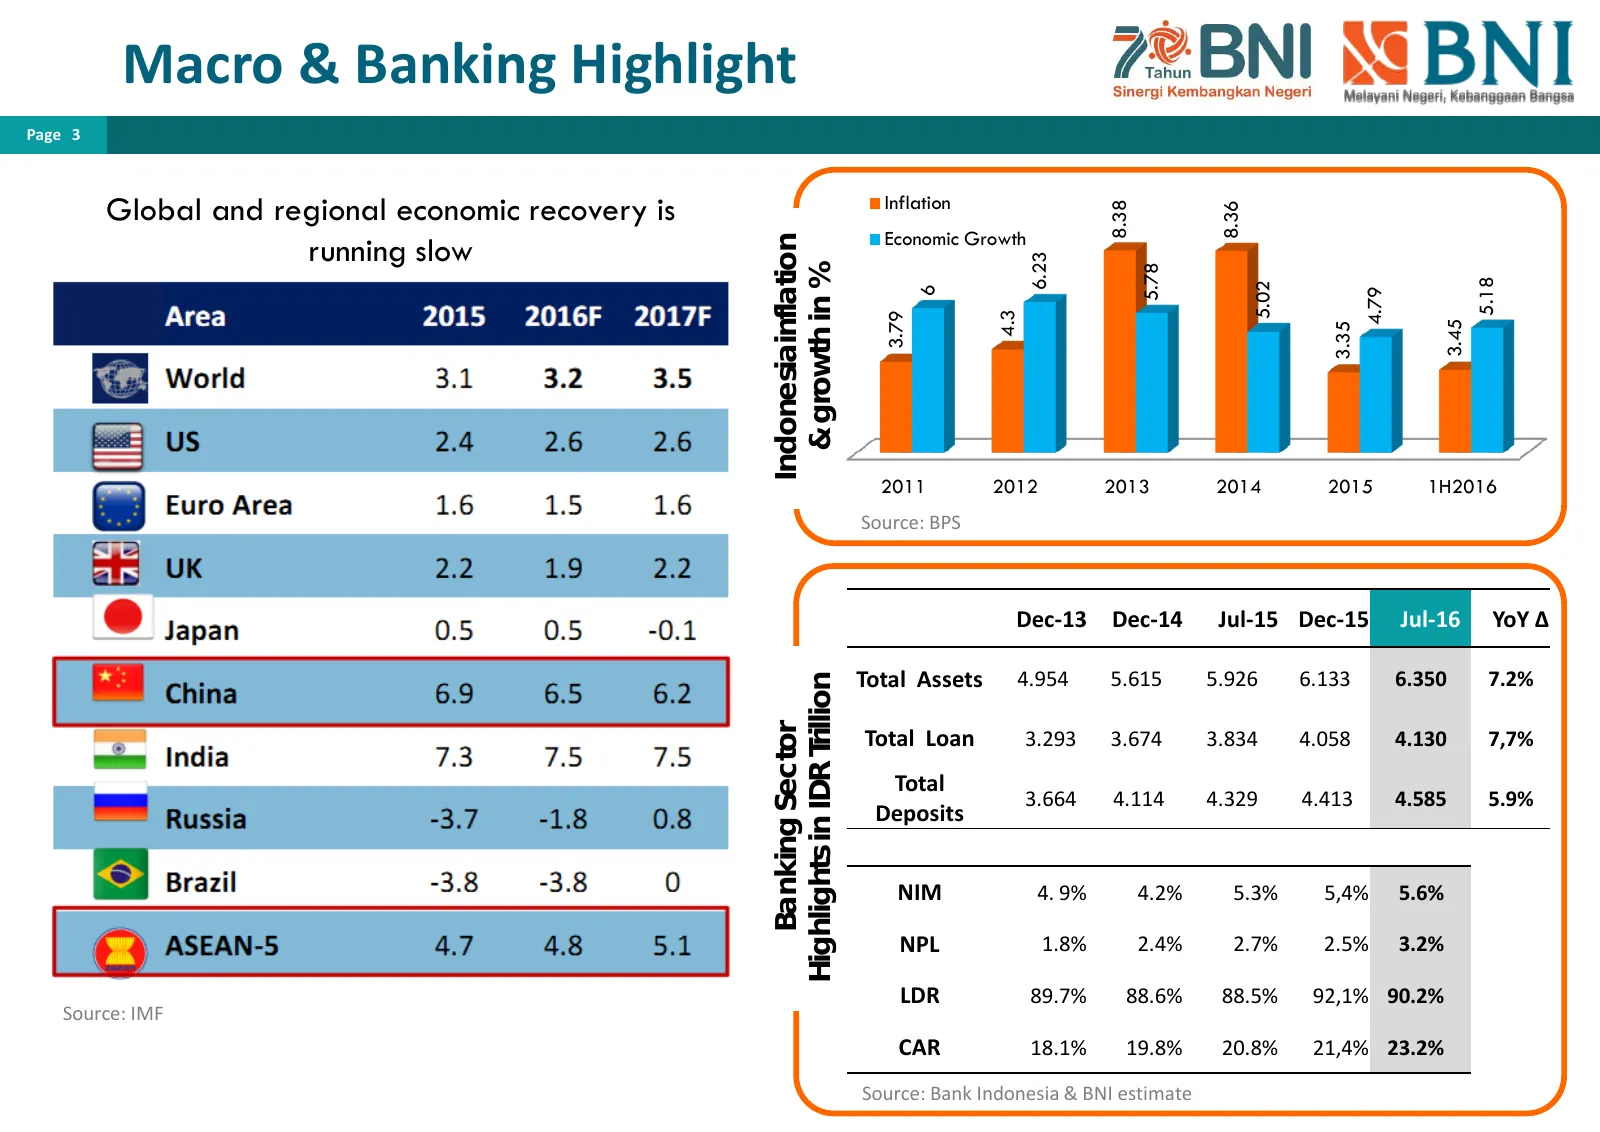
Slide 3: Macro & Banking Highlight
Macro & Banking Highlight Page 3 Global and regional economic recovery is Inflation 8.38 8.36 Economic Growth running slow Indonesiainflation 6.23 5.78 & growth in % 5.18 5.02 6 4.79 4.3 3.79 3.45 3.35 2011 2012 2013 2014 2015 1H2016 Source: BPS Dec-13 Dec-14 Jul-15 Dec-15 Jul-16 YoY ∆ Total Assets
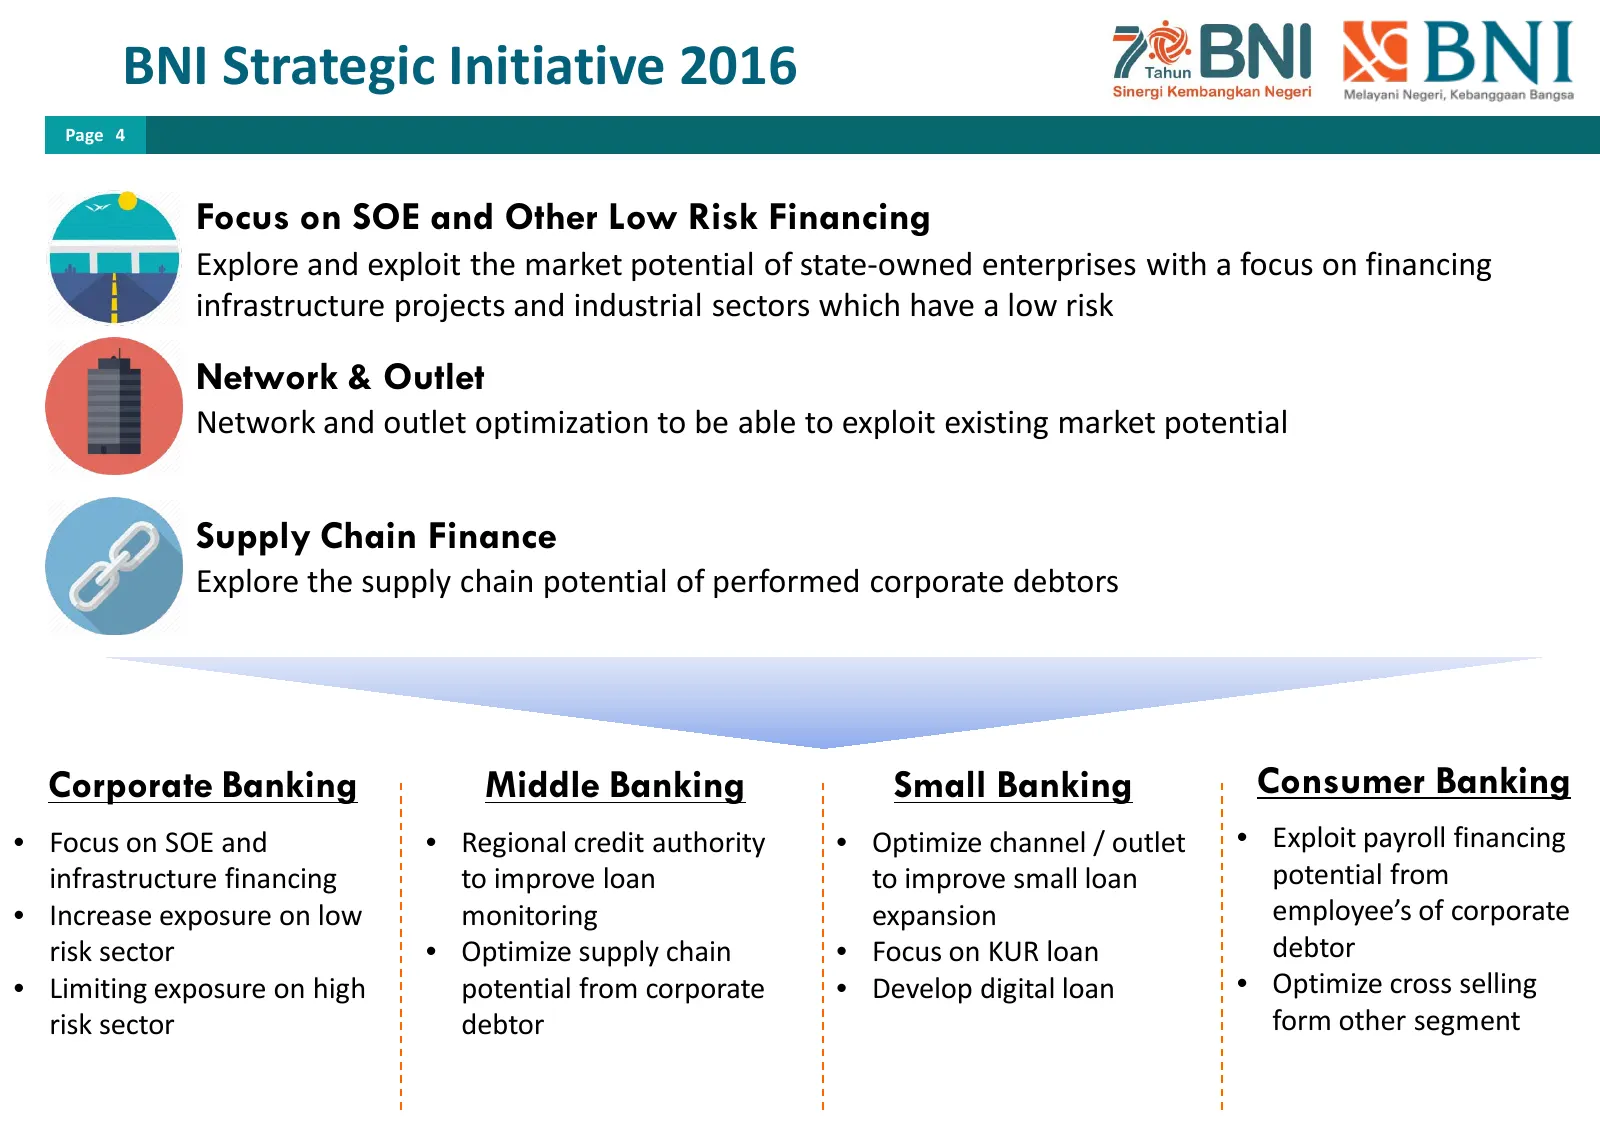
Slide 4: BNI Strategic Initiative 2016
BNI Strategic Initiative 2016 Page 4 Focus on SOE and Other Low Risk Financing Explore and exploit the market potential of state-owned enterprises with a focus on financing infrastructure projects and industrial sectors which have a low risk Network & Outlet Network and outlet optimization to be abl
Slide 5: Highlighted Results
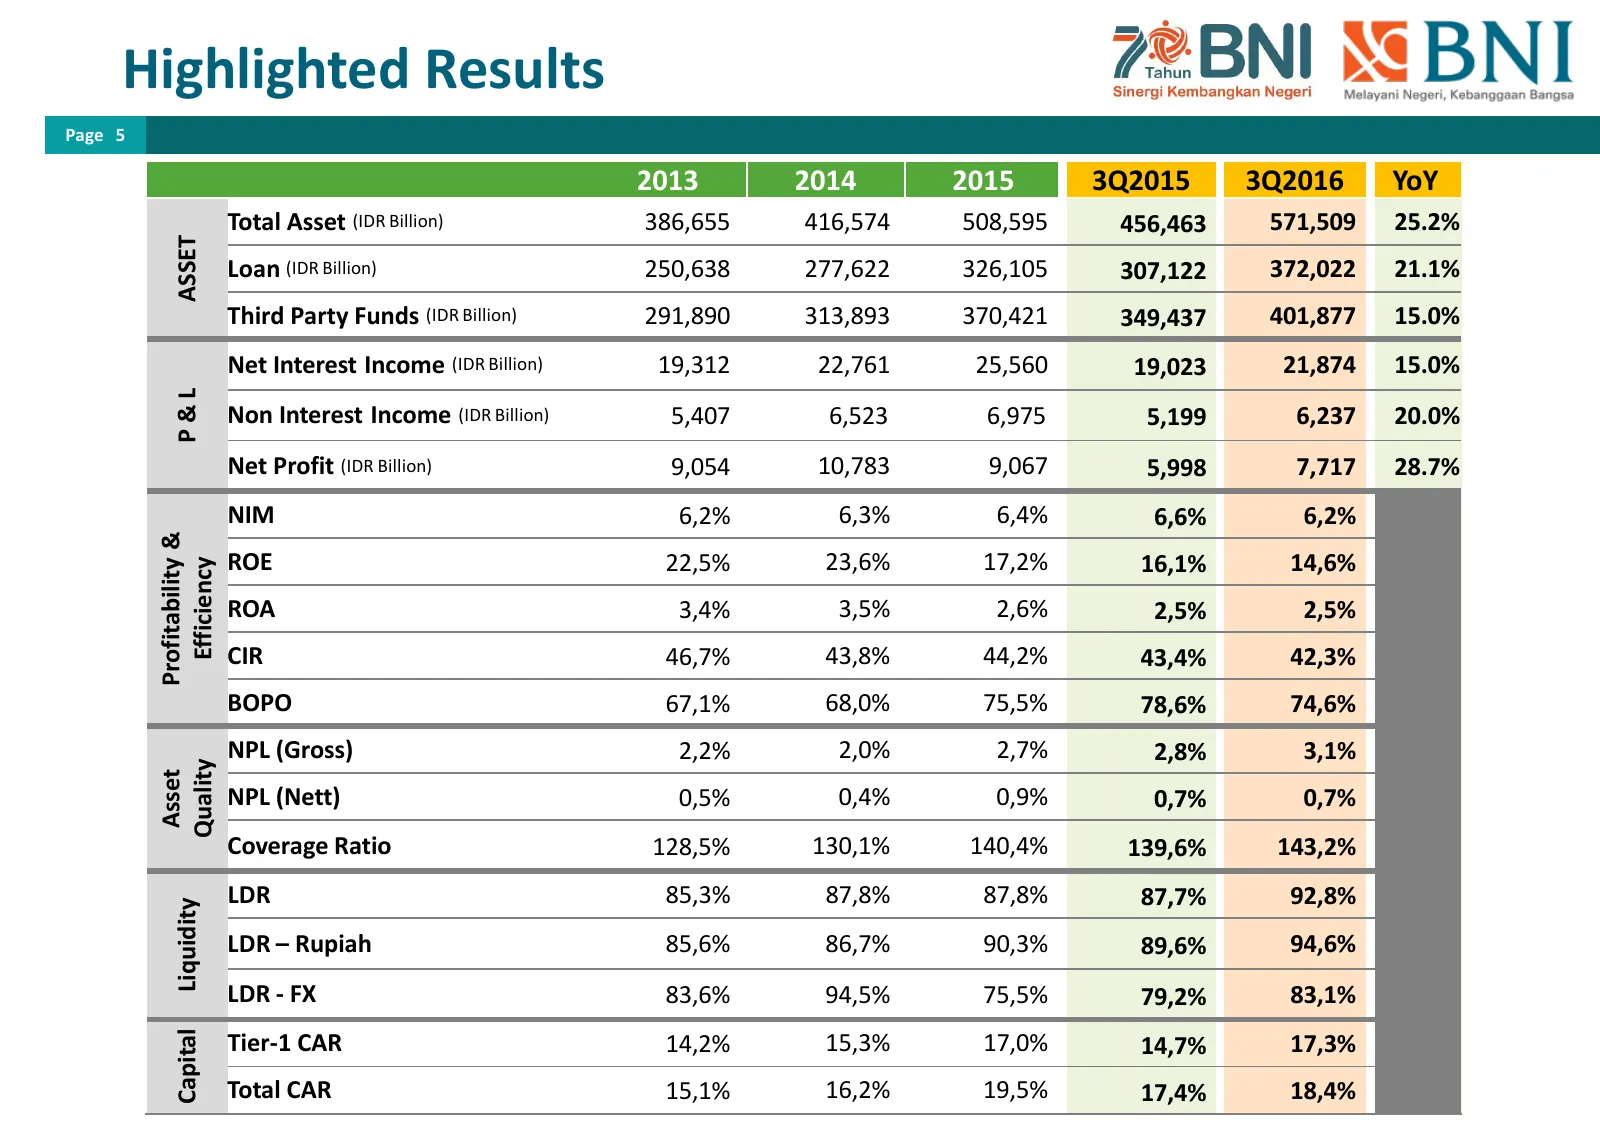
Highlighted Results Page 5 2013 2014 2015 3Q2015 3Q2016 YoY Total Asset (IDR Billion) 386,655 416,574 508,595 456,463 571,509 25.2% ASSET Loan (IDR Billion) 250,638 277,622 326,105 307,122 372,022 21.1% Third Party Funds (IDR Billion) 291,890 313,893 370,421 349,437 401,877 15.0% Net Interest Income
Slide 6: BNI Updates
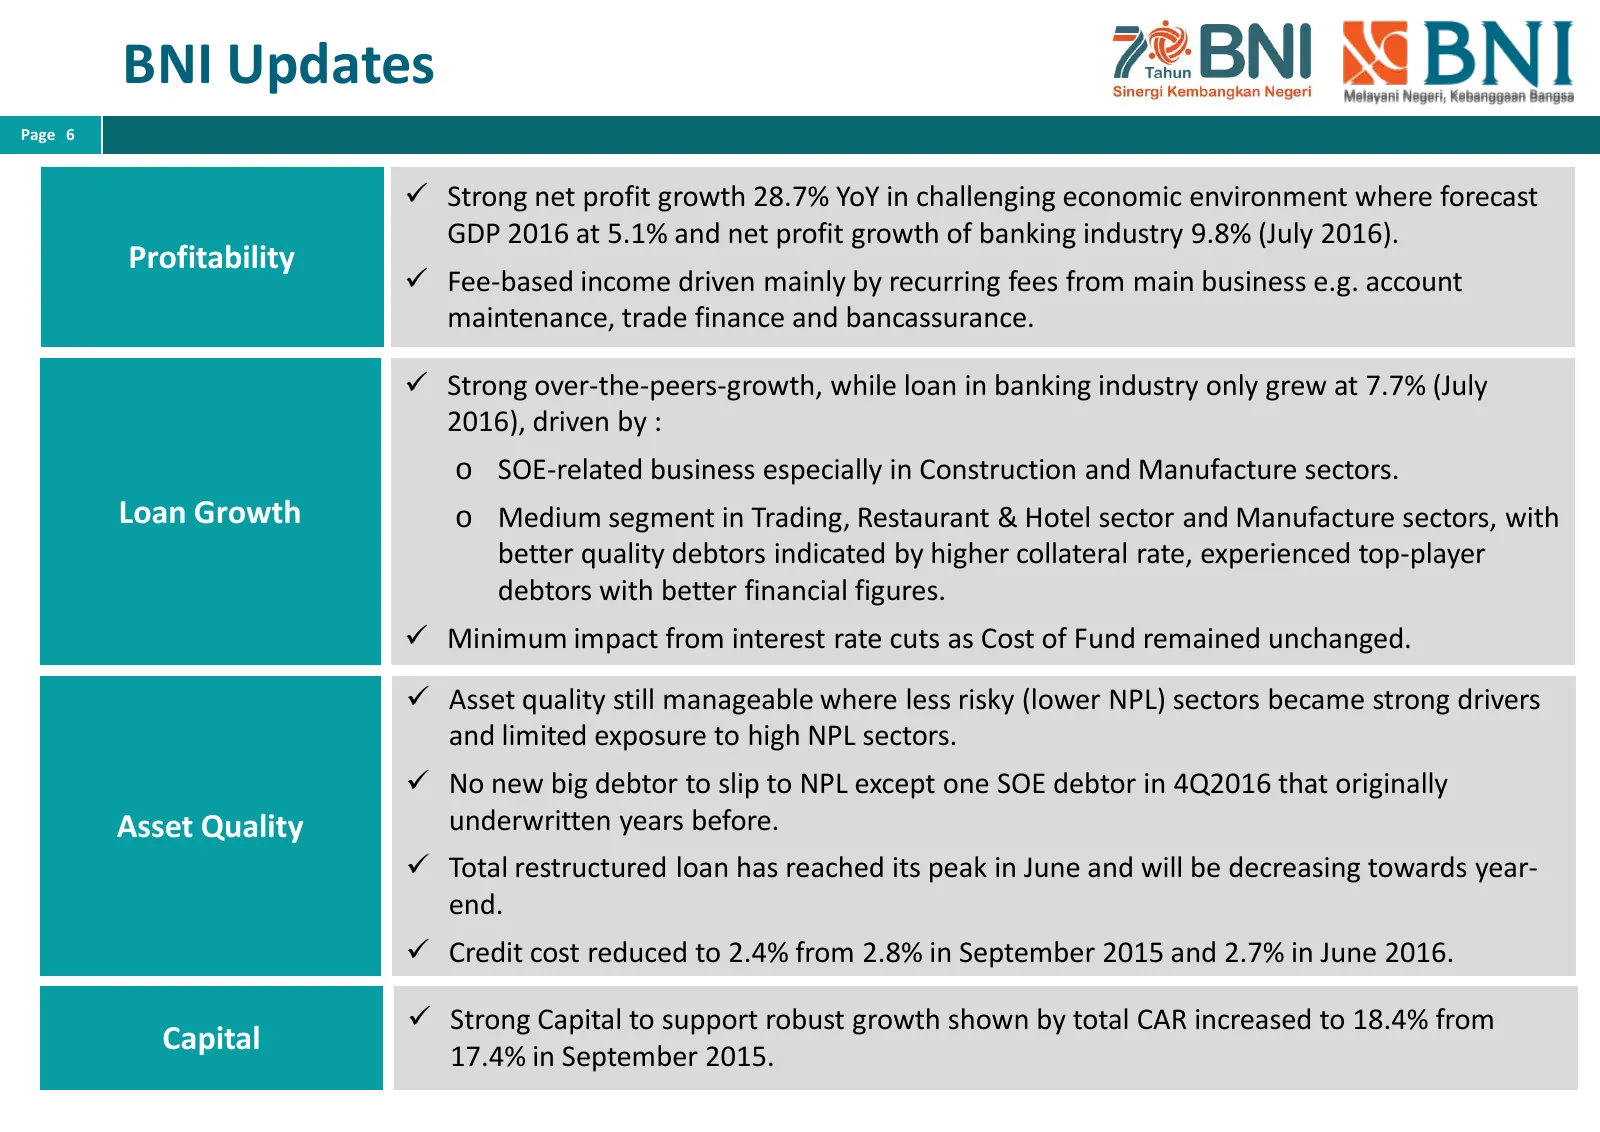
BNI Updates Page 6 Strong net profit growth 28.7% YoY in challenging economic environment where forecast GDP 2016 at 5.1% and net profit growth of banking industry 9.8% (July 2016). Profitability Fee-based income driven mainly by recurring fees from main business e.g. account maintenance, trade
Slide 7: Financial Performance 3Q-2016
PT. BANK NEGARA INDONESIA (PERSERO) TBK FINANCIAL PERFORMANCE 3Q-2016
Slide 8: Balance Sheet Highlight
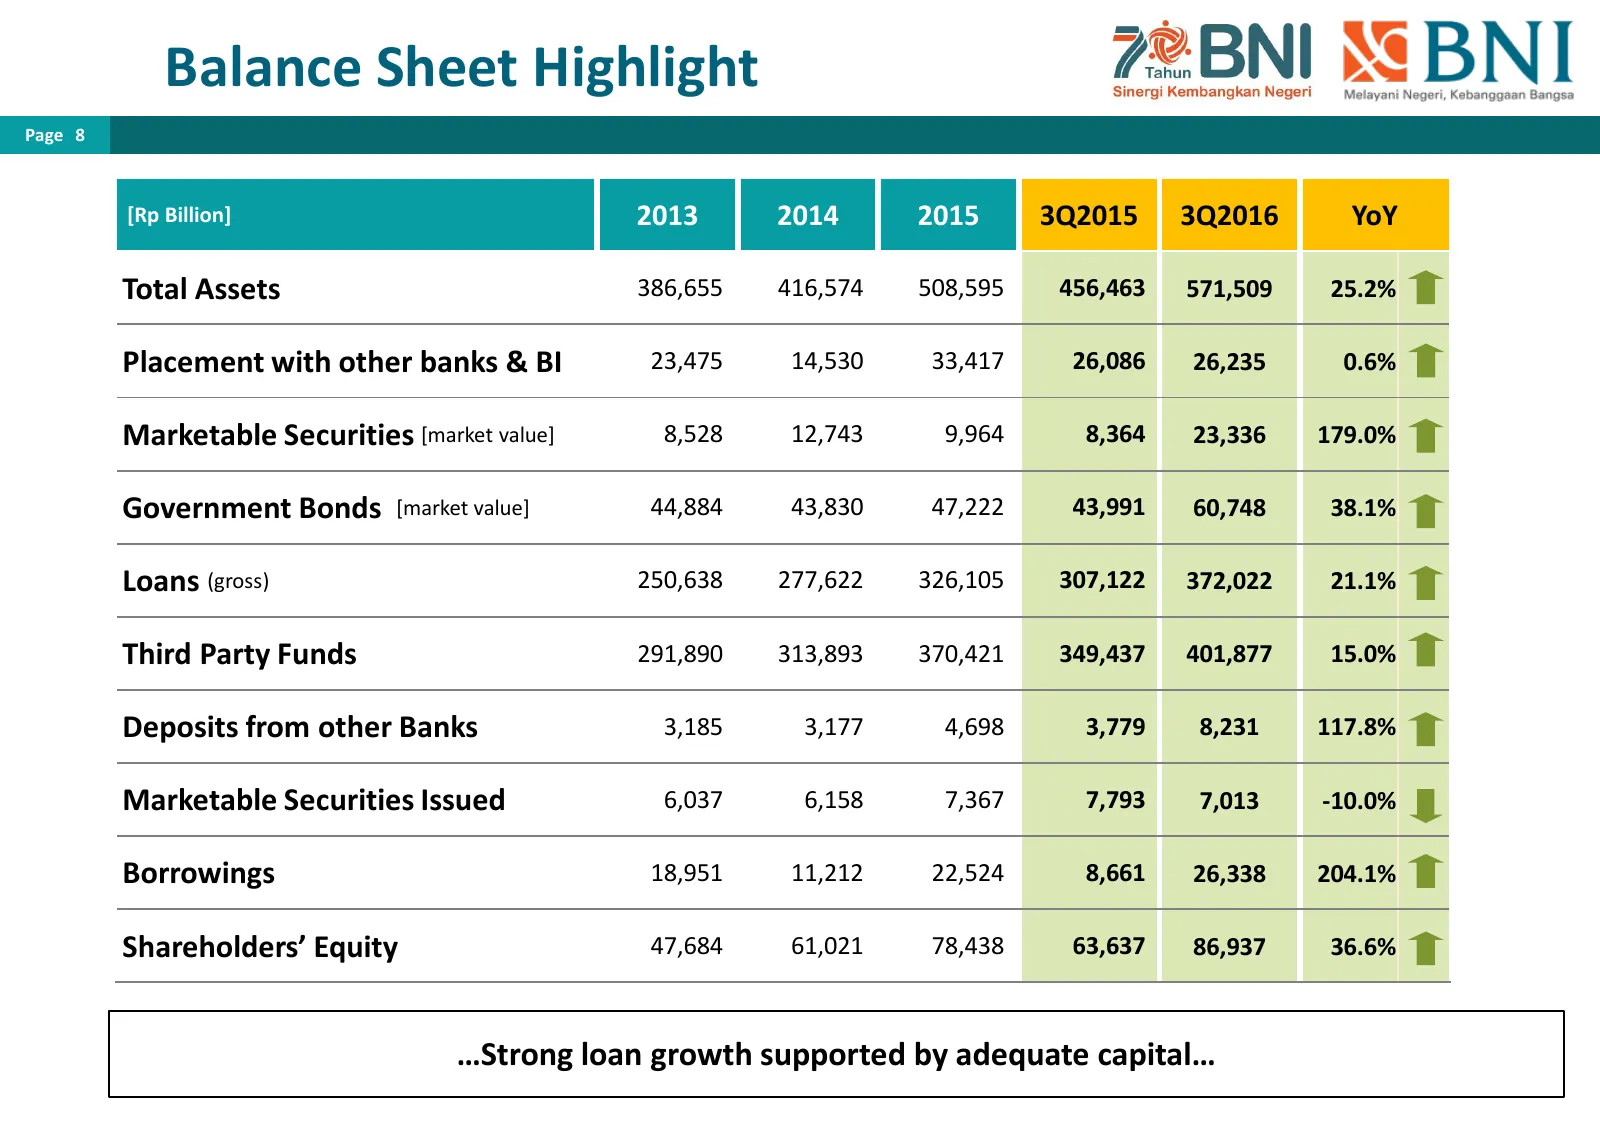
Balance Sheet Highlight Page 8 [Rp Billion] 2013 2014 2015 3Q2015 3Q2016 YoY Total Assets 386,655 416,574 508,595 456,463 571,509 25.2% Placement with other banks & BI 23,475 14,530 33,417 26,086 26,235 0.6% Marketable Securities [market value] 8,528 12,743 9,964 8,364 23,336 179.0% Government Bonds
Slide 9: Loan Composition
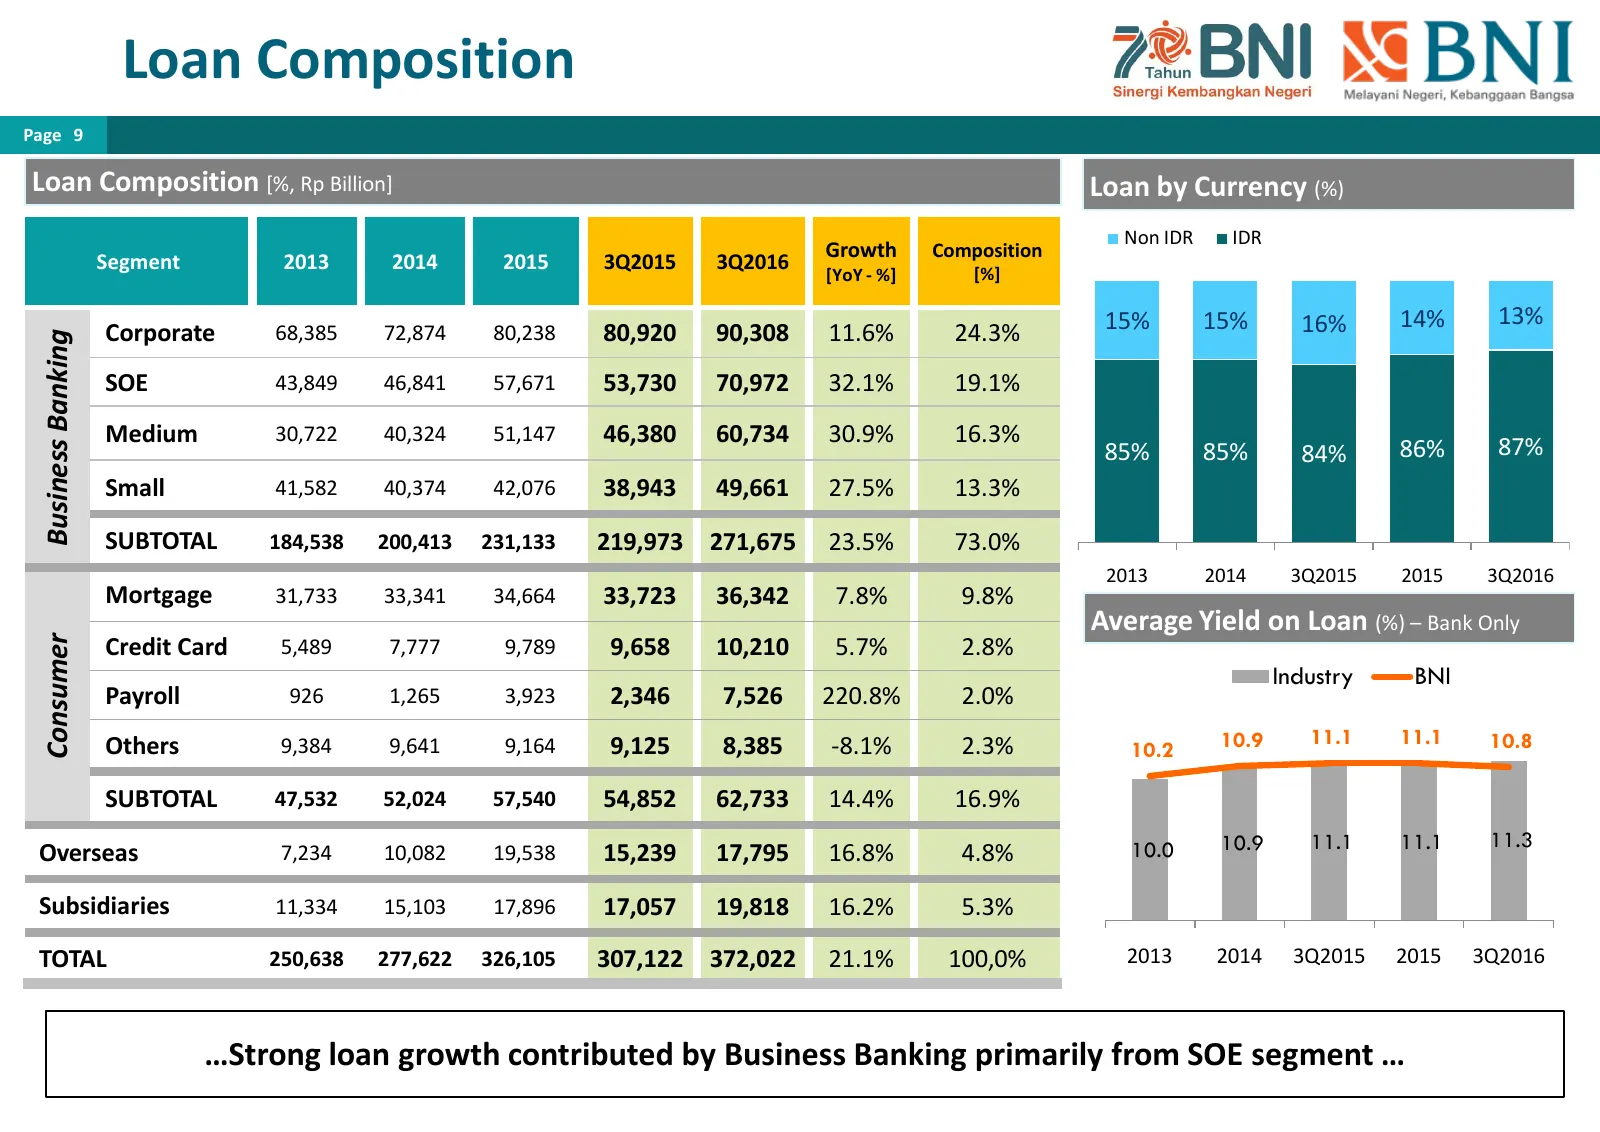
Loan Composition Page 9 Loan Composition [%, Rp Billion] Loan by Currency (%) Non IDR IDR Growth Composition Segment 2013 2014 2015 3Q2015 3Q2016 [%] [YoY - %] 15% 15% 16% 14% 13% Corporate 68,385 72,874 80,238 80,920 90,308 11.6% 24.3% Business Banking SOE 43,849 46,841 57,671 53,730 70,972 32.1% 1
Slide 10: Loan Quality – Bank Only
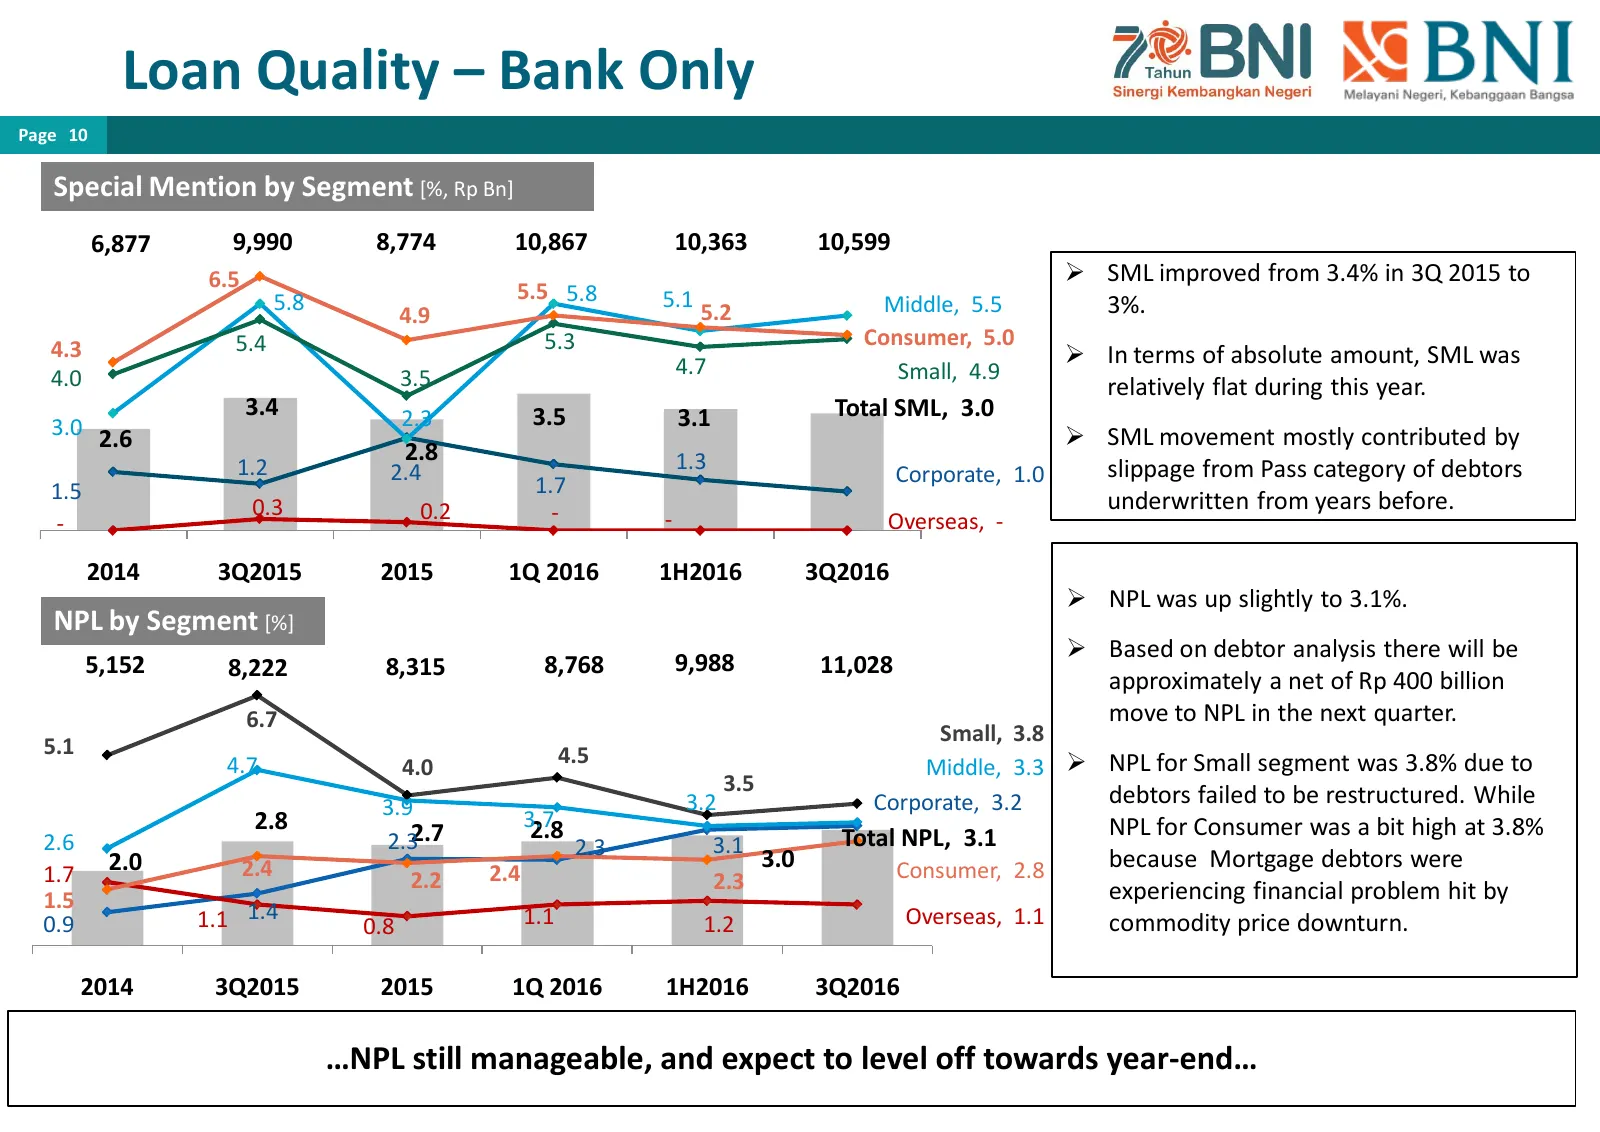
Loan Quality – Bank Only Page 10 Special Mention by Segment [%, Rp Bn] 6,877 9,990 8,774 10,867 10,363 10,599 6.5 SML improved from 3.4% in 3Q 2015 to 5.8 5.5 5.8 5.1 4.9 5.2 Middle, 5.5 3%. 4.3 5.4 5.3 Consumer, 5.0 4.7 In terms of absolute amount, SML was 4.0 3.5 Small, 4.9 relatively flat dur
Slide 11: Loan at Risk, Write Off, Recovery and Coverage
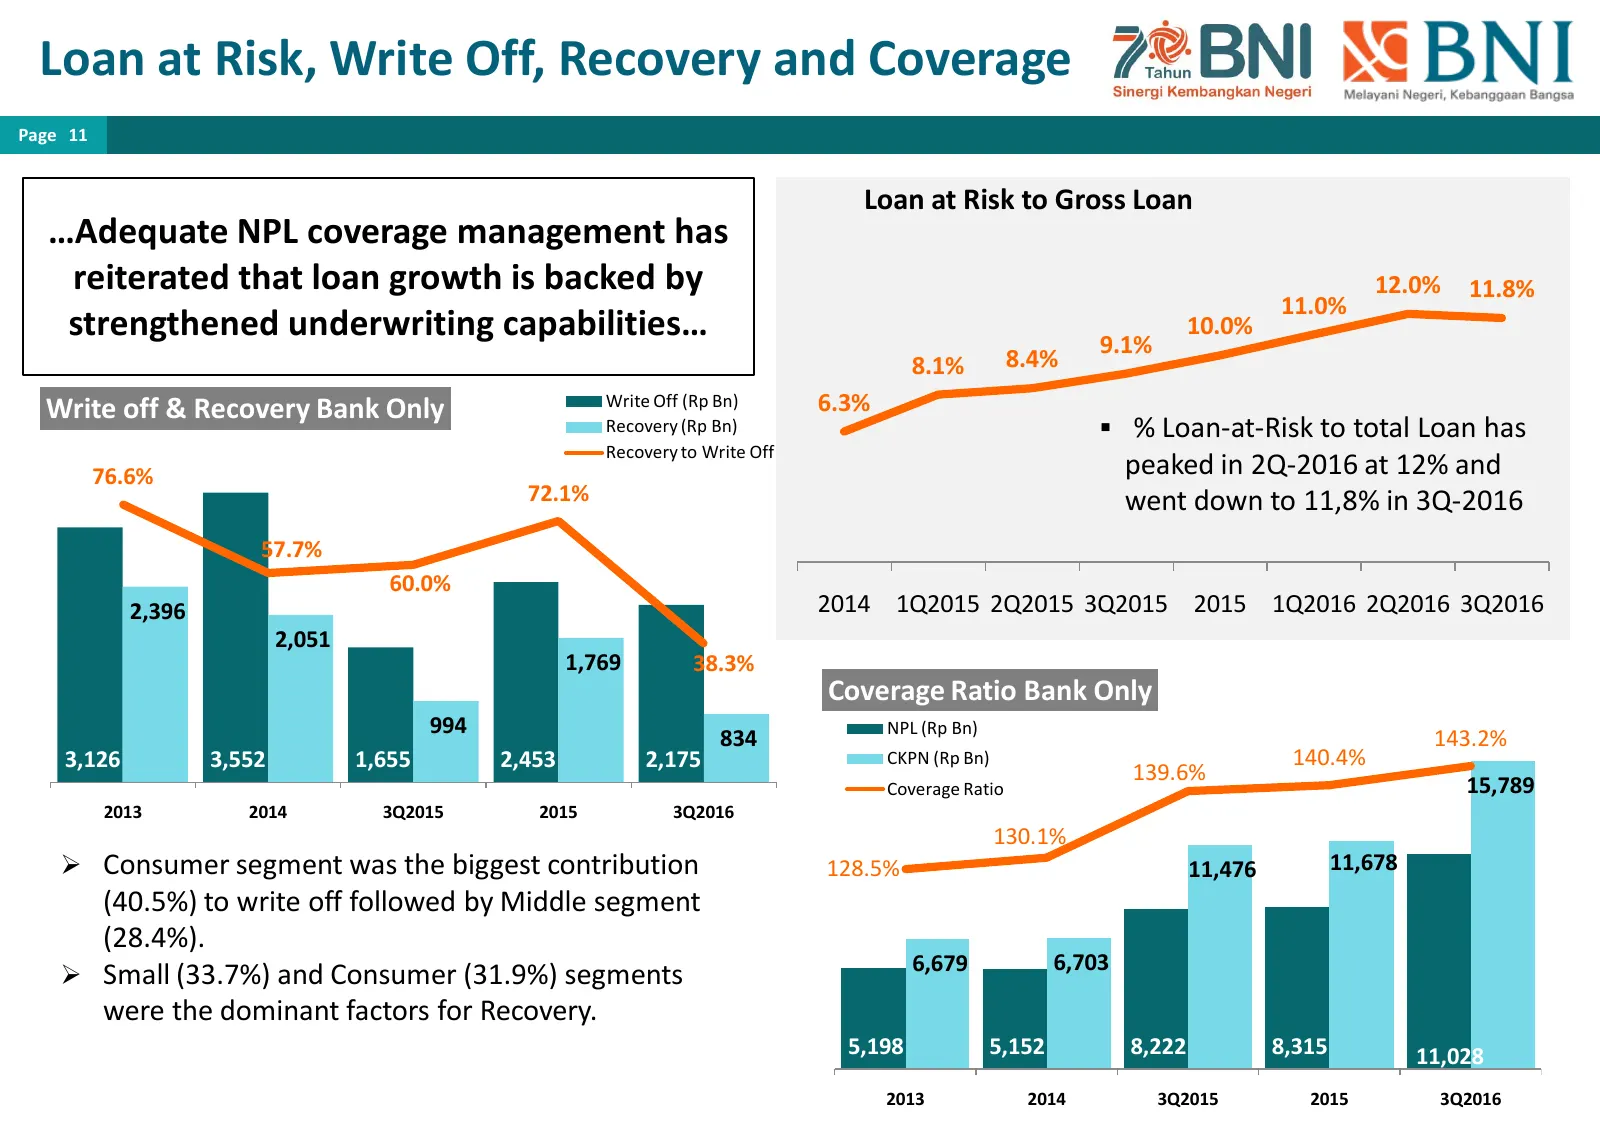
Loan at Risk, Write Off, Recovery and Coverage Page 11 Loan at Risk to Gross Loan …Adequate NPL coverage management has reiterated that loan growth is backed by 12.0% 11.8% 11.0% strengthened underwriting capabilities… 9.1% 10.0% 8.1% 8.4% Write off & Recovery Bank Only Write Off (Rp Bn) 6.3% Recove
Slide 12: Restructured Loan
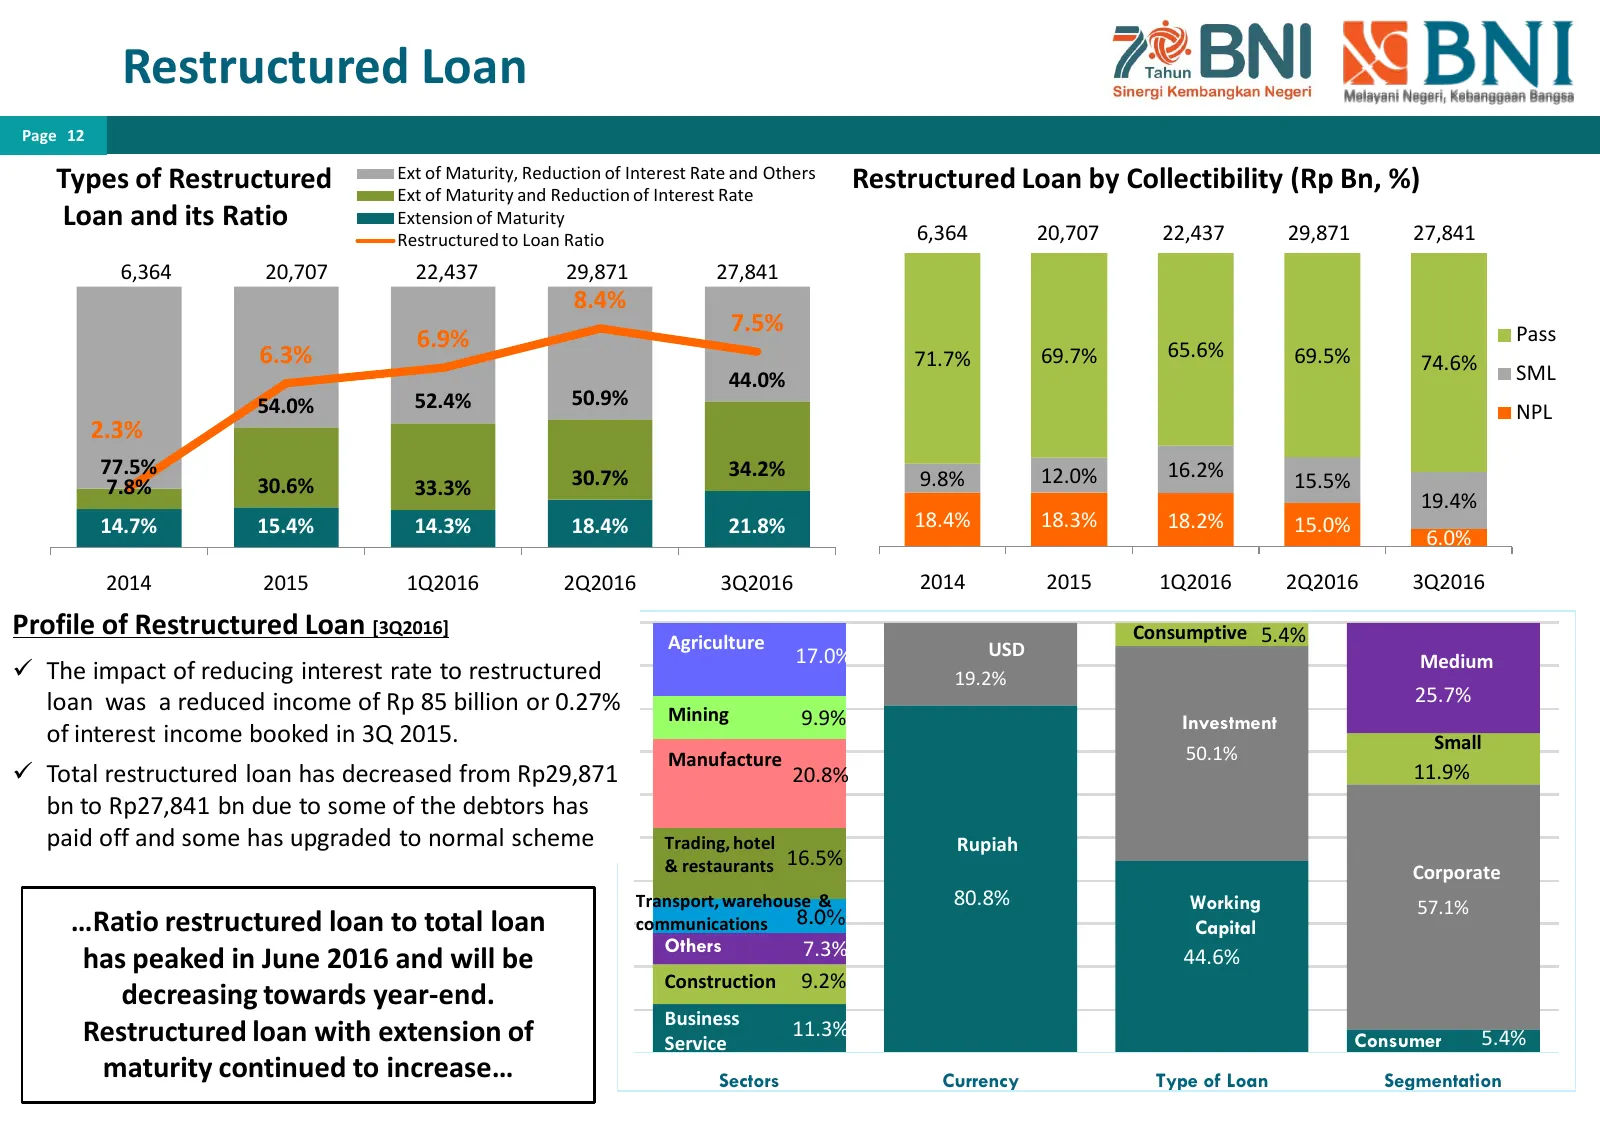
Restructured Loan Page 12 Types of Restructured Ext of Maturity, Reduction of Interest Rate and Others Ext of Maturity and Reduction of Interest Rate Restructured Loan by Collectibility (Rp Bn, %) Loan and its Ratio Extension of Maturity 6,364 20,707 22,437 29,871 27,841 Restructured to Loan Ratio 6
Slide 13: Third Party Funds
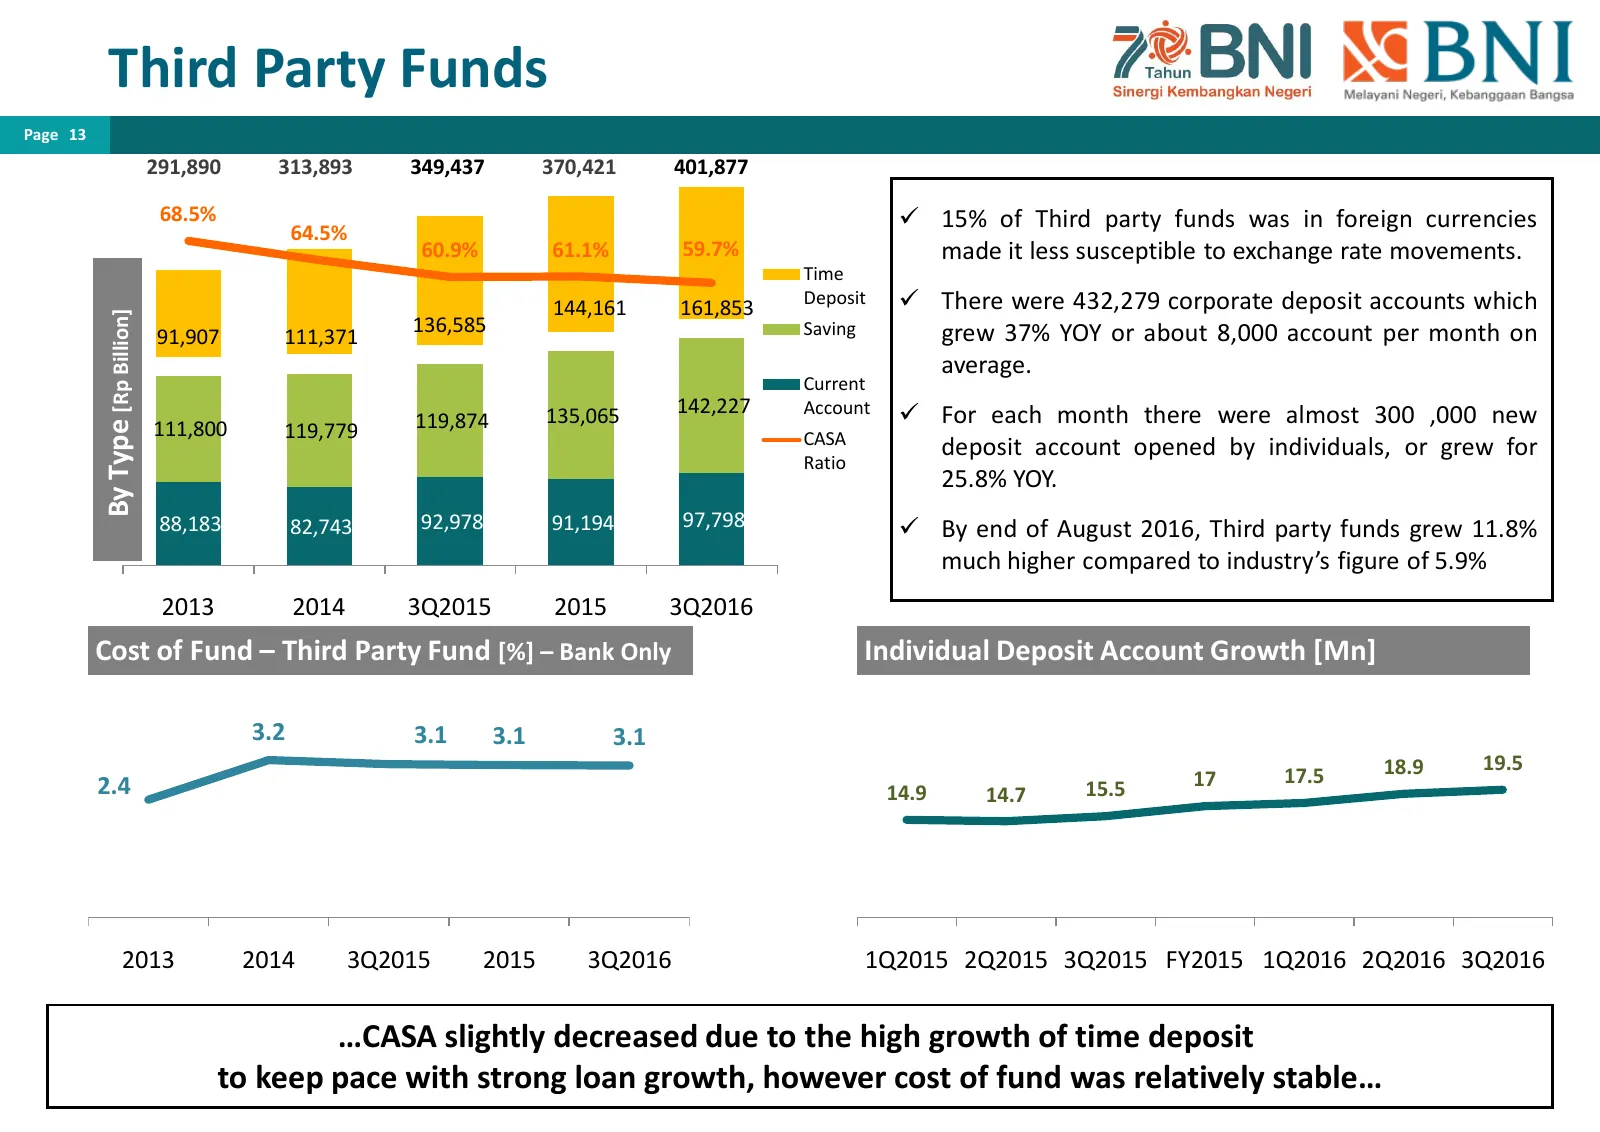
Third Party Funds Page 13 291,890 313,893 349,437 370,421 401,877 68.5% 15% of Third party funds was in foreign currencies 64.5% 60.9% 61.1% 59.7% made it less susceptible to exchange rate movements. Time 144,161 161,853 Deposit There were 432,279 corporate deposit accounts which By Type [Rp Bil
Slide 14: Profit & Loss Highlight
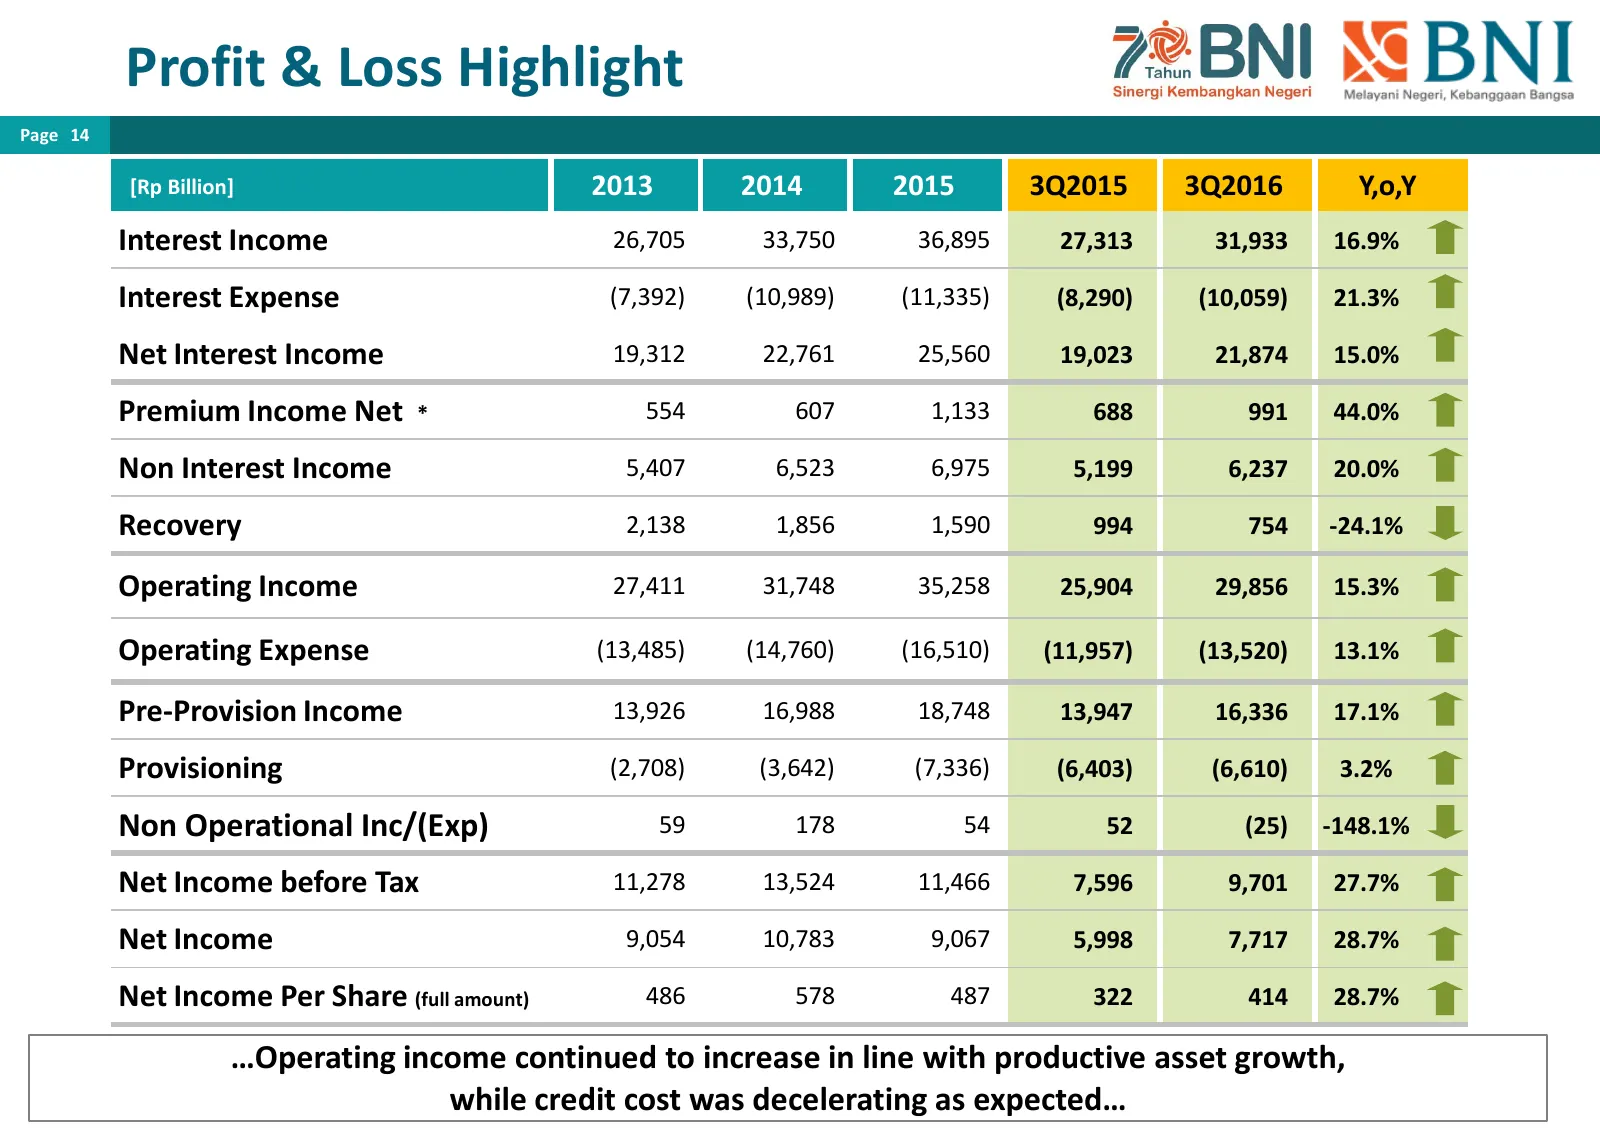
Profit & Loss Highlight Page 14 [Rp Billion] 2013 2014 2015 3Q2015 3Q2016 Y,o,Y Interest Income 26,705 33,750 36,895 27,313 31,933 16.9% Interest Expense (7,392) (10,989) (11,335) (8,290) (10,059) 21.3% Net Interest Income 19,312 22,761 25,560 19,023 21,874 15.0% Premium Income Net * 554 607 1,133 6
Slide 15: Non Interest Income
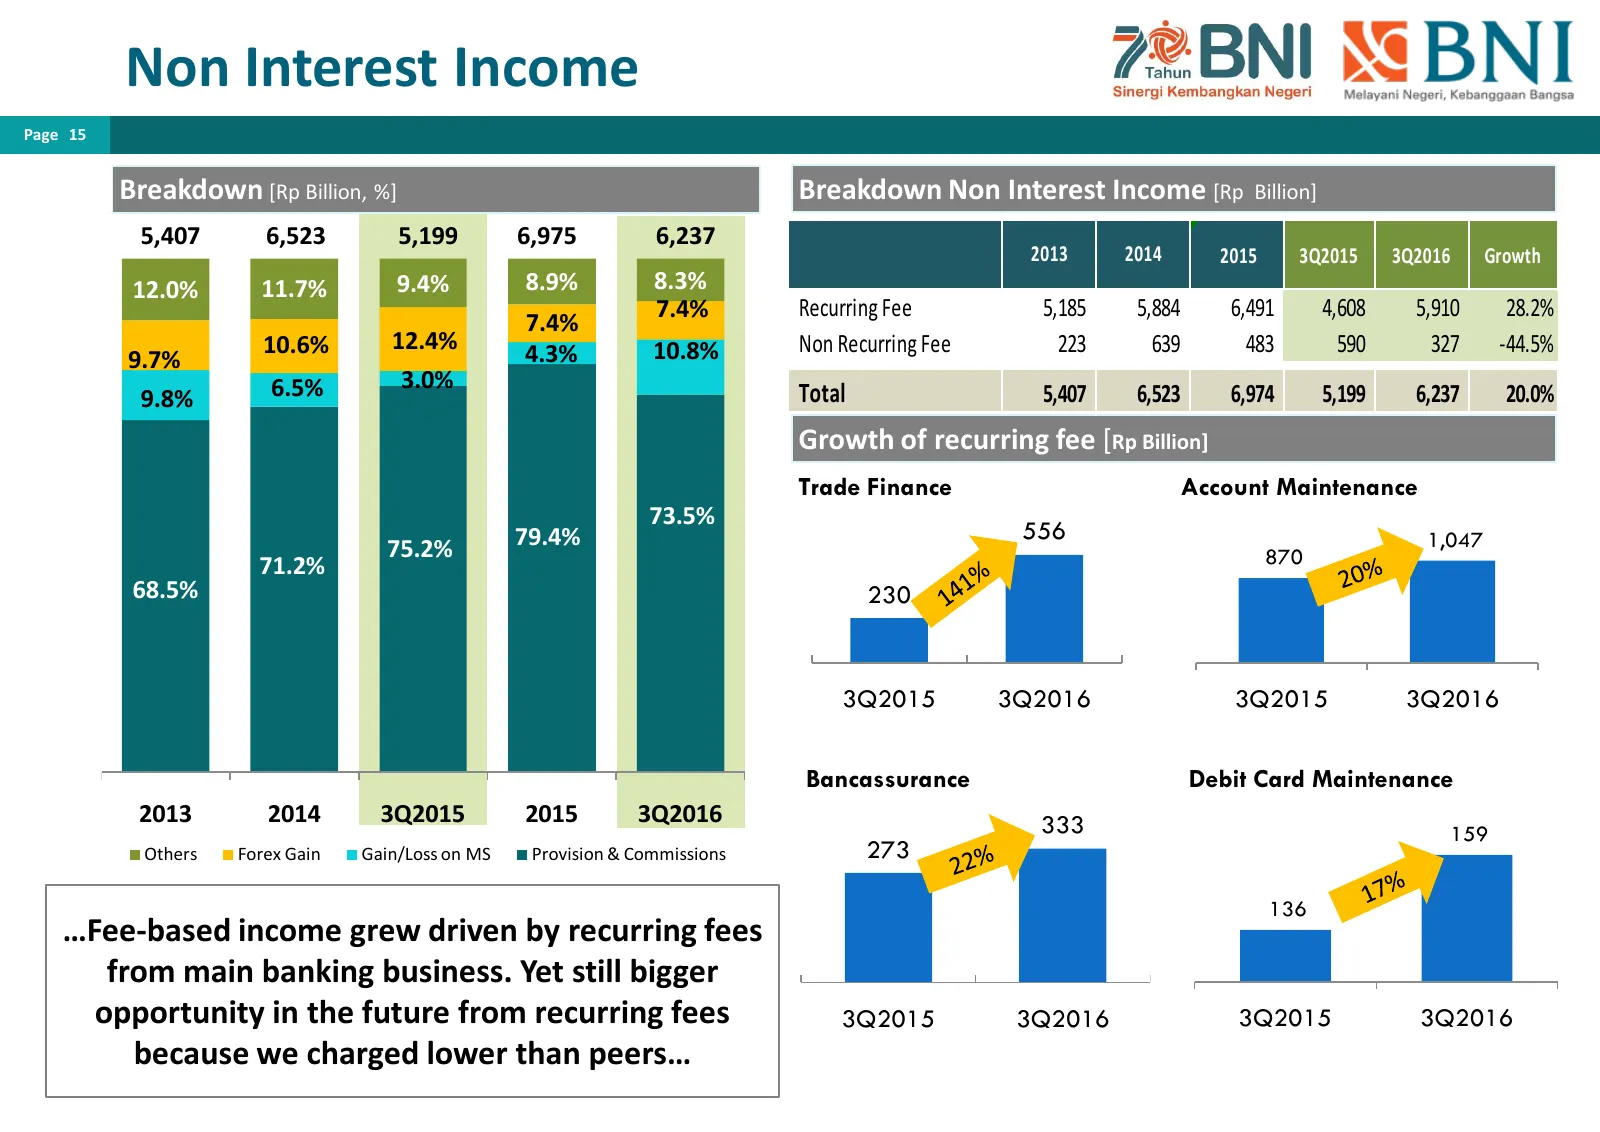
Non Interest Income Page 15 Breakdown [Rp Billion, %] Breakdown Non Interest Income [Rp Billion] 5,407 6,523 5,199 6,975 6,237 2013 2014 2015 3Q2015 3Q2016 Growth 12.0% 11.7% 9.4% 8.9% 8.3% 7.4% Recurring Fee 5,185 5,884 6,491 4,608 5,910 28.2% 7.4% 10.6% 12.4% 4.3% 10.8% Non Recurring Fee 223 639 4
Slide 16: Operating Expense
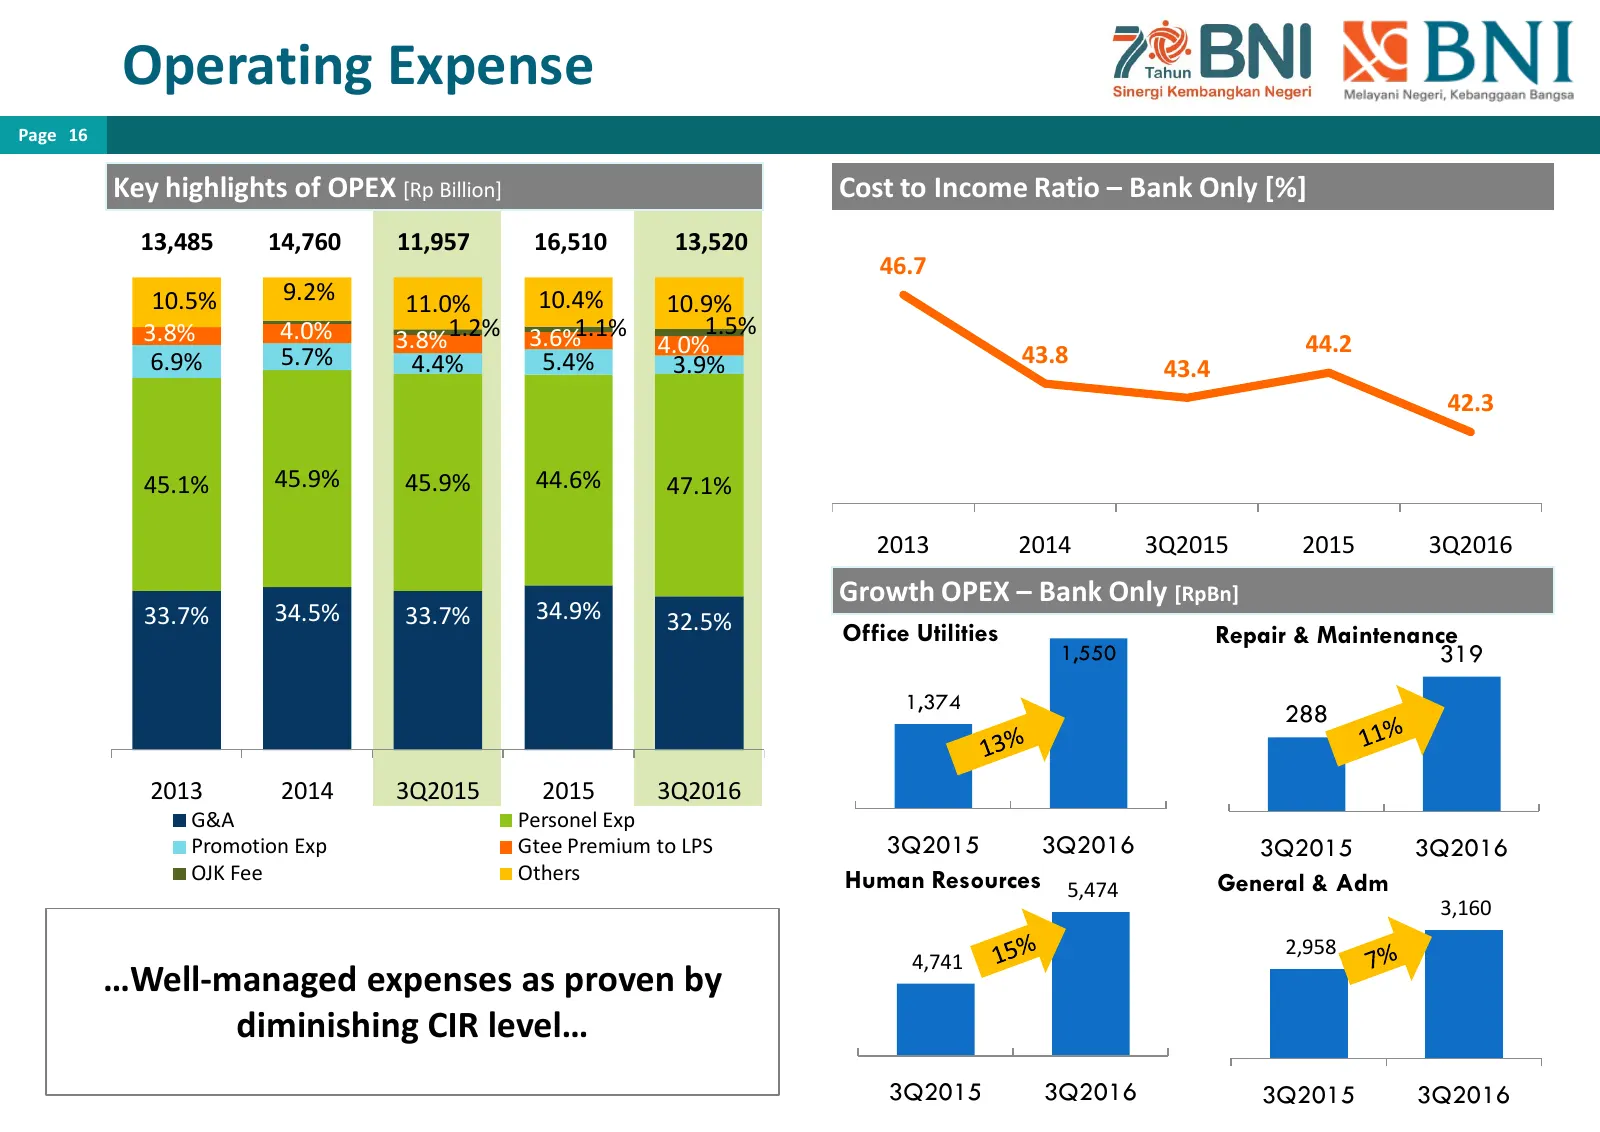
Operating Expense Page 16 Key highlights of OPEX [Rp Billion] Cost to Income Ratio – Bank Only [%] 13,485 14,760 11,957 16,510 13,520 46.7 10.5% 9.2% 11.0% 10.4% 10.9% 3.6%1.1% 1.5% 3.8% 4.0% 3.8%1.2% 4.0% 44.2 6.9% 5.7% 4.4% 5.4% 3.9% 43.8 43.4 42.3 45.1% 45.9% 45.9% 44.6% 47.1% 2013 2014 3Q2015 20
Slide 17: Business & Consumer Banking
PT. BANK NEGARA INDONESIA (PERSERO) TBK BUSINESS & CONSUMER BANKING
Slide 18: Corporate Business
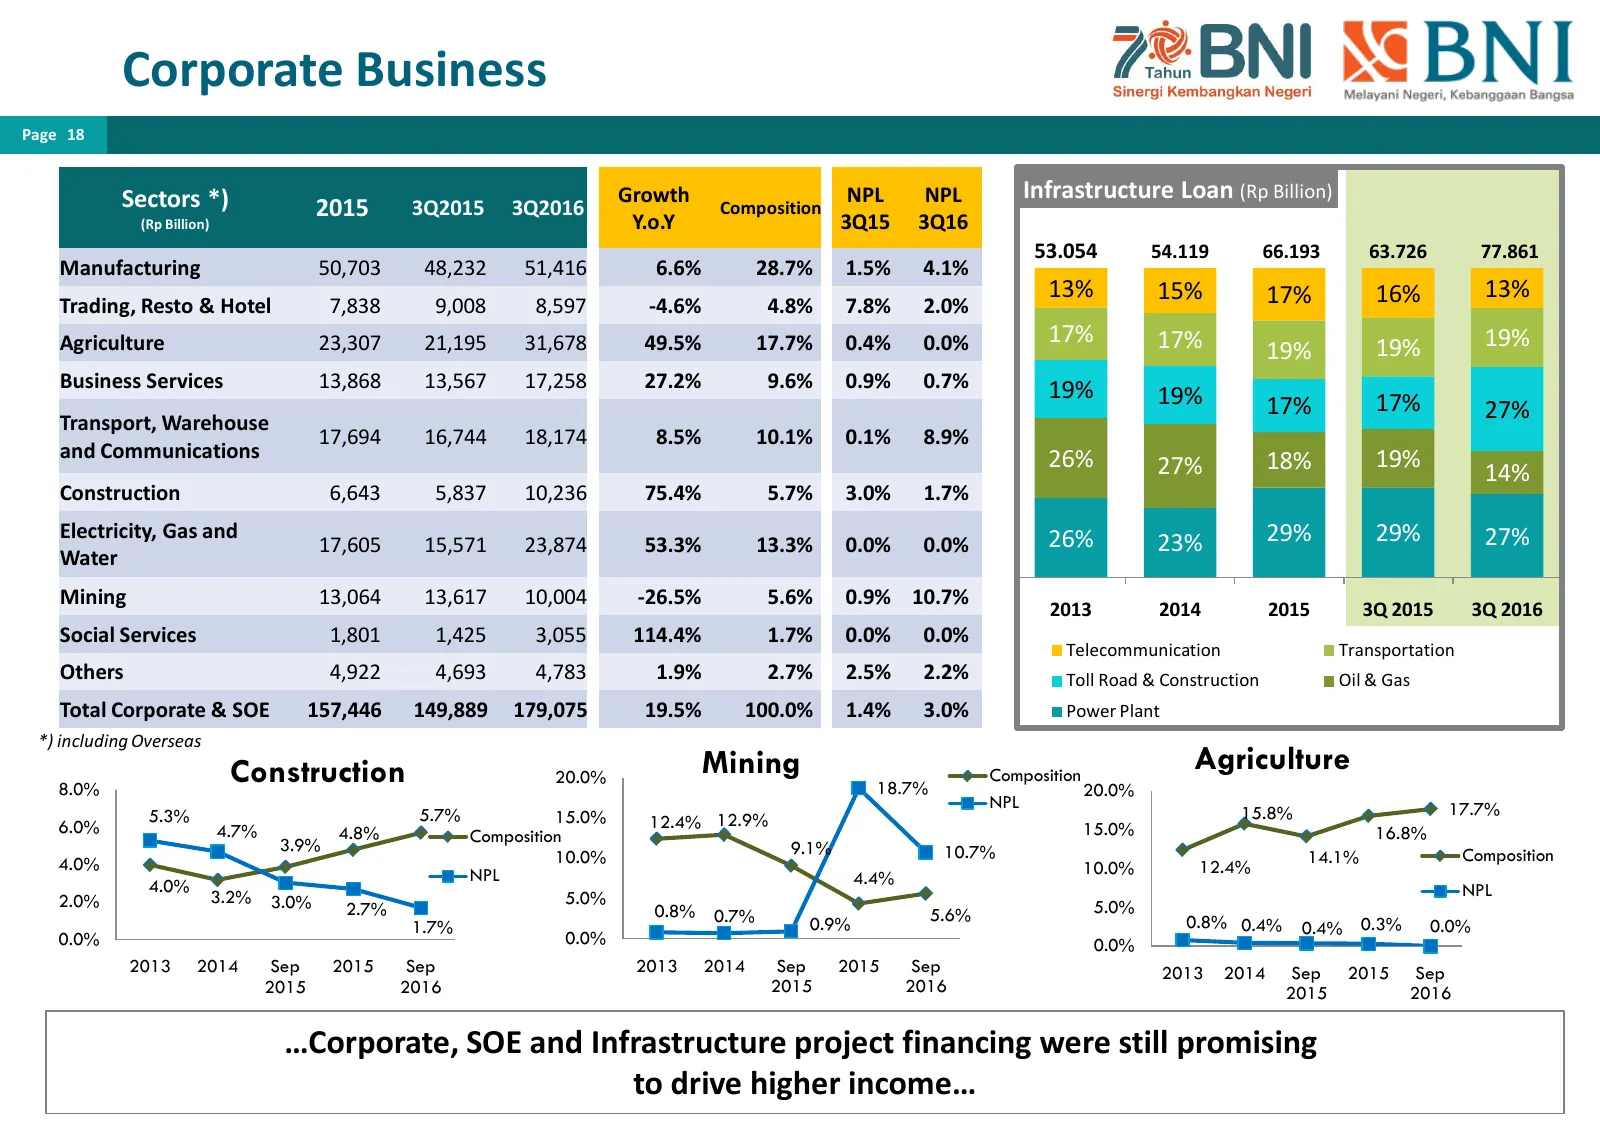
Corporate Business Page 18 Sectors *) Growth NPL NPL Infrastructure Loan (Rp Billion) (Rp Billion) 2015 3Q2015 3Q2016 Y.o.Y Composition 3Q15 3Q16 53.054 54.119 66.193 63.726 77.861 Manufacturing 50,703 48,232 51,416 6.6% 28.7% 1.5% 4.1% 13% 15% 17% 16% 13% Trading, Resto & Hotel 7,838 9,008 8,597 -4
Slide 19: Medium Business
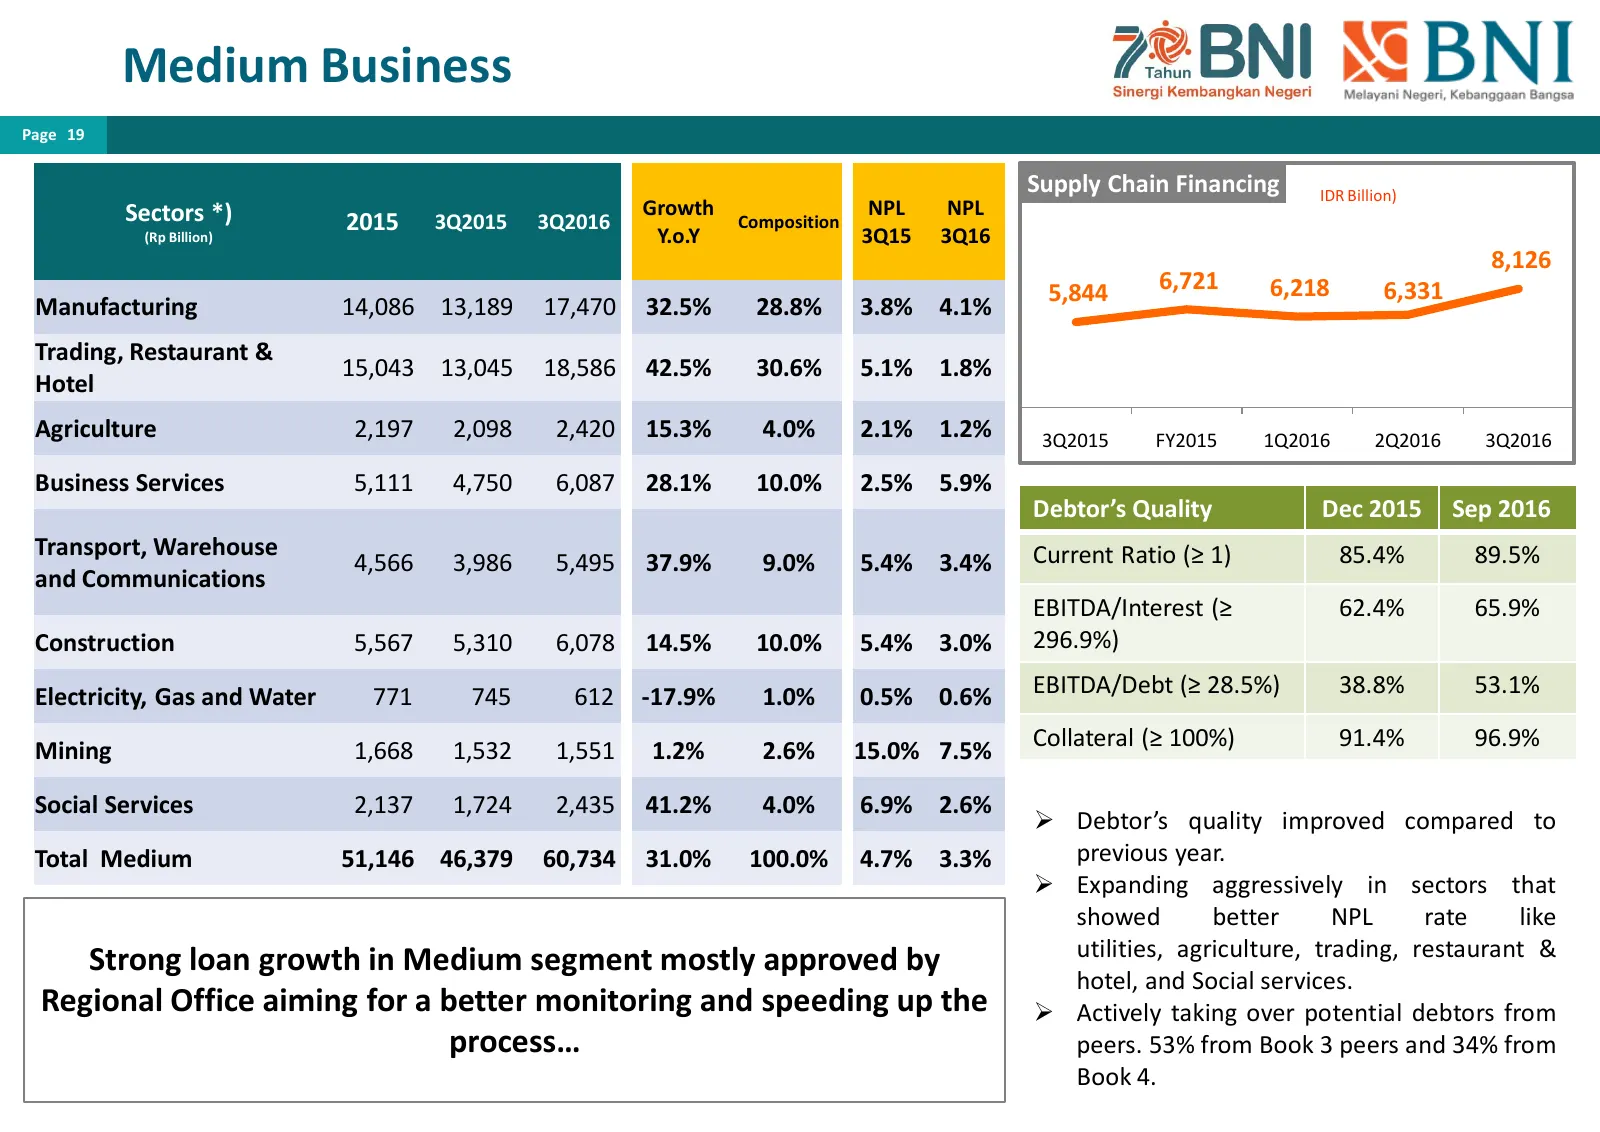
Medium Business Page 19 Supply Chain Financing IDR Billion) Sectors *) Growth NPL NPL (Rp Billion) 2015 3Q2015 3Q2016 Y.o.Y Composition 3Q15 3Q16 8,126 5,844 6,721 6,218 6,331 Manufacturing 14,086 13,189 17,470 32.5% 28.8% 3.8% 4.1% Trading, Restaurant & 15,043 13,045 18,586 42.5% 30.6% 5.1% 1.8% Ho
Slide 20: Small Business
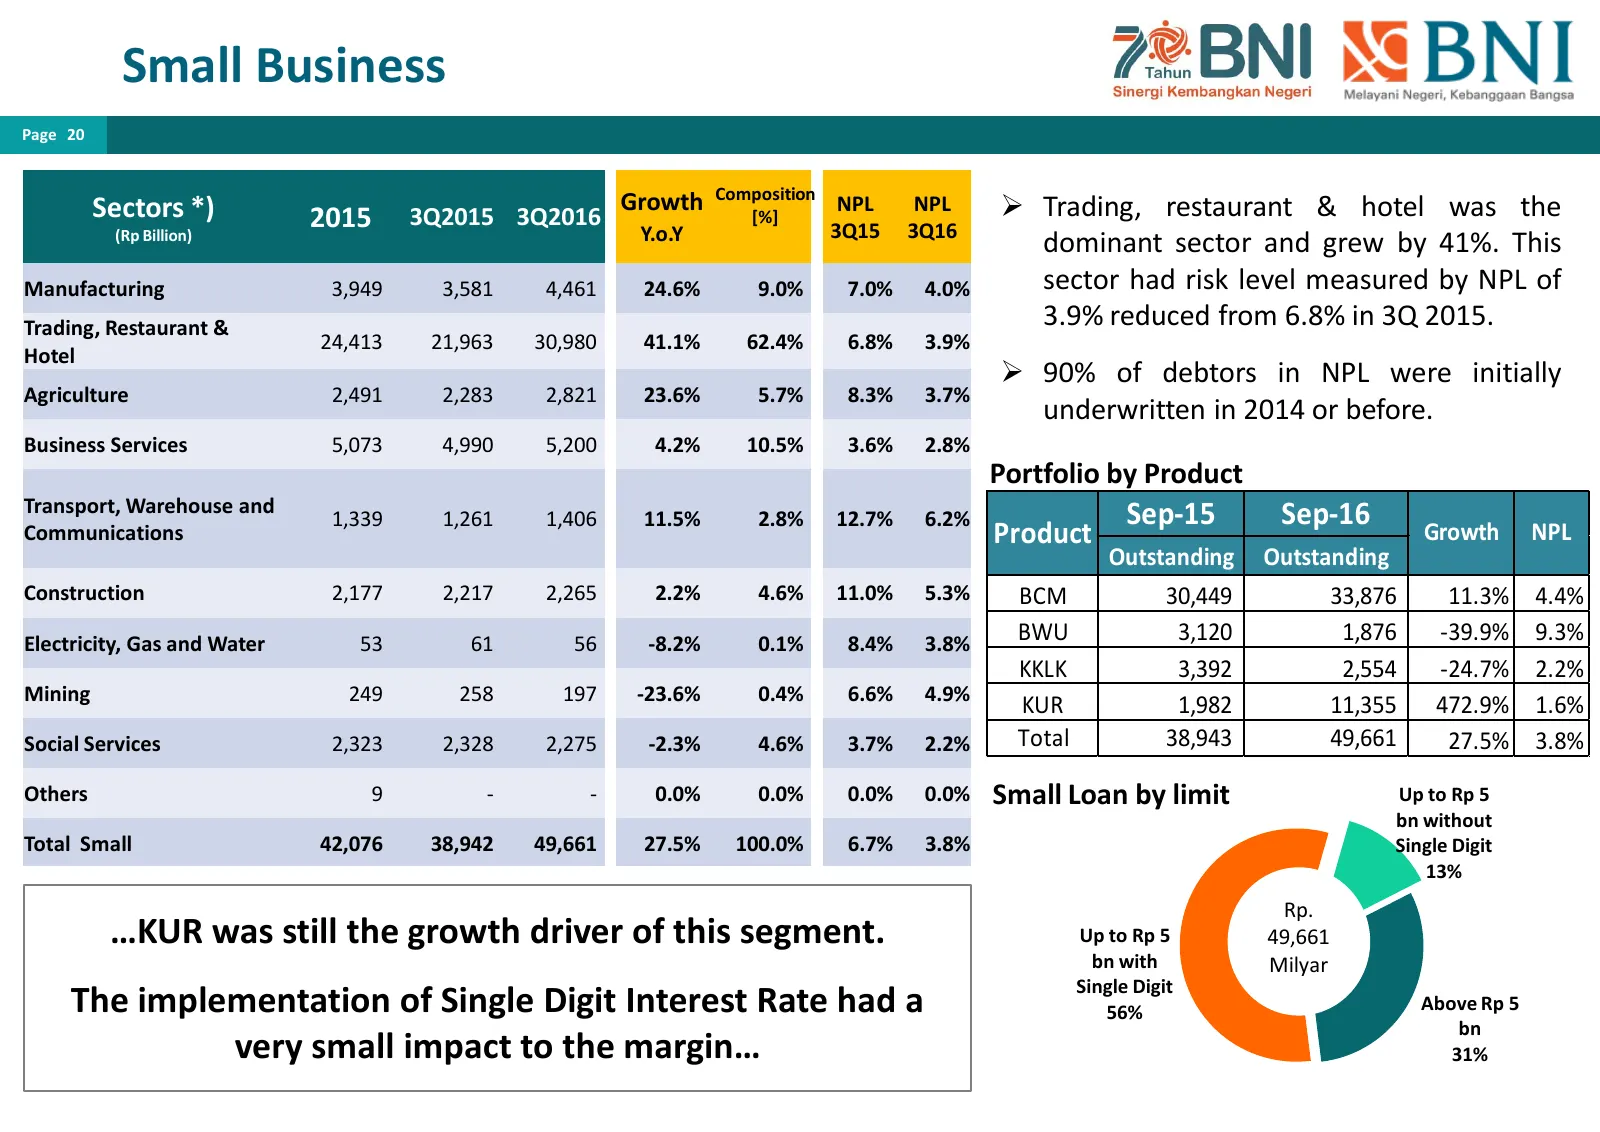
Small Business Page 20 Sectors *) Growth Composition NPL NPL Trading, restaurant & hotel was the 2015 3Q2015 3Q2016 Y.o.Y [%] 3Q15 3Q16 (Rp Billion) dominant sector and grew by 41%. This Manufacturing 3,949 3,581 4,461 24.6% 9.0% 7.0% 4.0% sector had risk level measured by NPL of Trading, Restaura
Slide 21: Consumer Business
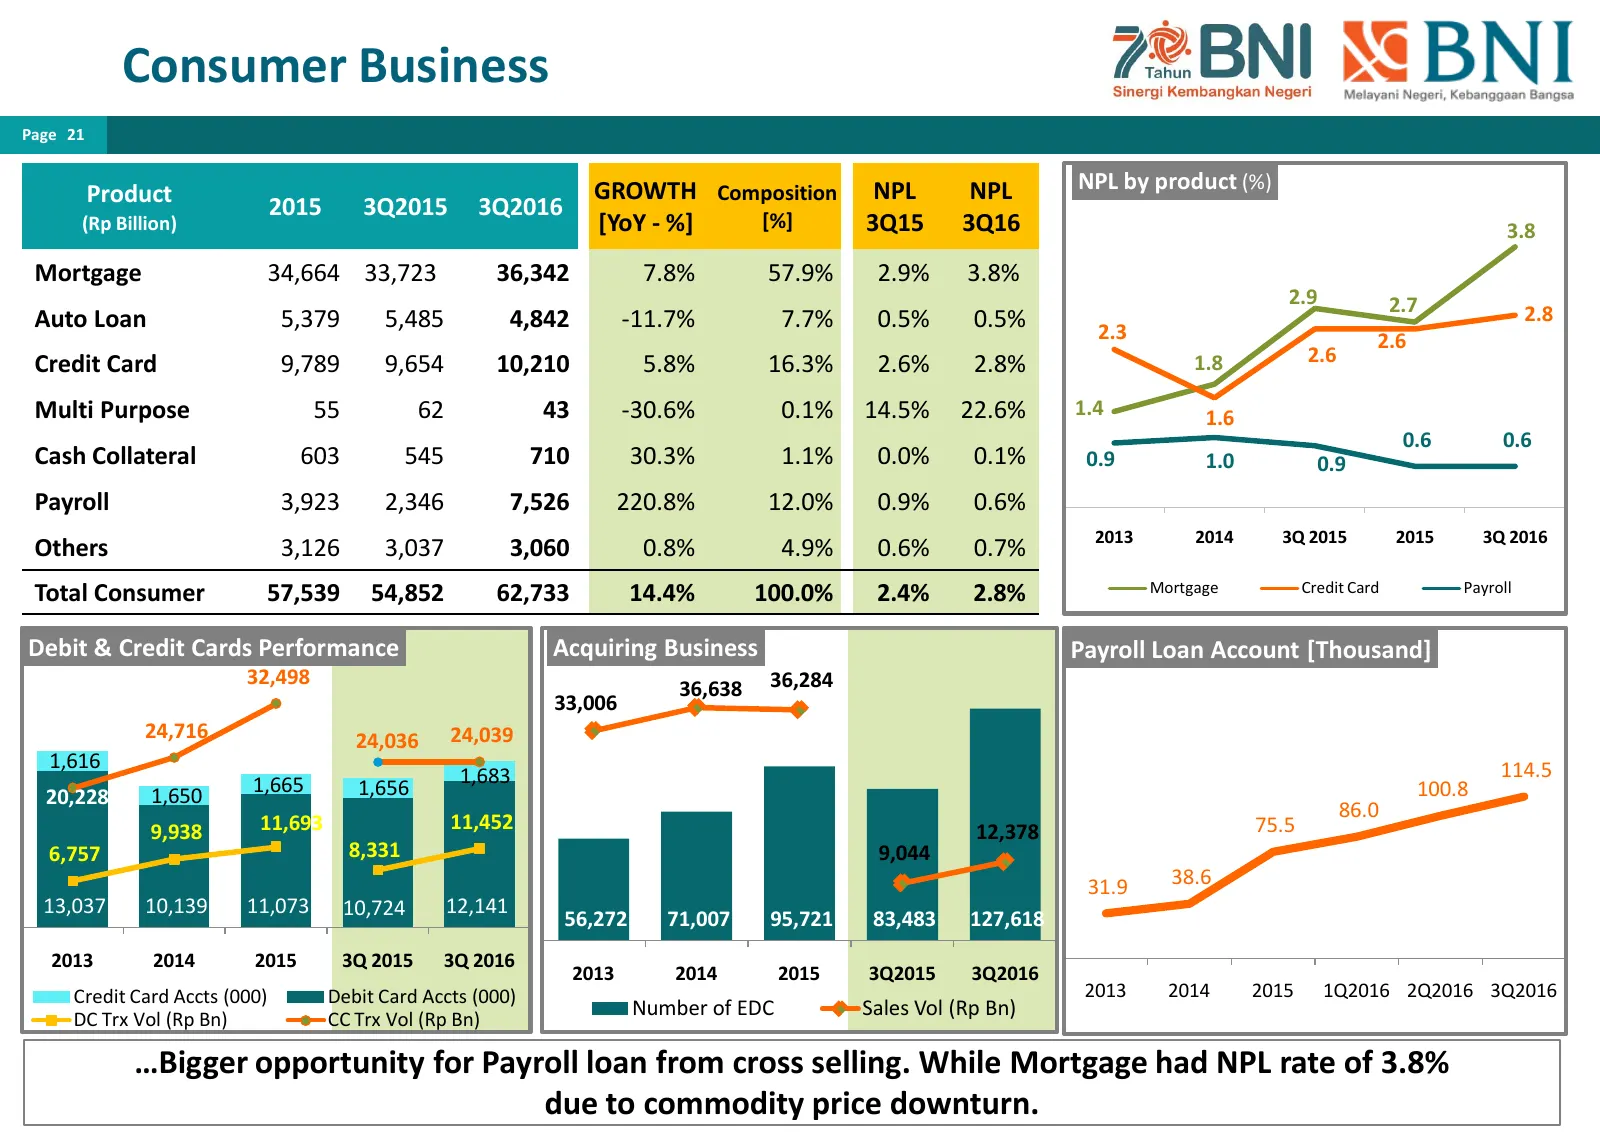
Consumer Business Page 21 GROWTH Composition NPL NPL NPL by product (%) Product 2015 3Q2015 3Q2016 (Rp Billion) [YoY - %] [%] 3Q15 3Q16 3.8 Mortgage 34,664 33,723 36,342 7.8% 57.9% 2.9% 3.8% 2.9 2.7 Auto Loan 5,379 5,485 4,842 -11.7% 7.7% 0.5% 0.5% 2.8 2.3 2.6 Credit Card 9,789 9,654 10,210 5.8% 16.
Slide 22: E-Banking
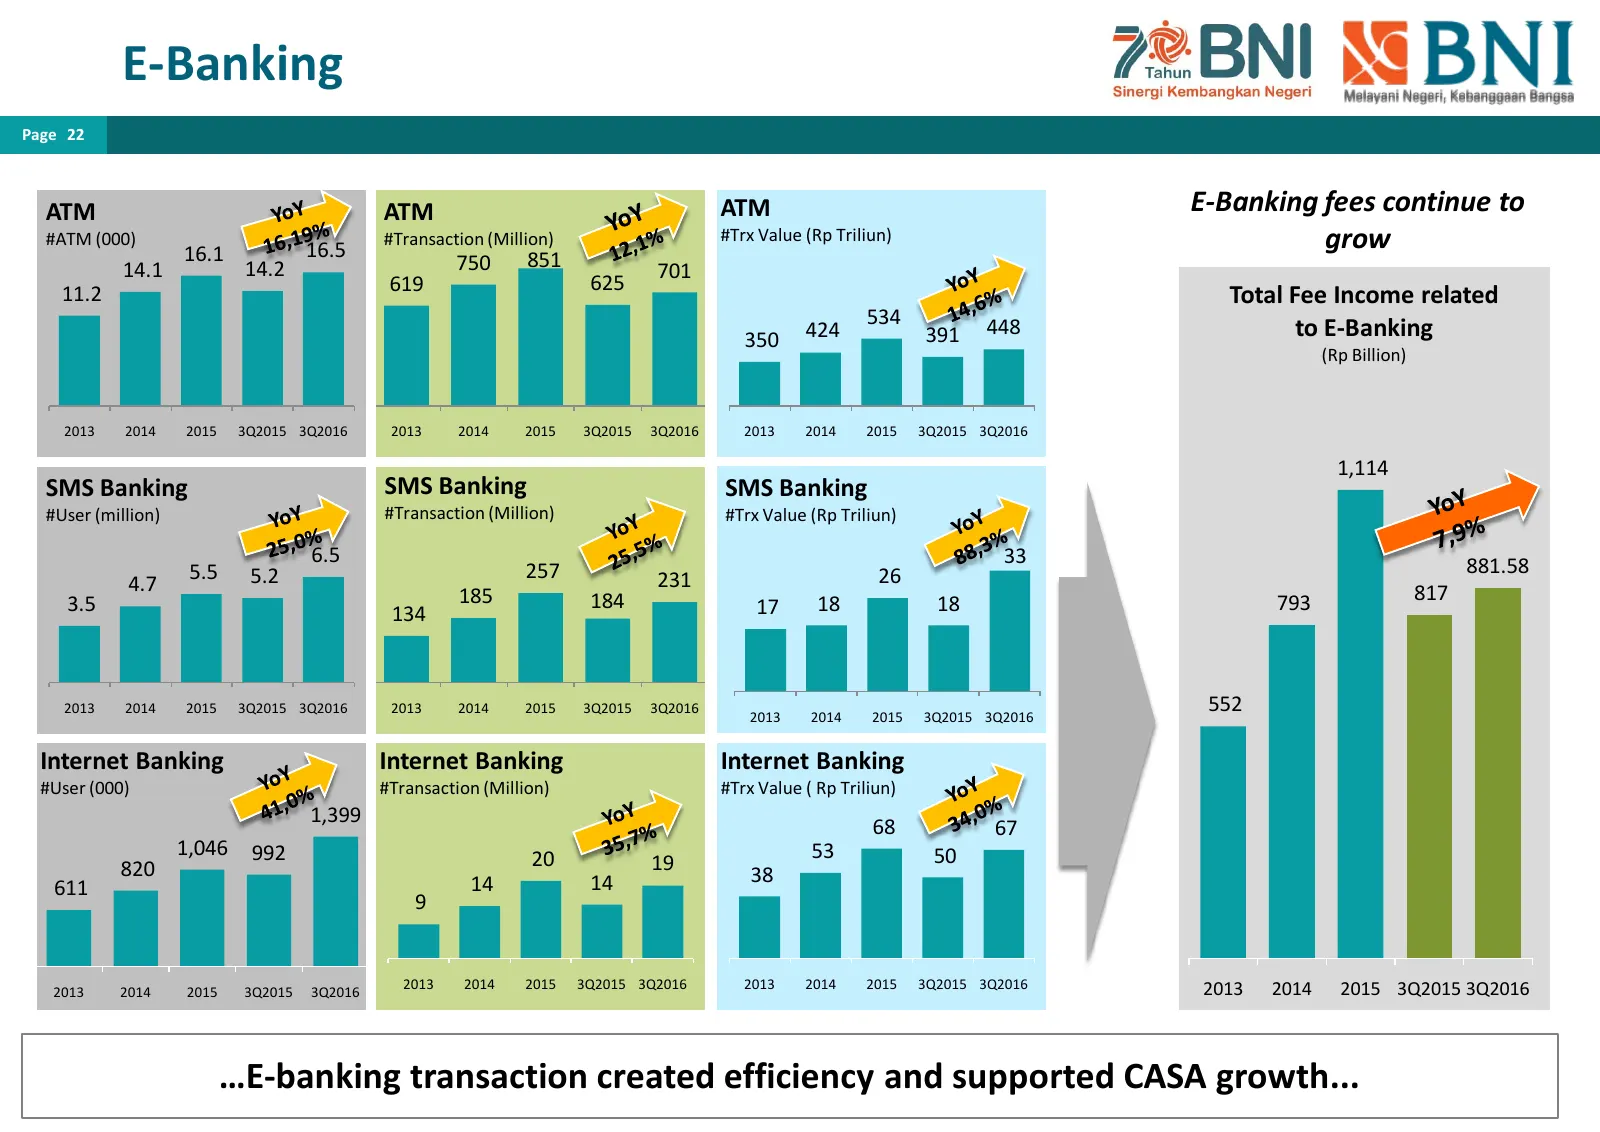
E-Banking Page 22 ATM ATM ATM E-Banking fees continue to #ATM (000) 16.1 16.5 #Transaction (Million) #Trx Value (Rp Triliun) grow 14.1 14.2 750 851 701 619 625 11.2 Total Fee Income related 534 350 424 391 448 to E-Banking (Rp Billion) 2013 2014 2015 3Q2015 3Q2016 2013 2014 2015 3Q2015 3Q2016 2013 2
Slide 23: About BNI
PT. BANK NEGARA INDONESIA (PERSERO) TBK ABOUT BNI
Slide 24: Board of Directors
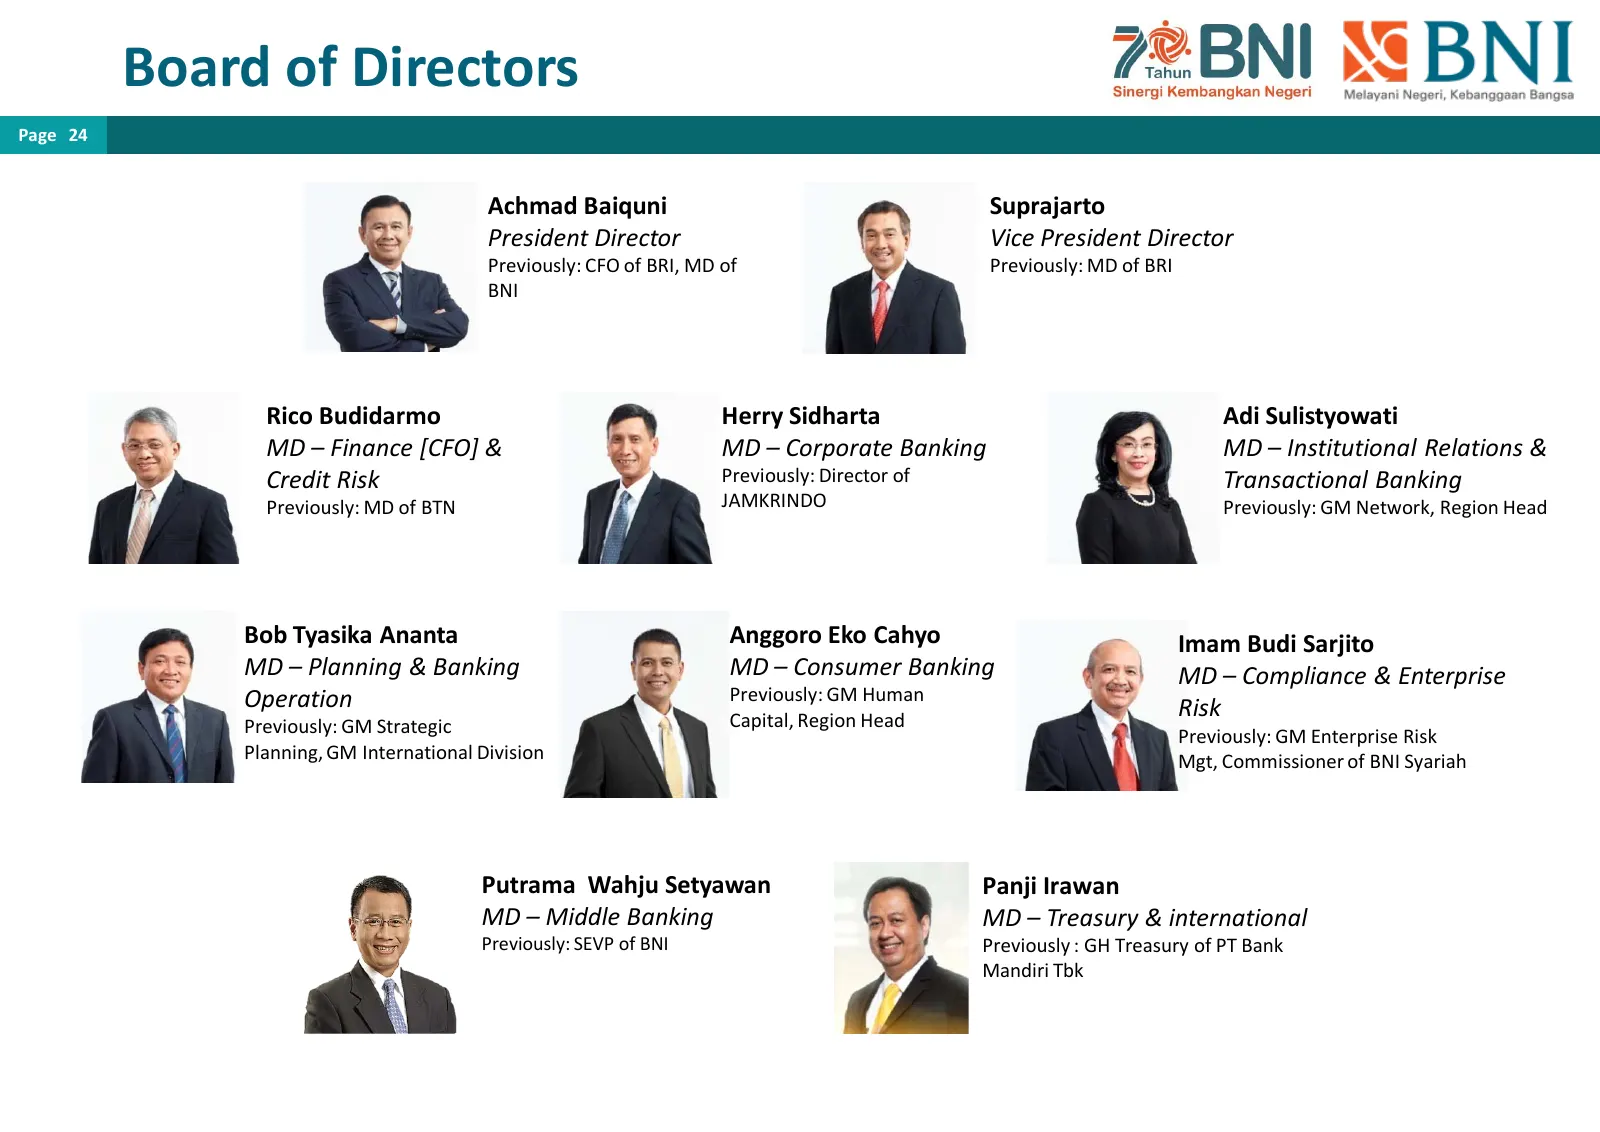
Board of Directors Page 24 Achmad Baiquni Suprajarto President Director Vice President Director Previously: CFO of BRI, MD of Previously: MD of BRI BNI Rico Budidarmo Herry Sidharta Adi Sulistyowati MD – Finance [CFO] & MD – Corporate Banking MD – Institutional Relations & Credit Risk Previously: Di
Slide 25: Board of Commissioners
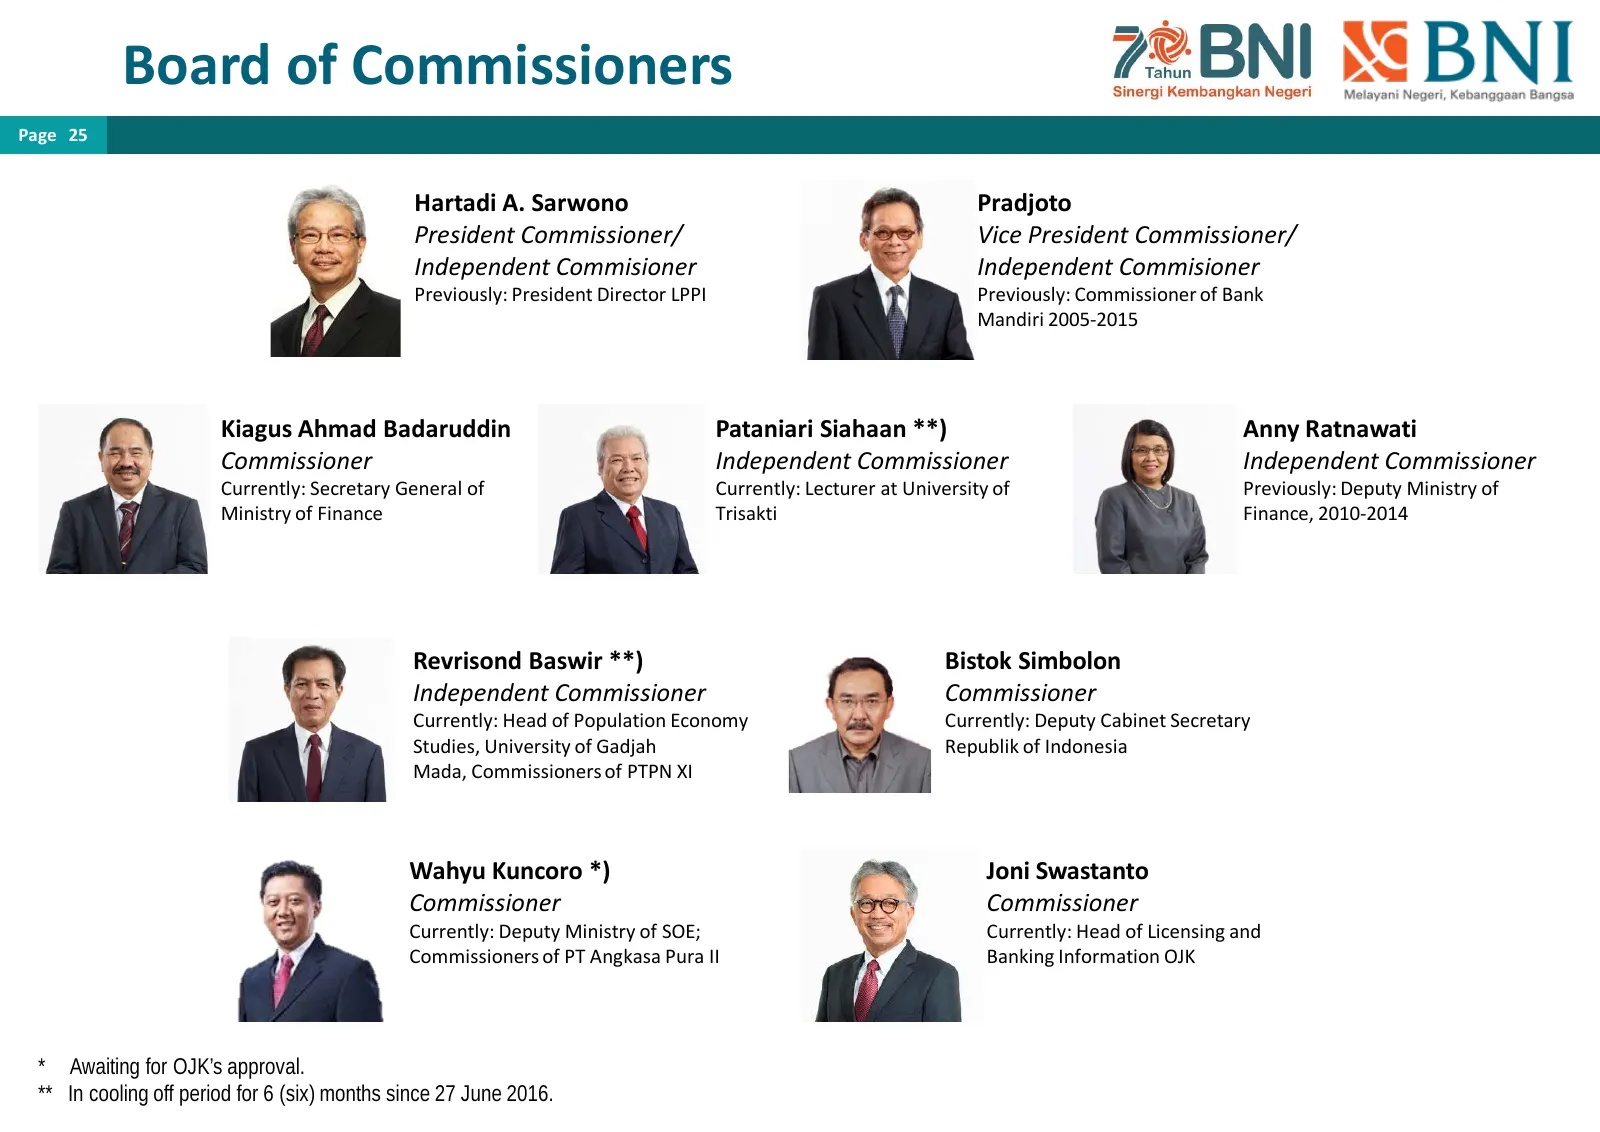
Board of Commissioners Page 25 Hartadi A. Sarwono Pradjoto President Commissioner/ Vice President Commissioner/ Independent Commisioner Independent Commisioner Previously: President Director LPPI Previously: Commissioner of Bank Mandiri 2005-2015 Kiagus Ahmad Badaruddin Pataniari Siahaan **) Anny Ra
Slide 26: Network & Distribution
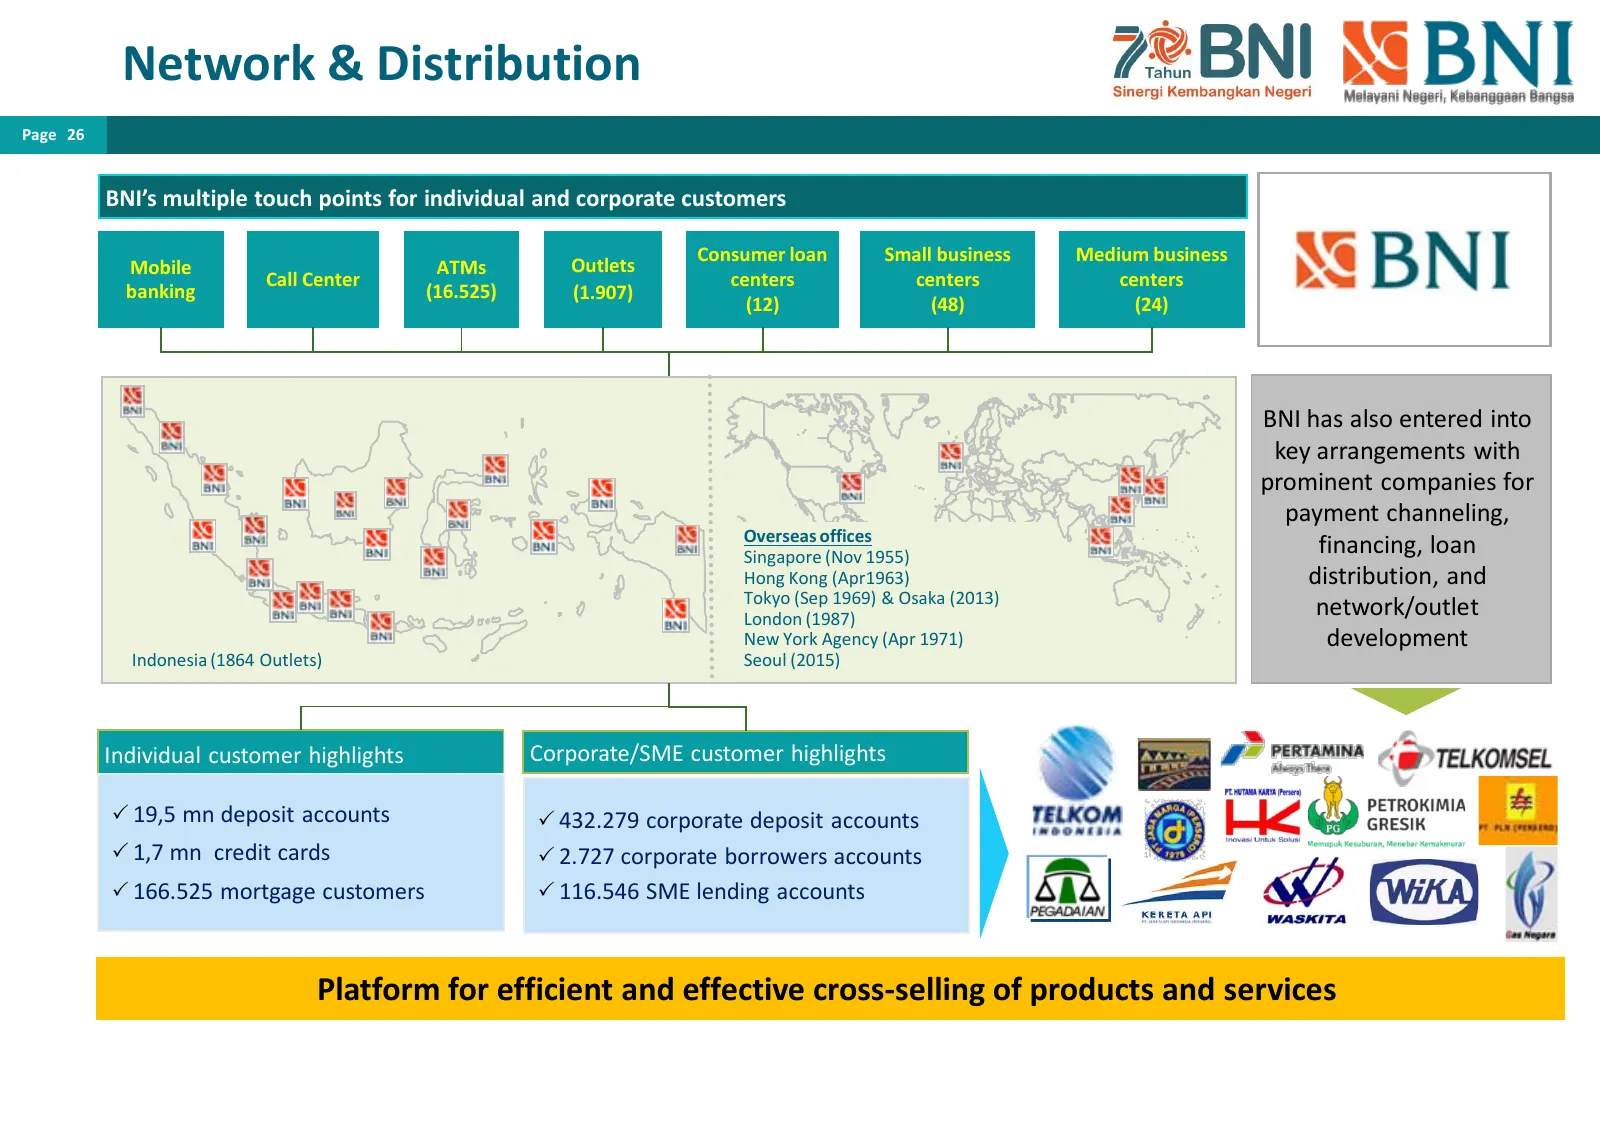
Network & Distribution Page 26 BNI’s multiple touch points for individual and corporate customers Consumer loan Small business Medium business Mobile ATMs Outlets Call Center centers centers centers banking (16.525) (1.907) (12) (48) (24) BNI has also entered into key arrangements with prominent com
Slide 27: BNI Ratings
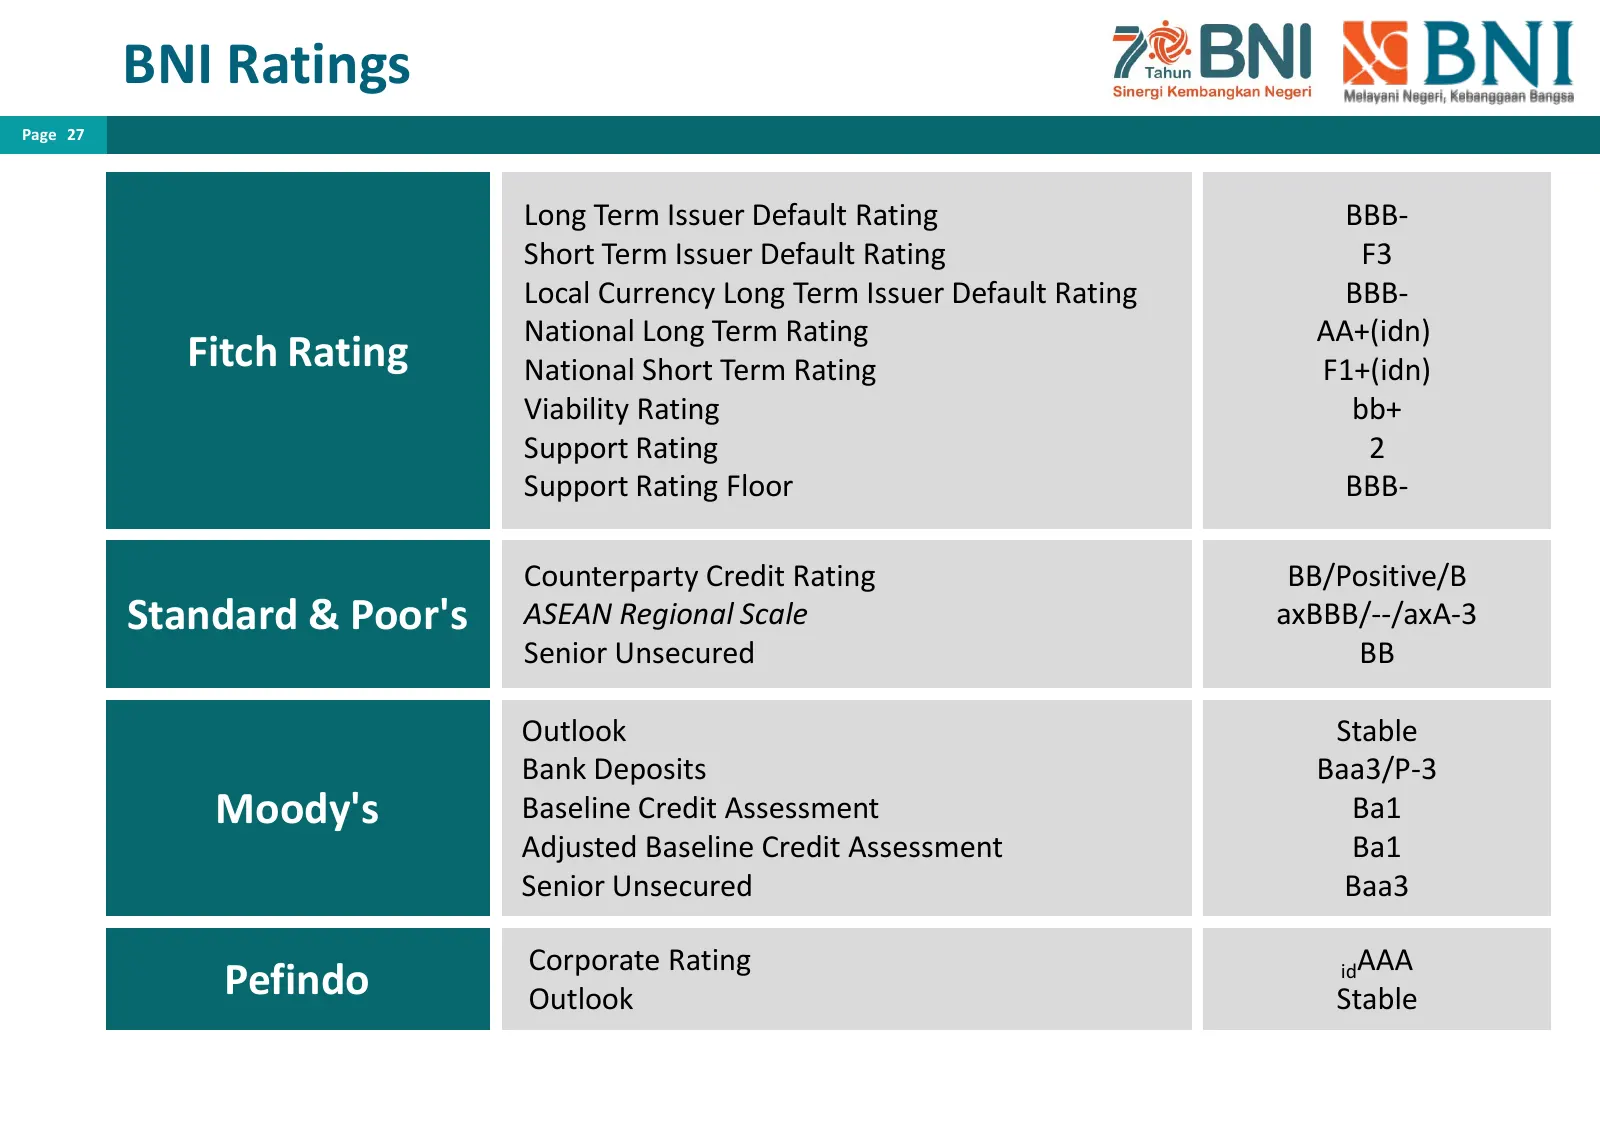
BNI Ratings Page 27 Long Term Issuer Default Rating BBB- Short Term Issuer Default Rating F3 Local Currency Long Term Issuer Default Rating BBB- National Long Term Rating AA+(idn) Fitch Rating National Short Term Rating F1+(idn) Viability Rating bb+ Support Rating 2 Support Rating Floor BBB- Counter
Slide 28: BNI Shares
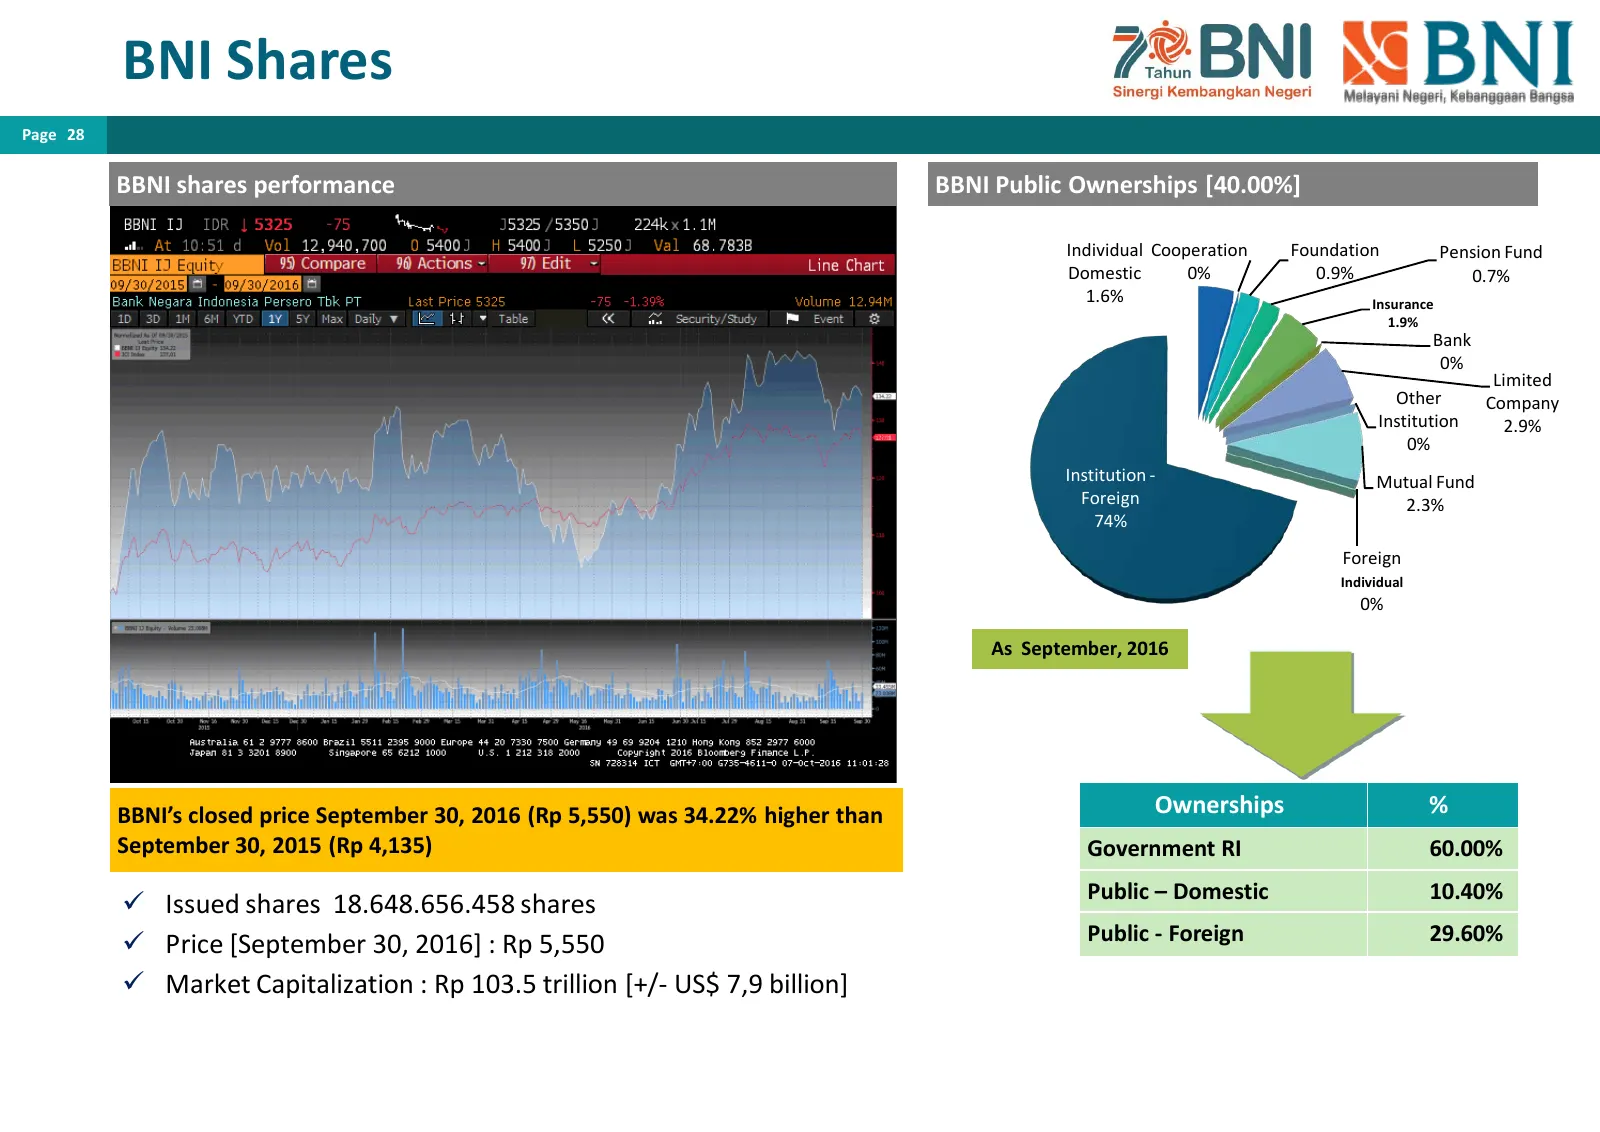
BNI Shares Page 28 BBNI shares performance BBNI Public Ownerships [40.00%] Individual Cooperation Foundation Pension Fund Domestic 0% 0.9% 0.7% 1.6% Insurance 1.9% Bank 0% Limited Other Company Institution 2.9% 0% Institution - Mutual Fund Foreign 2.3% 74% Foreign Individual 0% As September, 2016 BB
Slide 29: Macro Economy
PT. BANK NEGARA INDONESIA (PERSERO) TBK MACRO ECONOMY
Slide 30: Macro & Banking Sector
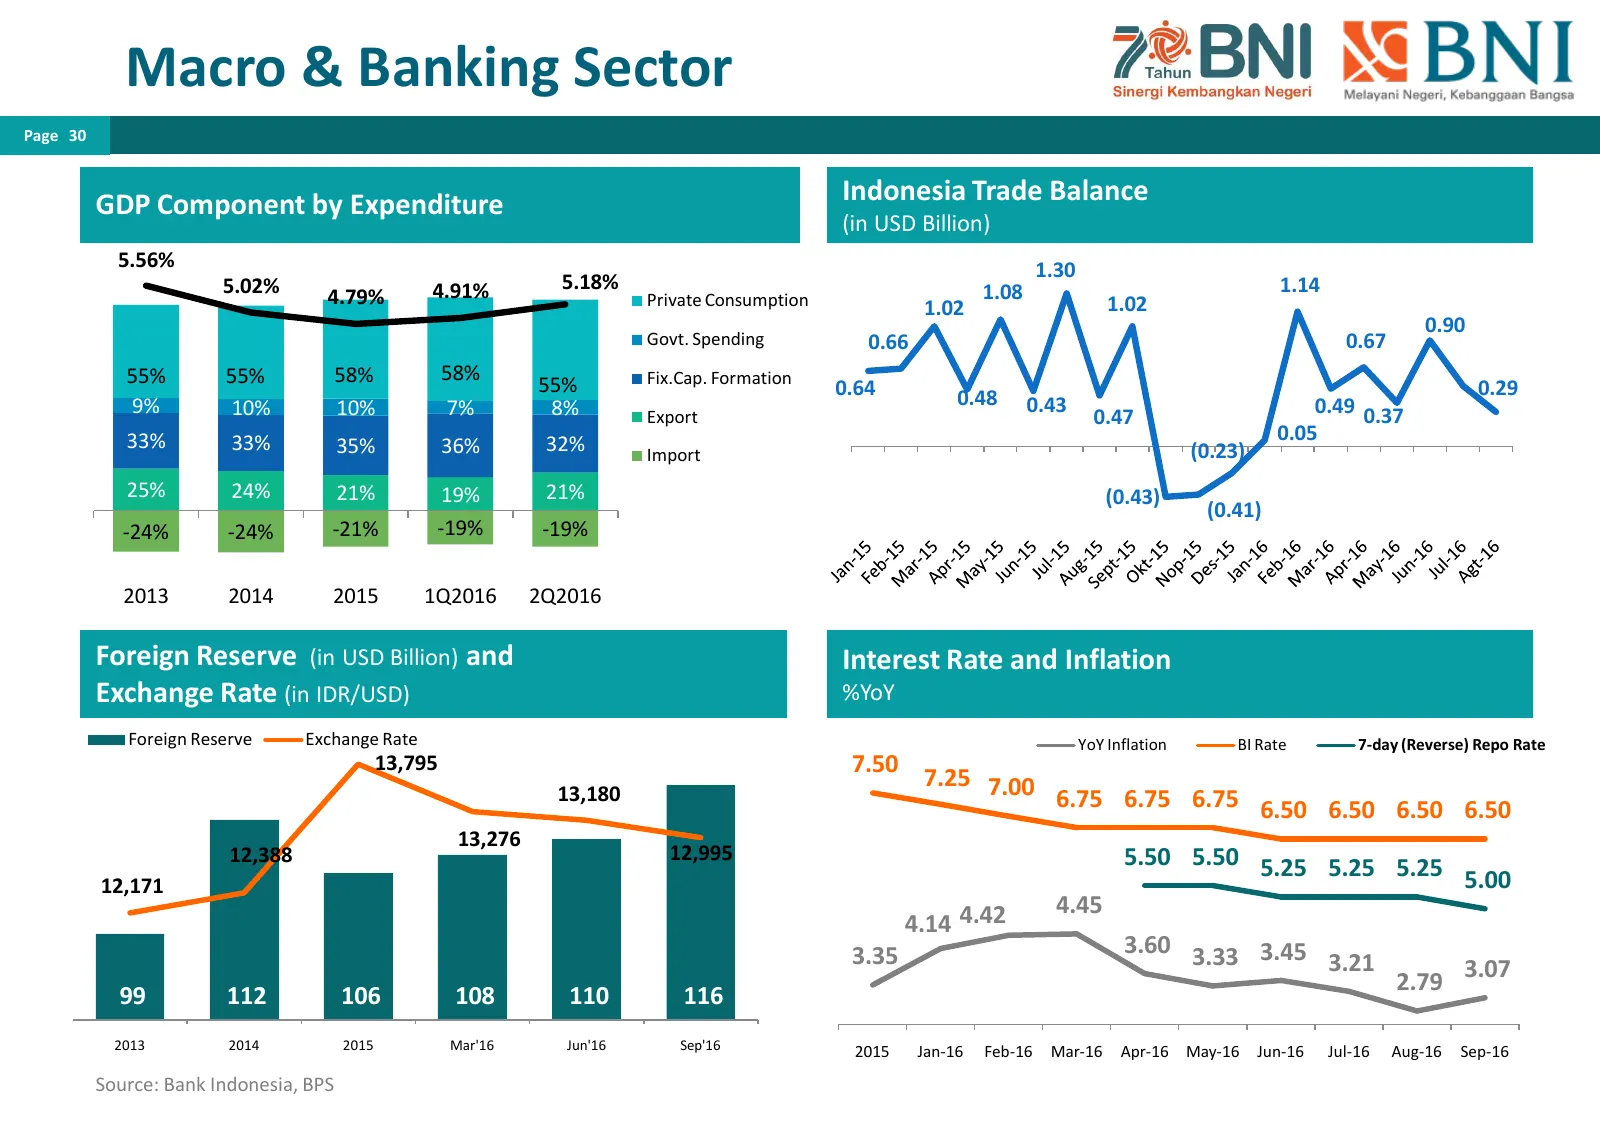
Macro & Banking Sector Page 30 GDP Component by Expenditure Indonesia Trade Balance (in USD Billion) 5.56% 1.30 5.02% 4.91% 5.18% 1.08 1.14 4.79% Private Consumption 1.02 1.02 0.90 Govt. Spending 0.66 0.67 55% 55% 58% 58% Fix.Cap. Formation 55% 0.64 0.29 9% 10% 10% 7% 8% 0.48 0.43 0.49 0.37 Export 0
Slide 31: Banking Sector Highlights
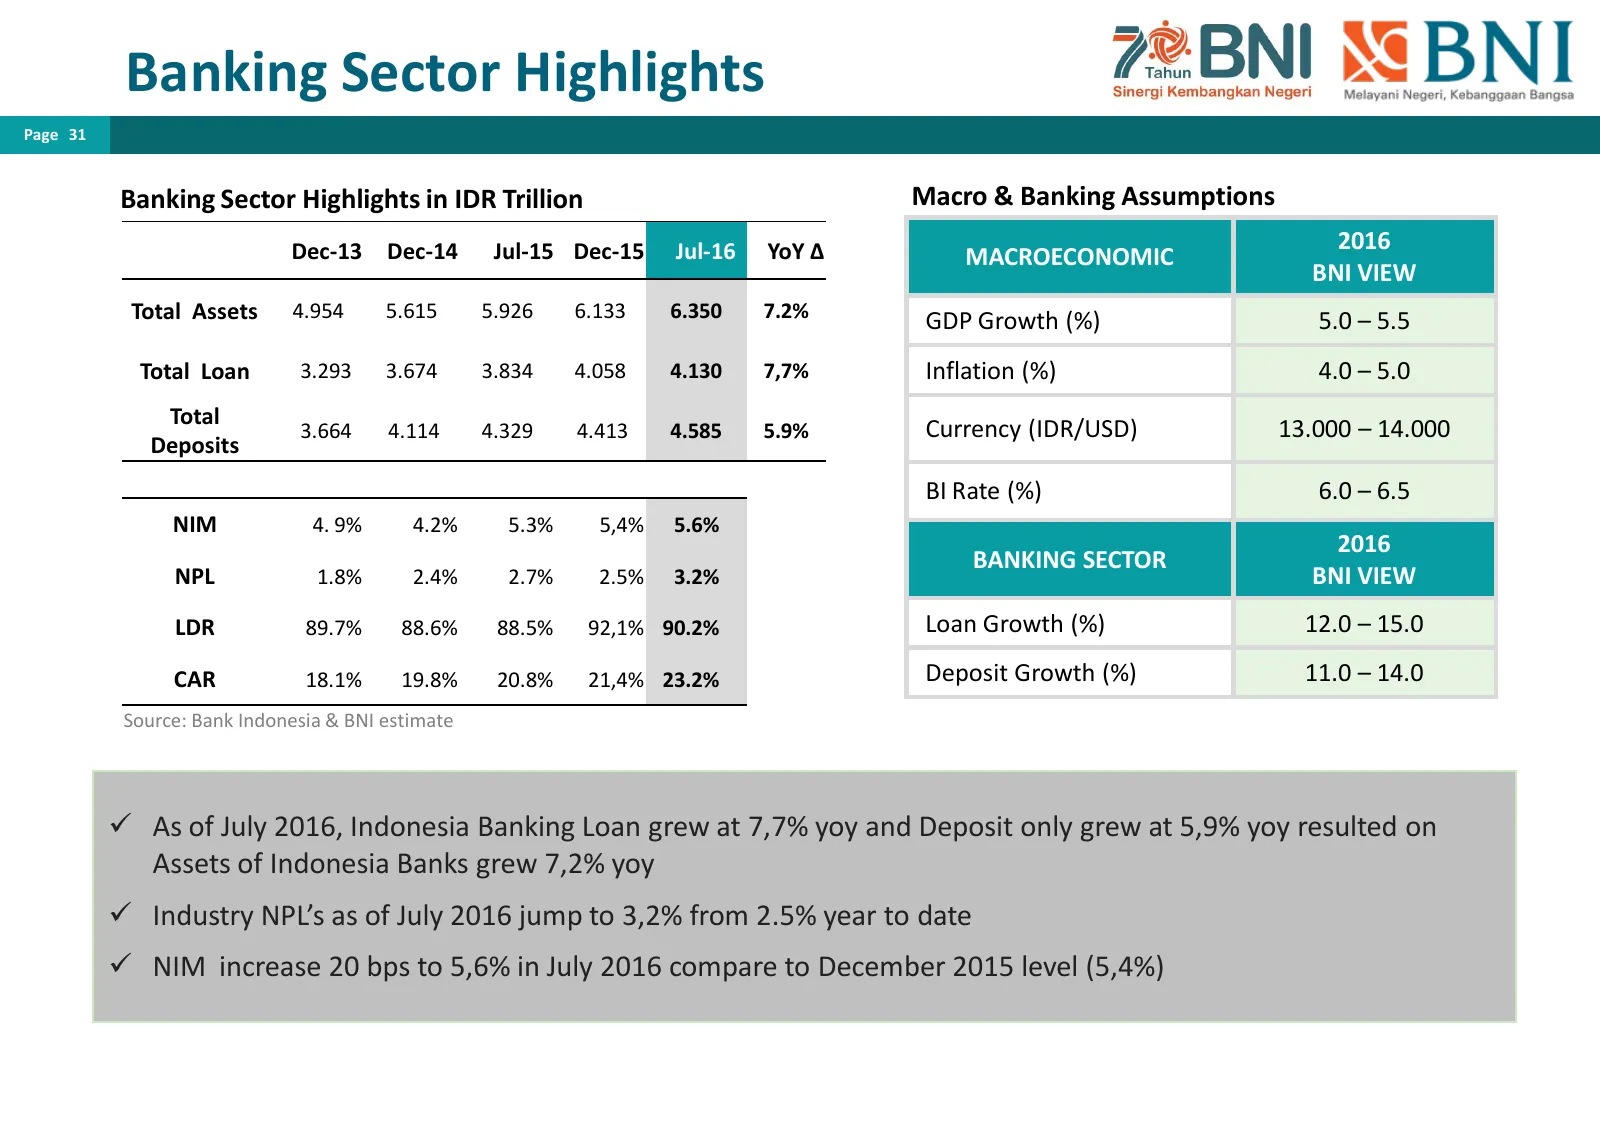
Banking Sector Highlights Page 31 Banking Sector Highlights in IDR Trillion Macro & Banking Assumptions Dec-13 Dec-14 Jul-15 Dec-15 Jul-16 YoY ∆ 2016 MACROECONOMIC BNI VIEW Total Assets 4.954 5.615 5.926 6.133 6.350 7.2% GDP Growth (%) 5.0 – 5.5 Total Loan 3.293 3.674 3.834 4.058 4.130 7,7% Inflatio
Slide 32: 5 Years Financial Data
PT. BANK NEGARA INDONESIA (PERSERO) TBK 5 YEARS FINANCIAL DATA
Slide 33: Balance Sheet
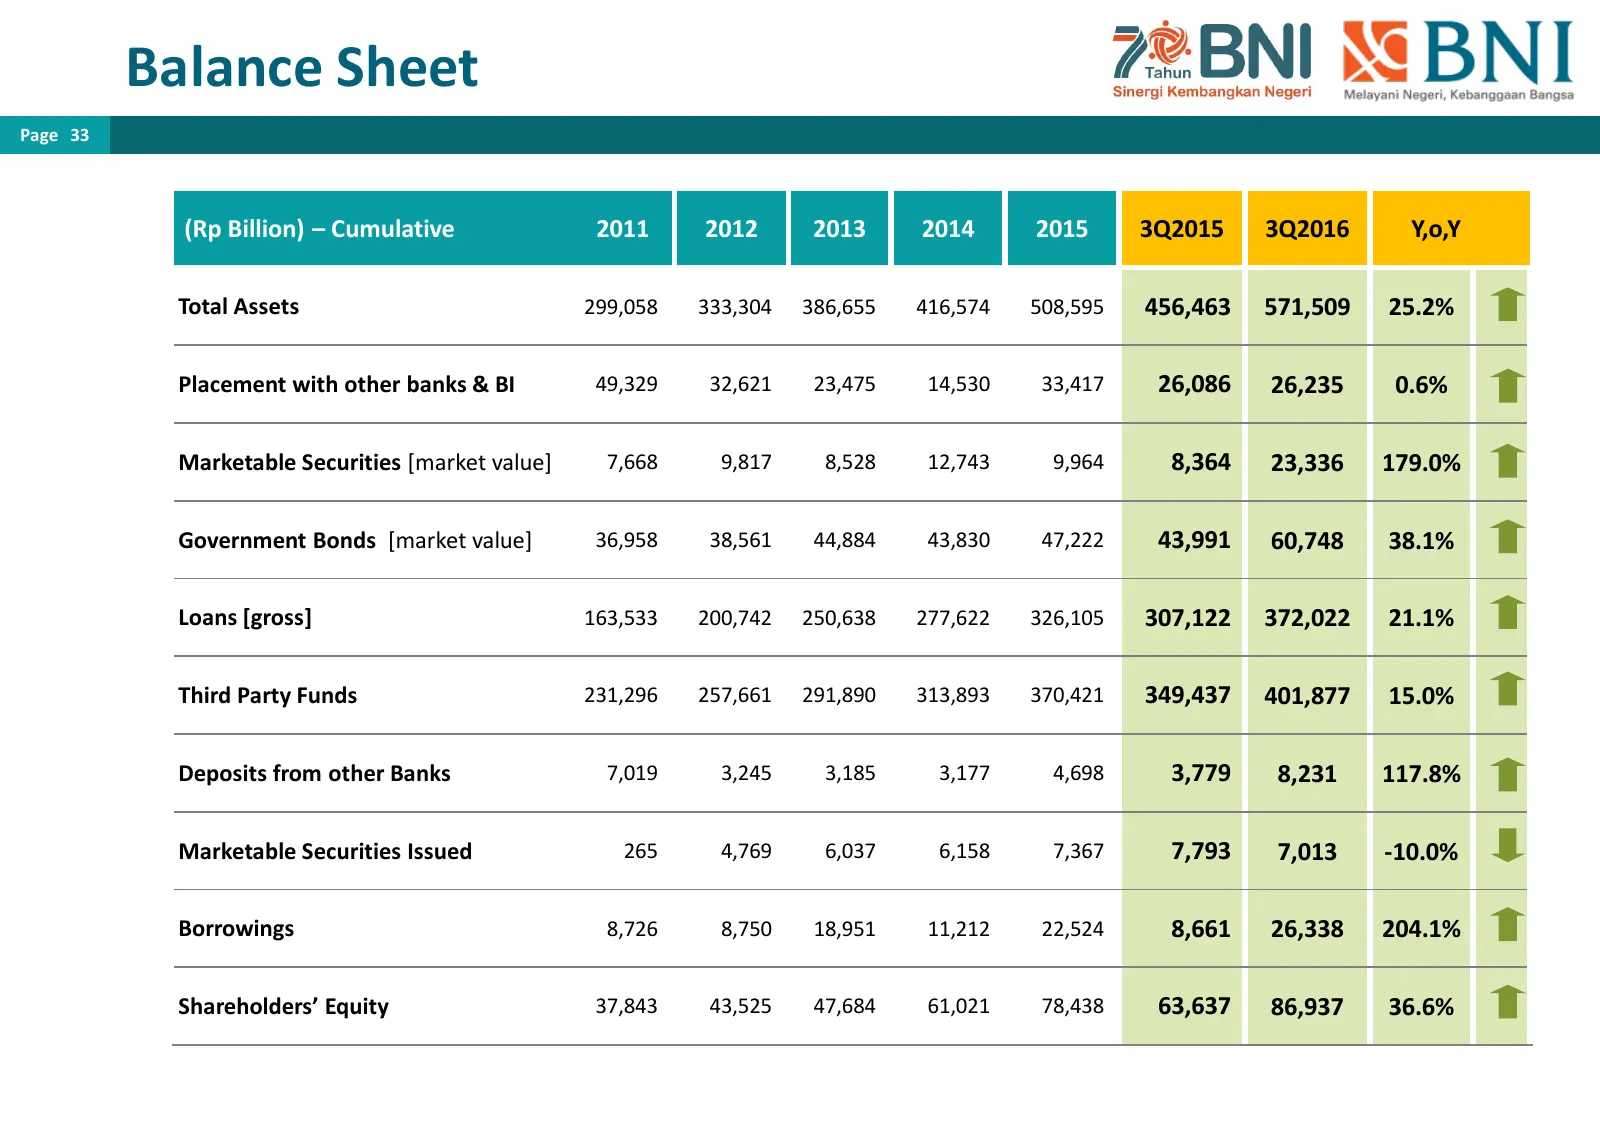
Balance Sheet Page 33 (Rp Billion) – Cumulative 2011 2012 2013 2014 2015 3Q2015 3Q2016 Y,o,Y Total Assets 299,058 333,304 386,655 416,574 508,595 456,463 571,509 25.2% Placement with other banks & BI 49,329 32,621 23,475 14,530 33,417 26,086 26,235 0.6% Marketable Securities [market value] 7,668 9,8
Slide 34: Profit & Loss
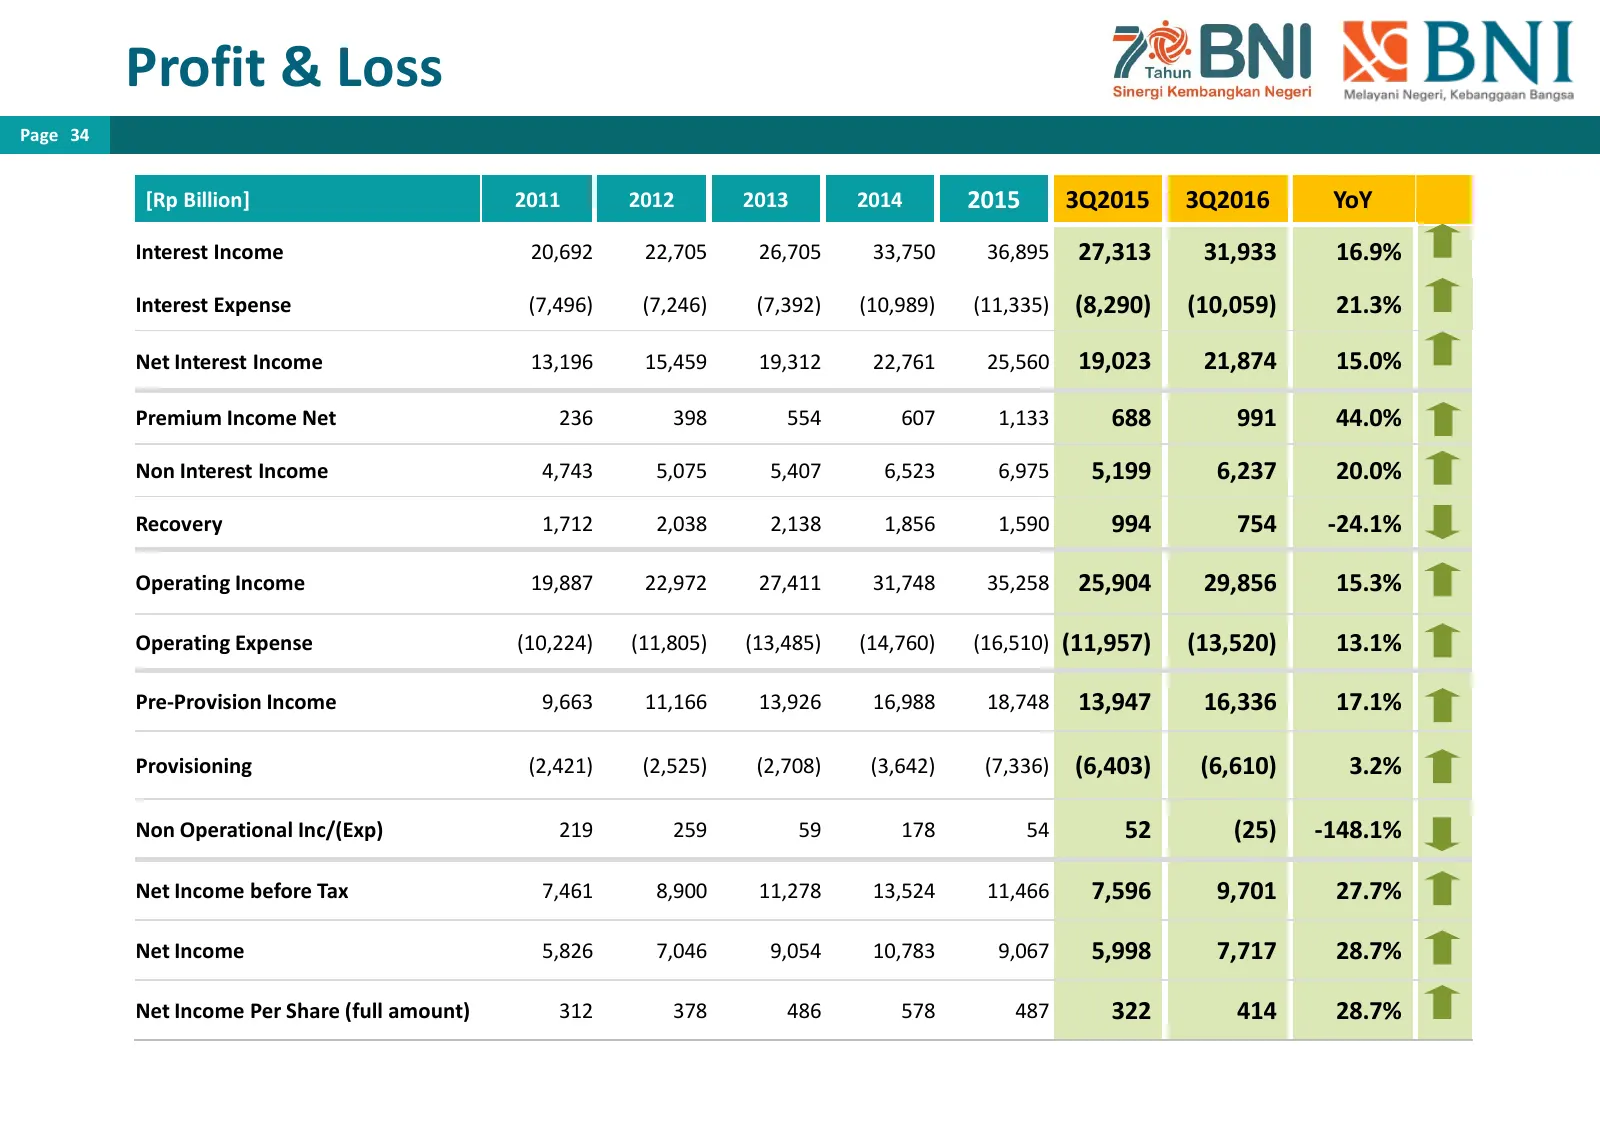
Profit & Loss Page 34 [Rp Billion] 2011 2012 2013 2014 2015 3Q2015 3Q2016 YoY Interest Income 20,692 22,705 26,705 33,750 36,895 27,313 31,933 16.9% Interest Expense (7,496) (7,246) (7,392) (10,989) (11,335) (8,290) (10,059) 21.3% Net Interest Income 13,196 15,459 19,312 22,761 25,560 19,023 21,874
Slide 35: Financial Ratios
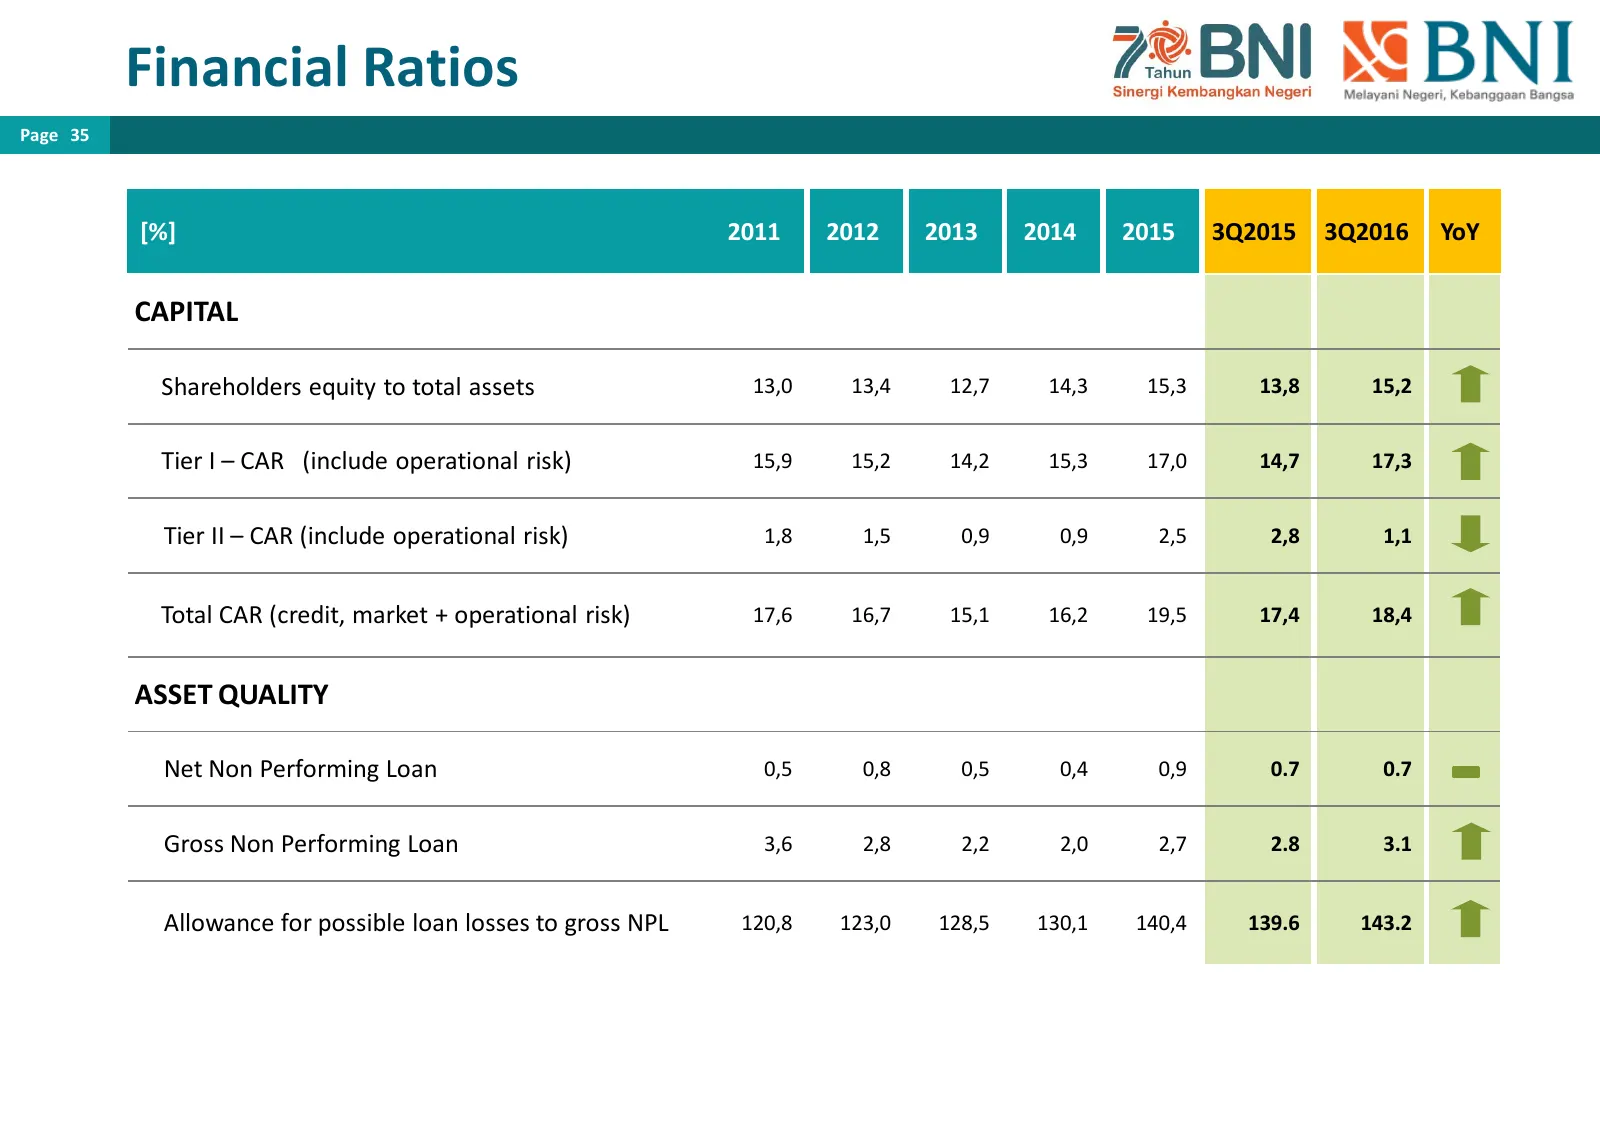
Financial Ratios Page 35 [%] 2011 2012 2013 2014 2015 3Q2015 3Q2016 YoY CAPITAL Shareholders equity to total assets 13,0 13,4 12,7 14,3 15,3 13,8 15,2 Tier I – CAR (include operational risk) 15,9 15,2 14,2 15,3 17,0 14,7 17,3 Tier II – CAR (include operational risk) 1,8 1,5 0,9 0,9 2,5 2,8 1,1 Total
Slide 36: Financial Ratios
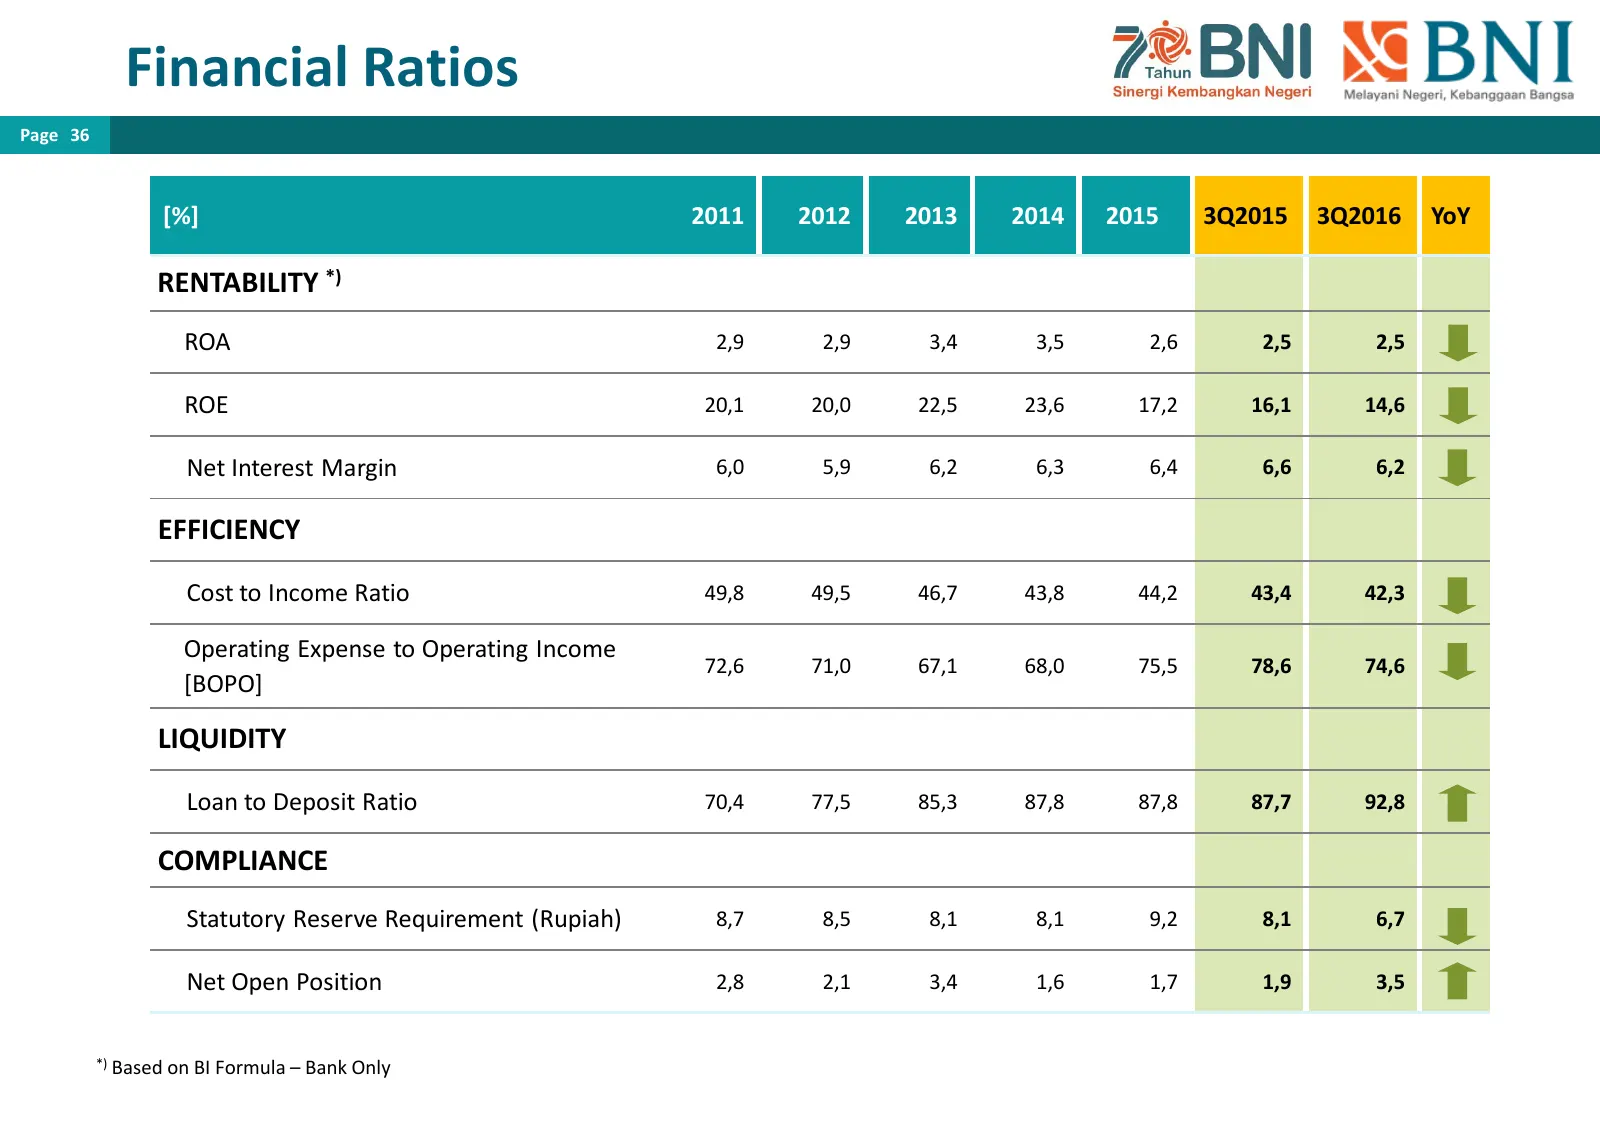
Financial Ratios Page 36 [%] 2011 2012 2013 2014 2015 3Q2015 3Q2016 YoY RENTABILITY *) ROA 2,9 2,9 3,4 3,5 2,6 2,5 2,5 ROE 20,1 20,0 22,5 23,6 17,2 16,1 14,6 Net Interest Margin 6,0 5,9 6,2 6,3 6,4 6,6 6,2 EFFICIENCY Cost to Income Ratio 49,8 49,5 46,7 43,8 44,2 43,4 42,3 Operating Expense to Operat
Slide 37: Thank You
PT. BANK NEGARA INDONESIA (PERSERO) TBK THANK YOU Disclaimer: This report has been prepared by PT Bank Negara Indonesia (Persero) Tbk (Bank BNI) independently and is circulated for the purpose of general information only, It is not intended to the specific person who may receive this report, The inf
Source: Internet Archive copy of bni.co.id
More decks from PT Bank Negara Indonesia (Persero) Tbk Class B
 Q1 2025 Earnings Presentation68 slides · Apr 28, 2025
 FY2024 Earnings Presentation71 slides · Jan 22, 2025
 Q1 2024 Earnings Presentation72 slides · Apr 29, 2024
 Q3 2023 Earnings Presentation74 slides · Oct 31, 2023
 Q1 2023 Earnings Presentation69 slides · May 18, 2023
 FY2022 Earnings Presentation69 slides · Jan 24, 2023