Ayala Land Inc. · PSE:ALI
Ayala Land — FY2004 Earnings Presentation
20 slides from Ayala Land's earnings presentation, Feb 15, 2005
Slide 1: Ayala Land, Inc. 2004 Unaudited Results Analysts' Briefing
Ayala Land, Inc. 2004 Unaudited Results Analysts' Briefing February 15, 2005
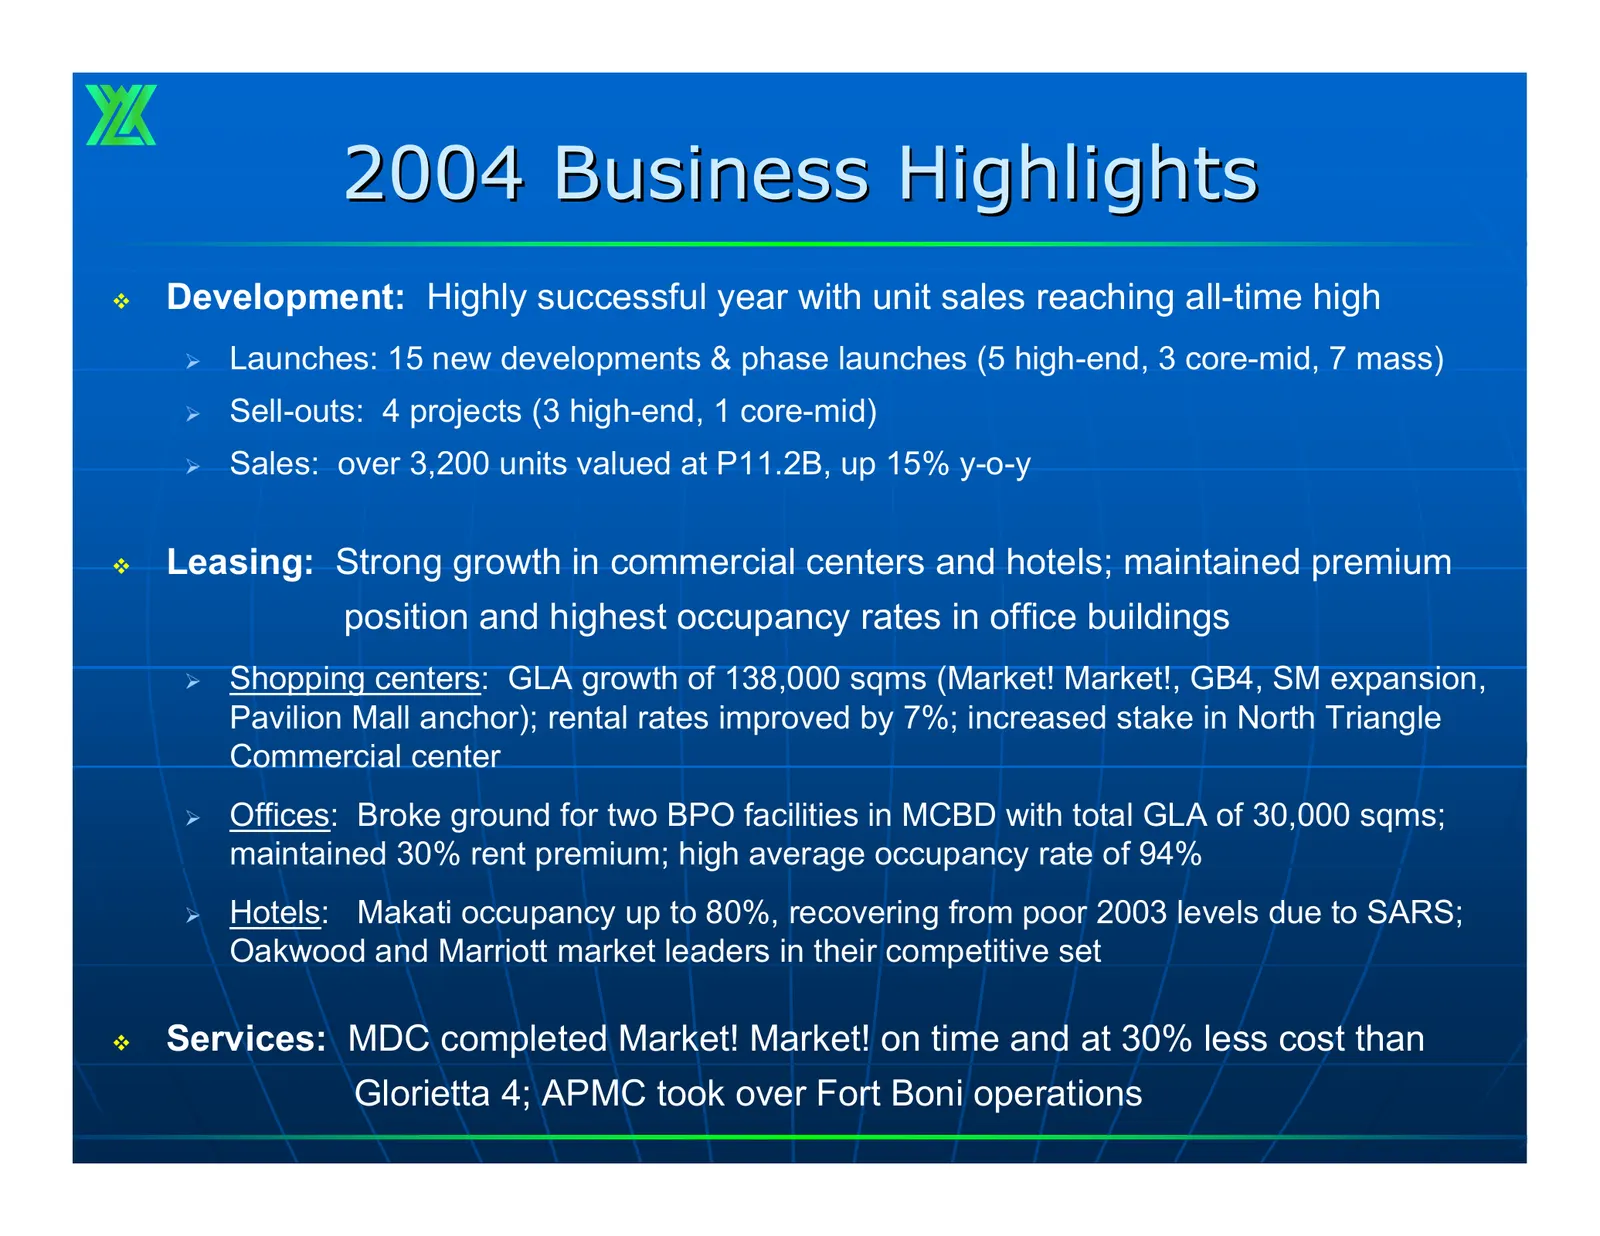
Slide 2: 2004 Business Highlights
2004 Business Highlights Development: Highly successful year with unit sales reaching all-time high ¾ Launches: 15 new developments & phase launches (5 high-end, 3 core-mid, 7 mass) ¾ Sell-outs: 4 projects (3 high-end, 1 core-mid) ¾ Sales: over 3,200 units valued at P11.2B, up 15% y-o-y Leasing:
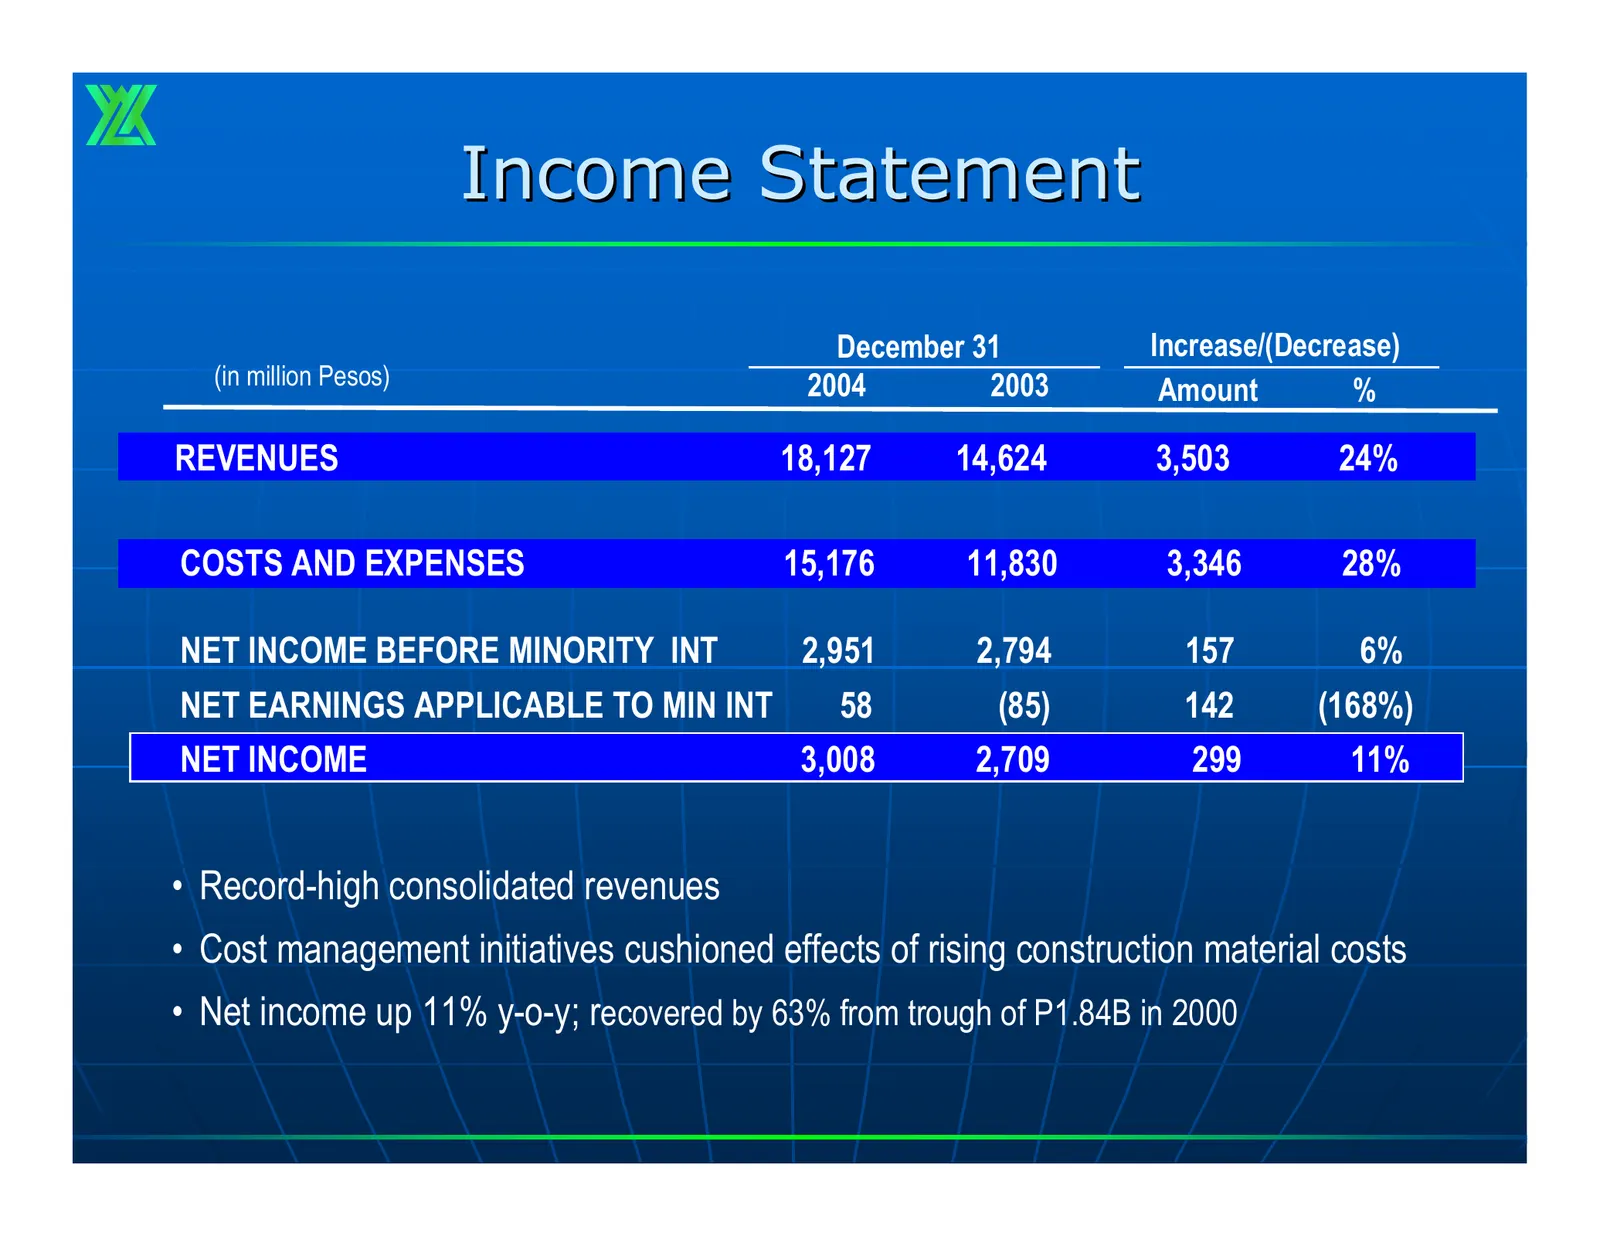
Slide 3: Income Statement
Income Statement December 31 Increase/(Decrease) (in million Pesos) 2004 2003 Amount % REVENUES 18,127 14,624 3,503 24% COSTS AND EXPENSES 15,176 11,830 3,346 28% NET INCOME BEFORE MINORITY INT 2,951 2,794 157 6% NET EARNINGS APPLICABLE TO MIN INT 58 (85) 142 (168%) NET INCOME 3,008 2,709 299 11% •
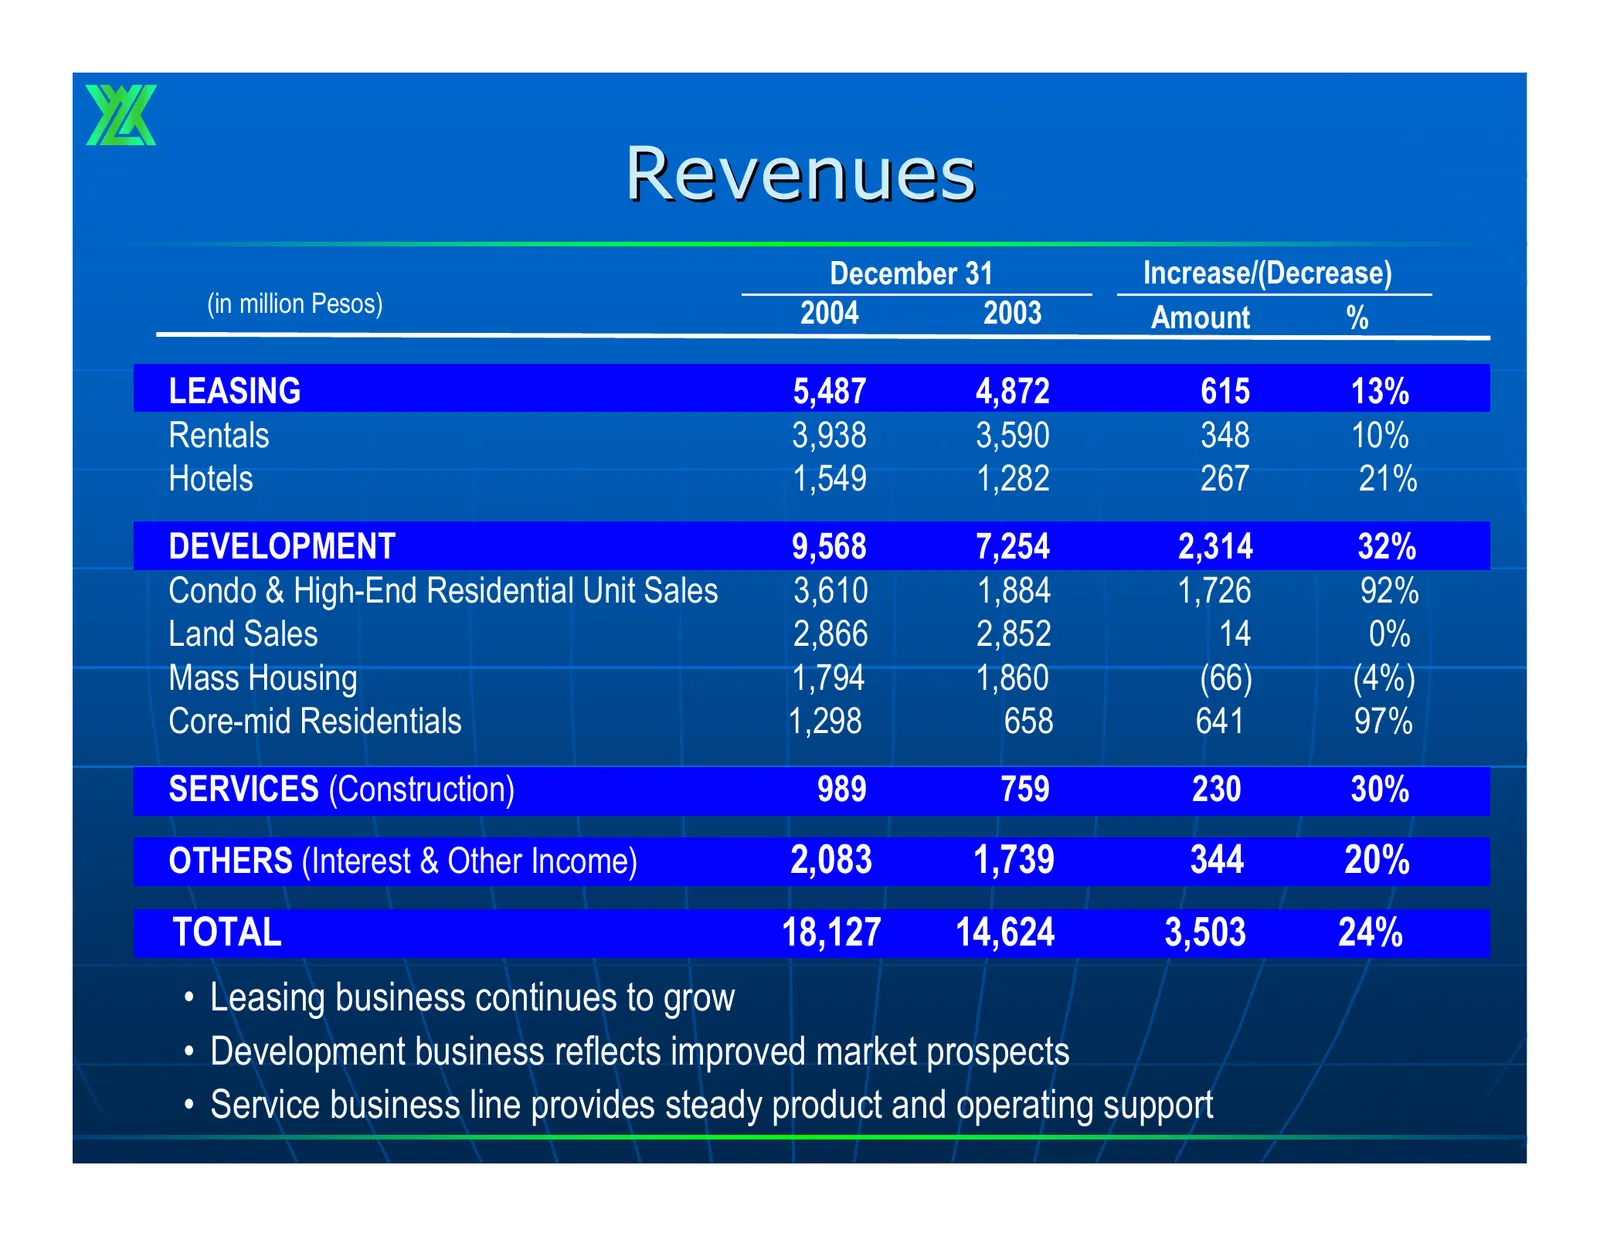
Slide 4: Revenues
Revenues December 31 Increase/(Decrease) (in million Pesos) 2004 2003 Amount % LEASING 5,487 4,872 615 13% Rentals 3,938 3,590 348 10% Hotels 1,549 1,282 267 21% DEVELOPMENT 9,568 7,254 2,314 32% Condo & High-End Residential Unit Sales 3,610 1,884 1,726 92% Land Sales 2,866 2,852 14 0% Mass Housing
Slide 5: Revenue Breakdown
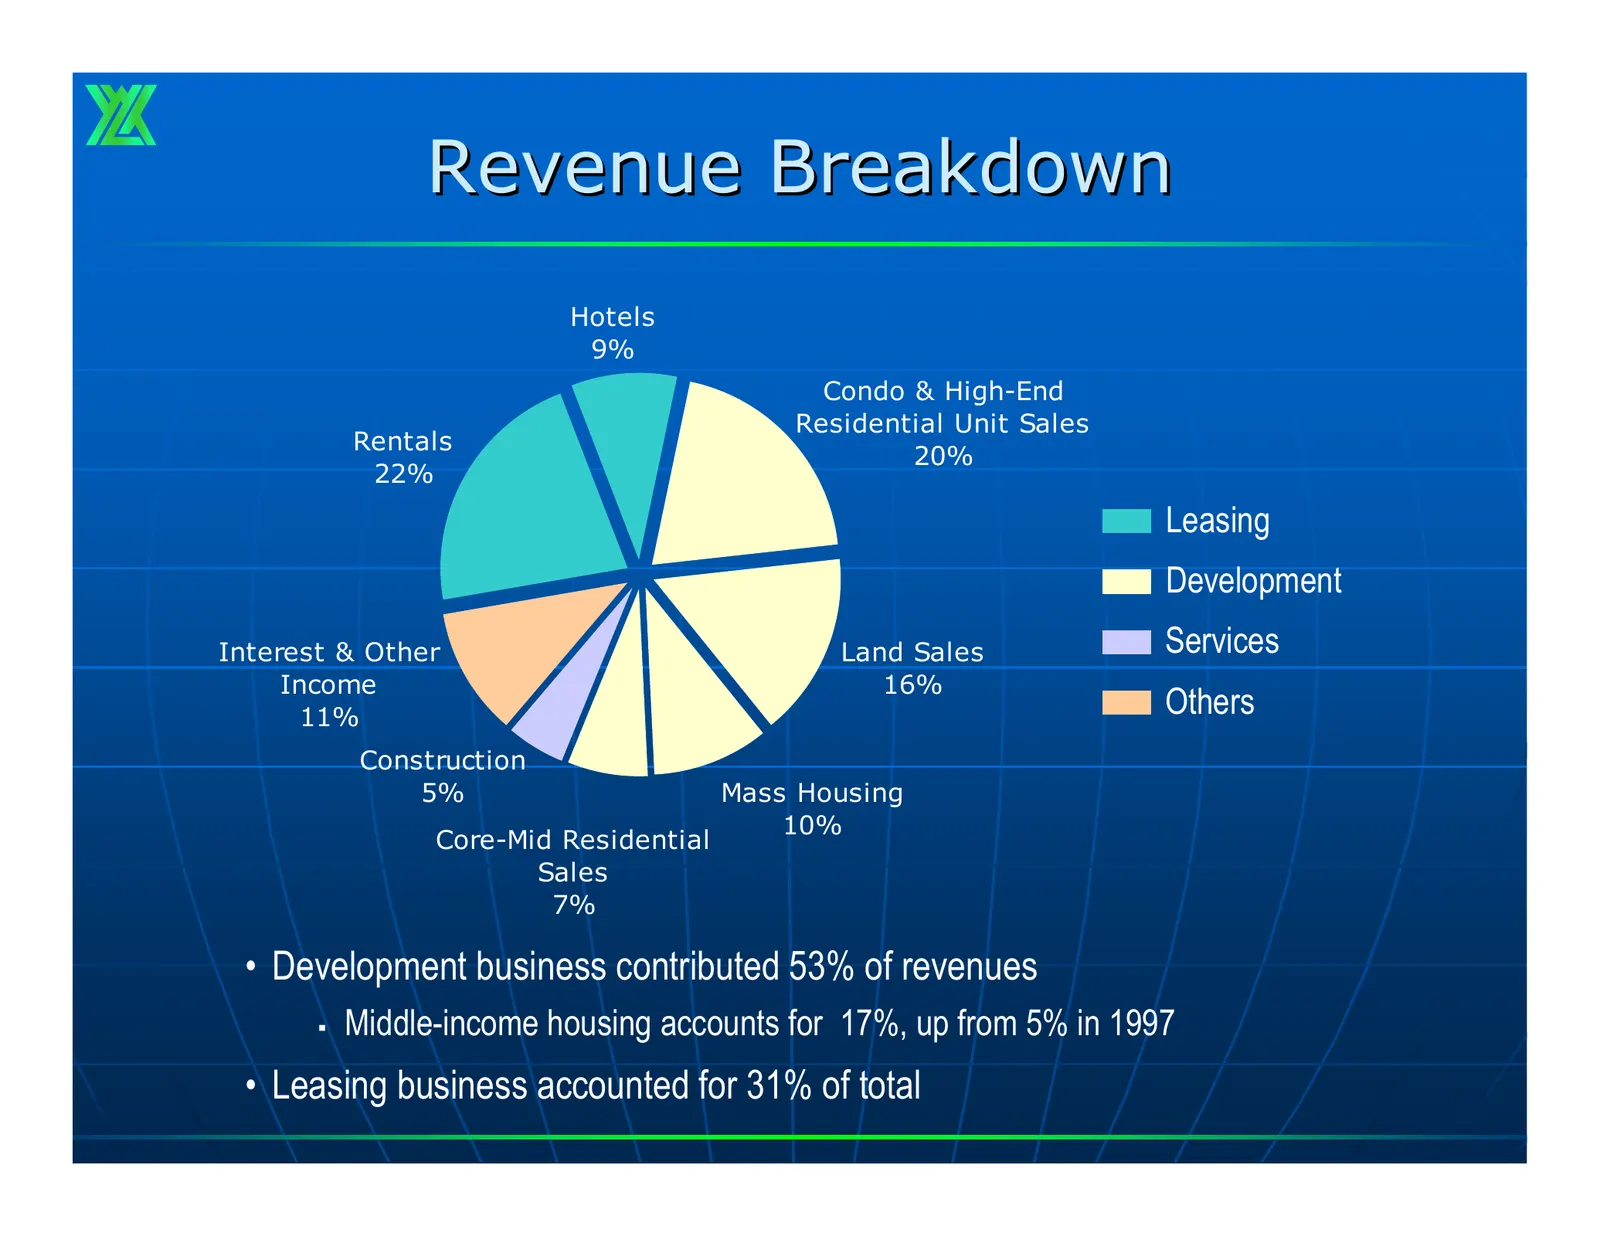
Revenue Breakdown Hotels 9% Condo & High-End Residential Unit Sales Rentals 20% 22% Leasing Development Interest & Other Land Sales Services Income 16% 11% Others Construction 5% Mass Housing 10% Core-Mid Residential Sales 7% • Development business contributed 53% of revenues Middle-income housing
Slide 6: Cost & Expenses
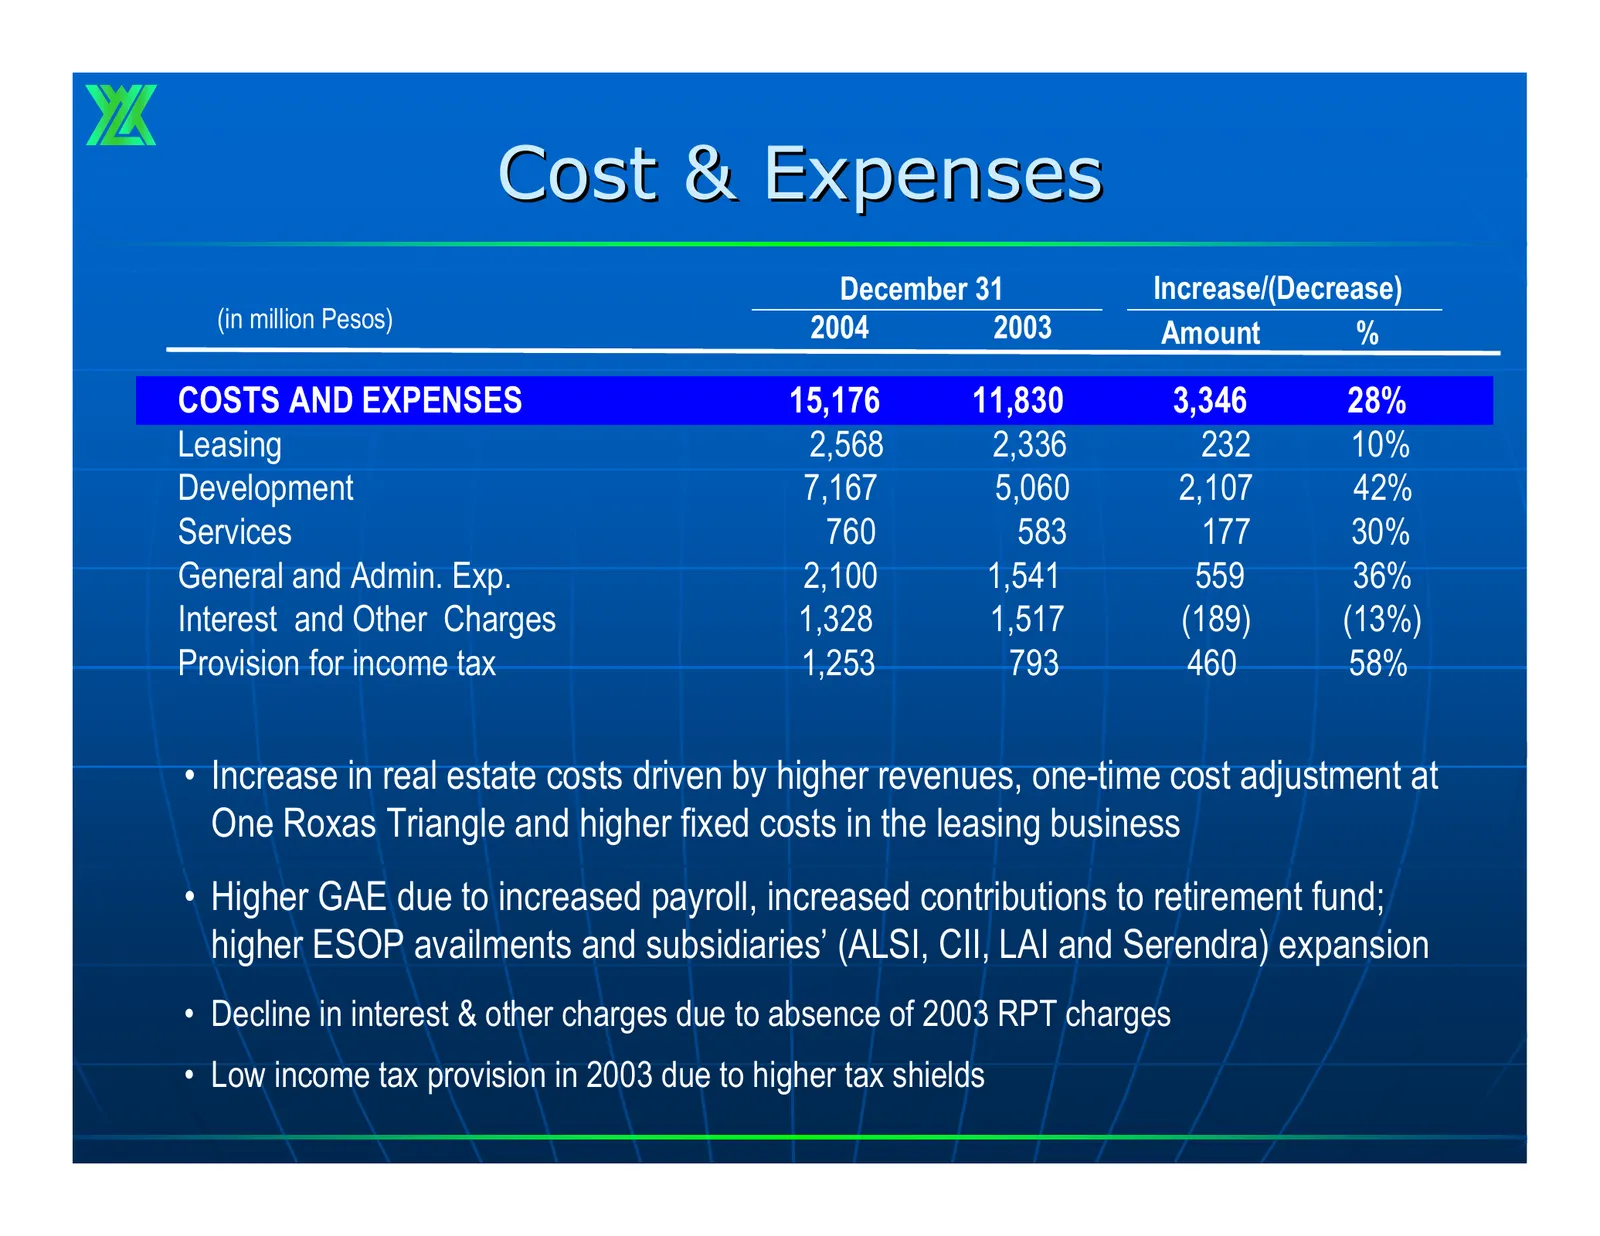
Cost & Expenses December 31 Increase/(Decrease) (in million Pesos) 2004 2003 Amount % COSTS AND EXPENSES 15,176 11,830 3,346 28% Leasing 2,568 2,336 232 10% Development 7,167 5,060 2,107 42% Services 760 583 177 30% General and Admin. Exp. 2,100 1,541 559 36% Interest and Other Charges 1,328 1,517 (
Slide 7: NOI Margins
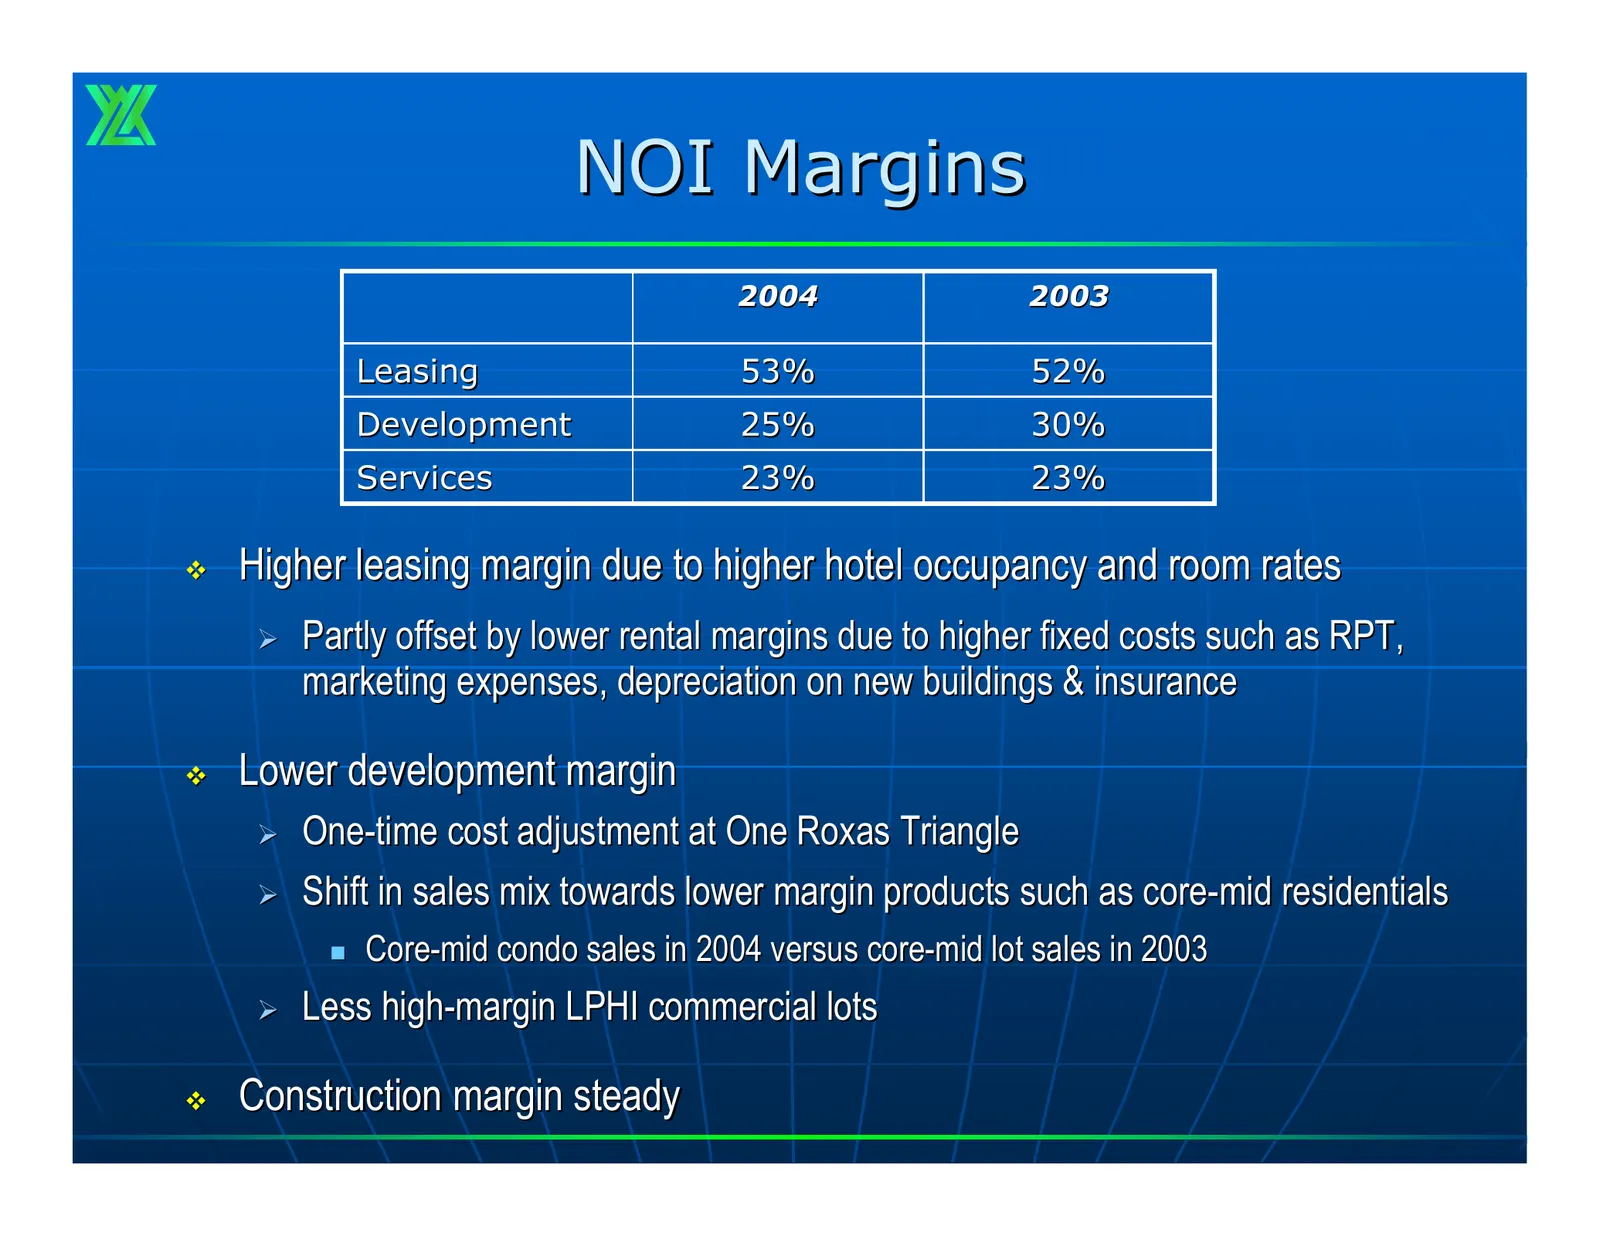
NOI Margins 2004 2003 Leasing 53% 52% Development 25% 30% Services 23% 23% Higher leasing margin due to higher hotel occupancy and room rates ¾ Partly offset by lower rental margins due to higher fixed costs such as RPT, marketing expenses, depreciation on new buildings & insurance Lower develop
Slide 8: Rentals
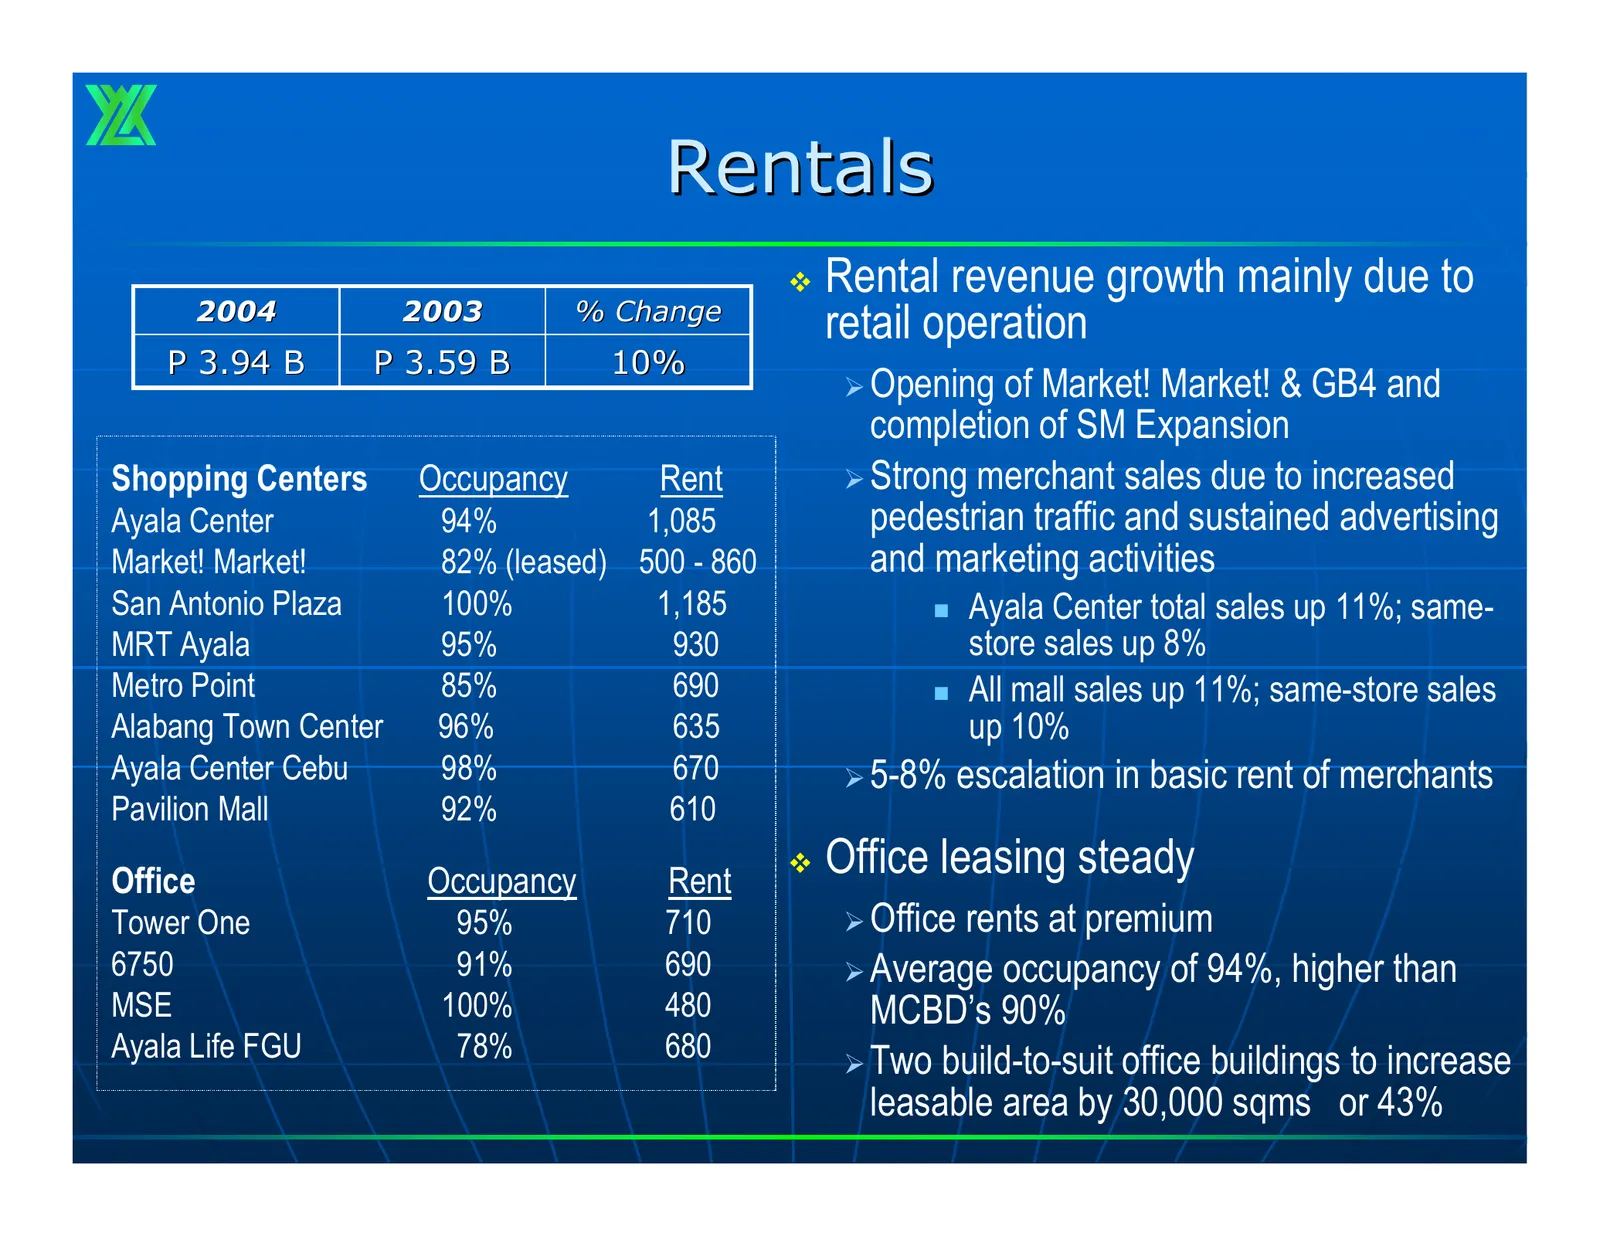
Rentals Rental revenue growth mainly due to 2004 2003 % Change retail operation P 3.94 B P 3.59 B 10% ¾ Opening of Market! Market! & GB4 and completion of SM Expansion Shopping Centers Occupancy Rent ¾ Strong merchant sales due to increased Ayala Center 94% 1,085 pedestrian traffic and sustained a
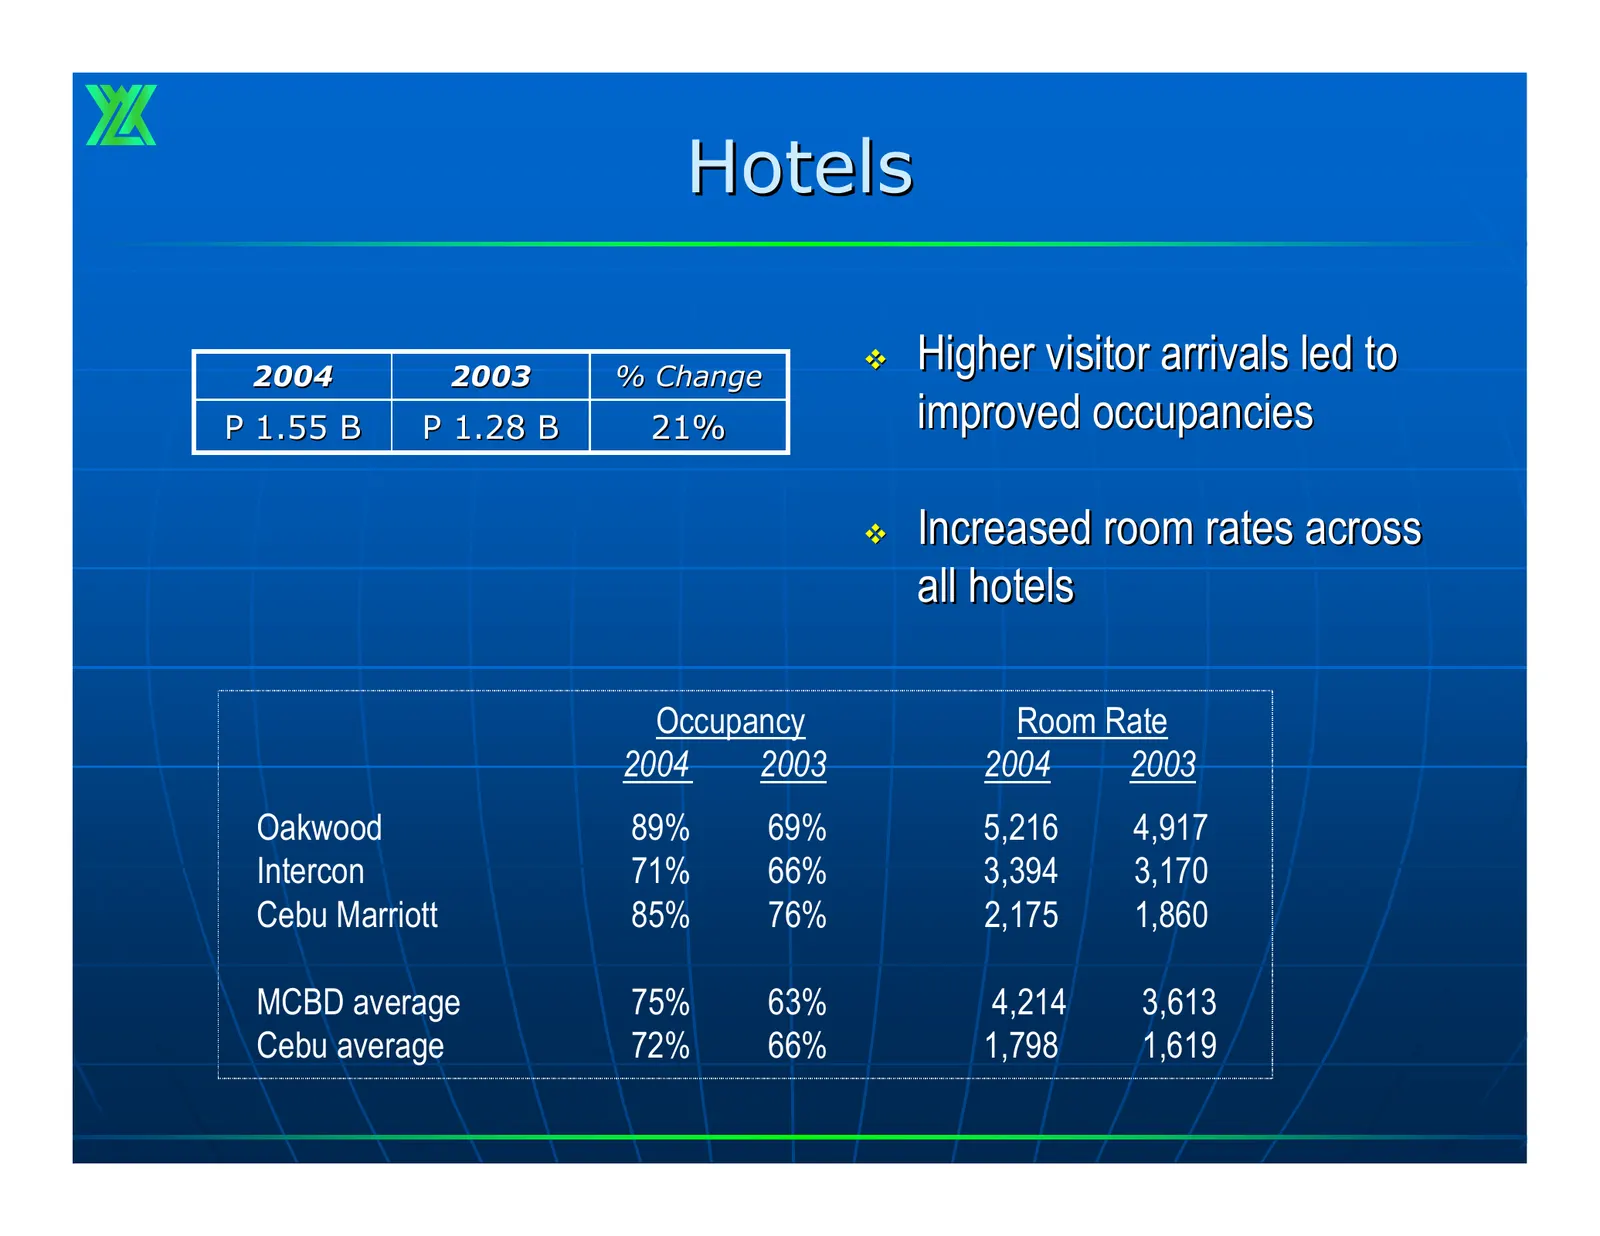
Slide 9: Hotels
Hotels 2004 2003 % Change Higher visitor arrivals led to P 1.55 B P 1.28 B 21% improved occupancies Increased room rates across all hotels Occupancy Room Rate 2004 2003 2004 2003 Oakwood 89% 69% 5,216 4,917 Intercon 71% 66% 3,394 3,170 Cebu Marriott 85% 76% 2,175 1,860 MCBD average 75% 63% 4,214
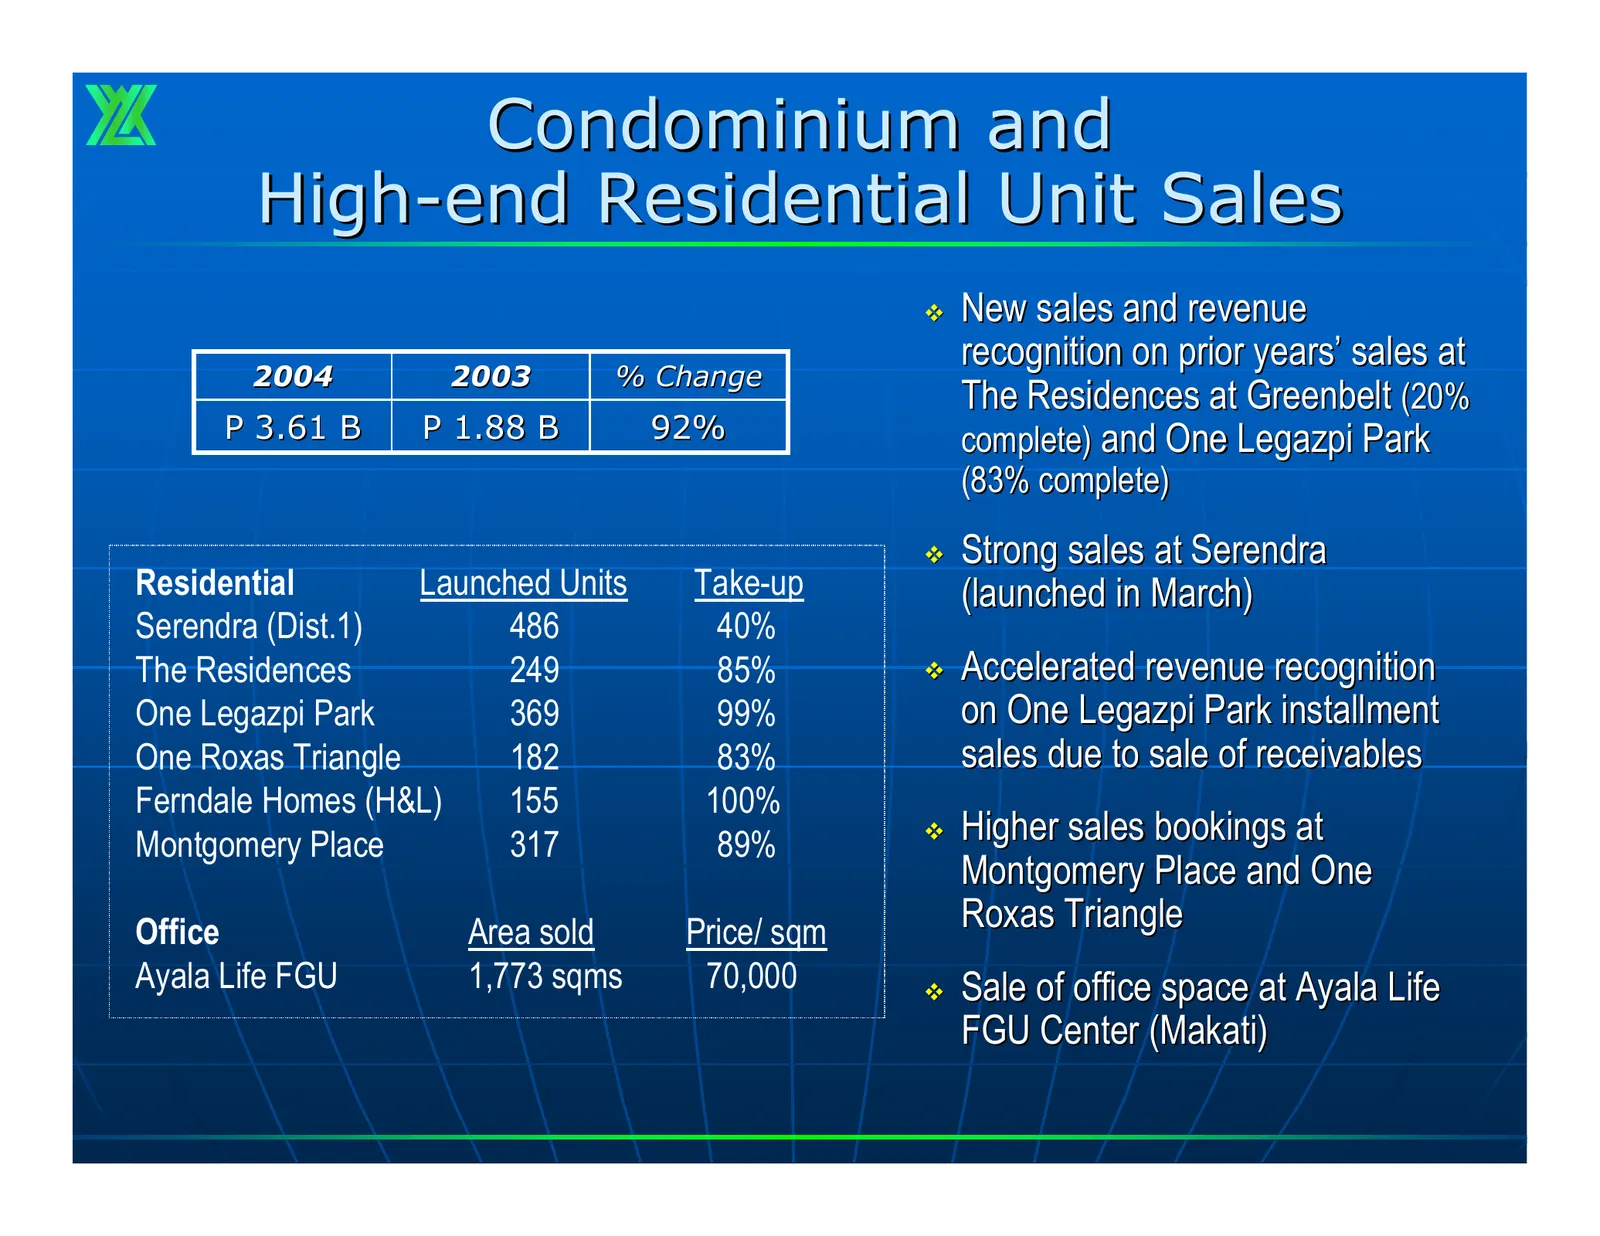
Slide 10: Condominium and High-end Residential Unit Sales
Condominium and High-end Residential Unit Sales New sales and revenue recognition on prior years’ sales at 2004 2003 % Change The Residences at Greenbelt (20% P 3.61 B P 1.88 B 92% complete) and One Legazpi Park (83% complete) Strong sales at Serendra Residential Launched Units Take-up (launched
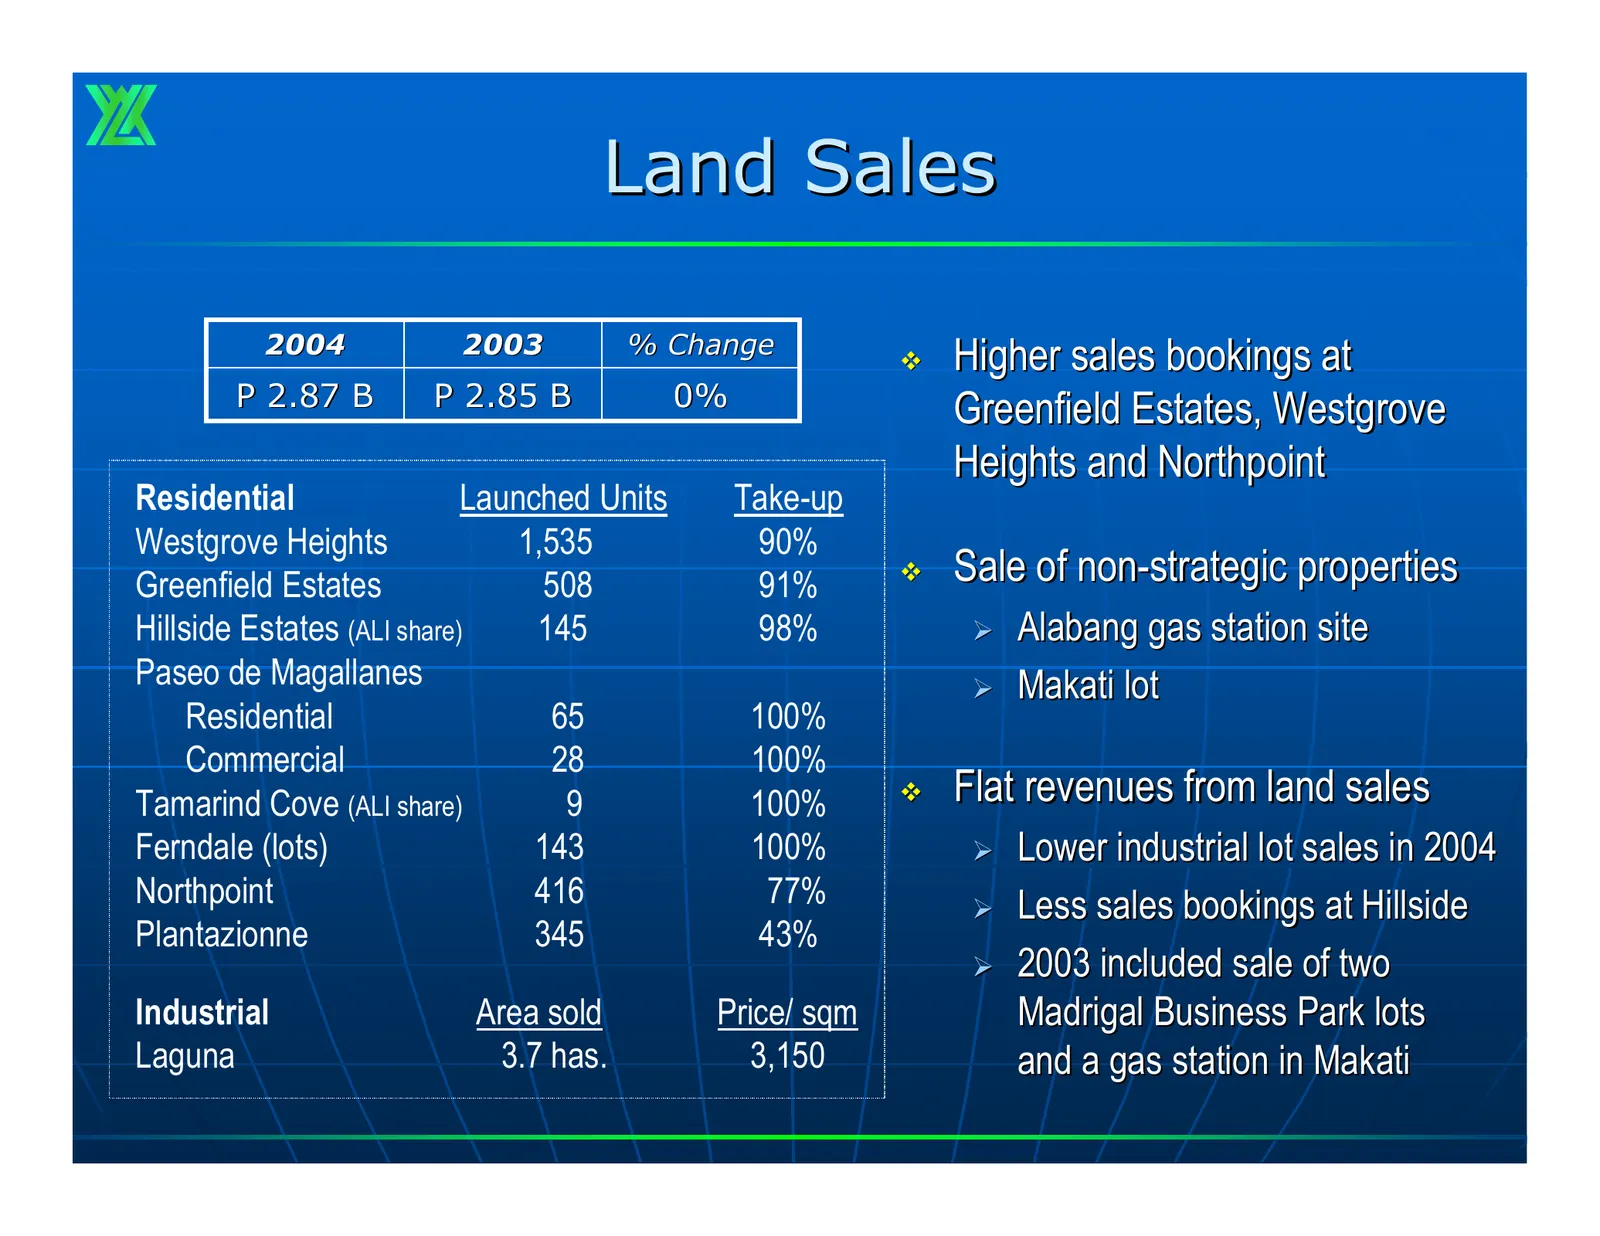
Slide 11: Land Sales
Land Sales 2004 2003 % Change Higher sales bookings at P 2.87 B P 2.85 B 0% Greenfield Estates, Westgrove Heights and Northpoint Residential Launched Units Take-up Westgrove Heights 1,535 90% Greenfield Estates 508 91% Sale of non-strategic properties Hillside Estates (ALI share) 145 98% ¾ Alaba
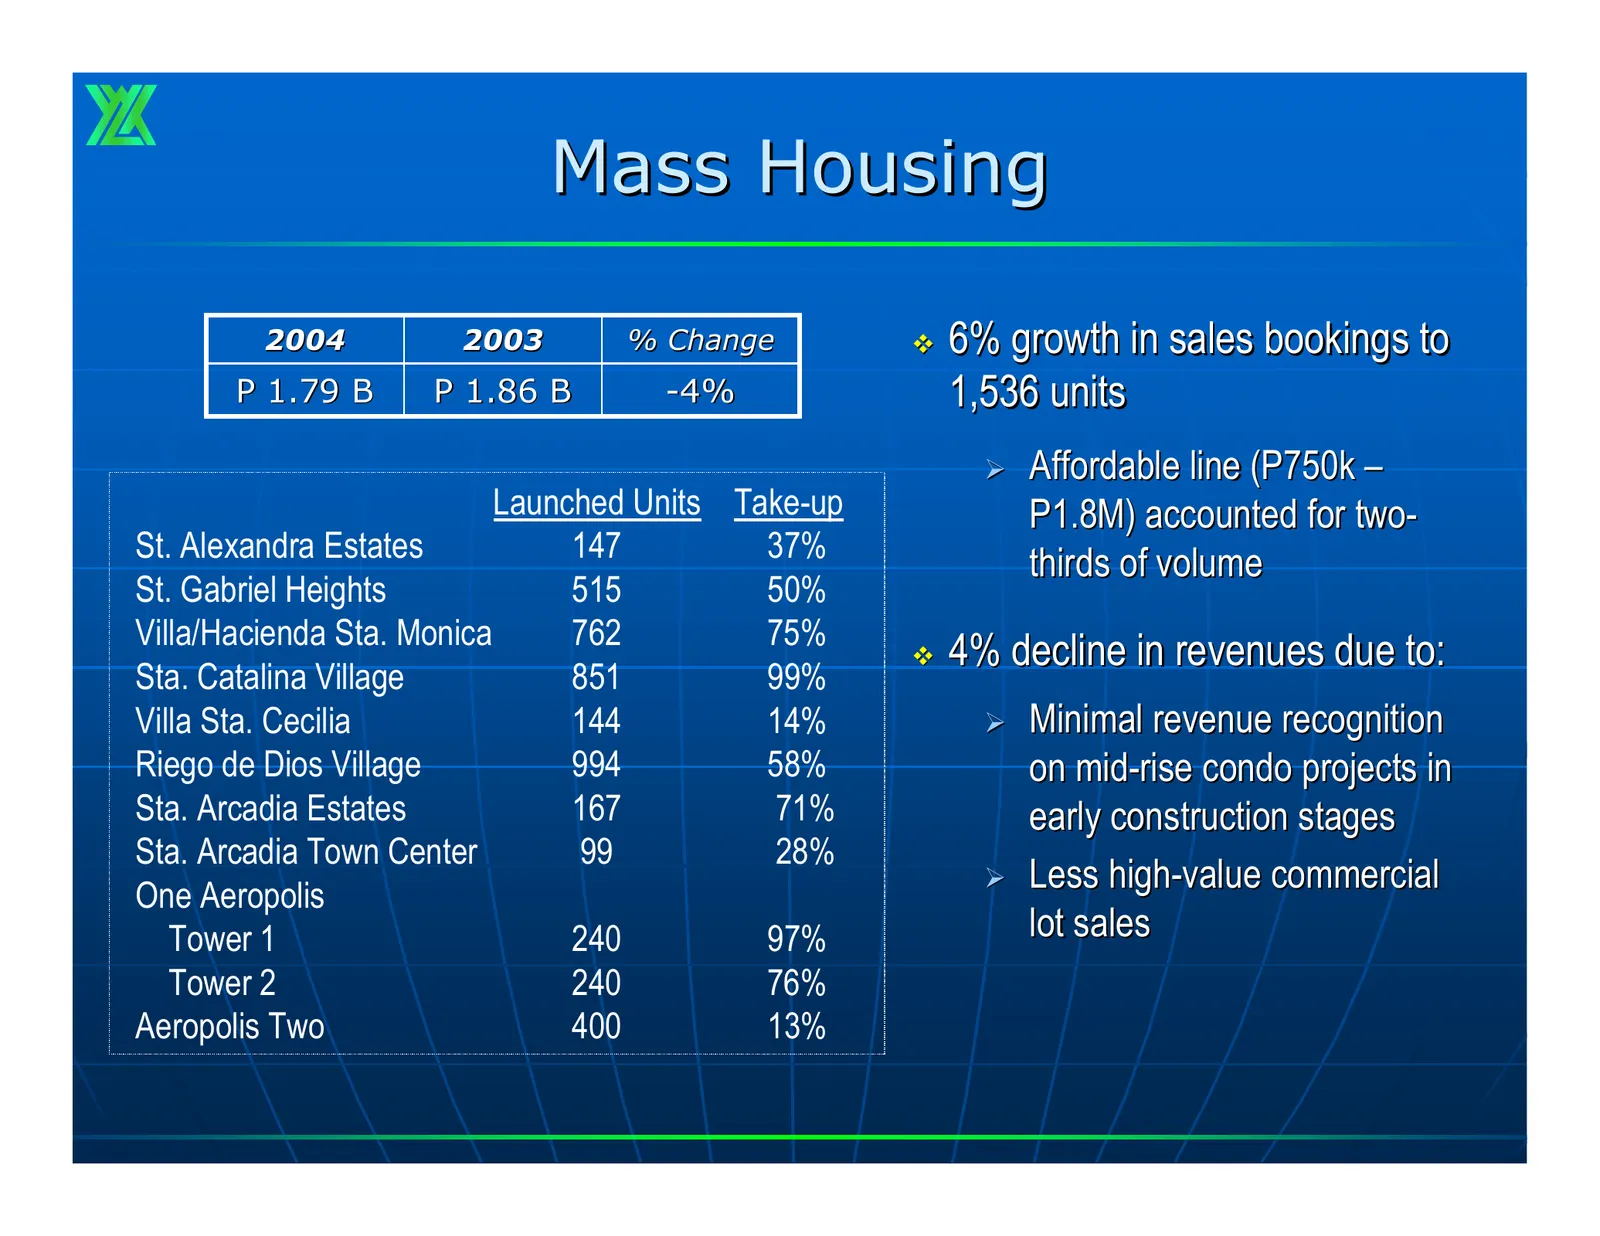
Slide 12: Mass Housing
Mass Housing 2004 2003 % Change 6% growth in sales bookings to P 1.79 B P 1.86 B -4% 1,536 units ¾ Affordable line (P750k – Launched Units Take-up P1.8M) accounted for two- St. Alexandra Estates 147 37% thirds of volume St. Gabriel Heights 515 50% Villa/Hacienda Sta. Monica 762 75% 4% decline in
Slide 13: Core-Mid Residentials
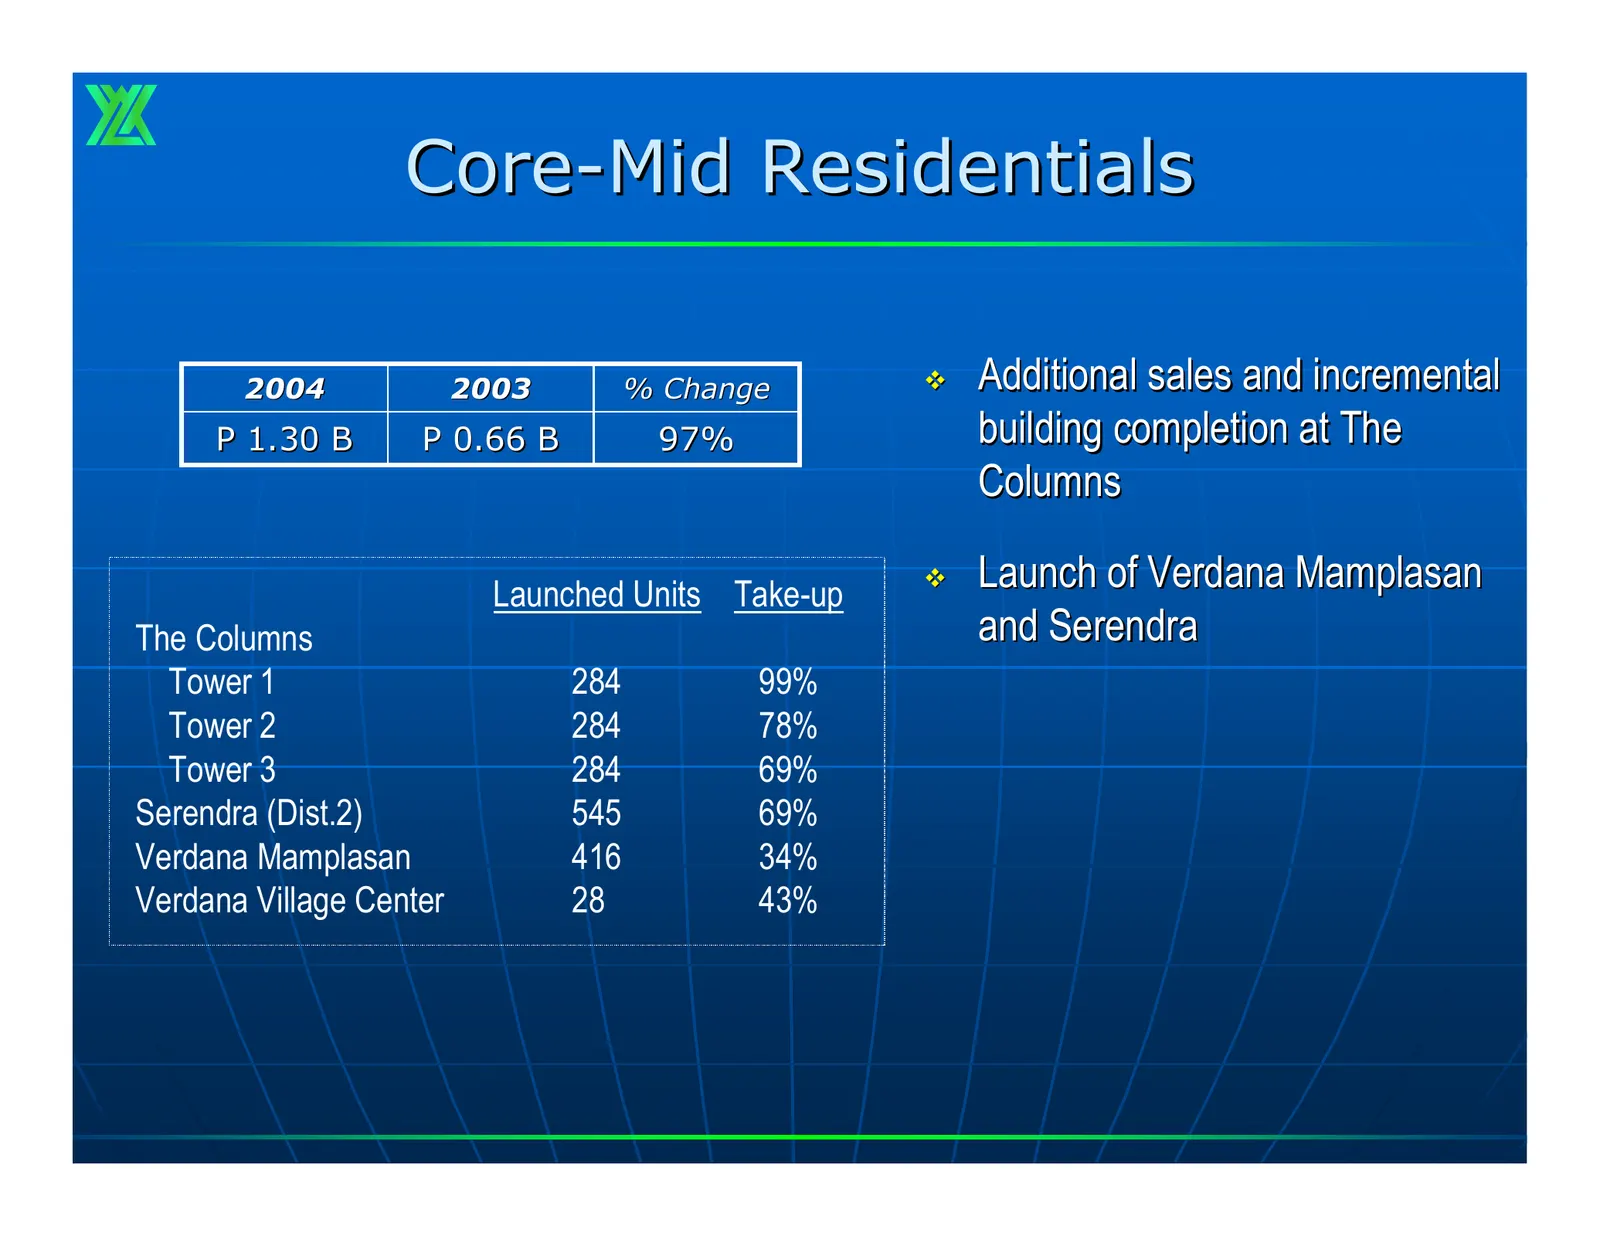
Core-Mid Residentials 2004 2003 % Change Additional sales and incremental P 1.30 B P 0.66 B 97% building completion at The Columns Launched Units Take-up Launch of Verdana Mamplasan The Columns and Serendra Tower 1 284 99% Tower 2 284 78% Tower 3 284 69% Serendra (Dist.2) 545 69% Verdana Mamplas
Slide 14: Construction
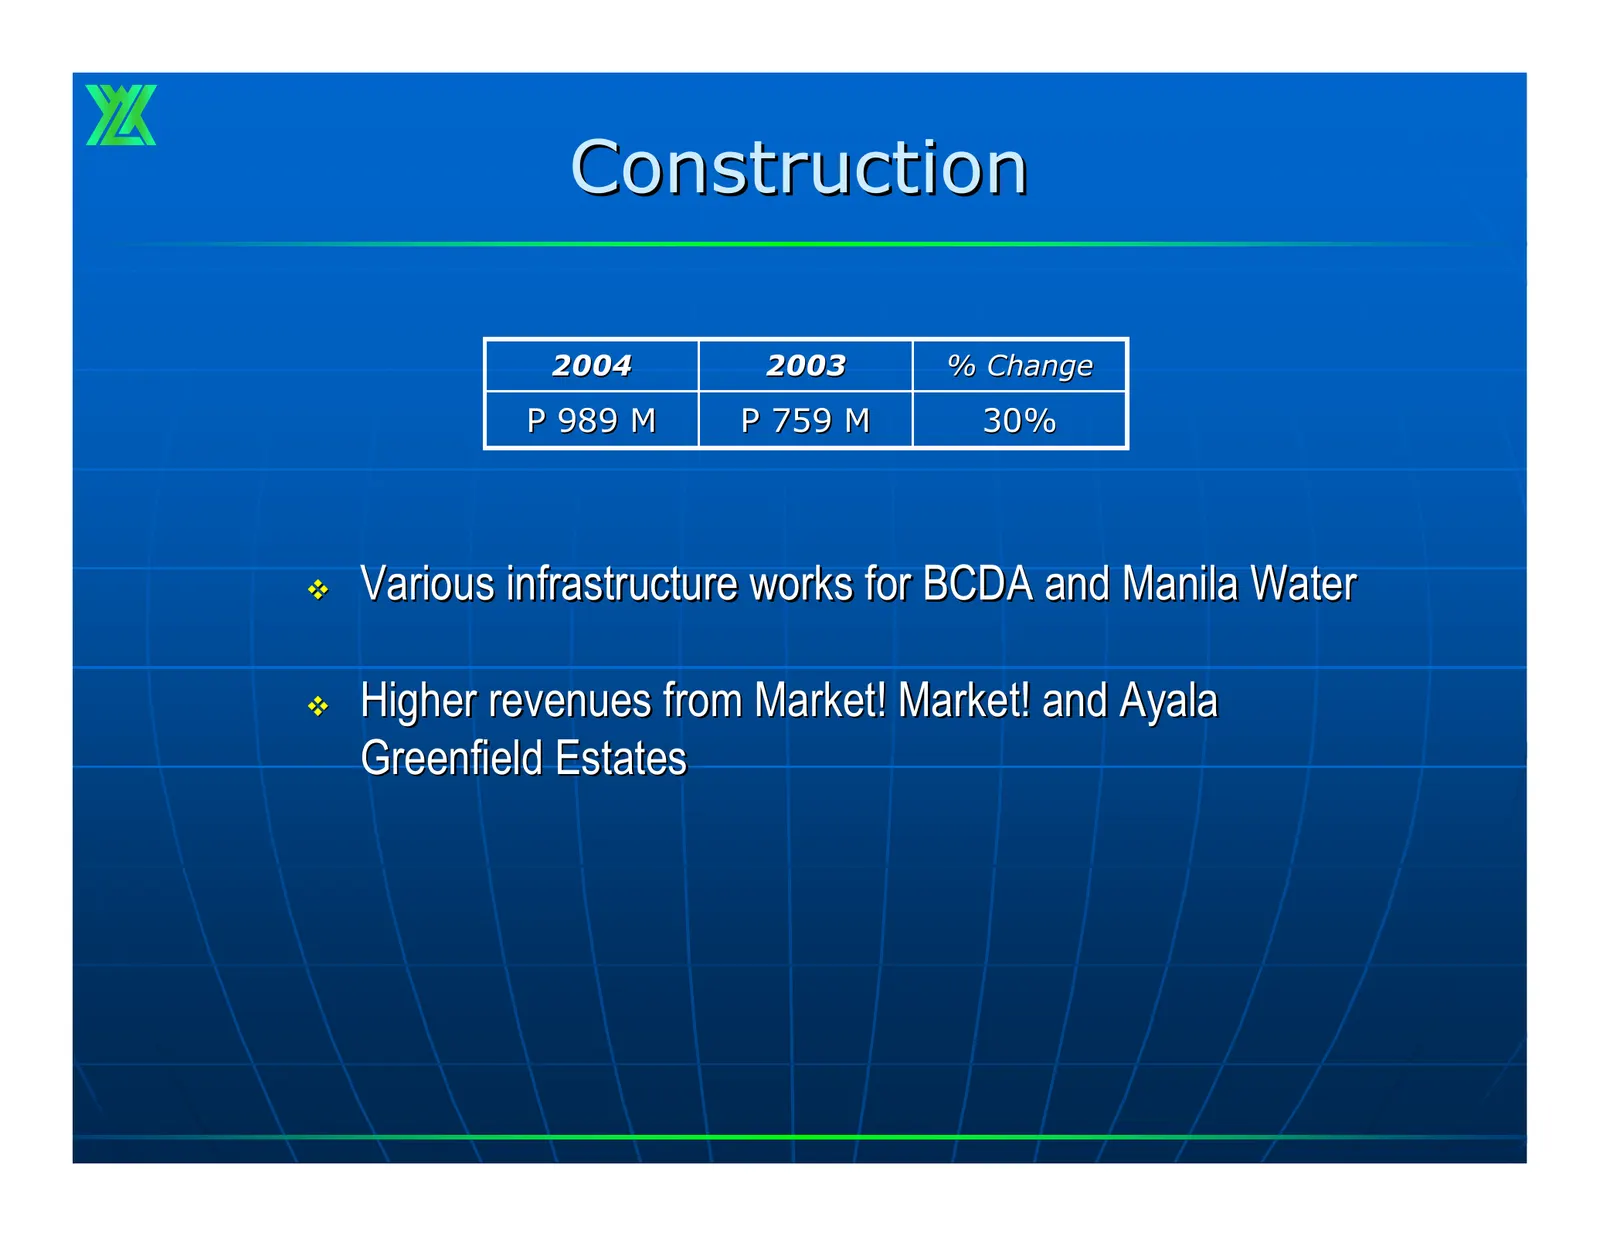
Construction 2004 2003 % Change P 989 M P 759 M 30% Various infrastructure works for BCDA and Manila Water Higher revenues from Market! Market! and Ayala Greenfield Estates
Slide 15: Interest & Other Income
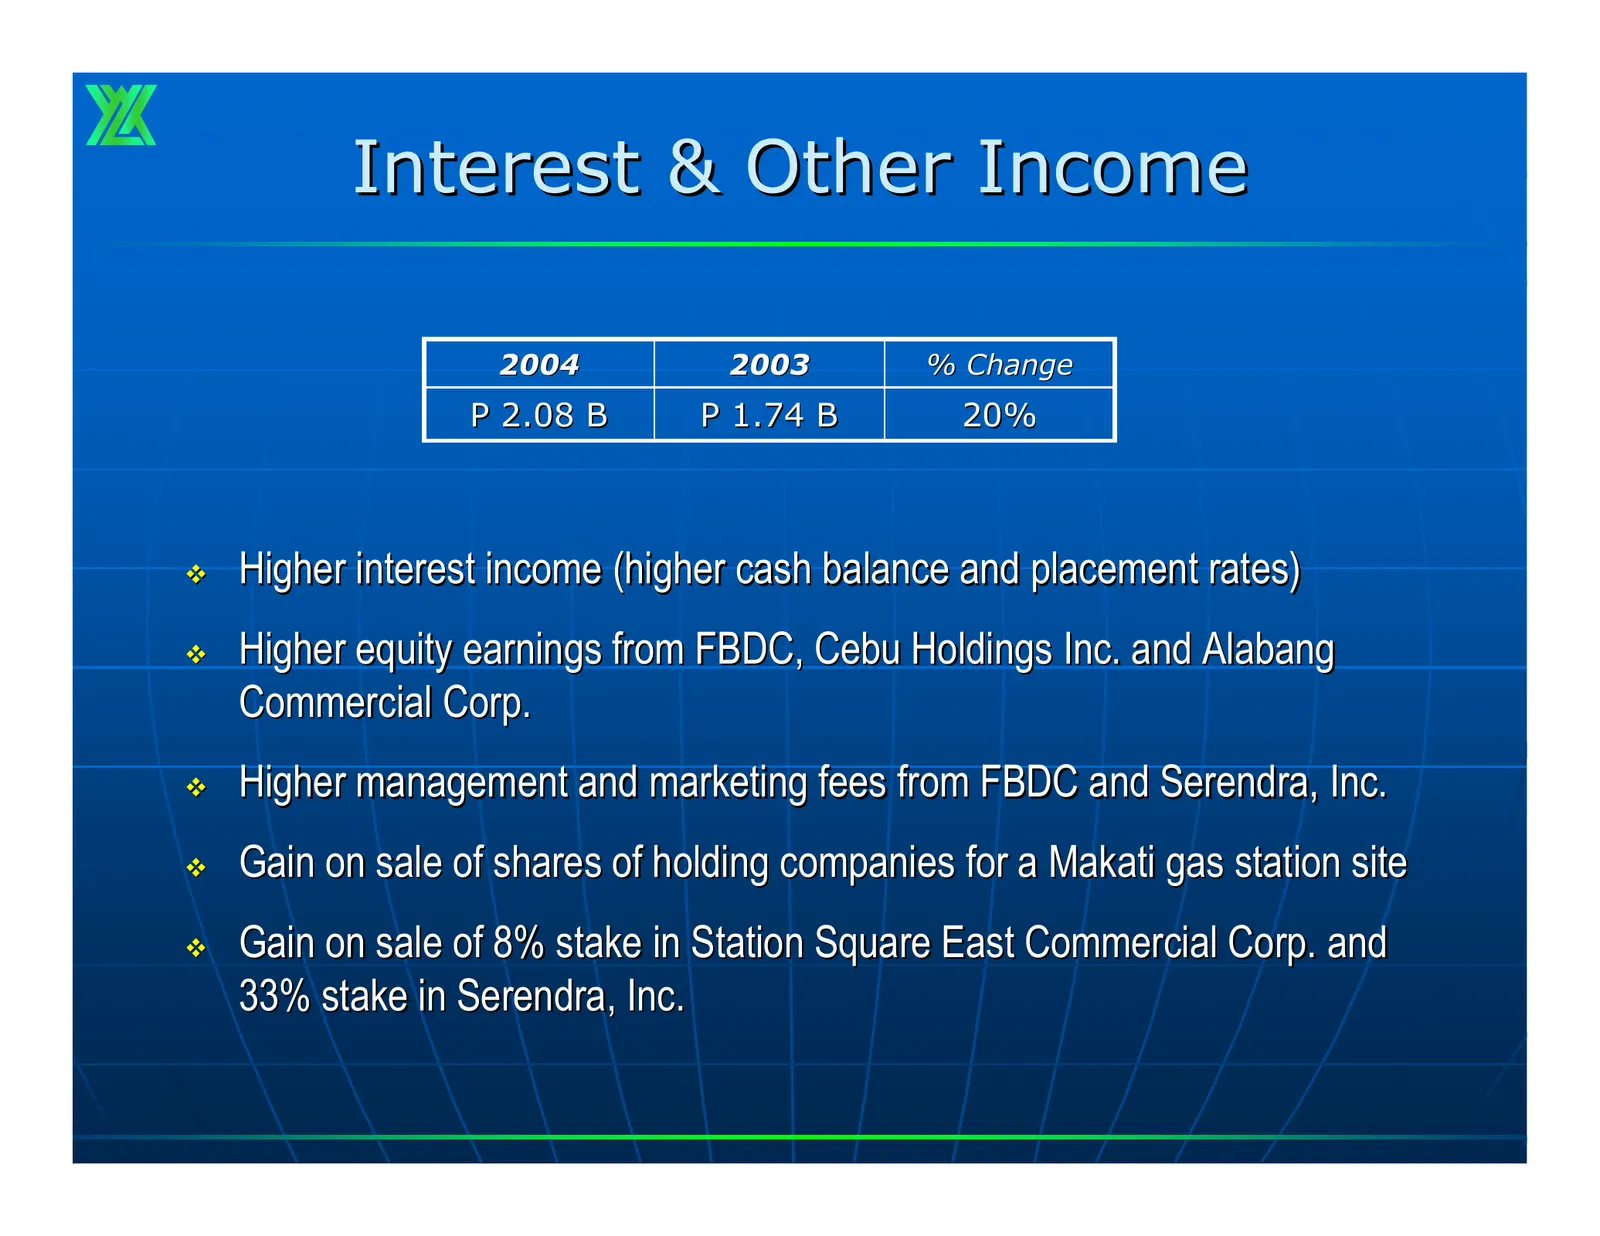
Interest & Other Income 2004 2003 % Change P 2.08 B P 1.74 B 20% Higher interest income (higher cash balance and placement rates) Higher equity earnings from FBDC, Cebu Holdings Inc. and Alabang Commercial Corp. Higher management and marketing fees from FBDC and Serendra, Inc. Gain on sale o
Slide 16: Balance Sheet
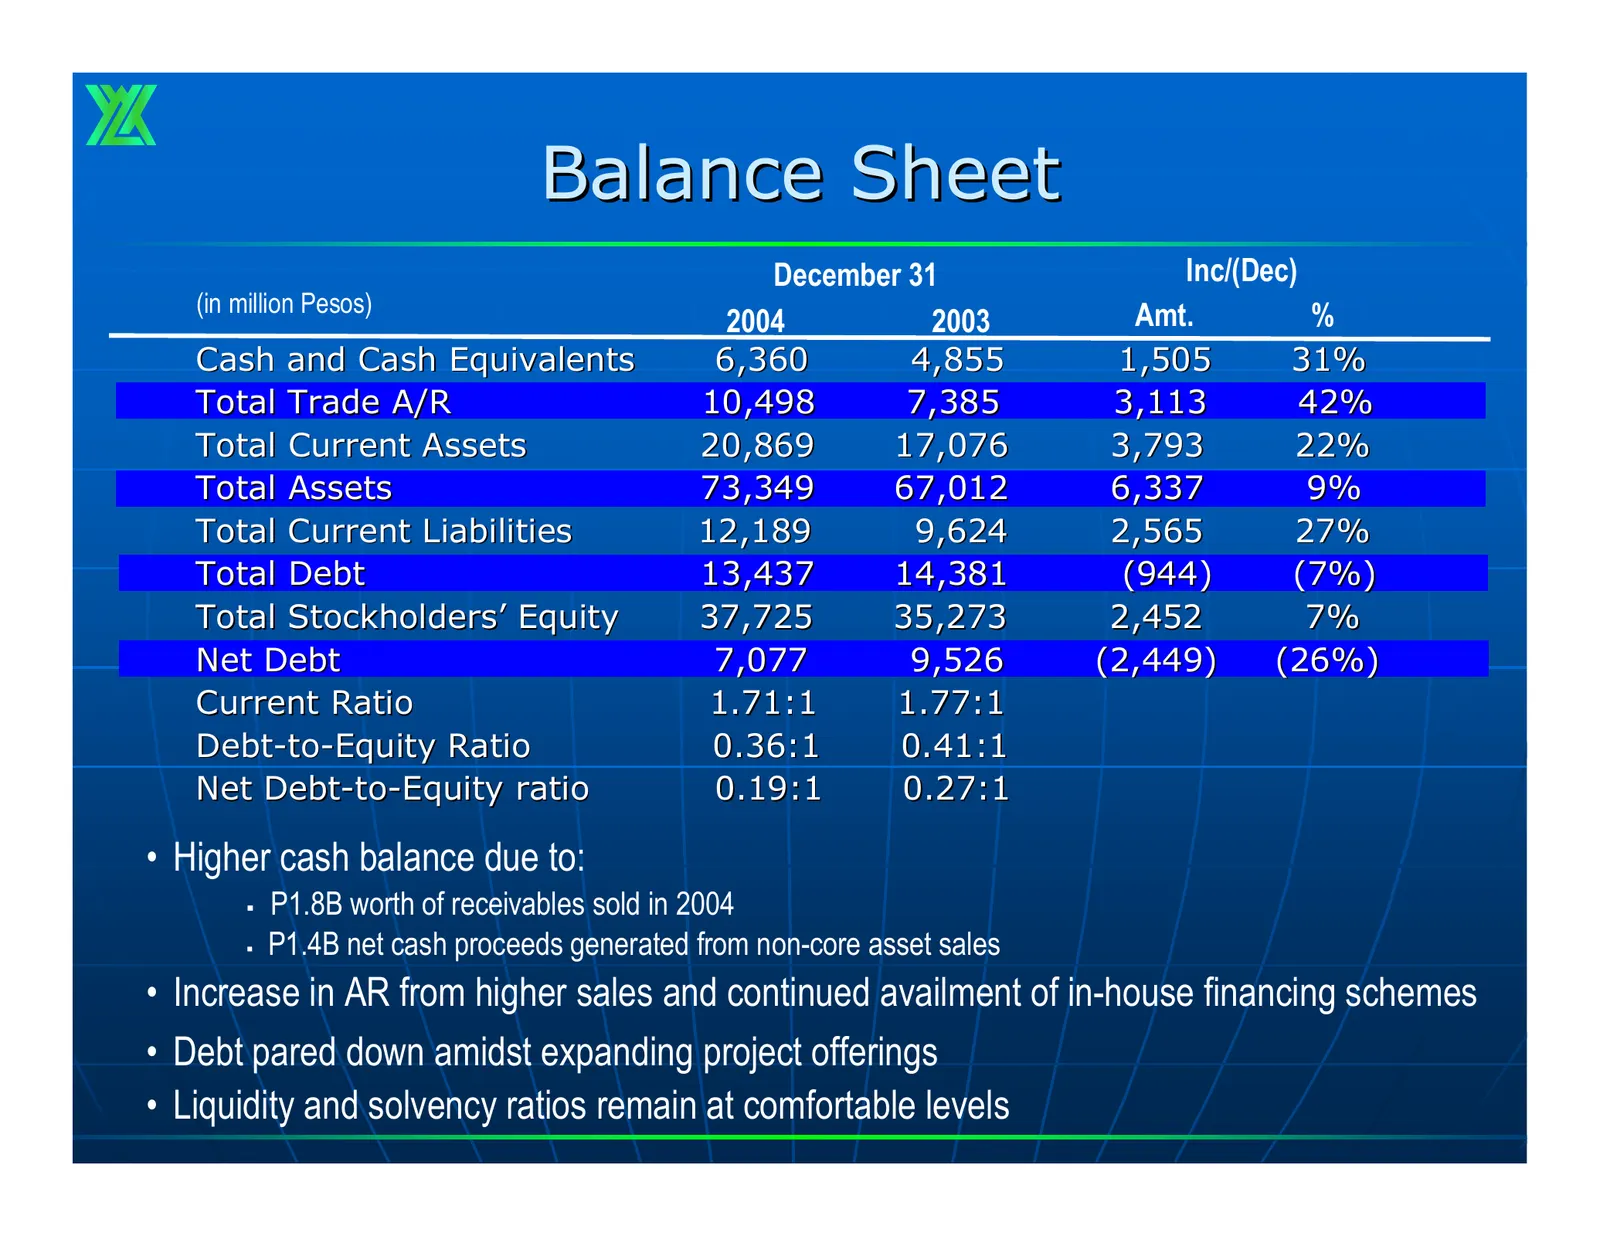
Balance Sheet December 31 Inc/(Dec) (in million Pesos) Amt. % 2004 2003 Cash and Cash Equivalents 6,360 4,855 1,505 31% Total Trade A/R 10,498 7,385 3,113 42% Total Current Assets 20,869 17,076 3,793 22% Total Assets 73,349 67,012 6,337 9% Total Current Liabilities 12,189 9,624 2,565 27% Total Debt
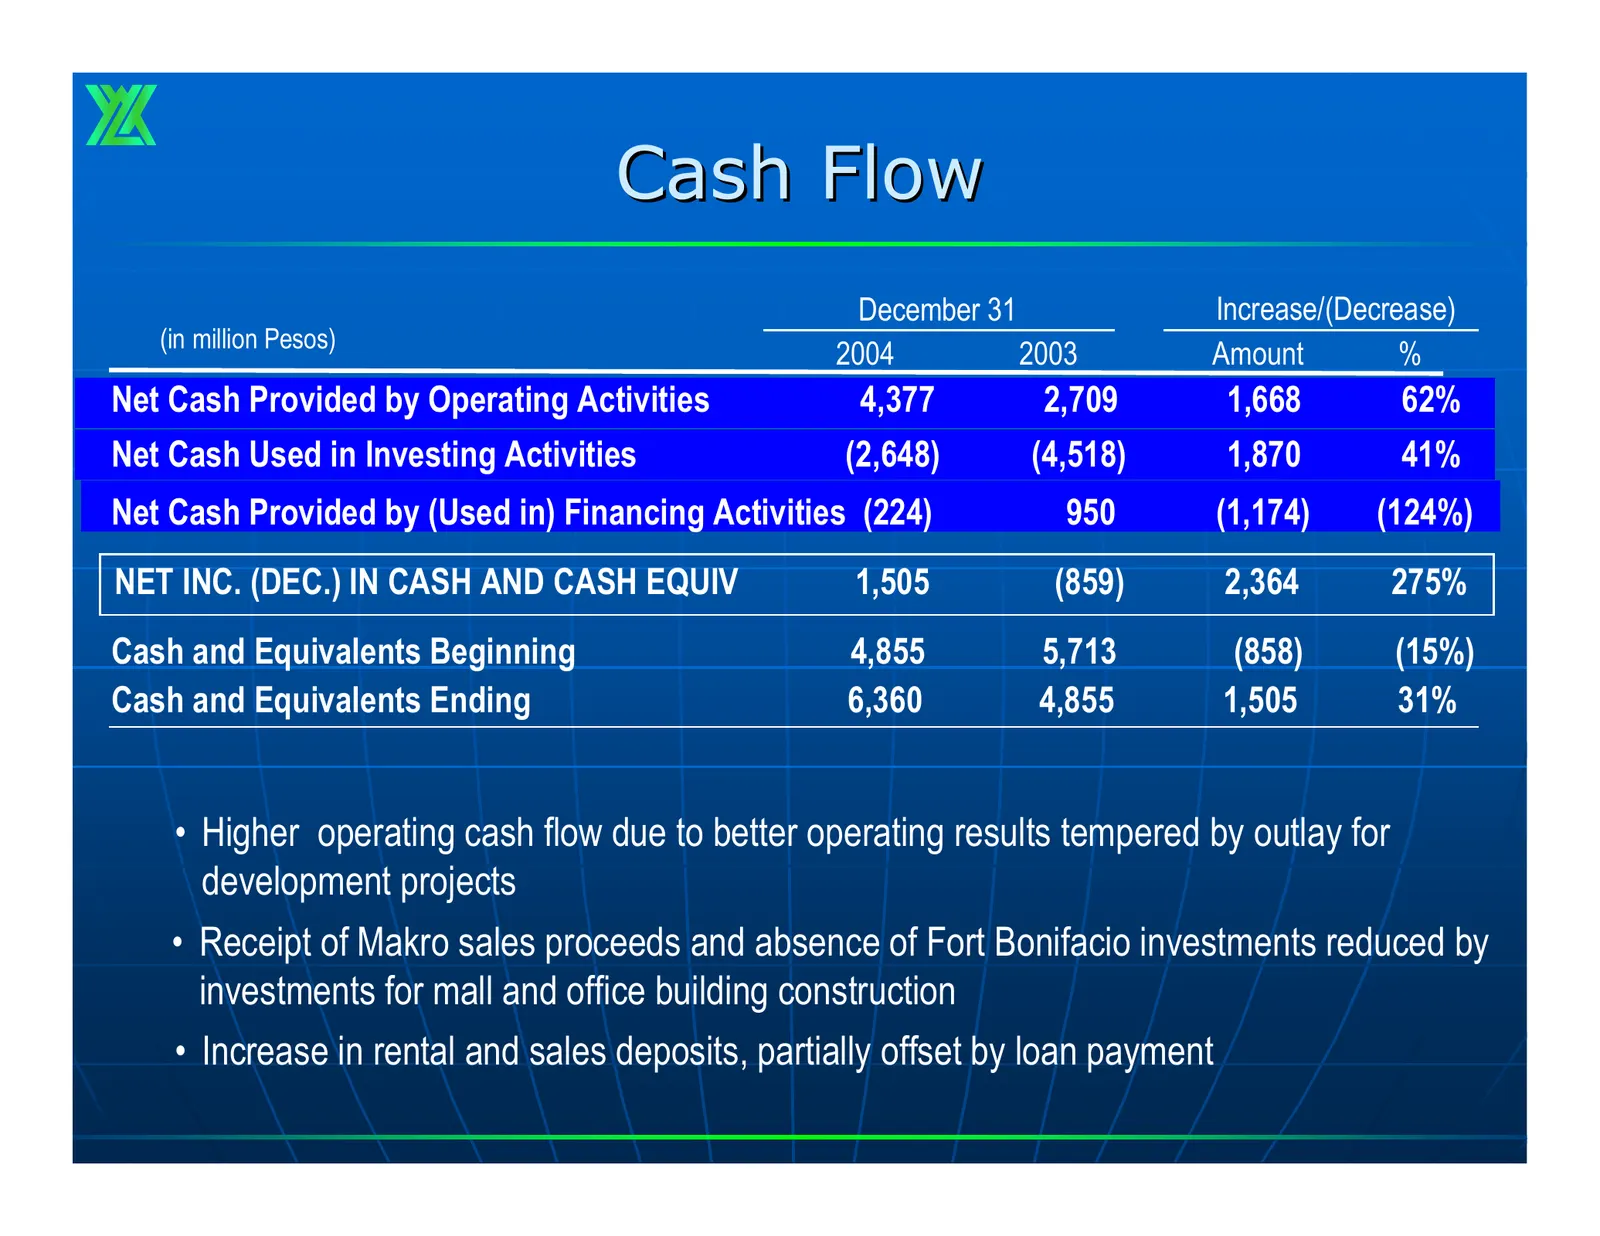
Slide 17: Cash Flow
Cash Flow December 31 Increase/(Decrease) (in million Pesos) 2004 2003 Amount % Net Cash Provided by Operating Activities 4,377 2,709 1,668 62% Net Cash Used in Investing Activities (2,648) (4,518) 1,870 41% Net Cash Provided by (Used in) Financing Activities (224) 950 (1,174) (124%) NET INC. (DEC.)
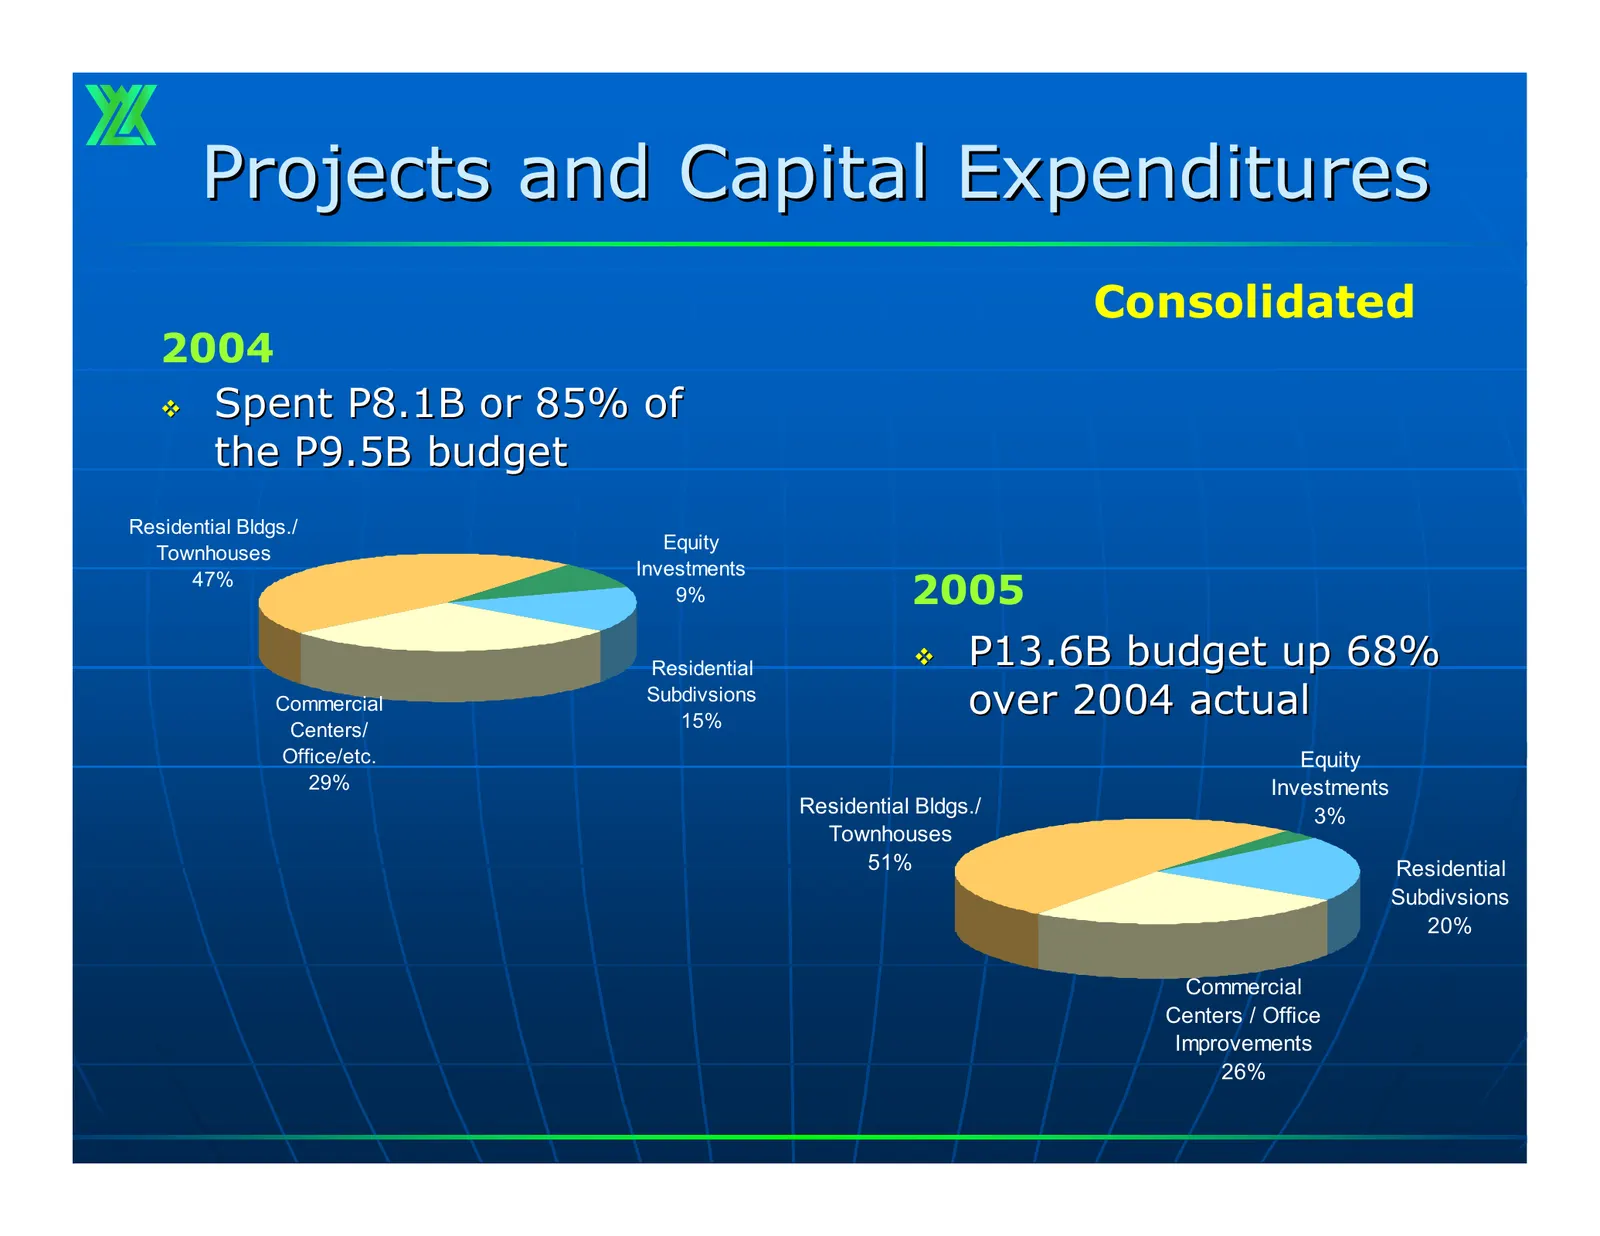
Slide 18: Projects and Capital Expenditures
Projects and Capital Expenditures Consolidated 2004 Spent P8.1B or 85% of the P9.5B budget Residential Bldgs./ Equity Townhouses Investments 47% 9% 2005 Residential P13.6B budget up 68% Commercial Subdivsions 15% over 2004 actual Centers/ Office/etc. Equity 29% Investments Residential Bldgs./ 3%
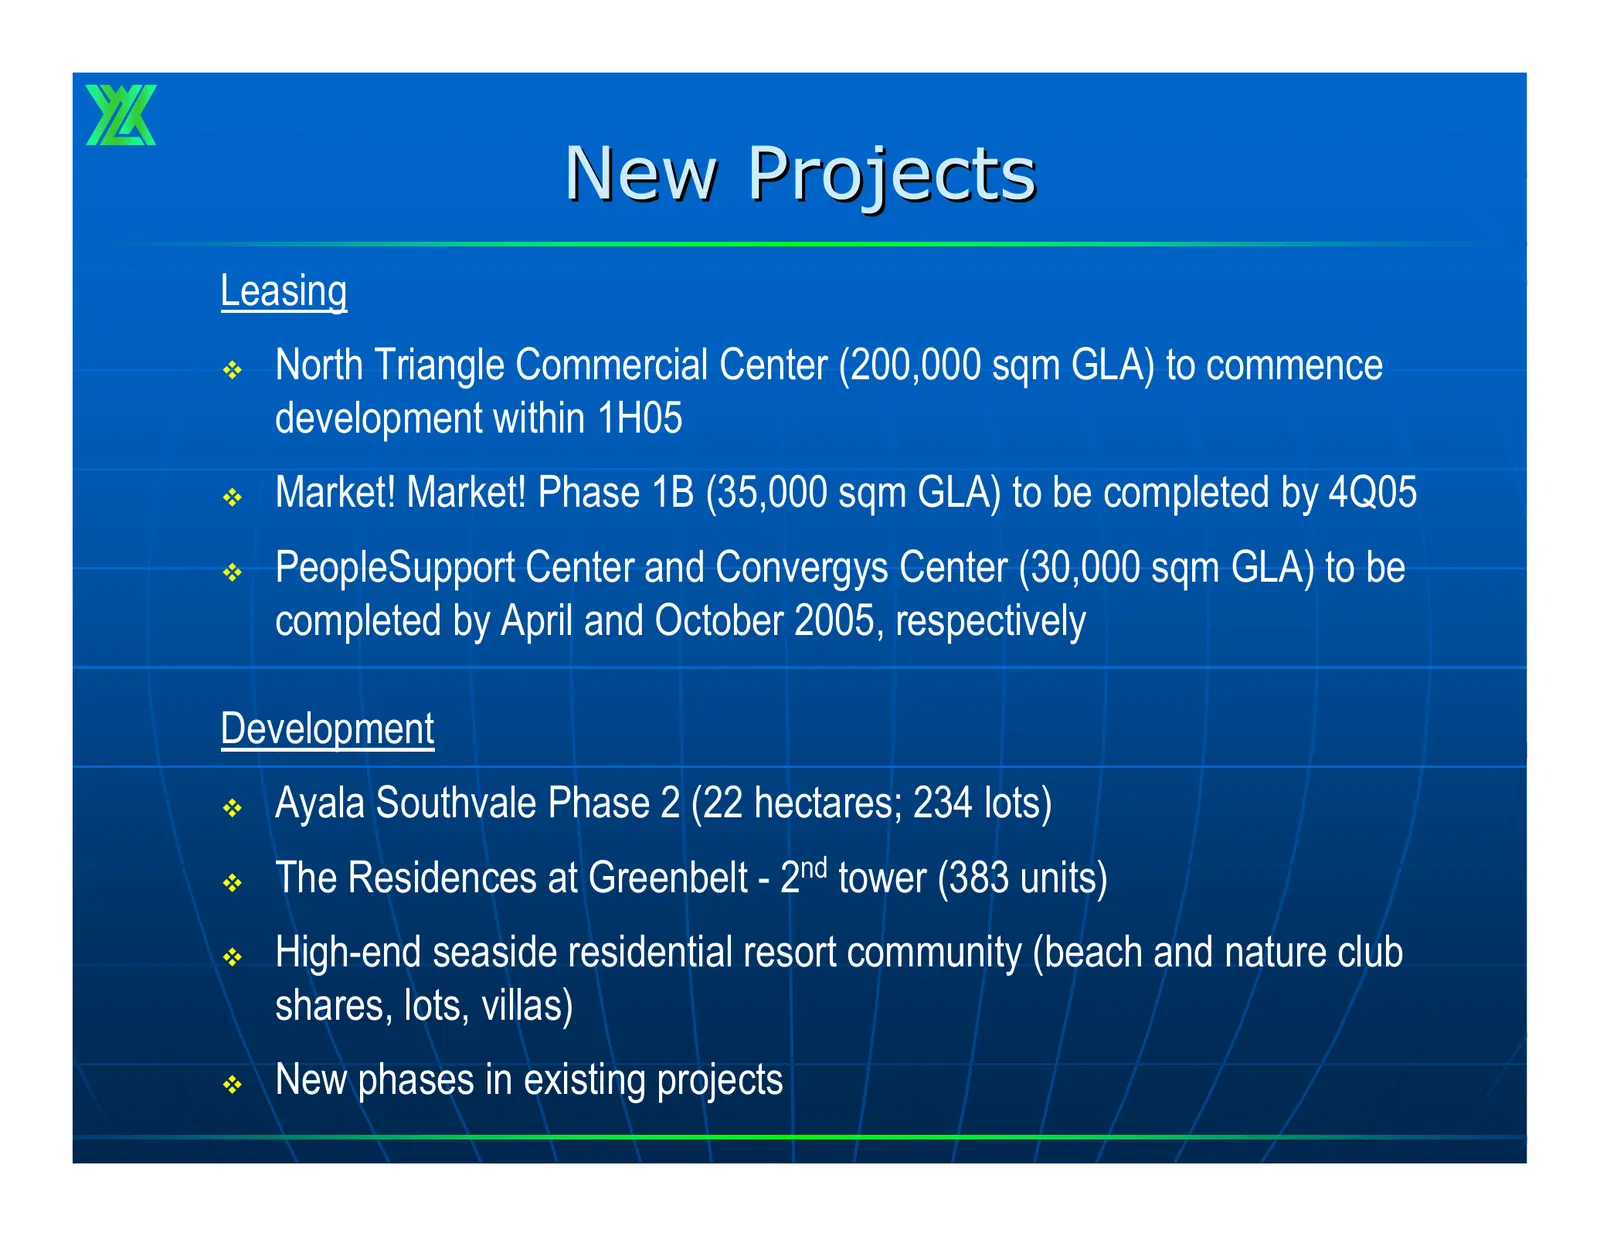
Slide 19: New Projects
New Projects Leasing North Triangle Commercial Center (200,000 sqm GLA) to commence development within 1H05 Market! Market! Phase 1B (35,000 sqm GLA) to be completed by 4Q05 PeopleSupport Center and Convergys Center (30,000 sqm GLA) to be completed by April and October 2005, respectively Devel
Slide 20: Ayala Land, Inc.
Ma Ayala Land, Inc.
Source: Internet Archive copy of ayalaland.com.ph
More decks from Ayala Land Inc.
 Q1 2026 Earnings Presentation15 slides · Apr 30, 2026
 Q4 2025 Earnings Presentation16 slides · Feb 20, 2026
 Q1 2025 Earnings Presentation10 slides · May 6, 2025
 FY2024 Earnings Presentation15 slides · Feb 20, 2025
 Q1 2024 Earnings Presentation37 slides · May 16, 2024
 Q1 2024 Earnings Presentation12 slides · May 8, 2024