NKT A/S · OMXCOP:NKT
NKT A/S — Q2 2014 Earnings Presentation
35 slides from NKT A/S's earnings presentation, Aug 20, 2014
Slide 1: NKT Interim Report Q2 2014
NKT I IR presentation I Interim Report Q2 2014 20 August 2014 I 1 NKT Interim Report Q2 2014 Webcast, 20 August 2014 at 9:00 CET
Slide 2: Forward looking statements
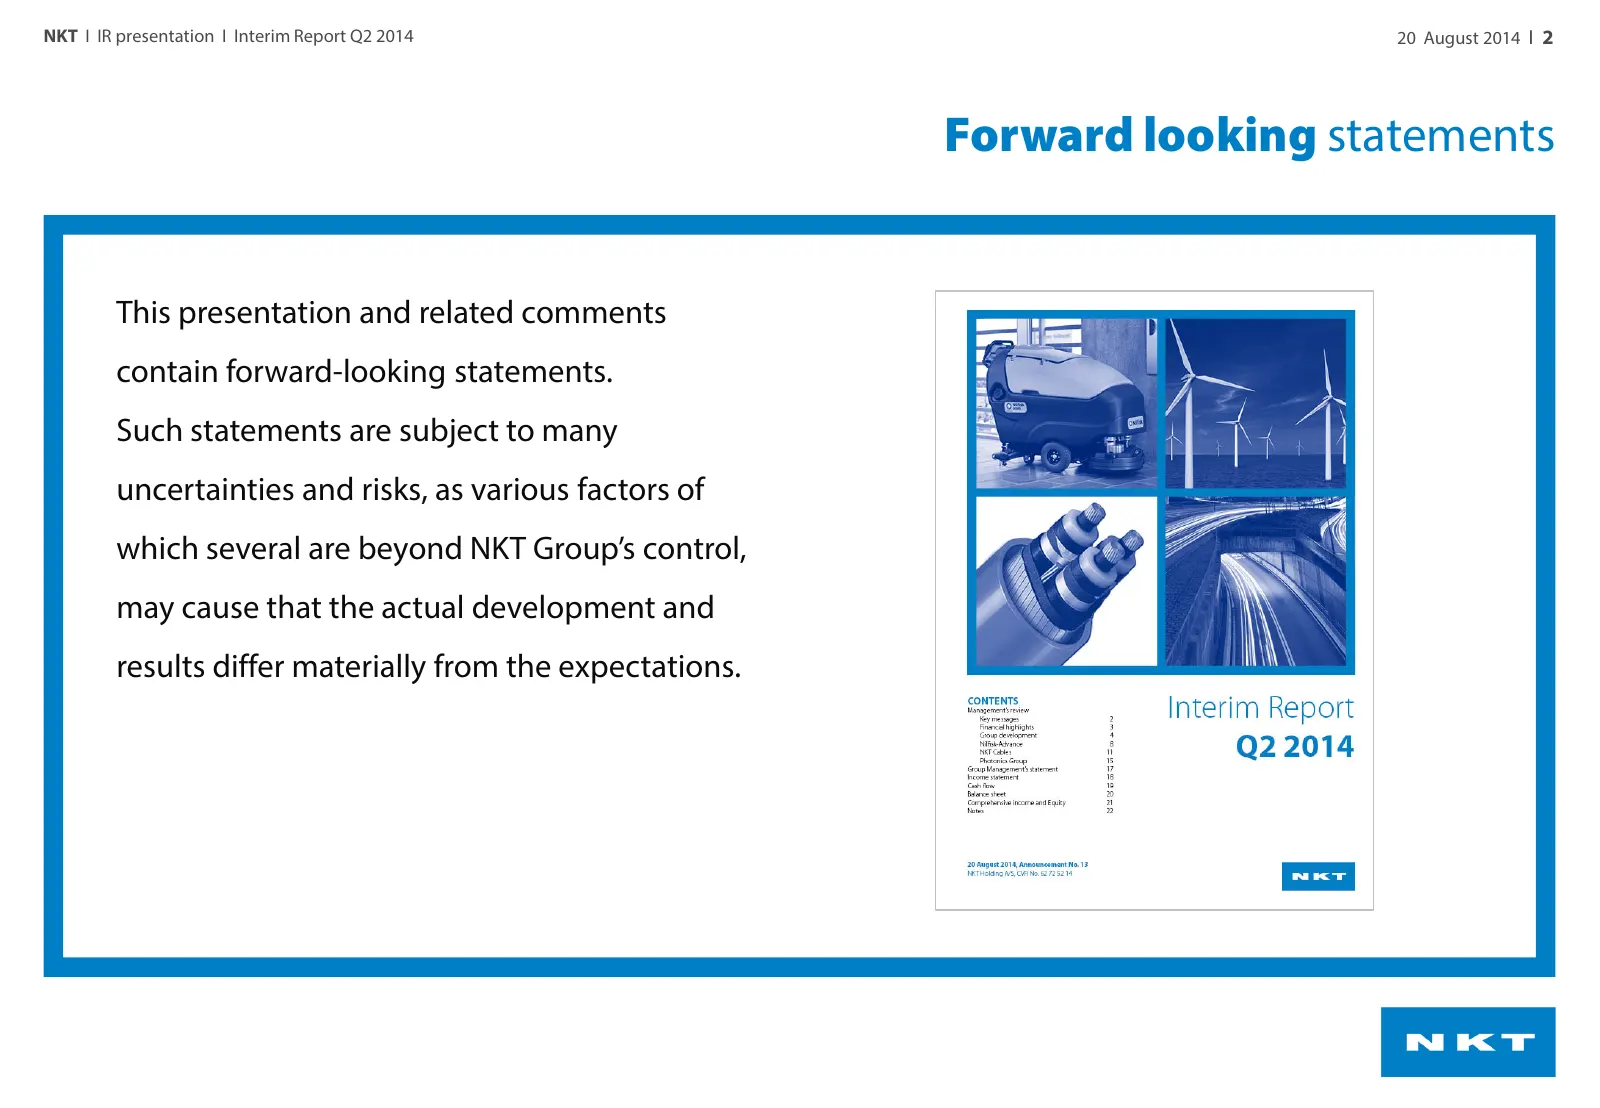
NKT I IR presentation I Interim Report Q2 2014 20 August 2014 I 2 Forward looking statements This presentation and related comments contain forward-looking statements. Such statements are subject to many uncertainties and risks, as various factors of which several are beyond NKT Group’s control, may
Slide 3: Introducing today's presenters
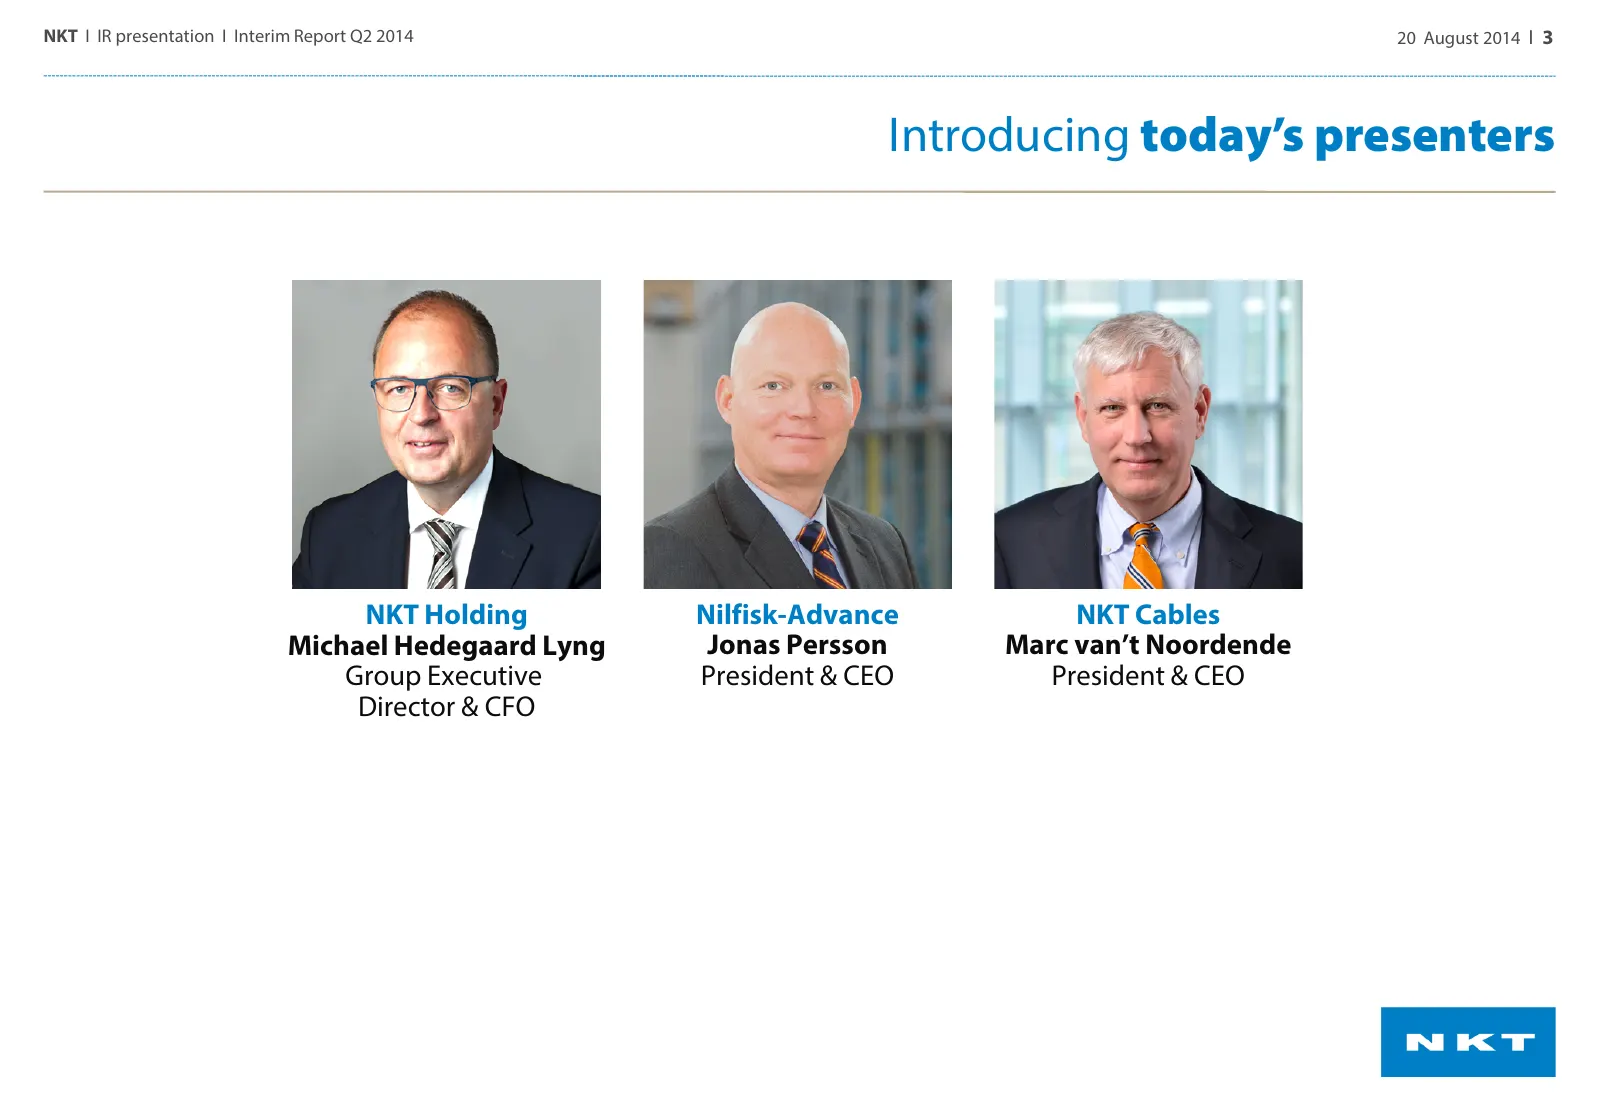
NKT I IR presentation I Interim Report Q2 2014 20 August 2014 I 3 Introducing today’s presenters NKT Holding Nilfisk-Advance NKT Cables Michael Hedegaard Lyng Jonas Persson Marc van’t Noordende Group Executive President & CEO President & CEO Director & CFO
Slide 4: Agenda: Highlights Q2 2014
NKT I IR presentation I Interim Report Q2 2014 20 August 2014 I 4 Agenda Highlights Q2 2014 Business areas • Nilfisk-Advance • NKT Cables • Photonics Group Expectations 2014 Questions & Answers
Slide 5: Highlights Q2 2014
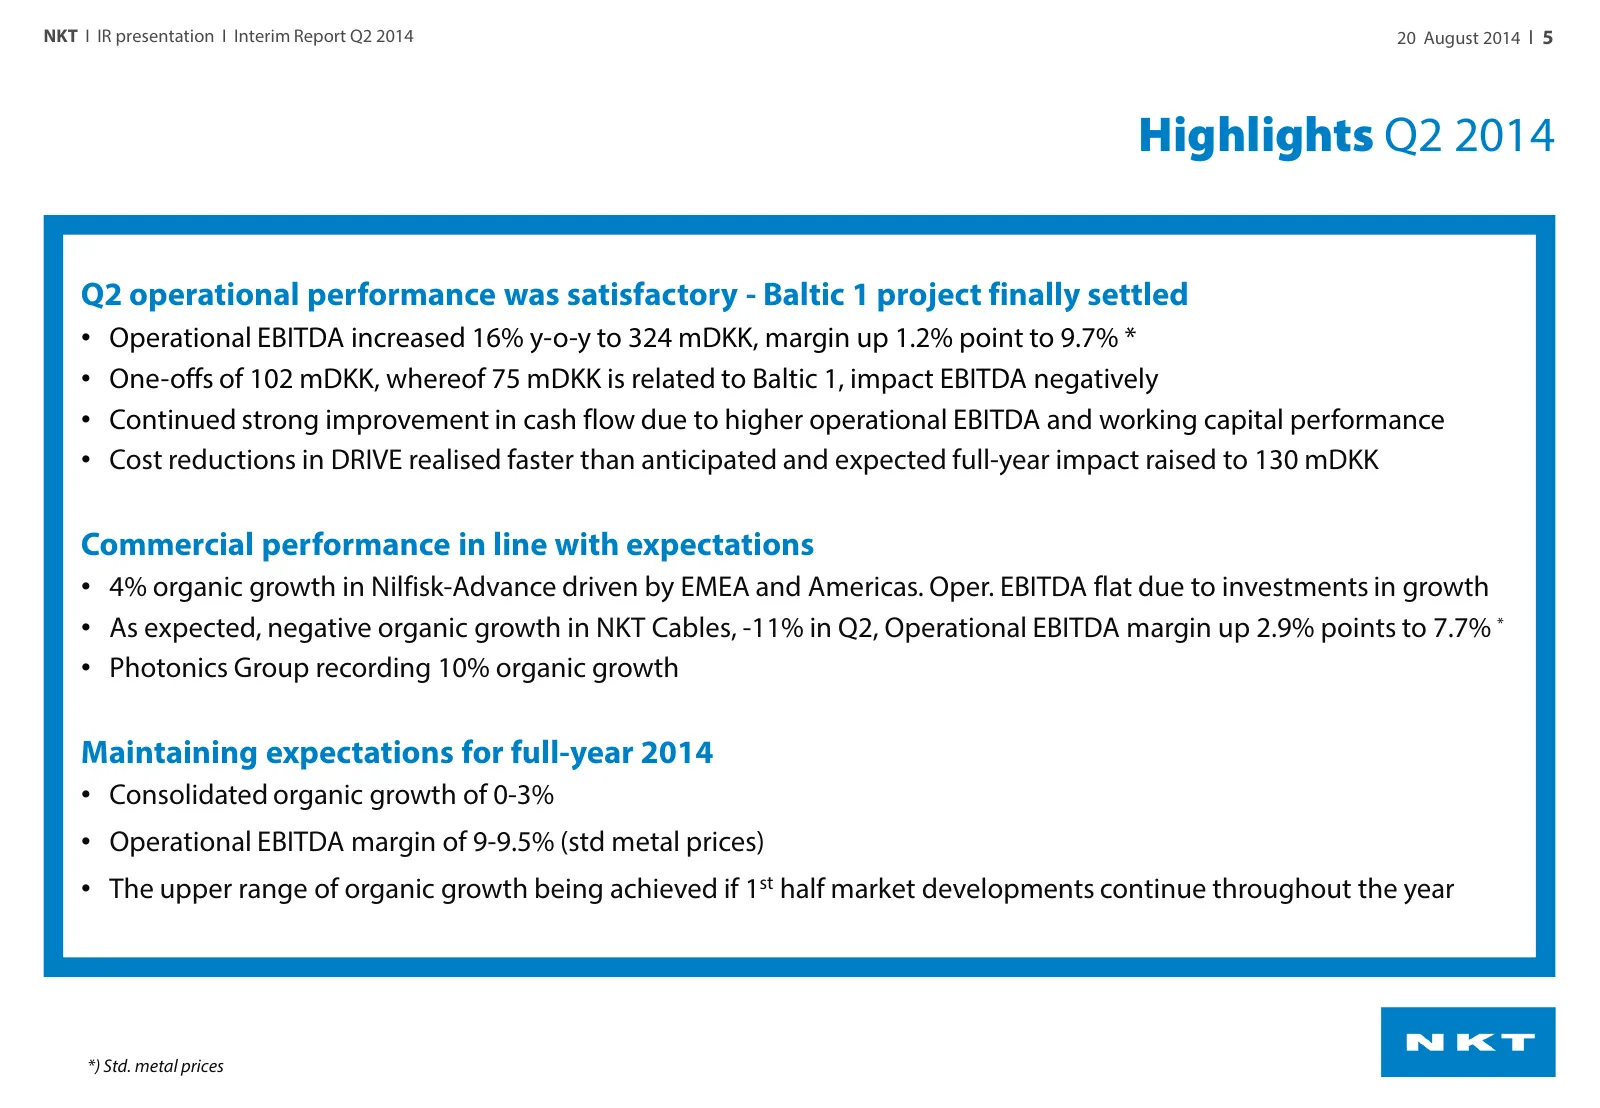
NKT I IR presentation I Interim Report Q2 2014 20 August 2014 I 5 Highlights Q2 2014 Q2 operational performance was satisfactory - Baltic 1 project finally settled • Operational EBITDA increased 16% y-o-y to 324 mDKK, margin up 1.2% point to 9.7% * • One-offs of 102 mDKK, whereof 75 mDKK is related
Slide 6: Group financial highlights Q2 2014
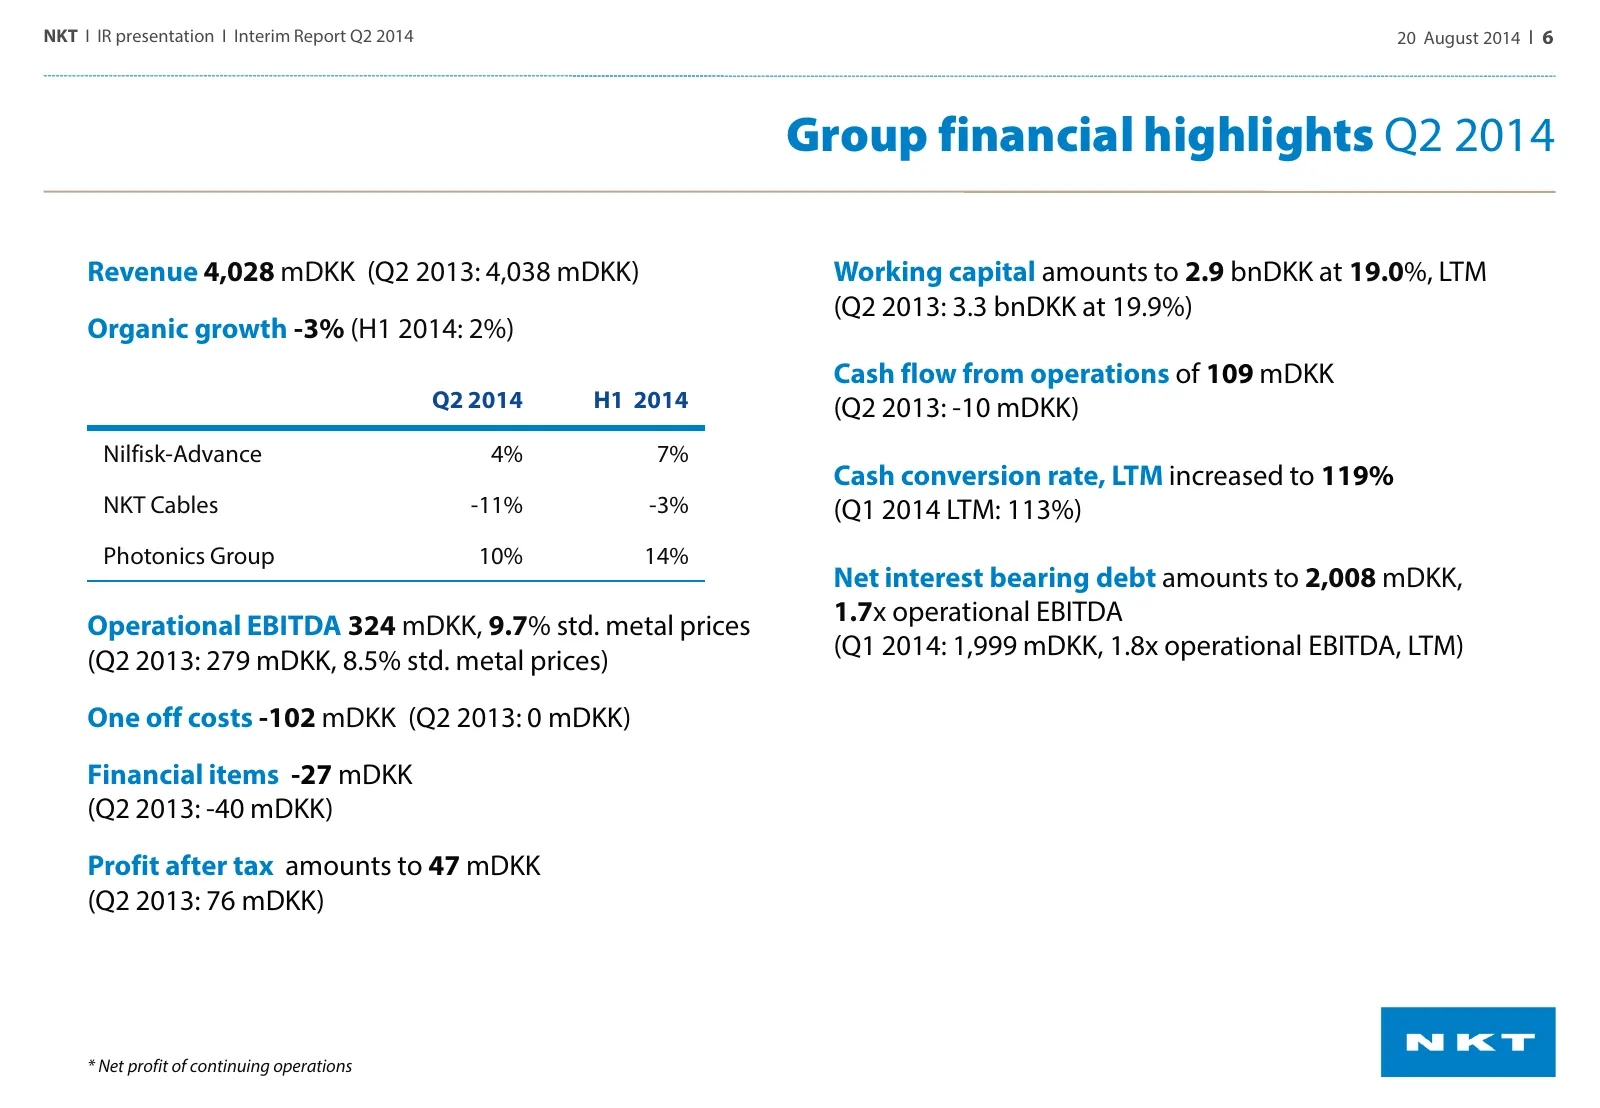
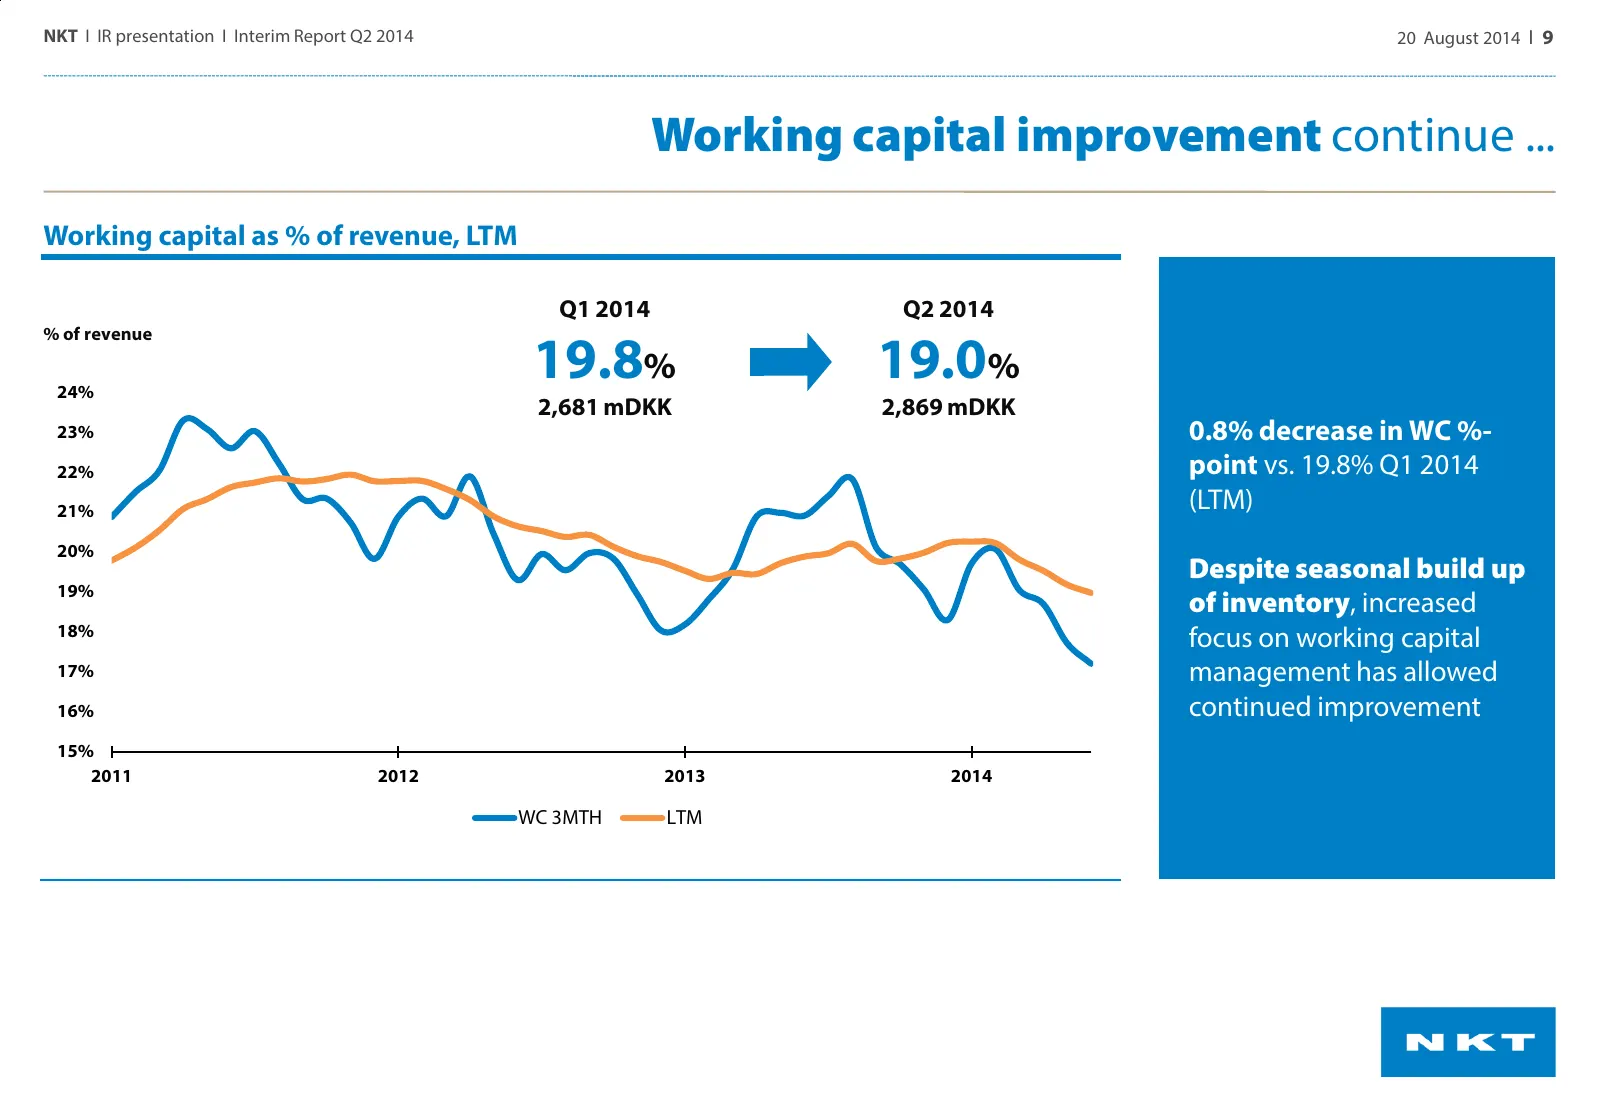
NKT I IR presentation I Interim Report Q2 2014 20 August 2014 I 6 Group financial highlights Q2 2014 Revenue 4,028 mDKK (Q2 2013: 4,038 mDKK) Working capital amounts to 2.9 bnDKK at 19.0%, LTM (Q2 2013: 3.3 bnDKK at 19.9%) Organic growth -3% (H1 2014: 2%) Cash flow from operations of 109 mDKK Q2 201
Slide 7: Operational EBITDA continue the positive momentum
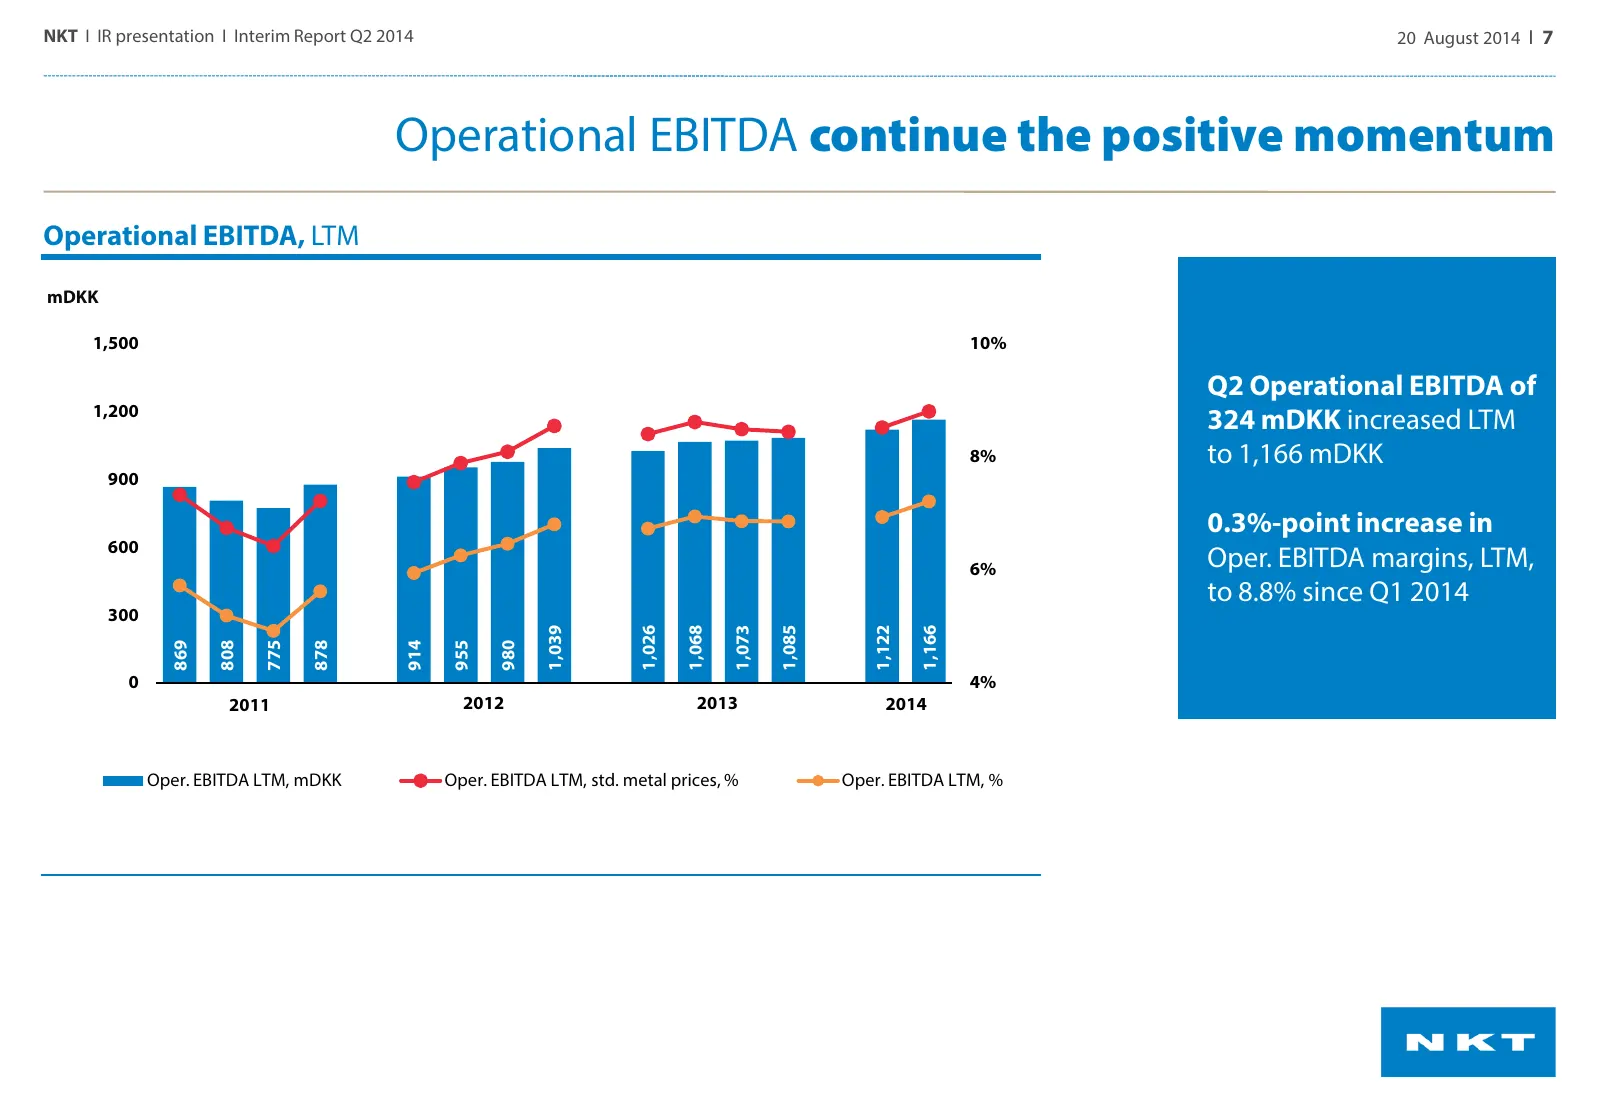
NKT I IR presentation I Interim Report Q2 2014 20 August 2014 I 7 Operational EBITDA continue the positive momentum Operational EBITDA, LTM mDKK • Negative organic 1,500 10% growth of 2% for 2012 Q2 • Operational EBITDA marginEBITDA of std. LTM 1,200 3242012 mDKKof increased LTM 8,1% or 980 8% to 1,
Slide 8: NKT Cables drive increase in operational performance
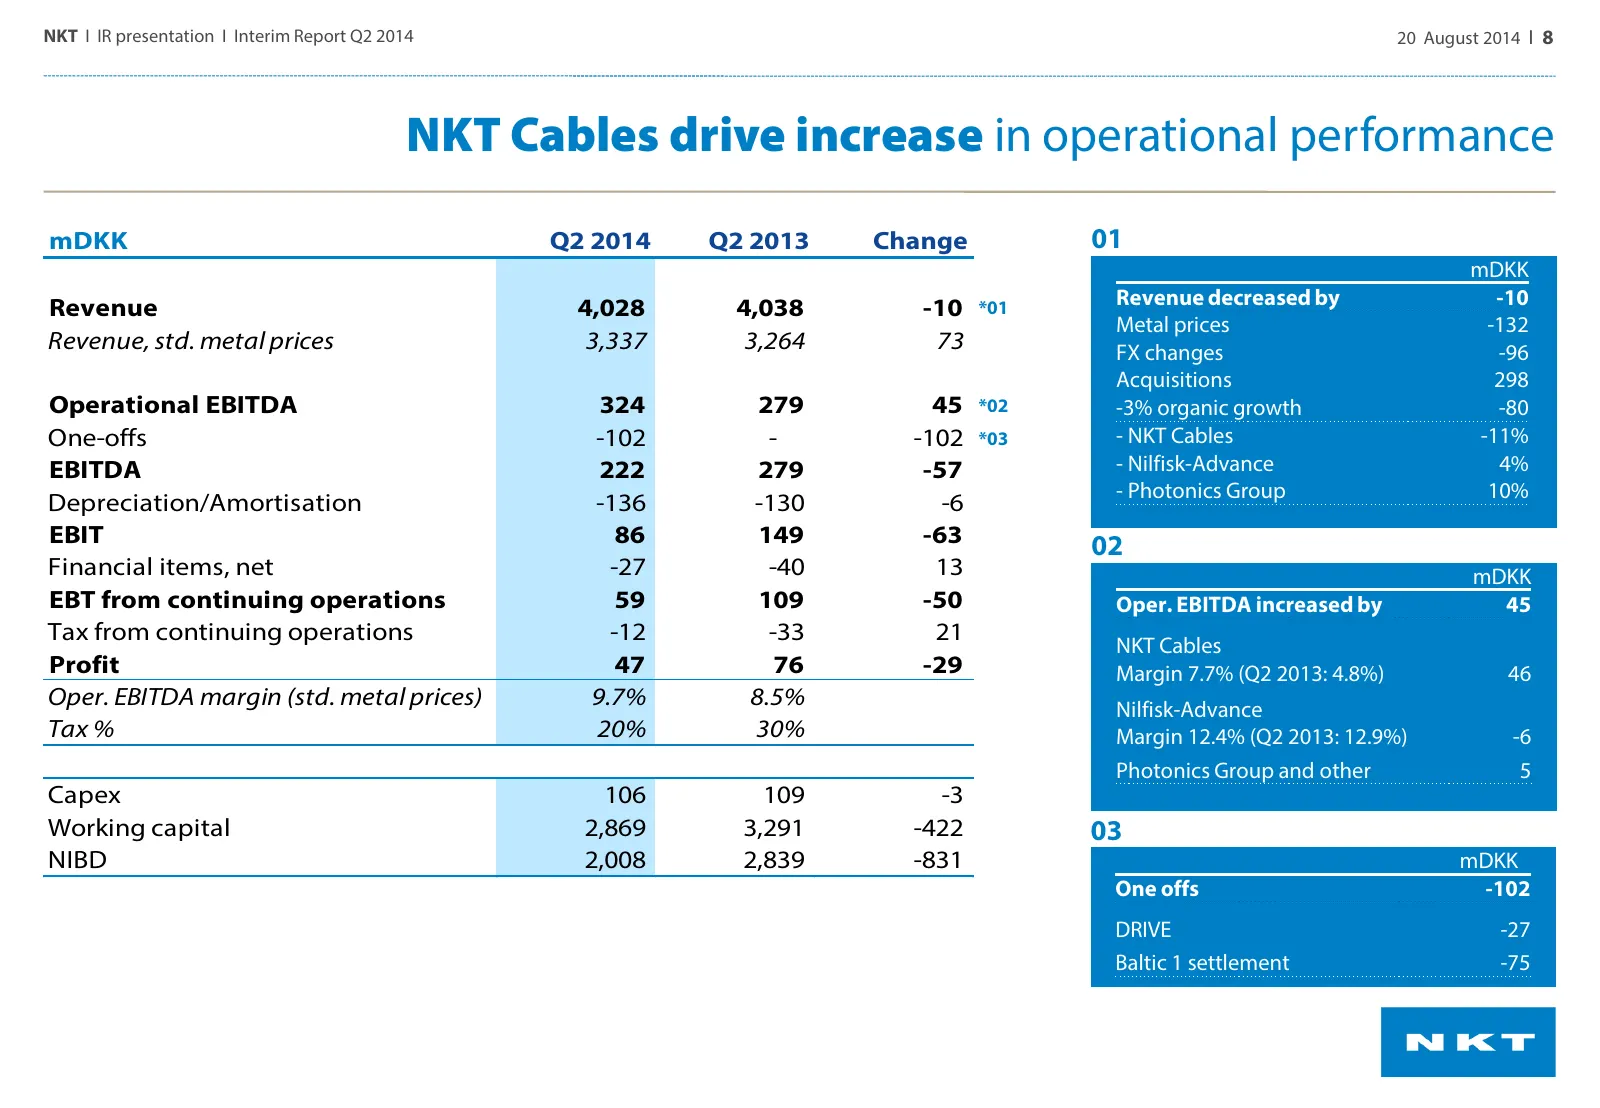
NKT I IR presentation I Interim Report Q2 2014 20 August 2014 I 8 NKT Cables drive increase in operational performance mDKK Q2 2014 Q2 2013 Change 01 mDKK Revenue decreased by -10 Revenue 4,028 4,038 -10 *01 Metal prices -132 Revenue, std. metal prices 3,337 3,264 73 FX changes -96 Acquisitions 298
Slide 9: Working capital improvement continue ...
NKT I IR presentation I Interim Report Q2 2014 20 August 2014 I 9 Working capital improvement continue ... Working capital as % of revenue, LTM Q1 2014 Q2 2014 19.8% 19.0% % of revenue 24% 2,681 mDKK 2,869 mDKK 23% 0.8% decrease in WC %- 22% point vs. 19.8% Q1 2014 21% (LTM) 20% Despite seasonal bui
Slide 10: ... reduction by more than 400 mDKK since Q2 last year
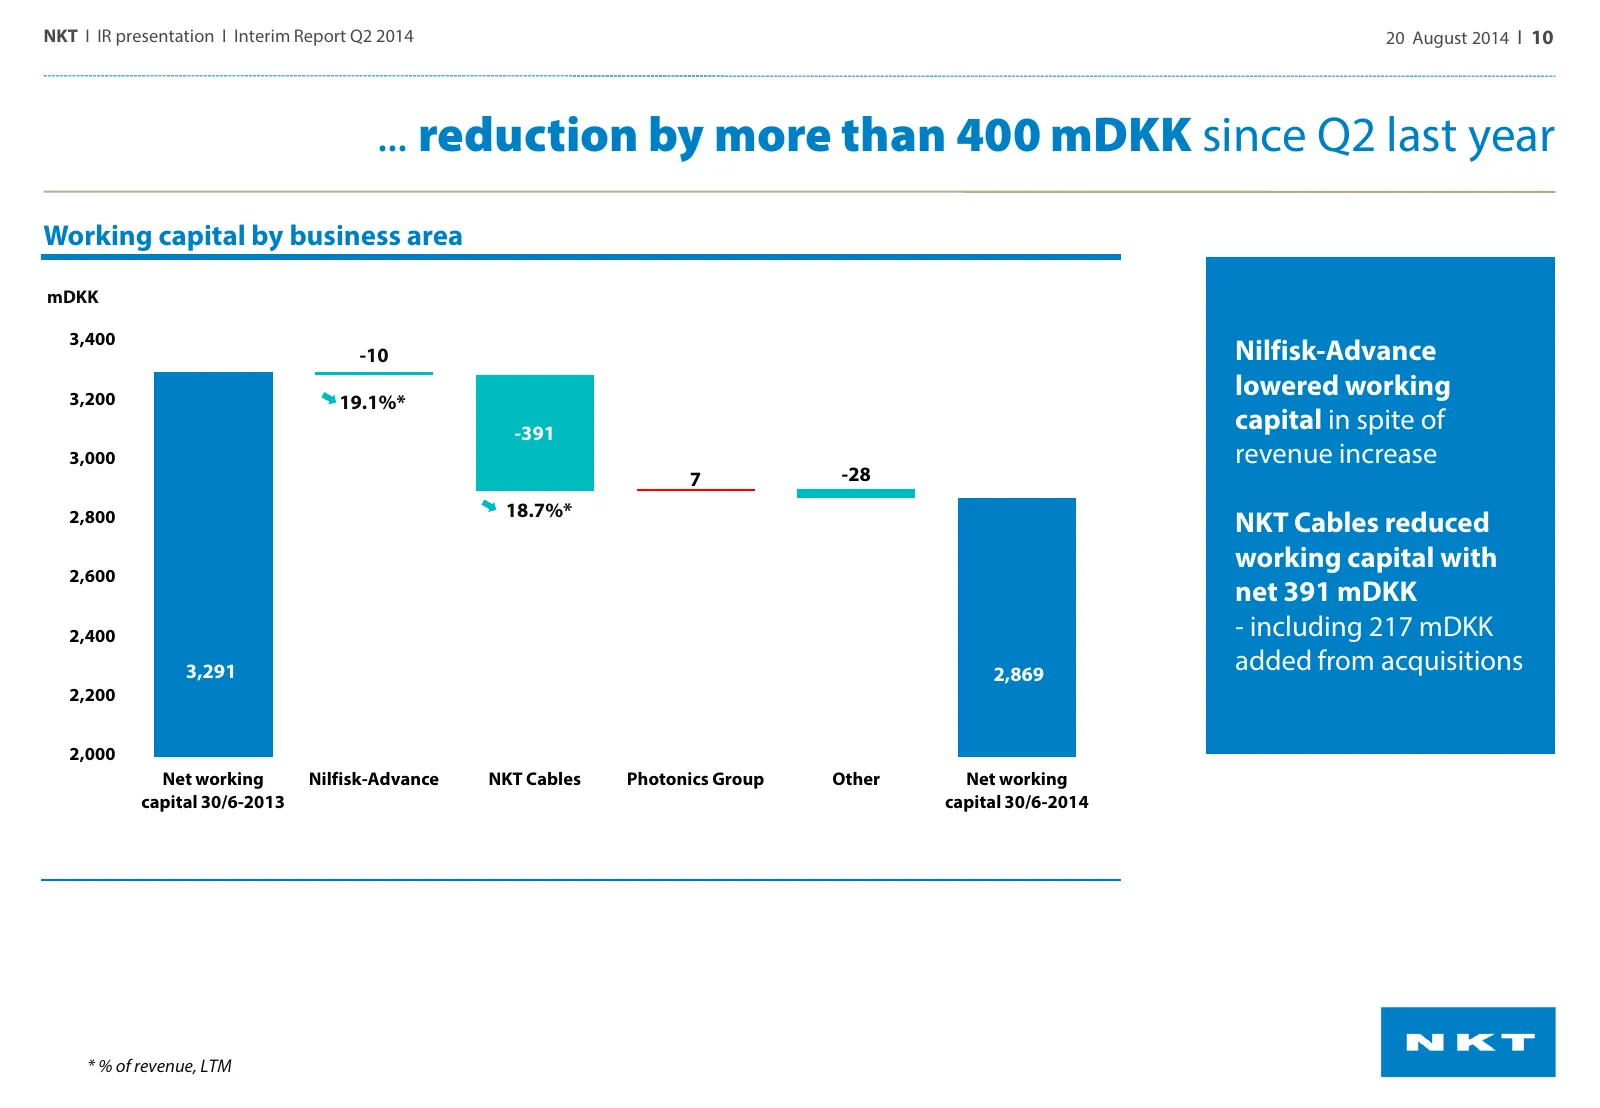
NKT I IR presentation I Interim Report Q2 2014 20 August 2014 I 10 ... reduction by more than 400 mDKK since Q2 last year Working capital by business area mDKK 3,400 -10 Nilfisk-Advance 3,200 lowered working 19.1%* -391 capital in spite of 3,000 revenue increase 7 -28 18.7%* 2,800 NKT Cables reduced
Slide 11: Strong cash flow development maintained
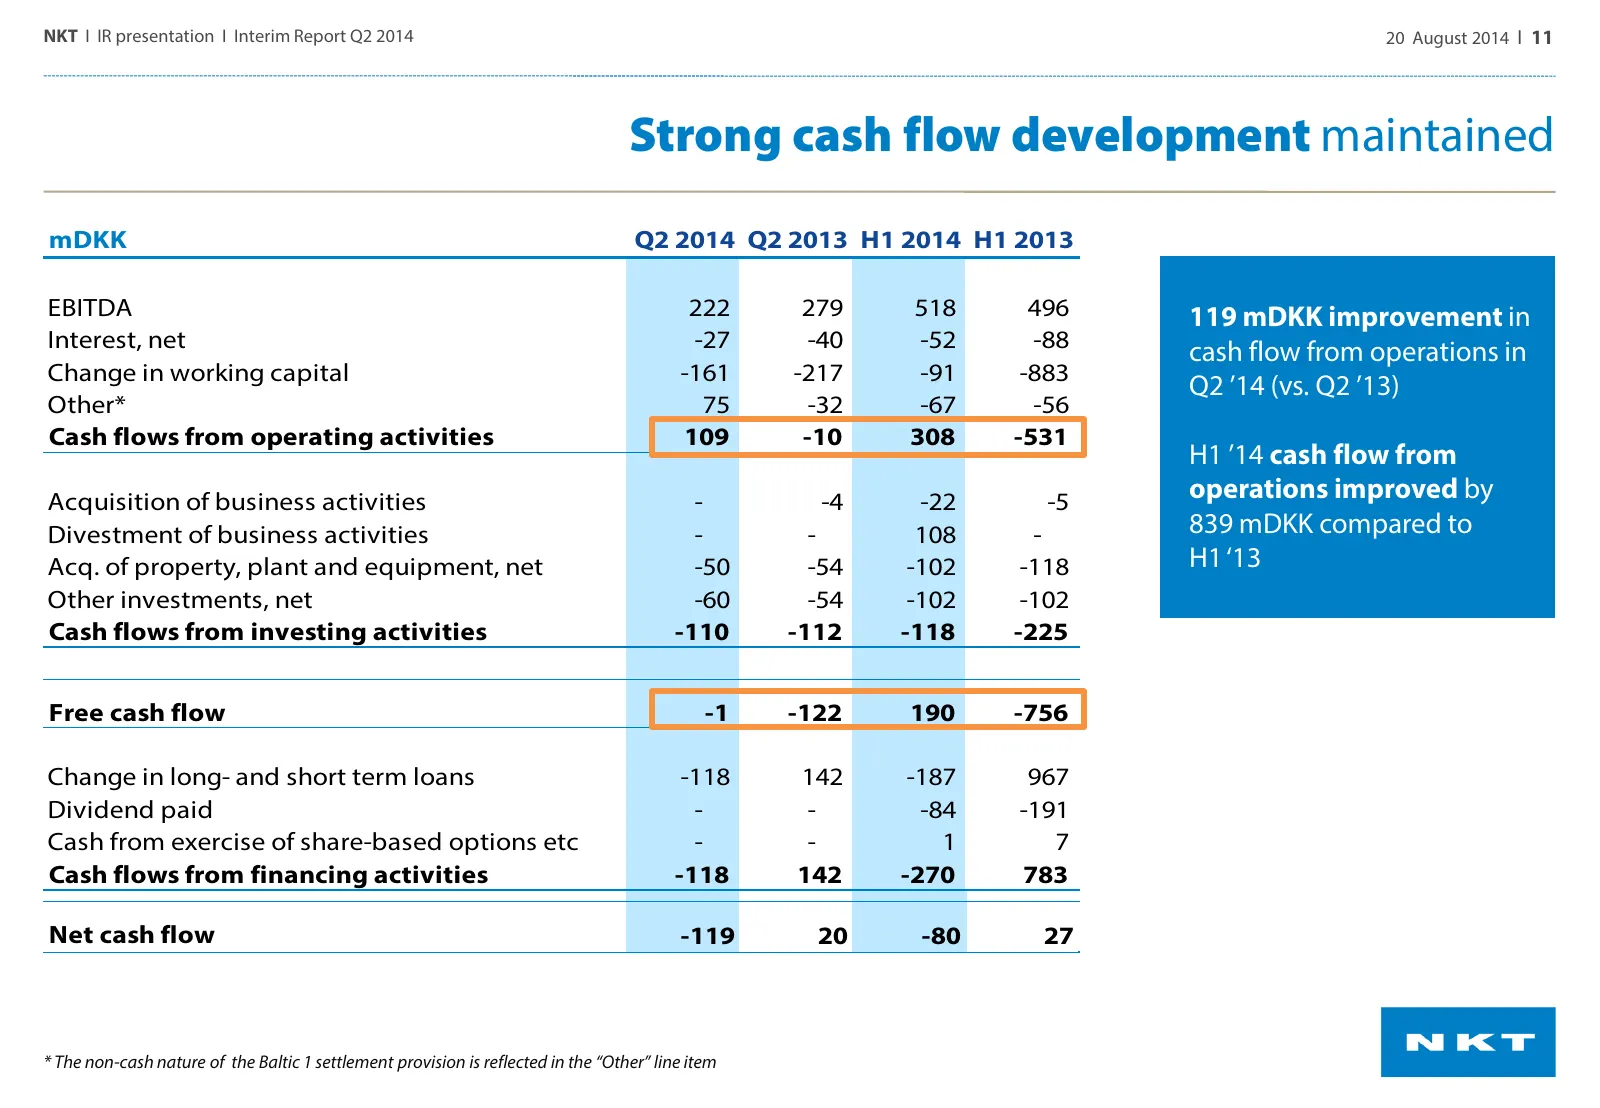
NKT I IR presentation I Interim Report Q2 2014 20 August 2014 I 11 Strong cash flow development maintained mDKK Q2 2014 Q2 2013 H1 2014 H1 2013 EBITDA 222 279 518 496 119 mDKK improvement in Interest, net -27 -40 -52 -88 cash flow from operations in Change in working capital -161 -217 -91 -883 Q2 ’1
Slide 12: Leverage further reduced to 1.7x Operational EBITDA
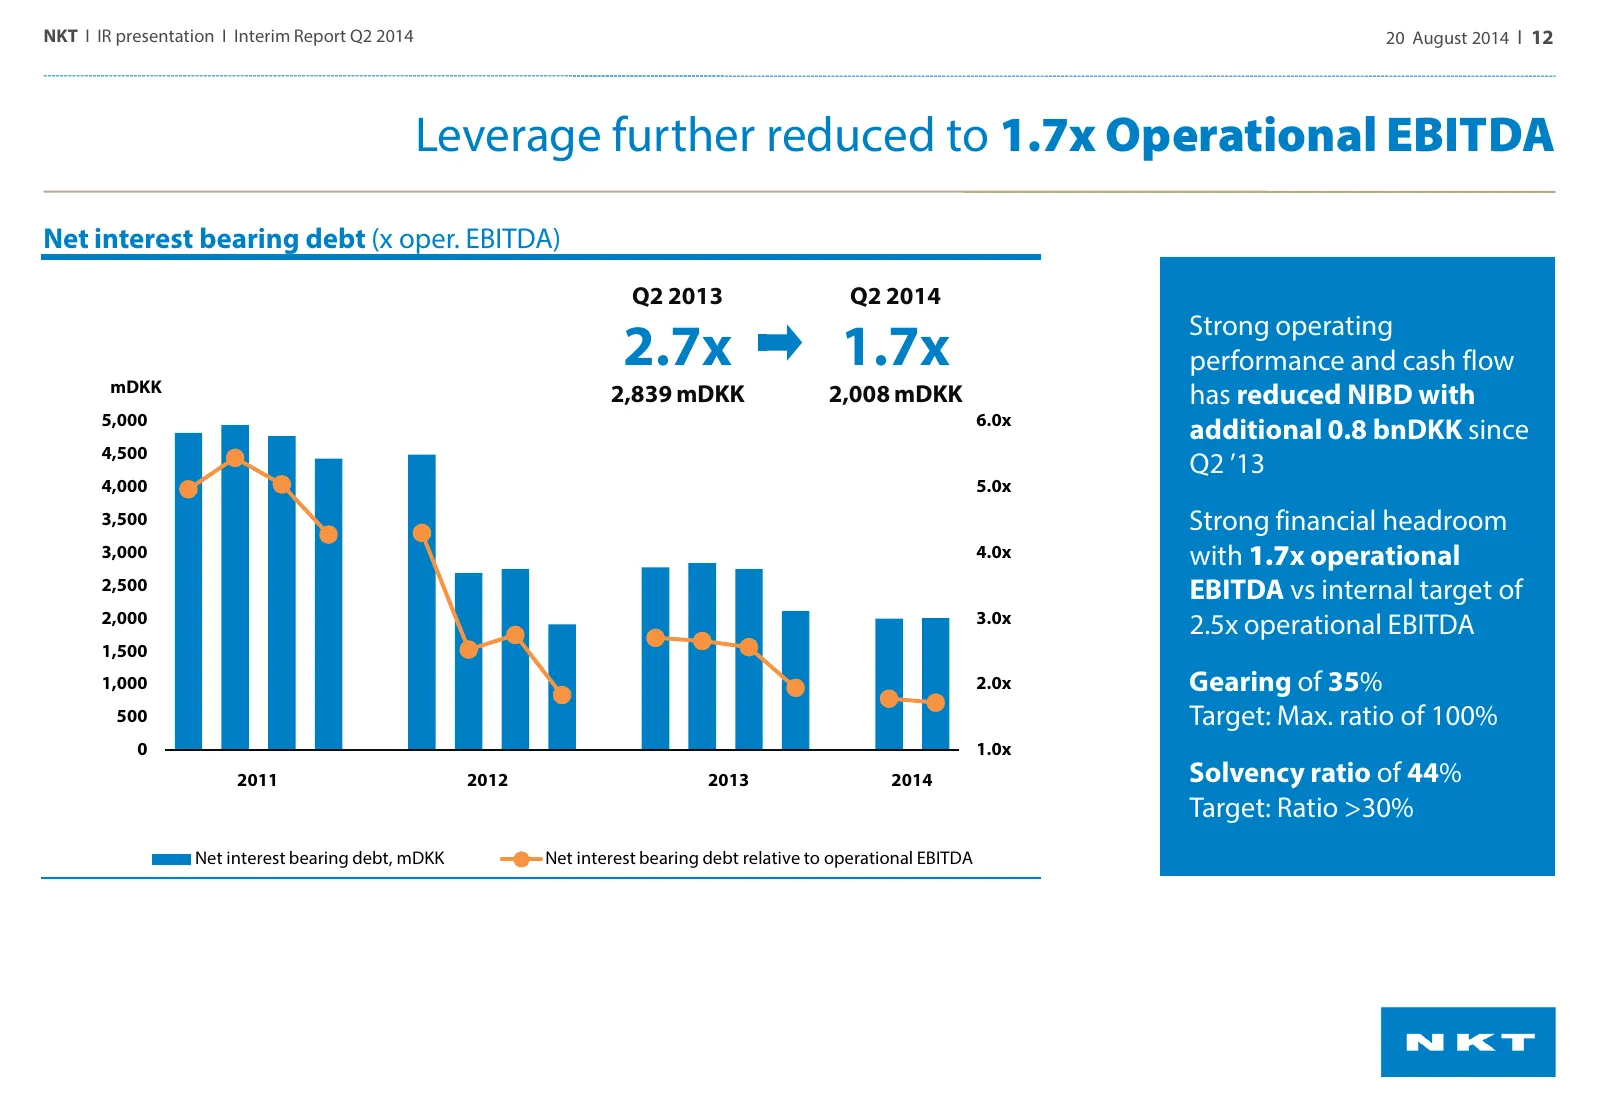
NKT I IR presentation I Interim Report Q2 2014 20 August 2014 I 12 Leverage further reduced to 1.7x Operational EBITDA Net interest bearing debt (x oper. EBITDA) Q2 2013 Q2 2014 2.7x 1.7x Strong operating performance and cash flow mDKK 2,839 mDKK 2,008 mDKK has reduced NIBD with 5,000 6.0x additiona
Slide 13: Agenda: Business areas
NKT I IR presentation I Interim Report Q2 2014 20 August 2014 I 13 Agenda Highlights Q2 2014 Business areas • Nilfisk-Advance • NKT Cables • Photonics Group Expectations 2014 Questions & Answers

Slide 14: Nilfisk-Advance
NKT I IR presentation I Interim Report Q2 2014 20 August 2014 I 14 Nilfisk-Advance
Slide 15: Growth in Q2 slightly above expectations
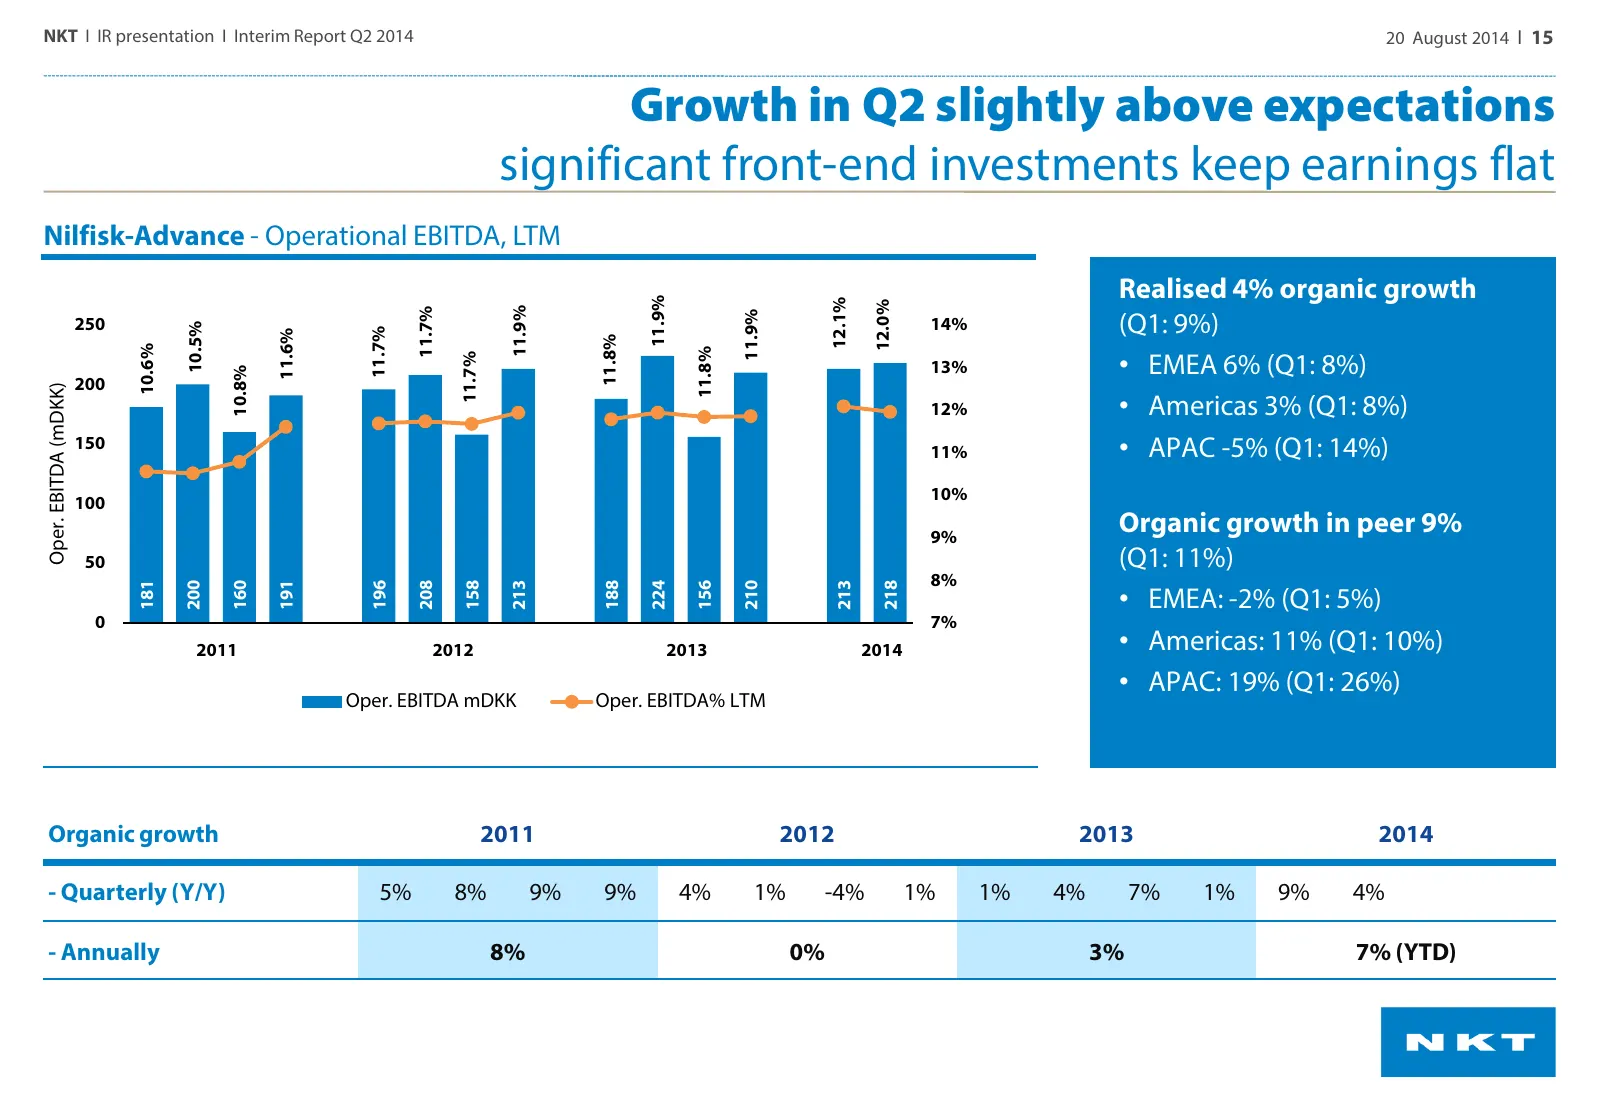
NKT I IR presentation I Interim Report Q2 2014 20 August 2014 I 15 Growth in Q2 slightly above expectations significant front-end investments keep earnings flat Nilfisk-Advance - Operational EBITDA, LTM Realised 4% organic growth 11.9% 12.1% 12.0% 11.9% (Q1: 9%) 11.7% 11.9% 250 14% 10.5% 11.7% 11.6%
Slide 16: Strong growth in EMEA, focus on Commercial Excellence
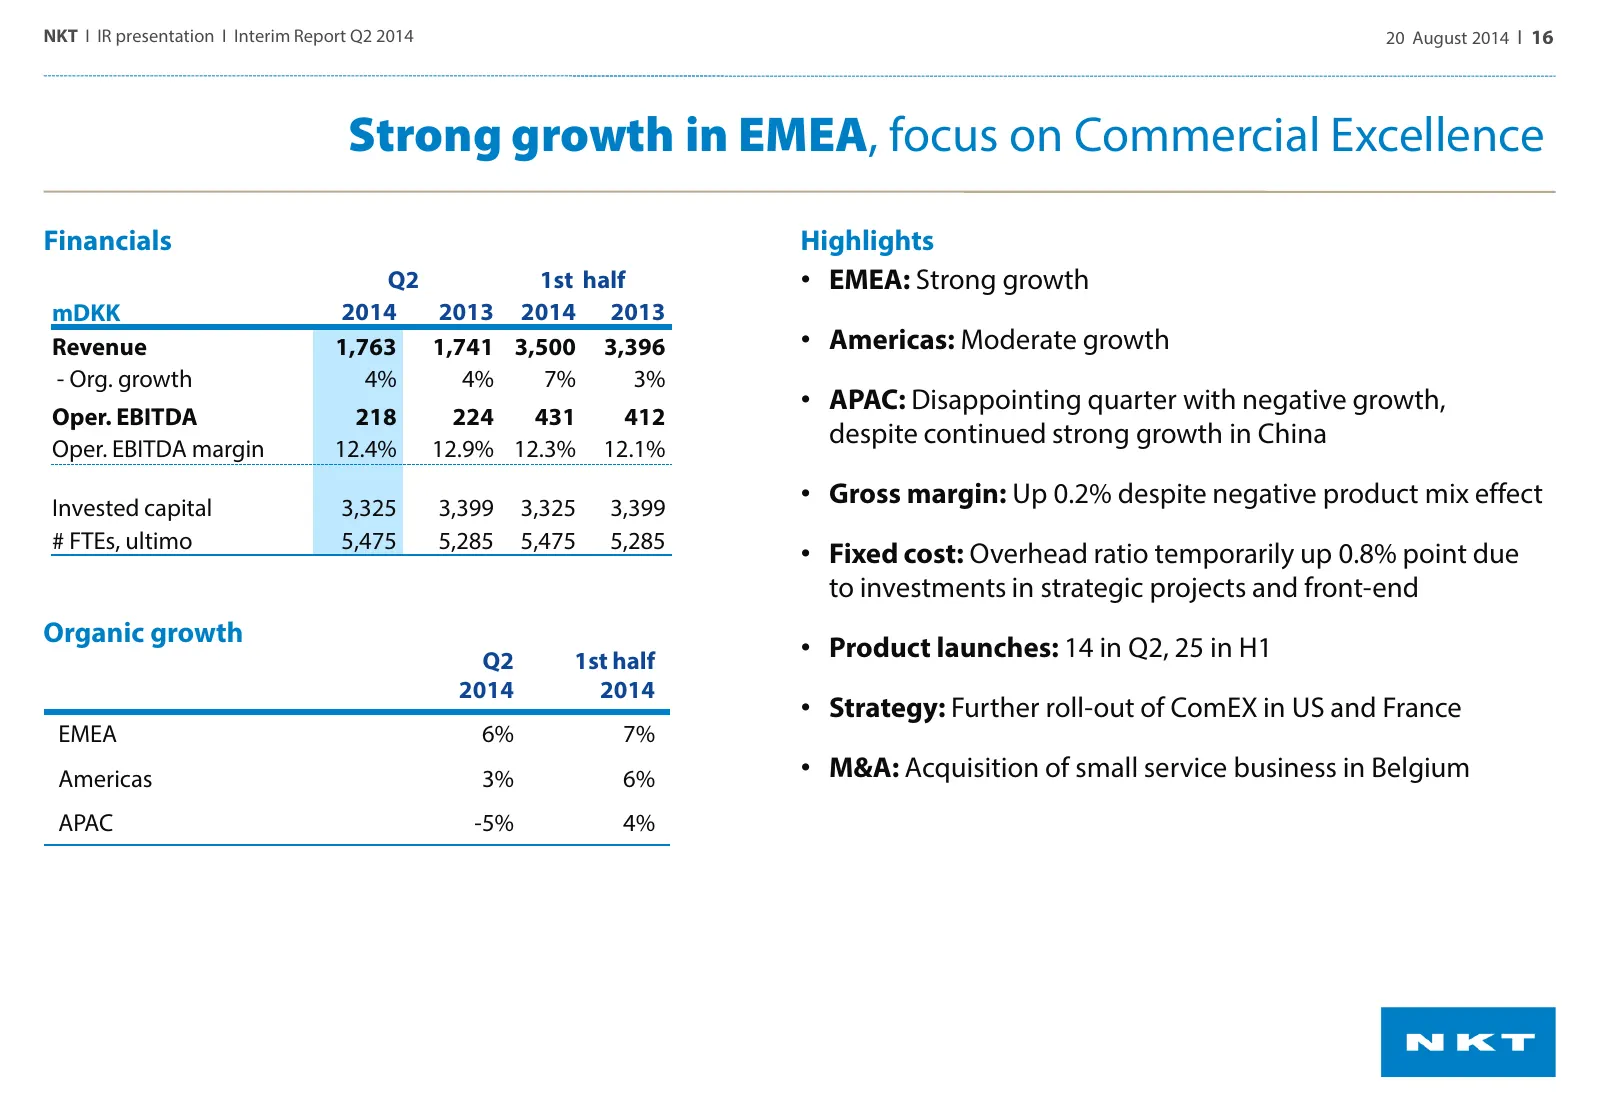
NKT I IR presentation I Interim Report Q2 2014 20 August 2014 I 16 Strong growth in EMEA, focus on Commercial Excellence Financials Highlights Q2 1st half • EMEA: Strong growth mDKK 2014 2013 2014 2013 Revenue 1,763 1,741 3,500 3,396 • Americas: Moderate growth - Org. growth 4% 4% 7% 3% • APAC: Disa
Slide 17: Commercial Excellence Programme
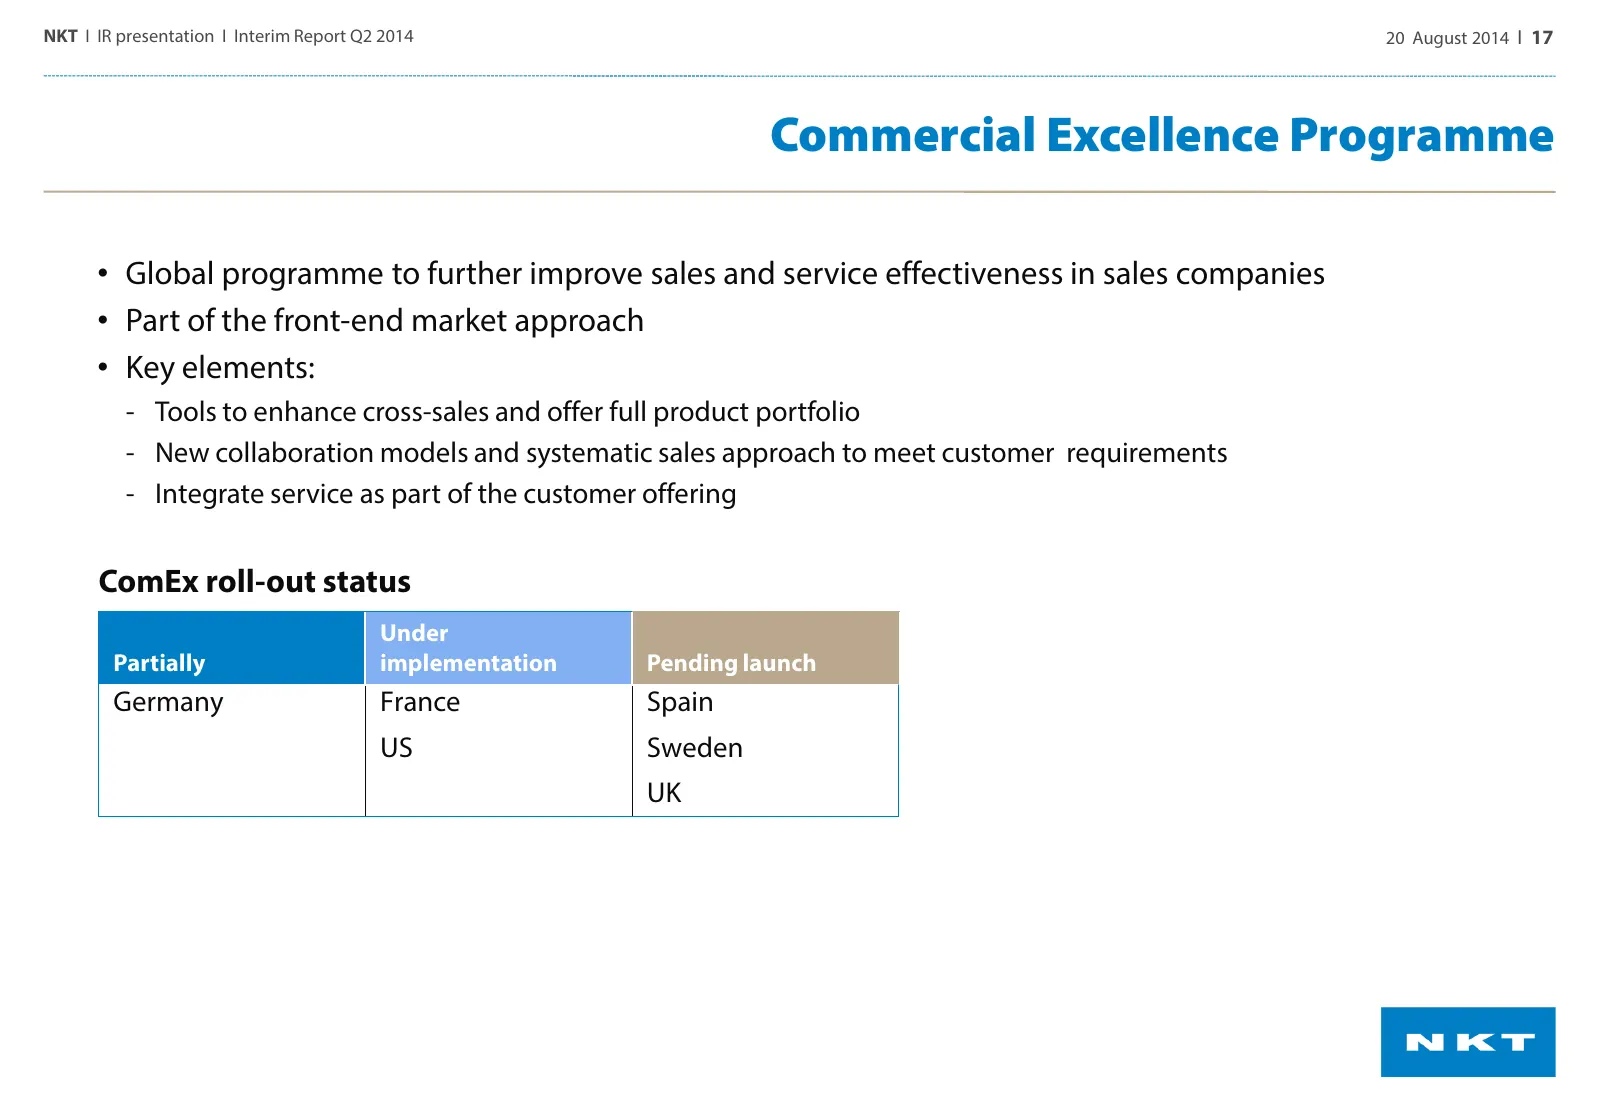
NKT I IR presentation I Interim Report Q2 2014 20 August 2014 I 17 Commercial Excellence Programme • Global programme to further improve sales and service effectiveness in sales companies • Part of the front-end market approach • Key elements: ‐ Tools to enhance cross-sales and offer full product po
Slide 18: Products - TrackClean
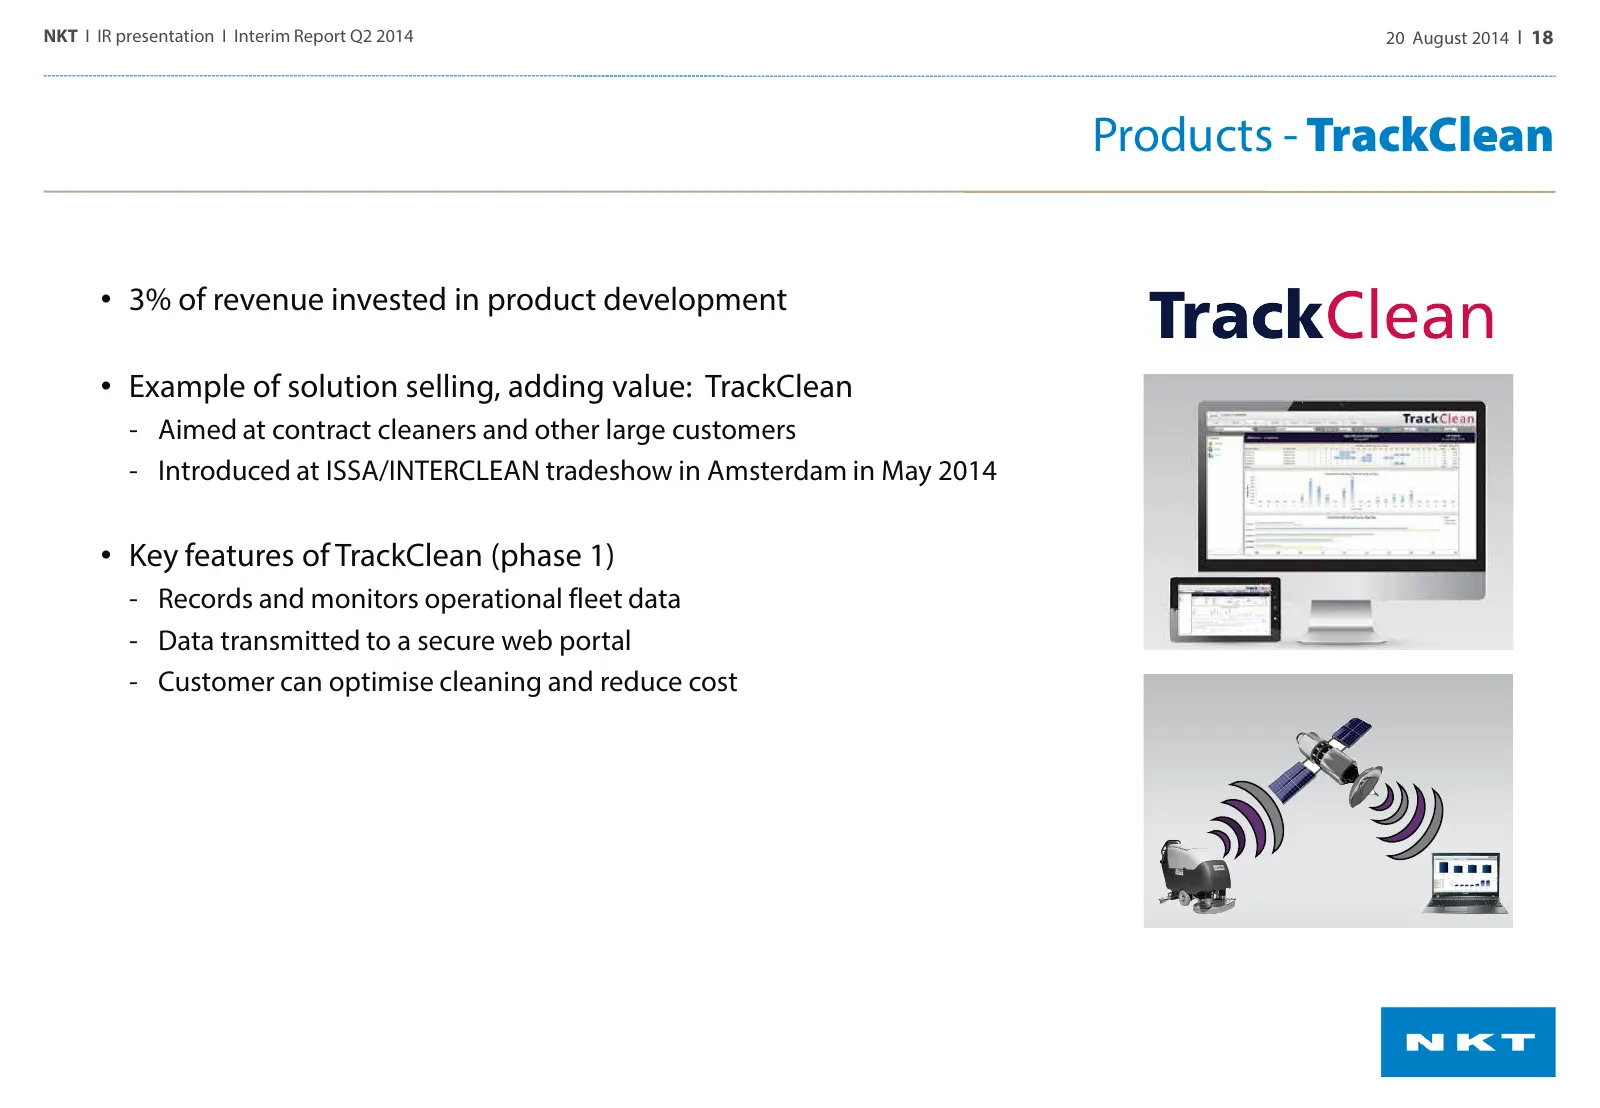
NKT I IR presentation I Interim Report Q2 2014 20 August 2014 I 18 Products - TrackClean • 3% of revenue invested in product development • Example of solution selling, adding value: TrackClean ‐ Aimed at contract cleaners and other large customers ‐ Introduced at ISSA/INTERCLEAN tradeshow in Amsterd
Slide 19: Nilfisk-Advance overview
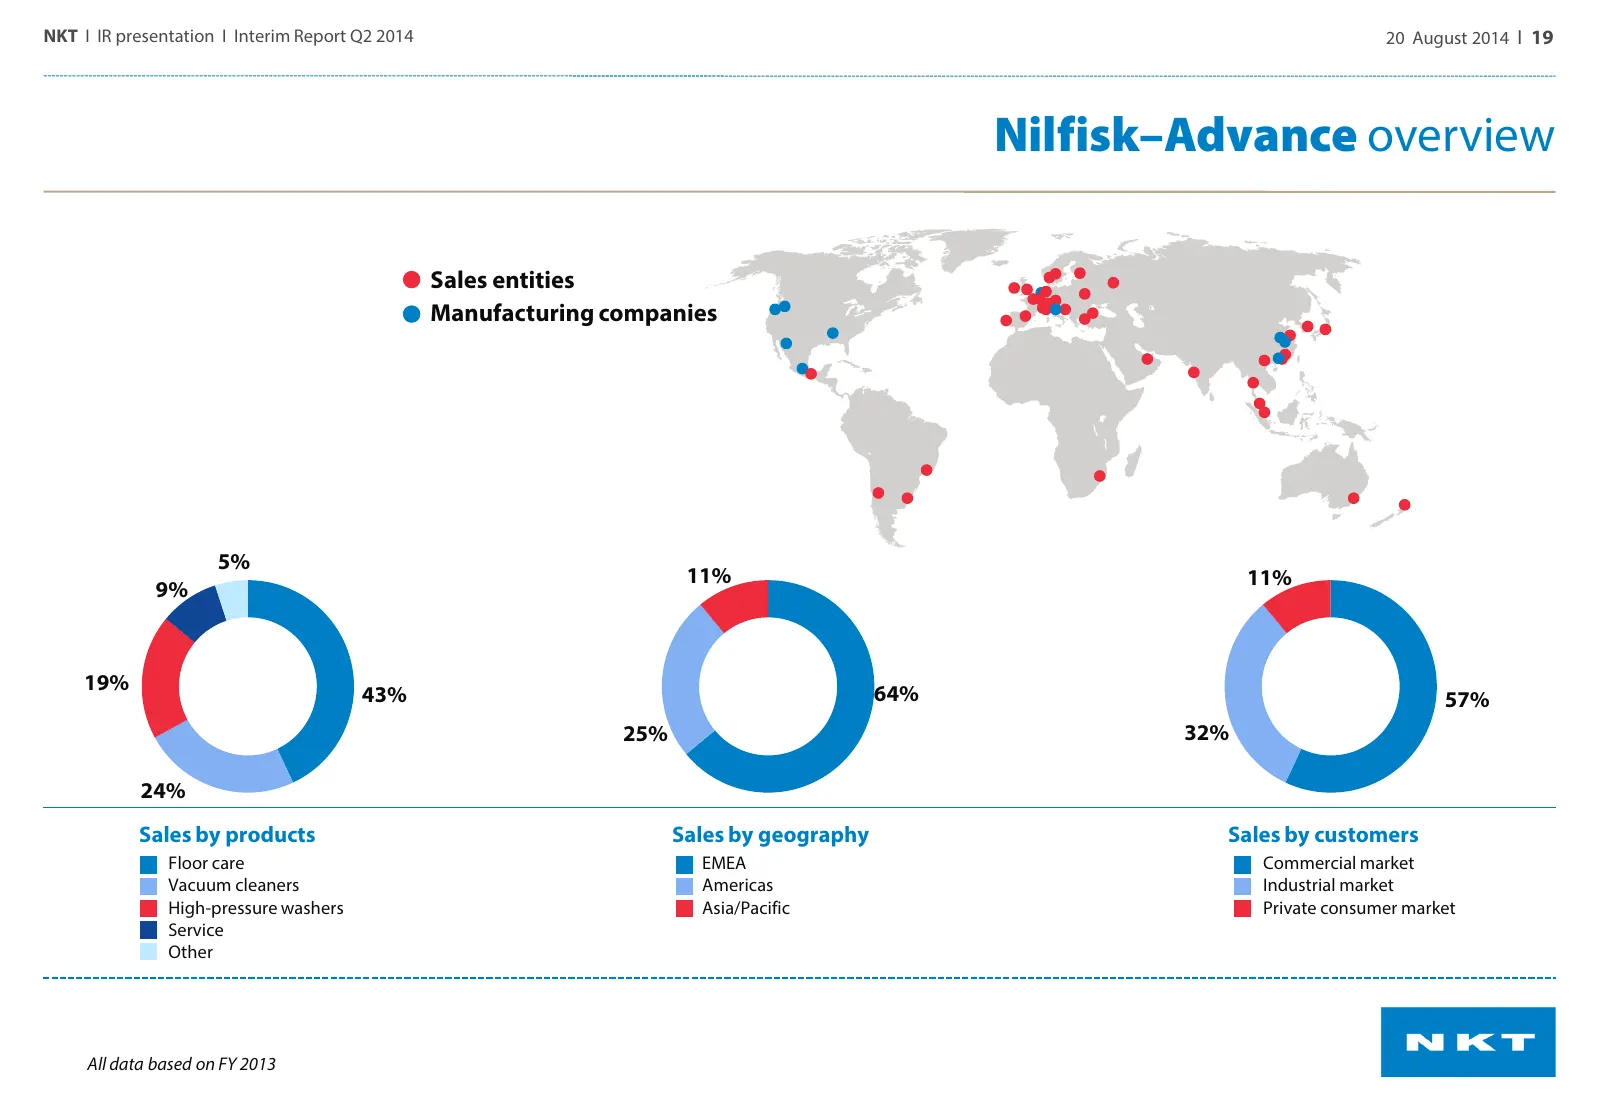
NKT I IR presentation I Interim Report Q2 2014 20 August 2014 I 19 Nilfisk–Advance overview Sales entities Manufacturing companies 5% 11% 11% 9% 19% 64% 43% 57% 25% 32% 24% Sales by products Sales by geography Sales by customers Floor care EMEA Commercial market Vacuum cleaners Americas Industrial m
Slide 20: NKT Cables
NKT I IR presentation I Interim Report Q2 2014 20 August 2014 I 20 NKT Cables
Slide 21: Operational EBITDA improved, despite lower revenues
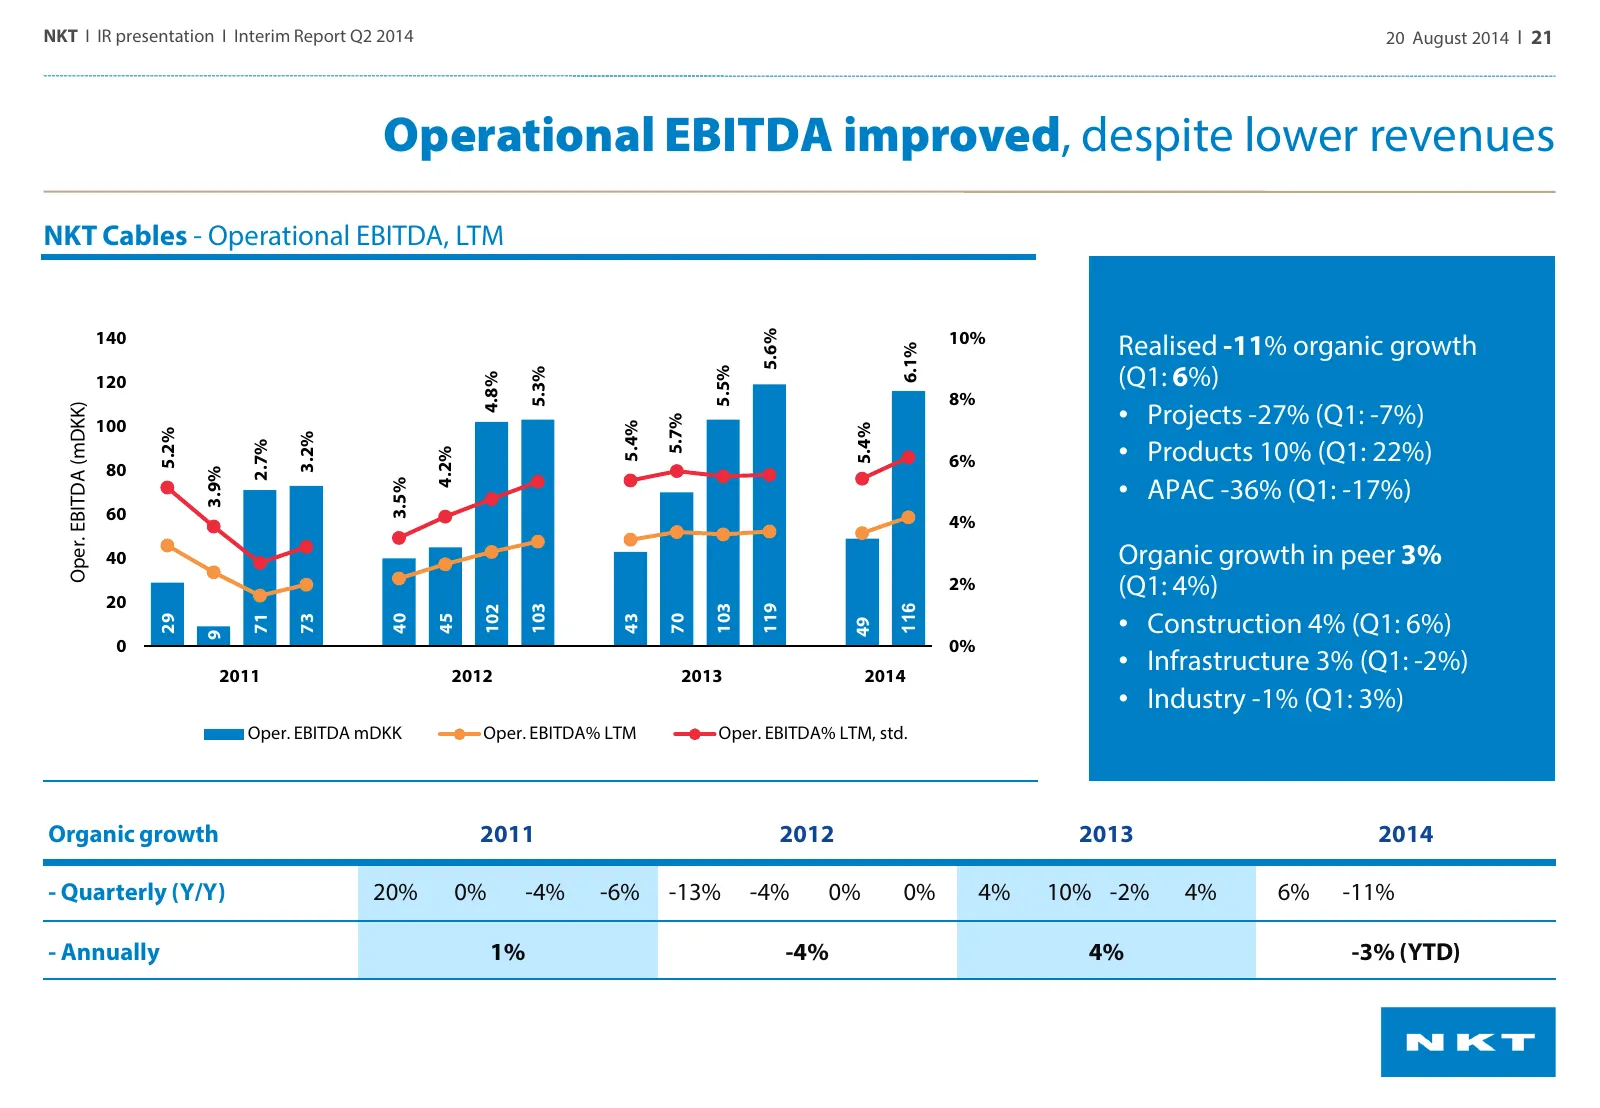
NKT I IR presentation I Interim Report Q2 2014 20 August 2014 I 21 Operational EBITDA improved, despite lower revenues NKT Cables - Operational EBITDA, LTM 140 10% Realised -11% organic growth 5.6% 6.1% (Q1: 6%) 5.5% 5.3% 120 4.8% 8% • Projects -27% (Q1: -7%) Oper. EBITDA (mDKK) 5.7% 100 5.4% 5.4% 5
Slide 22: Type of projects executed result in lower revenue, DRIVE showing clear impact
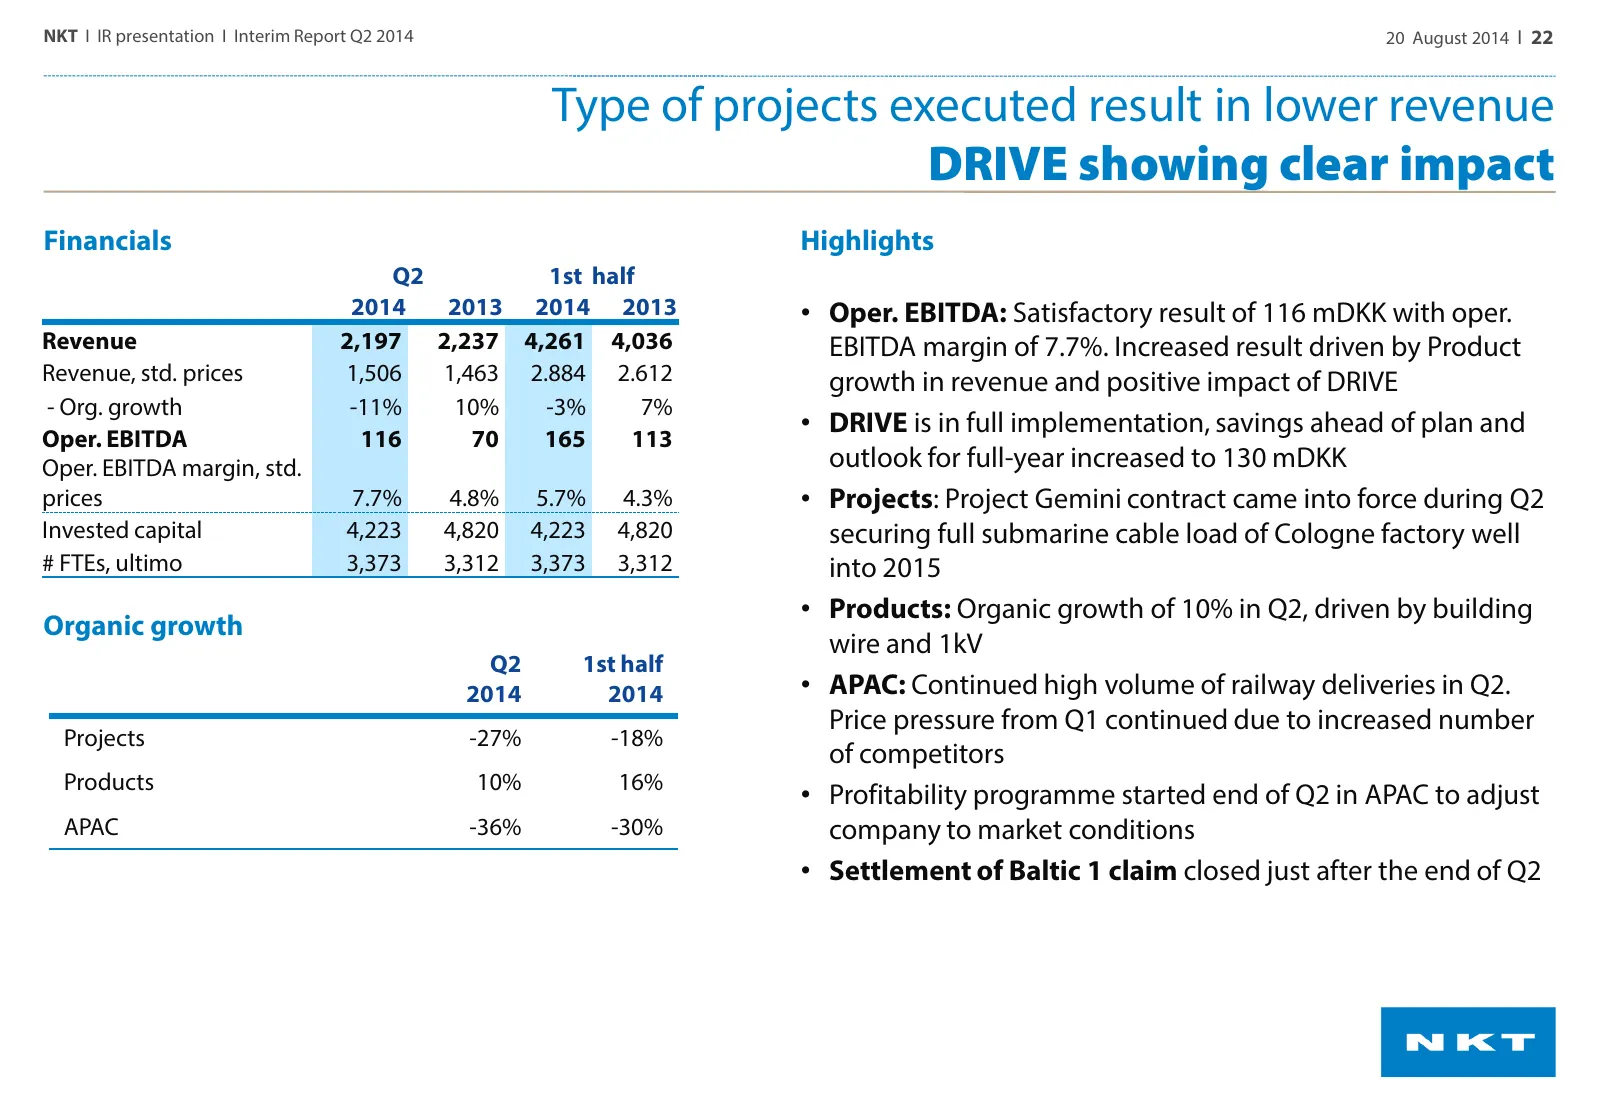
NKT I IR presentation I Interim Report Q2 2014 20 August 2014 I 22 Type of projects executed result in lower revenue DRIVE showing clear impact Financials Highlights Q2 1st half 2014 2013 2014 2013 • Oper. EBITDA: Satisfactory result of 116 mDKK with oper. Revenue 2,197 2,237 4,261 4,036 EBITDA marg
Slide 23: Baltic 1 claim finally settled
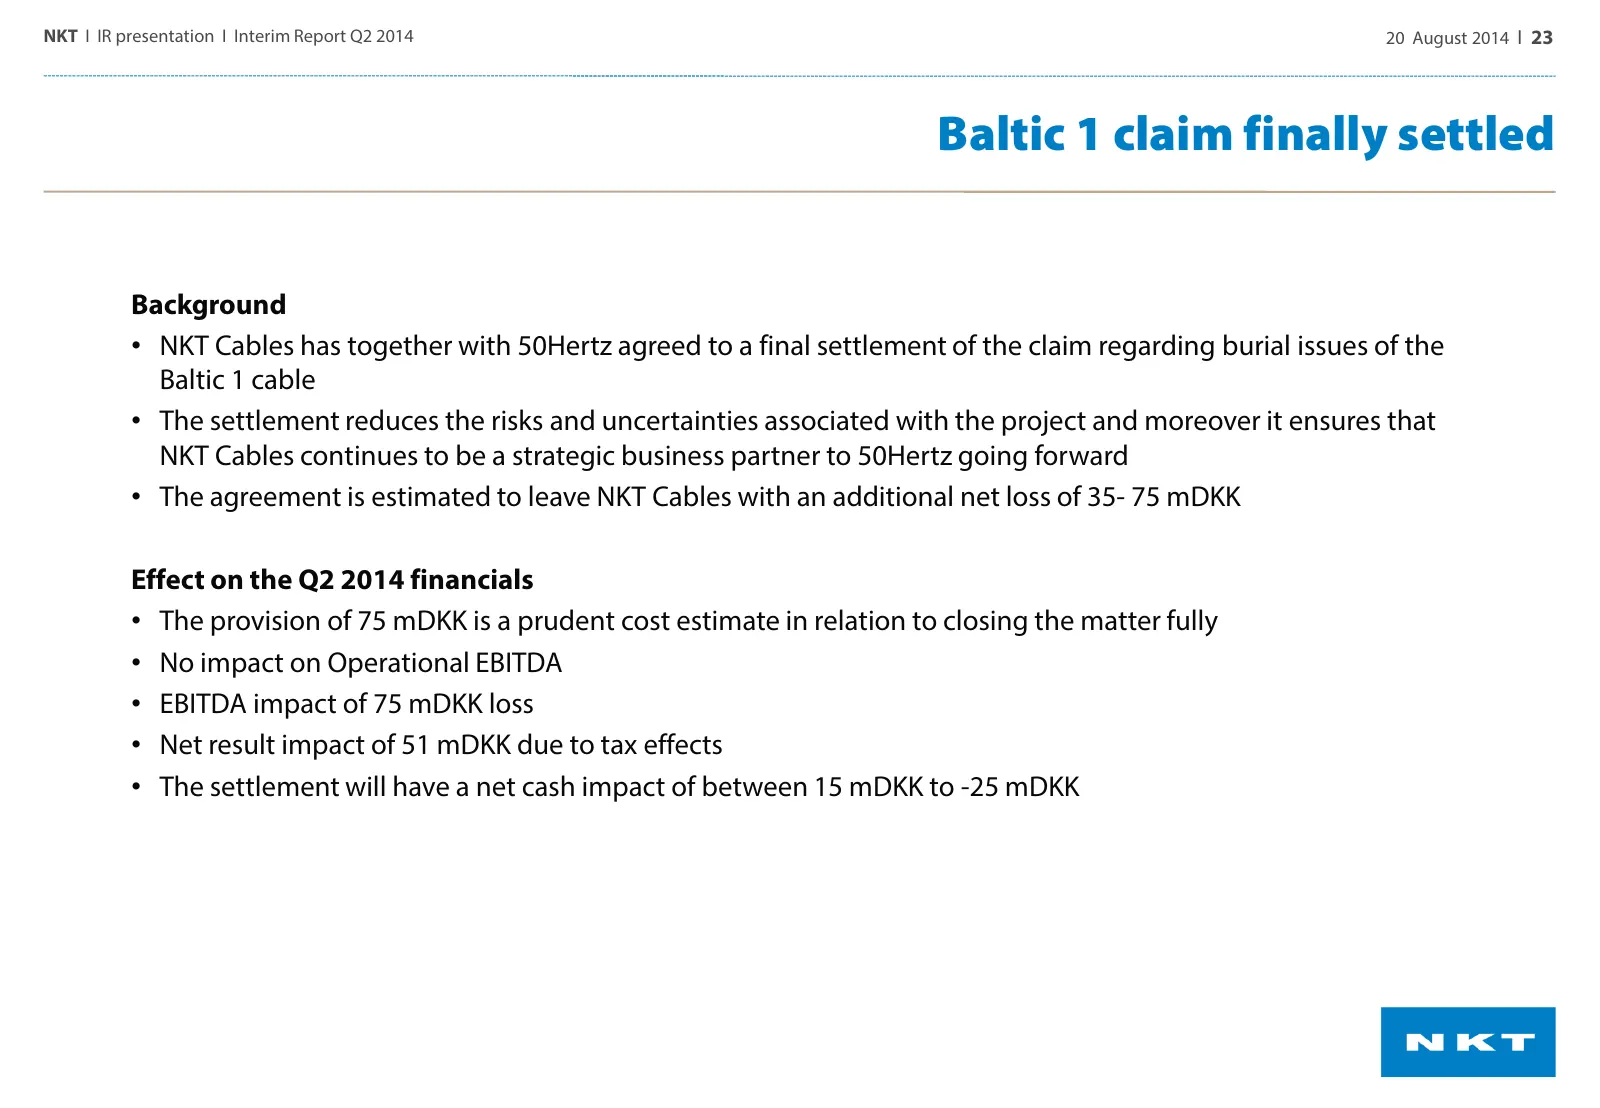
NKT I IR presentation I Interim Report Q2 2014 20 August 2014 I 23 Baltic 1 claim finally settled Background • NKT Cables has together with 50Hertz agreed to a final settlement of the claim regarding burial issues of the Baltic 1 cable • The settlement reduces the risks and uncertainties associated
Slide 24: Successful integration of Ericsson close to be completed...
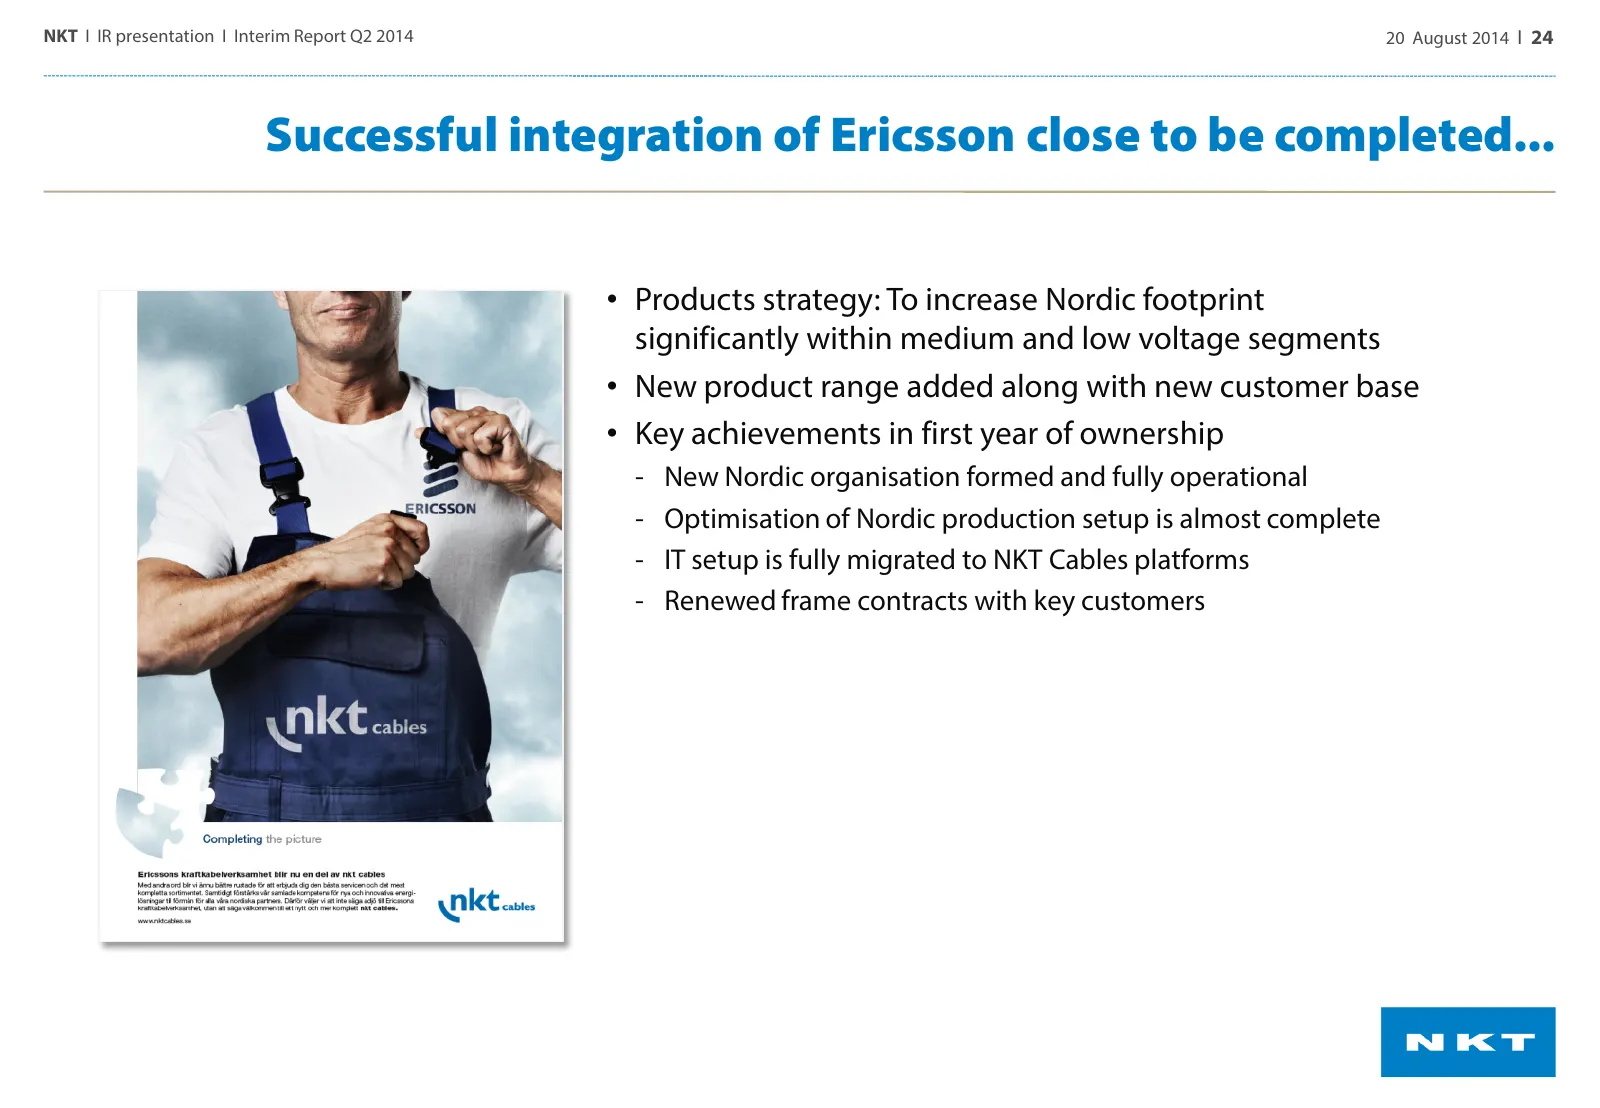
NKT I IR presentation I Interim Report Q2 2014 20 August 2014 I 24 Successful integration of Ericsson close to be completed... • Products strategy: To increase Nordic footprint significantly within medium and low voltage segments • New product range added along with new customer base • Key achieveme
Slide 25: ...and delivering results above ambitious business case
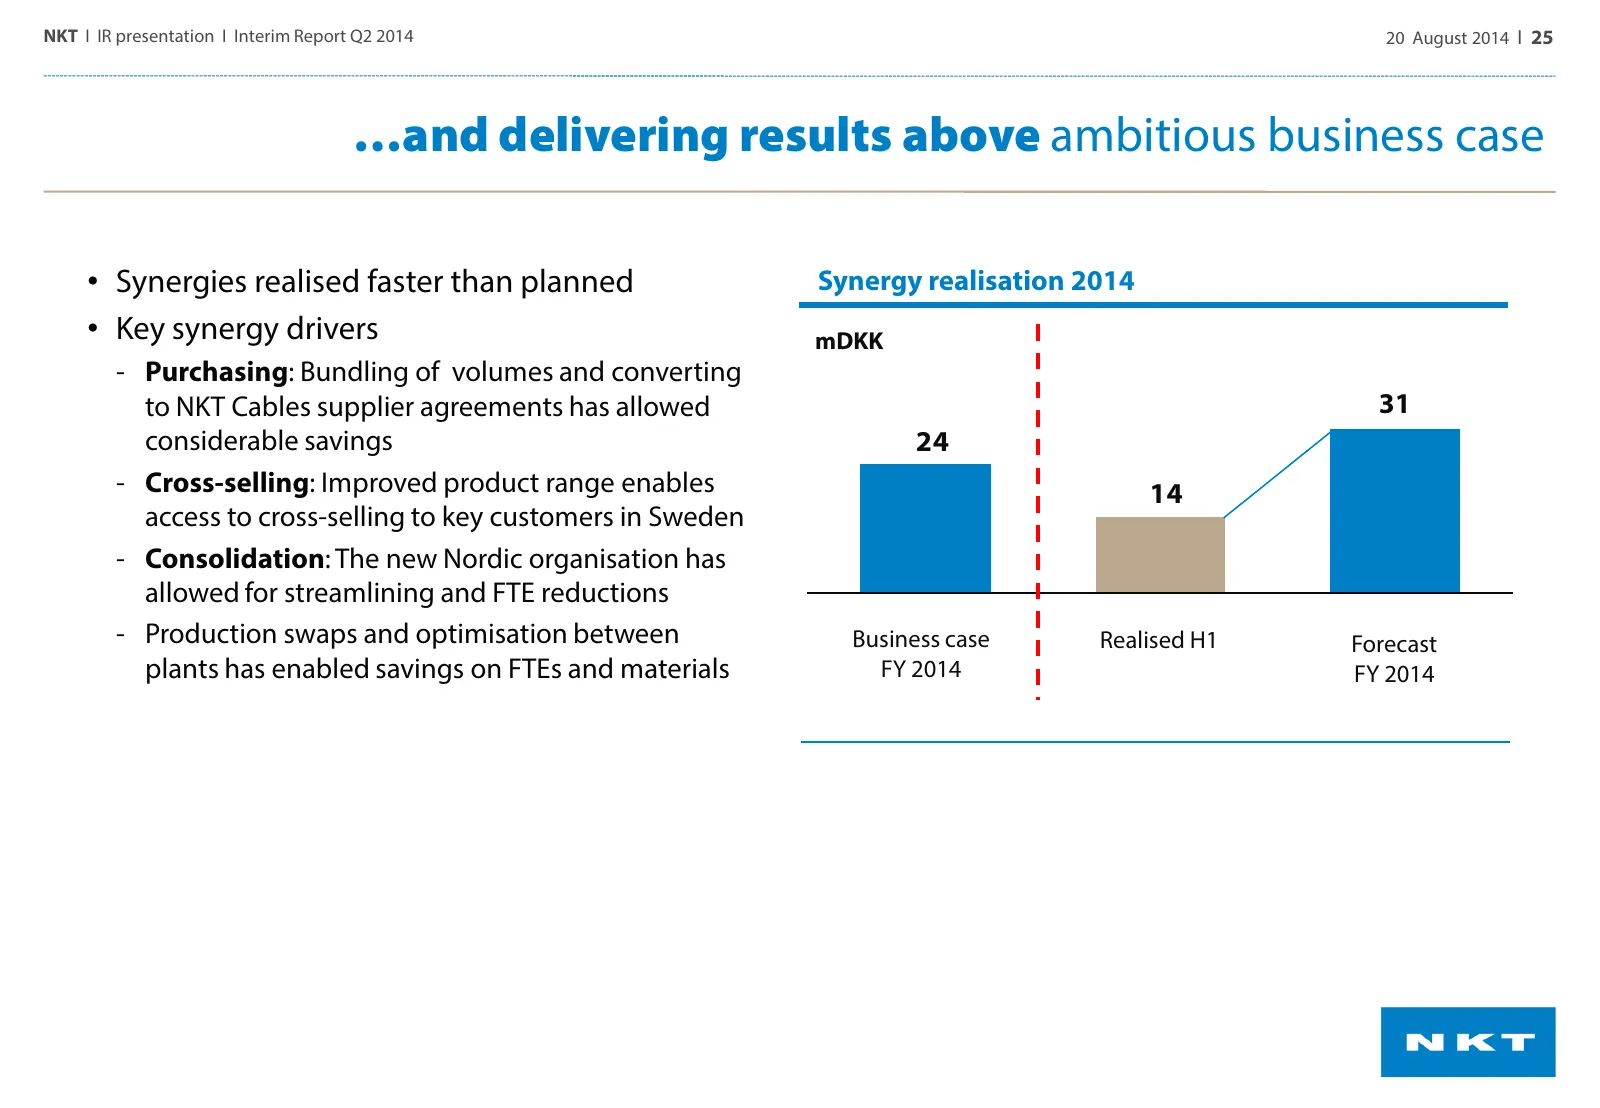
NKT I IR presentation I Interim Report Q2 2014 20 August 2014 I 25 …and delivering results above ambitious business case • Synergies realised faster than planned Synergy realisation 2014 • Key synergy drivers mDKK ‐ Purchasing: Bundling of volumes and converting to NKT Cables supplier agreements has
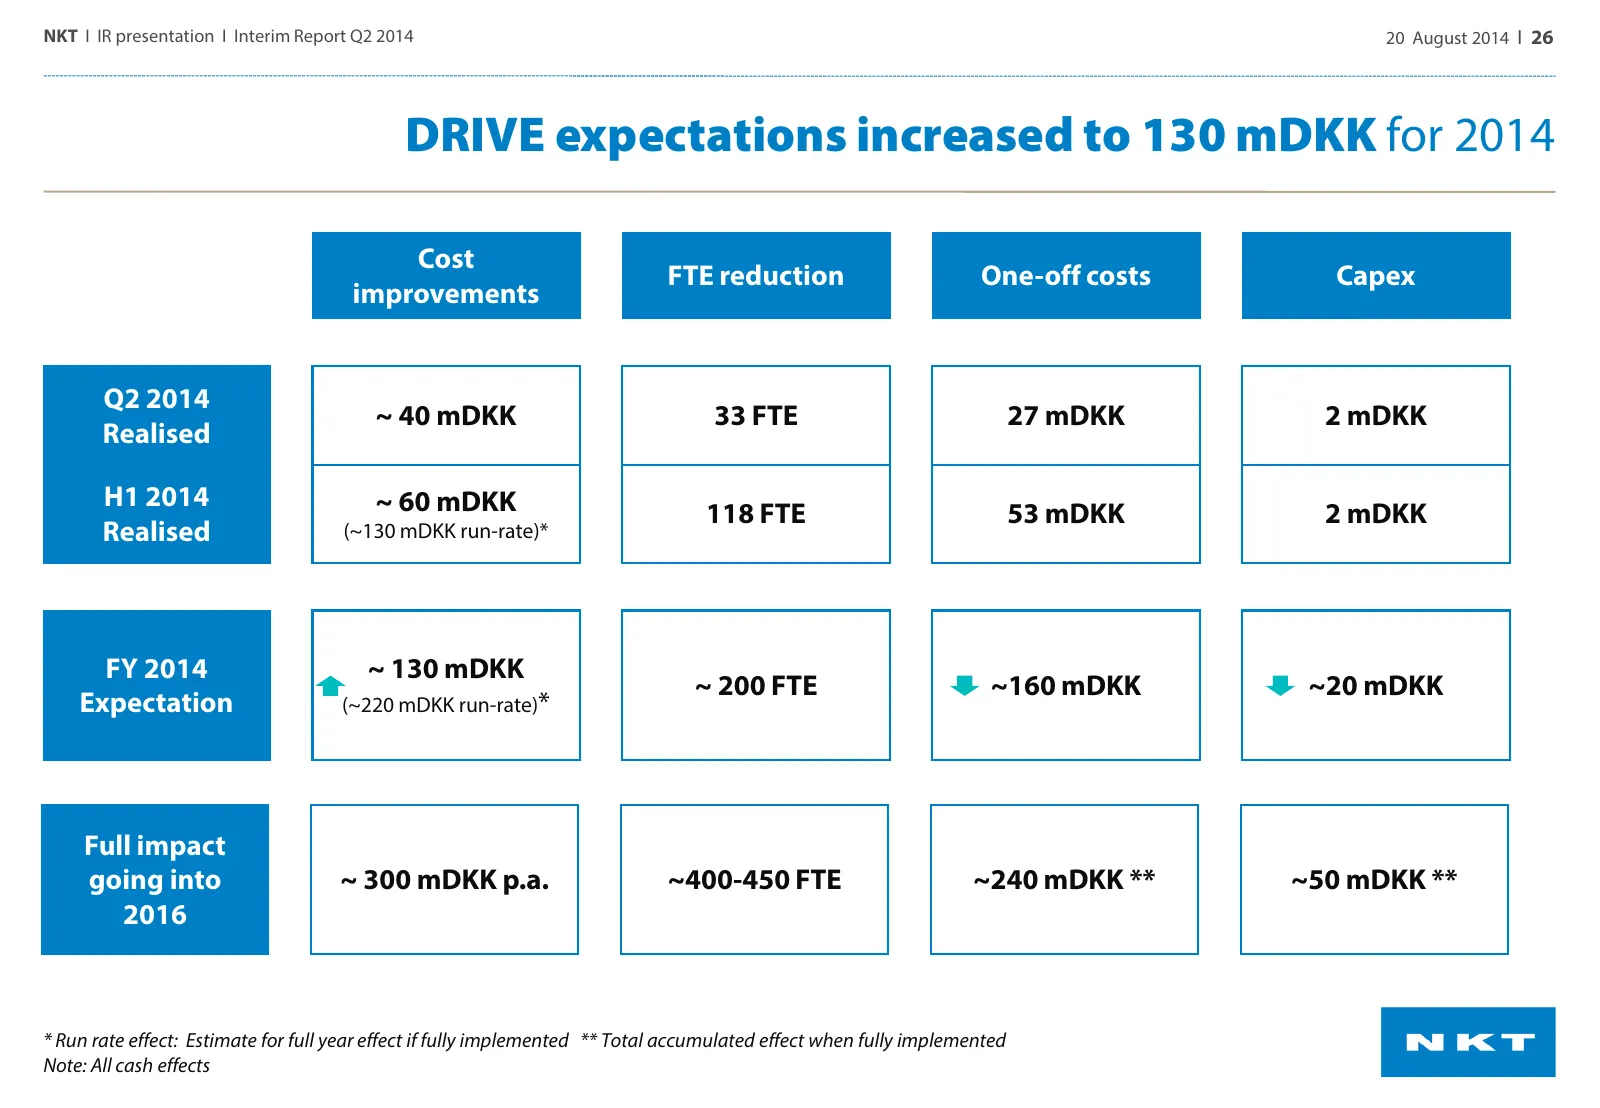
Slide 26: DRIVE expectations increased to 130 mDKK for 2014
NKT I IR presentation I Interim Report Q2 2014 20 August 2014 I 26 DRIVE expectations increased to 130 mDKK for 2014 Cost FTE reduction One-off costs Capex improvements Q2 2014 ~ 40 mDKK 33 FTE 27 mDKK 2 mDKK Realised H1 2014 ~ 60 mDKK 118 FTE 53 mDKK 2 mDKK Realised (~130 mDKK run-rate)* FY 2014 ~
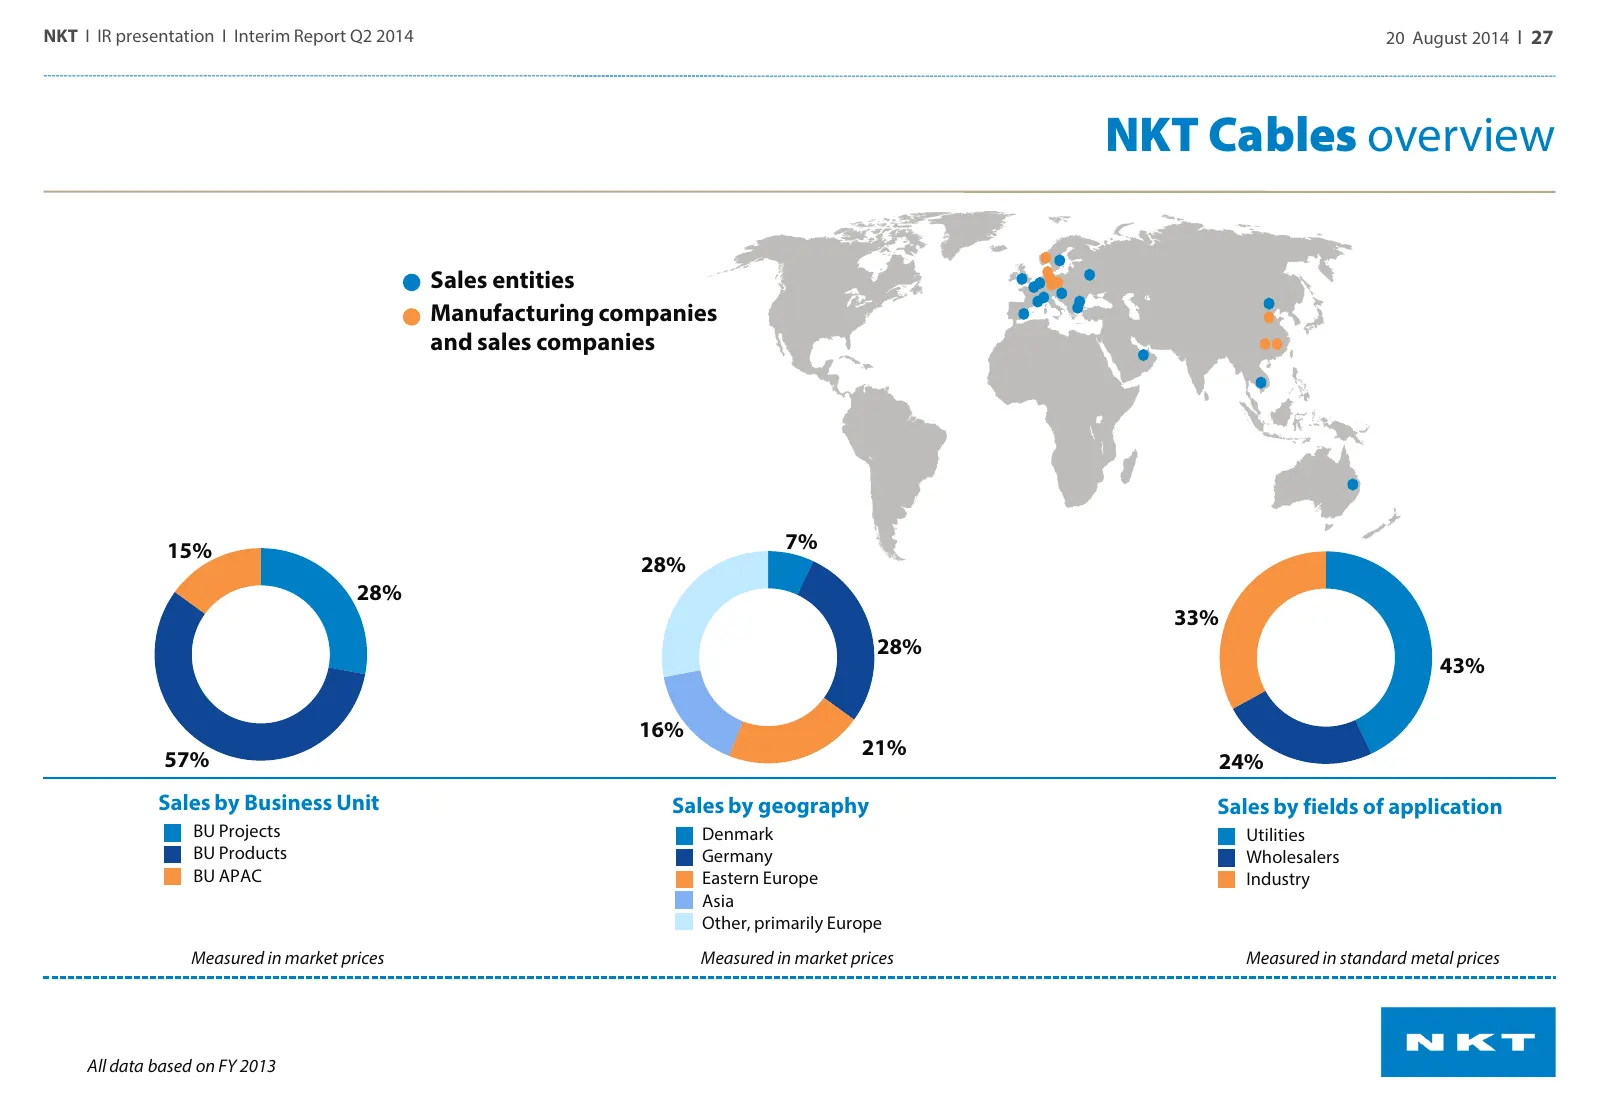
Slide 27: NKT Cables overview
NKT I IR presentation I Interim Report Q2 2014 20 August 2014 I 27 NKT Cables overview Sales entities Manufacturing companies and sales companies 15% 7% 28% 28% 33% 28% 43% 16% 21% 57% 24% Sales by Business Unit Sales by geography Sales by fields of application BU Projects Denmark Utilities BU Produ

Slide 28: Photonics Group
NKT I IR presentation I Interim Report Q2 2014 20 August 2014 I 28 Photonics Group
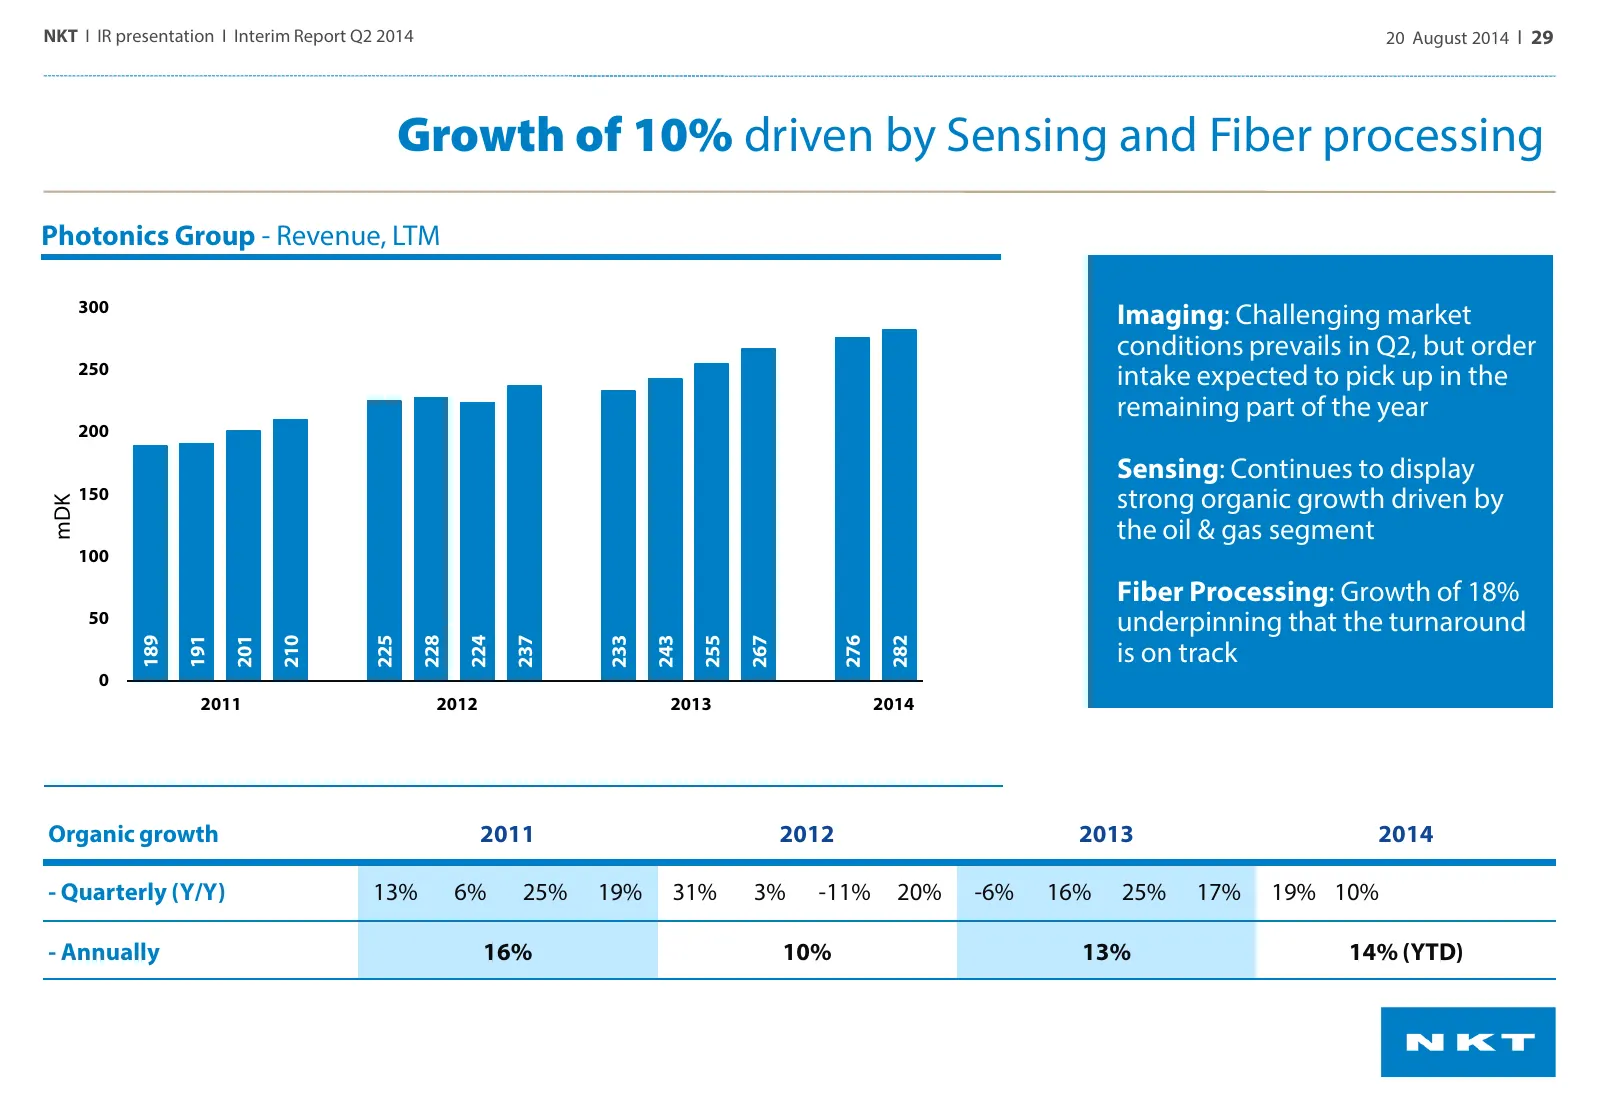
Slide 29: Growth of 10% driven by Sensing and Fiber processing
NKT I IR presentation I Interim Report Q2 2014 20 August 2014 I 29 Growth of 10% driven by Sensing and Fiber processing Photonics Group - Revenue, LTM 300 Imaging: Challenging market conditions prevails in Q2, but order 250 intake expected to pick up in the remaining part of the year 200 Sensing: Co
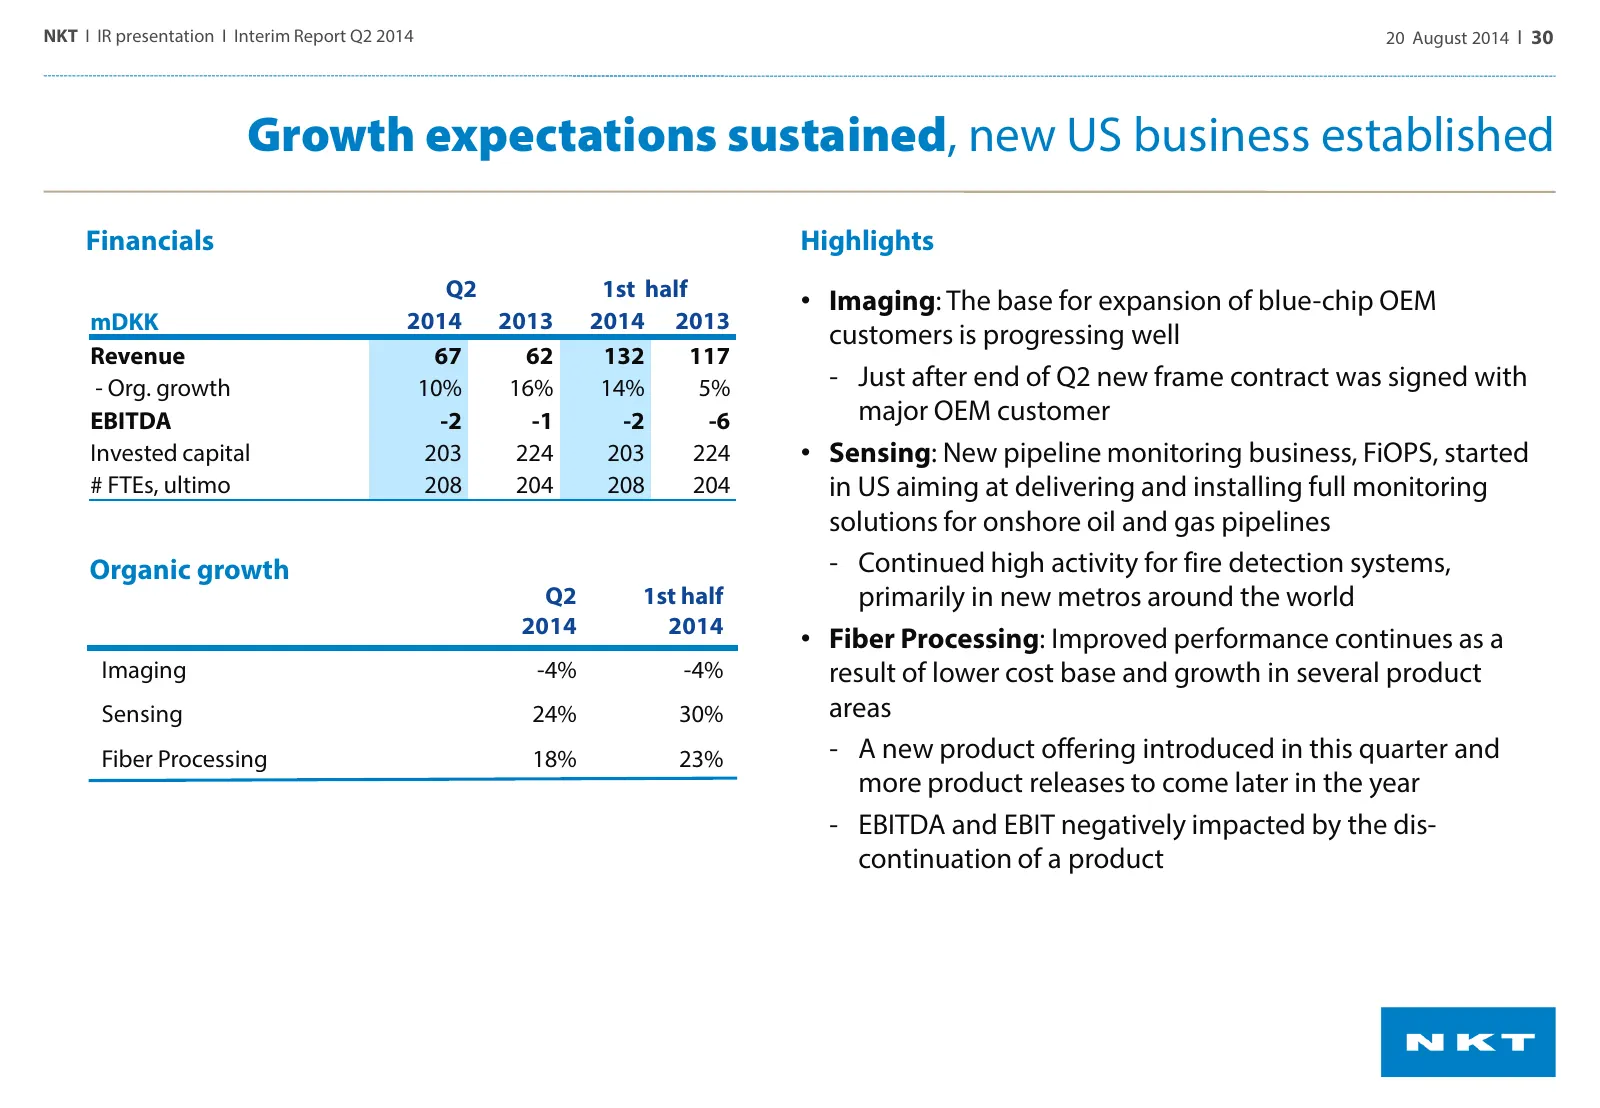
Slide 30: Growth expectations sustained, new US business established
NKT I IR presentation I Interim Report Q2 2014 20 August 2014 I 30 Growth expectations sustained, new US business established Financials Highlights Q2 1st half • Imaging: The base for expansion of blue-chip OEM mDKK 2014 2013 2014 2013 customers is progressing well Revenue 67 62 132 117 - Org. growt
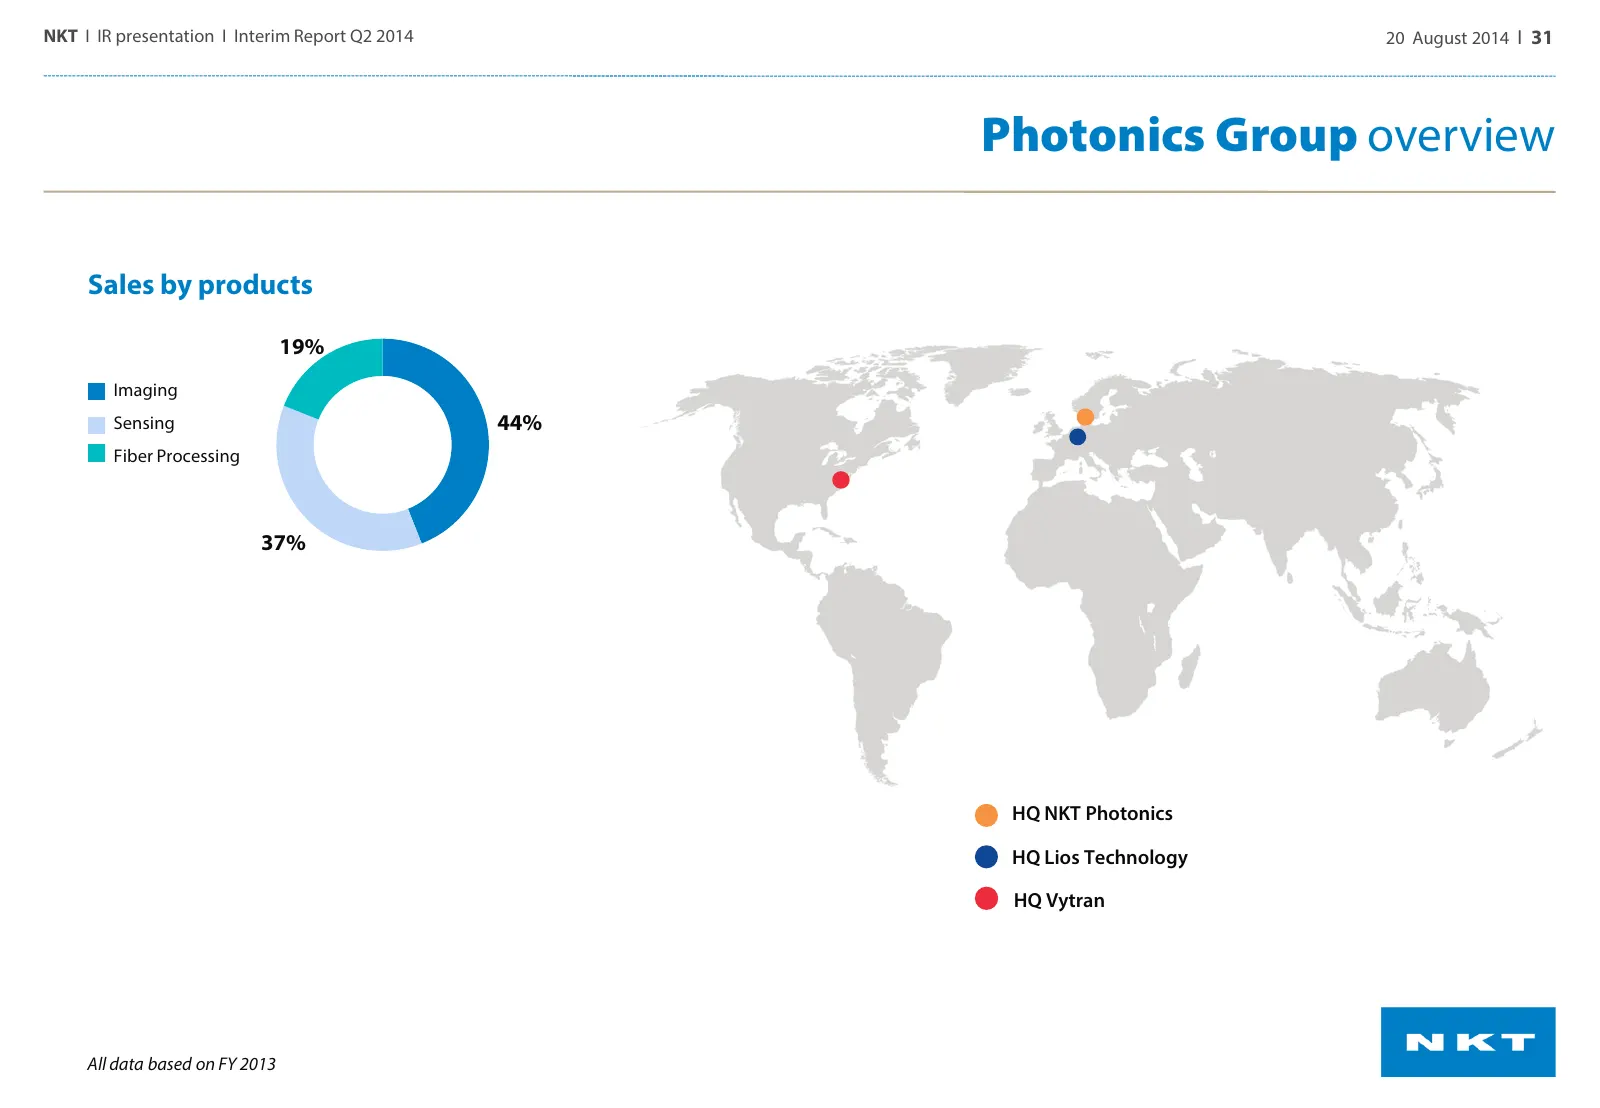
Slide 31: Photonics Group overview
NKT I IR presentation I Interim Report Q2 2014 20 August 2014 I 31 Photonics Group overview Sales by products 19% Imaging Sensing 44% Fiber Processing 37% HQ NKT Photonics HQ Lios Technology HQ Vytran All data based on FY 2013
Slide 32: Agenda: Expectations 2014
NKT I IR presentation I Interim Report Q2 2014 20 August 2014 I 32 Agenda Highlights Q2 2014 Business areas • Nilfisk-Advance • NKT Cables • Photonics Group Expectations 2014 Questions & Answers
Slide 33: Maintain expectations for full year 2014
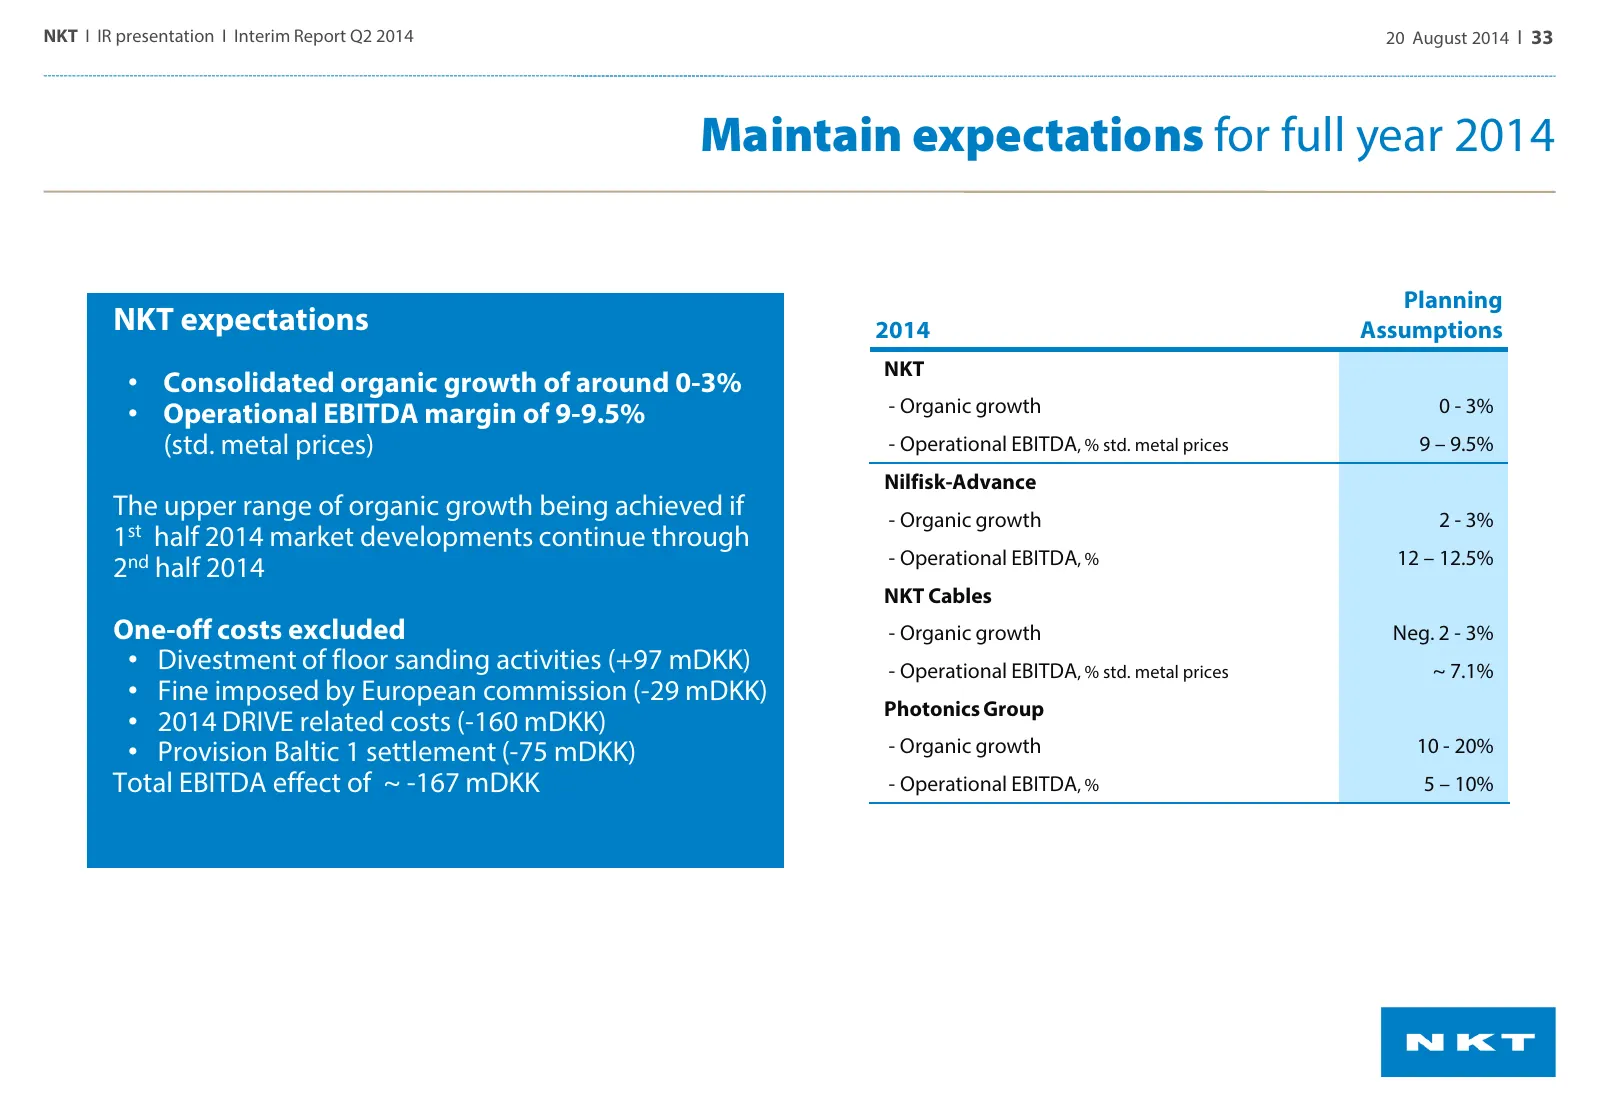
NKT I IR presentation I Interim Report Q2 2014 20 August 2014 I 33 Maintain expectations for full year 2014 Planning NKT expectations 2014 Assumptions NKT • Consolidated organic growth of around 0-3% • Operational EBITDA margin of 9-9.5% - Organic growth 0 - 3% (std. metal prices) - Operational EBIT
Slide 34: Agenda: Questions & Answers
NKT I IR presentation I Interim Report Q2 2014 20 August 2014 I 34 Agenda Highlights Q2 2014 Business areas • Nilfisk-Advance • NKT Cables • Photonics Group Expectations 2014 Questions & Answers
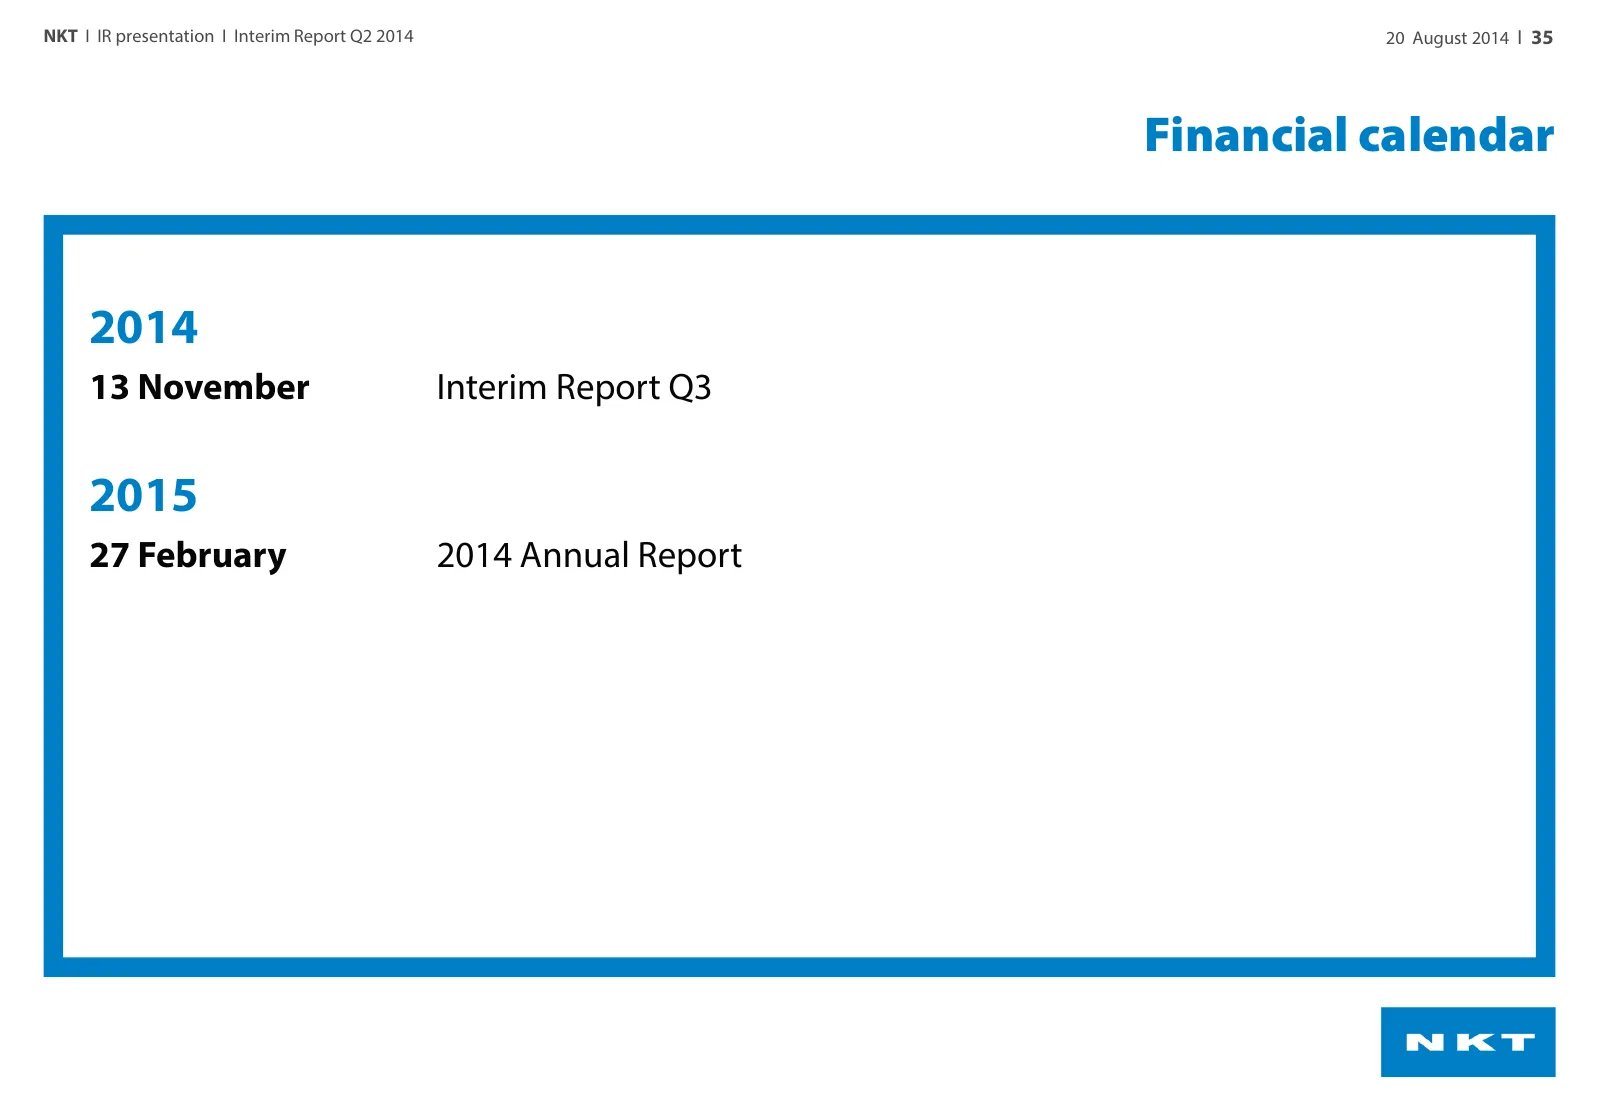
Slide 35: Financial calendar
NKT I IR presentation I Interim Report Q2 2014 20 August 2014 I 35 Financial calendar 2014 13 November Interim Report Q3 2015 27 February 2014 Annual Report
Source: Internet Archive copy of nkt.dk
More decks from NKT A/S
 Q2 2026 Earnings Presentation20 slides · Aug 14, 2026
 Q1 2026 Earnings Presentation20 slides · May 13, 2026
 Q4 2025 Earnings Presentation22 slides · Feb 25, 2026
 Q3 2025 Earnings Presentation27 slides · Nov 19, 2025
 Q2 2025 Earnings Presentation20 slides · Aug 15, 2025
 Q1 2025 Earnings Presentation20 slides · May 9, 2025