Hayes Lemmerz International Inc
Hayes Lemmerz International — Q2 2005 Earnings Presentation
29 slides from Hayes Lemmerz International's earnings presentation, Sep 8, 2005
Slide 1: Second Quarter Results September 8, 2005
Second Quarter Results September 8, 2005
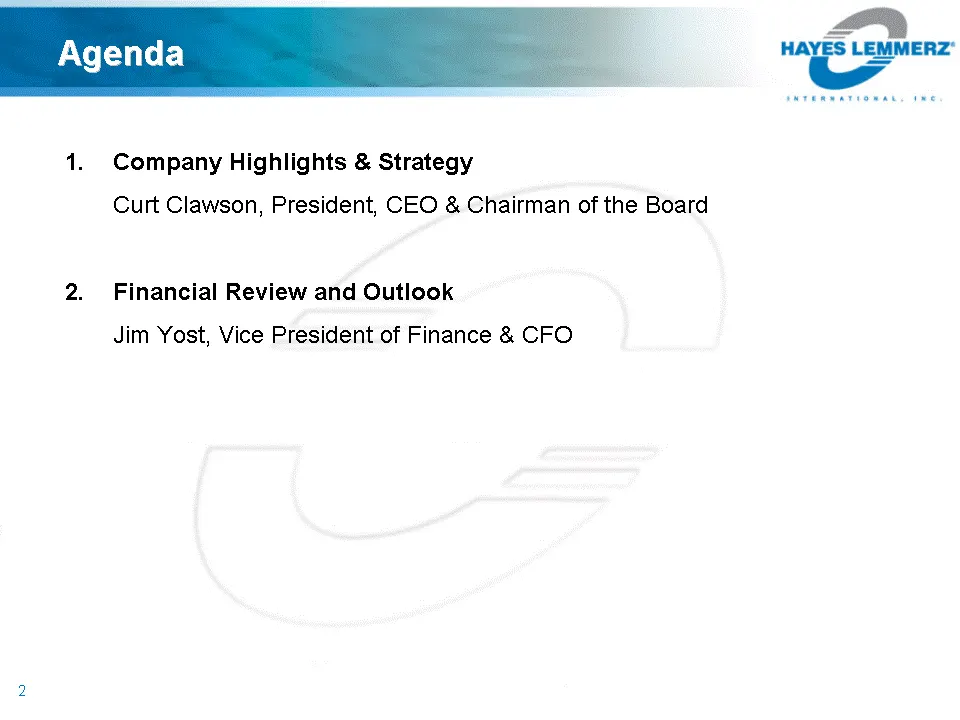
Slide 2: Agenda
Agenda Company Highlights & Strategy Curt Clawson, President, CEO & Chairman of the Board Financial Review and Outlook Jim Yost, Vice President of Finance & CFO
Slide 3: Company Overview
Company Overview HAYES LEMMERZ’ INTERNATIONAL, ENC.
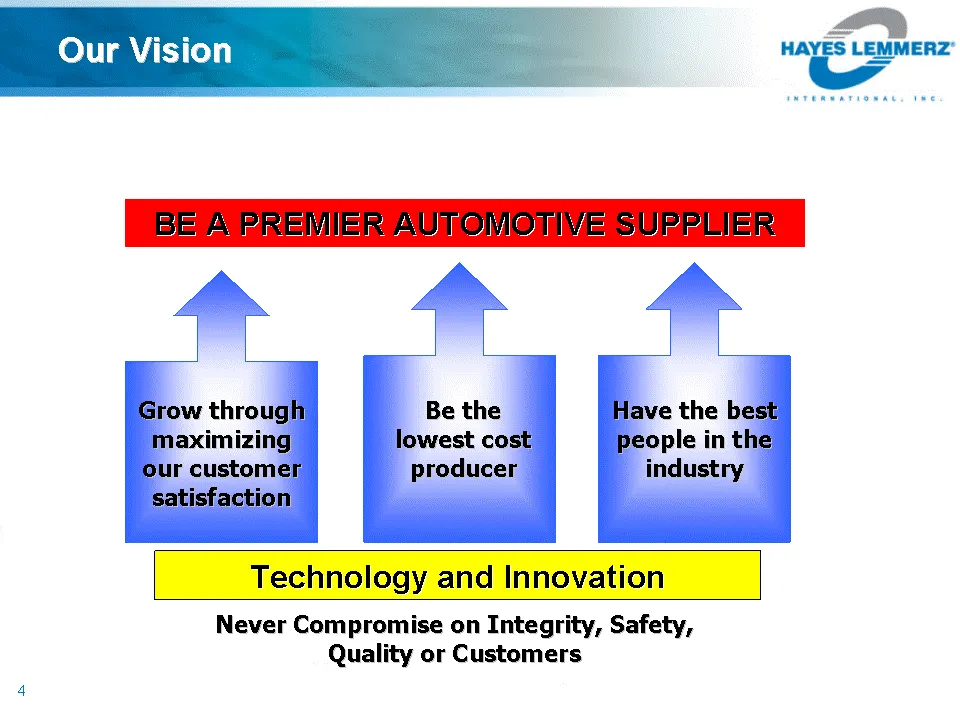
Slide 4: Our Vision: Be a Premier Automotive Supplier
Never Compromise on Integrity, Safety, Quality or Customers BE A PREMIER AUTOMOTIVE SUPPLIER Be the lowest cost producer Have the best people in the industry Grow through maximizing our customer satisfaction Technology and Innovation Our Vision
Slide 5: Summary
Summary Difficult second quarter in North America Company continues growth and profitability strategy Restructure unprofitable operations Expand and invest in profitable international locations Expect second half 2005 to be better International business growing and profitable Maintaining adequate li
Slide 6: Second Quarter Results Summary
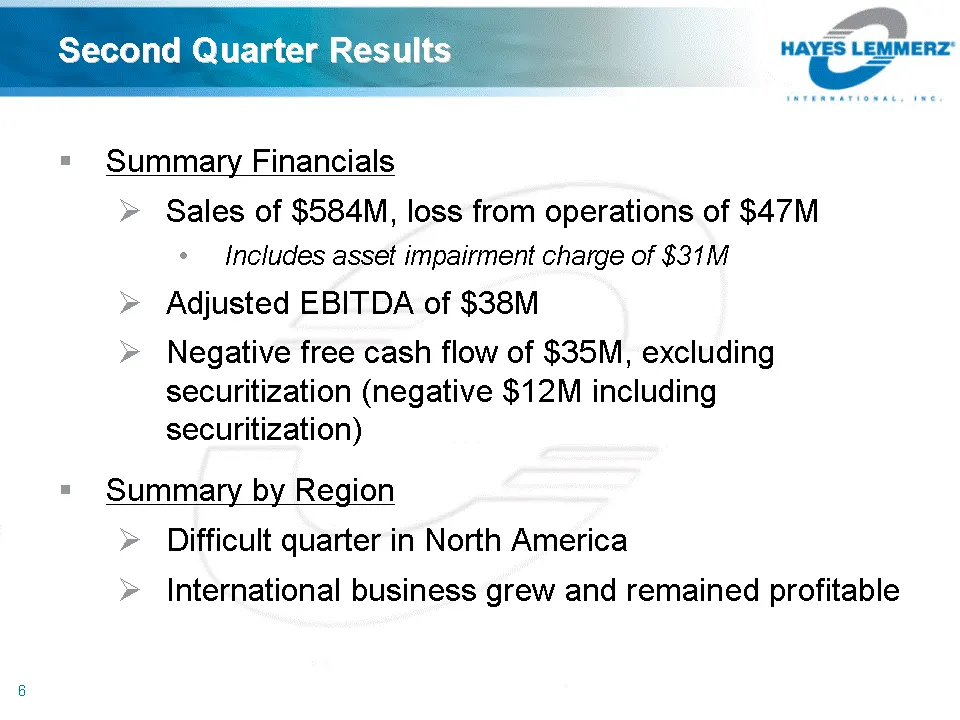
Second Quarter Results Summary Financials Sales of $584M, loss from operations of $47M Includes asset impairment charge of $31M Adjusted EBITDA of $38M Negative free cash flow of $35M, excluding securitization (negative $12M including securitization) Summary by Region Difficult quarter in North Amer
Slide 7: Primary Drivers of Q2 Results
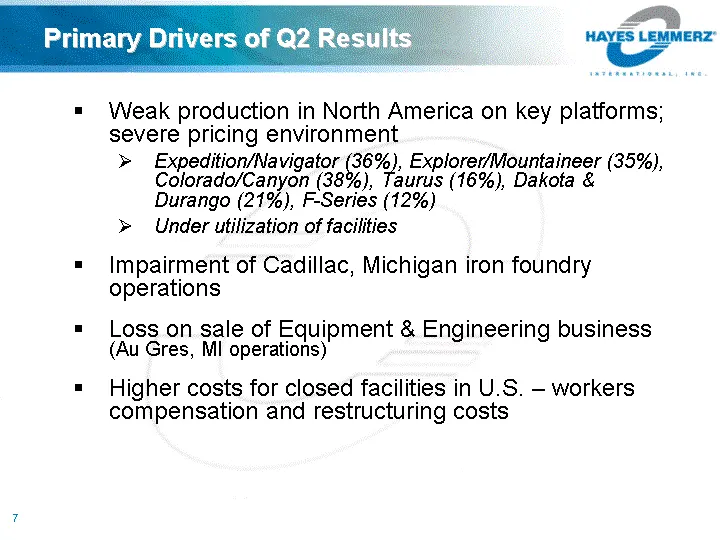
Primary Drivers of Q2 Results Weak production in North America on key platforms; severe pricing environment Expedition/Navigator (36%), Explorer/Mountaineer (35%), Colorado/Canyon (38%), Taurus (16%), Dakota & Durango (21%), F-Series (12%) Under utilization of facilities Impairment of Cadillac, Mich
Slide 8: Cadillac, MI Suspension Facility
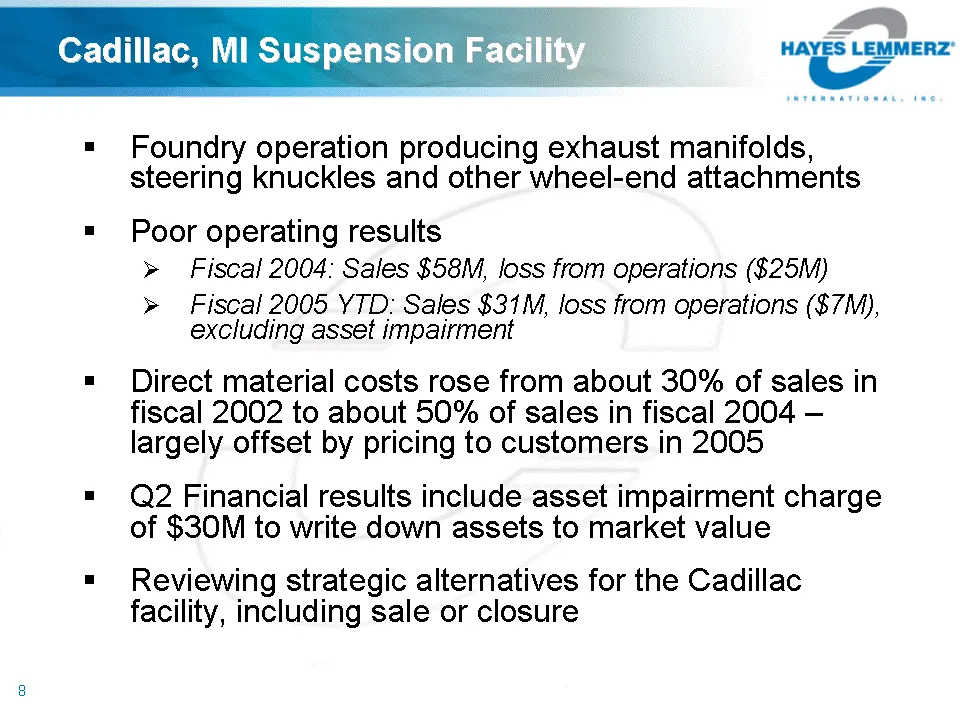
Cadillac, MI Suspension Facility Foundry operation producing exhaust manifolds, steering knuckles and other wheel-end attachments Poor operating results Fiscal 2004: Sales $58M, loss from operations ($25M) Fiscal 2005 YTD: Sales $31M, loss from operations ($7M), excluding asset impairment Direct mat
Slide 9: Company Strategy
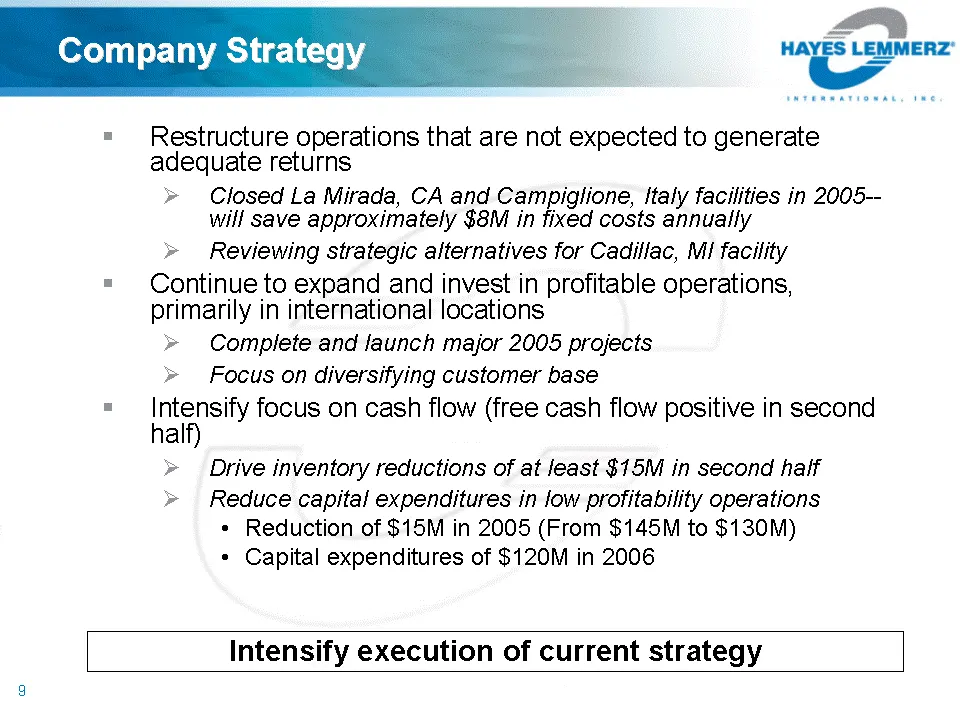
Company Strategy Restructure operations that are not expected to generate adequate returns Closed La Mirada, CA and Campiglione, Italy facilities in 2005-- will save approximately $8M in fixed costs annually Reviewing strategic alternatives for Cadillac, MI facility Continue to expand and invest in
Slide 10: Reinforcing Liquidity Position
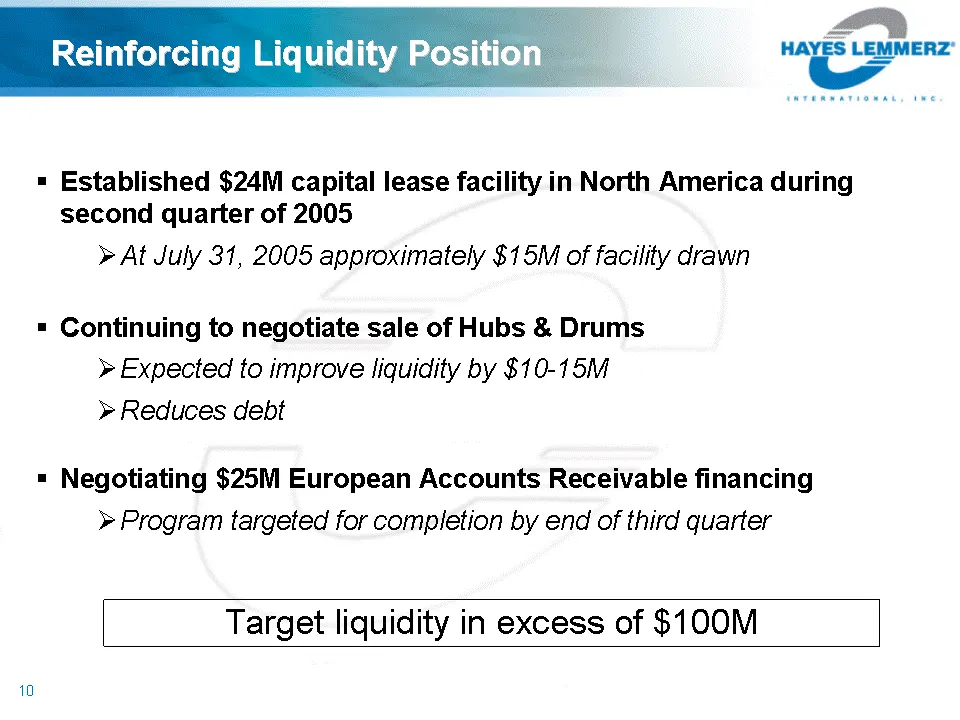
Reinforcing Liquidity Position Established $24M capital lease facility in North America during second quarter of 2005 At July 31, 2005 approximately $15M of facility drawn Continuing to negotiate sale of Hubs & Drums Expected to improve liquidity by $10-15M Reduces debt Negotiating $25M European Acc
Slide 11: Update on 2005 Key Projects
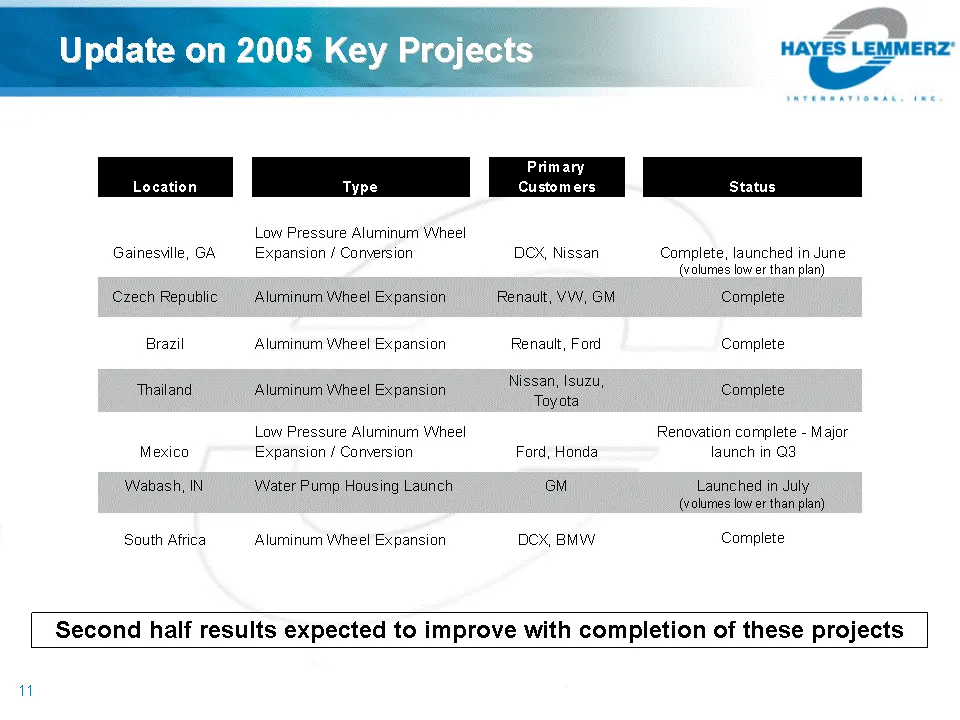
Update on 2005 Key Projects Second half results expected to improve with completion of these projects
Slide 12: Diversified Business Wins
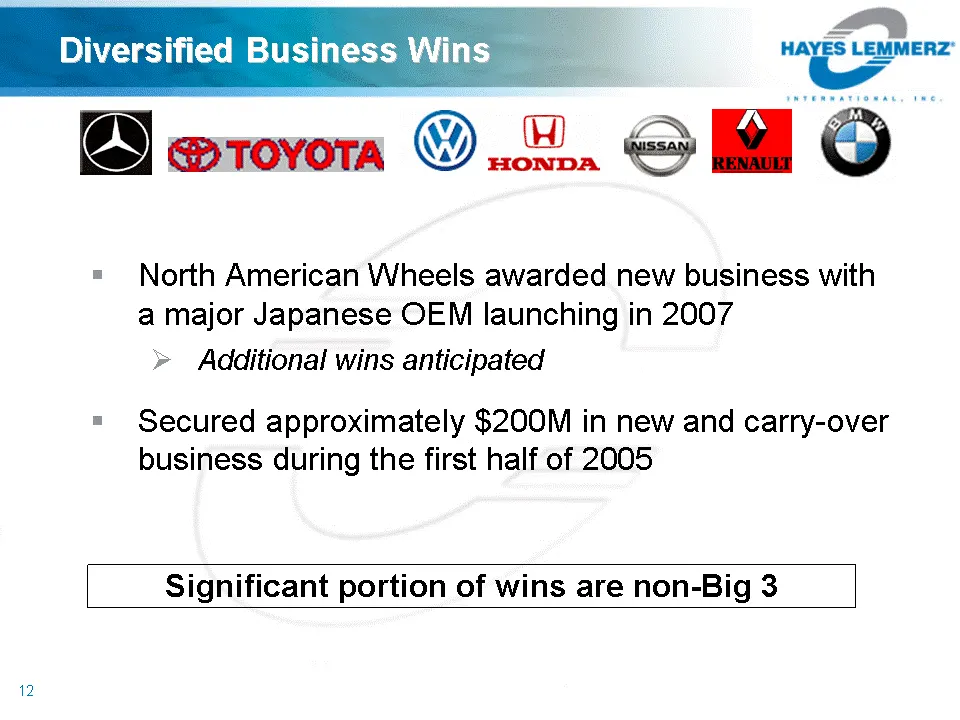
Diversified Business Wins North American Wheels awarded new business with a major Japanese OEM launching in 2007 Additional wins anticipated Secured approximately $200M in new and carry-over business during the first half of 2005 Significant portion of wins are non-Big 3
Slide 13: Industry and Customer Awards
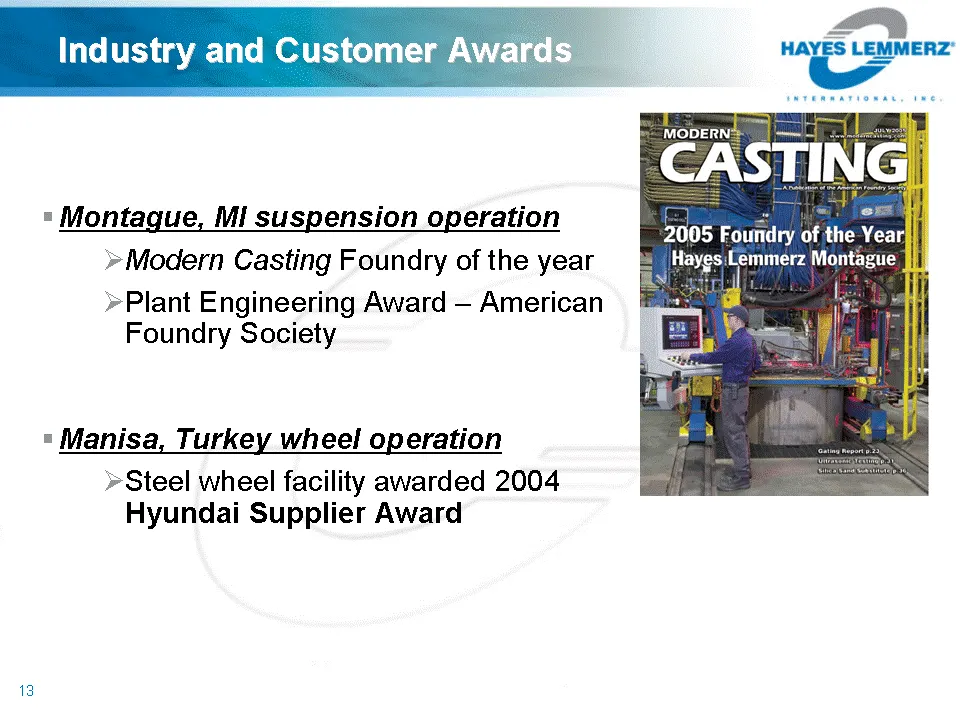
Industry and Customer Awards Montague, MI suspension operation Modern Casting Foundry of the year Plant Engineering Award - American Foundry Society Manisa, Turkey wheel operation Steel wheel facility awarded 2004 Hyundai Supplier Award Hyundai Supplier Award Hyundai Supplier Award Hyundai Supplier
Slide 14: Summary
Summary Difficult second quarter in North America Company continues growth and profitability strategy Restructure unprofitable operations Expand and invest in profitable international locations Expect second half 2005 to be better International business growing and profitable Maintaining adequate li
Slide 15: Financials
Financials HAYES LEMMERZ’ INTERNATIONAL, ENC.
Slide 16: Summary
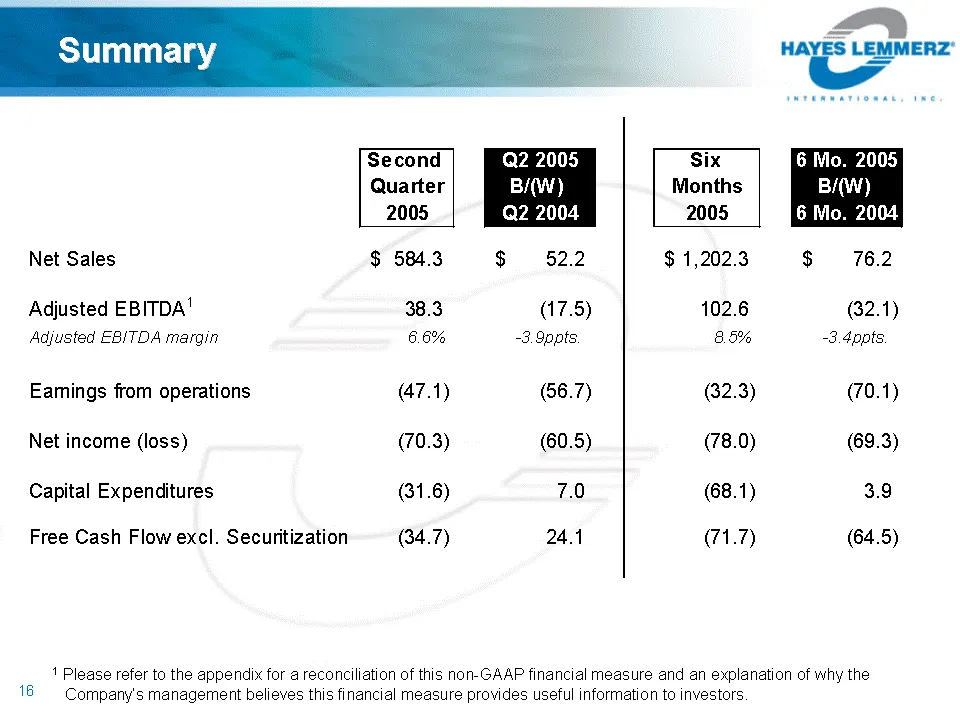
Summary 1 Please refer to the appendix for a reconciliation of this non-GAAP financial measure and an explanation of why the Company's management believes this financial measure provides useful information to investors.
Slide 17: Q2 2005 vs. Q2 2004 Change in Net Sales
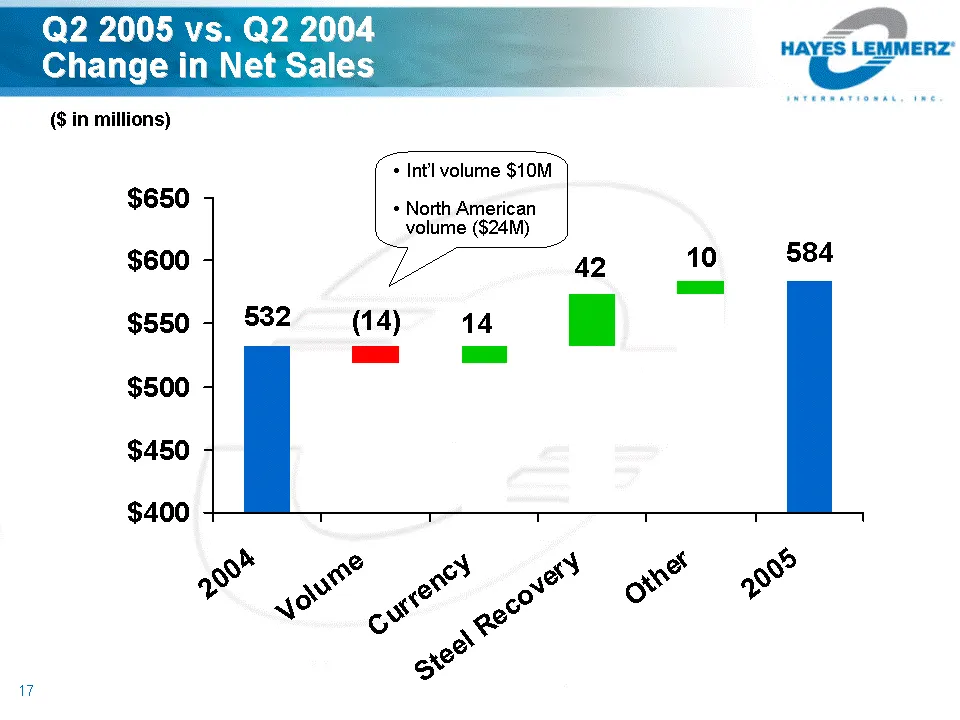
Q2 2005 vs. Q2 2004 Change in Net Sales 2004 Volume Currency Steel Recovery Other 2005 Show 532.1 584.2 Hide 0 518.6 518.6 532.5 574.4 0 Green 0 13.9 41.9 9.8 0 Red 0 13.5 0 0 ($ in millions) Int'l volume $10M North American volume ($24M)
Slide 18: Segment Summary
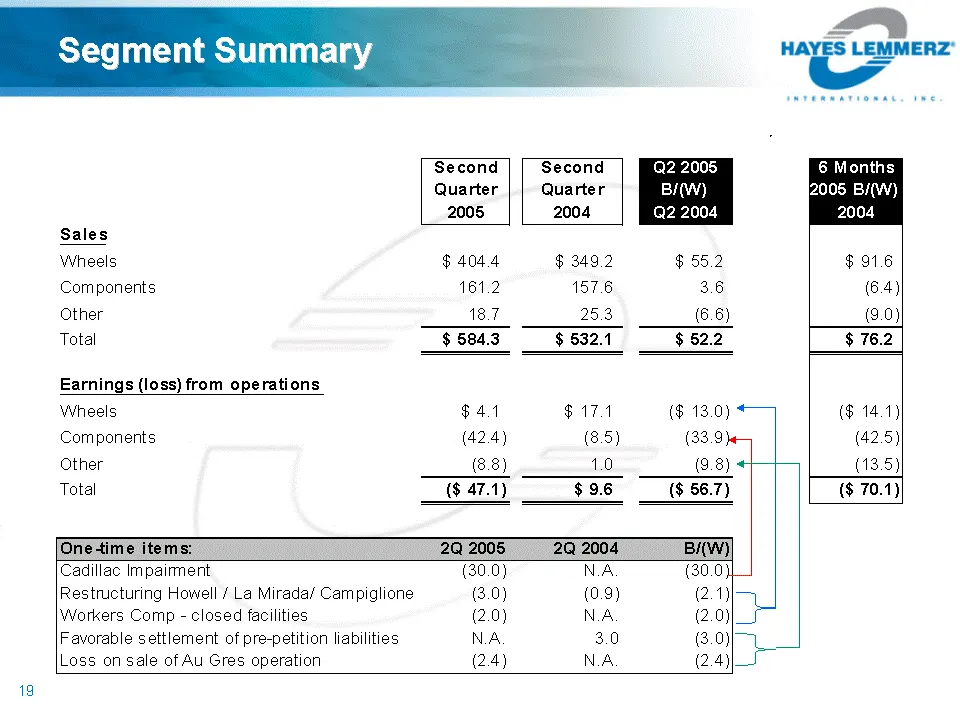
Segment Summar : HAYES LEMMERZ* Second | [ Second Q2 2005 Quarter || Quarter B/W) 2005 2004 Q2 2004 Sales Wheels $ 404.4 $ 349.2 $ 55.2 $91.6 Components 161.2 157.6 3.6 (6.4) Other 18.7 25.3 (6.6) (9.0) Total $584.3 $532.1 $52.2 $76.2 Earnings (loss) from operations Wheels $44 $4174 ($ 13.0) ($ 14.1
Slide 19: Free Cash Flow
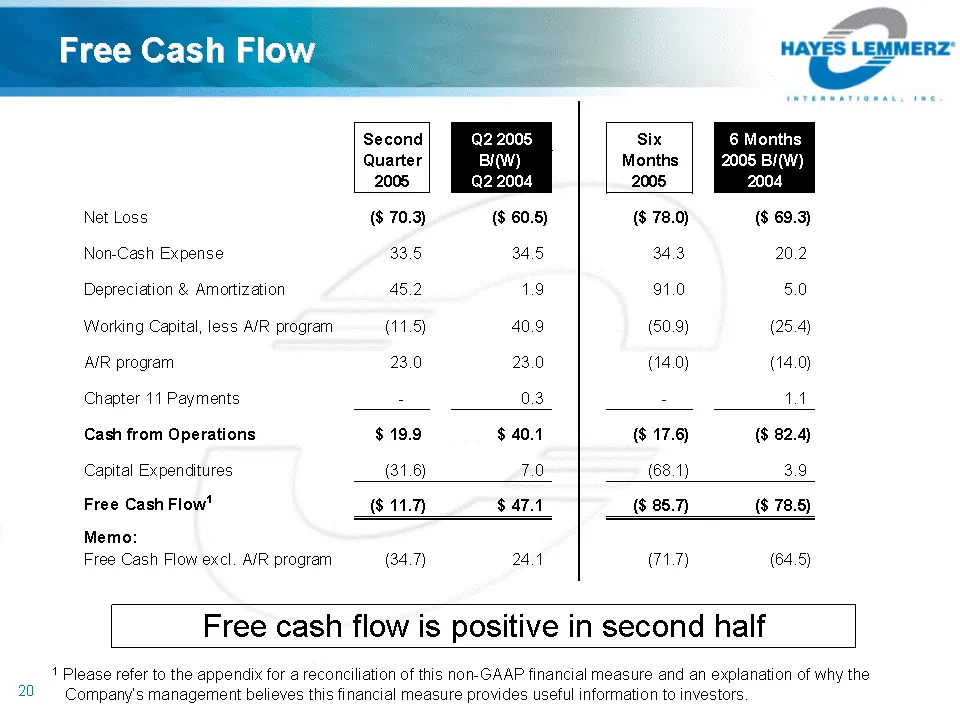
Free Cash Flow 1 Please refer to the appendix for a reconciliation of this non-GAAP financial measure and an explanation of why the Company's management believes this financial measure provides useful information to investors. Free cash flow is positive in second half
Slide 20: Liquidity
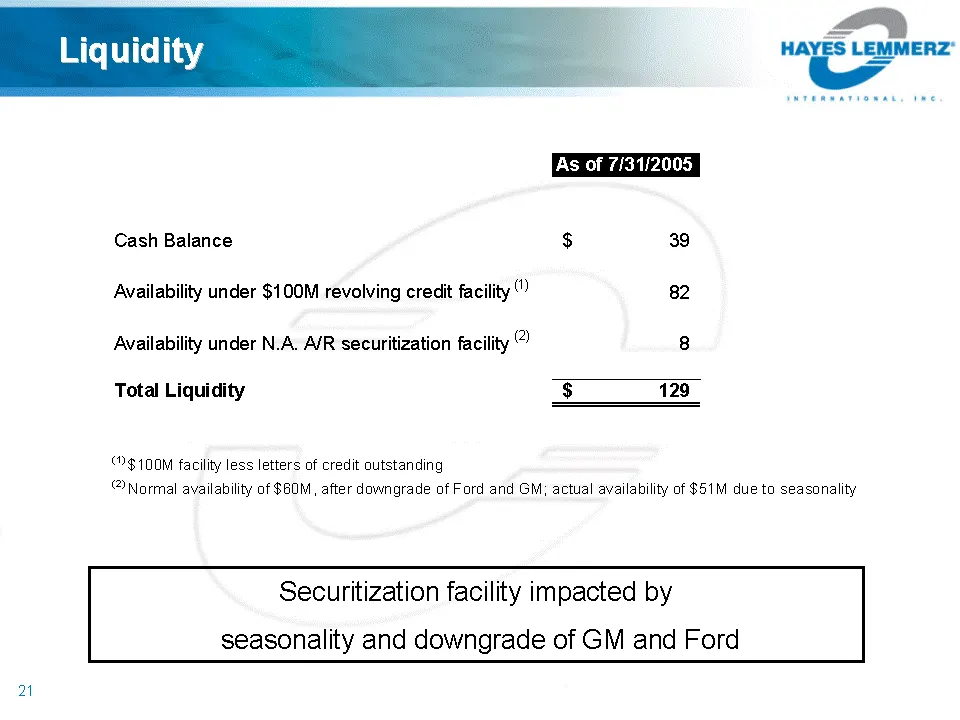
Liquidity Securitization facility impacted by seasonality and downgrade of GM and Ford
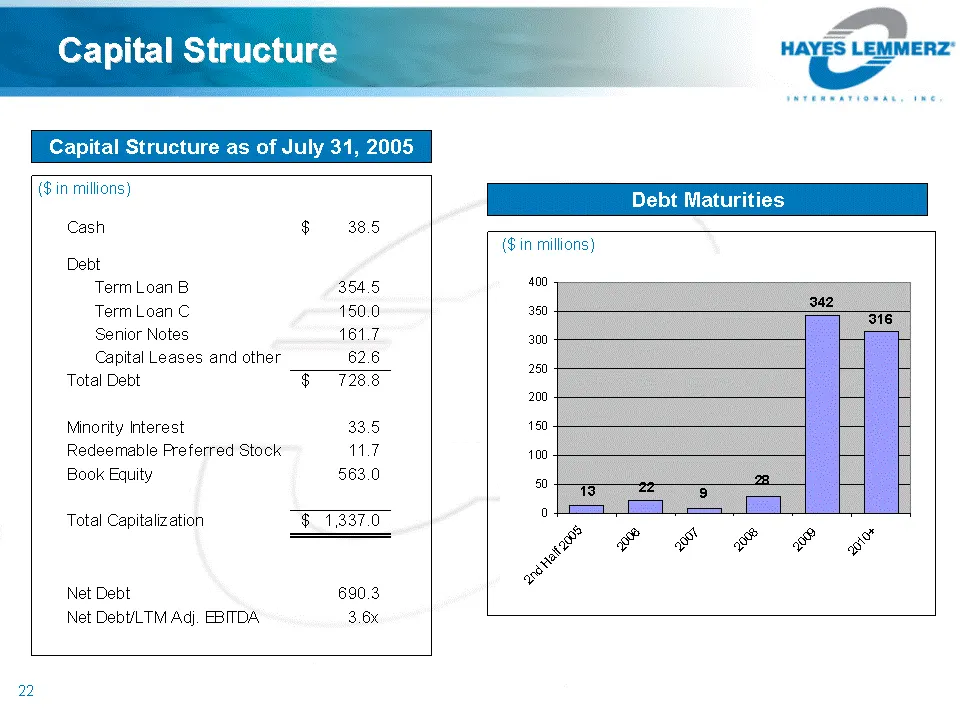
Slide 21: Capital Structure as of July 31, 2005
Capital Structure as of July 31, 2005 Debt Maturities ($ in millions) ($ in millions) Capital Structure
Slide 22: Outlook
Outlook HAYES LEMMERZ’ INTERNATIONAL, ENC.
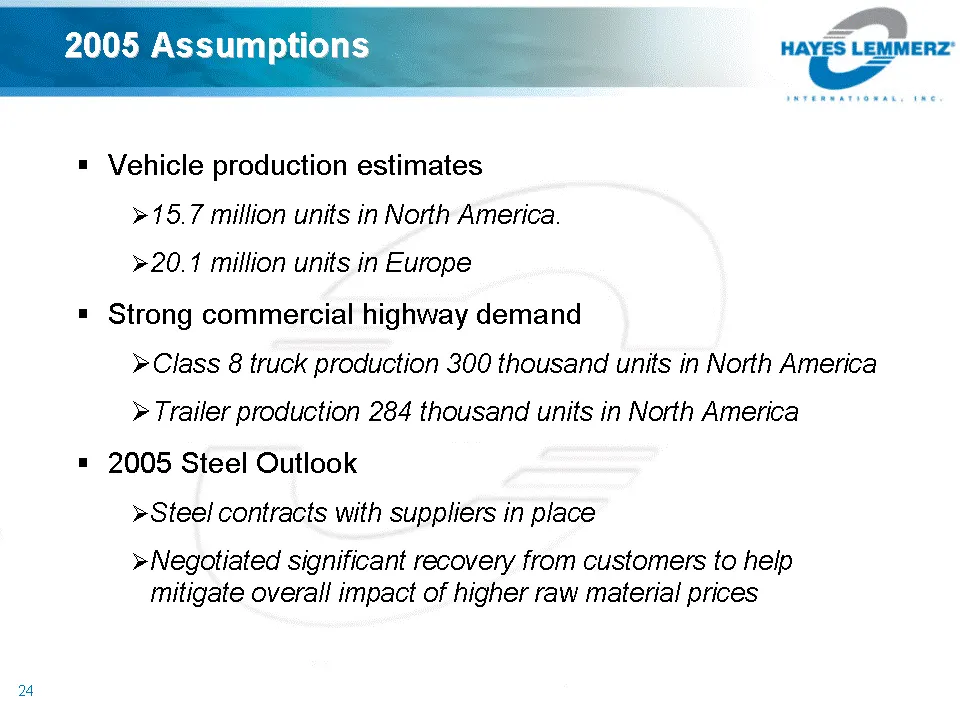
Slide 23: 2005 Assumptions
2005 Assumptions Vehicle production estimates 15.7 million units in North America. 20.1 million units in Europe Strong commercial highway demand Class 8 truck production 300 thousand units in North America Trailer production 284 thousand units in North America 2005 Steel Outlook Steel contracts with
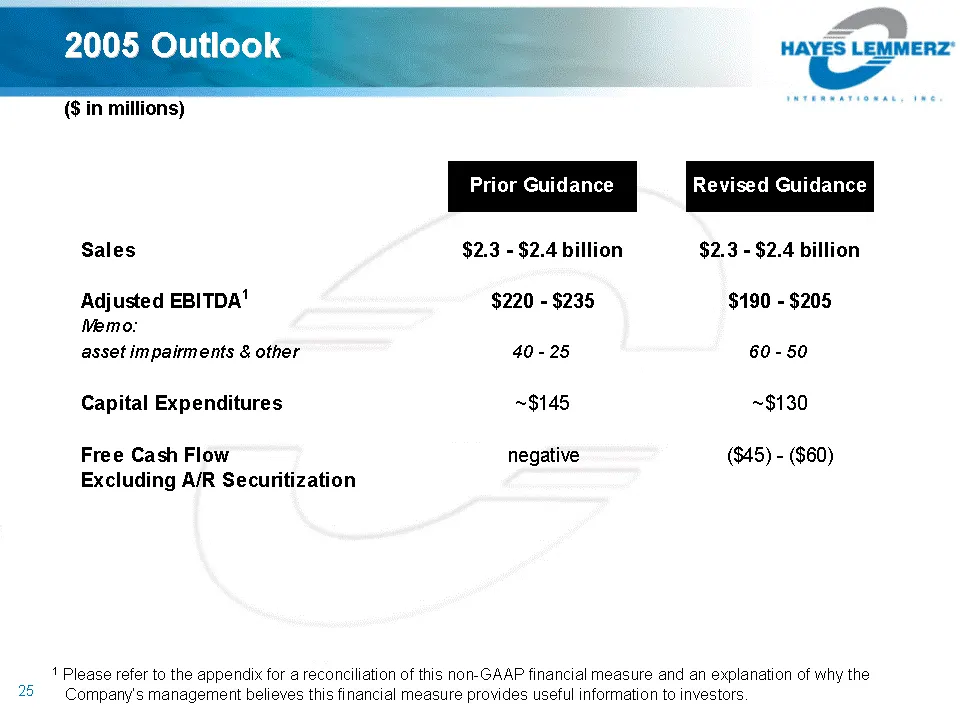
Slide 24: 2005 Outlook
2005 Outlook ($ in millions) 1 Please refer to the appendix for a reconciliation of this non-GAAP financial measure and an explanation of why the Company's management believes this financial measure provides useful information to investors.
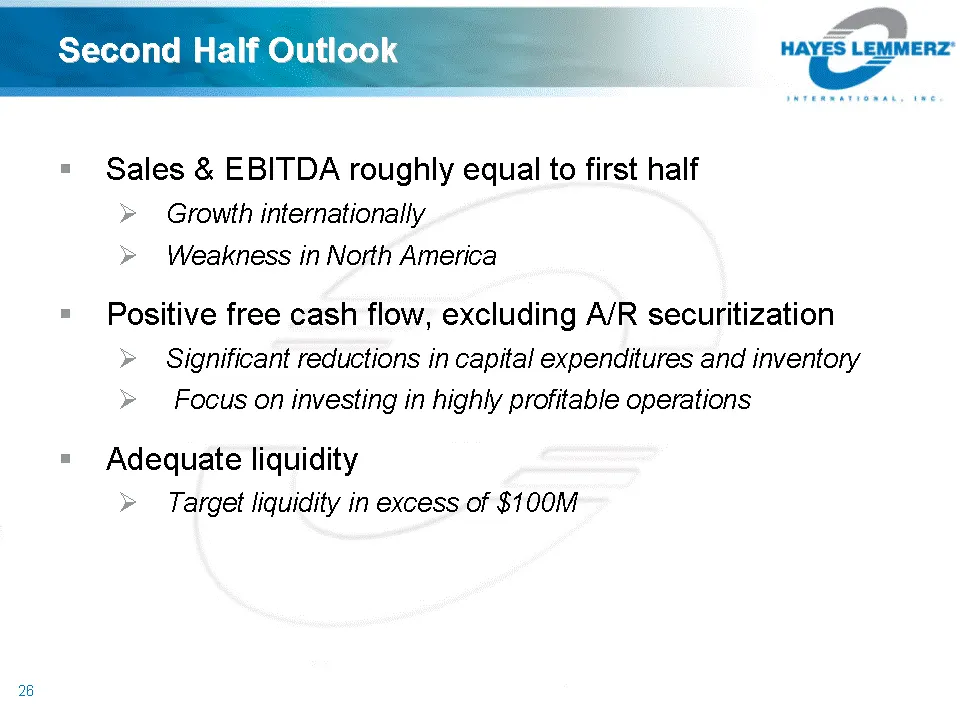
Slide 25: Second Half Outlook
Second Half Outlook Sales & EBITDA roughly equal to first half Growth internationally Weakness in North America Positive free cash flow, excluding A/R securitization Significant reductions in capital expenditures and inventory Focus on investing in highly profitable operations Adequate liquidity Tar
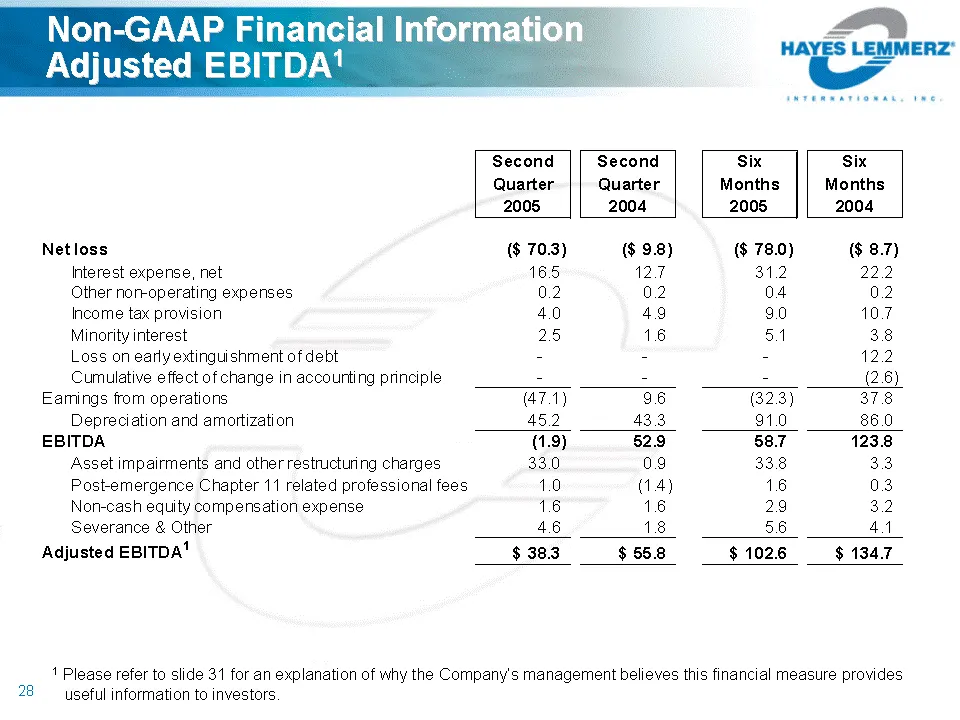
Slide 26: Non-GAAP Financial Information: Adjusted EBITDA
Non-GAAP Financial Information Adjusted EBITDA1 1 Please refer to slide 31 for an explanation of why the Company's management believes this financial measure provides useful information to investors.
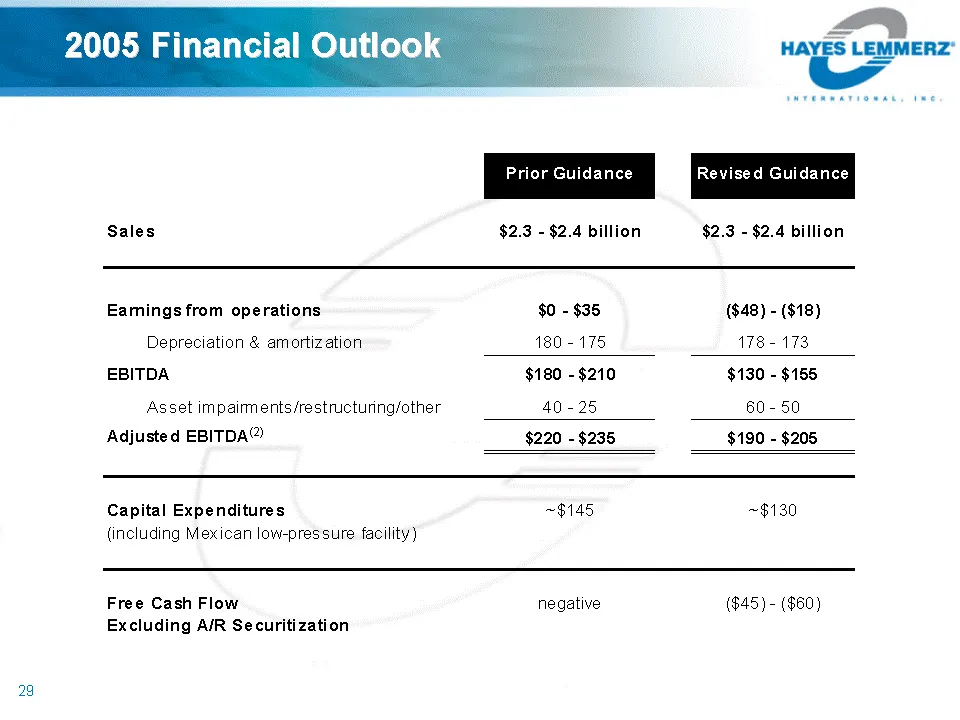
Slide 27: 2005 Financial Outlook
2005 Financial Outlook 2 HAYES LEMMERZ* | Sales $2.3 - $2.4 billion $2.3 - $2.4 billion Eamings from operations $0 - $35 ($48) - ($18) Depreciation & amortization 180-175 178-173 EBITDA $180 - $210 $130 - $155 Asset impaimments/restructuring/other 40-25 60-50 Adjusted EBITDA® $220 - $235 $190 - $205
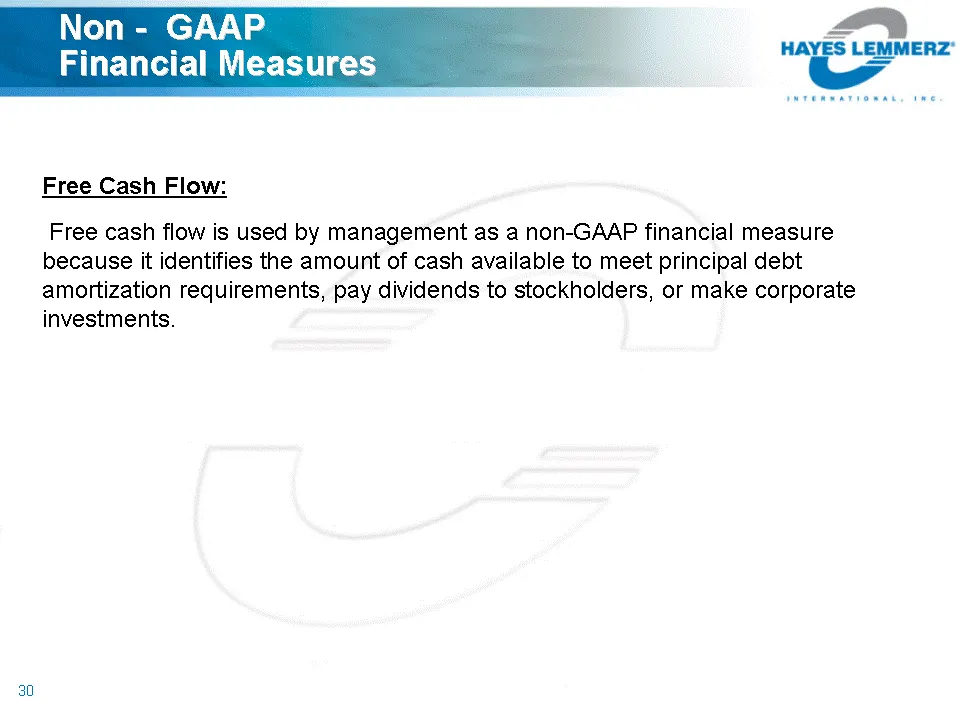
Slide 28: Non-GAAP Financial Measures: Free Cash Flow
Non - GAAP Financial Measures Free Cash Flow: Free cash flow is used by management as a non-GAAP financial measure because it identifies the amount of cash available to meet principal debt amortization requirements, pay dividends to stockholders, or make corporate investments.
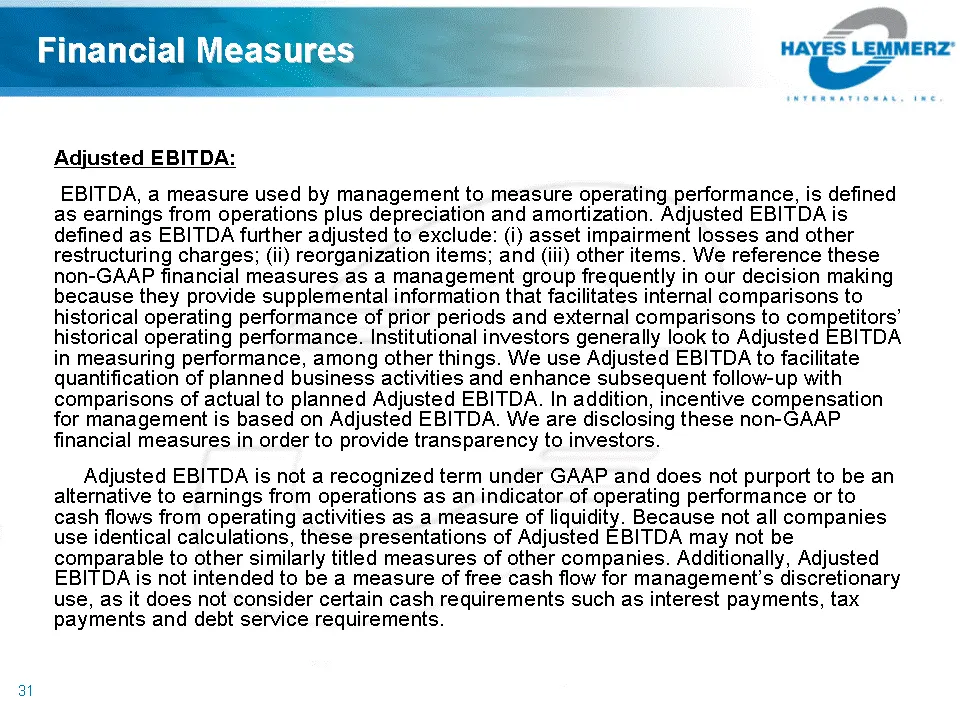
Slide 29: Financial Measures: Adjusted EBITDA
Financial Measures Adjusted EBITDA: EBITDA, a measure used by management to measure operating performance, is defined as earnings from operations plus depreciation and amortization. Adjusted EBITDA is defined as EBITDA further adjusted to exclude: (i) asset impairment losses and other restructuring
Source: SEC EDGAR · 8-K filed Sep 8, 2005
More decks from Hayes Lemmerz International Inc
 Q3 2008 Earnings Presentation29 slides · Dec 4, 2008
 Q2 2008 Earnings Presentation34 slides · Sep 4, 2008
 Q1 2008 Earnings Presentation35 slides · Jun 5, 2008
 FY2007 Earnings Presentation35 slides · Apr 10, 2008
 Morgan Stanley Global Automotive Conference 200837 slides · Mar 19, 2008
 2008 Auto Analysts of New York Conference39 slides · Jan 16, 2008