USA Truck — Investor Day (August 2008)
17 slides from USA Truck's investor day presentation, Aug 19, 2008
Slide 1: 2008 USA Truck Analyst Day
2008 USA Truck Analyst Day
Slide 2: Forward-Looking Statement
Forward-Looking Statement This information and the statements made at this Analyst Day Conference may contain forward-looking statements within the meaning of Section 27A of the Securities Act of 1933, as amended and Section 21E of the Securities Exchange Act of 1934, as amended. These statements ge
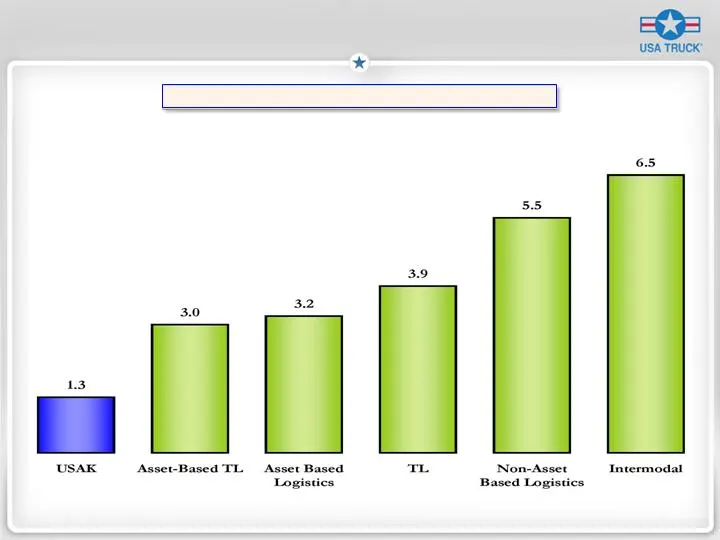
Slide 3: Our Stock is Under-Valued
Our Stock is Under-Valued Price to Book Multiples As of August 15, 2008
Slide 4: Market Rejected Growth Strategy
Market Rejected Growth Strategy USAK is the 2 nd fastest growing name in TL Group * over past 10 years (14.3% revenue CAGR), but……. 7 th out of 9: EBITDA Growth CAGR 8 th out of 9: Average ROCE and ROIC 2 nd Largest Spread: Revenue CAGR and EBITDA CAGR (850 BPS) 2 nd Largest Spread: Revenue CAGR and
Slide 5: Strong Core
Strong Core Customer Base Cost Structure Service Culture
Slide 6: ROC Drives Stock!
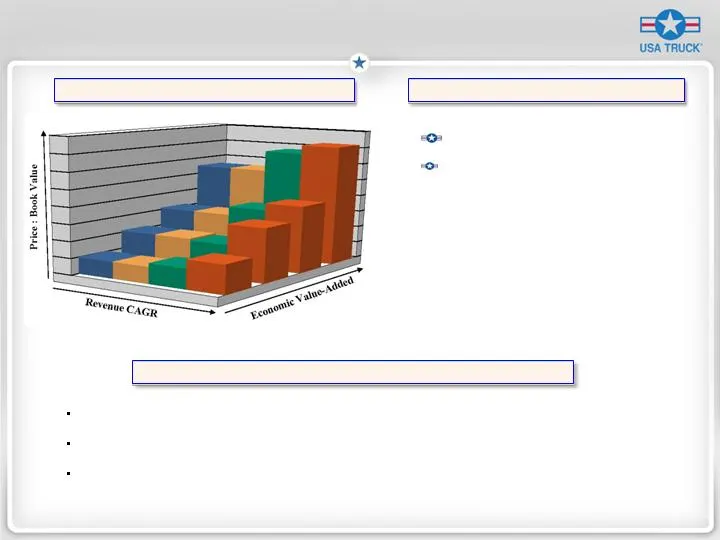
ROC Drives Stock! Copeland’s Value Mountain Lane’s Value Mountain Applied to T&L Industry Confirms Copeland’s Theory Revenue Growth Doesn’t Drive Stock Value * * SEC Documents and Stephens Inc. 10-year Stock Price CAGR: TL Group = 11.3%, S&P500 = 3.1% Revenue Growth vs. Stock Price: Low Correlation
Slide 7: USA Truck return on capital vs WACC goal
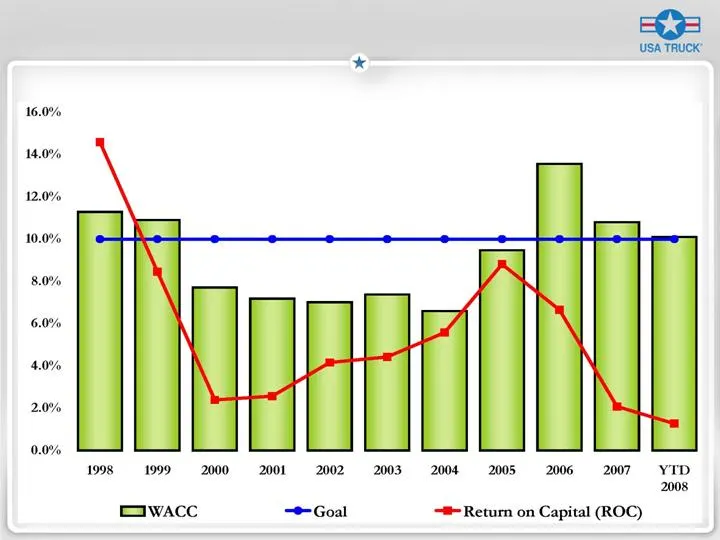
Usa TRUCK’ 16.0% 14.0% 12.0% 10.0% 8.0% 6.0% 4.0% 20" 0.0% 1998 1999-2000» -2001_-—«S 2002-2003 2004 = 2005-2006 = 2007 YID 2008 wacc Goal -® Retum on Capital (ROC)
Slide 8: A Fresh Operating Strategy
A Fresh Operating Strategy Preserve the Core : Customer base Cost discipline Service culture Trucking Segment : Restrict capacity growth Expand margin primarily through yield management Reduce length of haul (no particular target) Increase use of asset-light owner operators (120/4-5%) Strategic Capa
Slide 9: The VEVA Plan
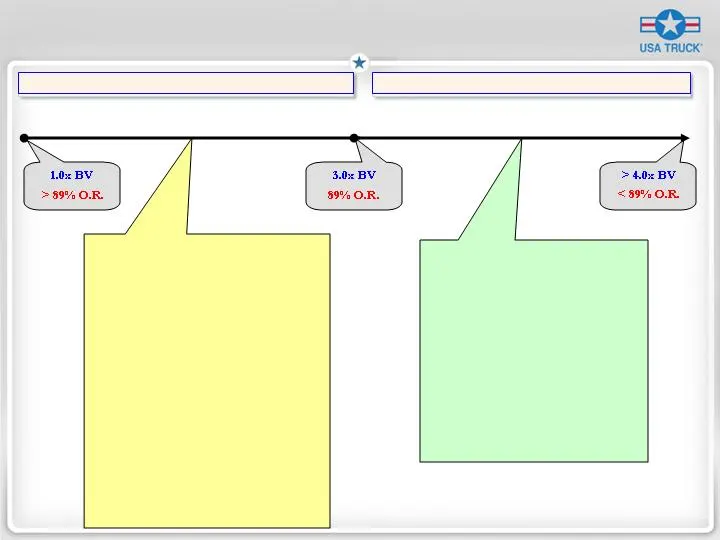
The VEVA * Plan The Results We’ll Need Consistent Earnings Earn our Cost of Capital Positioned for Long-Term Growth How We’ll Do It Culture (Mission, Core Values) Project Velocity War on Accidents Limit Capacity/Yield Management Cost Management Expand Owner Operator Fleet Improve Brokerage Model Lau
Slide 10: Project Velocity
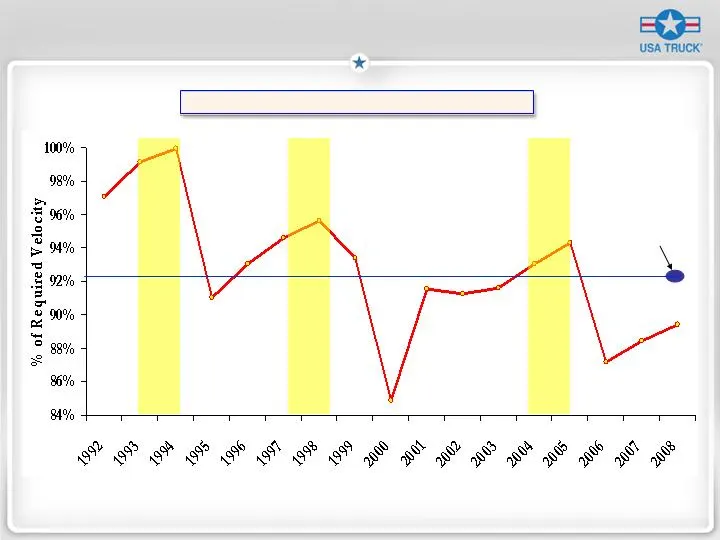
Project Velocity Performance History March 22 to June 30
Slide 11: The War on Accidents
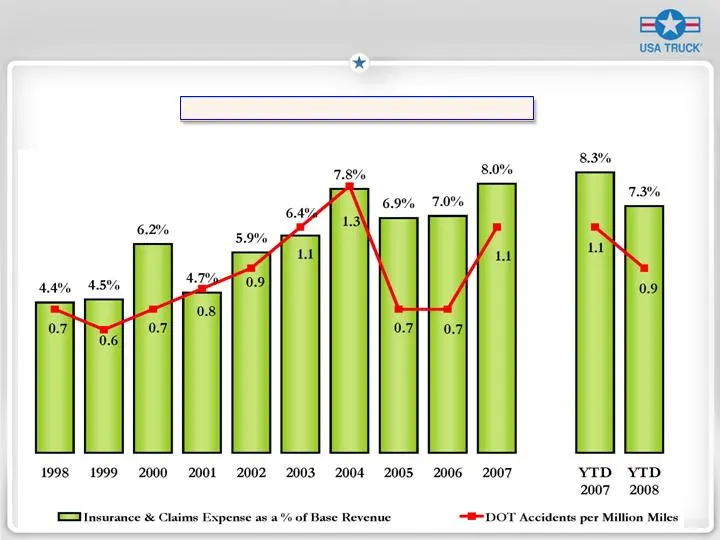
The War on Accidents Insurance & Claims
Slide 12: Best-In-Class Cost Structure
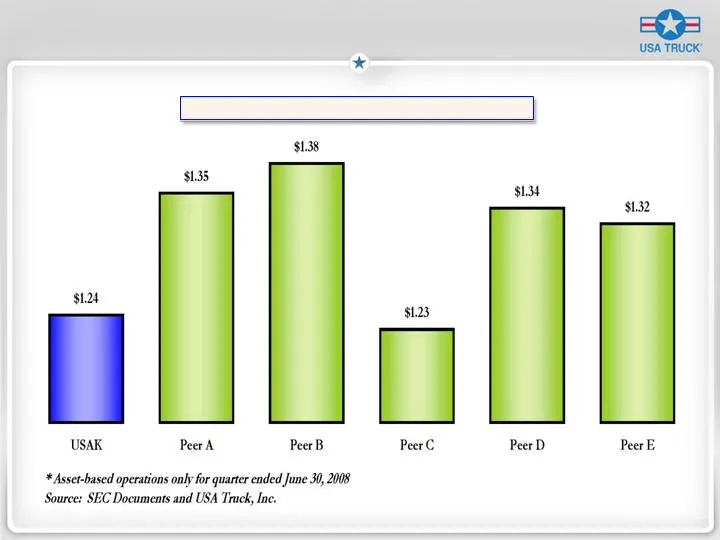
Best-In-Class Cost Structure Operating Cost per Mile *
Slide 13: Yield Management
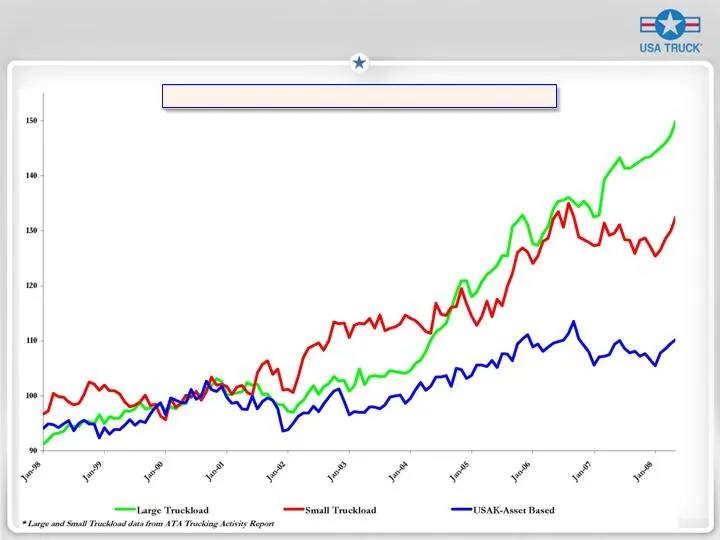
Yield Management Base Revenue per Paid Mile (2000 = 100) 4.7% CAGR 1.1% CAGR
Slide 14: Strategic Capacity Solutions
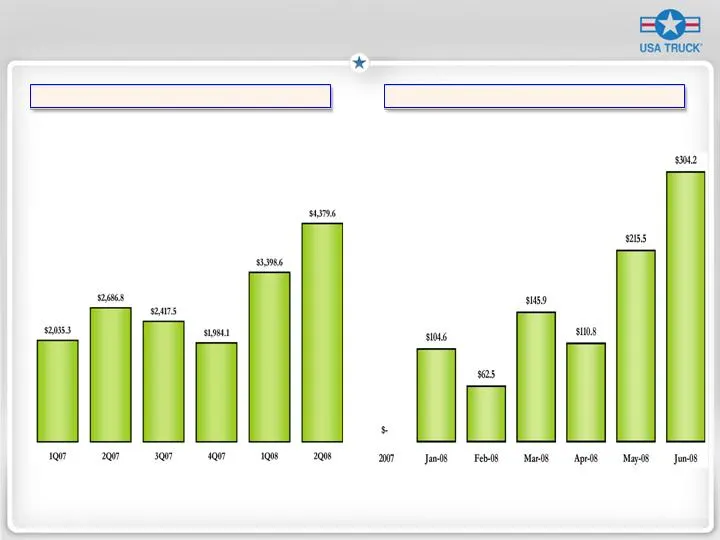
Strategic Capacity Solutions Freight Brokerage Growth * Intermodal Growth * * Base Revenue only (excludes fuel surcharge) In Thousands
Slide 15: Project Tech
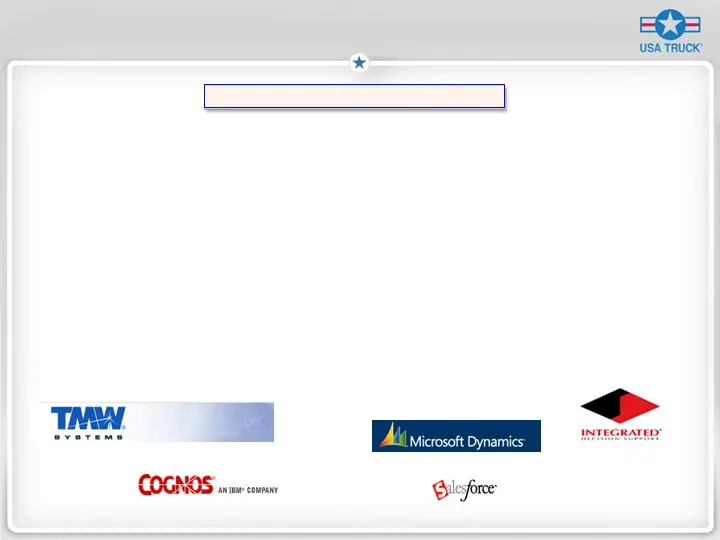
Project Tech Age Installed Developer Platform Application Year Mainframe Mainframe Mainframe Mainframe Mainframe Mainframe Mainframe Mainframe Hardware Custom Website Custom Maintenance Custom Driver Recruiting Custom Accounts Receivable Custom Operations Custom Risk Management 3 rd Party Accounting
Slide 16: Project People
Project People USAK 3.2 : 1 Peer Average 3.8 : (USAK’s disadvantage is 126 employees) Best-in-Class 6.0 : 1 (USAK’s disadvantage is 372 employees) Driver to Non-Driver Ratio 20% 27% Less than High School 24% 13% Bachelor’s degree or higher National Average Fort Smith MSA Education Level
Slide 17: Why Invest In USA Truck?
Why Invest In USA Truck? We have a solid core of service, cost discipline and a diverse customer portfolio. We have a vision and a plan to create shareholder value. Our stock is trading at a deep discount to our industry peers.
Source: SEC EDGAR · 8-K filed Aug 19, 2008
More decks from USA Truck Inc
 Investor Presentation (June 2014)26 slides · Jun 9, 2014
 Q4 2013 Earnings Presentation16 slides · Feb 11, 2014
 Investor Presentation (October 2013)34 slides · Oct 17, 2013
 Q3 2013 Earnings Presentation12 slides · Oct 17, 2013
 Conference Presentation (August 2011)17 slides · Aug 24, 2011
 Conference Presentation (June 2011)17 slides · Jun 14, 2011