The Phoenix Companies — Phoenix Companies — Investor Day (December 2005)
132 slides from The Phoenix Companies's investor day presentation, Dec 13, 2005
Slide 1: Investor Briefing
The Phoenix Companies, Inc. Investor Briefing December 13, 2005 New York City PHOENIX
Slide 2: Agenda
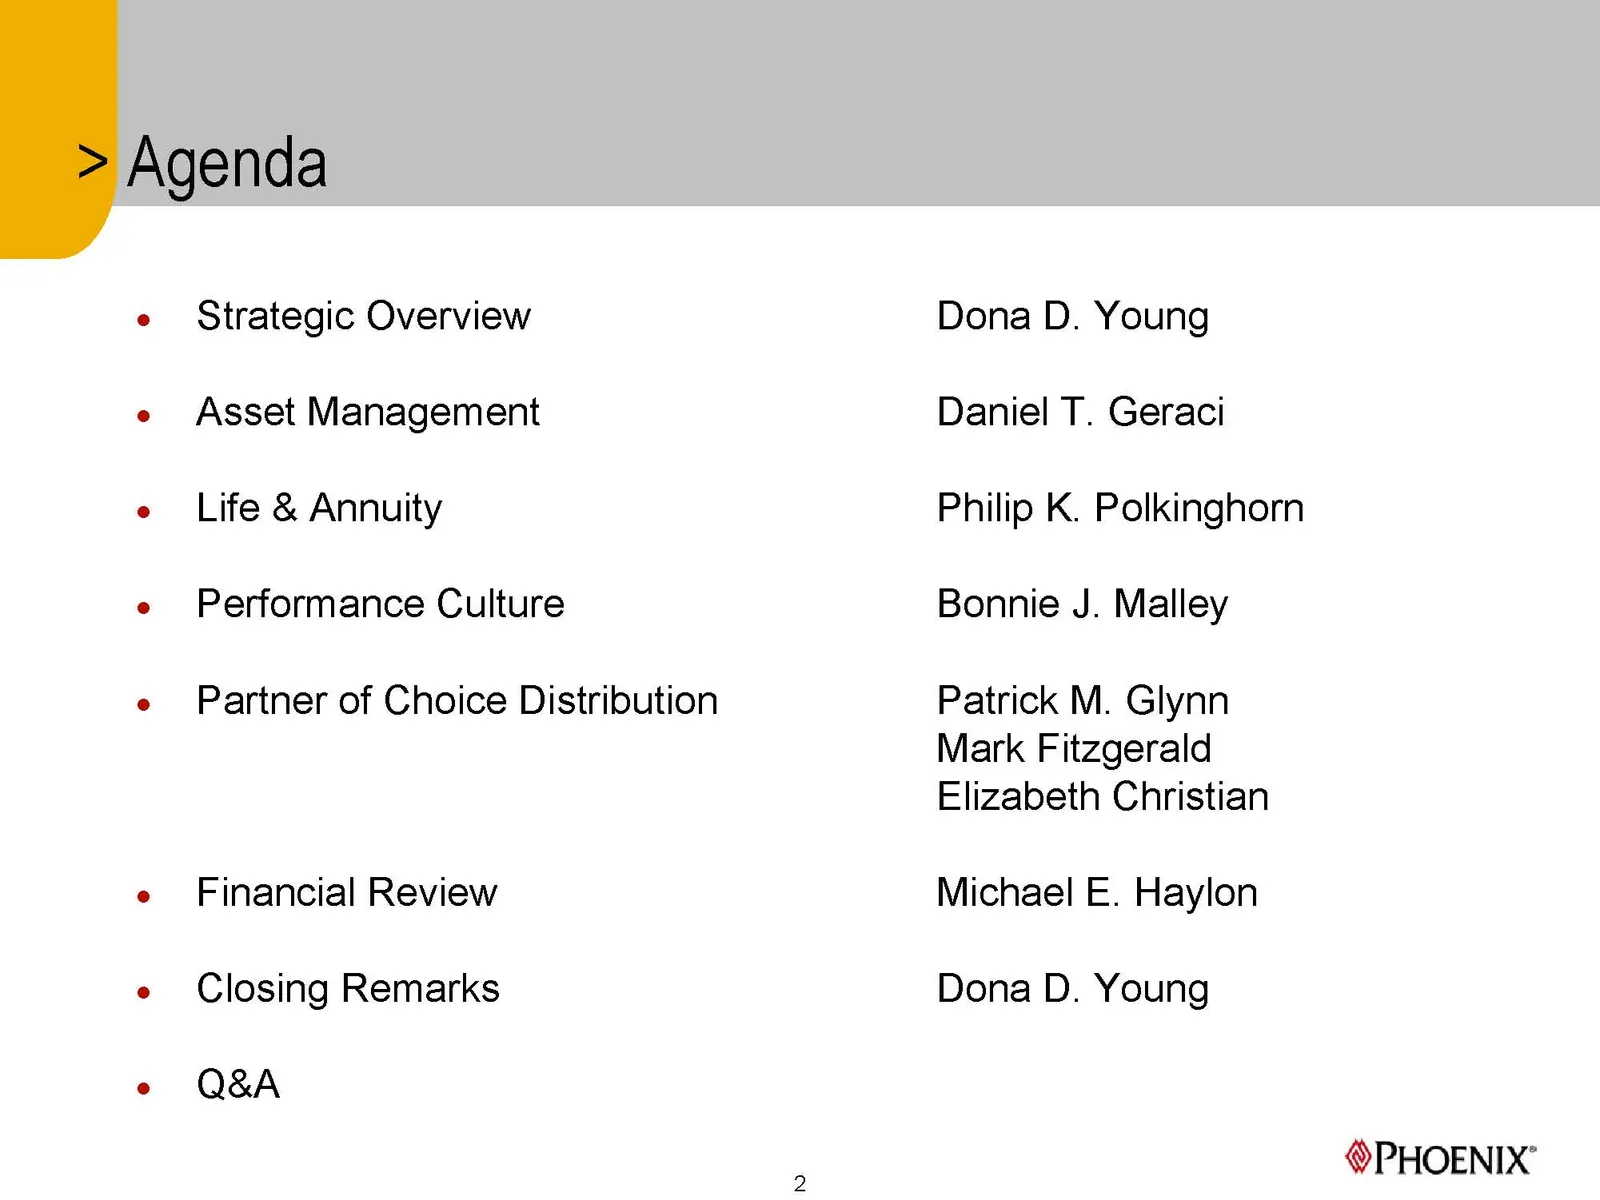
Agenda e Strategic Overview e Asset Management e Life & Annuity e Performance Culture e Partner of Choice Distribution e Financial Review e Closing Remarks e Q&A Dona D. Young Daniel T. Geraci Philip K. Polkinghorn Bonnie J. Malley Patrick M. Glynn Mark Fitzgerald Elizabeth Christian Michael E. Hayl
Slide 3: Safe-harbor disclosures
Safe-harbor disclosures This presentation may contain forward-looking statements within the meaning of the Private Securities Litigation Reform Act of 1995 which, by their nature, are subject to risks and uncertainties. The company intends these forward- looking statements to be covered by the safe
Slide 4: Non-GAAP financial measures
Non-GAAP financial measures In addition to net income presented in accordance with Generally Accepted Accounting Principles ("GAAP"), Phoenix considers total segment income in evaluating its financial performance. Total segment income is an internal performance measure used by Phoenix in the managem
Slide 5: Strategic Overview
The Phoenix Companies, Inc. Strategic Overview Dona D. Young Chairman, President and Chief Executive Officer December 13, 2005 New York City PHOENIX
Slide 6: We have moved beyond the turnaround to sustainable growth
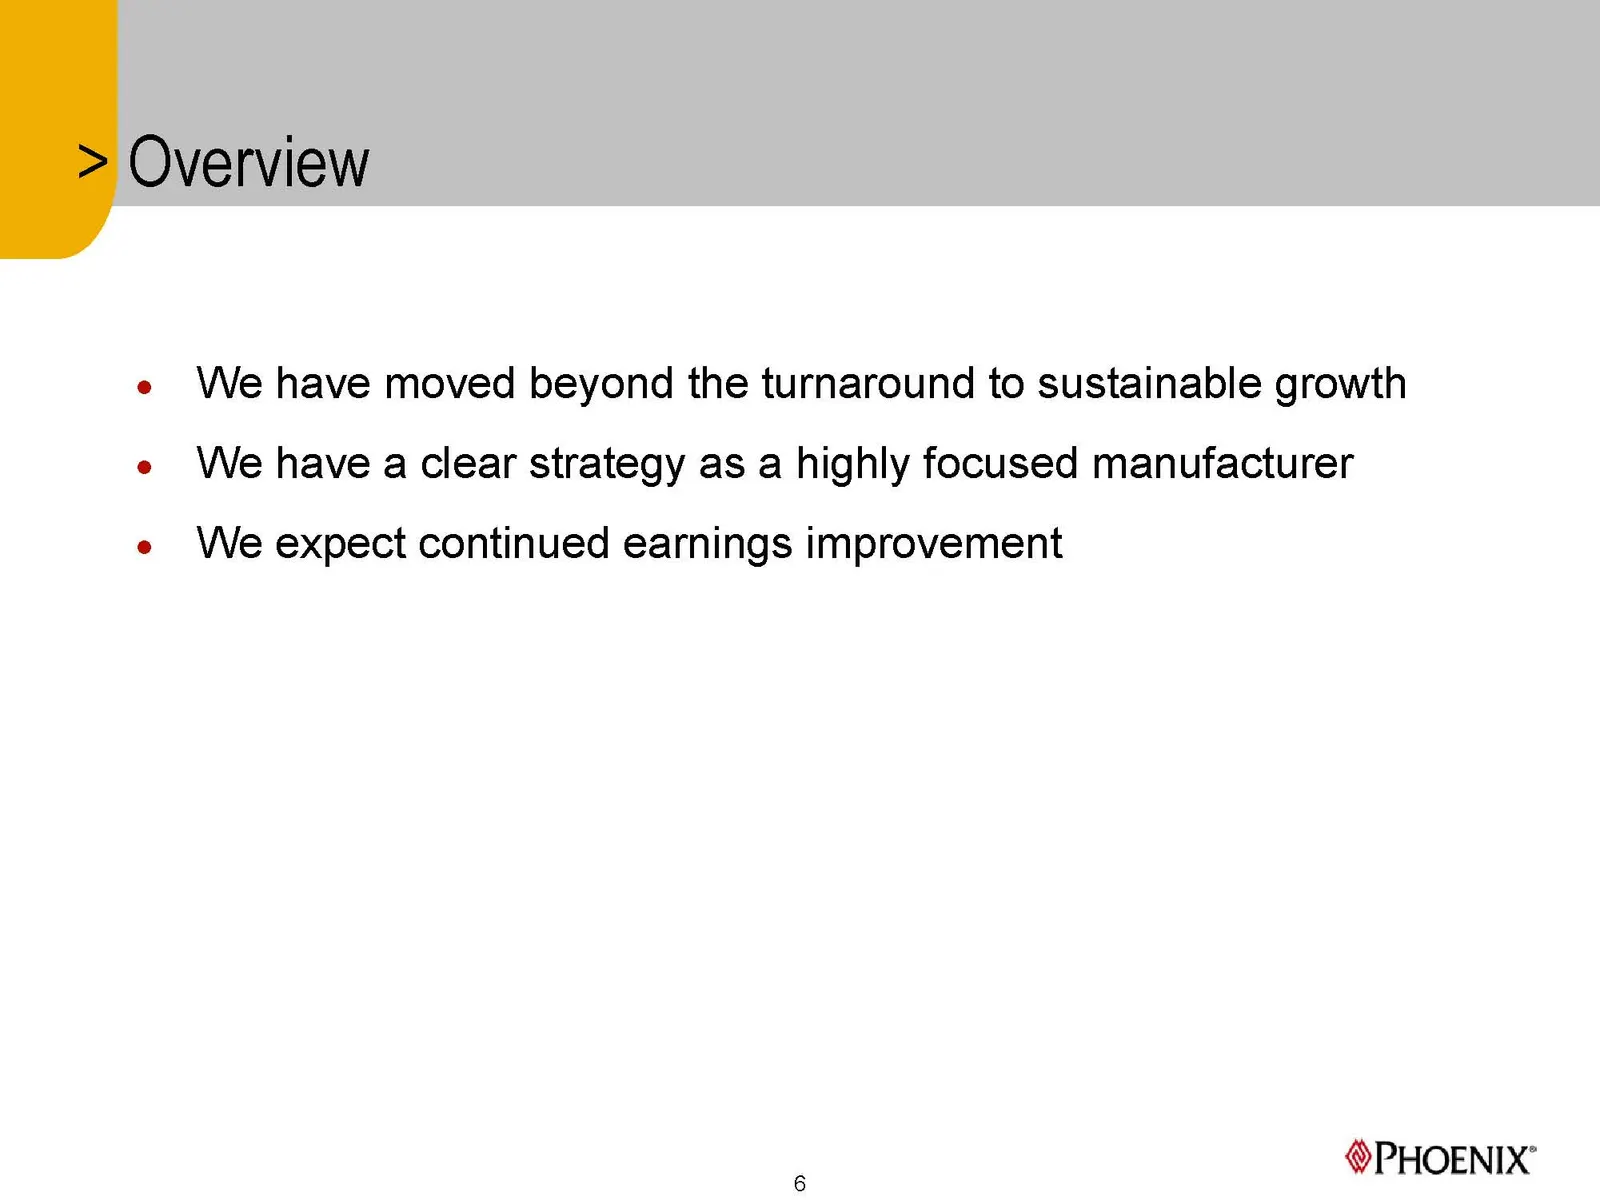
e We have moved beyond the turnaround to sustainable growth e We have a clear strategy as a highly focused manufacturer e We expect continued earnings improvement PHOENIX’
Slide 7: We have entered the growth phase of our turnaround
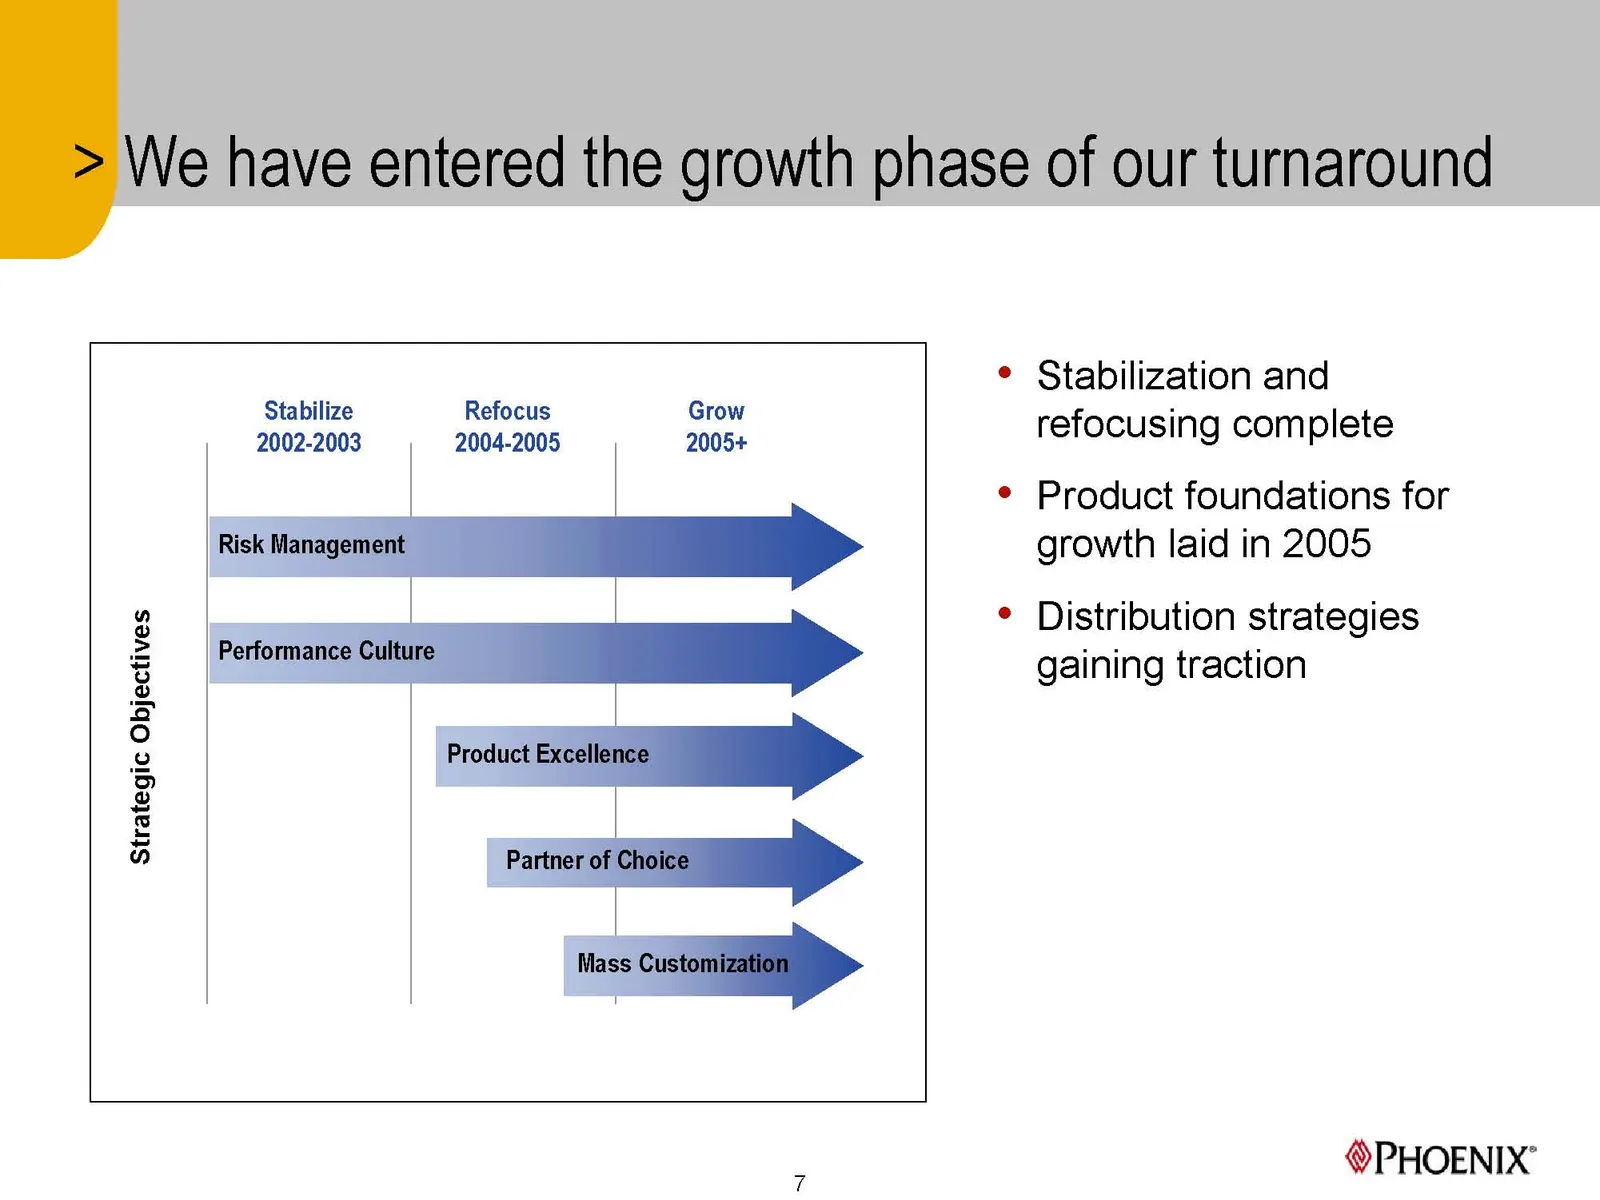
We have entered the growth phase of our turnaround * Stabilization and refocusing complete Stabilize Refocus Grow 2002-2003 2004-2005 2005+ ¢ Product foundations for growth laid in 2005 ¢ Distribution strategies gaining traction Risk Management. Performance Strategic Objectives PHOENIX’
Slide 8: Critical milestones for 2005 largely achieved
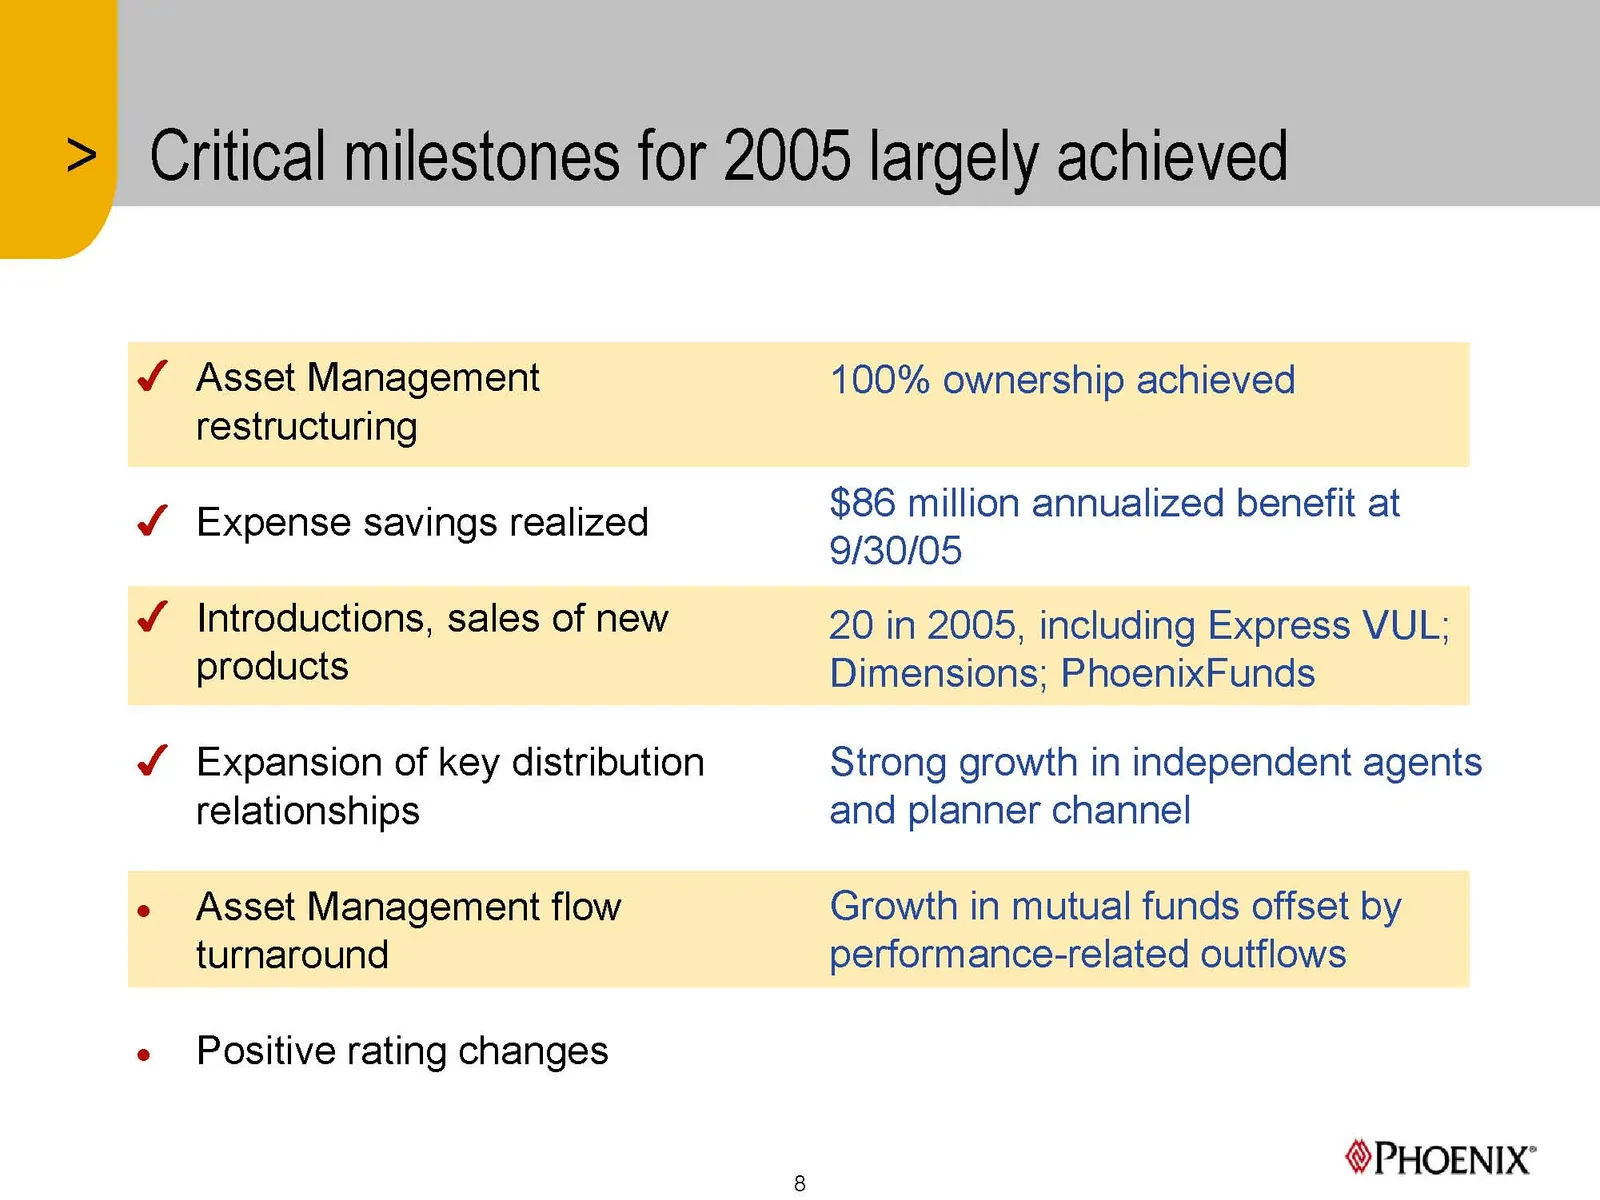
> Critical milestones for 2005 largely achieved / Asset Management 100% ownership achieved restructuring . . $86 million annualized benefit at / Expense savings realized 9/30/05 ¥ Introductions, sales of new 20 in 2005, including Express VUL; products Dimensions; PhoenixFunds ¥ Expansion of key dist
Slide 9: Risk discipline and execution focus maintained
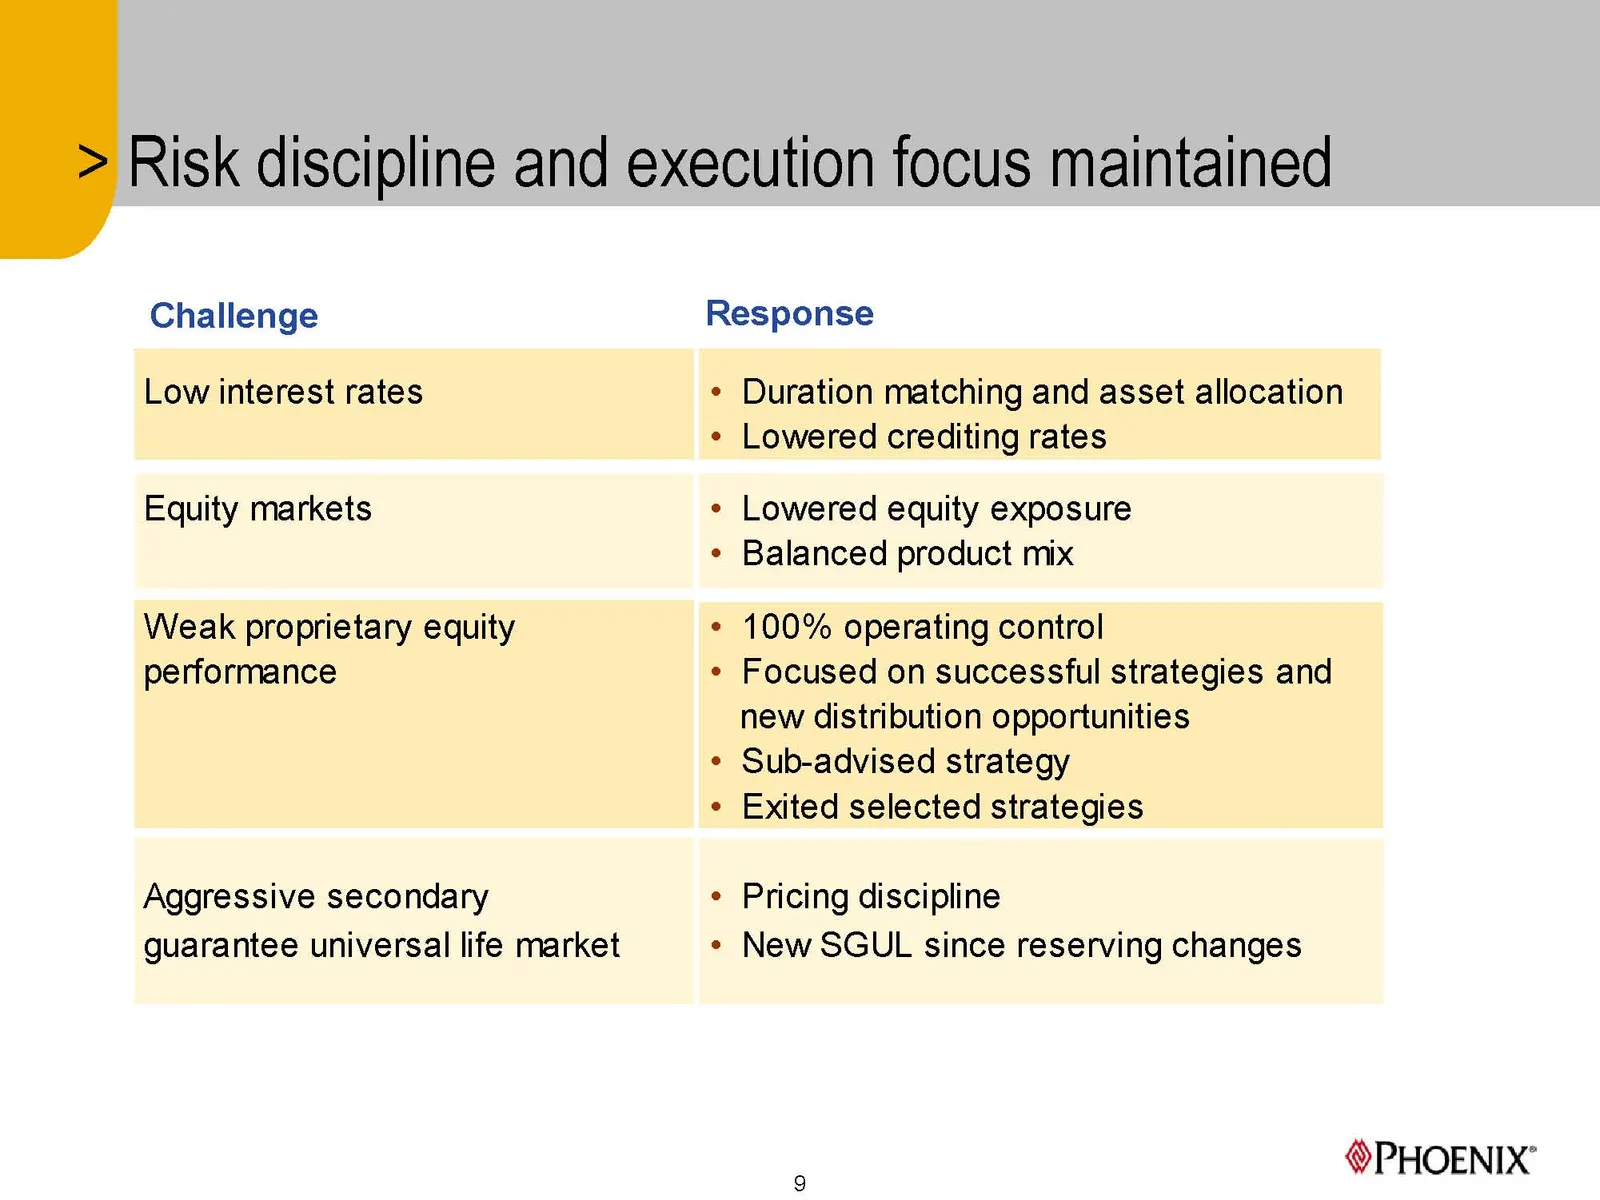
Risk discipline and execution focus maintained Challenge Low interest rates Equity markets Weak proprietary equity performance Aggressive secondary guarantee universal life market Response ¢ Duration matching and asset allocation ¢ Lowered crediting rates ¢ Lowered equity exposure ¢ Balanced product
Slide 10: Risk Based Capital
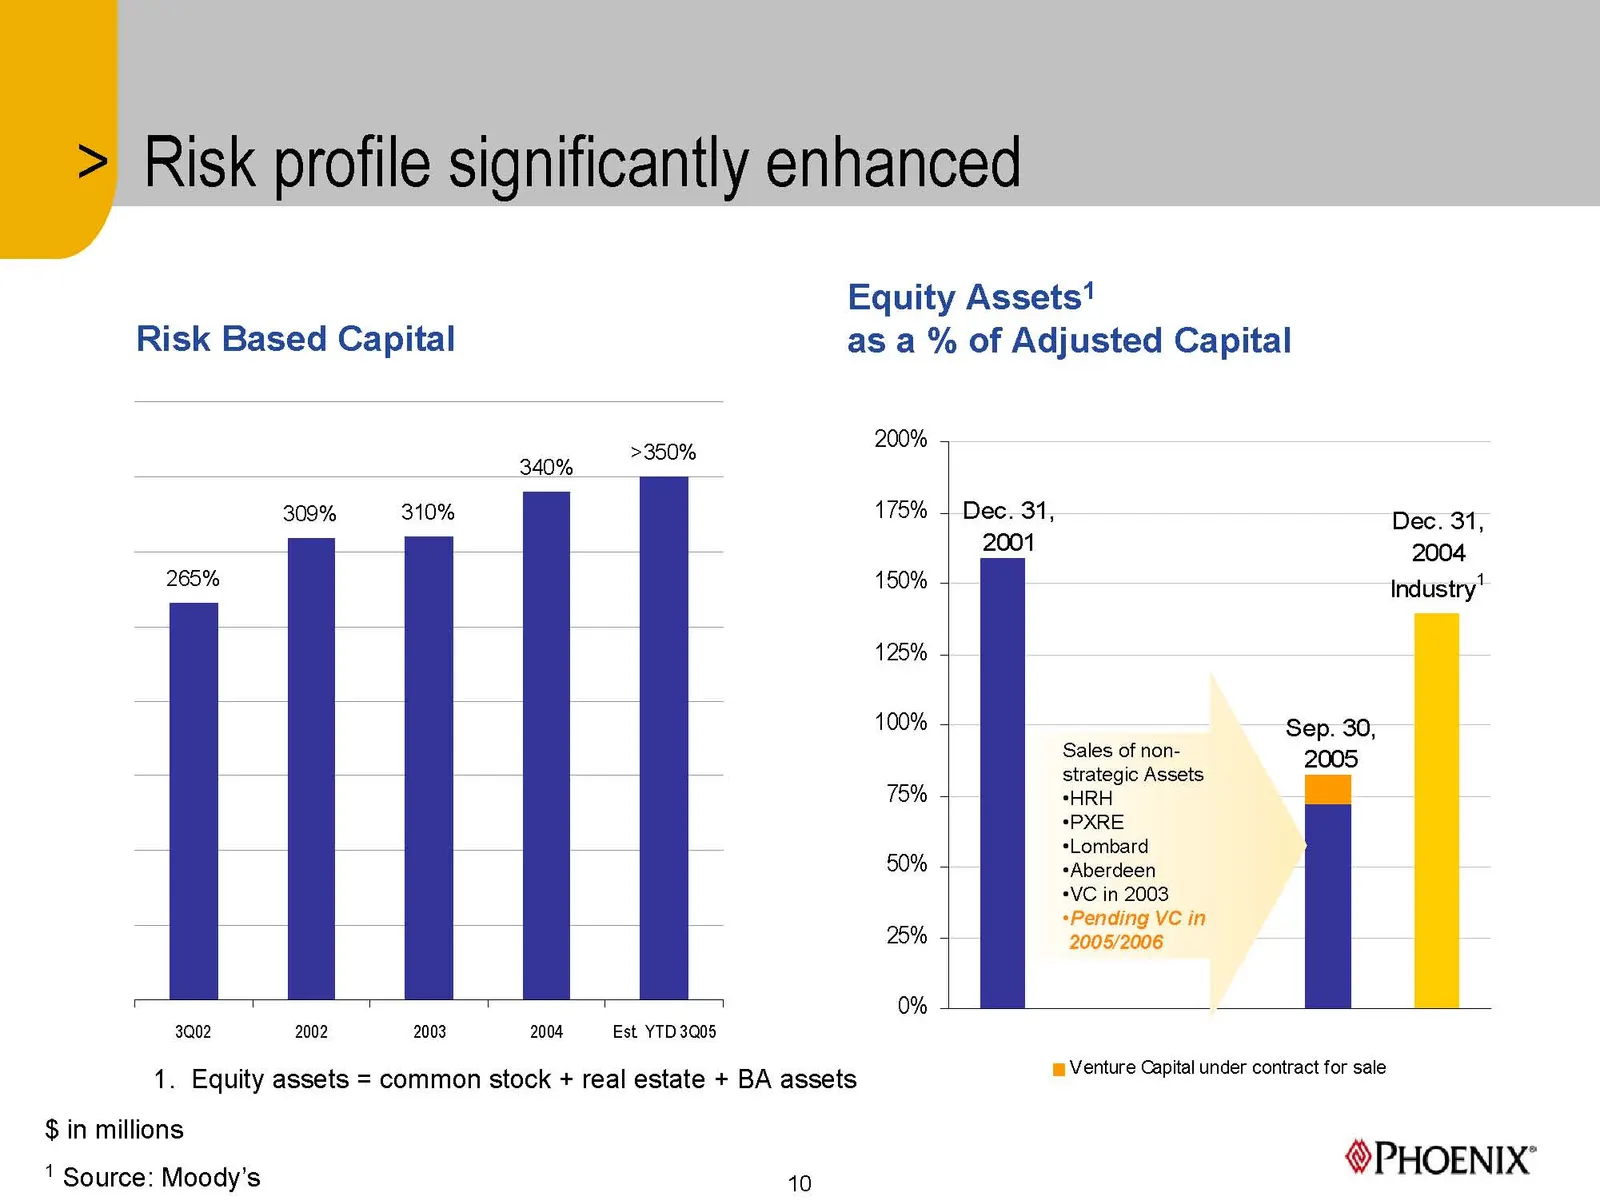
Risk Based Capital 4 340% 730% 309% 310% | | | 3Q02 2002 2003 2004 Est YTD 3Q05 Risk profile significantly enhanced Equity Assets’ as a % of Adjusted Capital 200% 175% 150% 125% 100% 75% 50% 25% 0% 1. Equity assets = common stock + real estate + BA assets $ in millions ’ Source: Moody’s 10 Dec. 31,
Slide 11: Total Segment Income
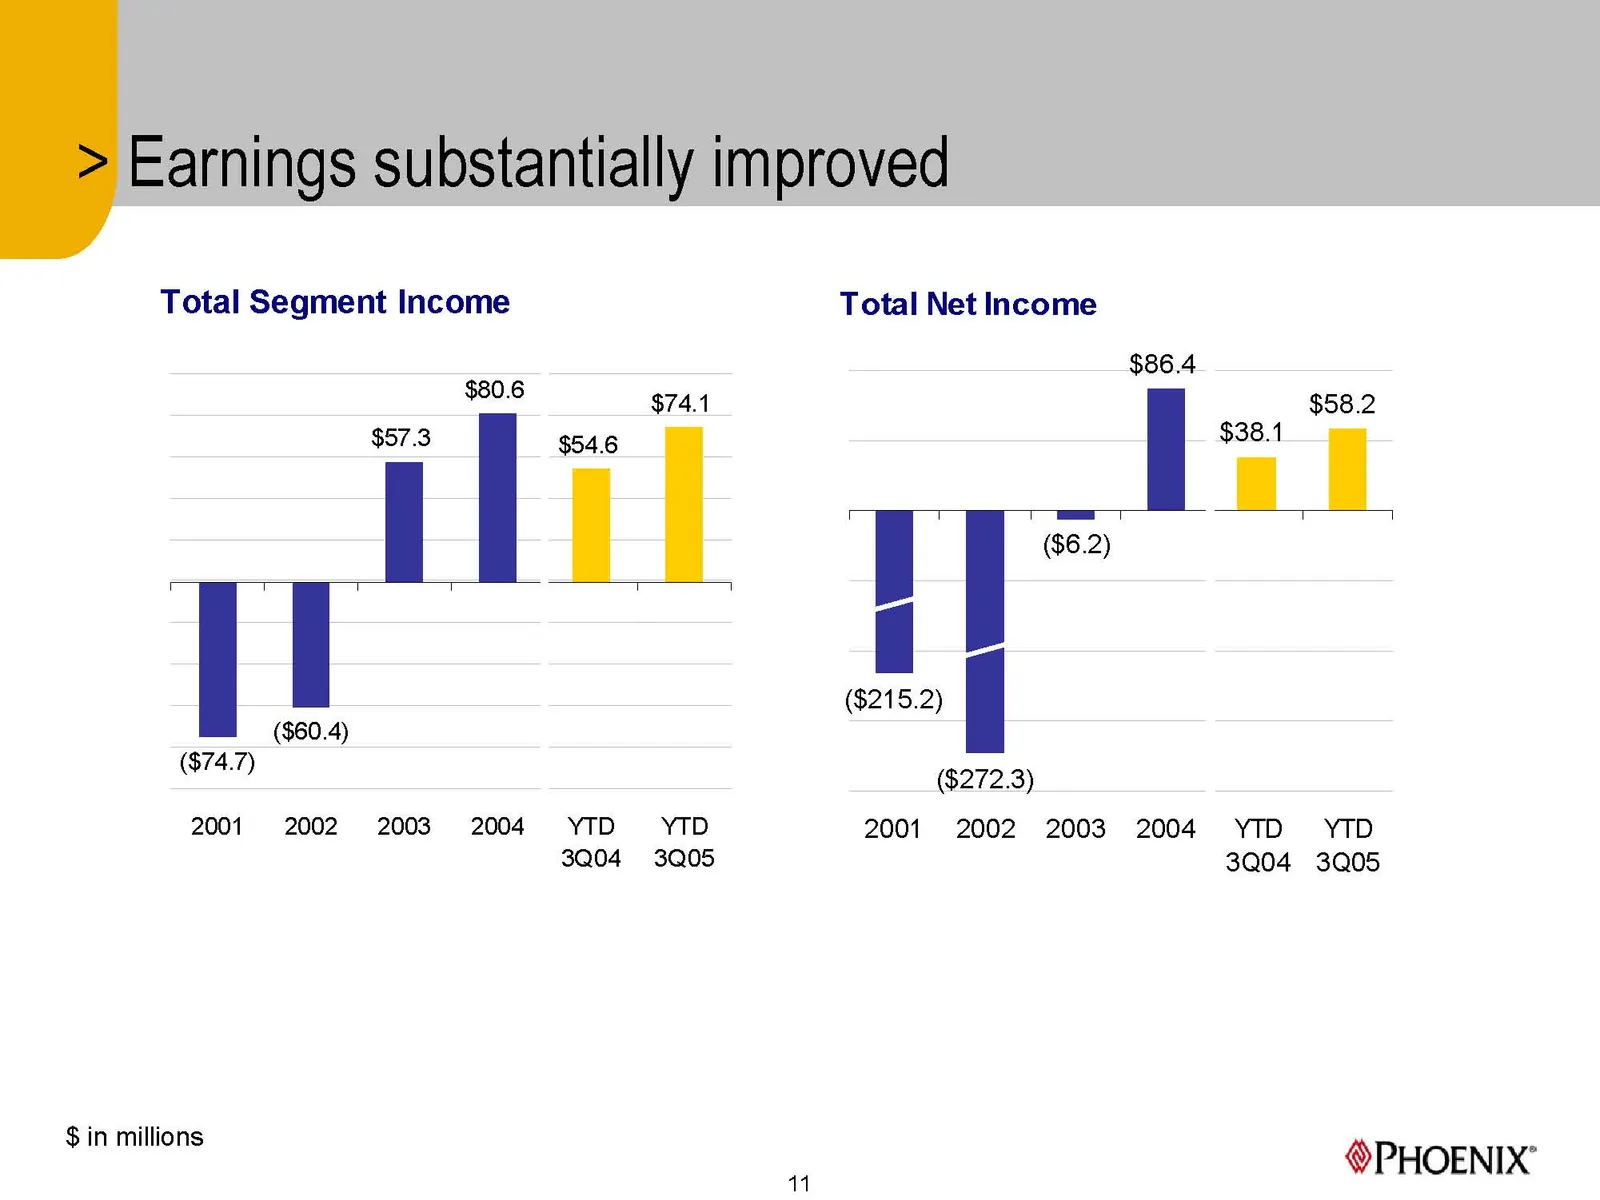
Total Segment Income 950.6 $74.1 $57.3 $54.6 [ J ne ($60.4) ($74.7) 2001 2002 2003 2004 YTD YTD 3Q04 3Q05 $in millions Earnings substantially improved Total Net Income $86.4 $58.2 _fall ($215.2) (| ($272.3) 2001 2002 2003 2004 YTD YTD 3Q04 3Q05 PHOENIX’
Slide 12: Life & Annuity drives earnings
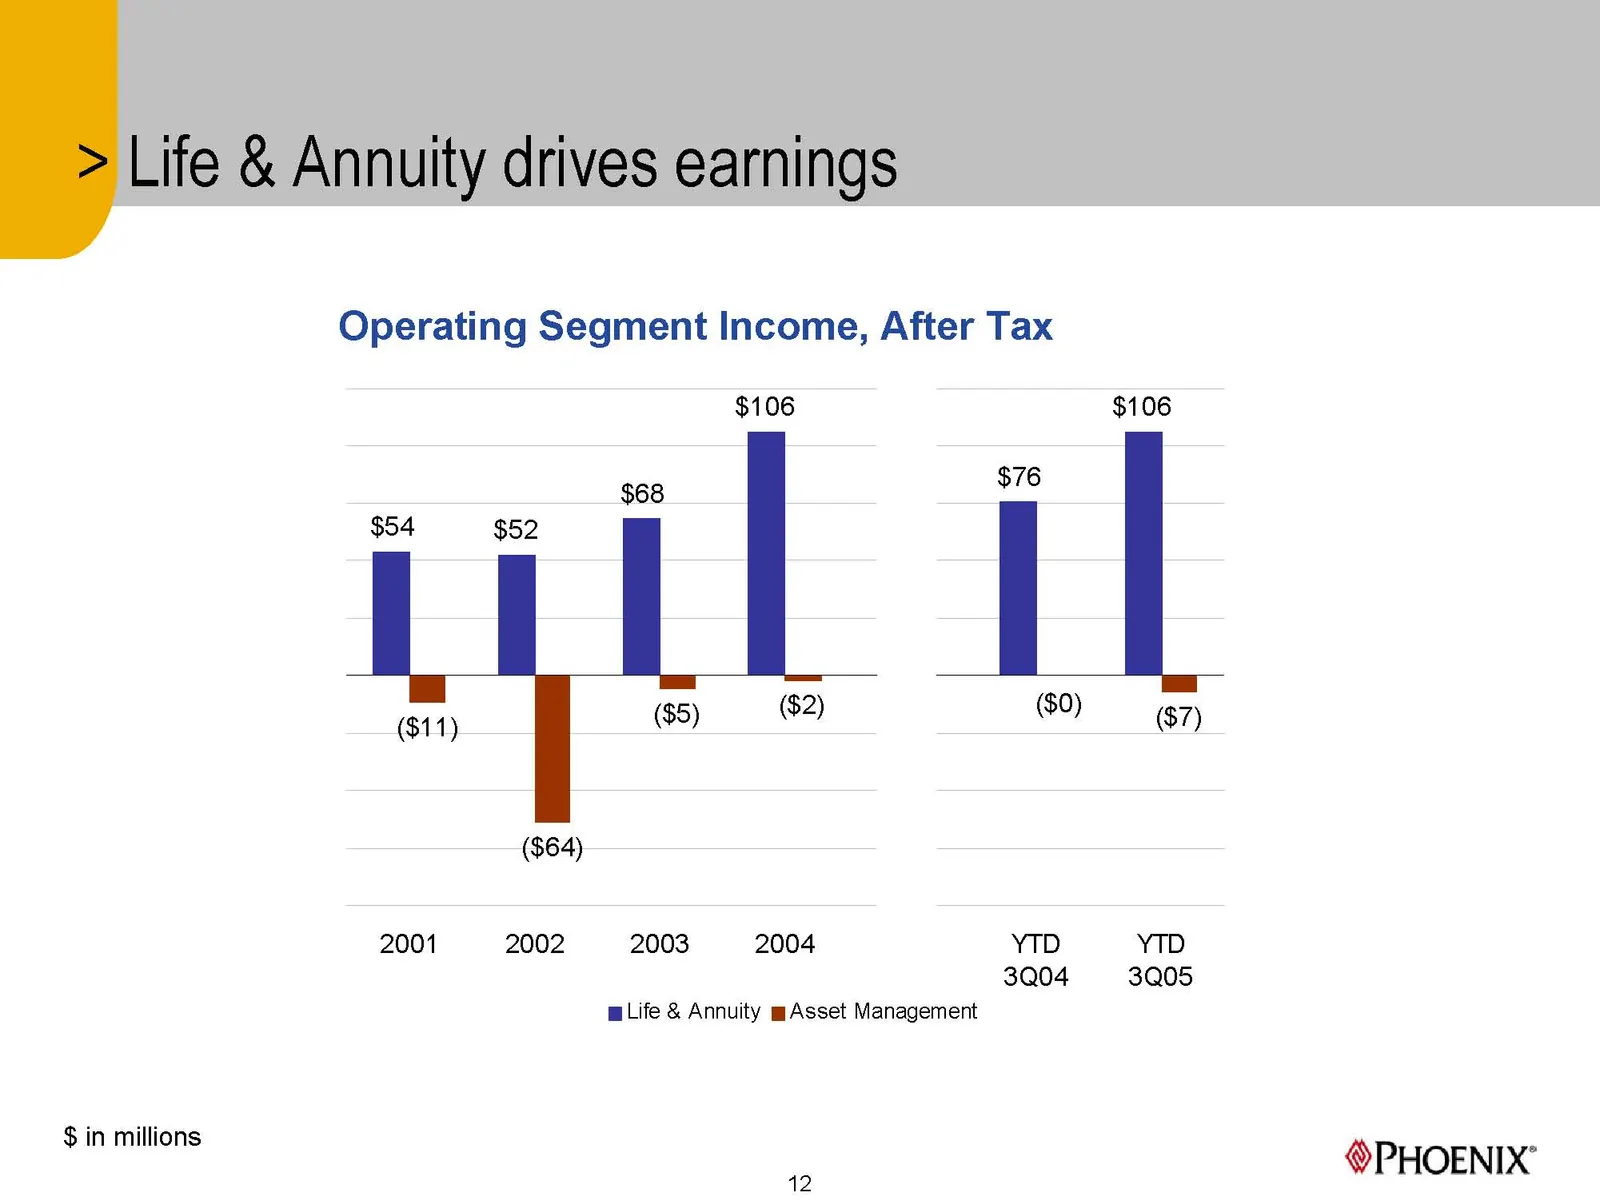
Life & Annuity drives earnings Operating Segment Income, After Tax $106 $106 $76 $54 | ($11) . ($5) ($2) ($0) ($7) ($64) 2001 2002 2003 2004 YTD YTD 3Q04 3Q05 mLife & Annuity mAsset Management $ in millions PHOENIX’ 12
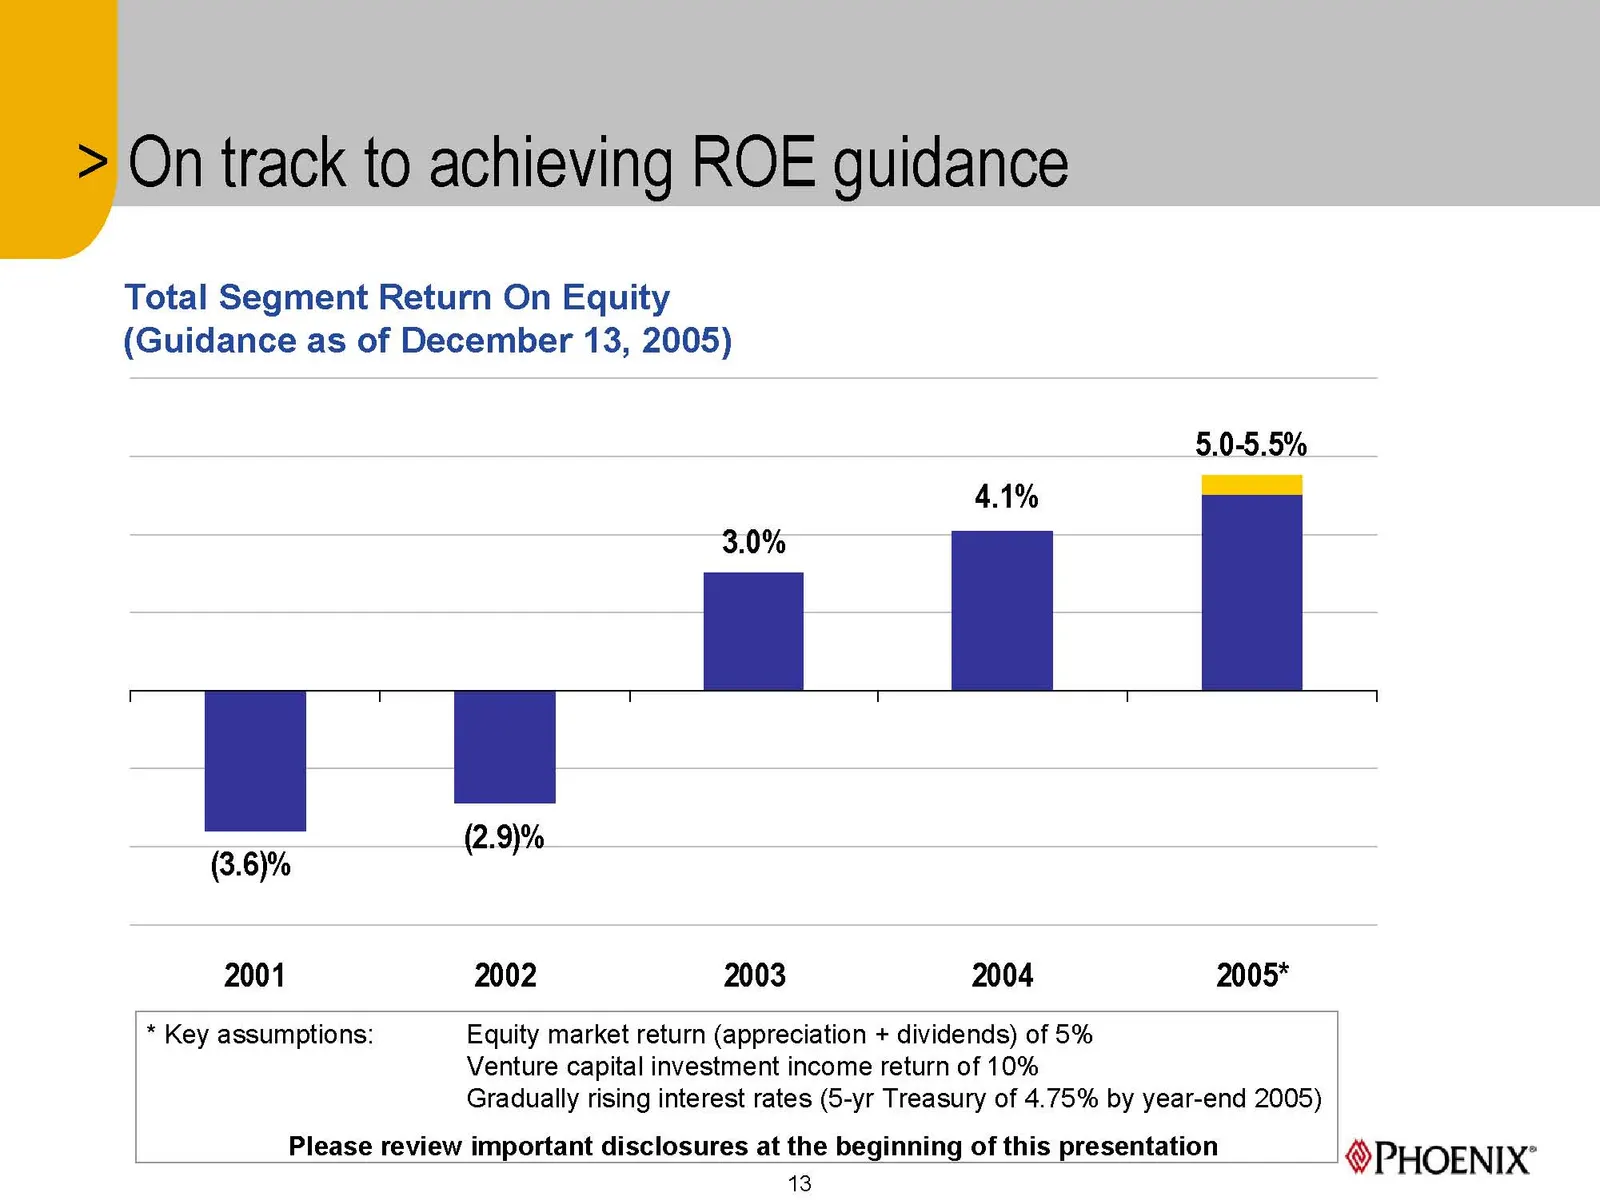
Slide 13: On track to achieving ROE guidance
On track to achieving ROE guidance Total Segment Return On Equity (Guidance as of December 13, 2005) 5.0-5.5% 4.1% 3.0% a (2.9)% (3.6)% 2001 2002 2003 2004 2005* * Key assumptions: Equity market return (appreciation + dividends) of 5% Venture capital investment income return of 10% Gradually rising
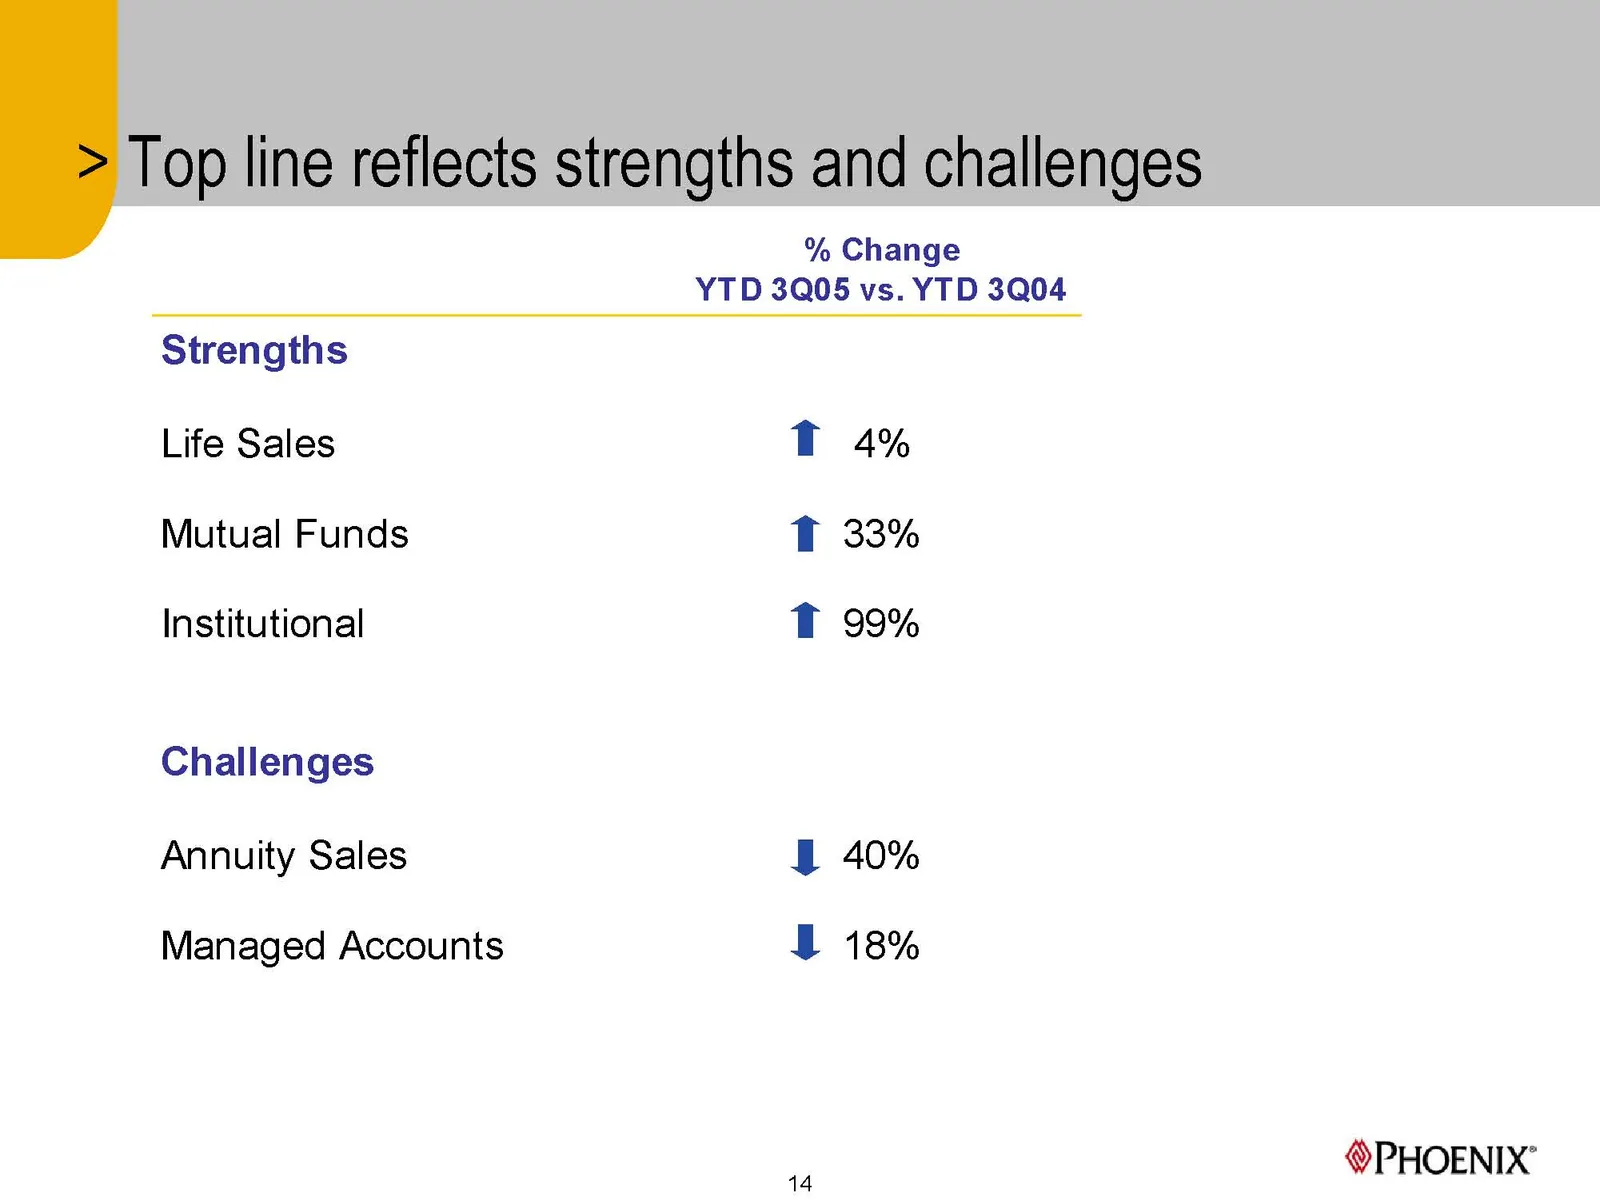
Slide 14: % Change
% Change YTD 3Q05 vs. YTD 3Q04 Strengths Life Sales Mutual Funds Institutional Challenges Annuity Sales Managed Accounts T 4% T 33% T 99% § 40% U 18% 14 PHOENIX’
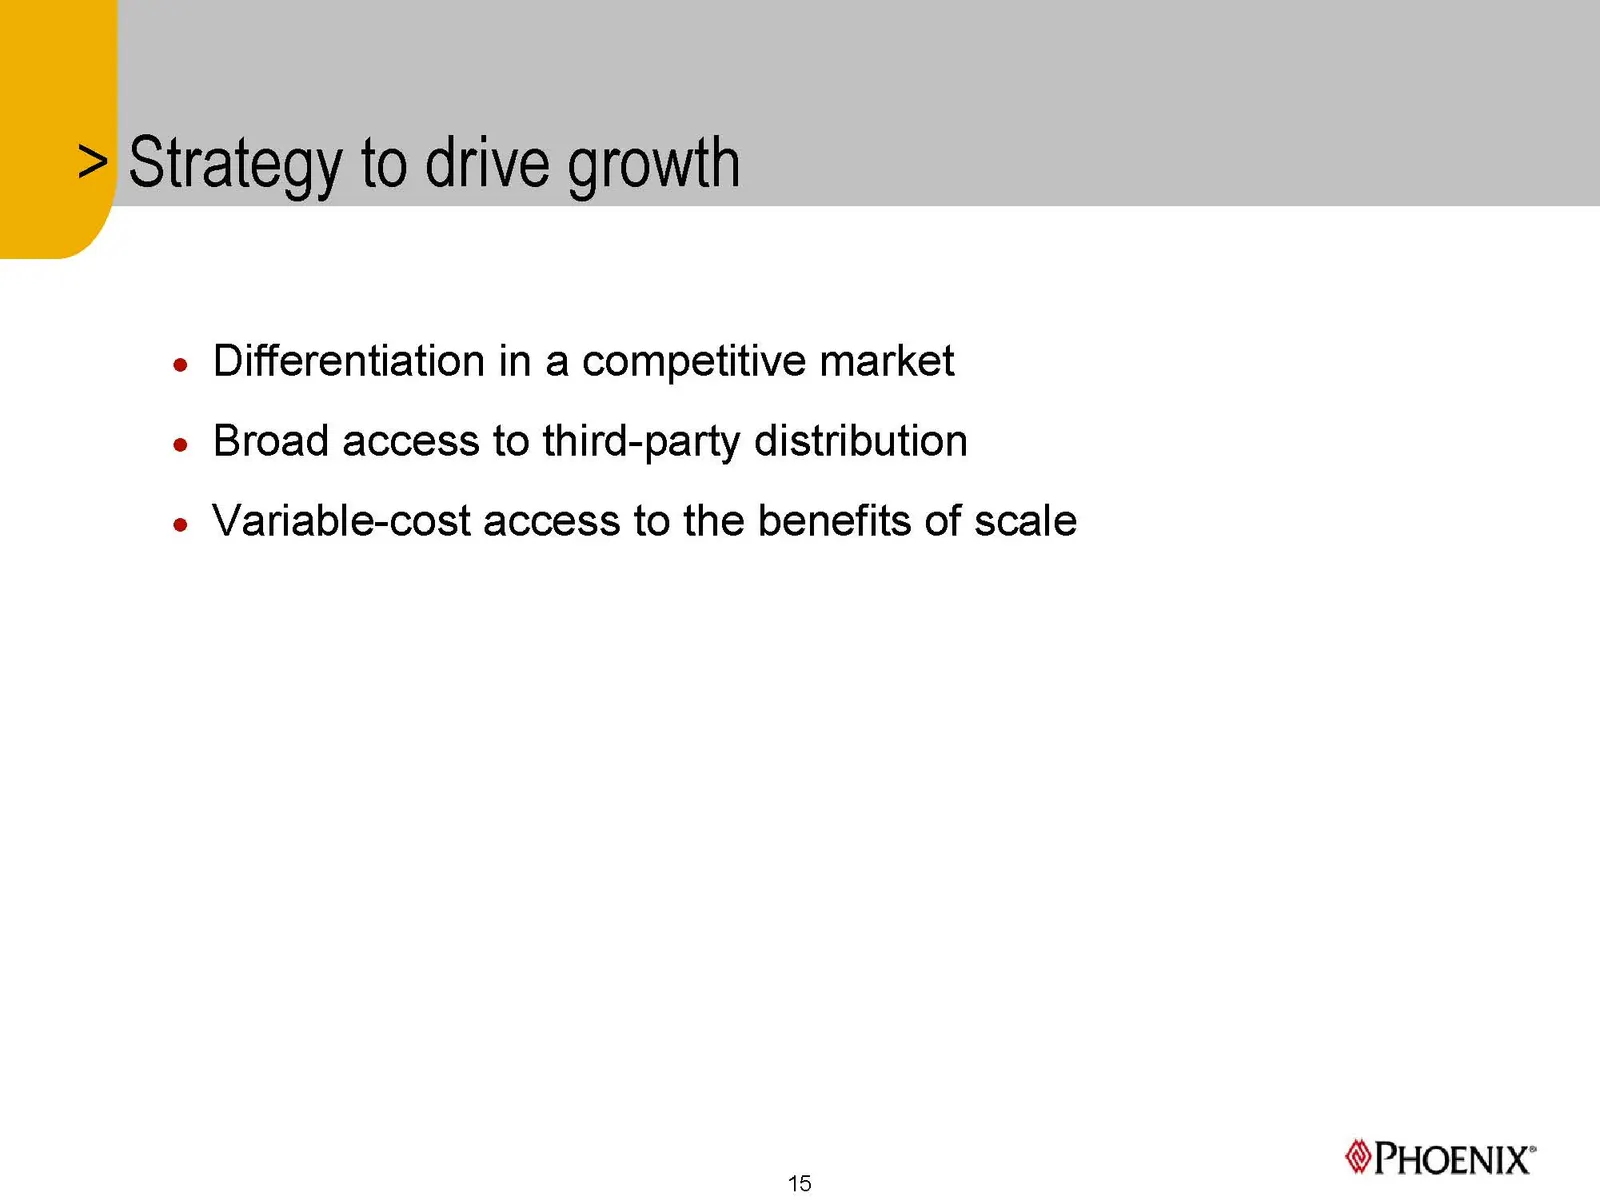
Slide 15: Differentiation in a competitive market
e Differentiation in a competitive market e Broad access to third-party distribution e Variable-cost access to the benefits of scale PHOENIX’ 15
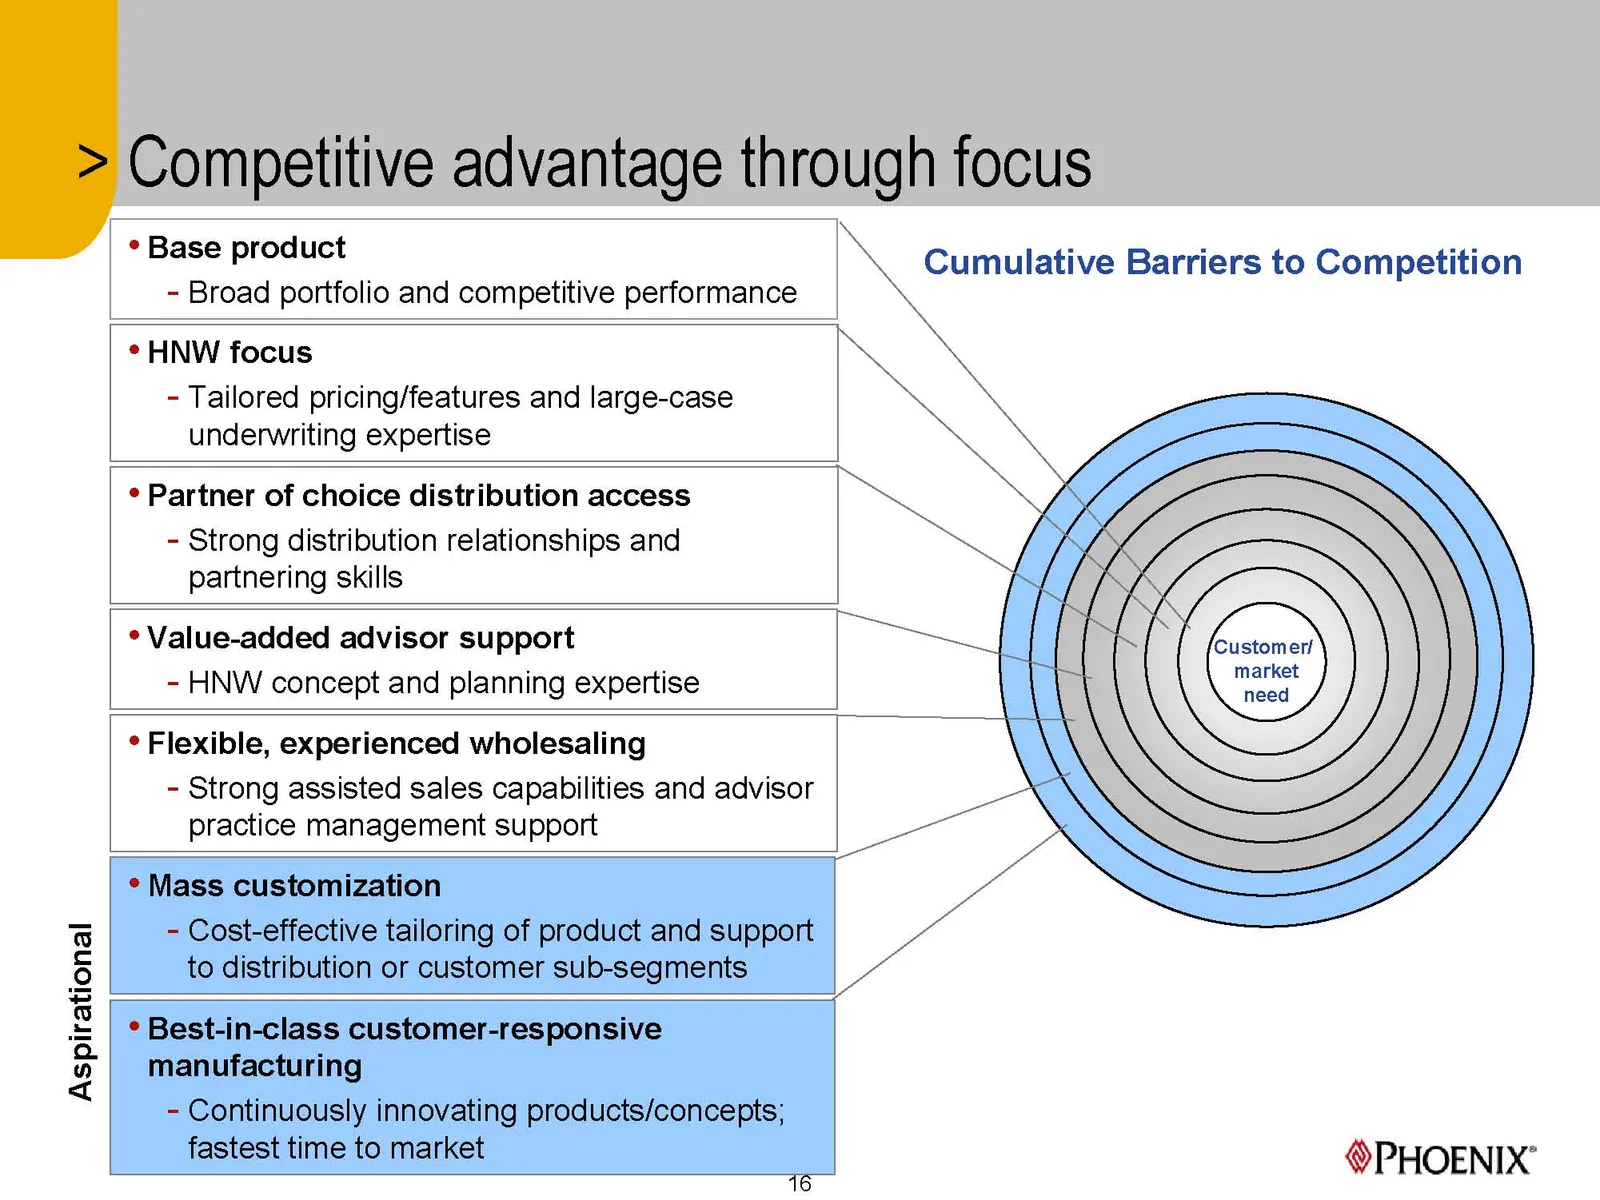
Slide 16: Aspirational
Aspirational ° Base product - Broad portfolio and competitive performance * HNW focus - Tailored pricing/features and large-case underwriting expertise ¢ Partner of choice distribution access - Strong distribution relationships and partnering skills ¢ Value-added advisor support - HNW concept and pl
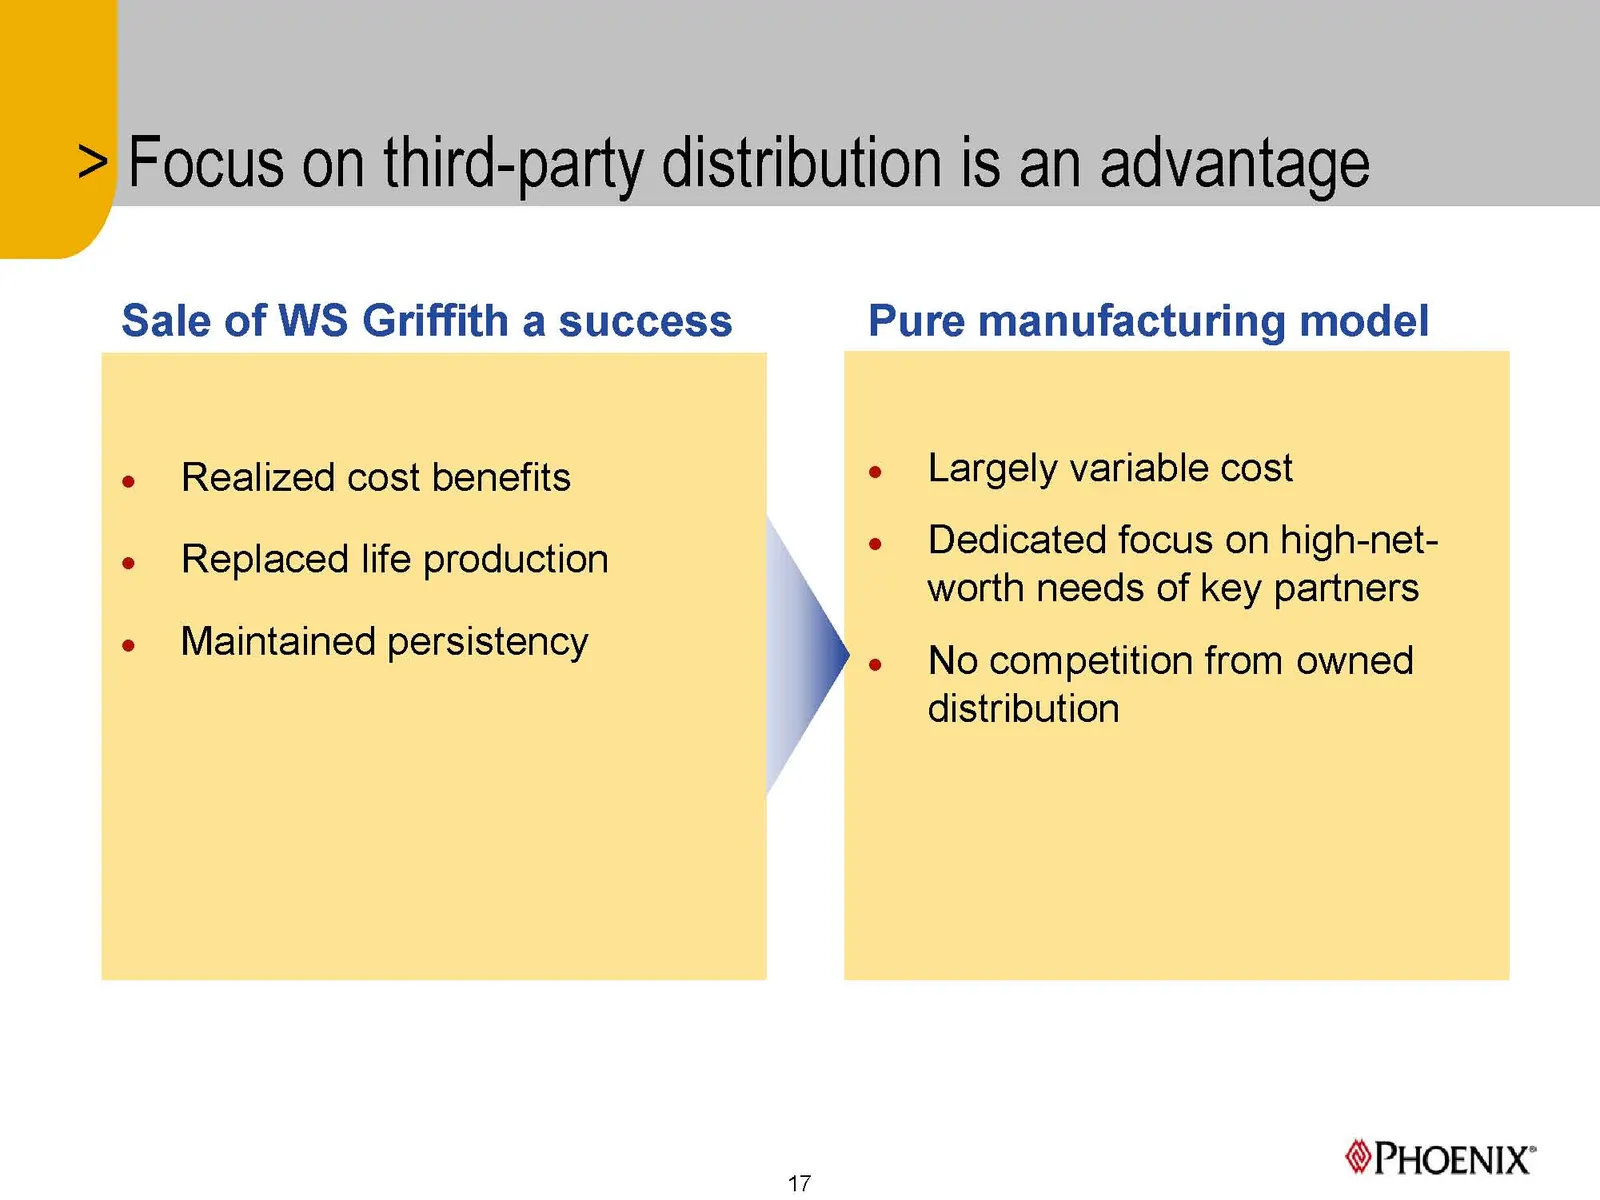
Slide 17: Focus on third-party distribution is an advantage
> Focus on third-party distribution is an advantage Sale of WS Griffith a success Realized cost benefits Replaced life production Maintained persistency Pure manufacturing model ». 17 Largely variable cost Dedicated focus on high-net- worth needs of key partners No competition from owned distributio
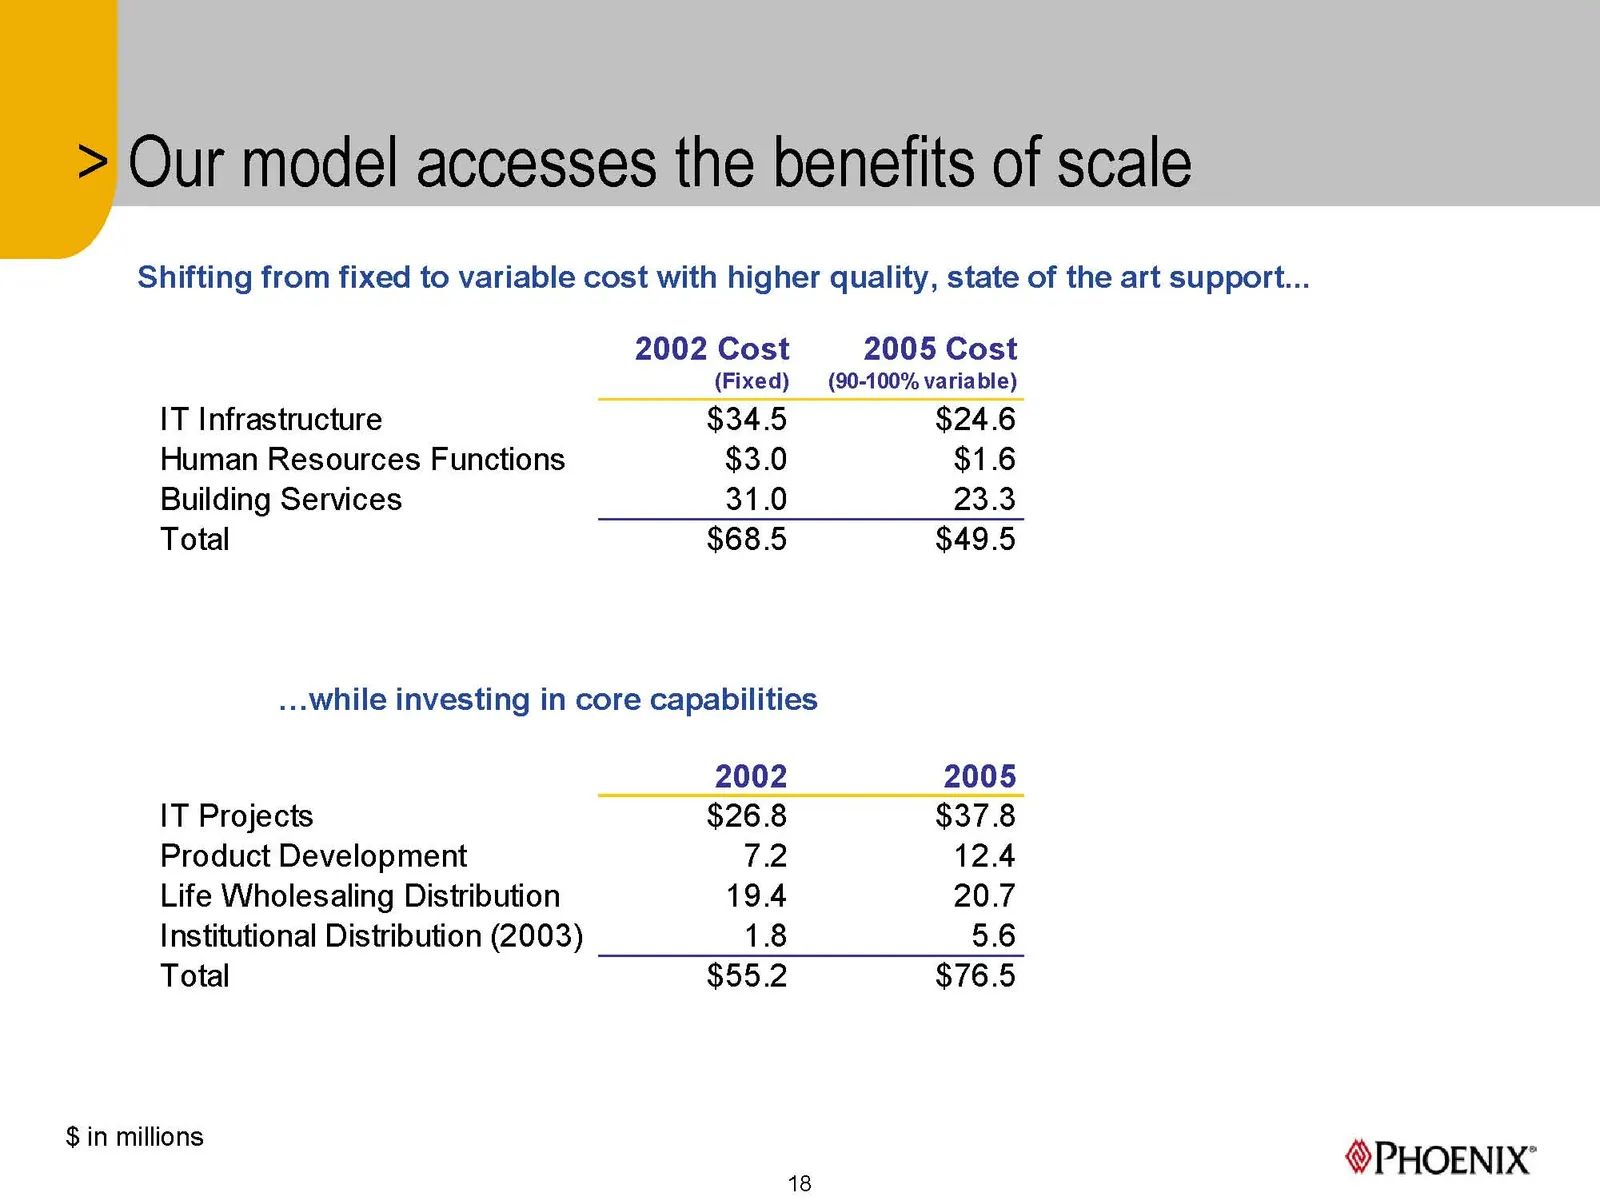
Slide 18: Our model accesses the benefits of scale
Our model accesses the benefits of scale Shifting from fixed to variable cost with higher quality, state of the art support... 2002 Cost 2005 Cost (Fixed) (90-100% variable) IT Infrastructure $34.5 $24.6 Human Resources Functions $3.0 $1.6 Building Services 31.0 23.3 Total $68.5 $49.5 ...while inves
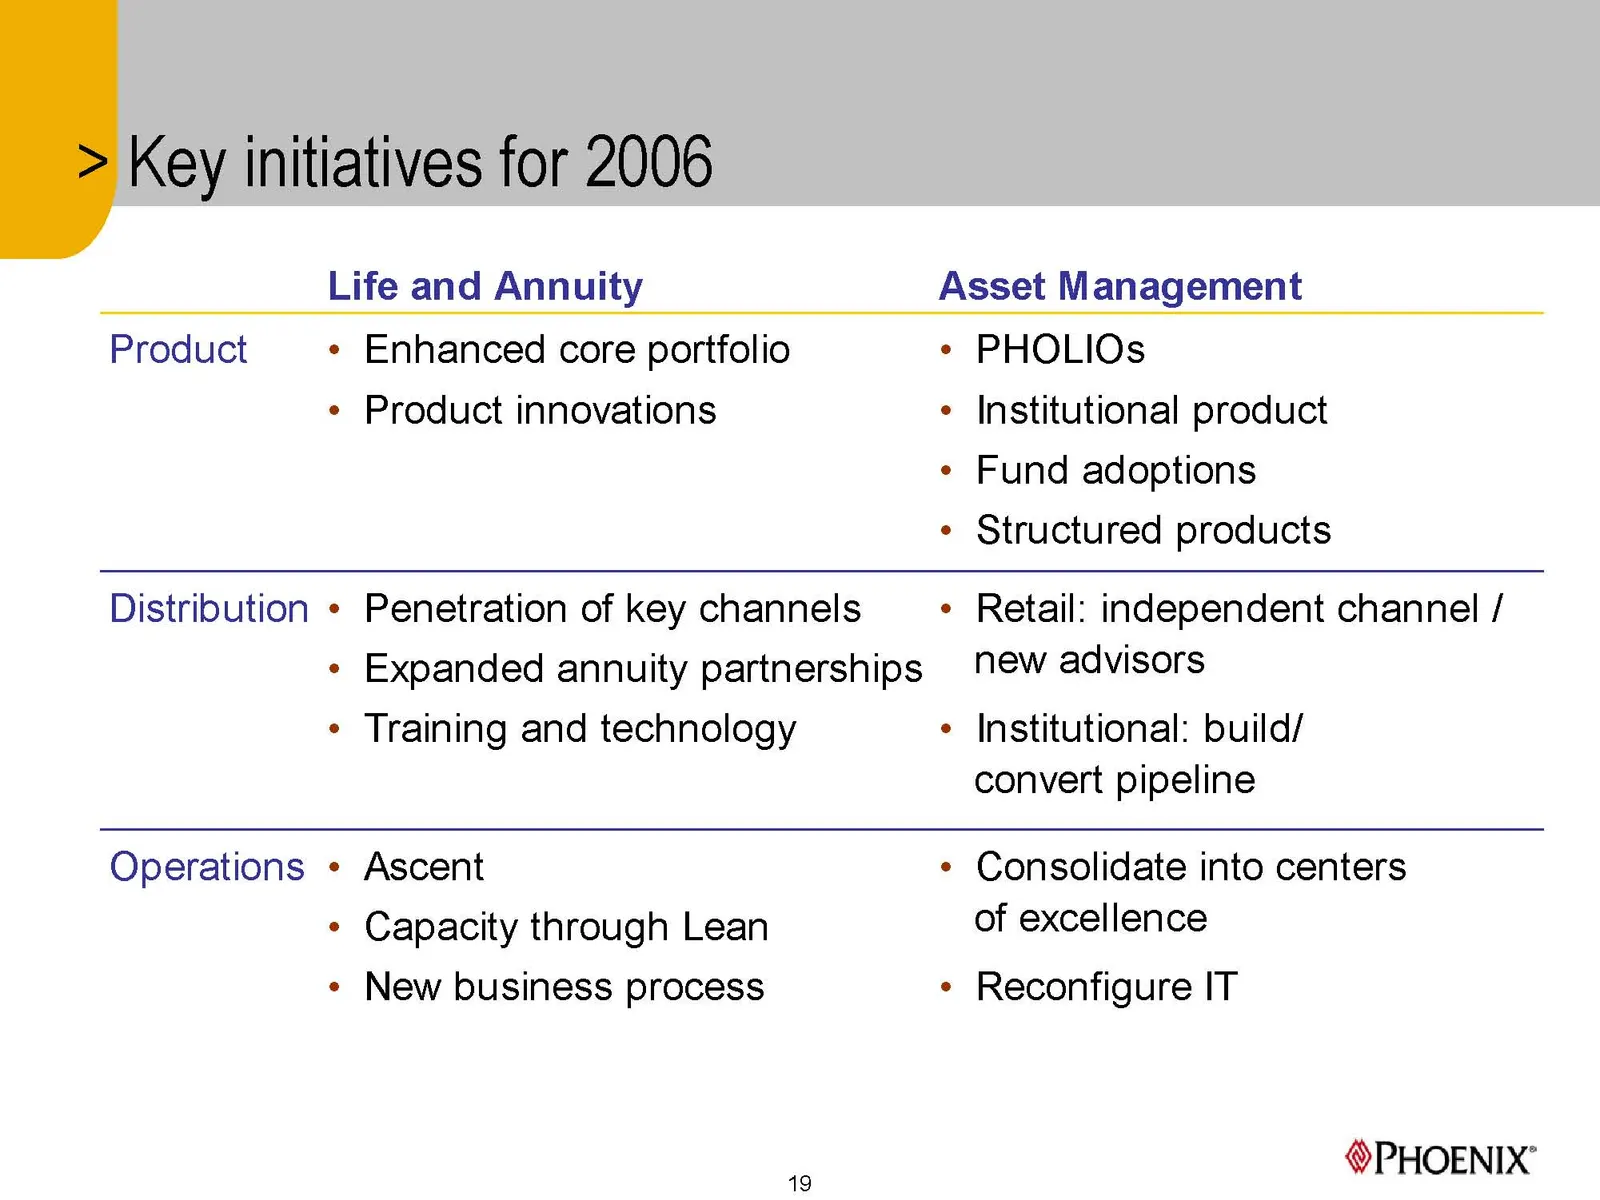
Slide 19: Key initiatives for 2006
Key initiatives for 2006 Life and Annuity Asset Management Product ¢ Enhanced core portfolio *« PHOLIOs ¢ Product innovations ¢ Institutional product ¢ Fund adoptions ¢ Structured products Distribution * Penetration of key channels ¢ Retail: independent channel / * Expanded annuity partnerships "ew
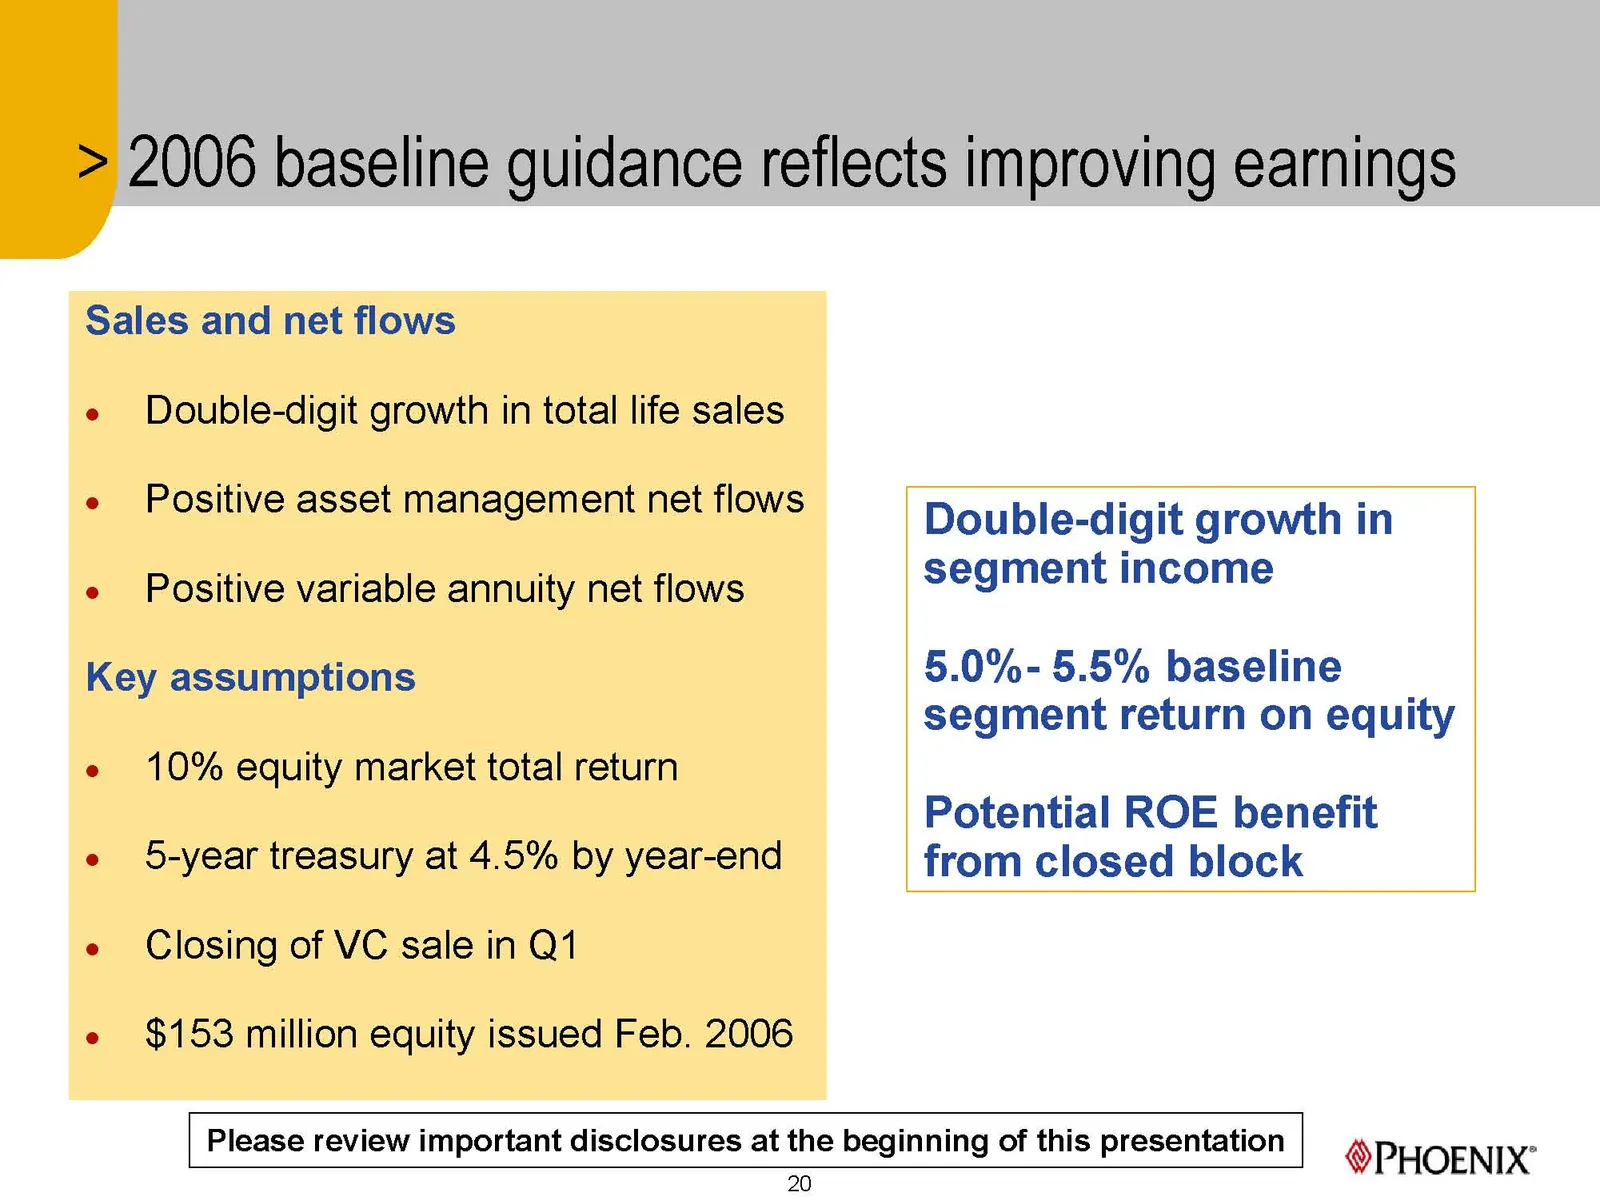
Slide 20: 2006 baseline guidance reflects improving earnings
> 2006 baseline guidance reflects improving earnings Sales and net flows Double-digit growth in total life sales Positive asset management net flows Double-digit growth in Positive variable annuity net flows segment income Key assumptions 5.0%- 5.5% baseline segment return on equity 10% equity marke
Slide 21: We will revisit options for the closed block in 2006
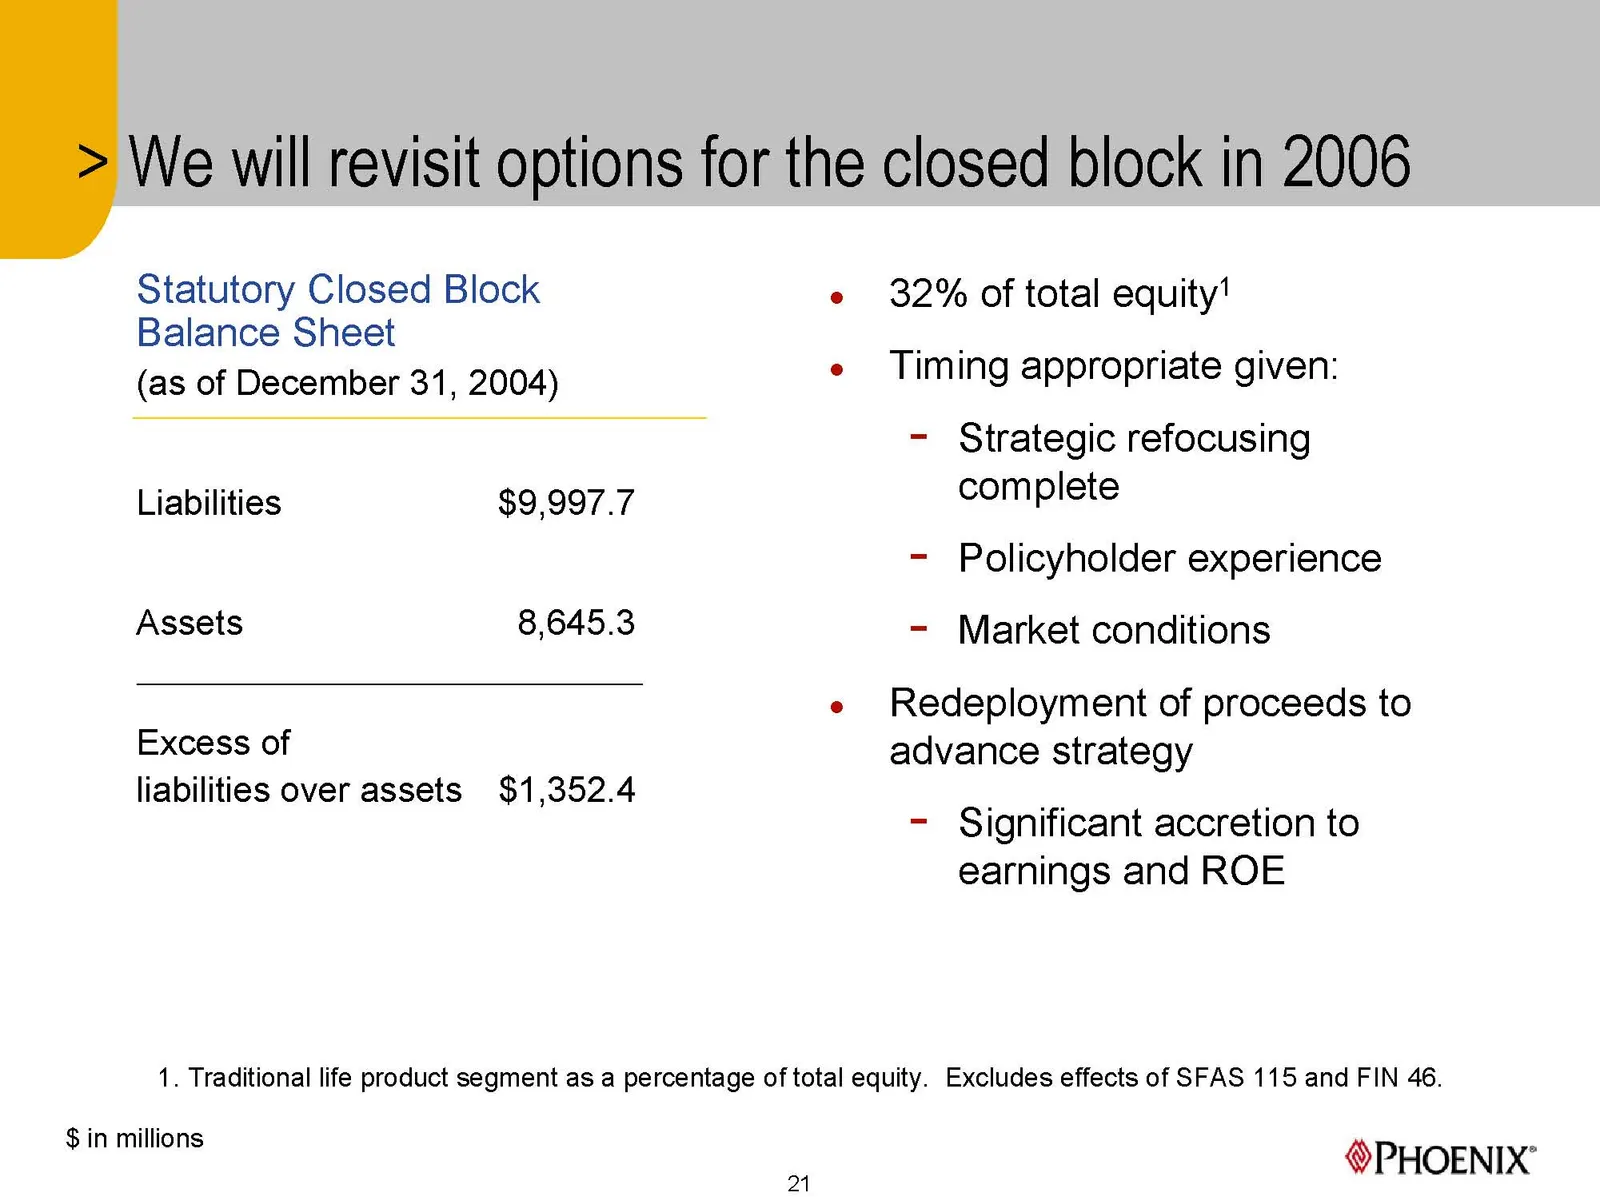
We will revisit options for the closed block in 2006 Statutory Closed Block e 32% of total equity’ Balance Sheet . . . (as of December 31, 2004) e Timing appropriate given: - Strategic refocusing Liabilities $9,997.7 complete - Policyholder experience Assets 8,645.3 - Market conditions e Redeploymen
Slide 22: 2006 priorities
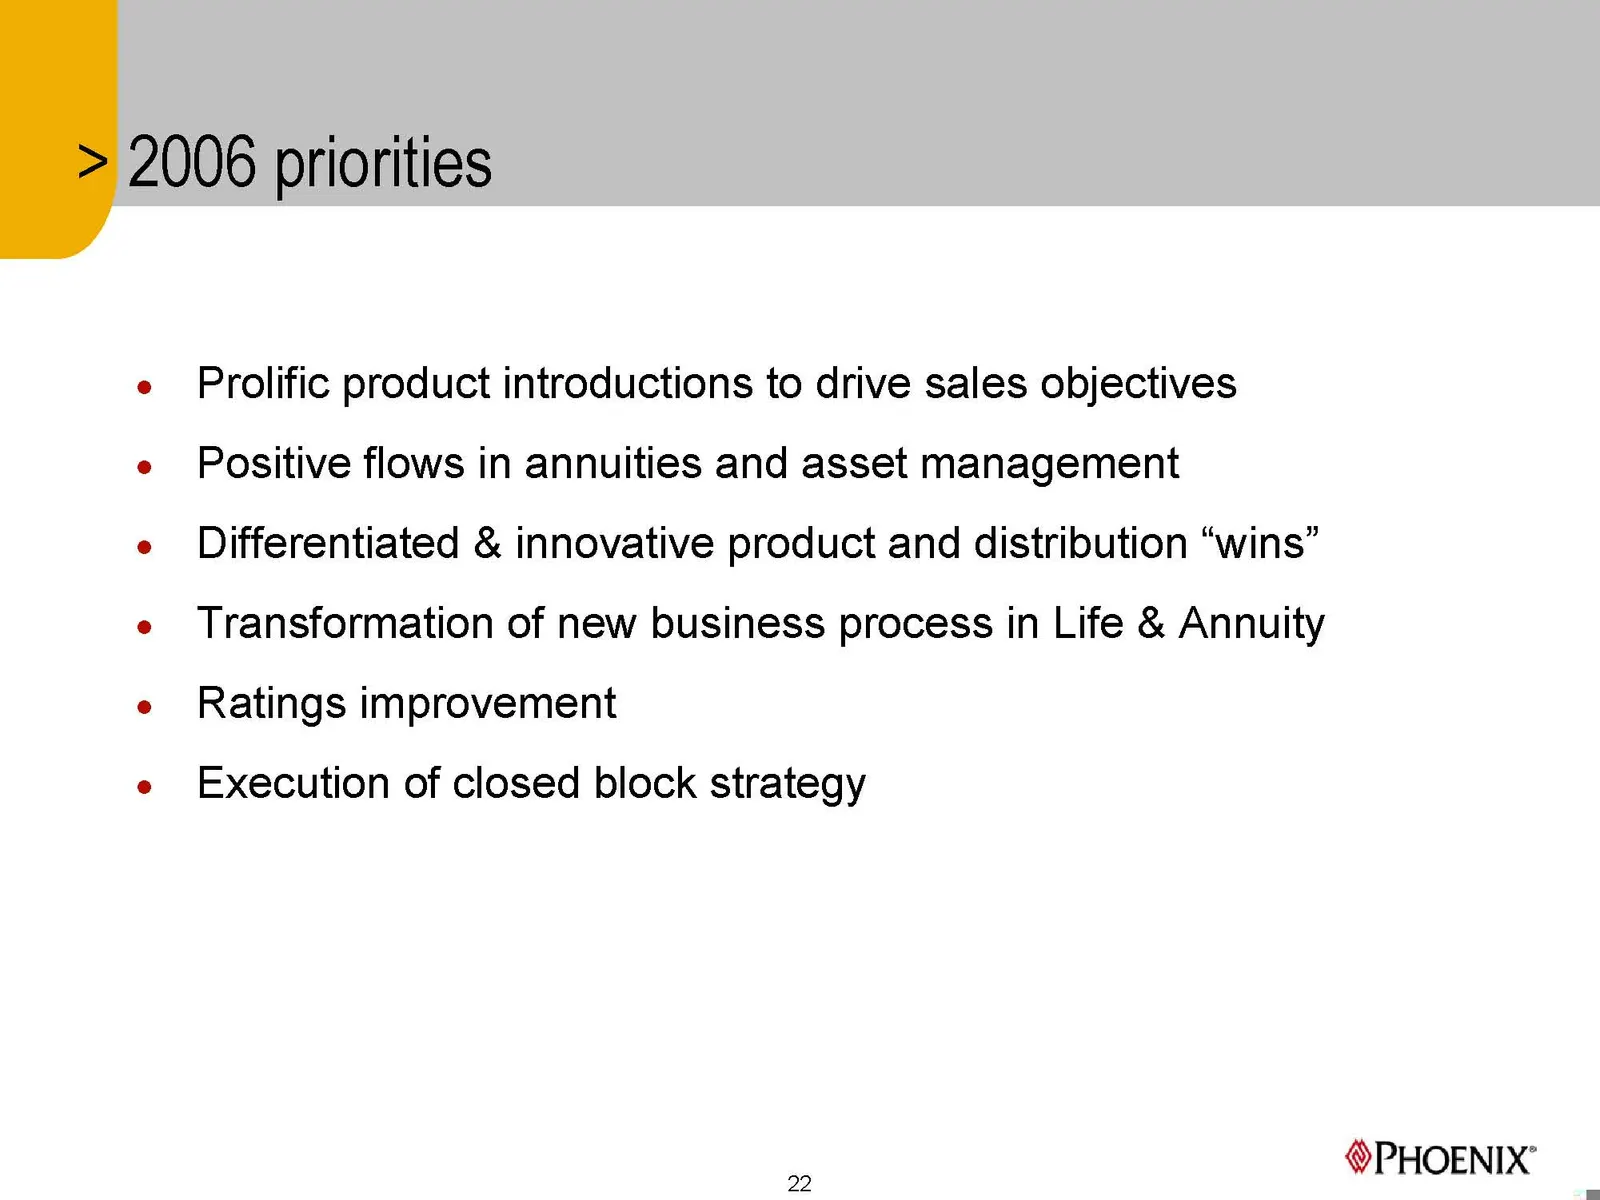
2006 priorities e Prolific product introductions to drive sales objectives e Positive flows in annuities and asset management e Differentiated & innovative product and distribution “wins” e Transformation of new business process in Life & Annuity e Ratings improvement e Execution of closed block str
Slide 23: Asset Management
The Phoenix Companies, Inc. Asset Management Daniel T. Geraci Executive Vice President December 13, 2005 New York City PHOENIX"
Slide 24: Significant progress in 2005
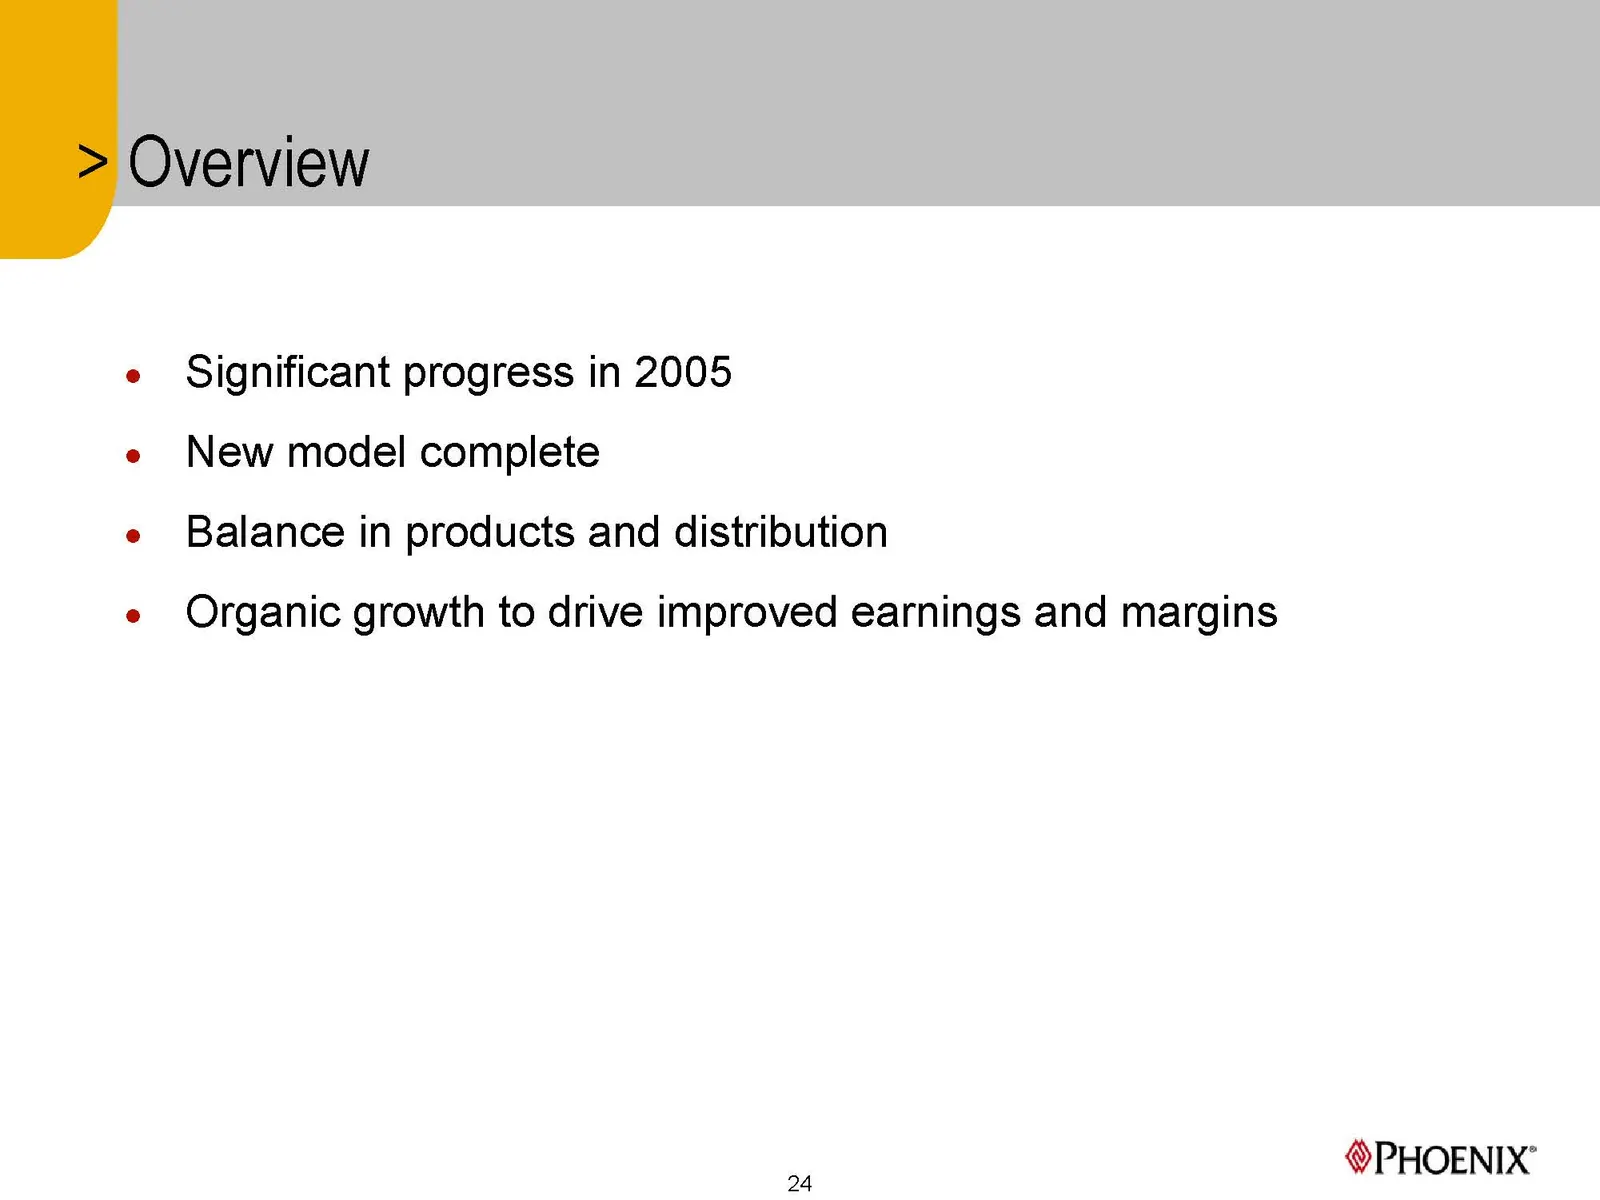
Significant progress in 2005 New model complete Balance in products and distribution Organic growth to drive improved earnings and margins 24 PHOENIX’
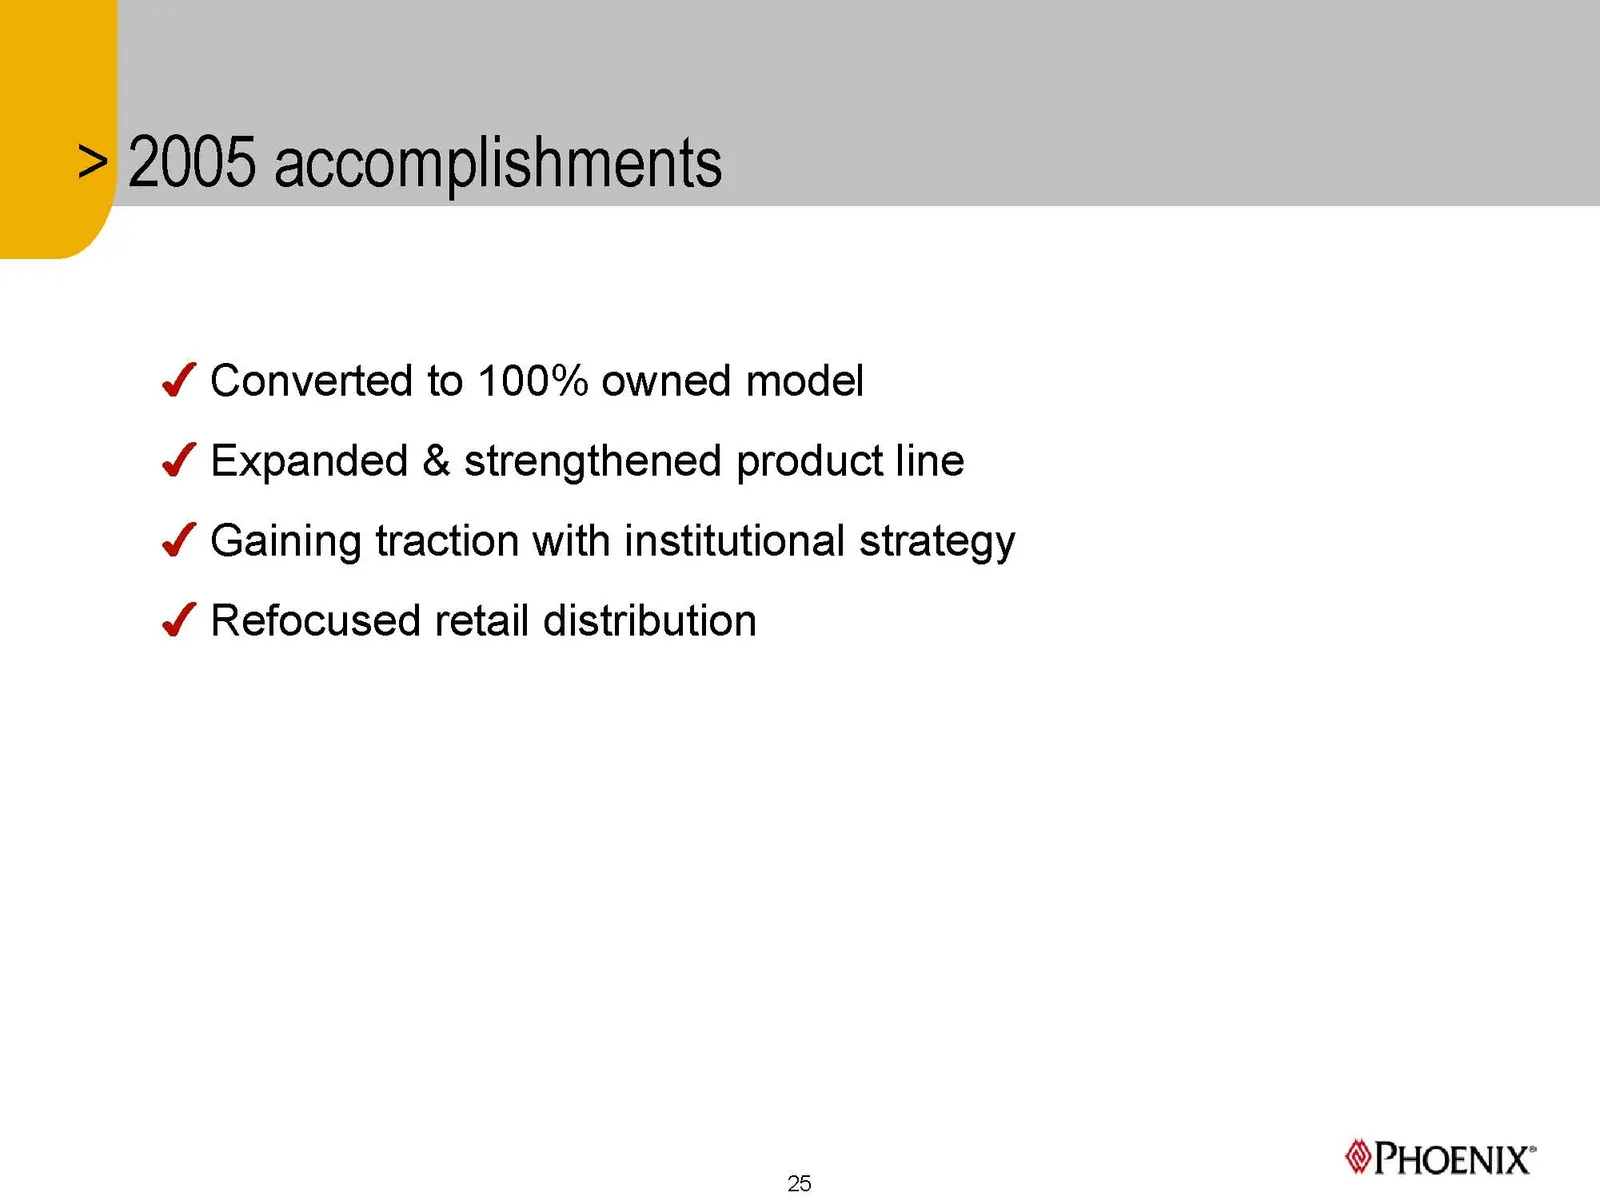
Slide 25: Converted to 100% owned model
v¥ Converted to 100% owned model v Expanded & strengthened product line ¥ Gaining traction with institutional strategy v¥ Refocused retail distribution PHOENIX’ 25
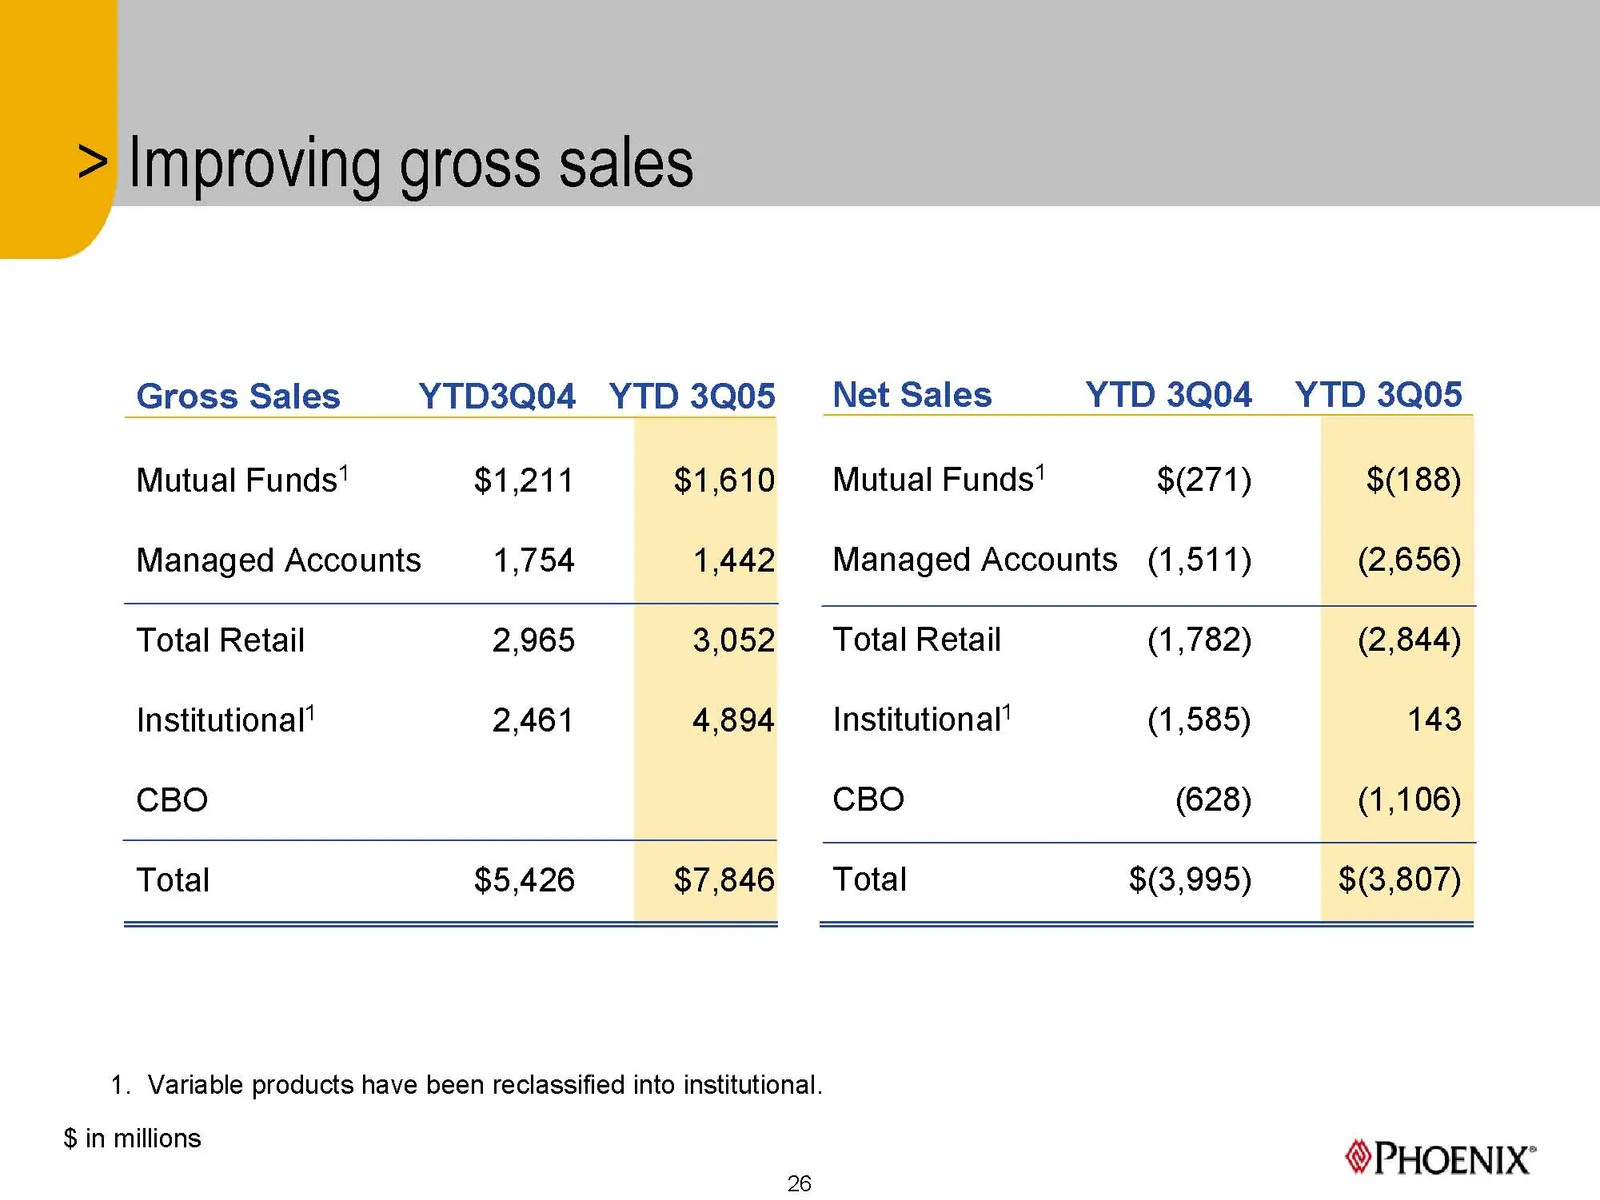
Slide 26: Improving gross sales
Improving gross sales Gross Sales YTD3Q04 YTD3Q05 Net Sales YTD 3Q04 YTD 3Q05 Mutual Funds’ $1,211 $1,610 Mutual Funds’ $(271) $(188) Managed Accounts 1,754 1,442 Managed Accounts (1,511) (2,656) Total Retail 2,965 3,052 ‘Total Retail (1,782) (2,844) Institutional’ 2,461 4,894 Institutional’ (1,585)
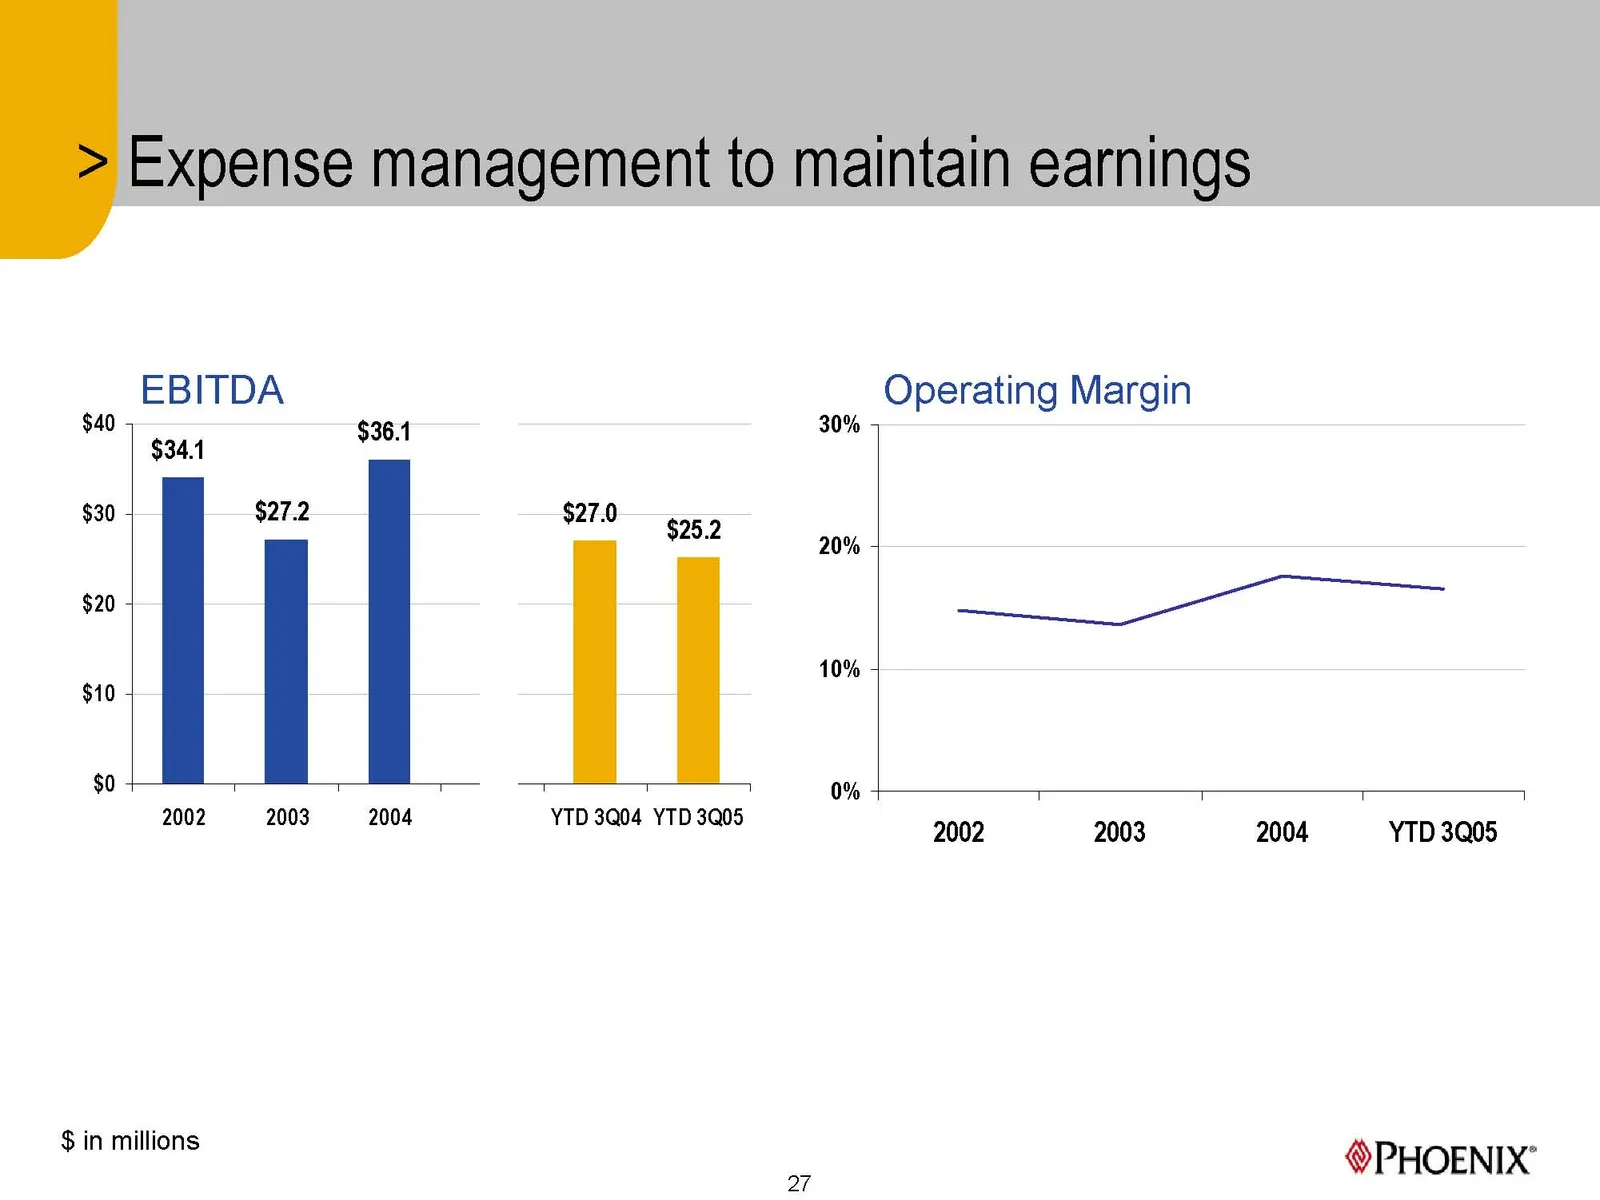
Slide 27: EBITDA
$40 9 $30 + $20 5 $10 4 $0 + EBITDA $34.1 pe | $27.2 30% 5 $25.2 20% Operating Margin ae pe OCOC*S*~*~S $270 a | 10% : 0% 2002 2003 2004 $ in millions YTD 3Q04 YTD 3Q05 27 2002 2003 2004 YTD 3Q05 PHOENIX’
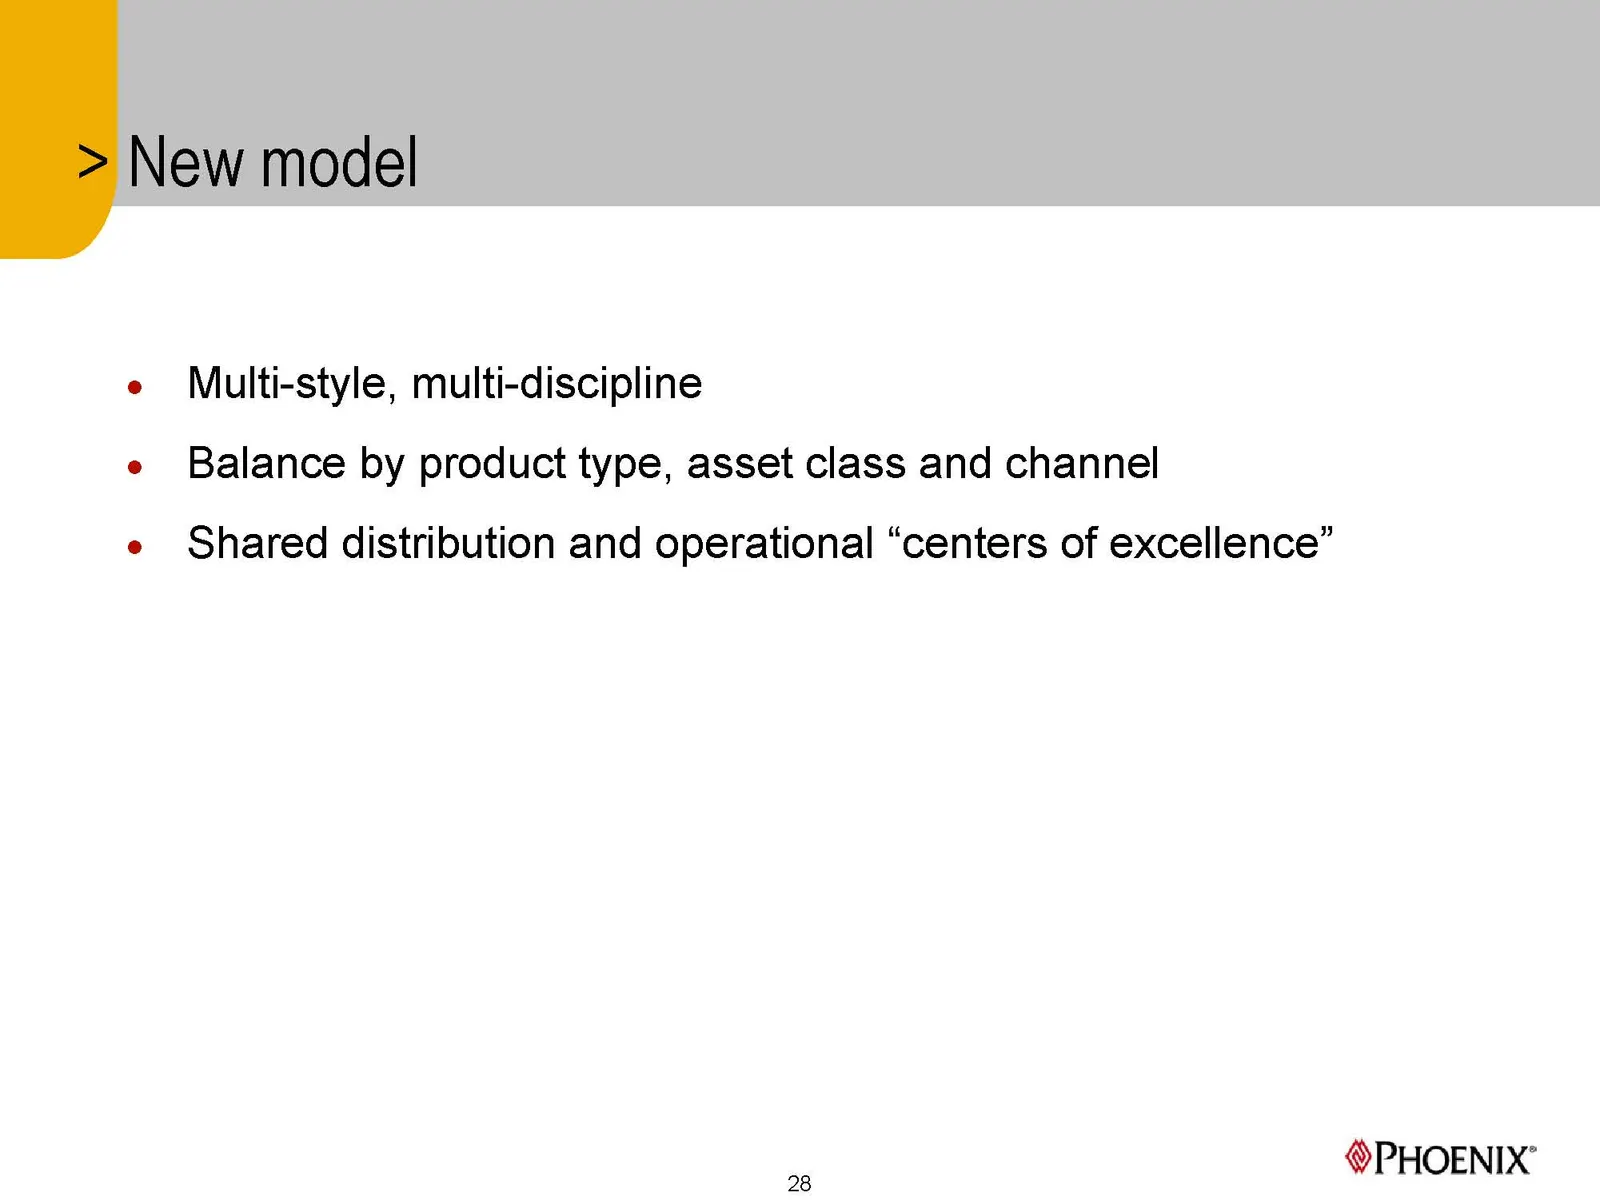
Slide 28: Multi-style, multi-discipline
e Multi-style, multi-discipline e Balance by product type, asset class and channel e Shared distribution and operational “centers of excellence” PHOENIX’ 28
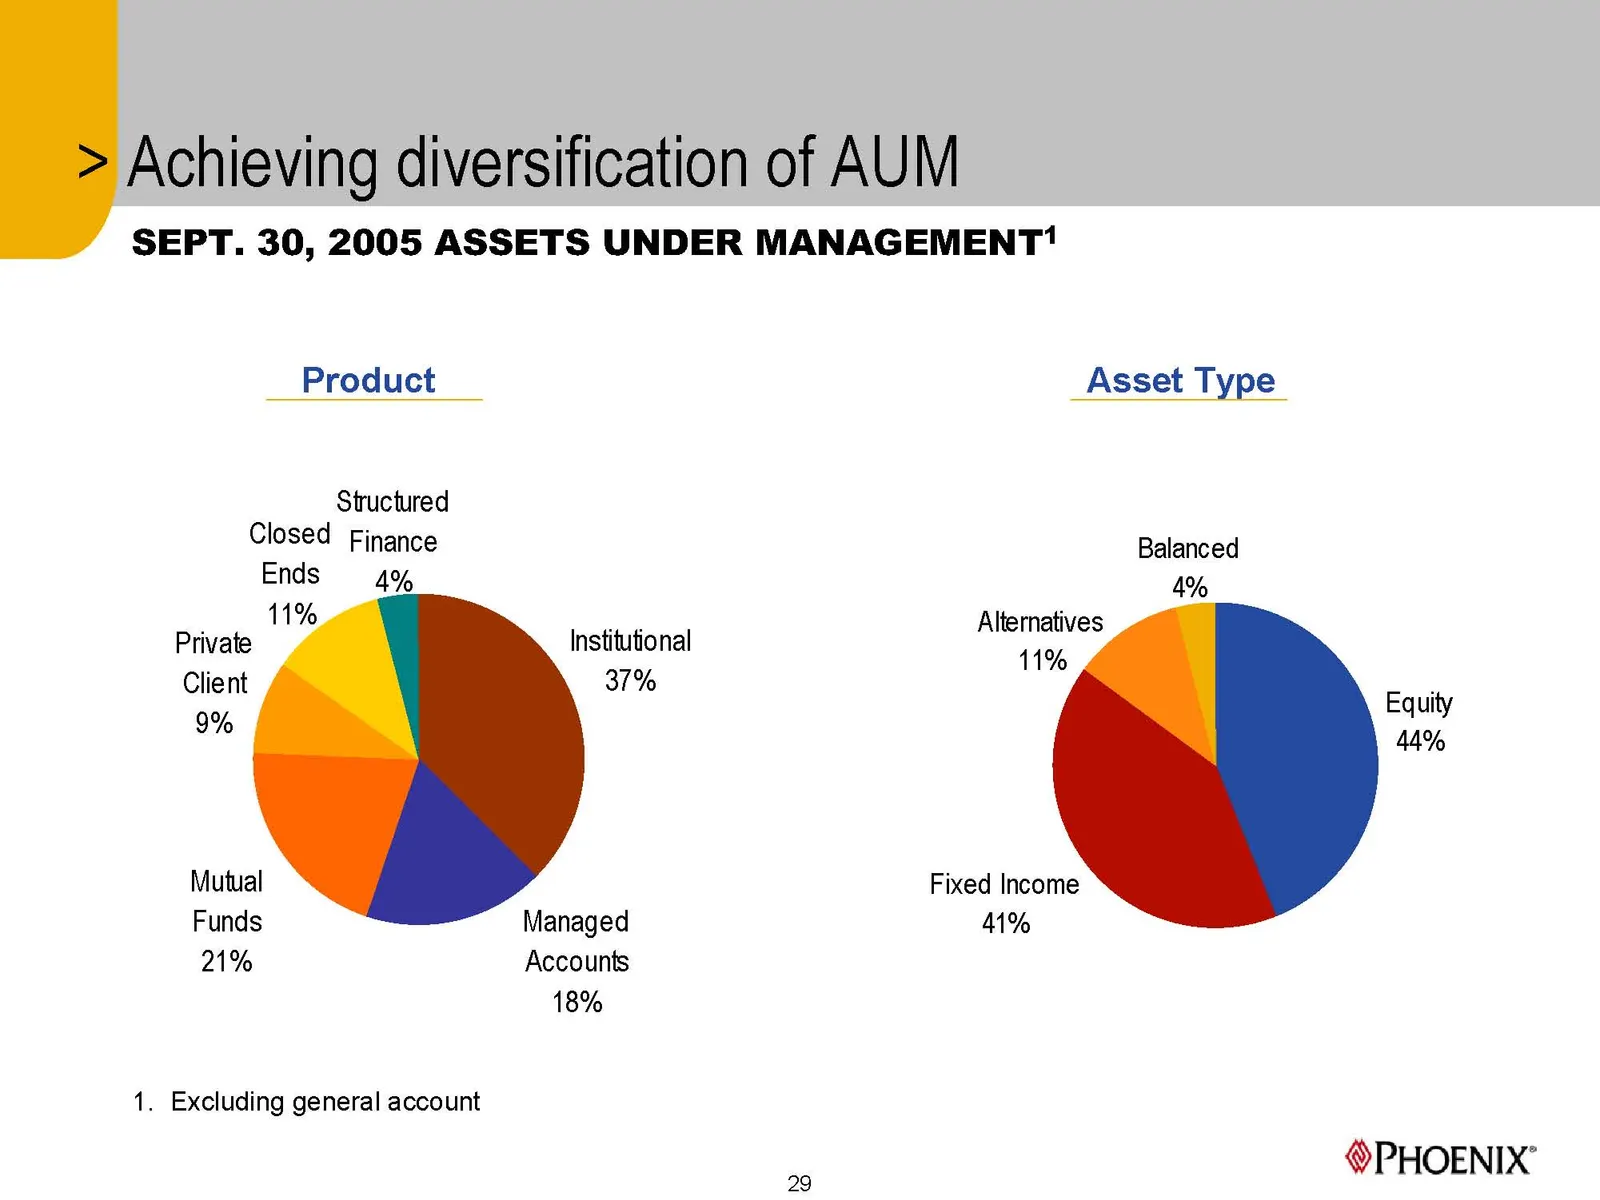
Slide 29: Achieving diversification of AUM
Achieving diversification of AUM SEPT. 30, 2005 ASSETS UNDER MANAGEMENT‘ Product Asset Type Structured Closed Finance Balanced Ends 4% Alternatives Institutional 11% 37% Private Client 9% Equity 44% Mutual Fixed Income Funds Managed M% 21% Accounts 18% 1. Excluding general account PHOENIX’ 29
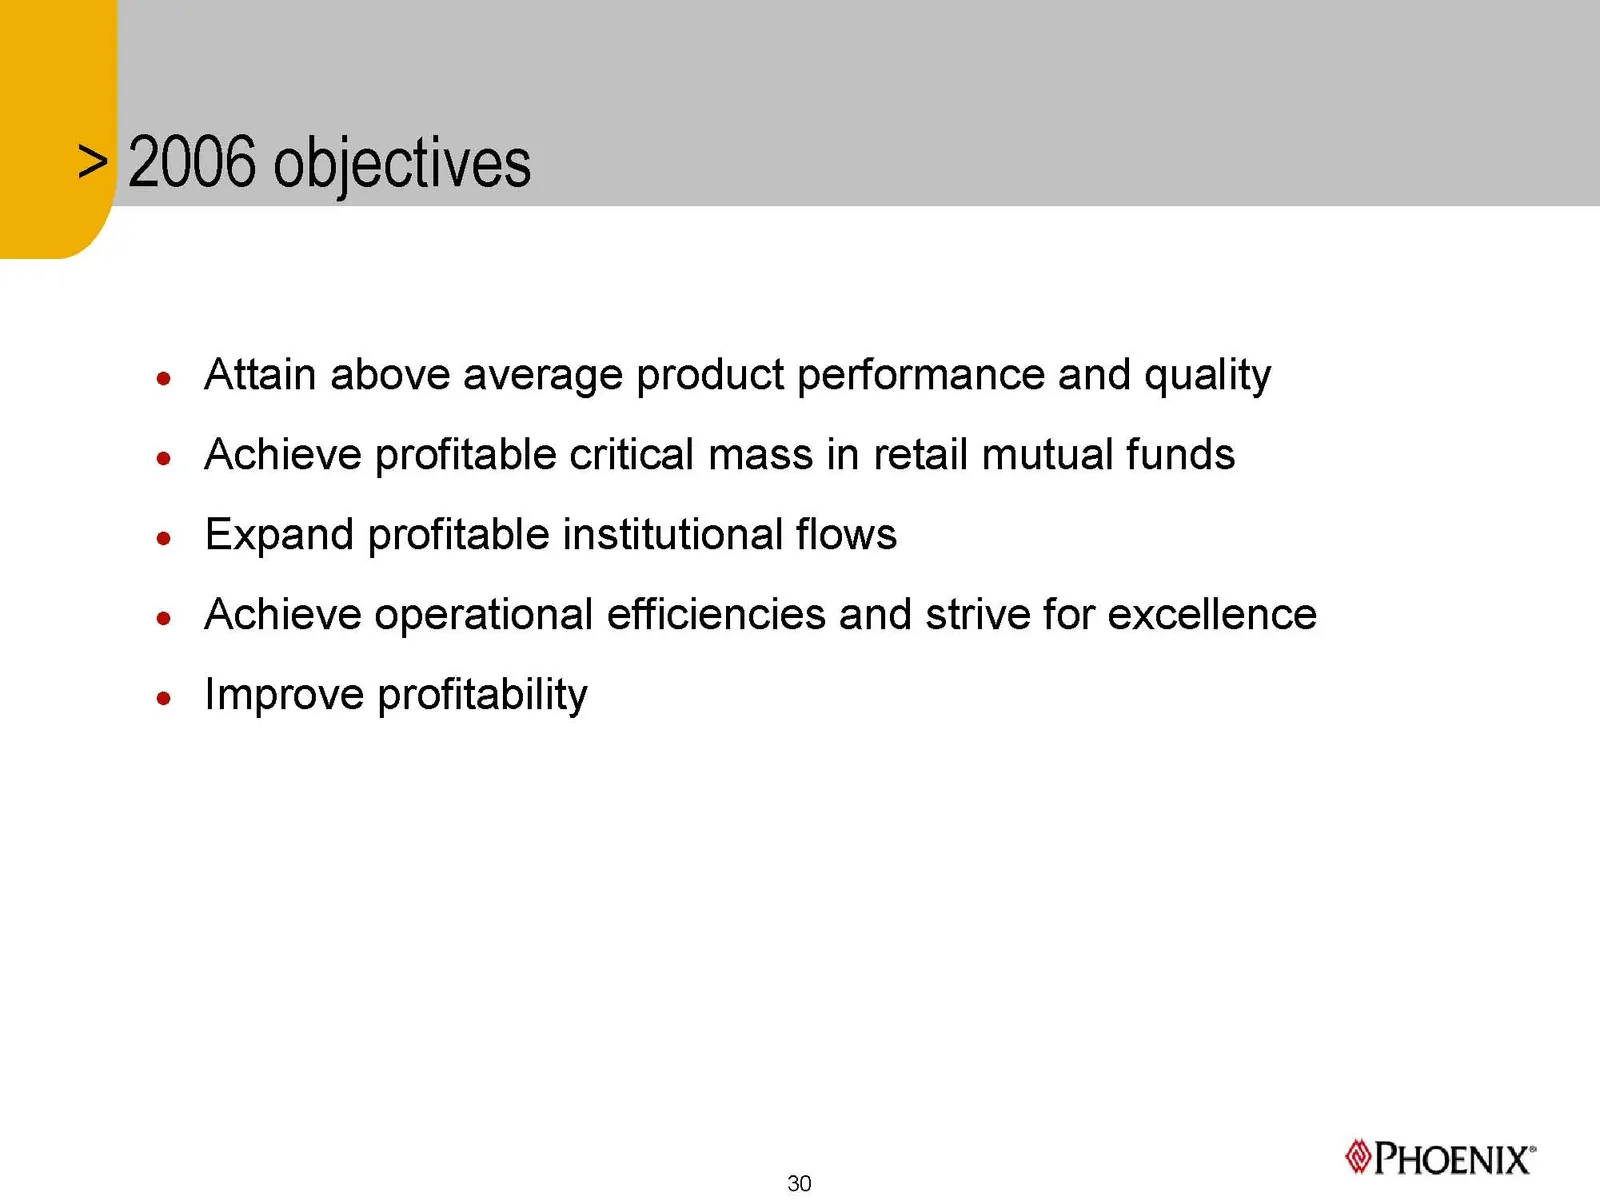
Slide 30: 2006 objectives
2006 objectives Attain above average product performance and quality Achieve profitable critical mass in retail mutual funds Expand profitable institutional flows Achieve operational efficiencies and strive for excellence Improve profitability PHOENIX’ 30
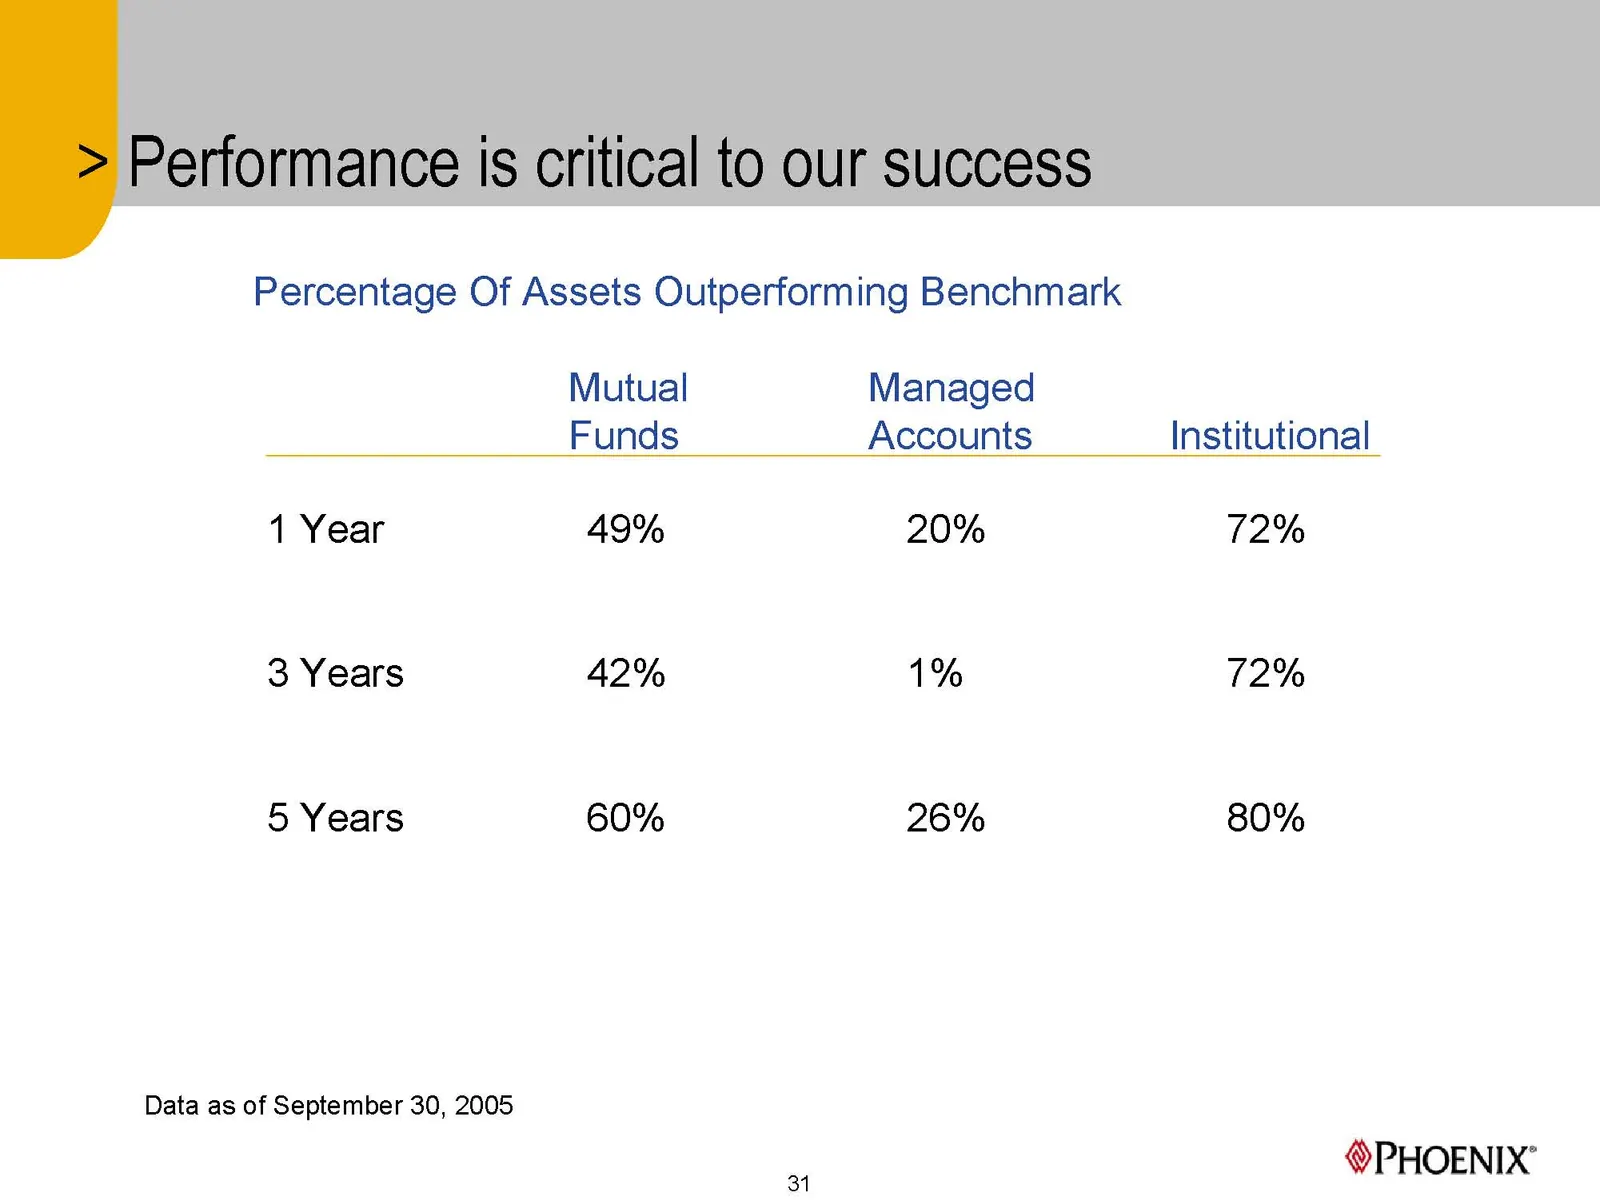
Slide 31: Percentage Of Assets Outperforming Benchmark
Percentage Of Assets Outperforming Benchmark Mutual Managed Funds Accounts Institutional 1 Year 49% 20% 72% 3 Years 42% 1% 72% 5 Years 60% 26% 80% Data as of September 30, 2005 PHOENIX" 31
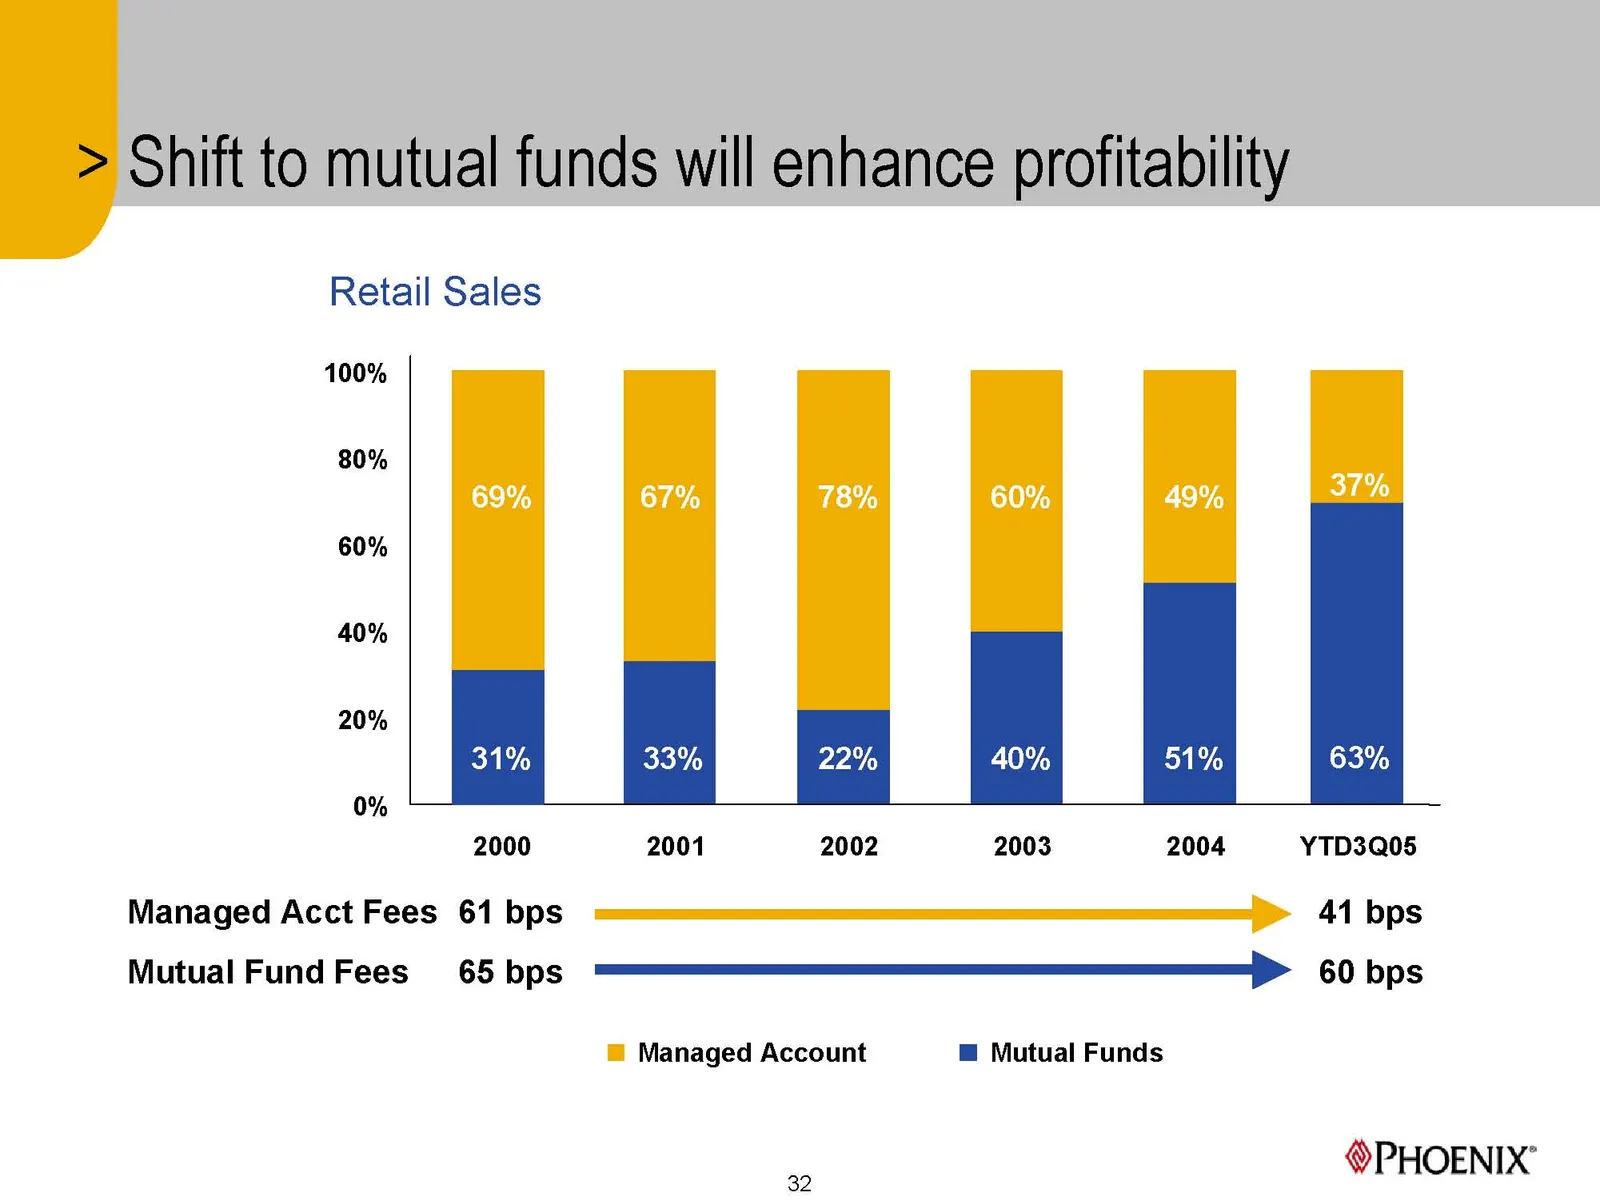
Slide 32: Shift to mutual funds will enhance profitability
Shift to mutual funds will enhance profitability Retail Sales 100% 80% ; 69% 67% 78% 60% 49% 37% 60% 40% 20% 31% 33% 22% 40% 51% 63% 0% 2000 2001 2002 2003 2004 YTD3Q05 Managed Acct Fees 61 bps eee 41 bps Mutual Fund Fees 65 bps —————__—_————ED 60 bps ™ Managed Account @ Mutual Funds PHOENIX’ 32
Slide 33: Expanded market coverage in retail distribution
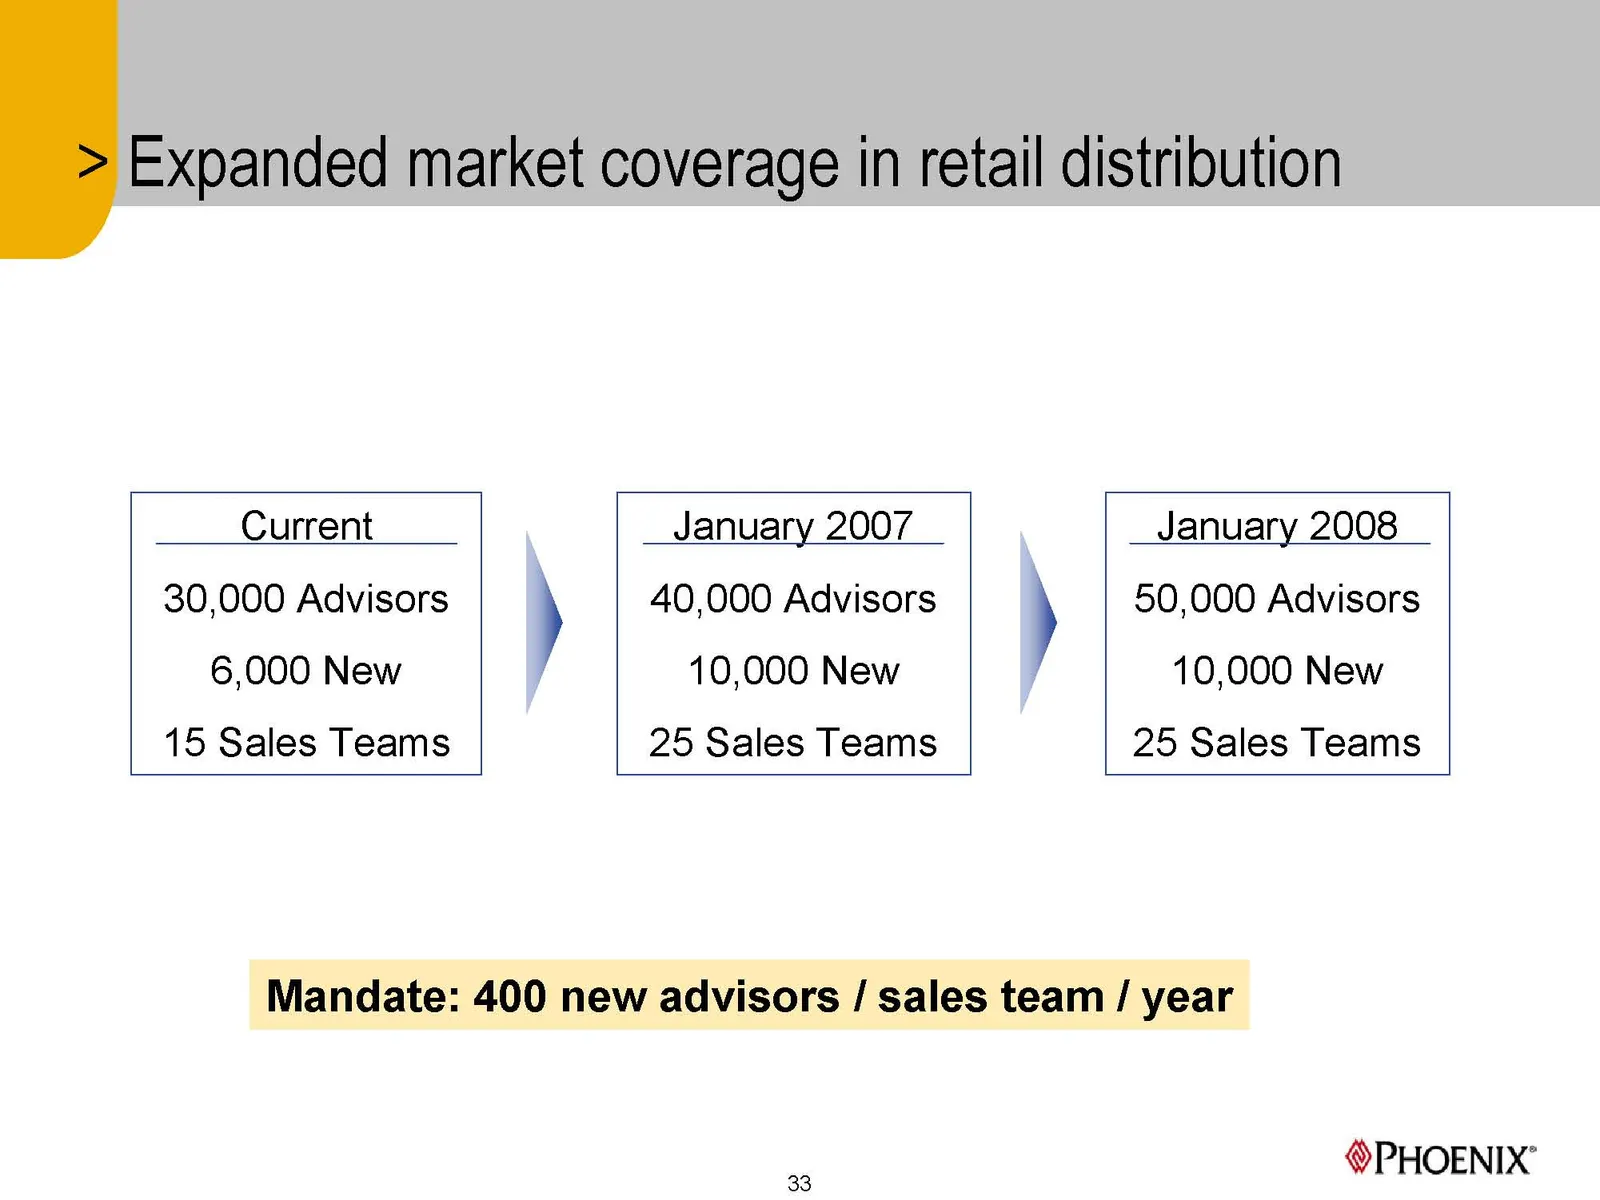
Expanded market coverage in retail distribution Current January 2007 January 2008 30,000 Advisors ) 40,000 Advisors ) 50,000 Advisors 6,000 New 10,000 New 10,000 New 15 Sales Teams 25 Sales Teams 25 Sales Teams Mandate: 400 new advisors / sales team / year PHOENIX’ 33
Slide 34: 3Q05 YTD Retail Sales
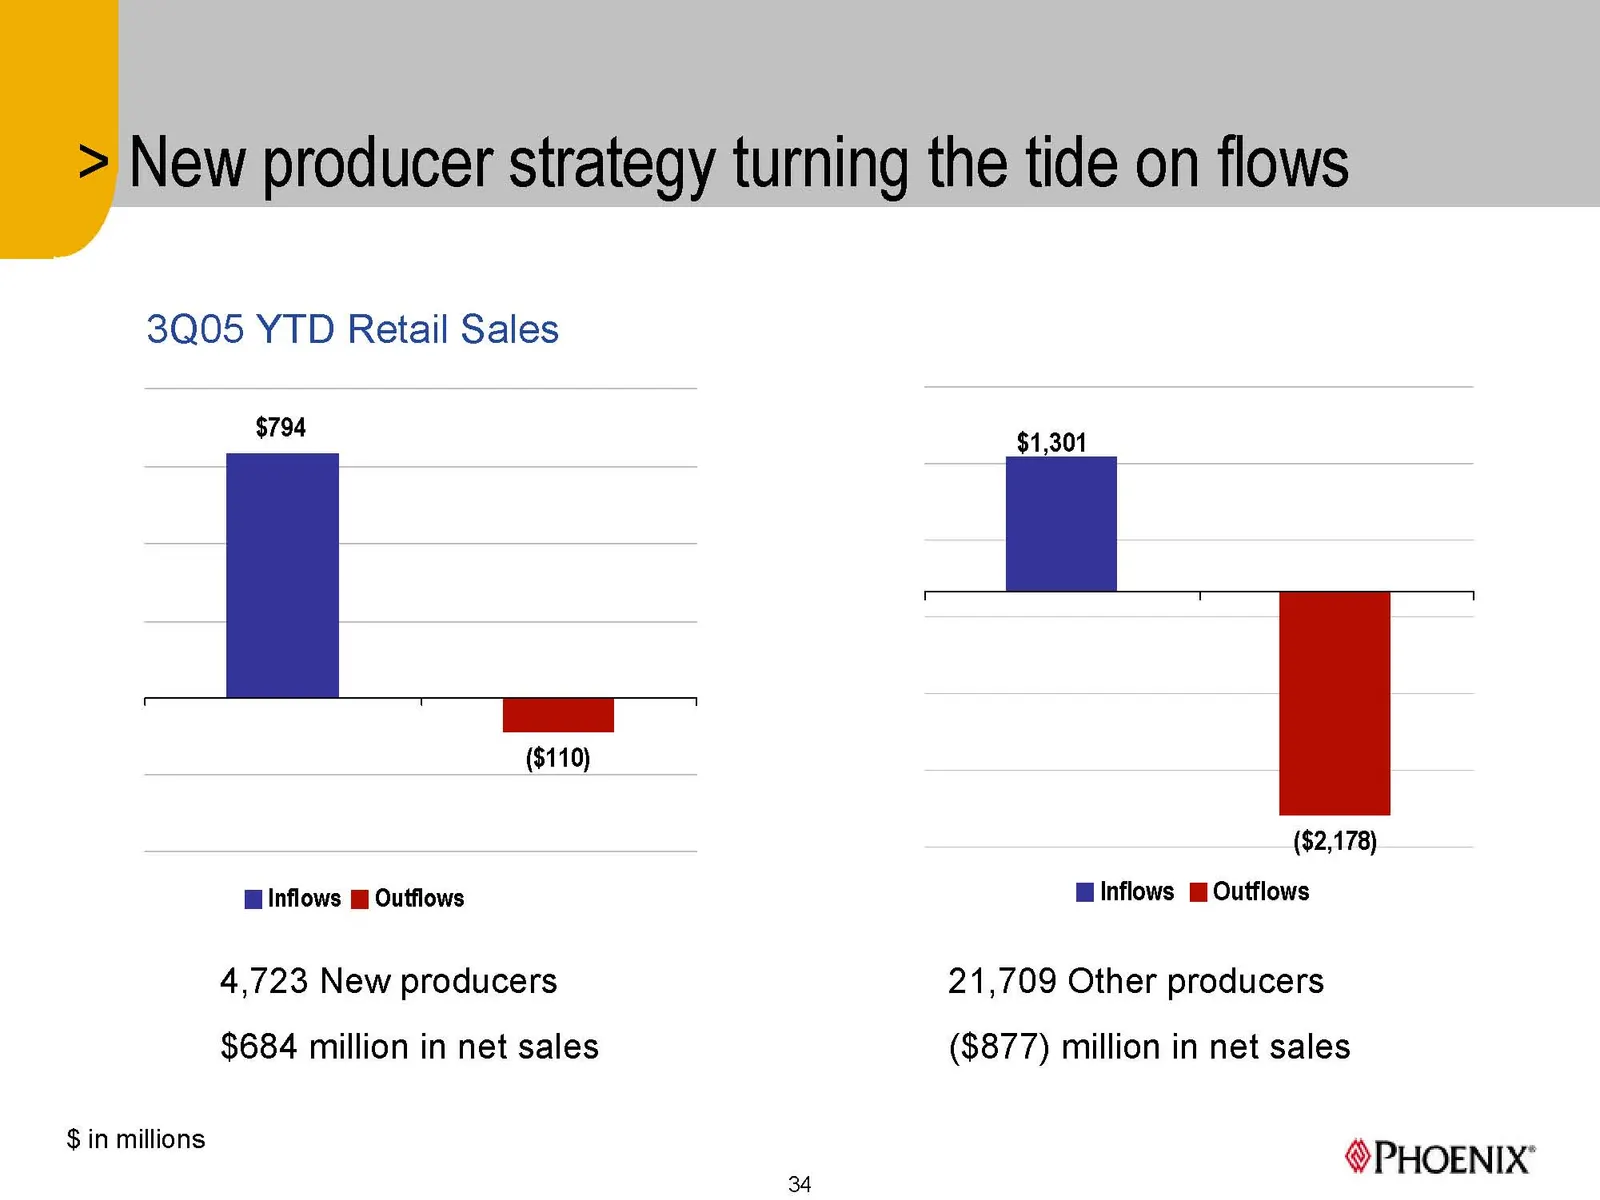
3Q05 YTD Retail Sales $794 | ($110) Hi lnflows Mi Outflows 4,723 New producers $684 million in net sales $in millions New producer strategy turning the tide on flows $1,301 ($2,178) i lnflows m Outflows 21,709 Other producers ($877) million in net sales PHOENIX’
Slide 35: Sub-advisor adoption
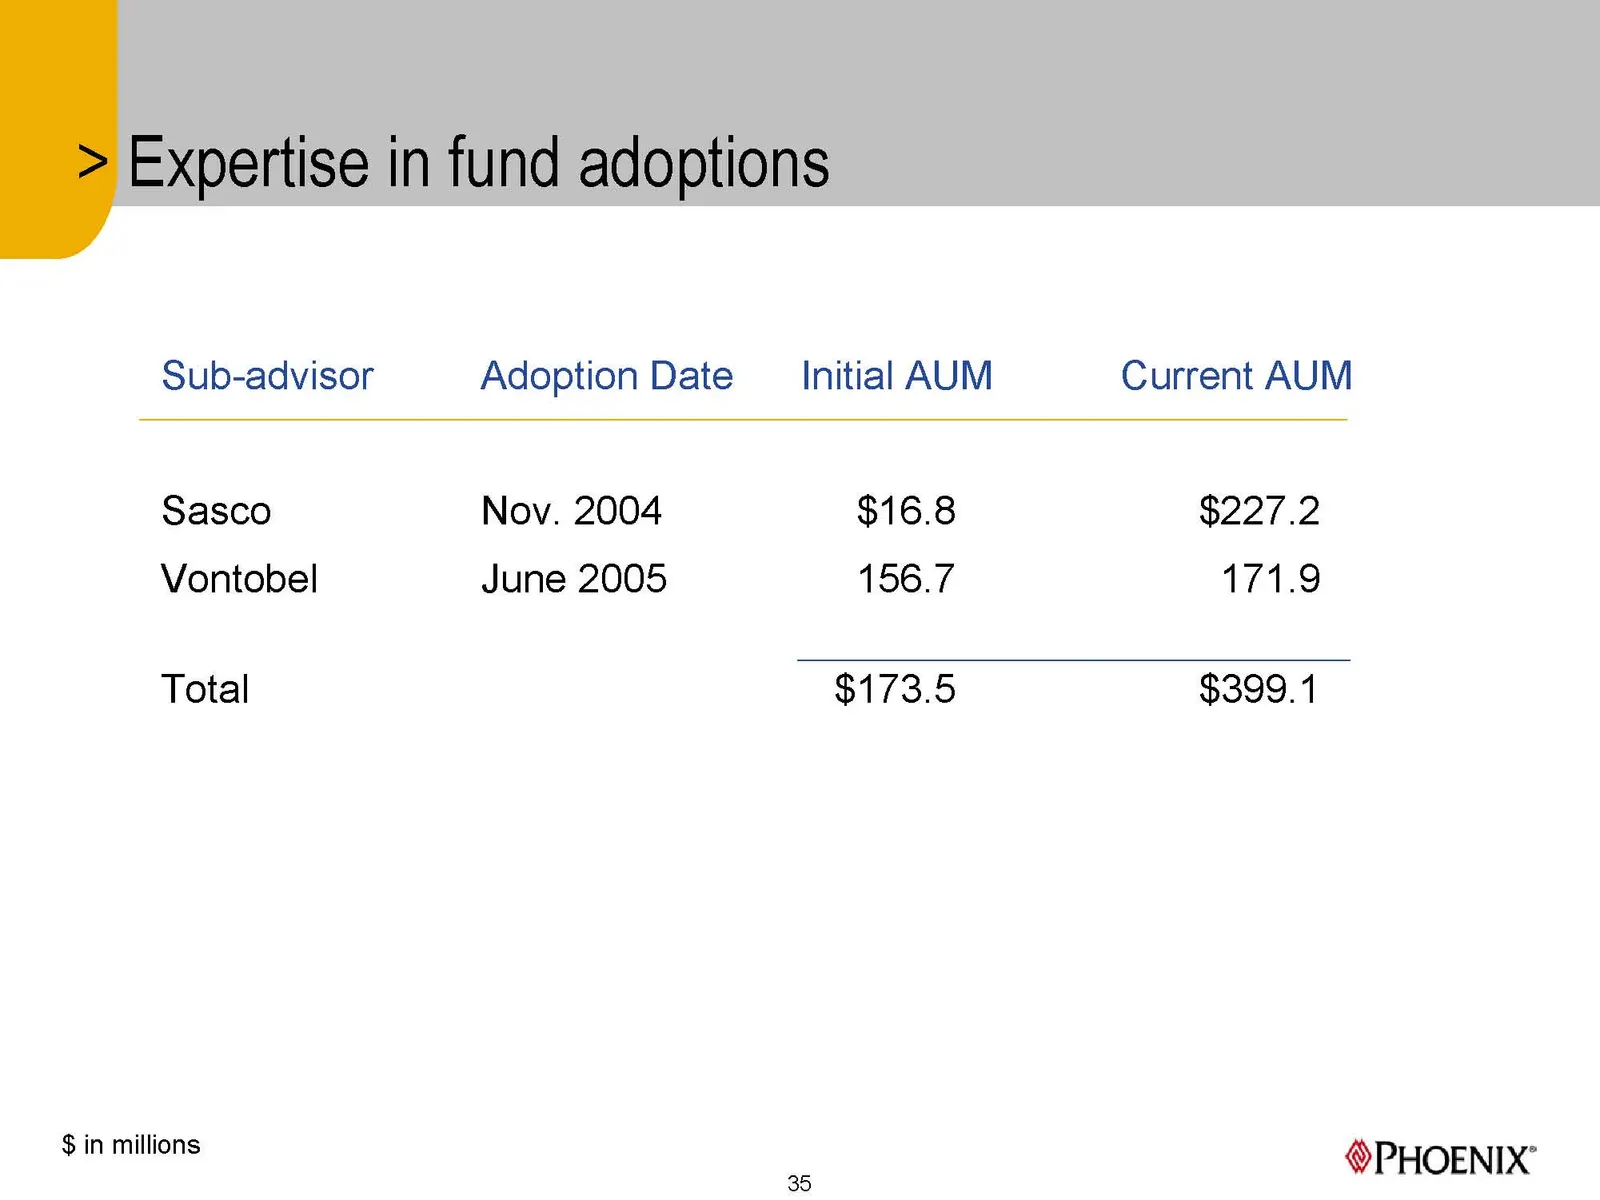
Sub-advisor Adoption Date Initial AUM Current AUM Sasco Nov. 2004 $16.8 $227.2 Vontobel June 2005 156.7 171.9 Total $173.5 $399.1 $ in millions PHOENIX’ 35
Slide 36: Revamped institutional product and strategy
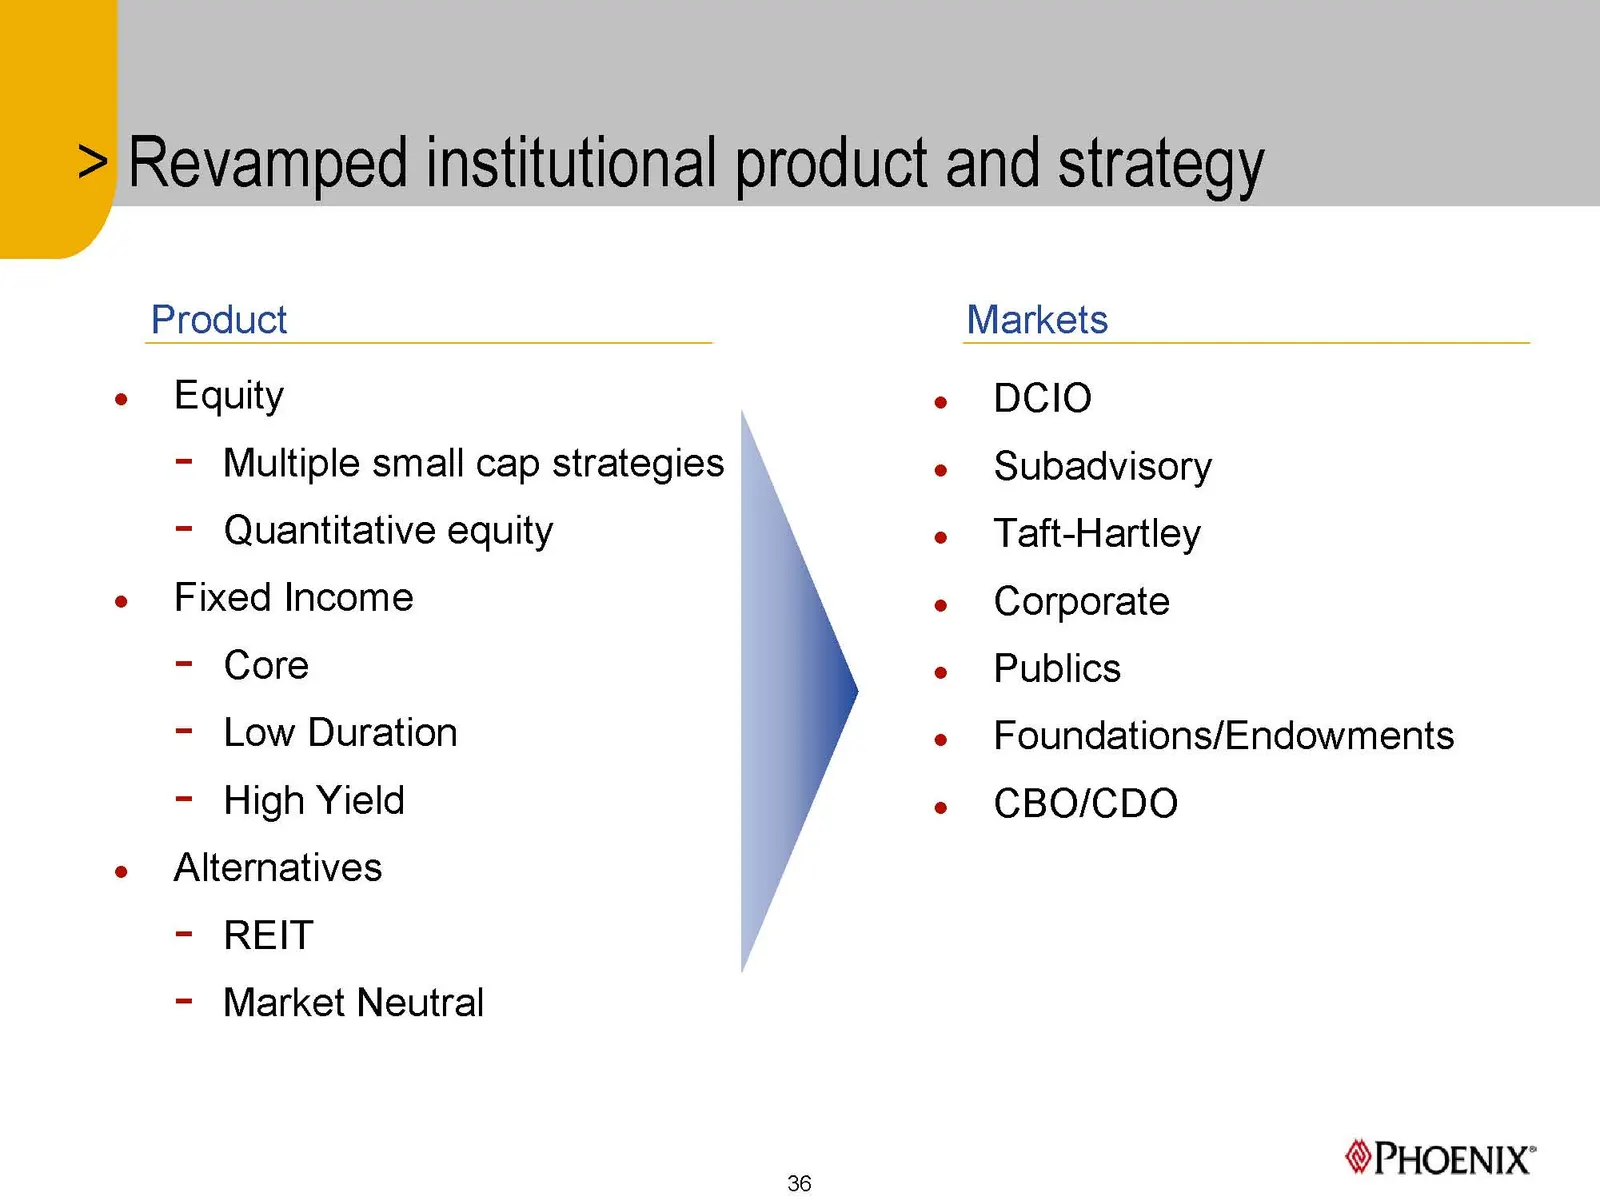
Revamped institutional product and strategy Product Markets e Equity e DCIO - Multiple small cap strategies e Subadvisory - Quantitative equity ' e Taft-Hartley e Fixed Income e Corporate - Core e Publics - Low Duration e Foundations/Endowments - High Yield e CBO/CDO e Alternatives - REIT - Market N
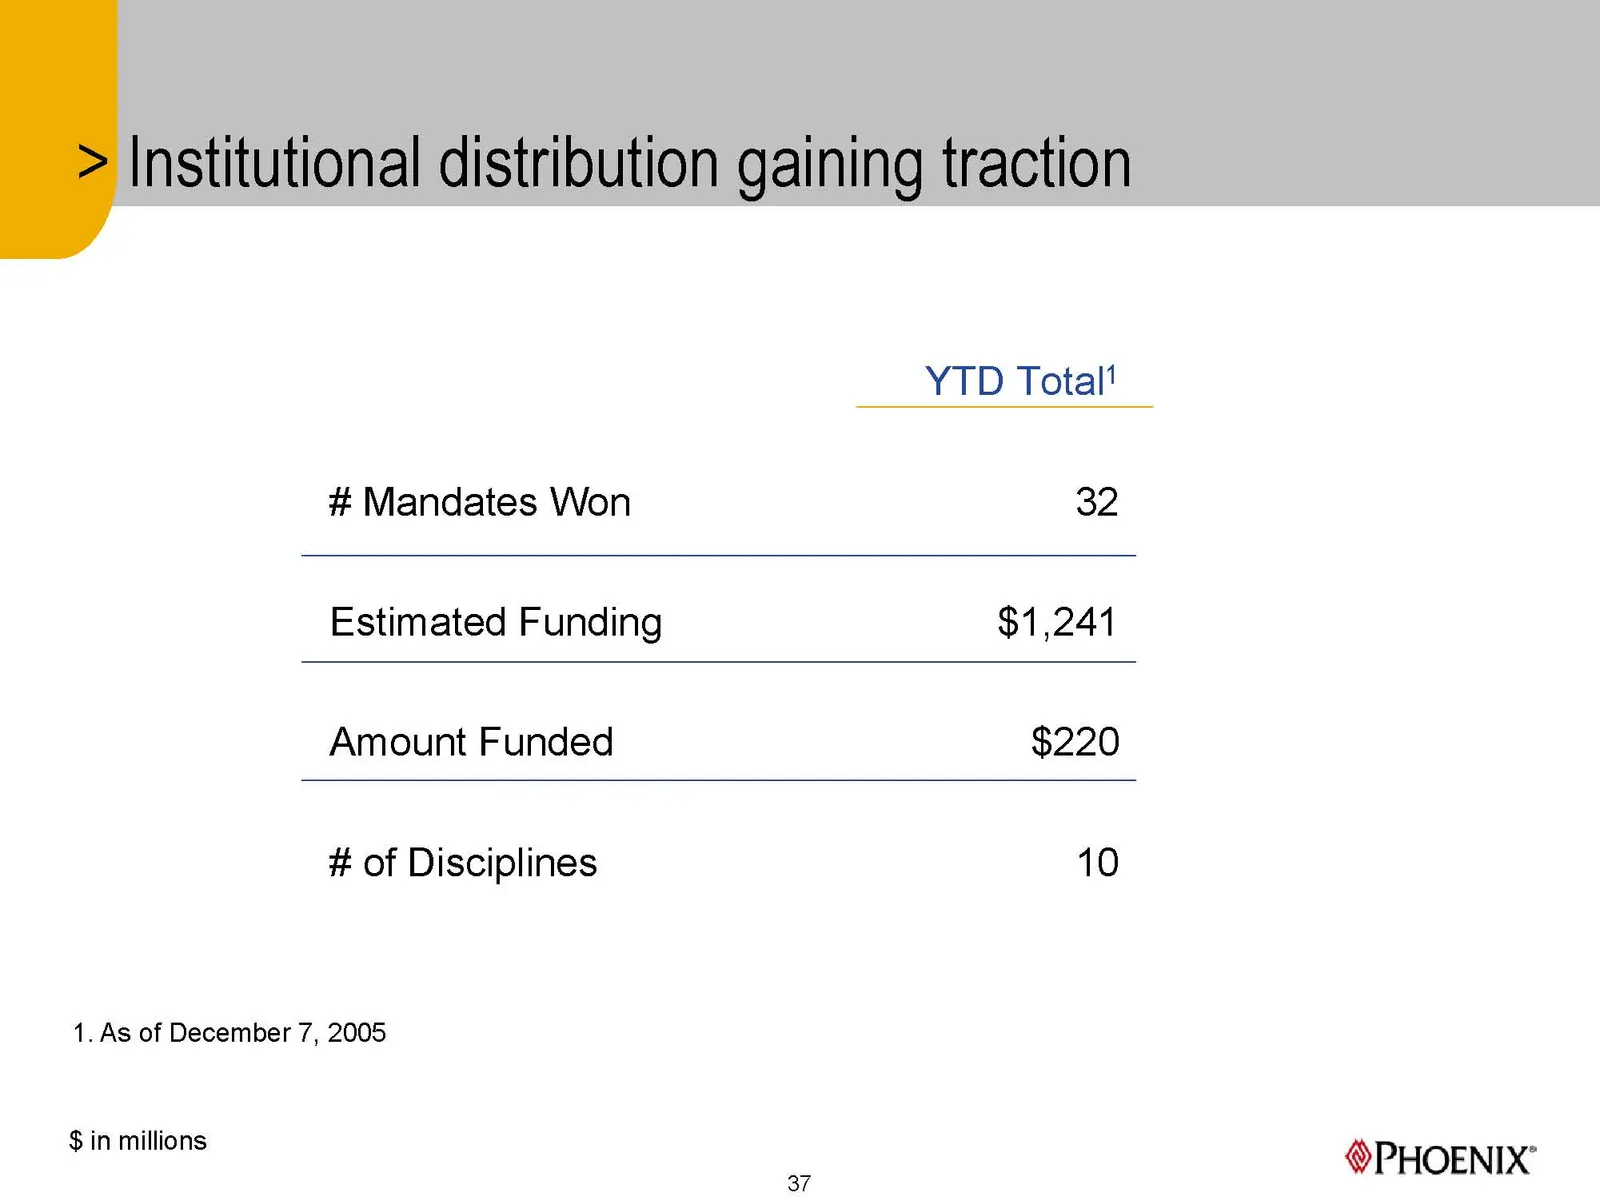
Slide 37: Institutional mandates YTD
YTD Totalt # Mandates Won 32 Estimated Funding $1,241 Amount Funded $220 # of Disciplines 10 1. As of December 7, 2005 $ in millions 37 PHOENIX’
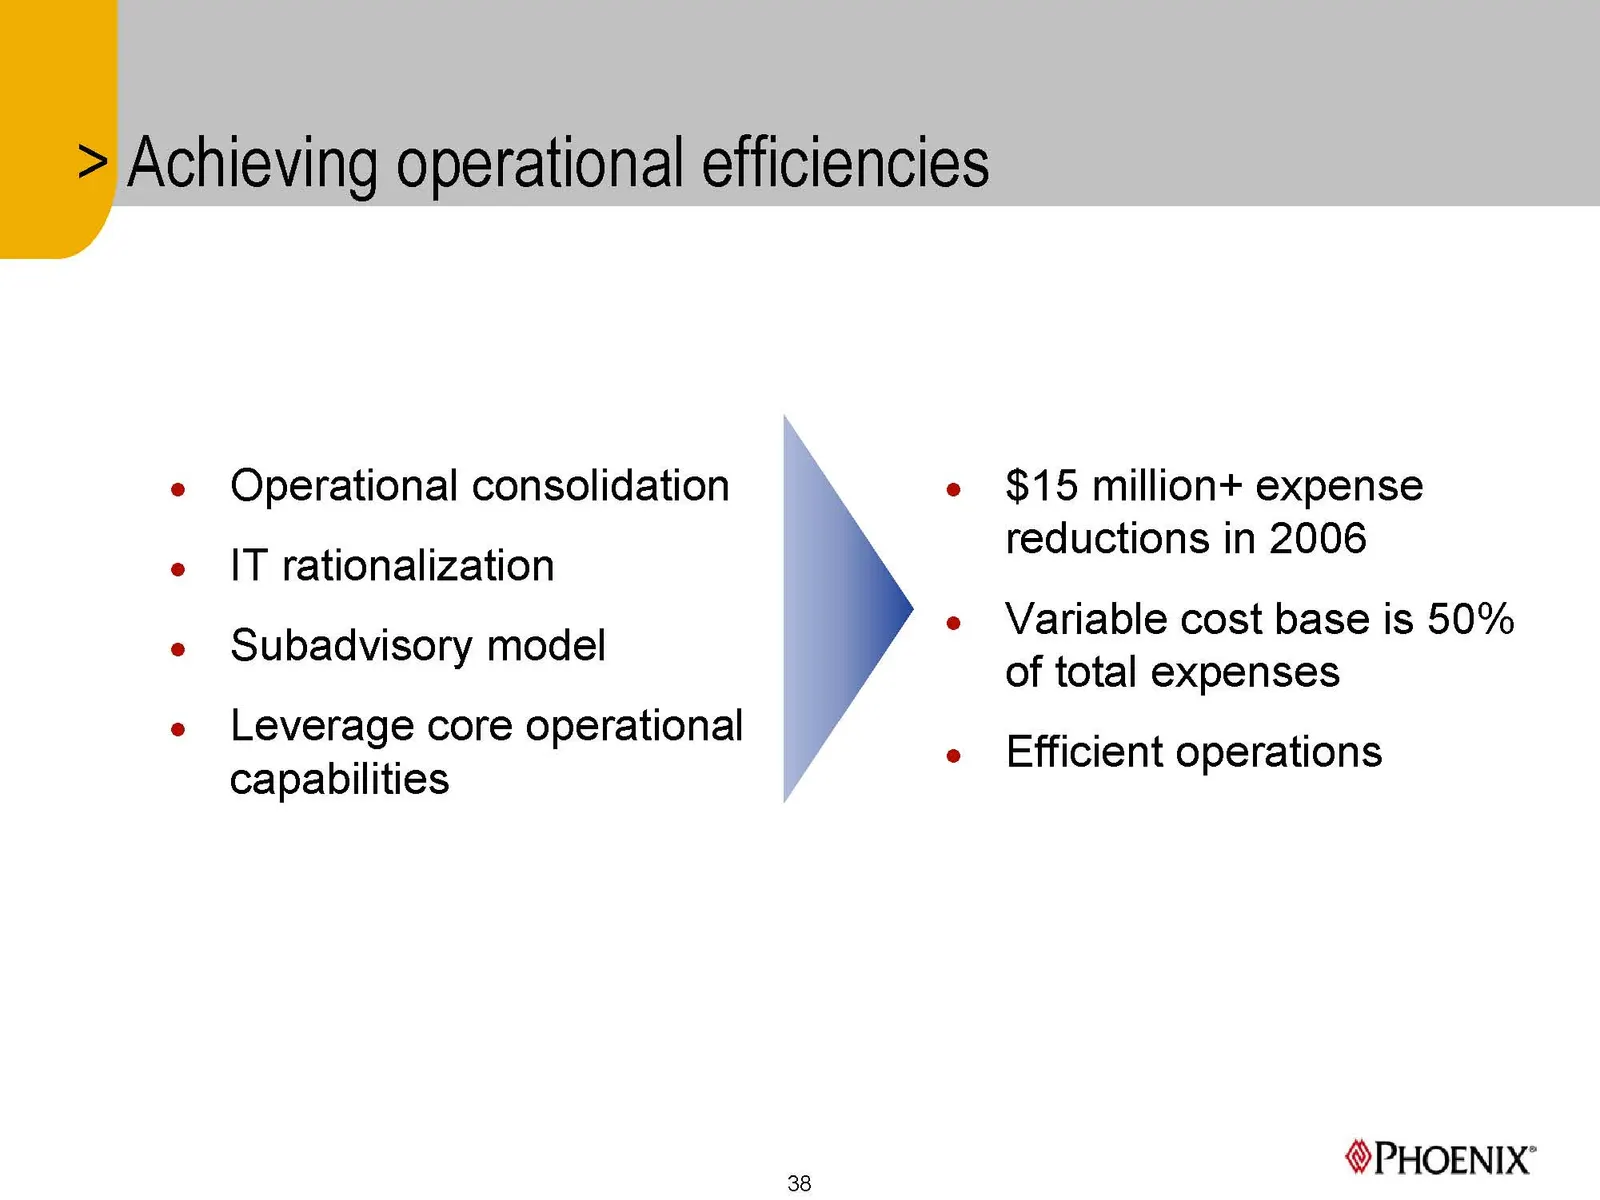
Slide 38: Achieving operational efficiencies
Achieving operational efficiencies e Operational consolidation e $15 million+ expense ¢ IT rationalization Balen 10 ee . e Variable cost base is 50% e Subadvisory model of total expenses e Leverage core operational capabilities e Efficient operations PHOENIX’ 38
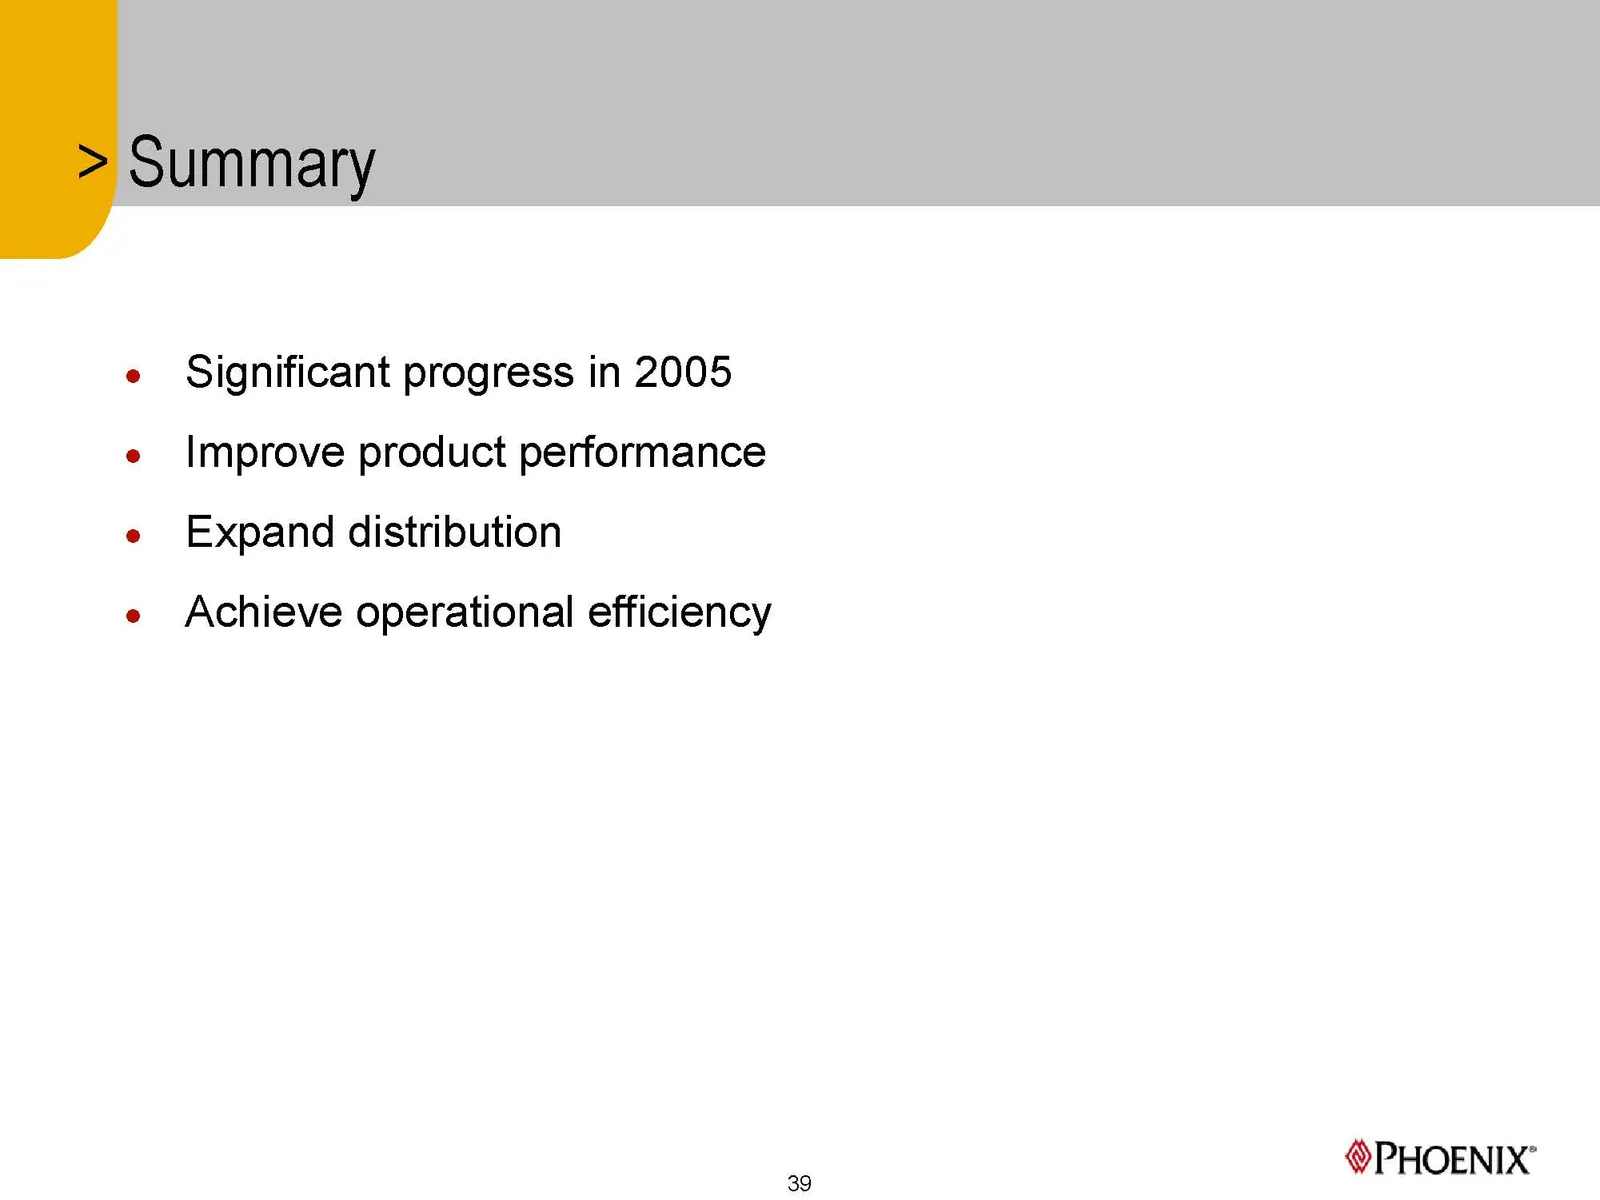
Slide 39: Significant progress in 2005
Significant progress in 2005 Improve product performance Expand distribution Achieve operational efficiency 39 PHOENIX’
Slide 40: Life & Annuity
The Phoenix Companies, Inc. Life & Annuity Phil Polkinghorn Executive Vice President December 13, 2005 New York City PHOENIX"
Slide 41: Pure product manufacturer
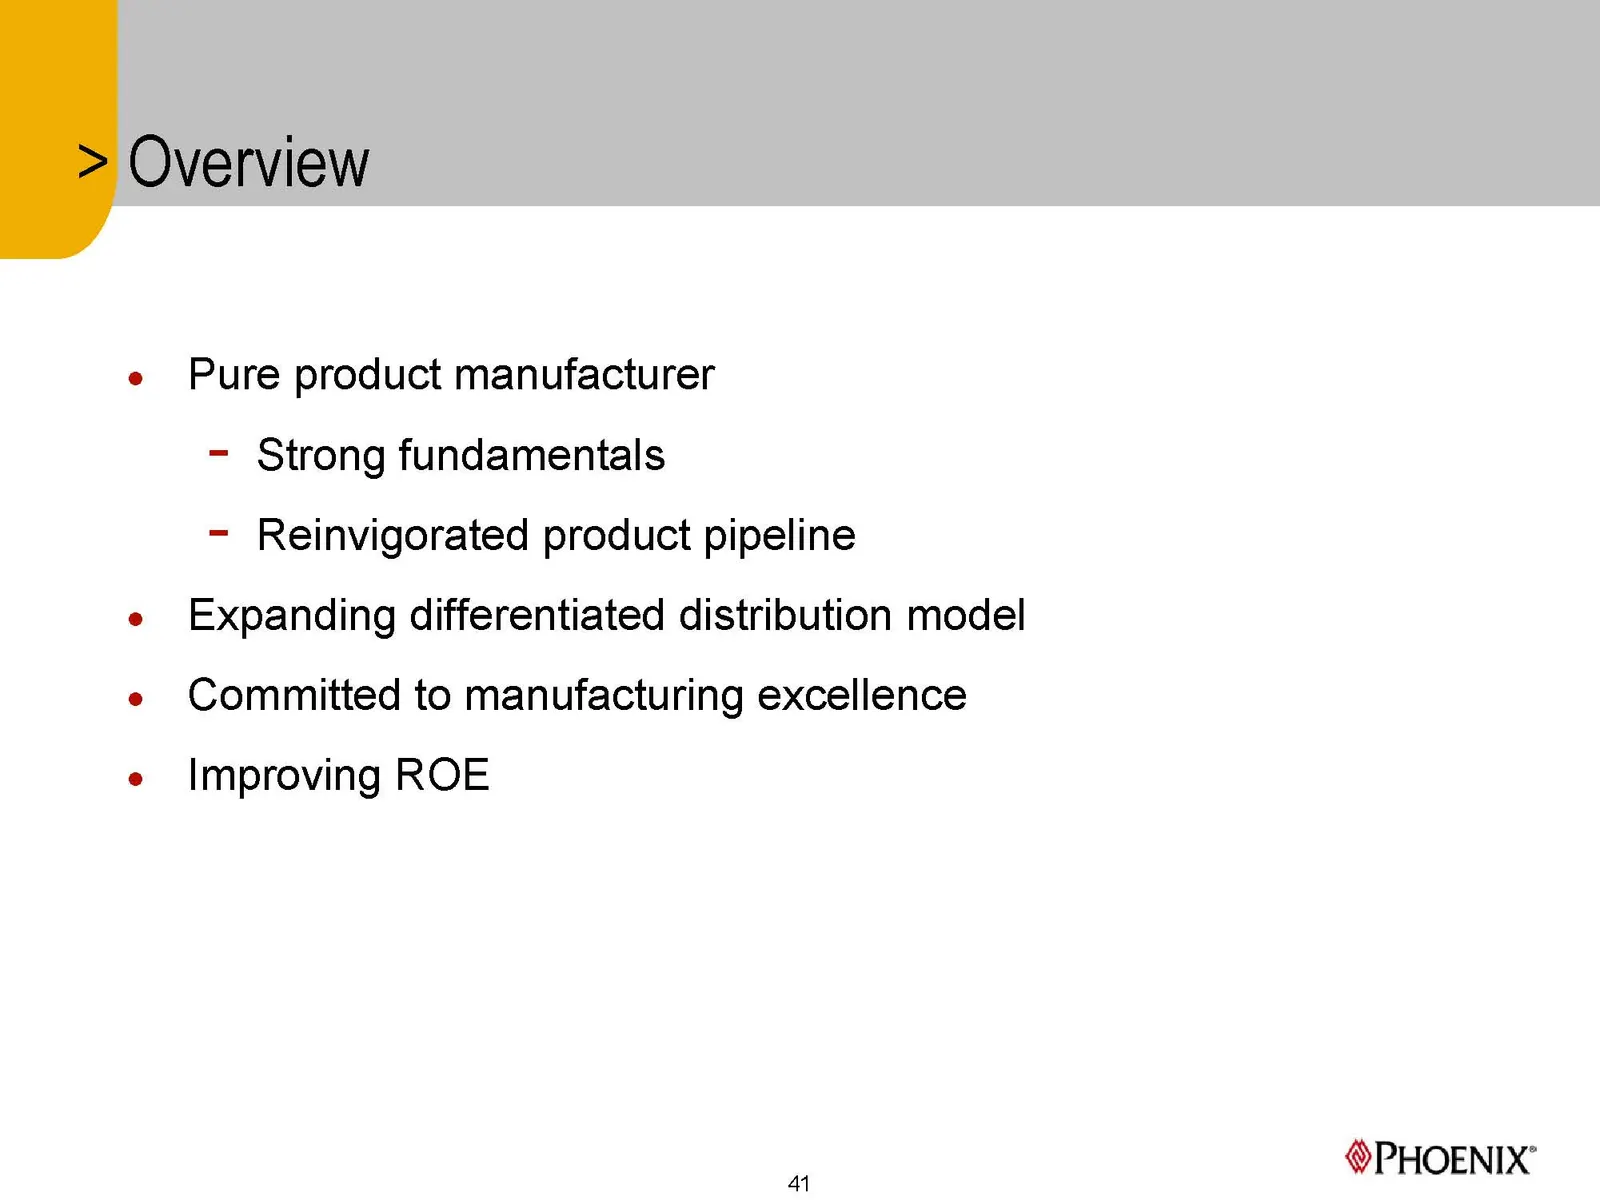
e Pure product manufacturer - Strong fundamentals - Reinvigorated product pipeline e Expanding differentiated distribution model e Committed to manufacturing excellence e Improving ROE PHOENIX’ 4
Slide 42: We have a strong life franchise
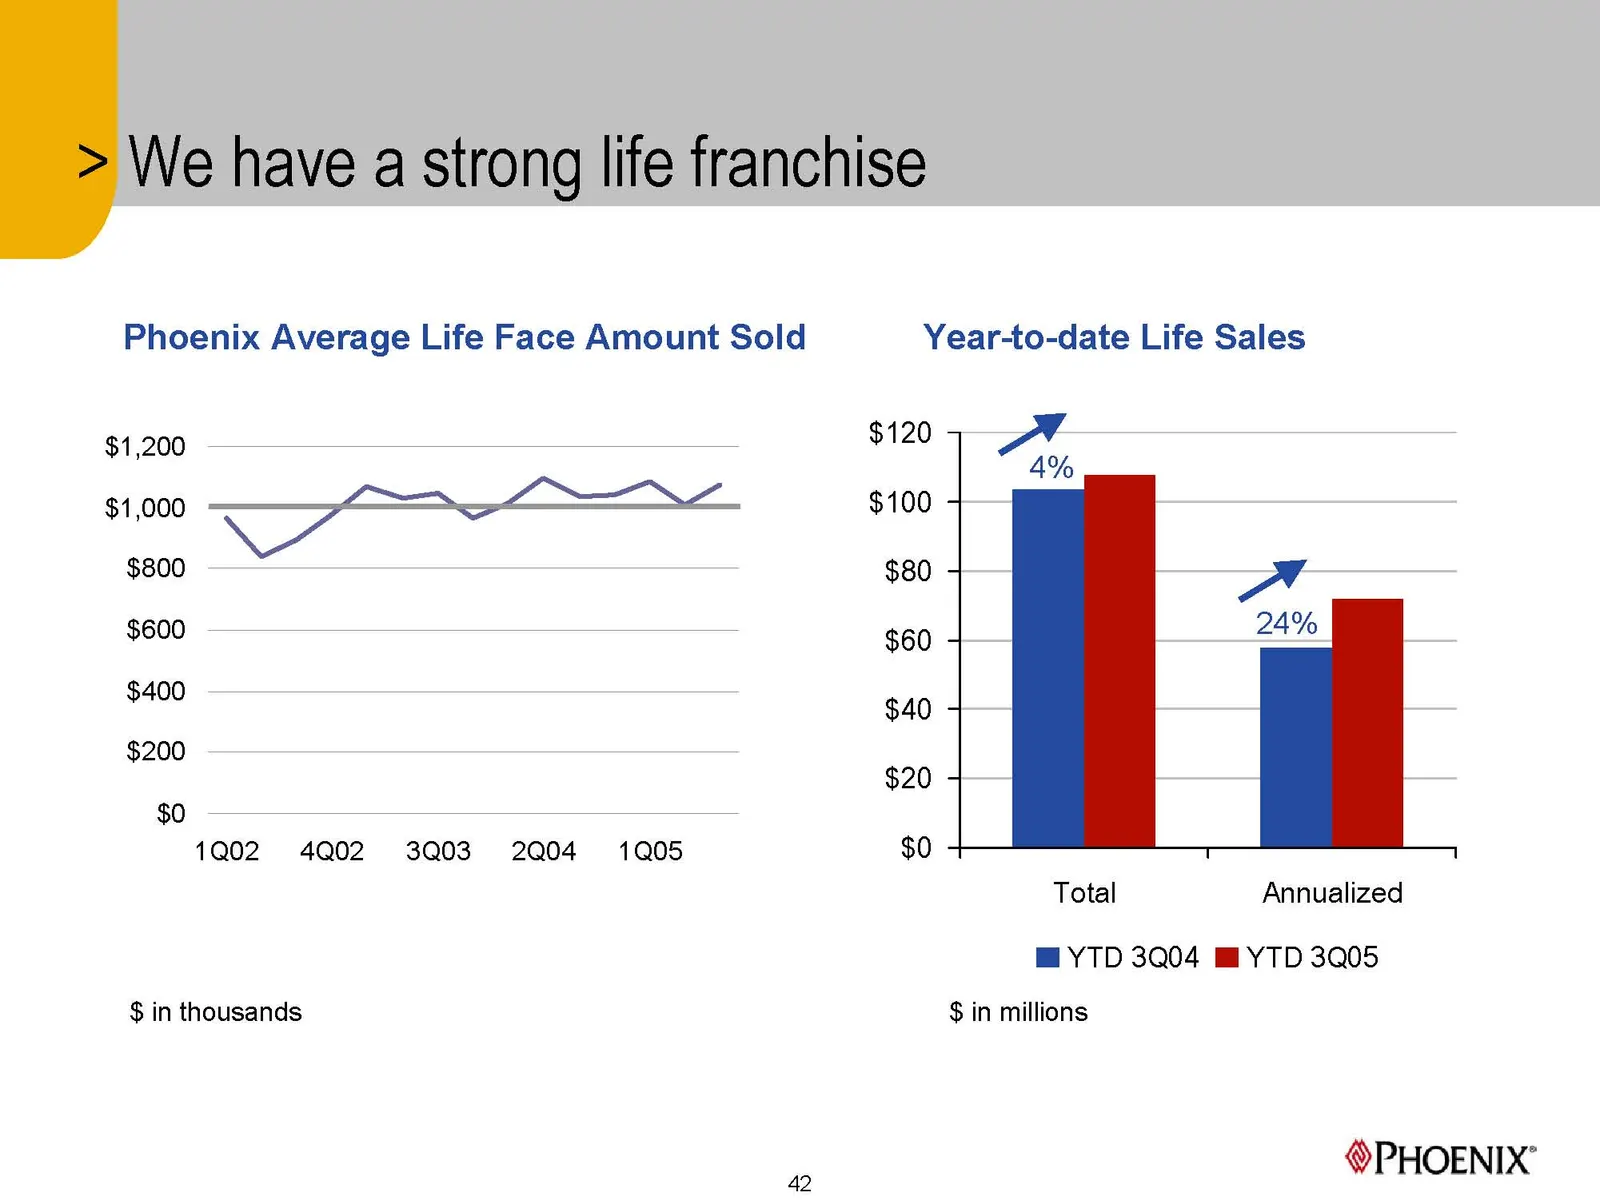
We have a strong life franchise Phoenix Average Life Face Amount Sold Year-to-date Life Sales $1,200 $120 5 $1,000 i = $100 4 $800 $80 4 pene $60 + —_ $40 4 $200 $20 + $0 1Q02 4Q02 3Q03 2Q04 1Q05 $0 4 Total Annualized YTD 3004 YTD 3Q05 $ in thousands $ in millions PHOENIX’ 42
Slide 43: Strong life fundamentals
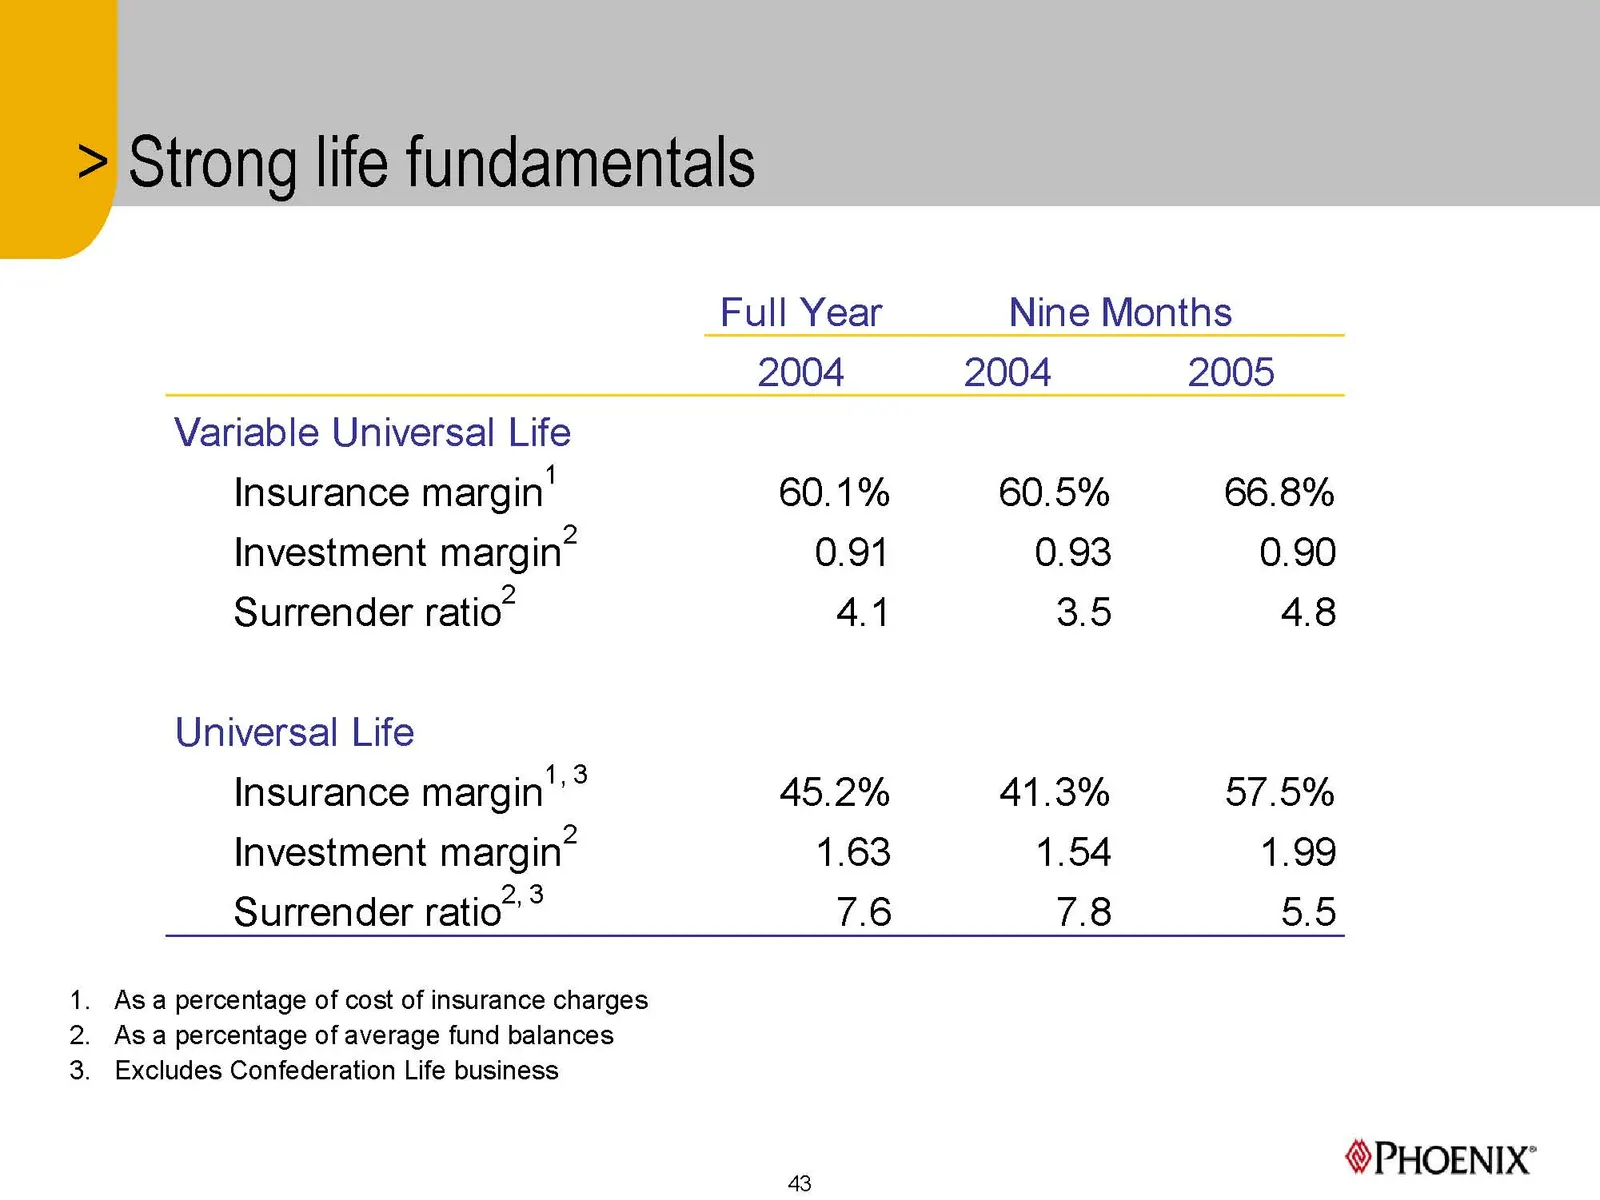
Strong life fundamentals Full Year Nine Months 2004 2004 2005 Variable Universal Life Insurance margin’ 60.1% 60.5% 66.8% Investment margin” 0.91 0.93 0.90 Surrender ratio” 4.1 3.5 48 Universal Life Insurance margin'’® 45.2% 41.3% 57.5% Investment margin” 1.63 1.54 1.99 Surrender ratio” * 7.6 7.8 5.
Slide 44: Annuity fundamentals
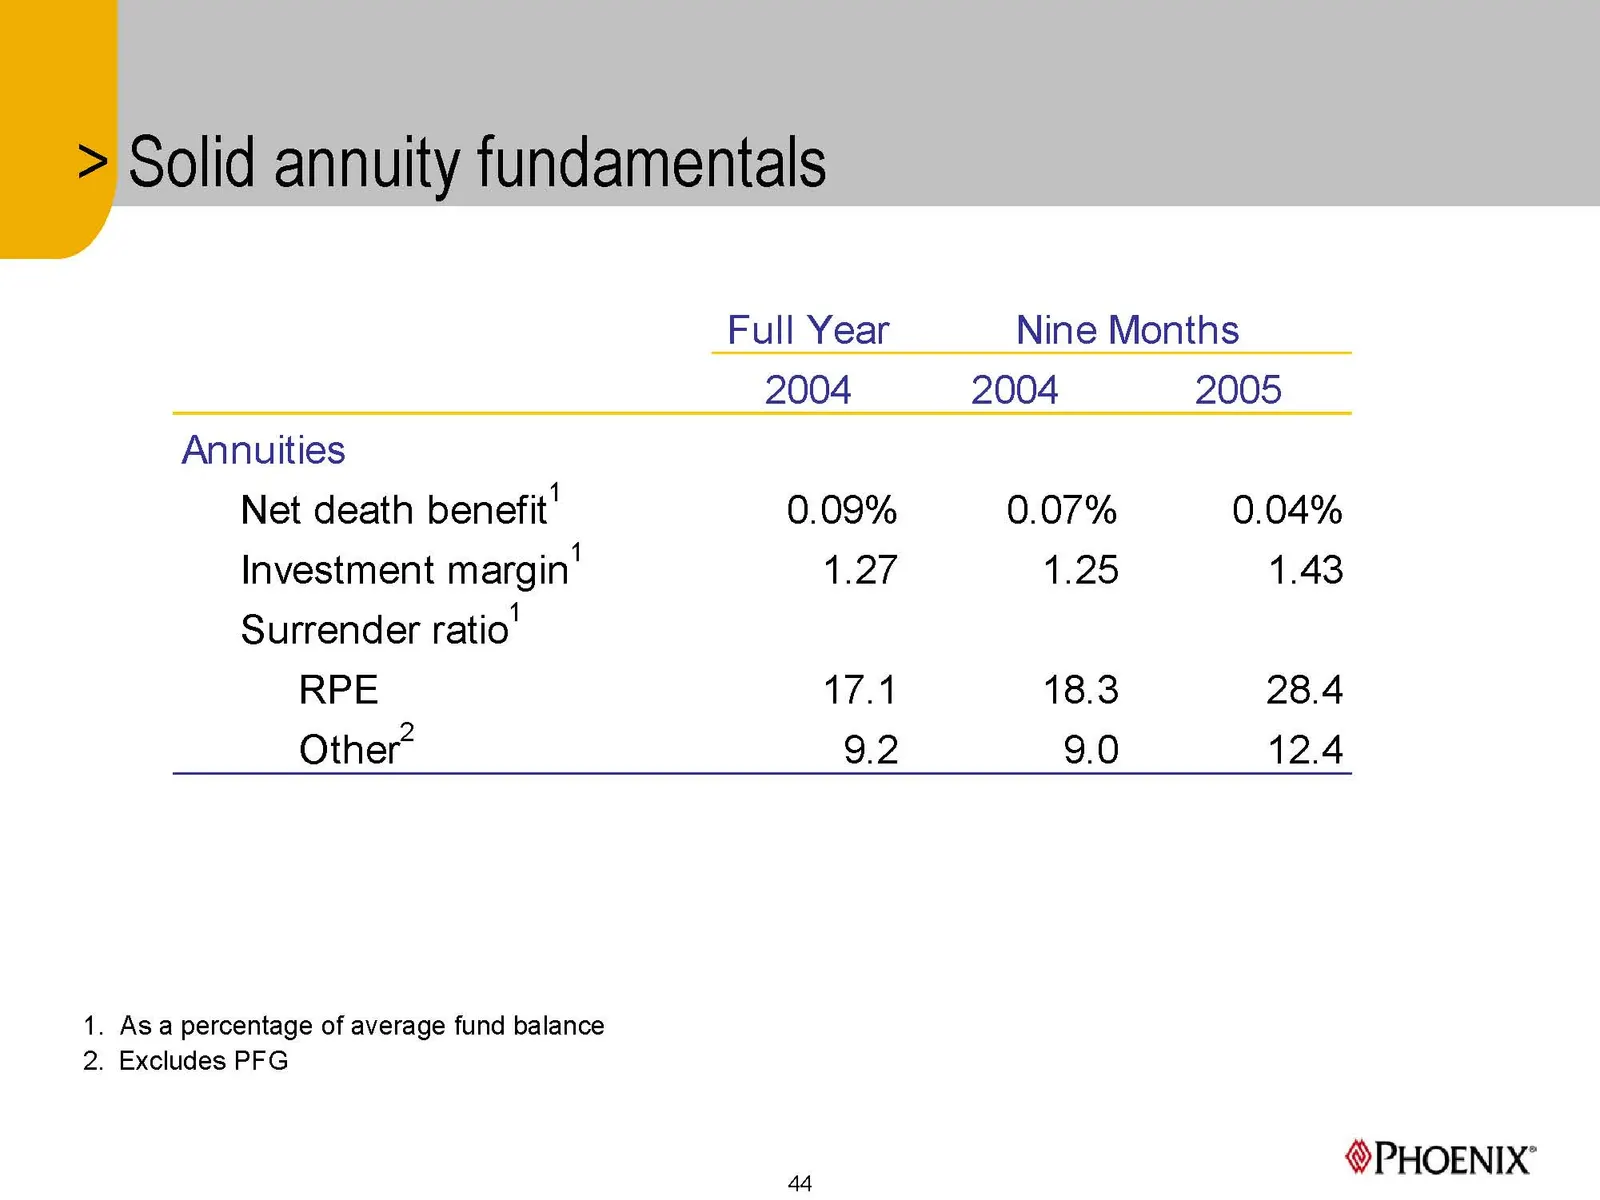
Full Year Nine Months 2004 2004 2005 Annuities Net death benefit’ 0.09% 0.07% 0.04% Investment margin’ 1.27 1.25 1.43 Surrender ratio’ RPE 17.1 18.3 28.4 Other* 9.2 9.0 12.4 1. Asa percentage of average fund balance 2. Excludes PFG PHOENIX’
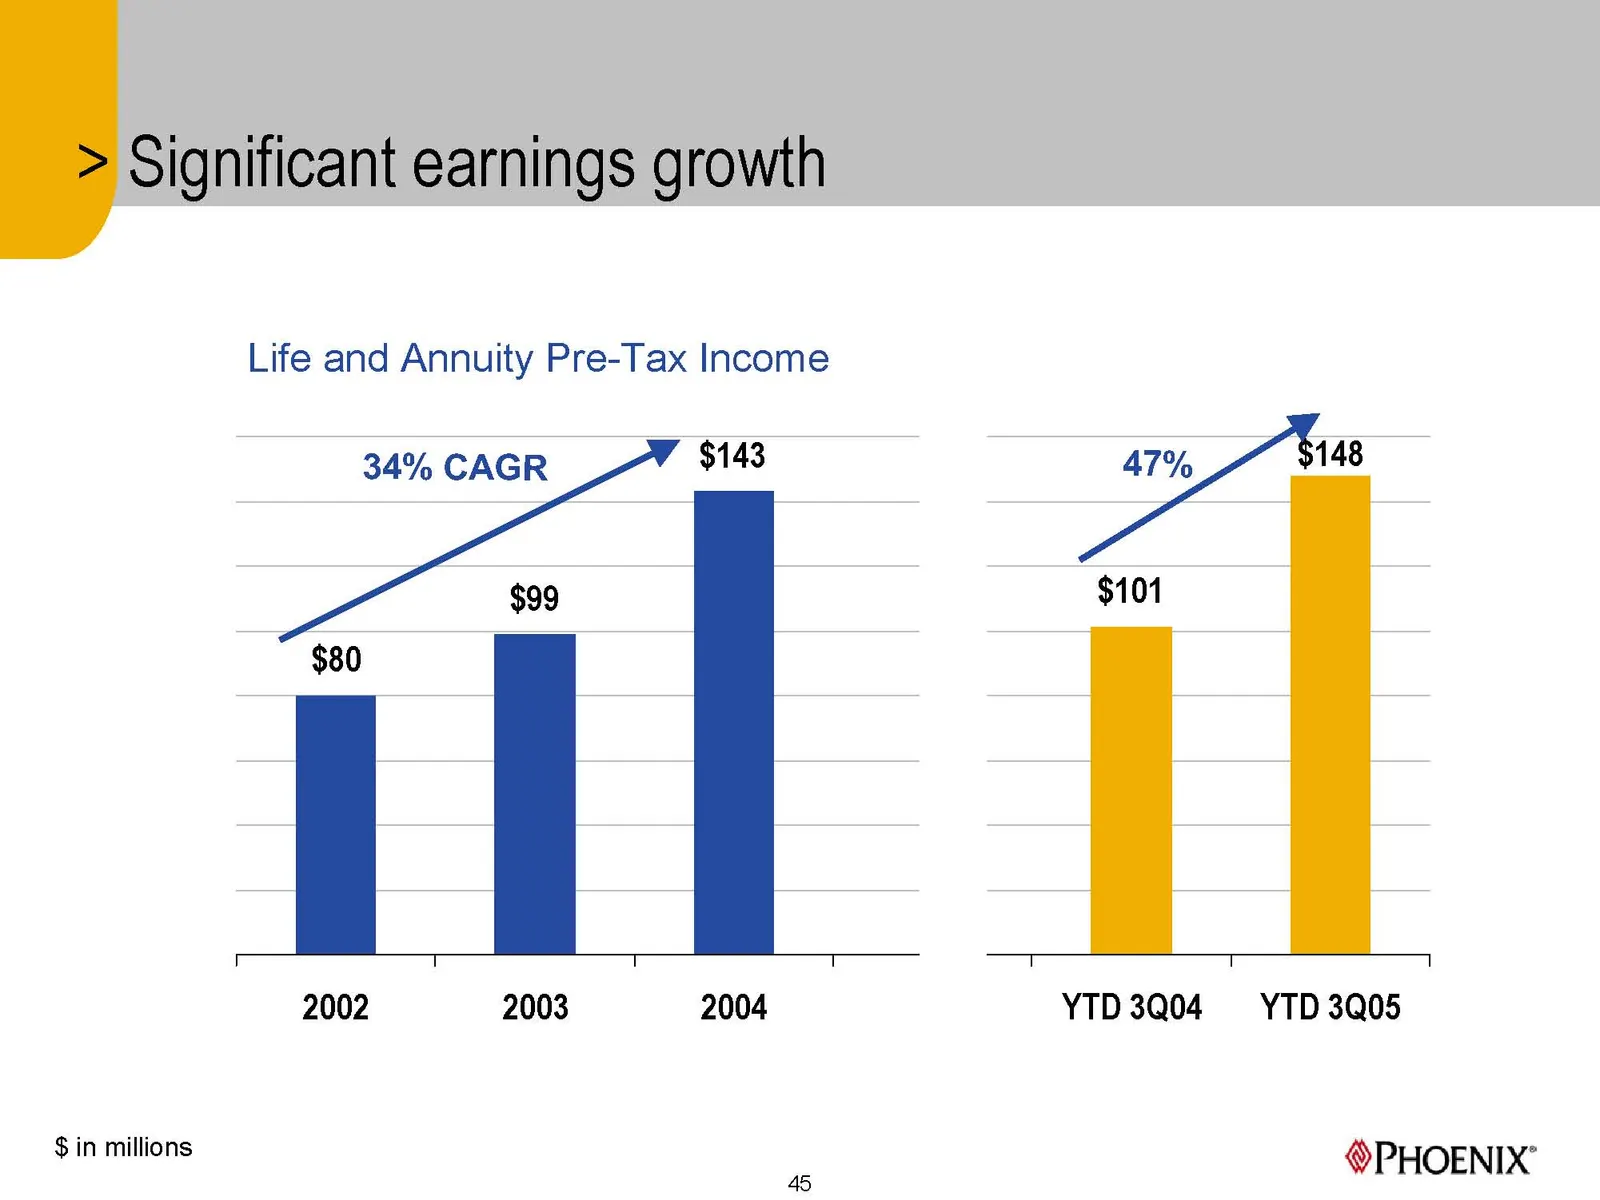
Slide 45: Significant earnings growth
Significant earnings growth Life and Annuity Pre-Tax Income 34% CAGR $143 oa $99 $101 $80 , 2002 2003 2004 YTD 3Q04 §=YTD 3Q05 $ in millions ®PHOENIX’
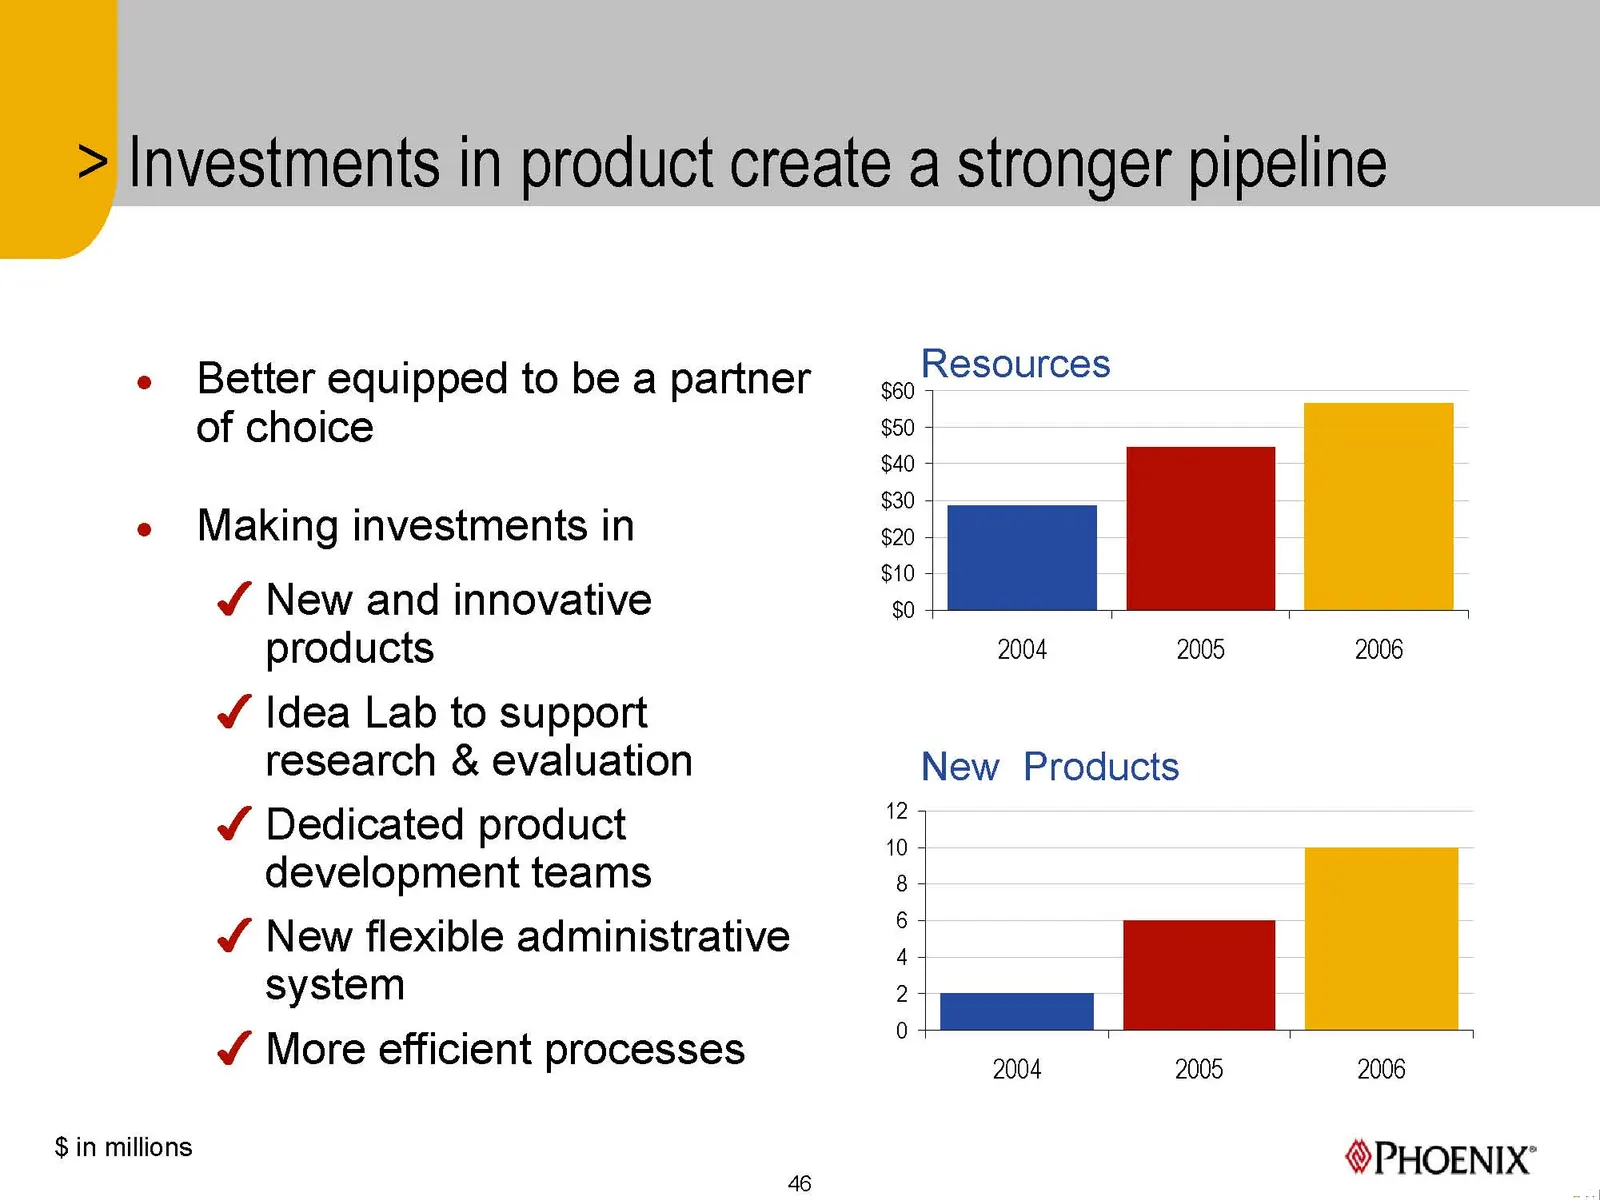
Slide 46: Investments in product create a stronger pipeline
$ in millions Better equipped to be a partner of choice Making investments in v¥ New and innovative products v¥ Idea Lab to support research & evaluation v¥ Dedicated product development teams v¥ New flexible administrative system Vv More efficient processes Investments in product create a stronger
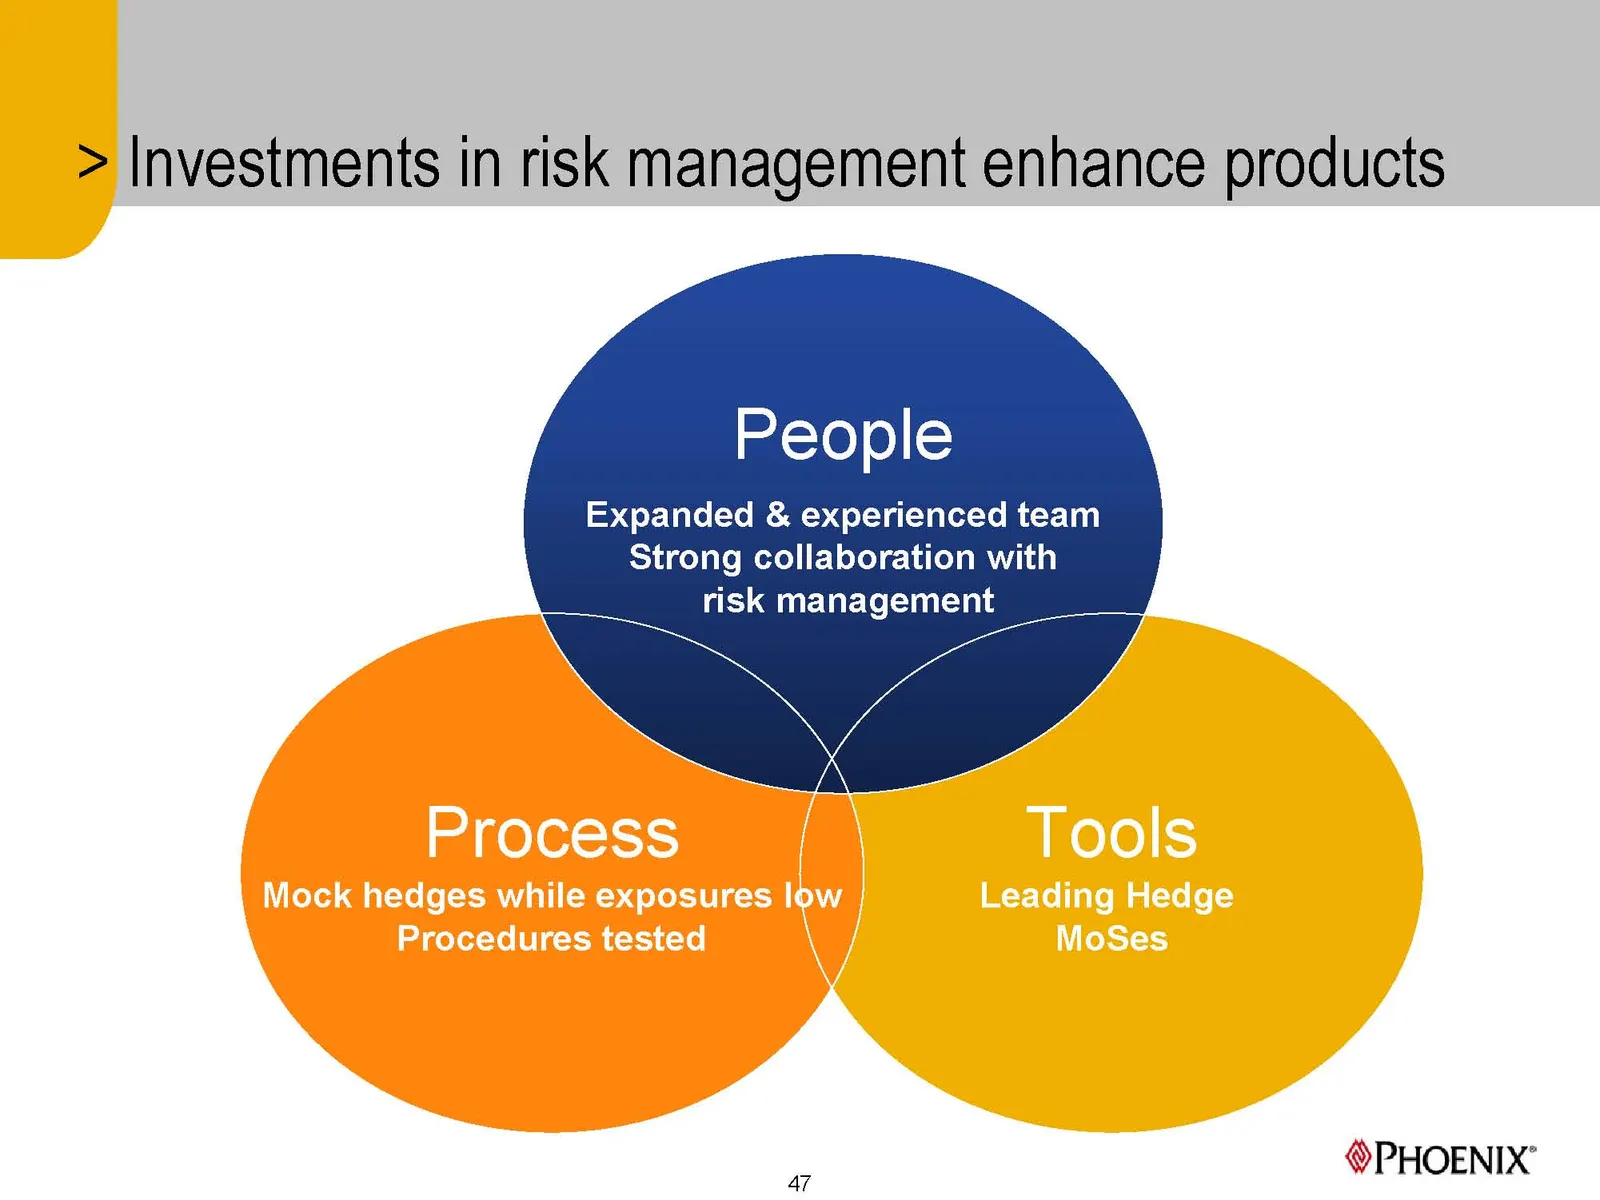
Slide 47: Investments in risk management enhance products
> Investments in risk management enhance products People Expanded & experienced team Strong collaboration with risk management PHOENIX’ 47
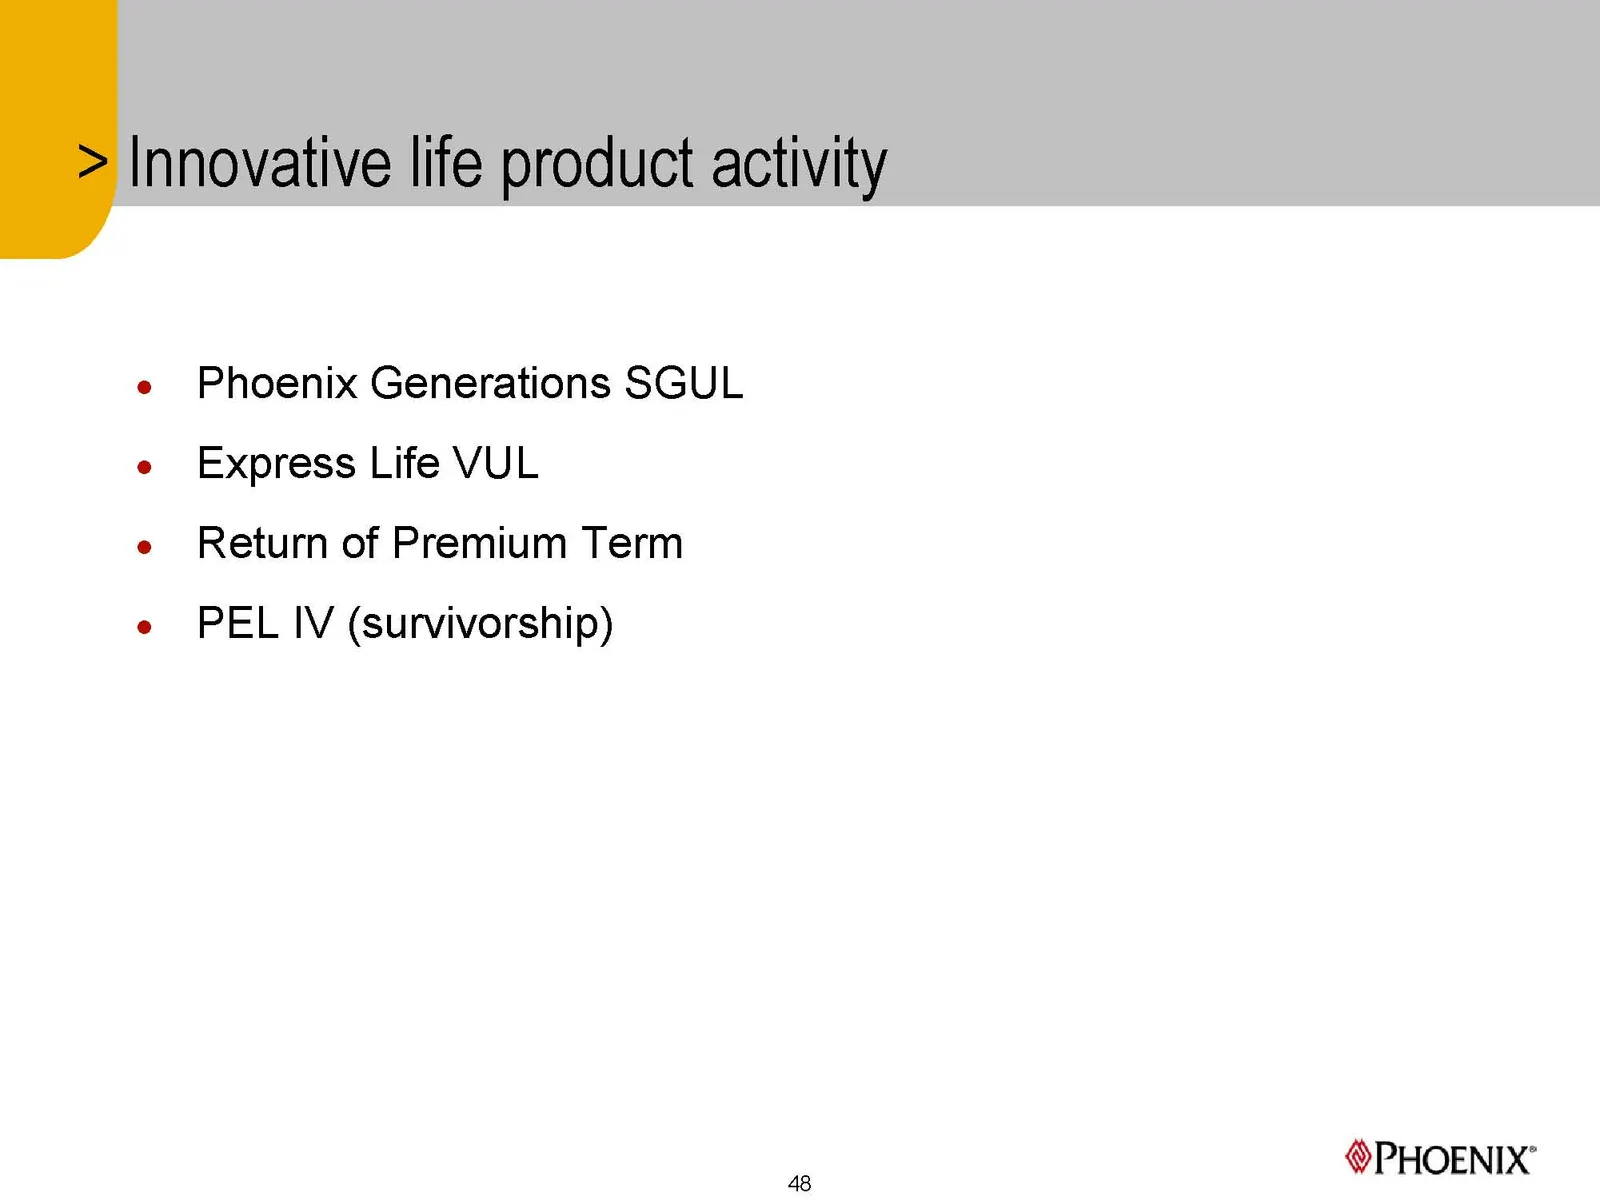
Slide 48: Life products
Phoenix Generations SGUL Express Life VUL Return of Premium Term PEL IV (survivorship) PHOENIX’
Slide 49: Recent competitive SGUL introduction
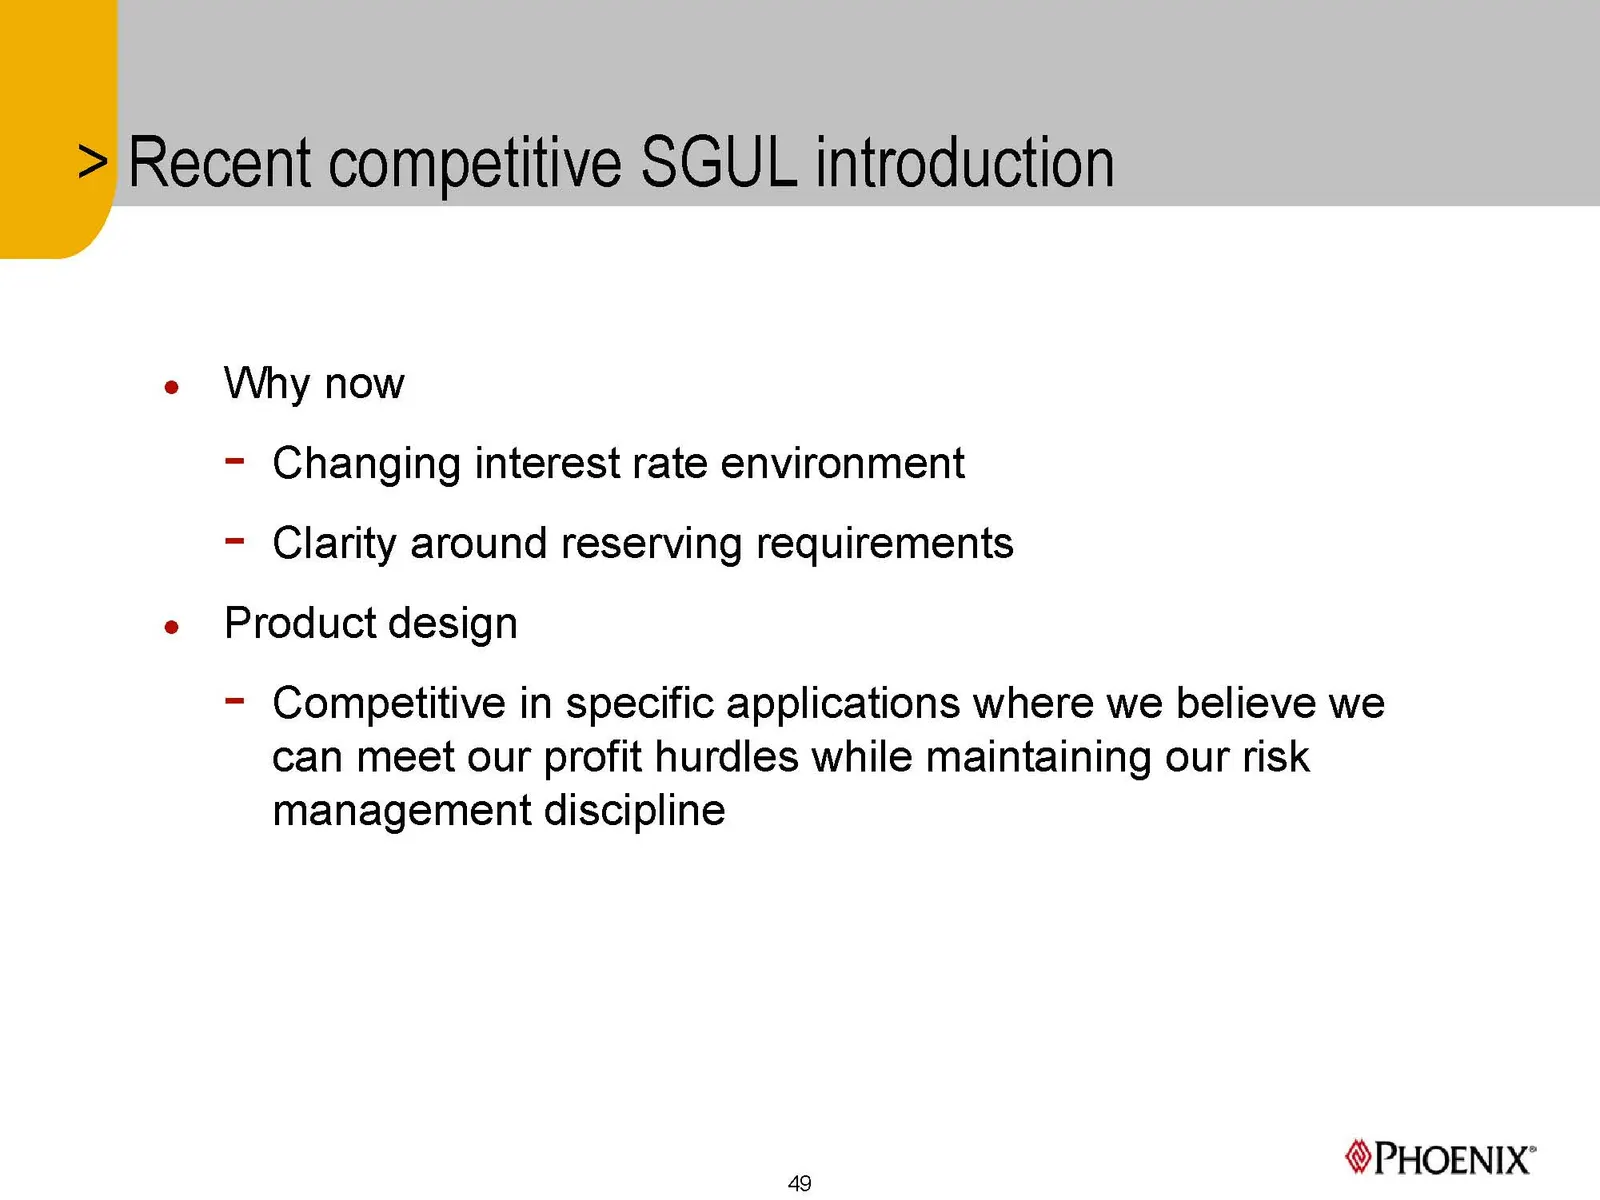
Recent competitive SGUL introduction e Why now - Changing interest rate environment - Clarity around reserving requirements e Product design - Competitive in specific applications where we believe we can meet our profit hurdles while maintaining our risk management discipline PHOENIX’ 49
Slide 50: Competitive in specific scenarios
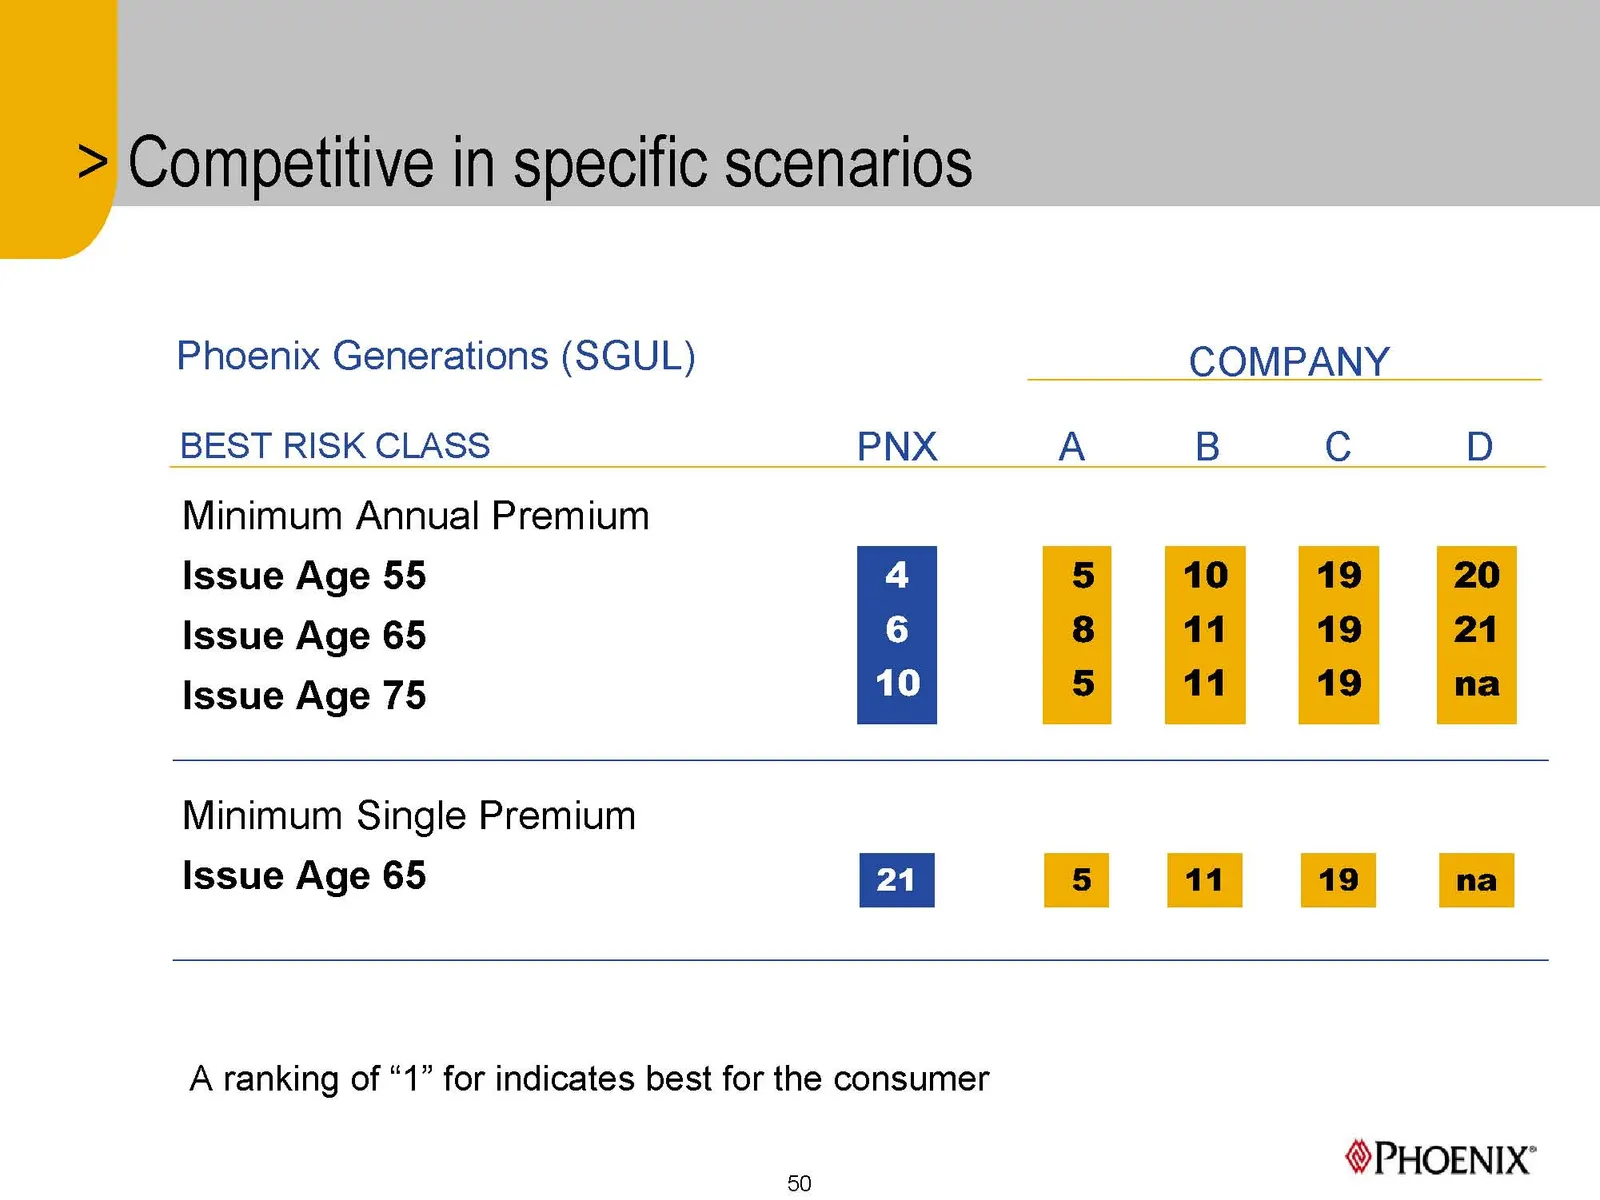
Competitive in specific scenarios Phoenix Generations (SGUL) COMPANY BEST RISK CLASS PNX A B Cc D Minimum Annual Premium Issue Age 55 Issue Age 65 Issue Age 75 Minimum Single Premium Issue Age 65 Hoe we A ranking of “1” for indicates best for the consumer - PHOENIX’
Slide 51: Annuity products
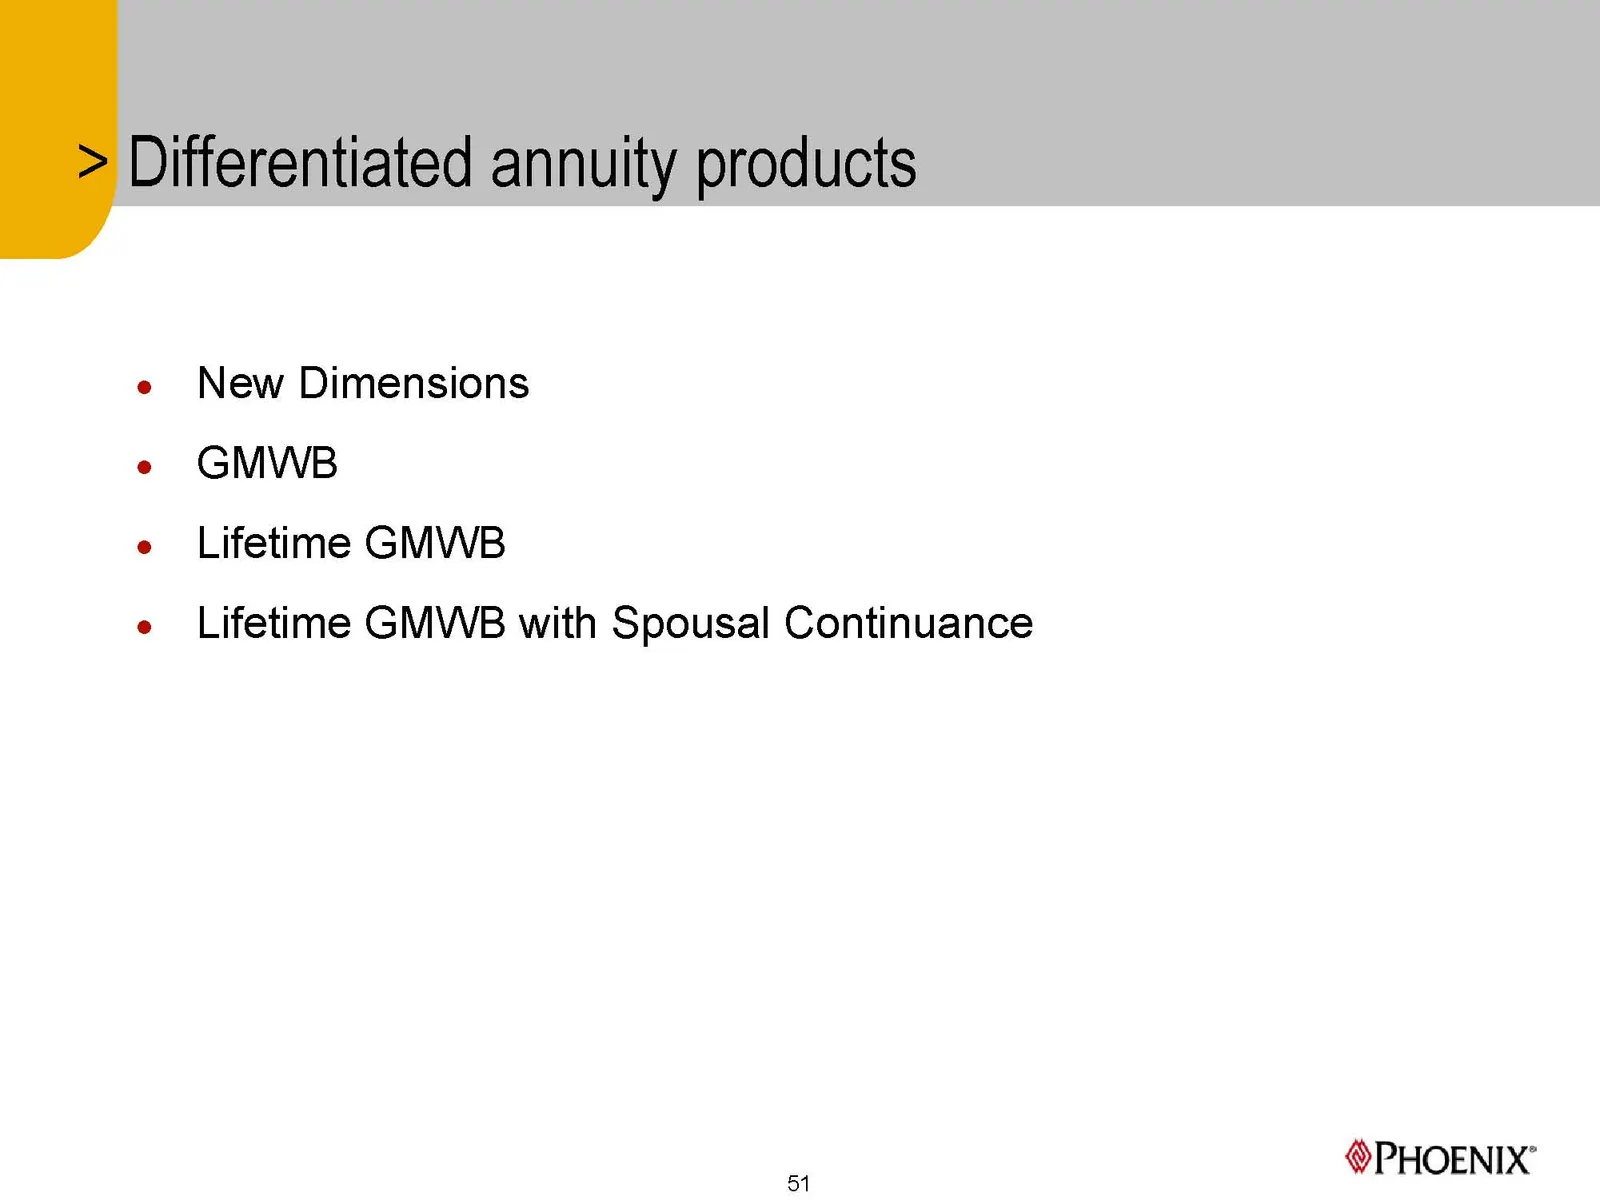
e New Dimensions e GMWB e Lifetime GMWB e Lifetime GMWB with Spousal Continuance PHOENIX’ 51
Slide 52: Innovative GMWB with spousal continuance
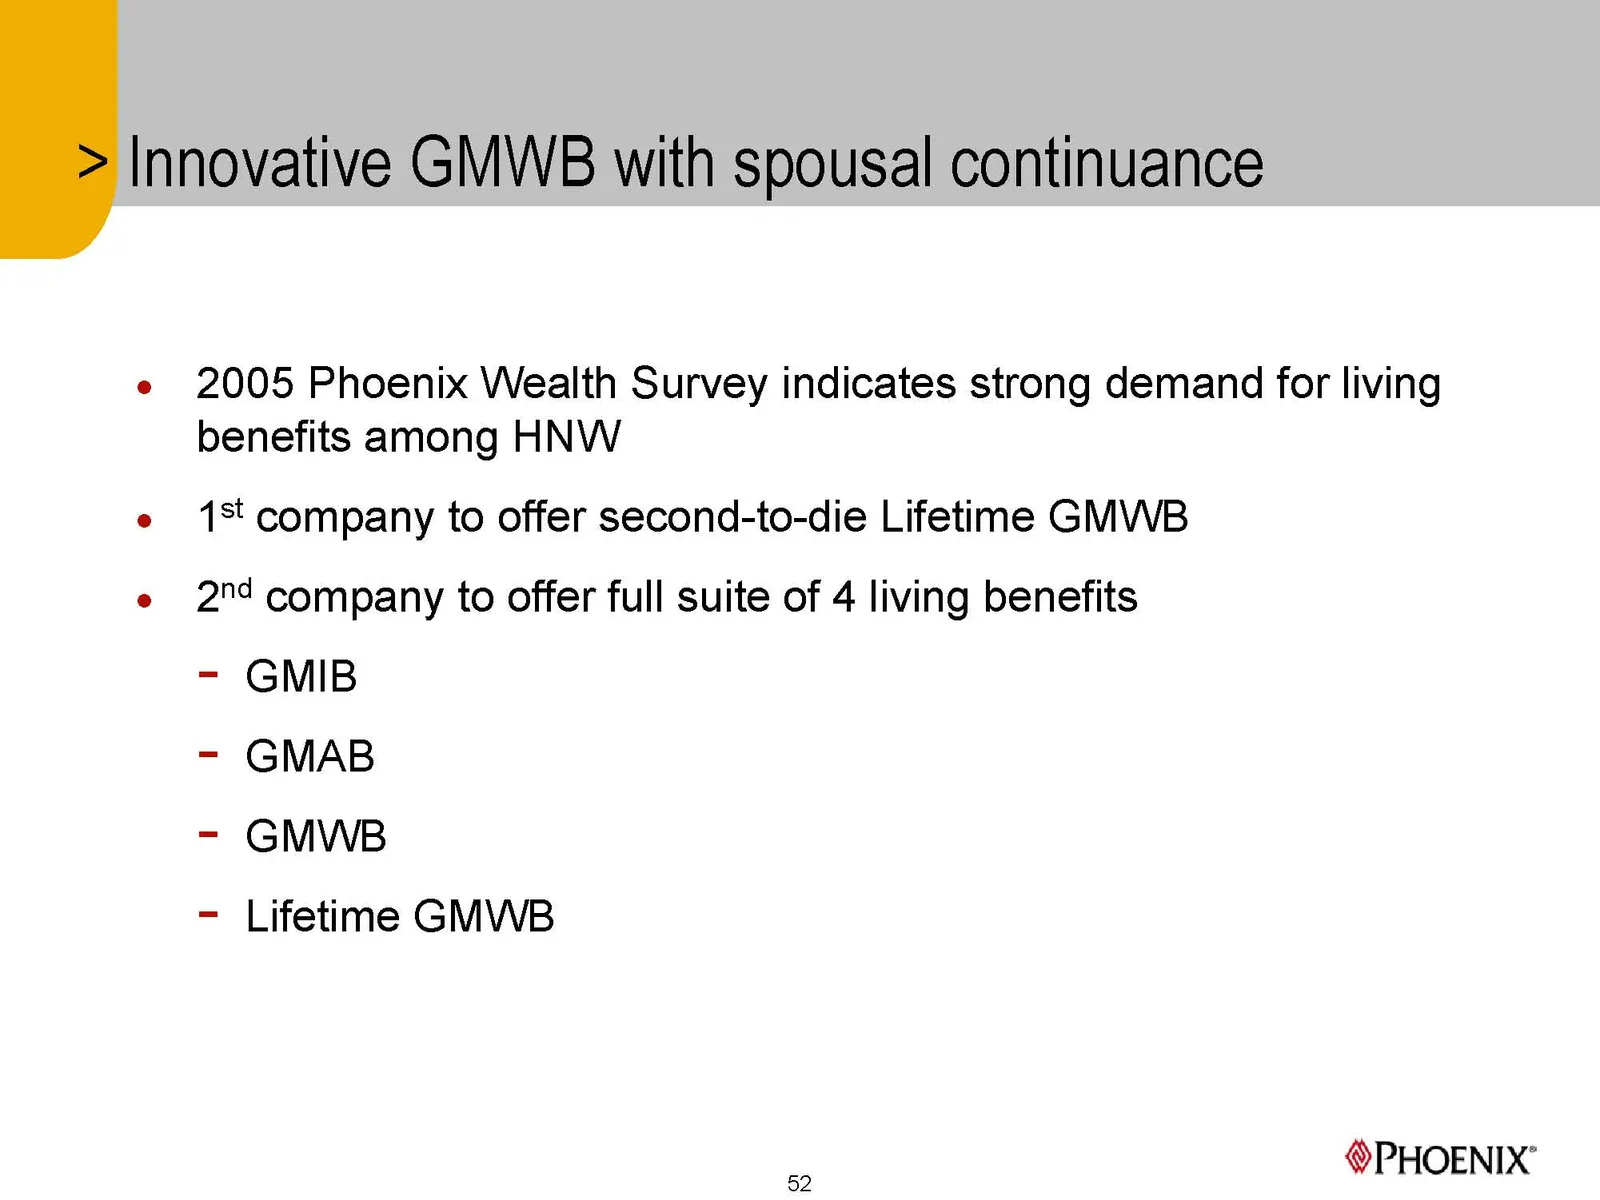
Innovative GMWB with spousal continuance e 2005 Phoenix Wealth Survey indicates strong demand for living benefits among HNW e 1s company to offer second-to-die Lifetine GMWB e 24 company to offer full suite of 4 living benefits - GMIB - GMAB - GMWB - Lifetime GMWB PHOENIX’ 52
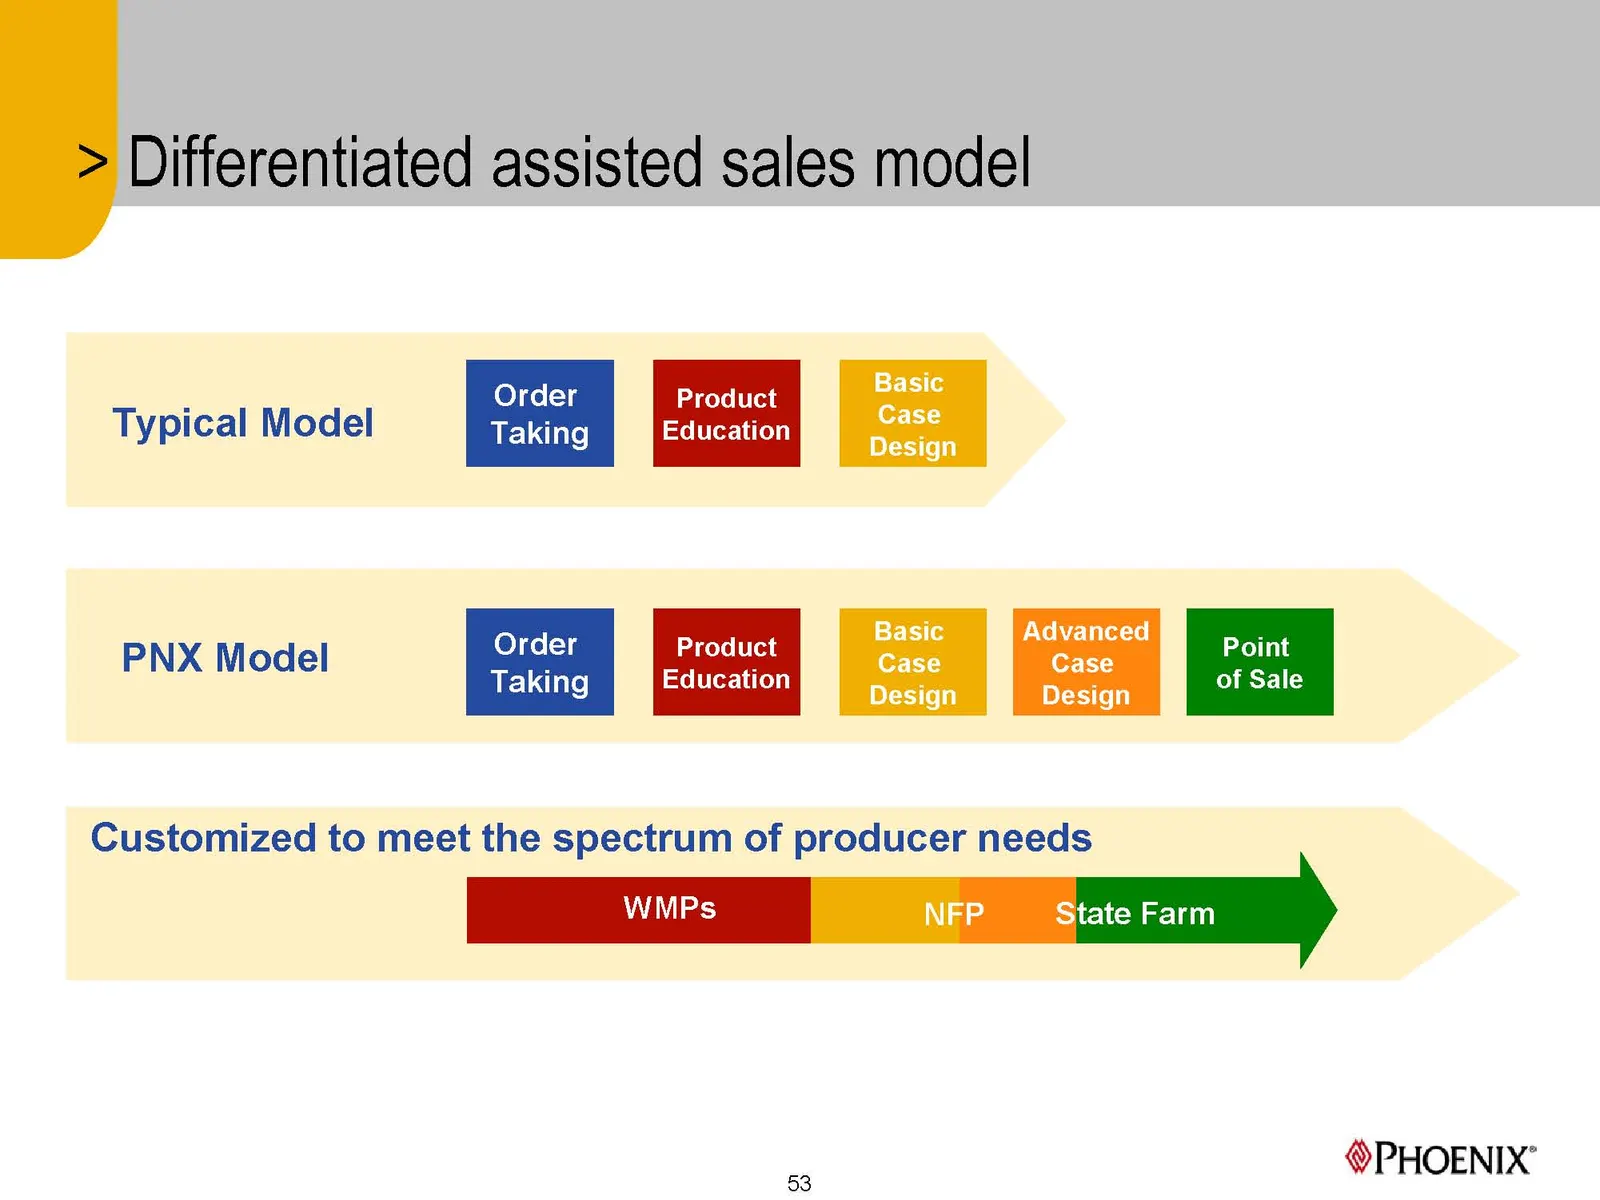
Slide 53: Differentiated assisted sales model
Differentiated assisted sales model Basic Order Product = : Case oO 4 Basic Advanced : PNX Model ini Poem | | eae aking Design Design Customized to meet the spectrum of producer needs WMPs NFP State Farm PHOENIX’ 53
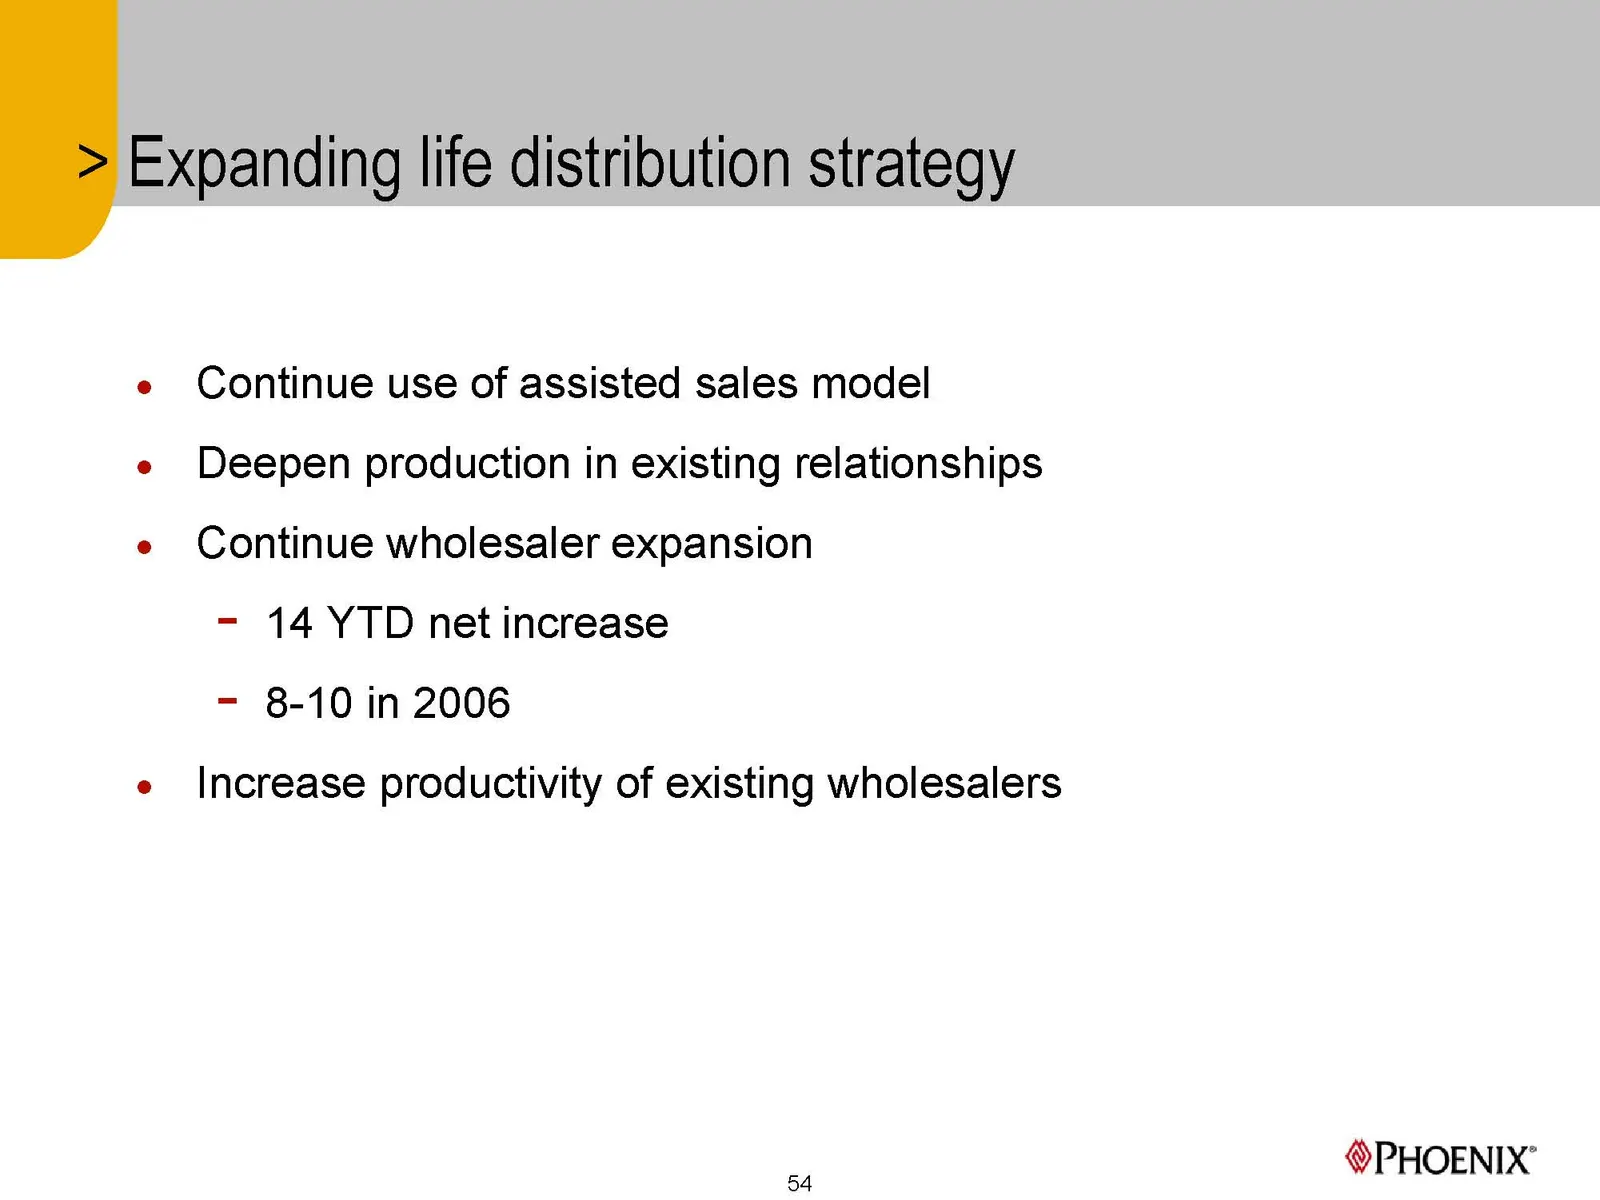
Slide 54: Expanding life distribution strategy
Expanding life distribution strategy e Continue use of assisted sales model e Deepen production in existing relationships e Continue wholesaler expansion - 14 YTD net increase - 8-10 in 2006 e Increase productivity of existing wholesalers PHOENIX’ 54
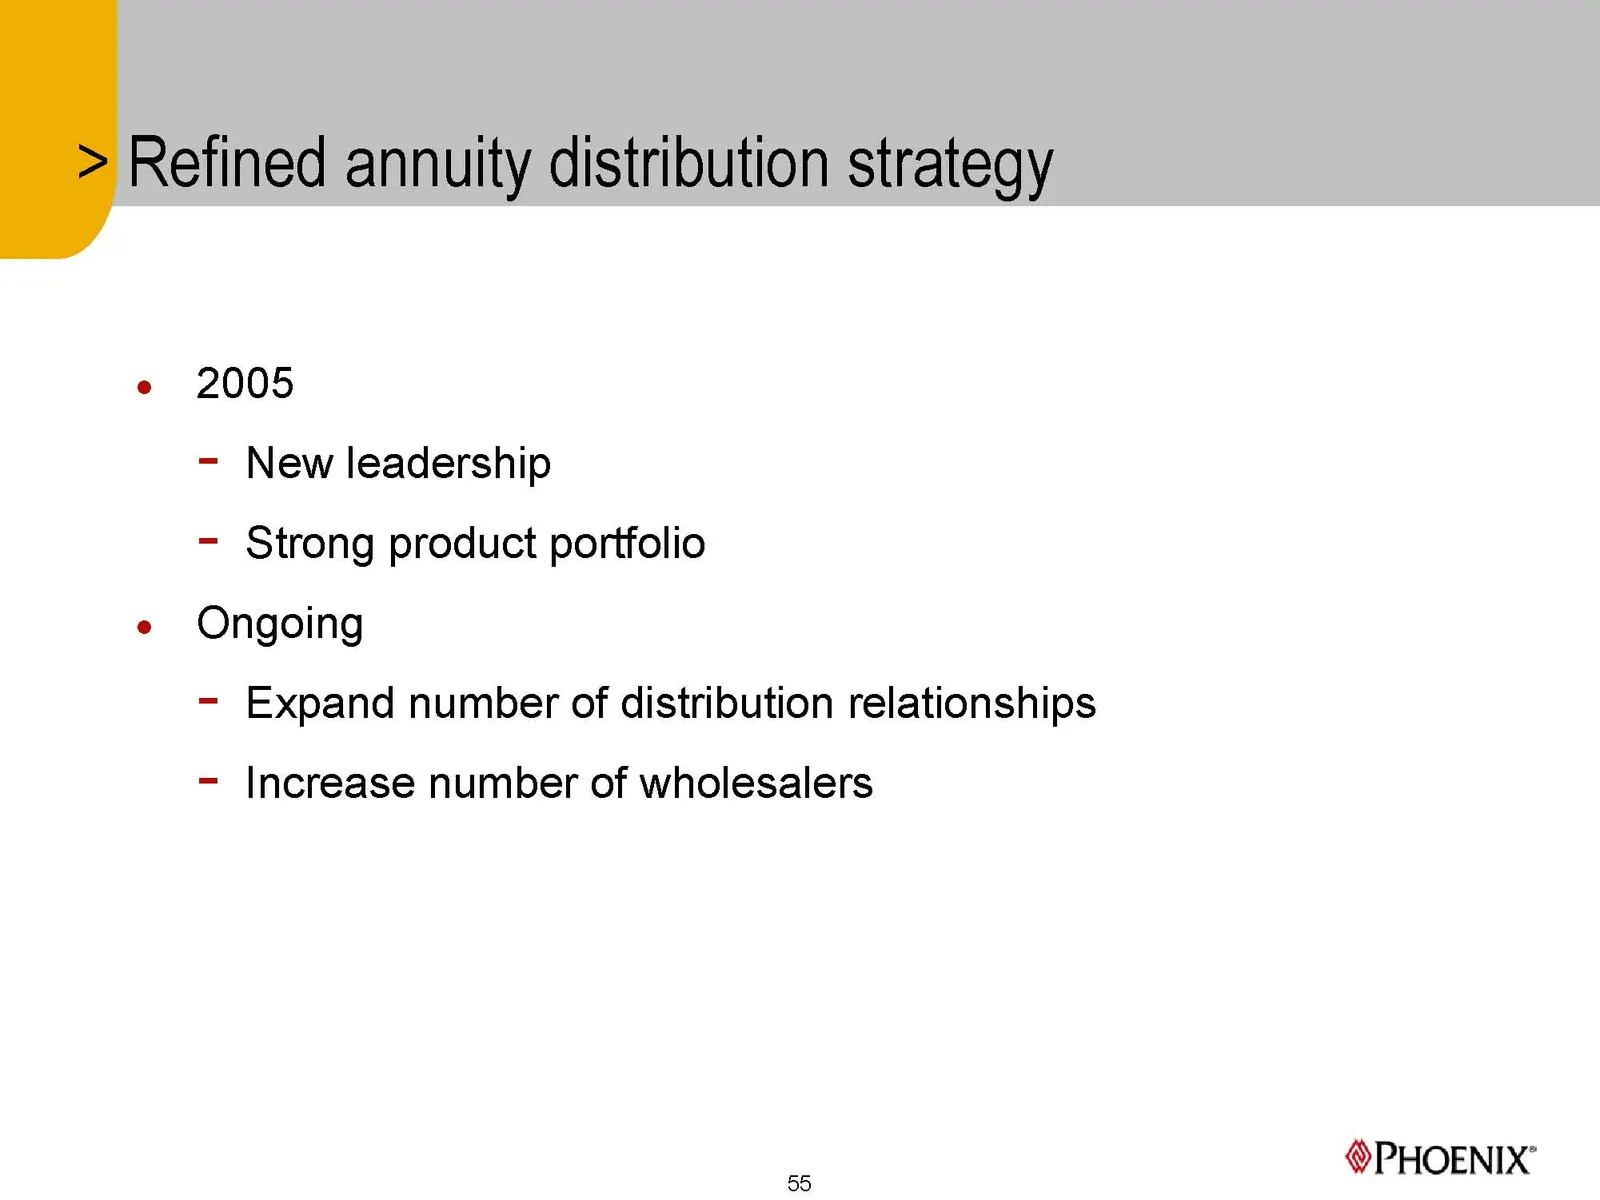
Slide 55: Refined annuity distribution strategy
Refined annuity distribution strategy e 2005 - New leadership - Strong product portfolio e Ongoing - Expand number of distribution relationships - Increase number of wholesalers PHOENIX’ 55
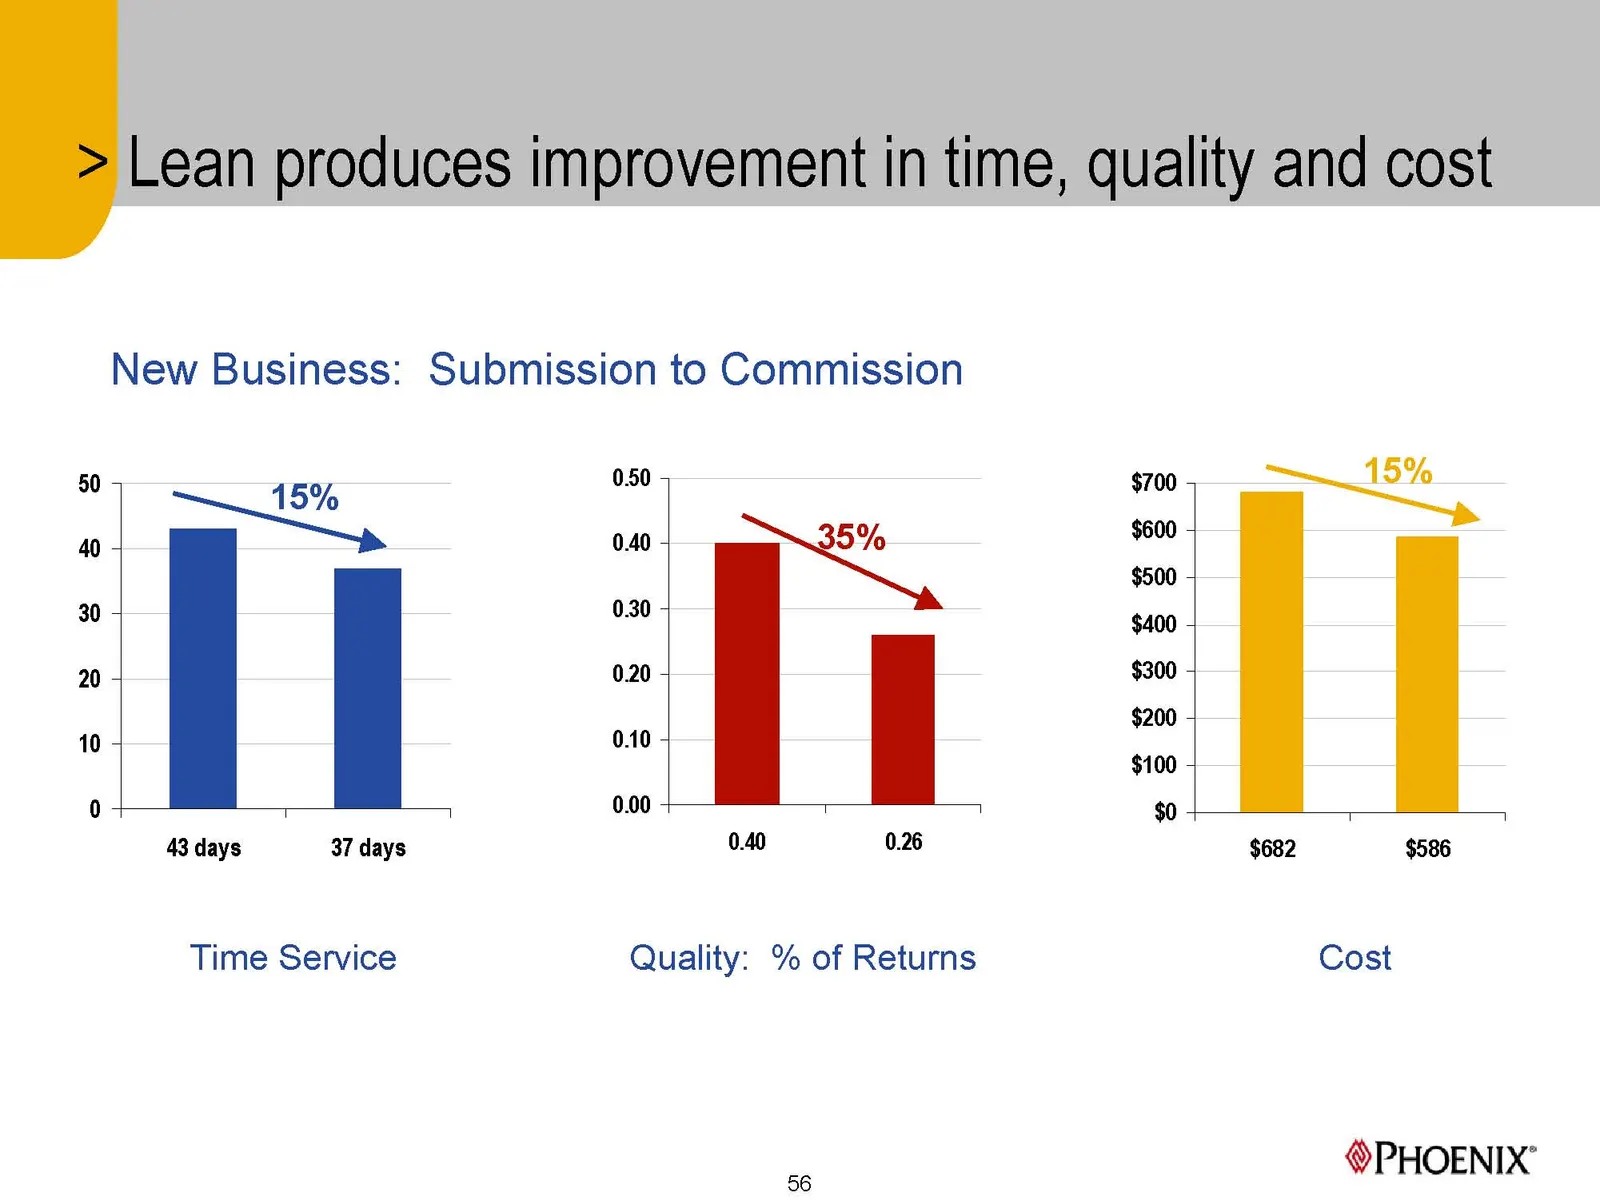
Slide 56: New Business: Submission to Commission
New Business: Submission to Commission 15% 050 5 a 0.40 0.30 = T 43 days 37 days Time Service 0.20 5 0.10 + 0.00 + a 0.40 0.26 Quality: % of Returns 56 $700 - $600 - $500 - $400 - $300 - $200 - $100 - $0 = Lean produces improvement in time, quality and cost _———— $682 $586 Cost PHOENIX’
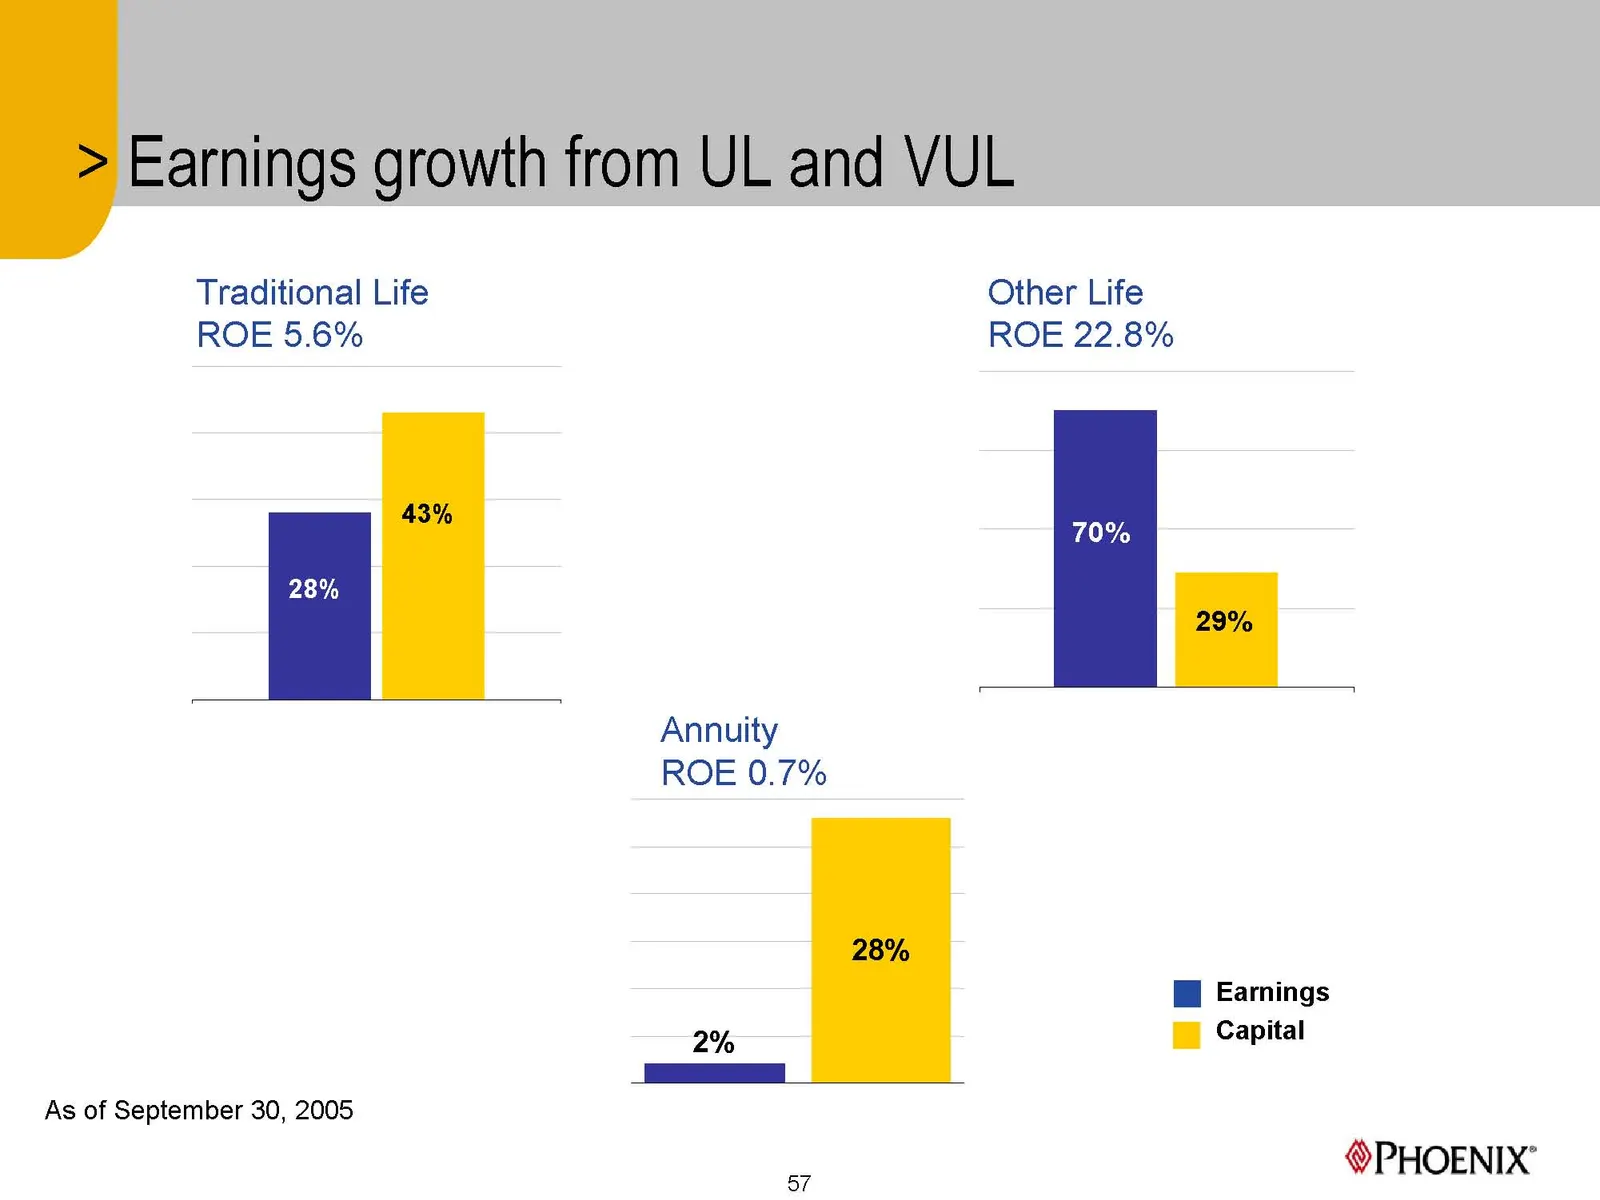
Slide 57: Earnings growth from UL and VUL
Earnings growth from UL and VUL Traditional Life Other Life ROE 5.6% ROE 22.8% Annuity ROE 0.7% i Earnings % (§) Capital As of September 30, 2005 PHOENIX’ 57
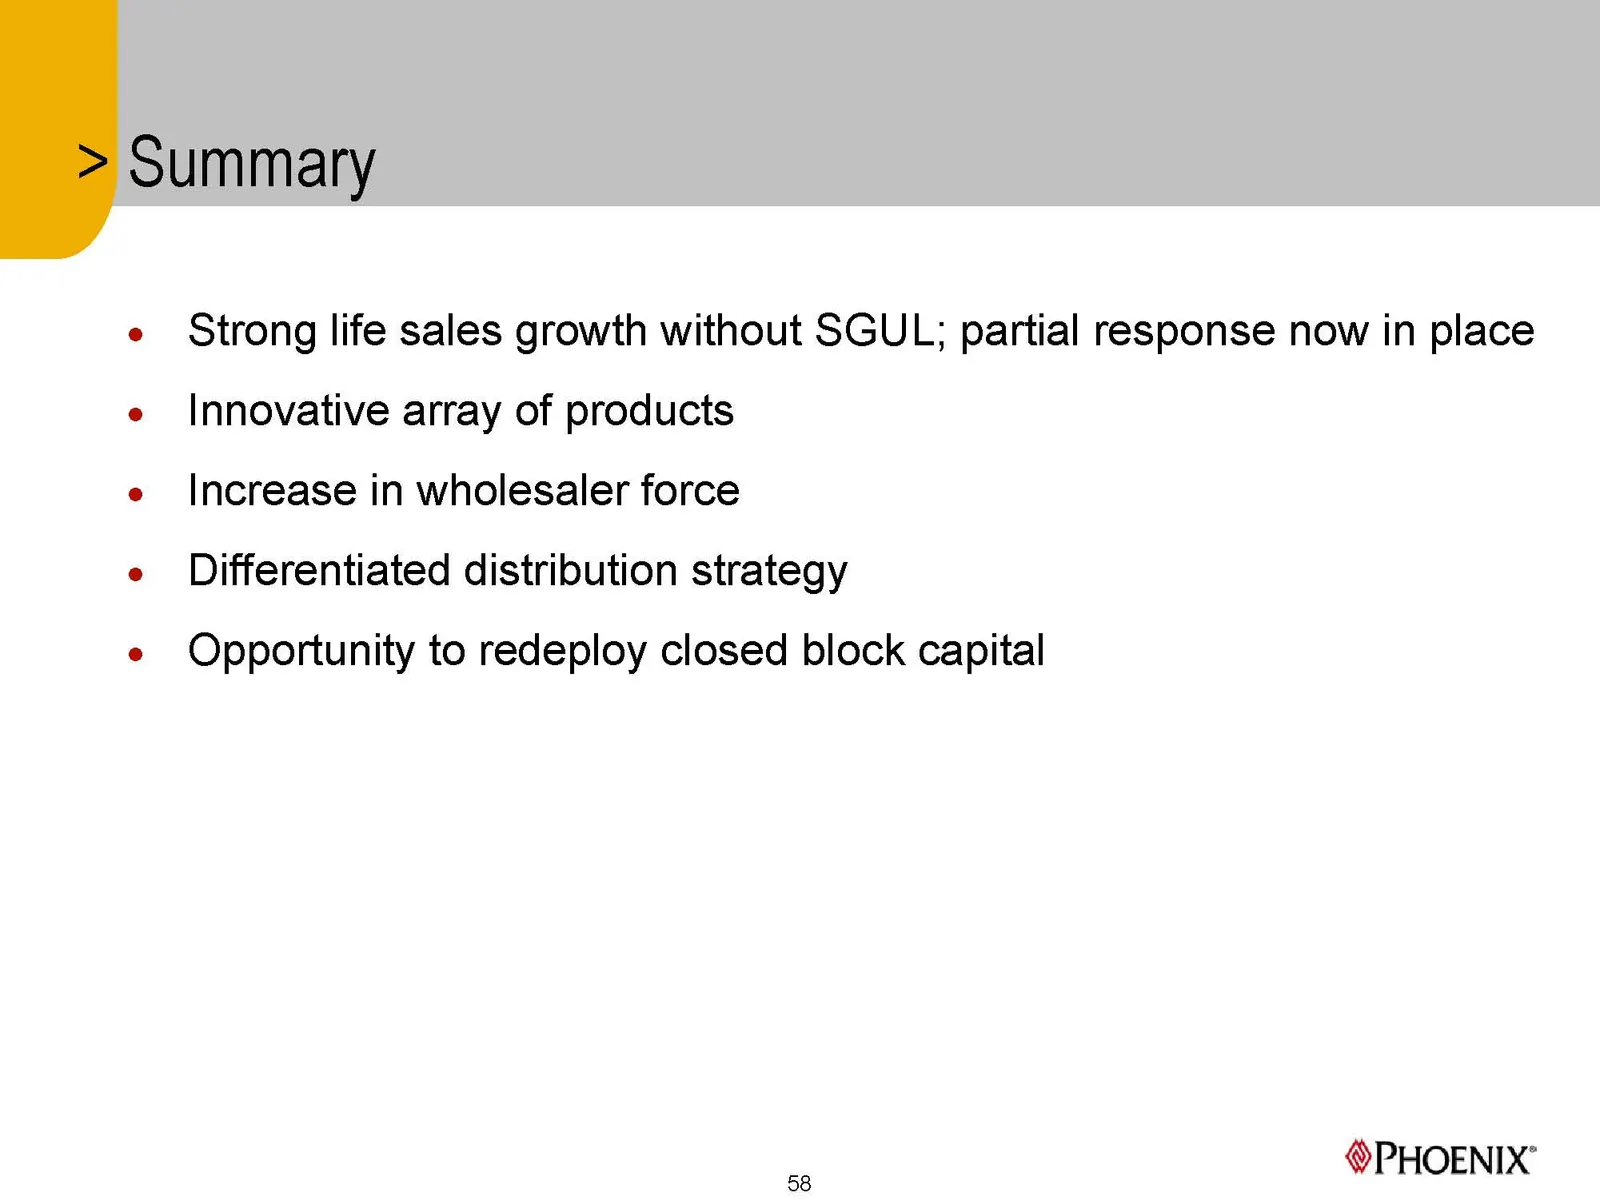
Slide 58: Summary
Summary e Strong life sales growth without SGUL; partial response now in place e Innovative array of products e Increase in wholesaler force e Differentiated distribution strategy e Opportunity to redeploy closed block capital PHOENIX’ 58

Slide 59: PHOENIX’
PHOENIX’
Slide 60: Performance Culture
The Phoenix Companies, Inc. Performance Culture Bonnie Malley Senior Vice President December 13, 2005 New York City PHOENIX"
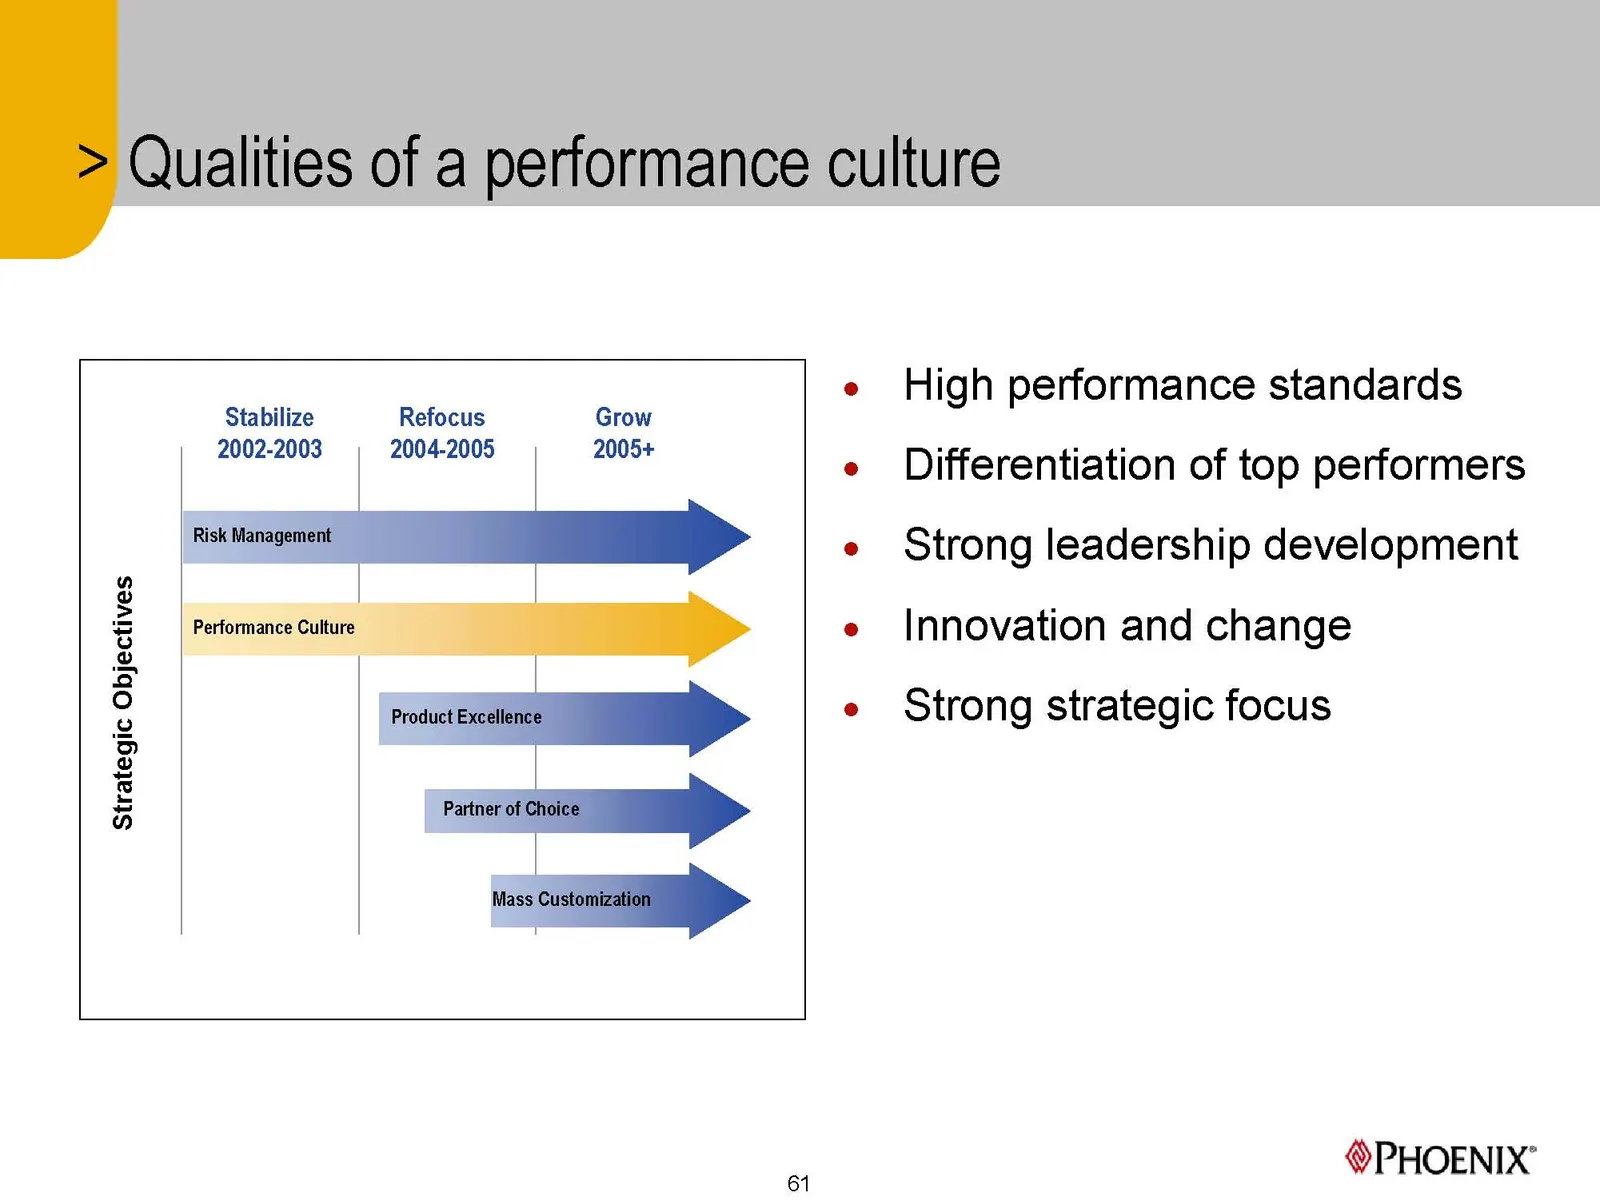
Slide 61: Strategic Objectives
Strategic Objectives Stabilize Refocus Grow 2002-2003 2004-2005 2005+ Risk Management Performance Culture 61 Qualities of a performance culture High performance standards Differentiation of top performers Strong leadership development Innovation and change Strong strategic focus PHOENIX’
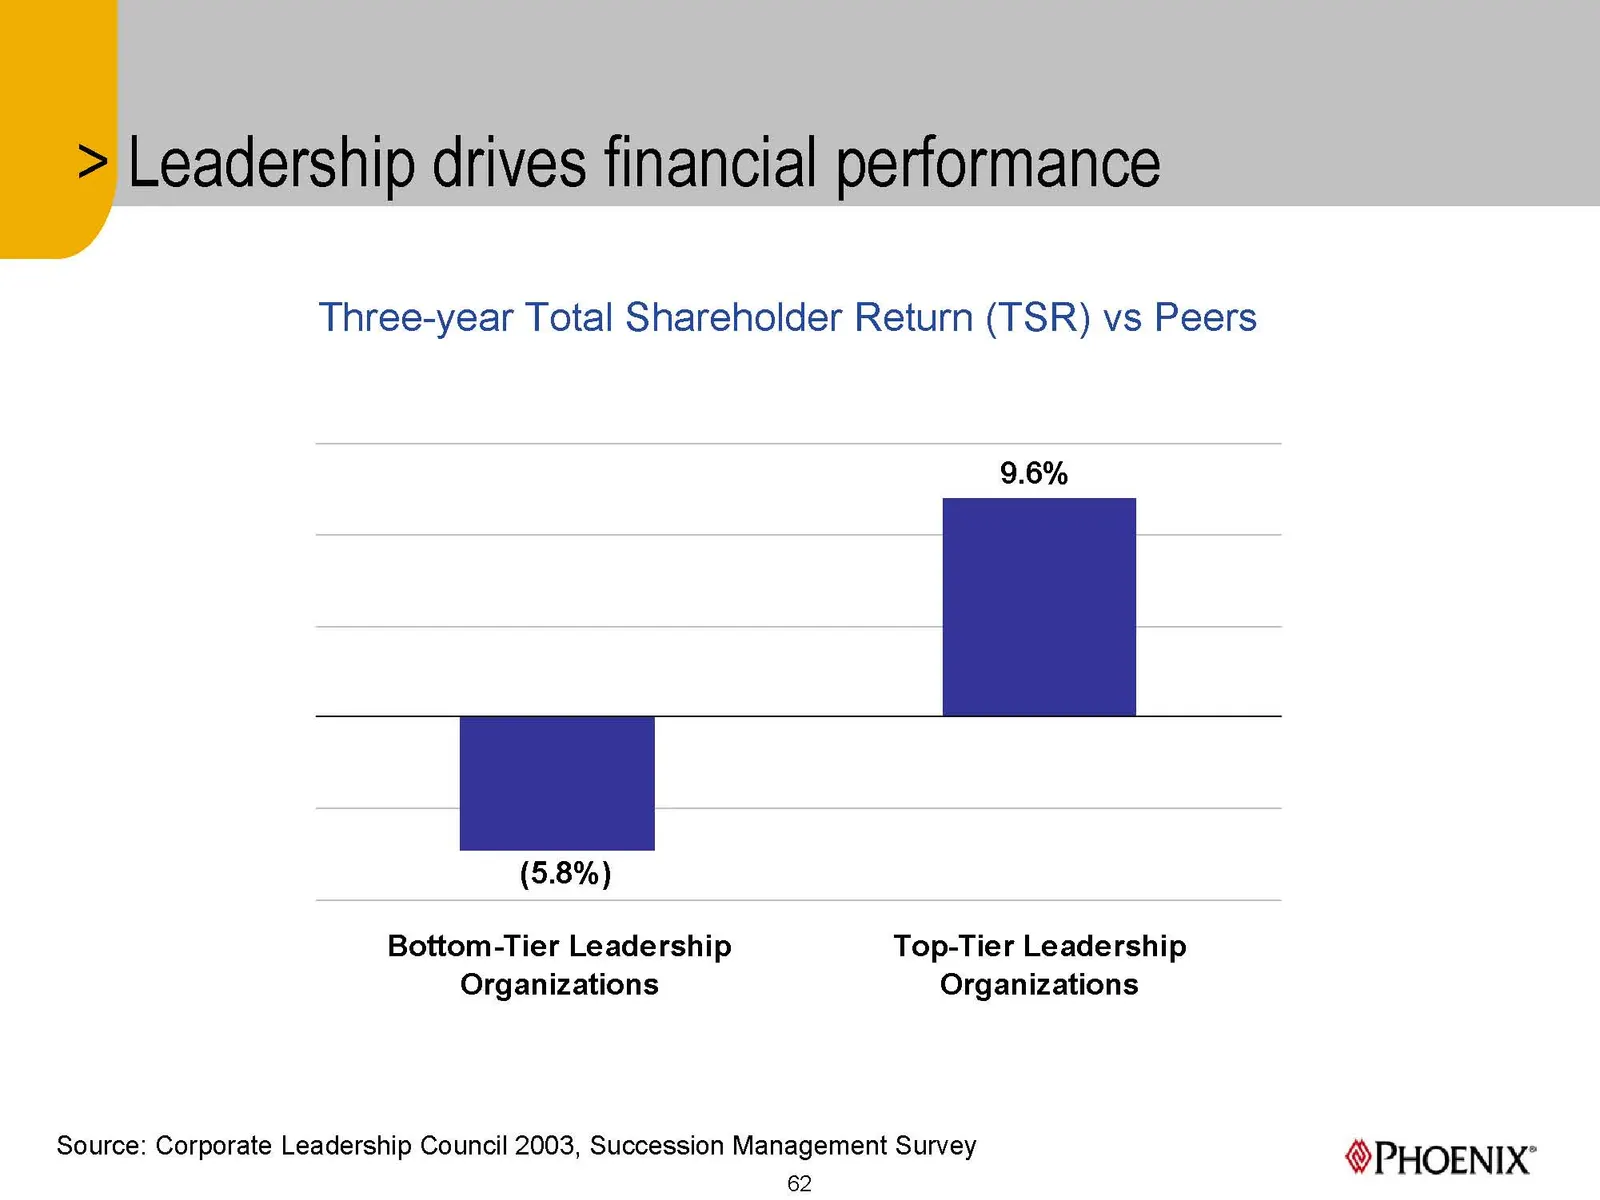
Slide 62: Leadership drives financial performance
Leadership drives financial performance Three-year Total Shareholder Return (TSR) vs Peers 9.6% (5.8%) Bottom-Tier Leadership Top-Tier Leadership Organizations Organizations Source: Corporate Leadership Council 2003, Succession Management Survey ° ms PHOENIX
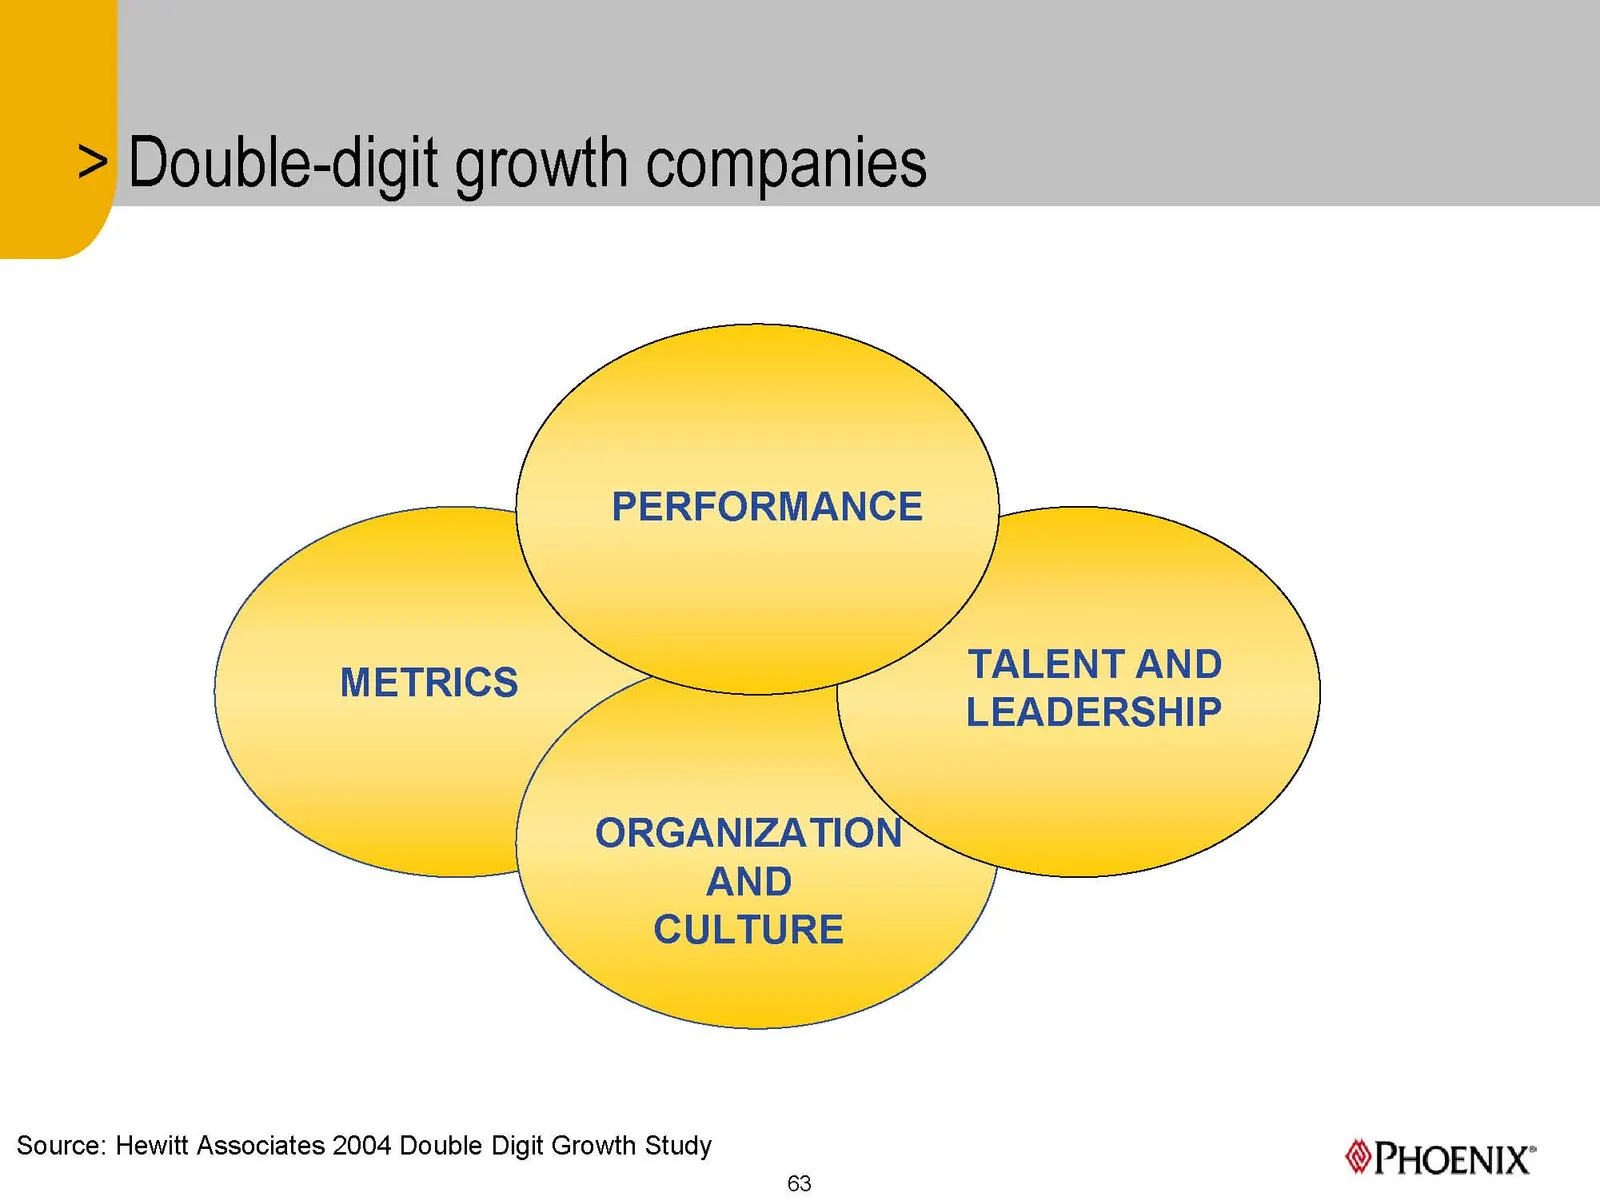
Slide 63: Talent and leadership
PERFORMANCE TALENT AND LEADERSHIP ORGANIZATIO AND CULTURE Source: Hewitt Associates 2004 Double Digit Growth Study «s PHOENIX
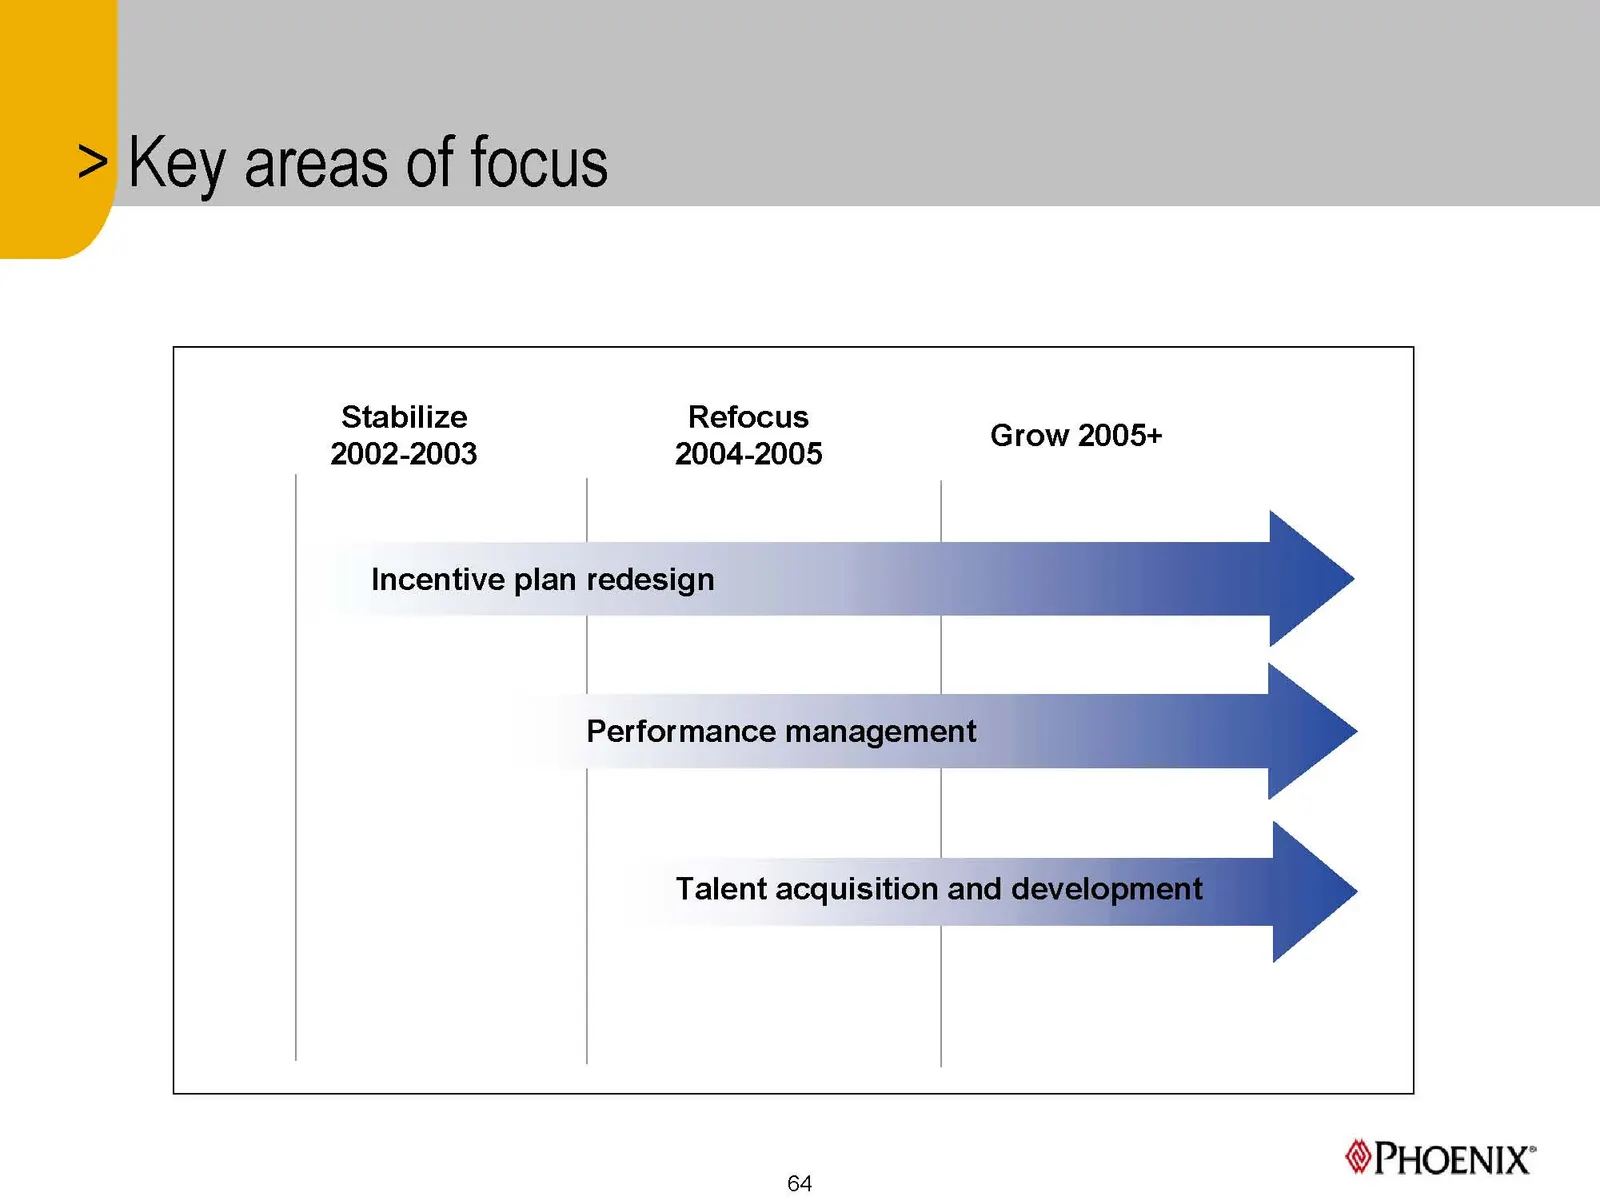
Slide 64: Key areas of focus
Key areas of focus Stabilize Refocus 2002-2003 2004-2005 Grow 2005+ Incentive plan redesign Performance management Talent acquisition and de PHOENIX’ 64
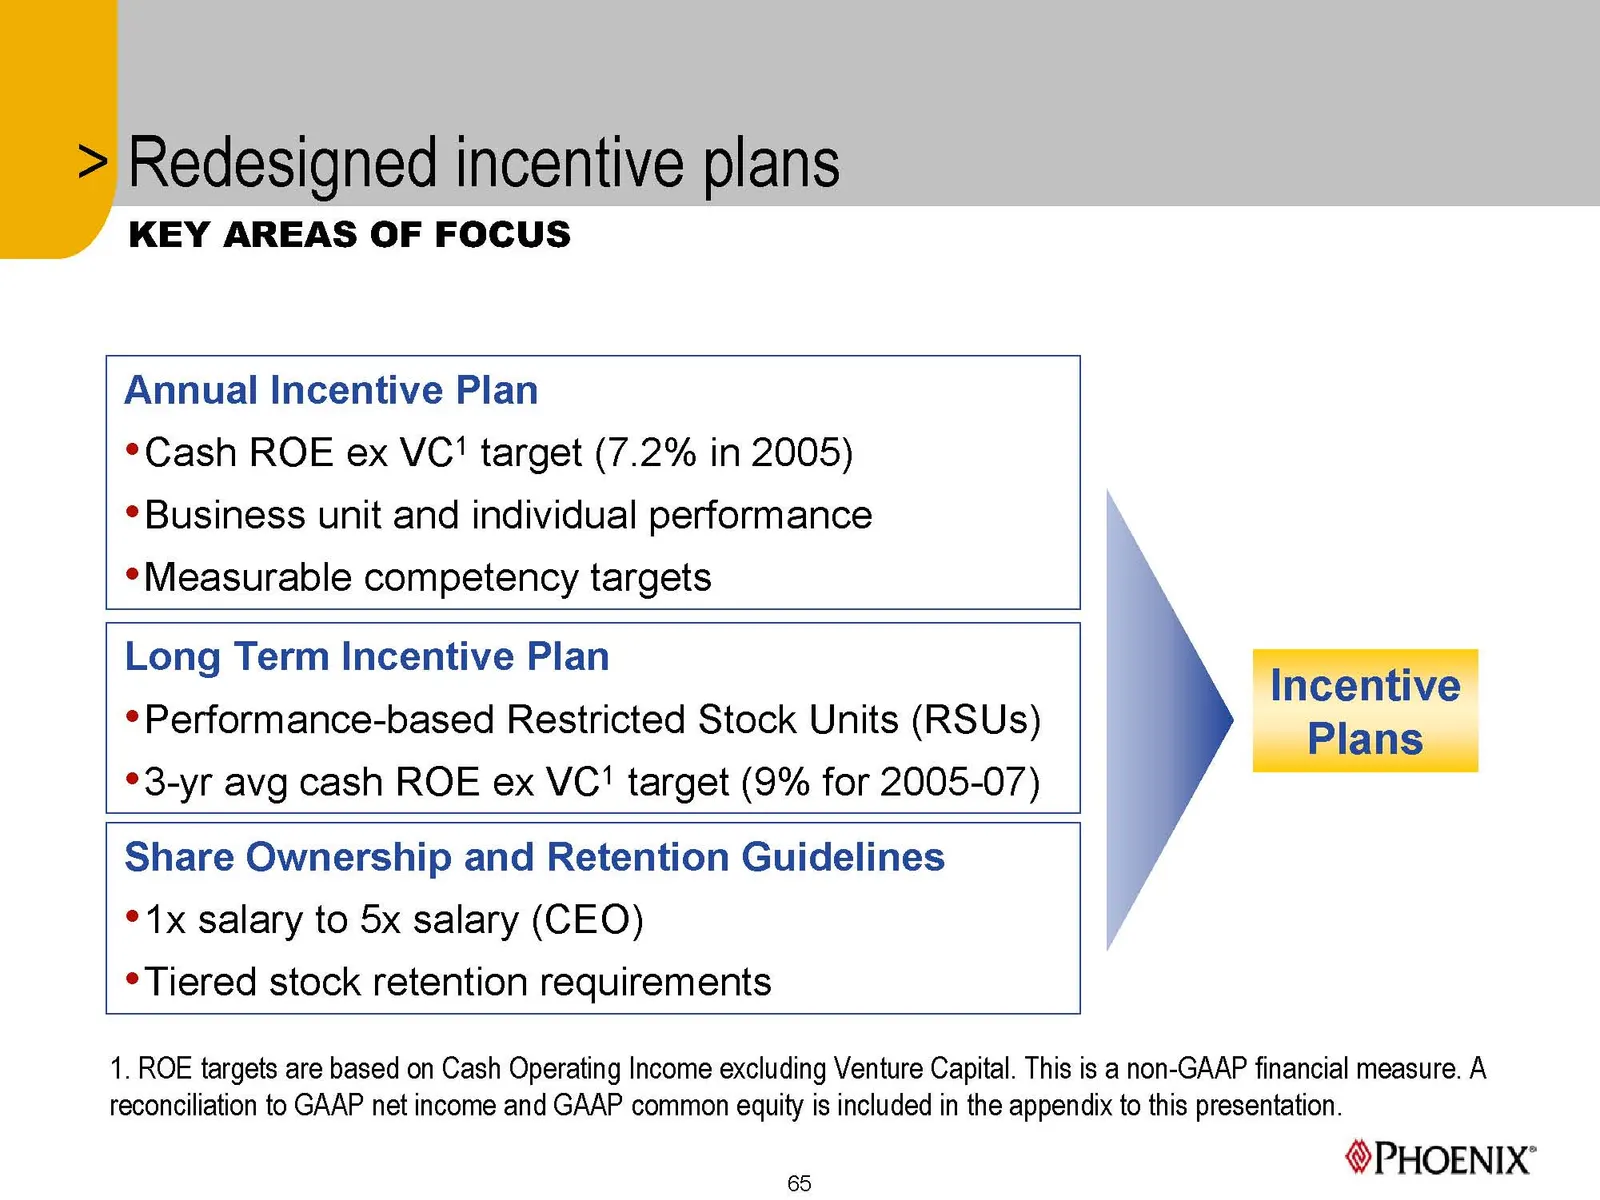
Slide 65: Redesigned incentive plans
Redesigned incentive plans KEY AREAS OF FOCUS Annual Incentive Plan Cash ROE ex VC’! target (7.2% in 2005) ¢Business unit and individual performance ¢Measurable competency targets } Long Term Incentive Plan ) a recrriie *Performance-based Restricted Stock Units (RSUs) Pla 1s °3-yr avg cash ROE ex VC
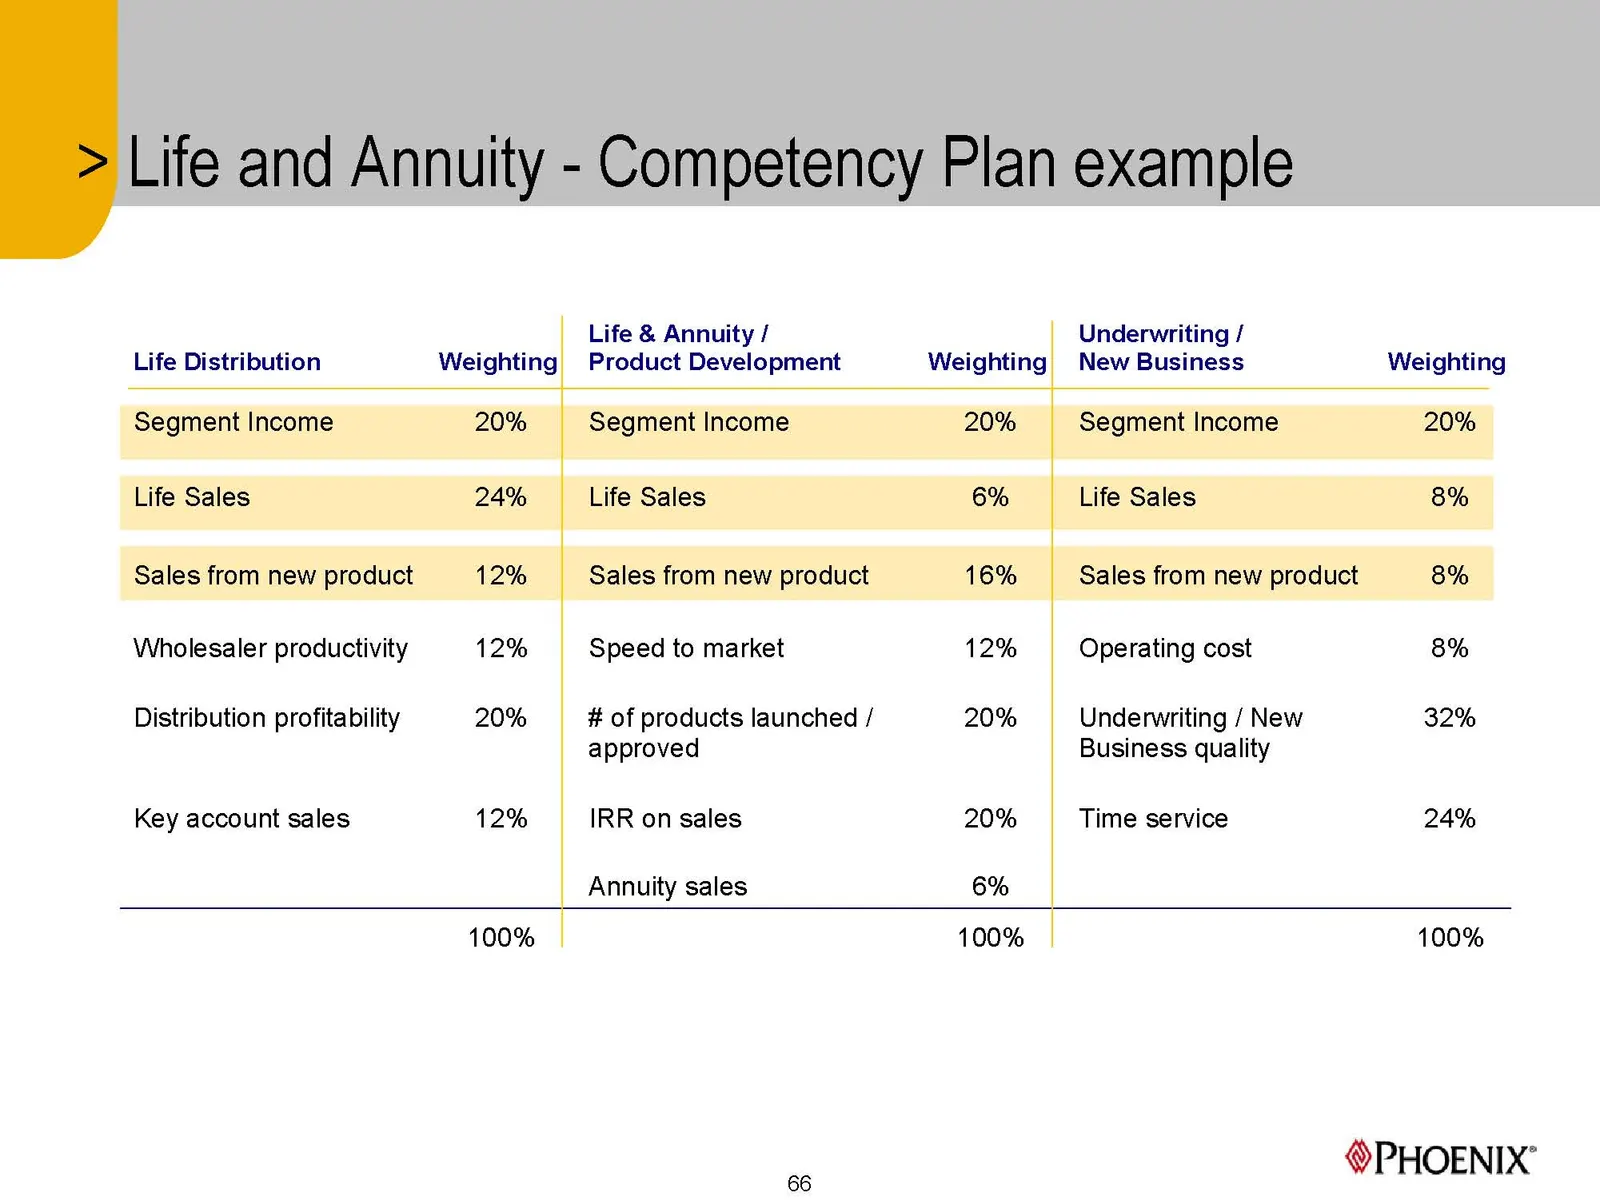
Slide 66: Life and Annuity - Competency Plan example
Life and Annuity - Competency Plan example Life & Annuity / Underwriting / Life Distribution Weighting Product Development Weighting New Business Weighting Segment Income 20% Segment Income 20% Segment Income 20% Life Sales 24% Life Sales 6% Life Sales 8% Sales from new product 12% Sales from new pr
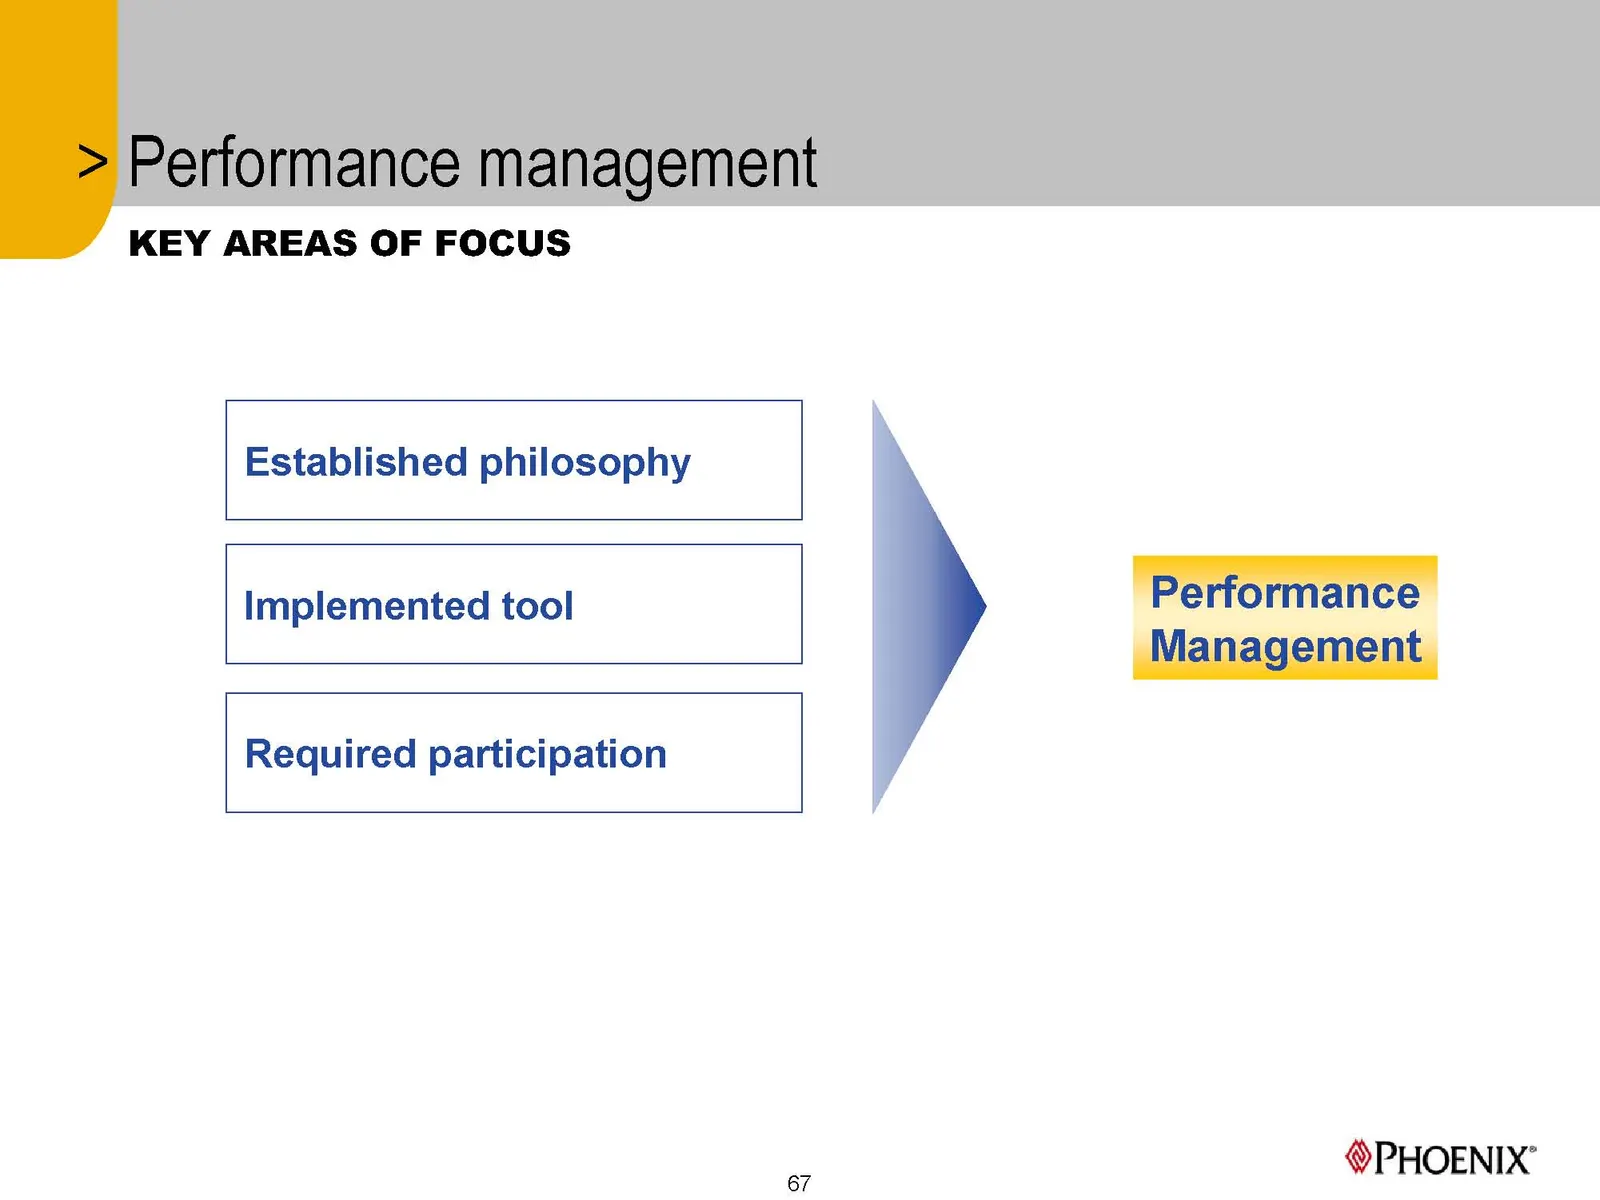
Slide 67: Key areas of focus
KEY AREAS OF FOCUS Required participation Established philosophy Implemented tool Penonnance: PHOENIX’ 67
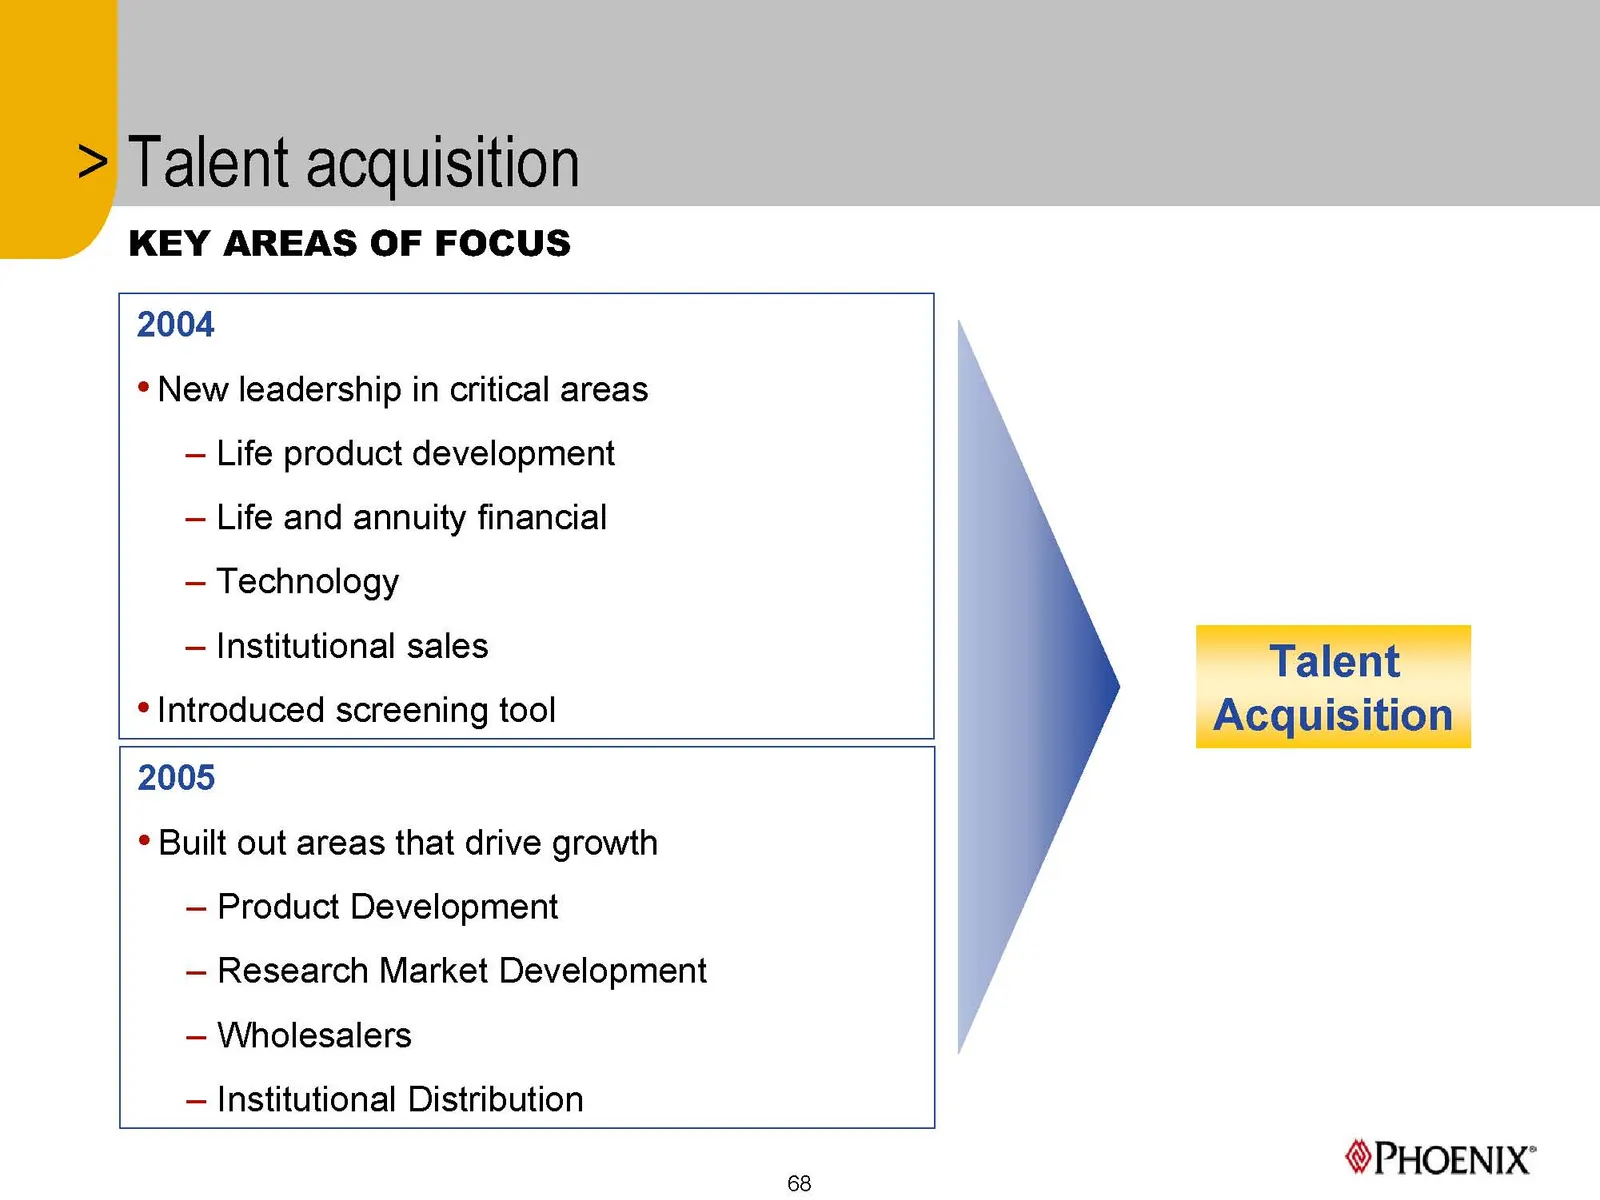
Slide 68: Key areas of focus
KEY AREAS OF FOCUS 2004 * New leadership in critical areas — Life product development — Life and annuity financial — Technology — Institutional sales * Introduced screening tool 2005 * Built out areas that drive growth — Product Development — Research Market Development — Wholesalers — Institutional
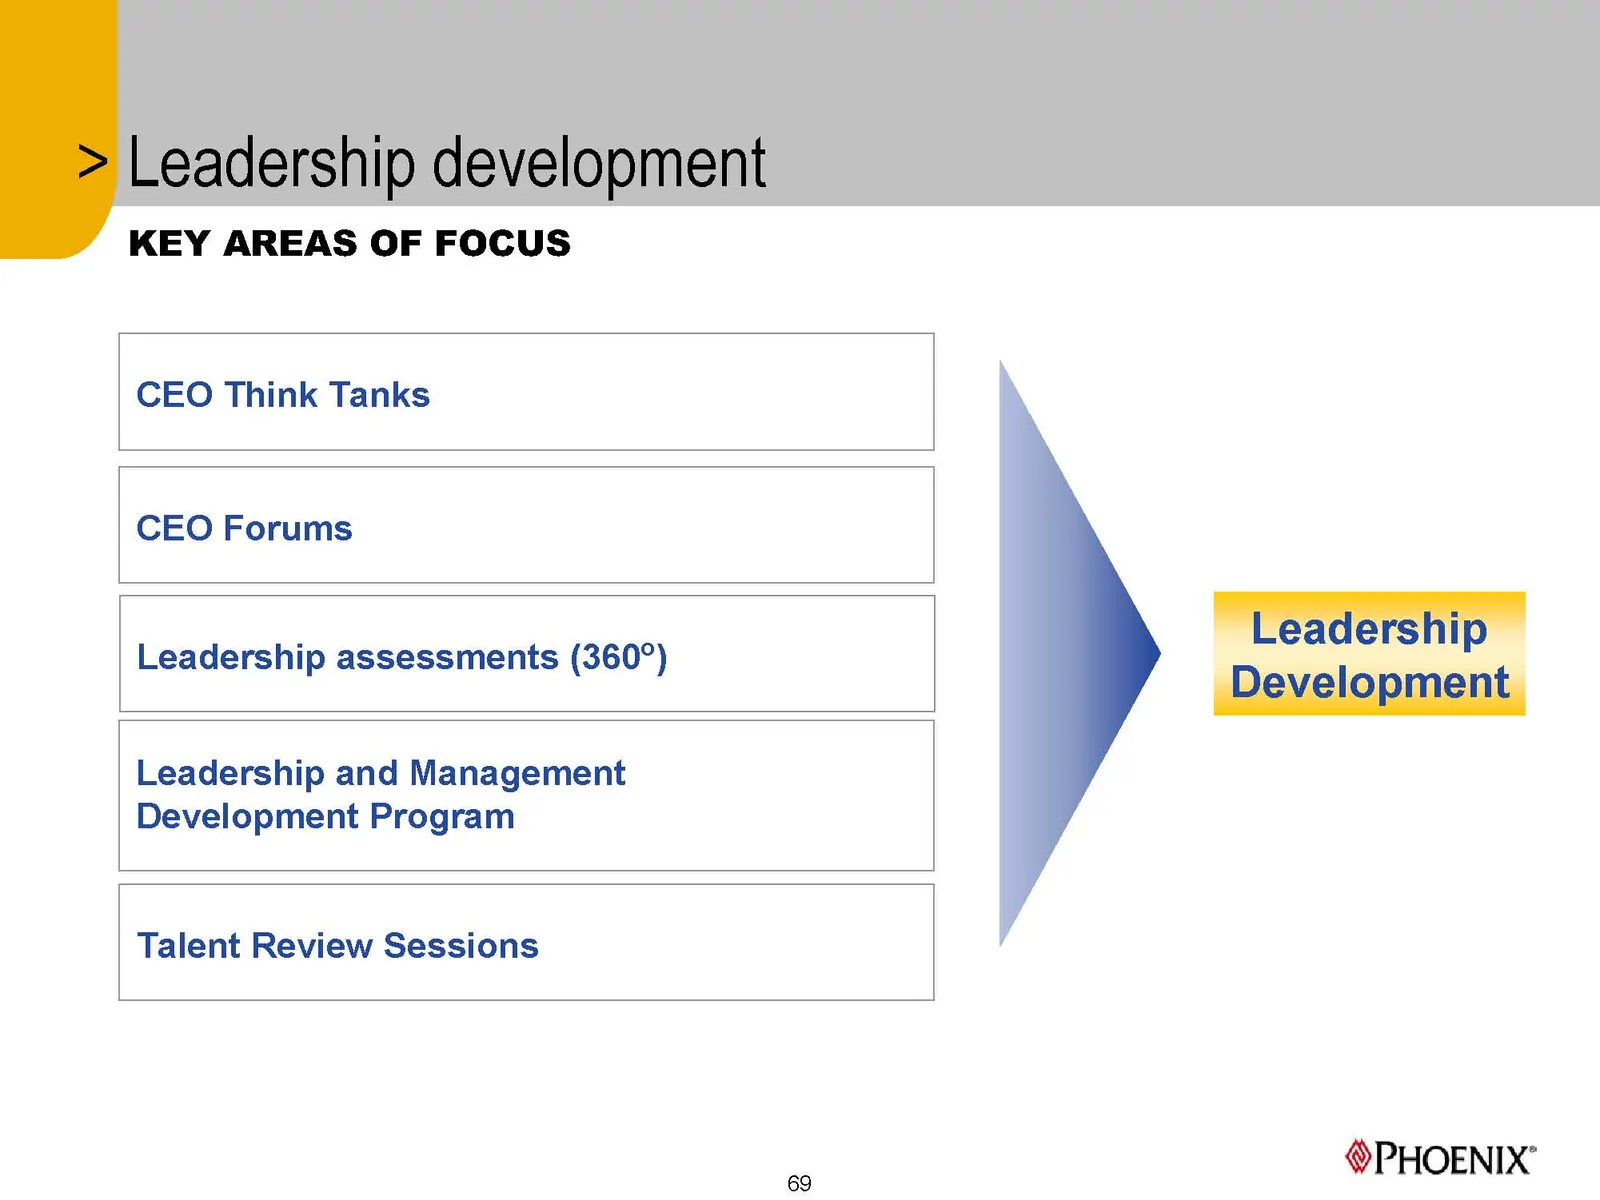
Slide 69: Key areas of focus
KEY AREAS OF FOCUS CEO Think Tanks CEO Forums Leadership assessments (360°) ii oe as i Wevelopment, Leadership and Management Development Program Talent Review Sessions PHOENIX’ 69
Slide 70: Building a performance based culture
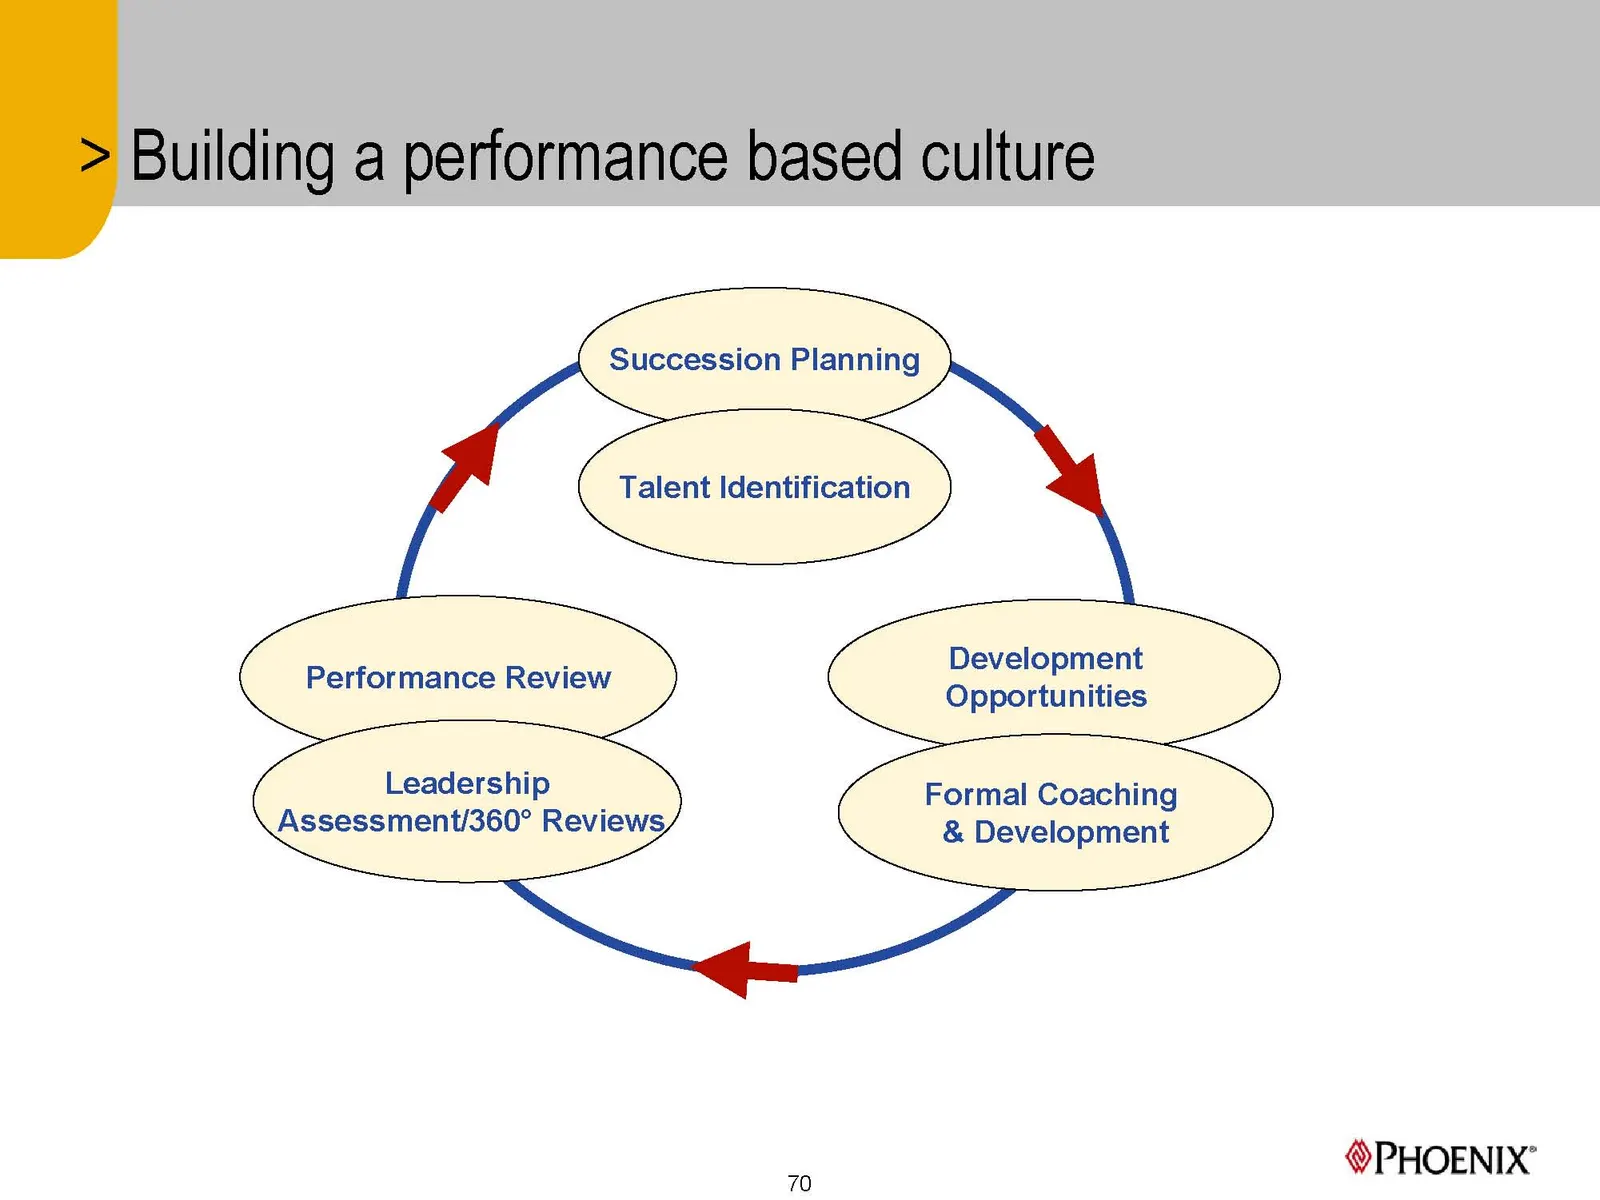
Building a performance based culture Succession Planning Talent Identification Development Opportunities Performance Review Formal Coaching Leadership & Development Assessment/360° Reviews, PHOENIX’ 70
Slide 71: Partner of Choice Distribution
The Phoenix Companies, Inc. Partner of Choice Distribution Wholesaler Panel December 13, 2005 New York City PHOENIX
Slide 72: Wholesaler panel
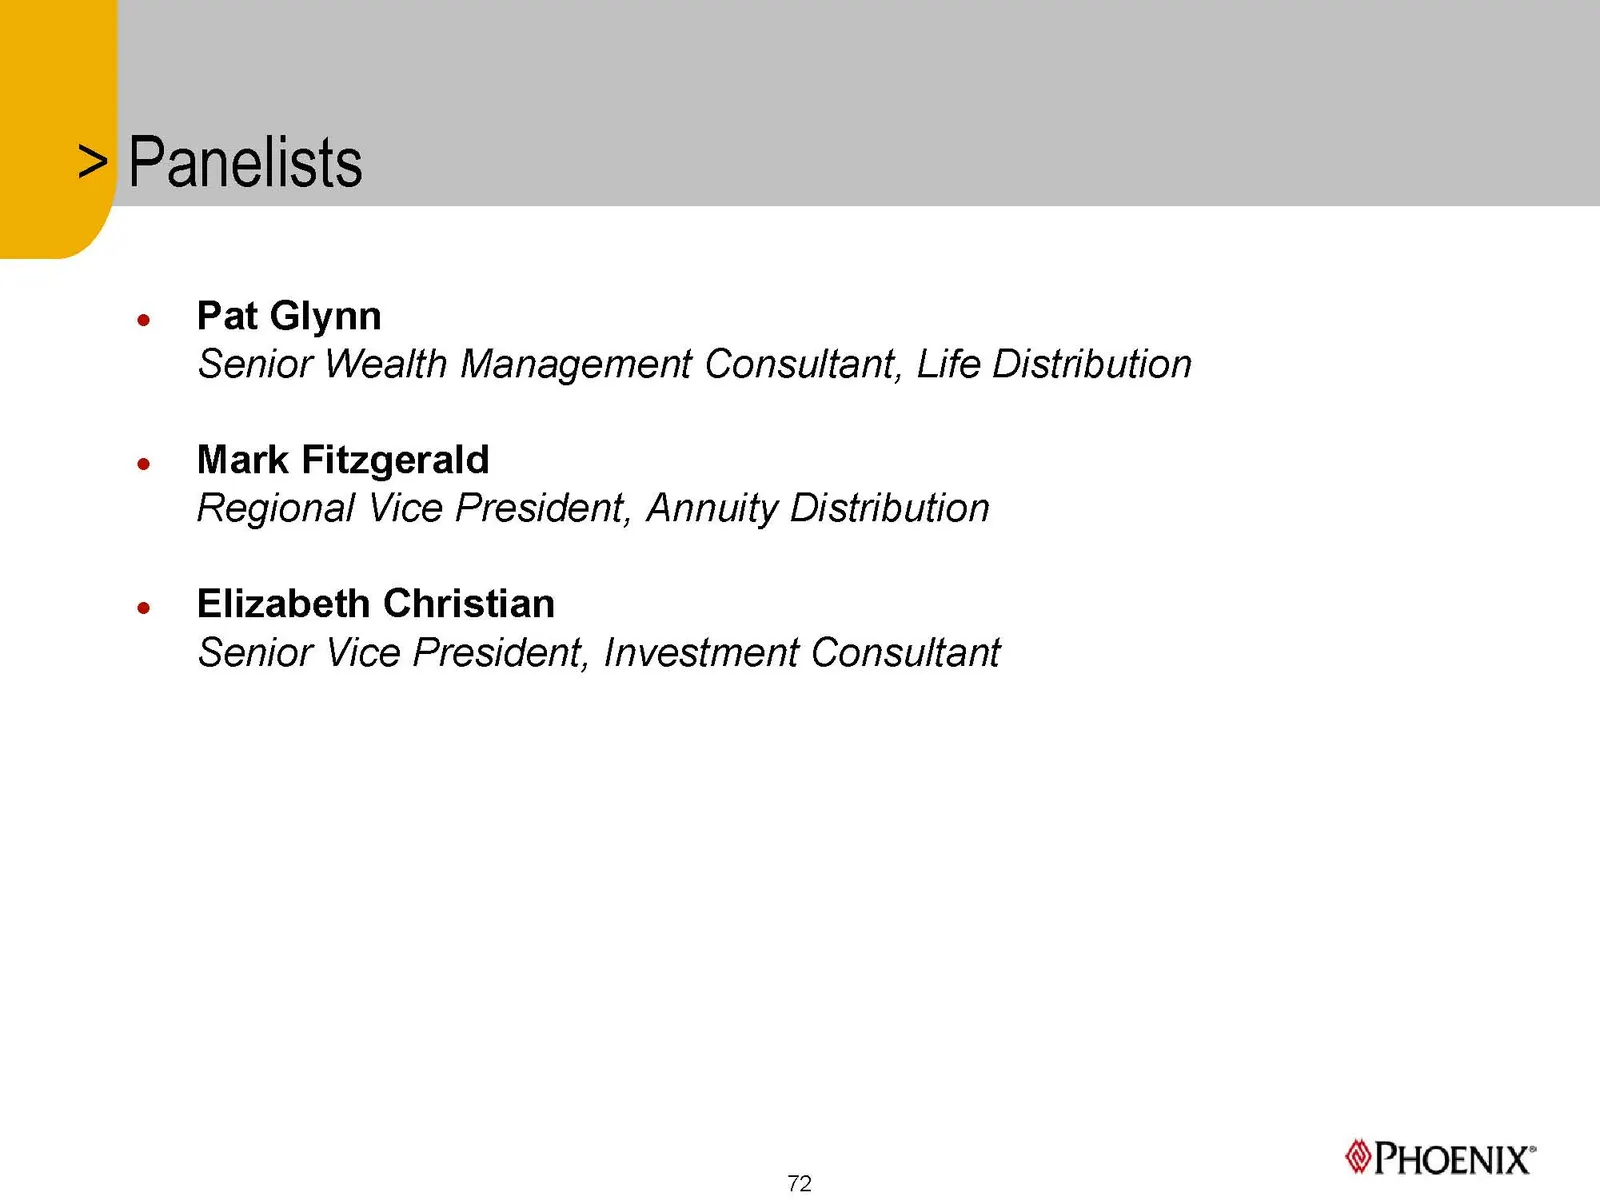
e Pat Glynn Senior Wealth Management Consultant, Life Distribution e Mark Fitzgerald Regional Vice President, Annuity Distribution e Elizabeth Christian Senior Vice President, Investment Consultant PHOENIX’ 72
Slide 73: Life Distribution
Life Distribution PHOENIX’
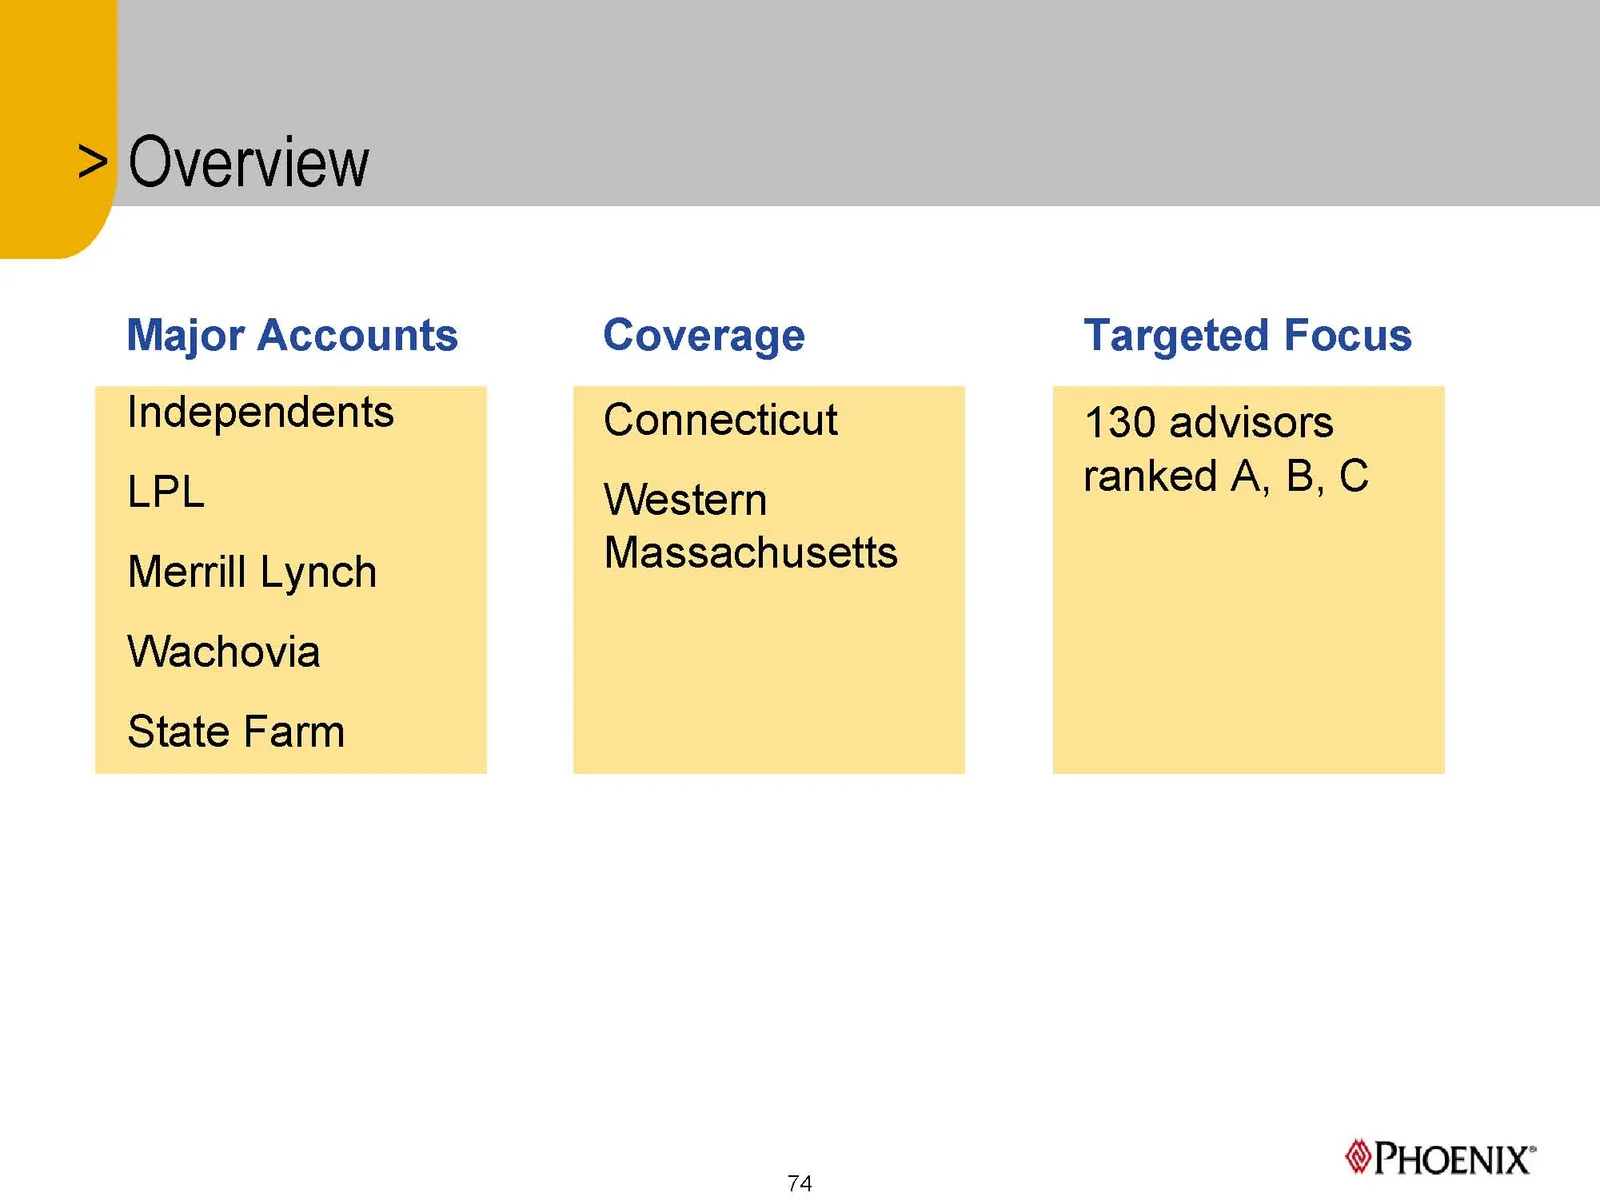
Slide 74: Major Accounts
Major Accounts Independents LPL Merrill Lynch Wachovia State Farm Coverage Connecticut Western Massachusetts 74 Targeted Focus 130 advisors ranked A, B, C PHOENIX’
Slide 75: Challenges, Opportunities, My Approach
e Challenges e Opportunities e My Approach PHOENIX’ 75
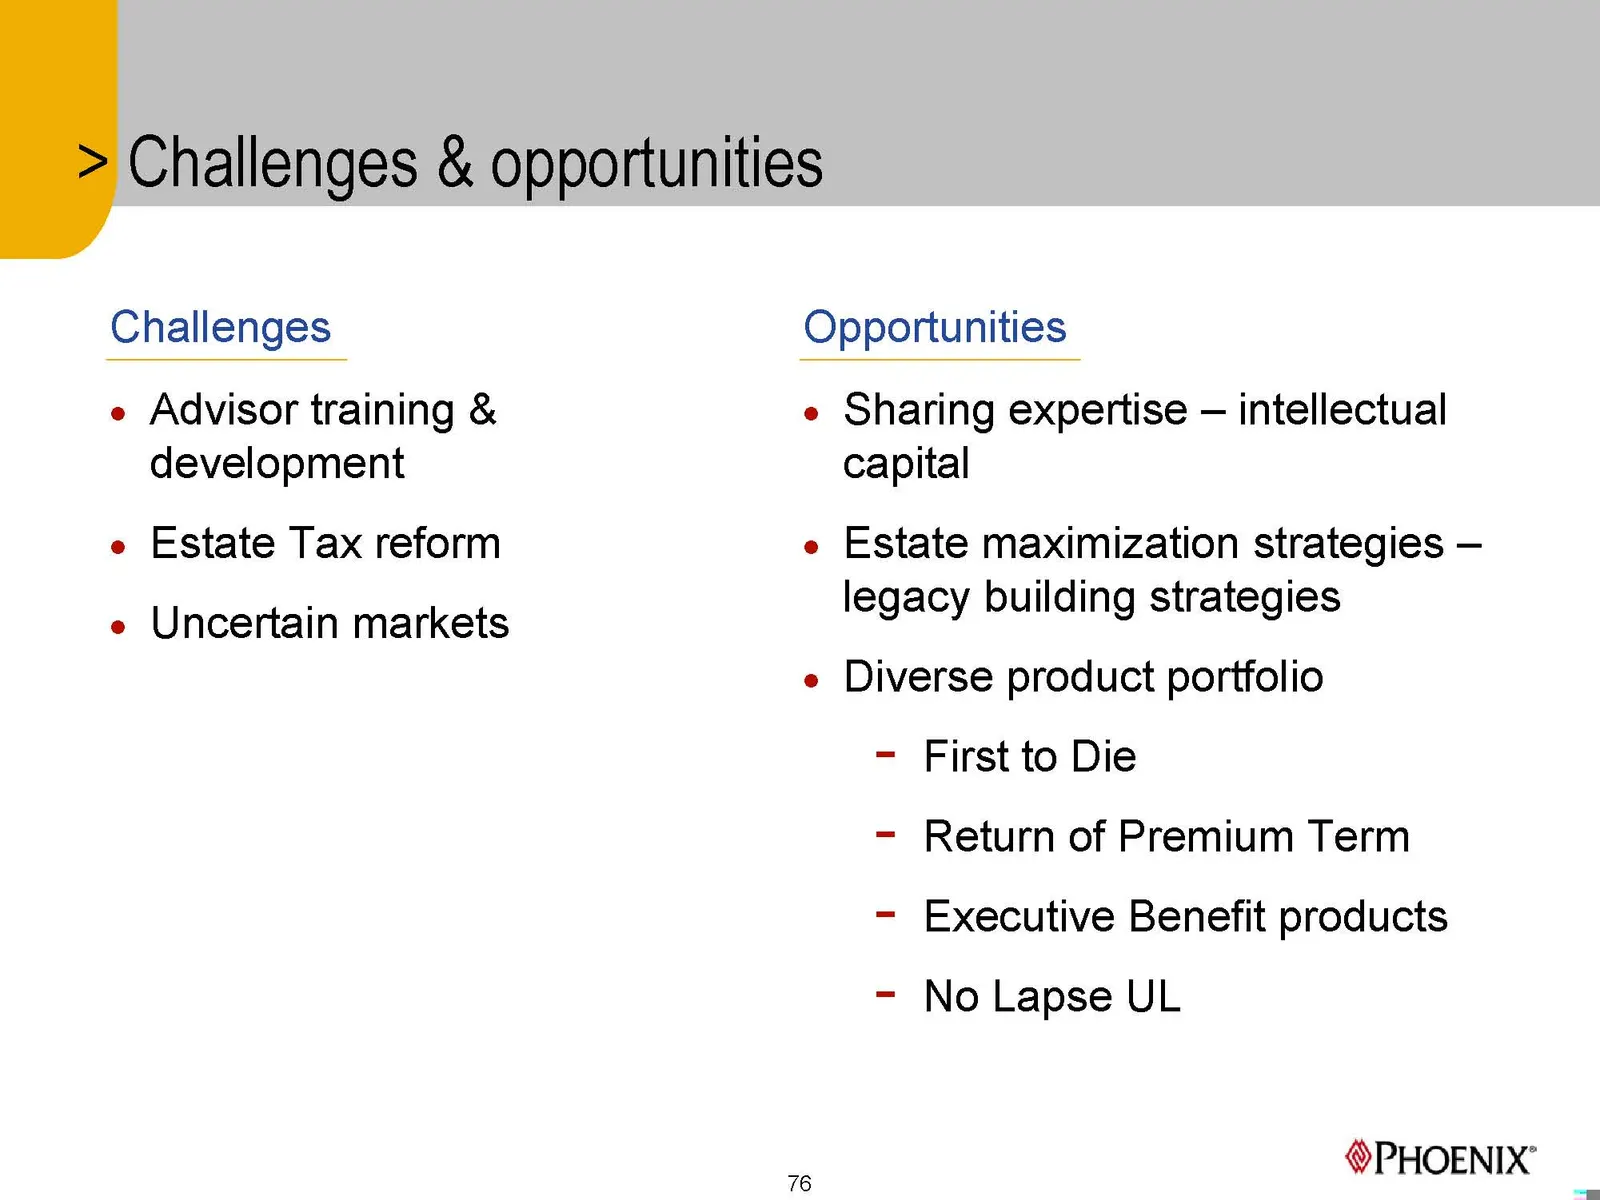
Slide 76: Challenges & opportunities
Challenges & opportunities Challenges Opportunities e Advisor training & e Sharing expertise — intellectual development capital e Estate Tax reform e Estate maximization strategies — = Uessaiain wareie legacy building strategies e Diverse product portfolio - First to Die - Return of Premium Term - E
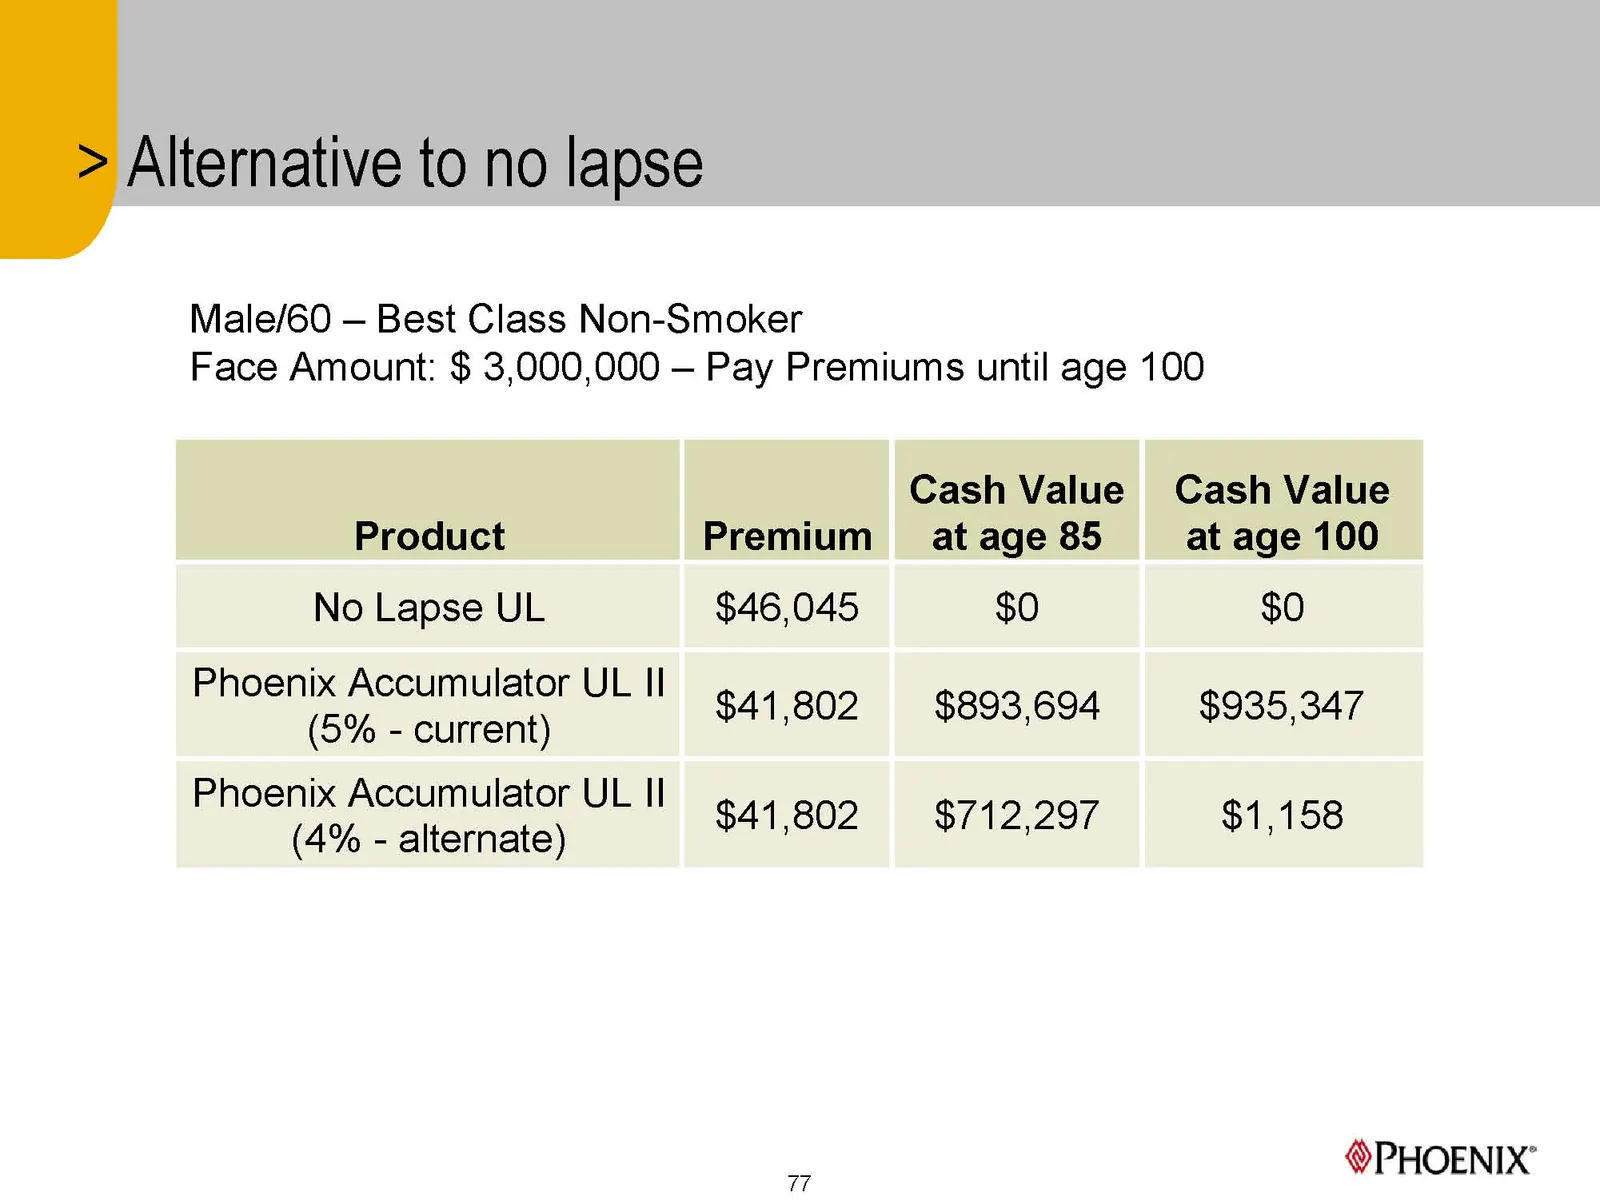
Slide 77: Alternative to no lapse
Alternative to no lapse Male/60 — Best Class Non-Smoker Face Amount: $ 3,000,000 — Pay Premiums until age 100 Cash Value Cash Value Product Premium at age 85 at age 100 No Lapse UL $46,045 $0 $0 Phoenix Accumulator UL II (5% - current) $41,802 $898,694 $935,347 Phoenix Accumulator UL II (4% - altern
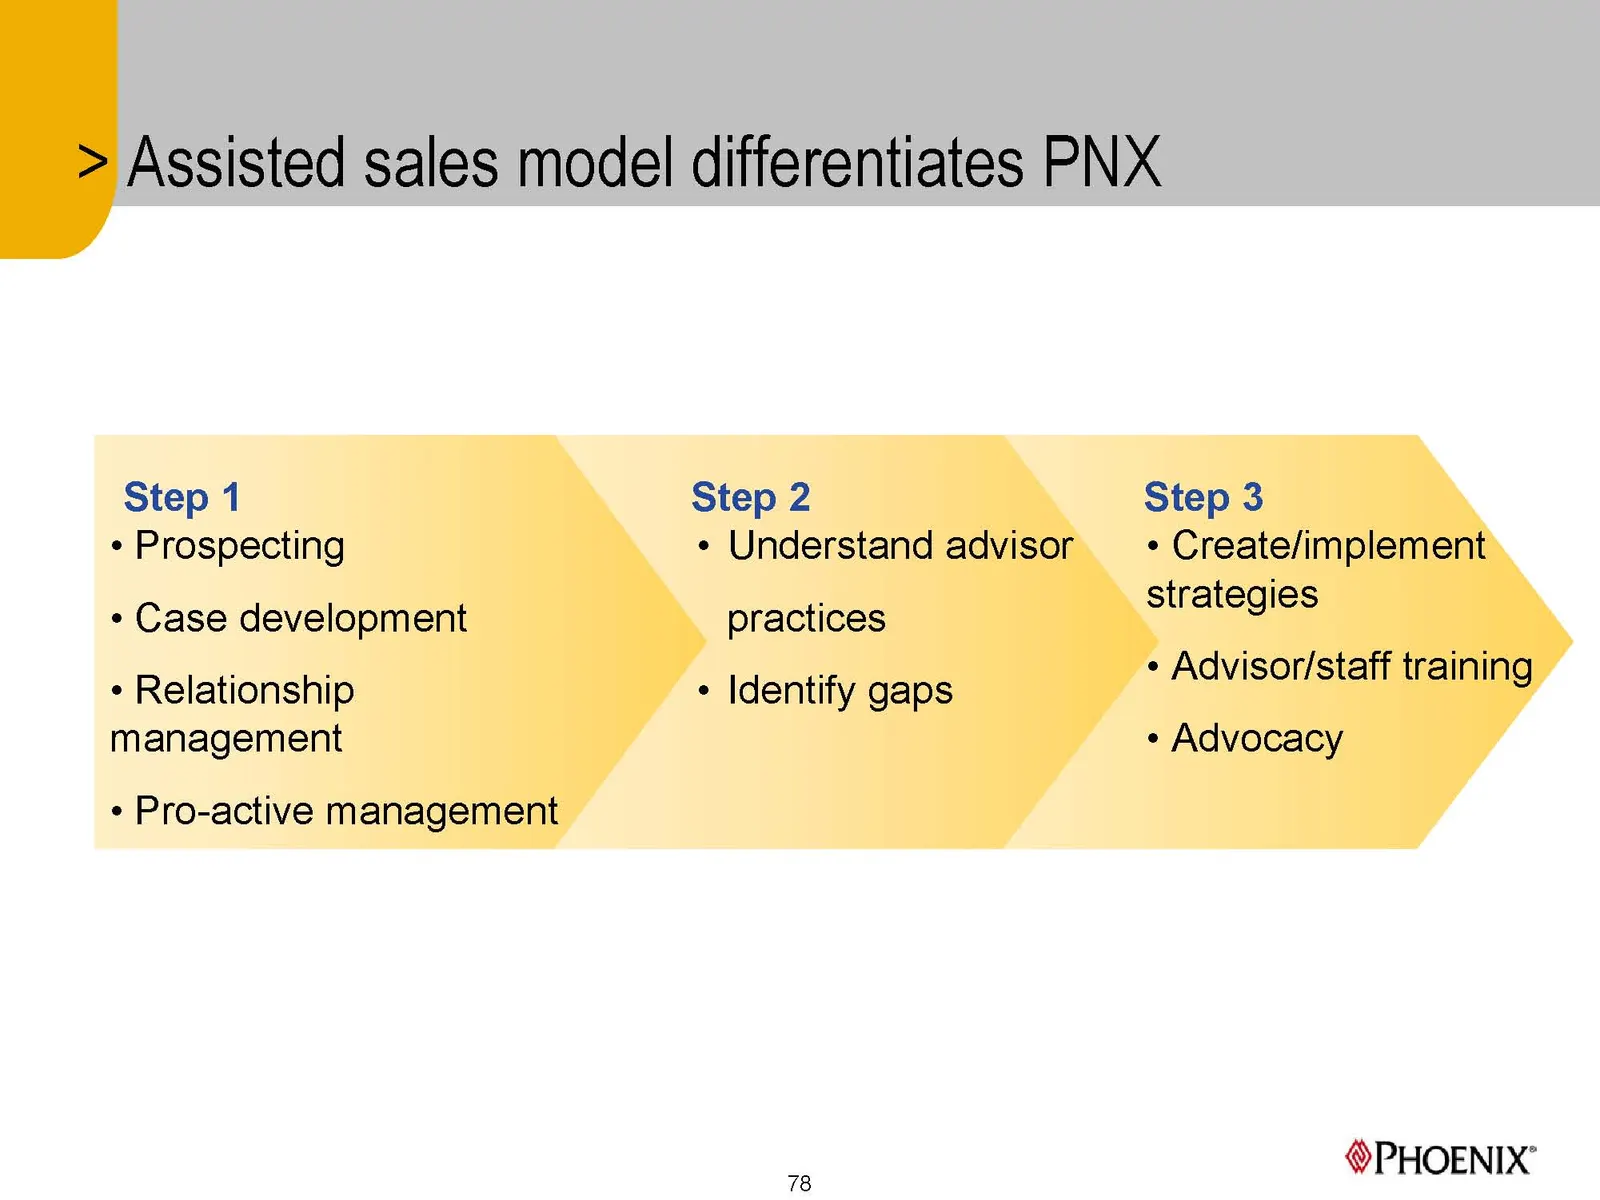
Slide 78: Assisted sales model differentiates PNX
> Assisted sales model differentiates PNX Step 1 Step 2 « Prospecting « Understand advisor * Case development practices « Relationship « Identify gaps management * Pro-active management 78 Step 3 * Create/implement strategies ¢ Advisor/staff training « Advocacy PHOENIX’
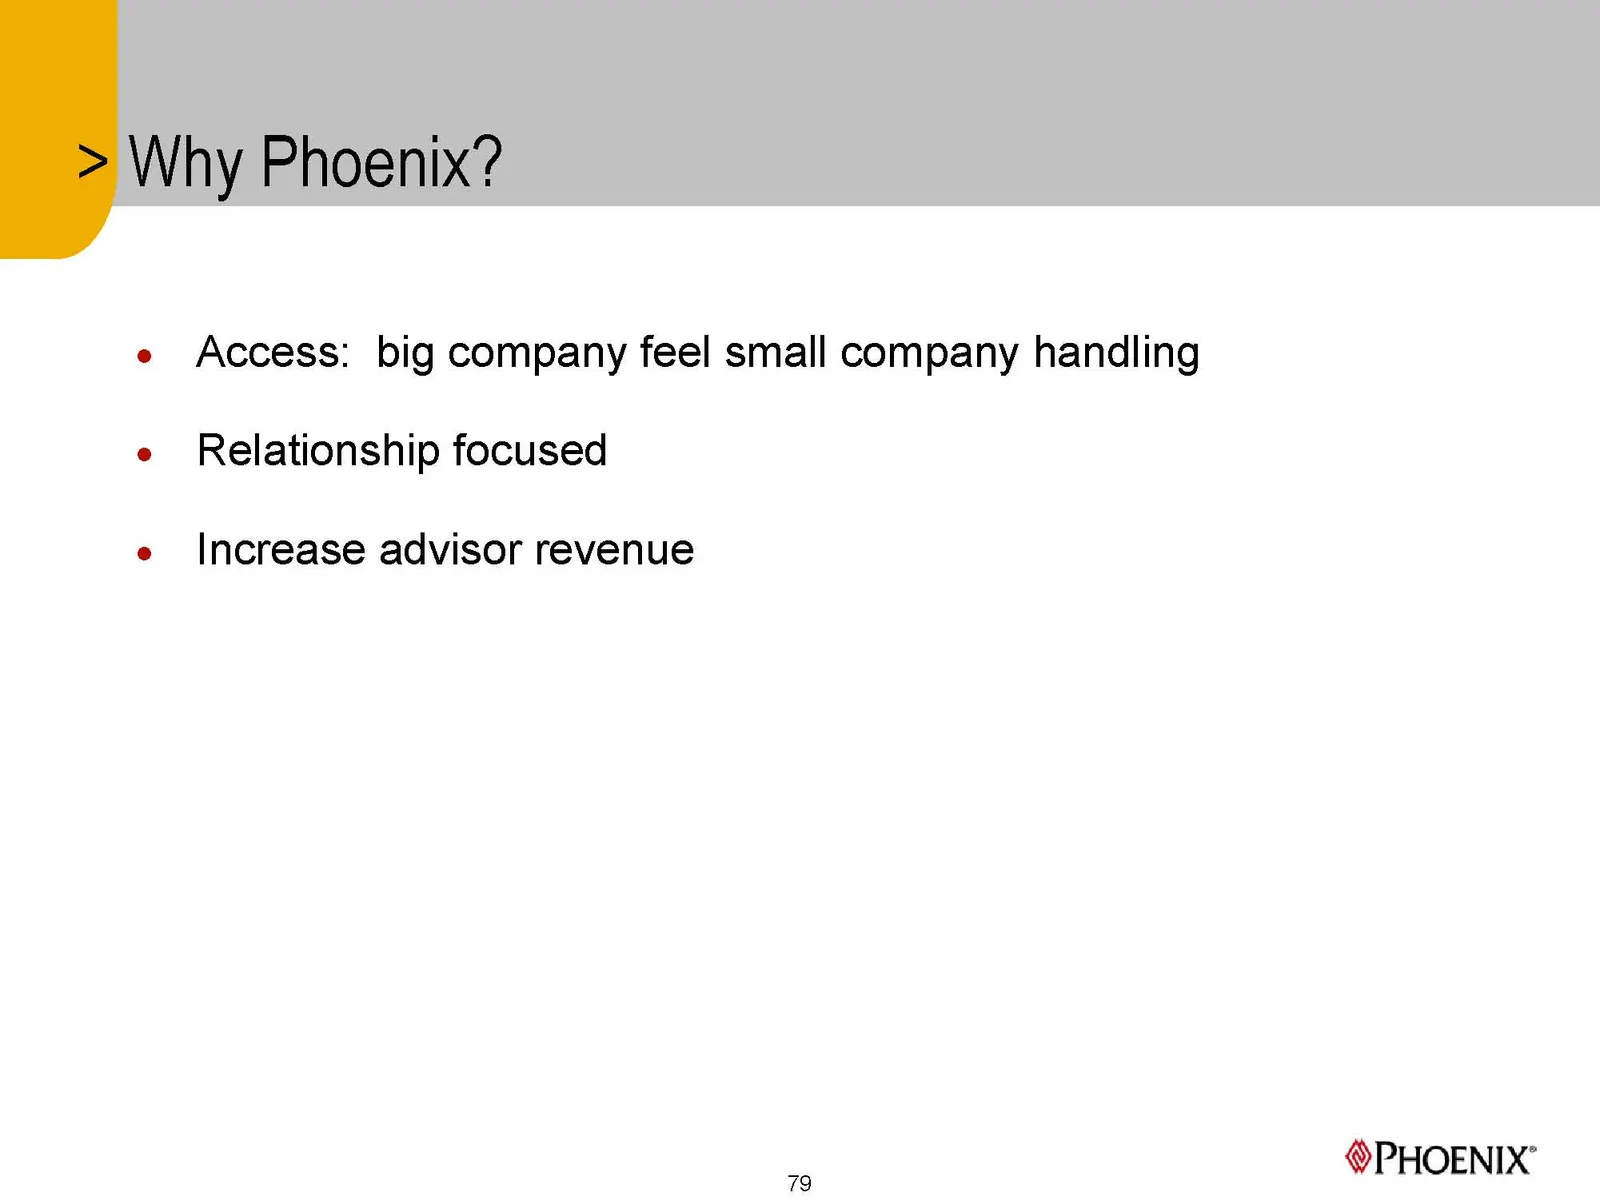
Slide 79: Access and relationship focus
e Access: big company feel small company handling e Relationship focused e Increase advisor revenue PHOENIX’ 79
Slide 80: Annuity Distribution
Annuity Distribution PHOENIX’
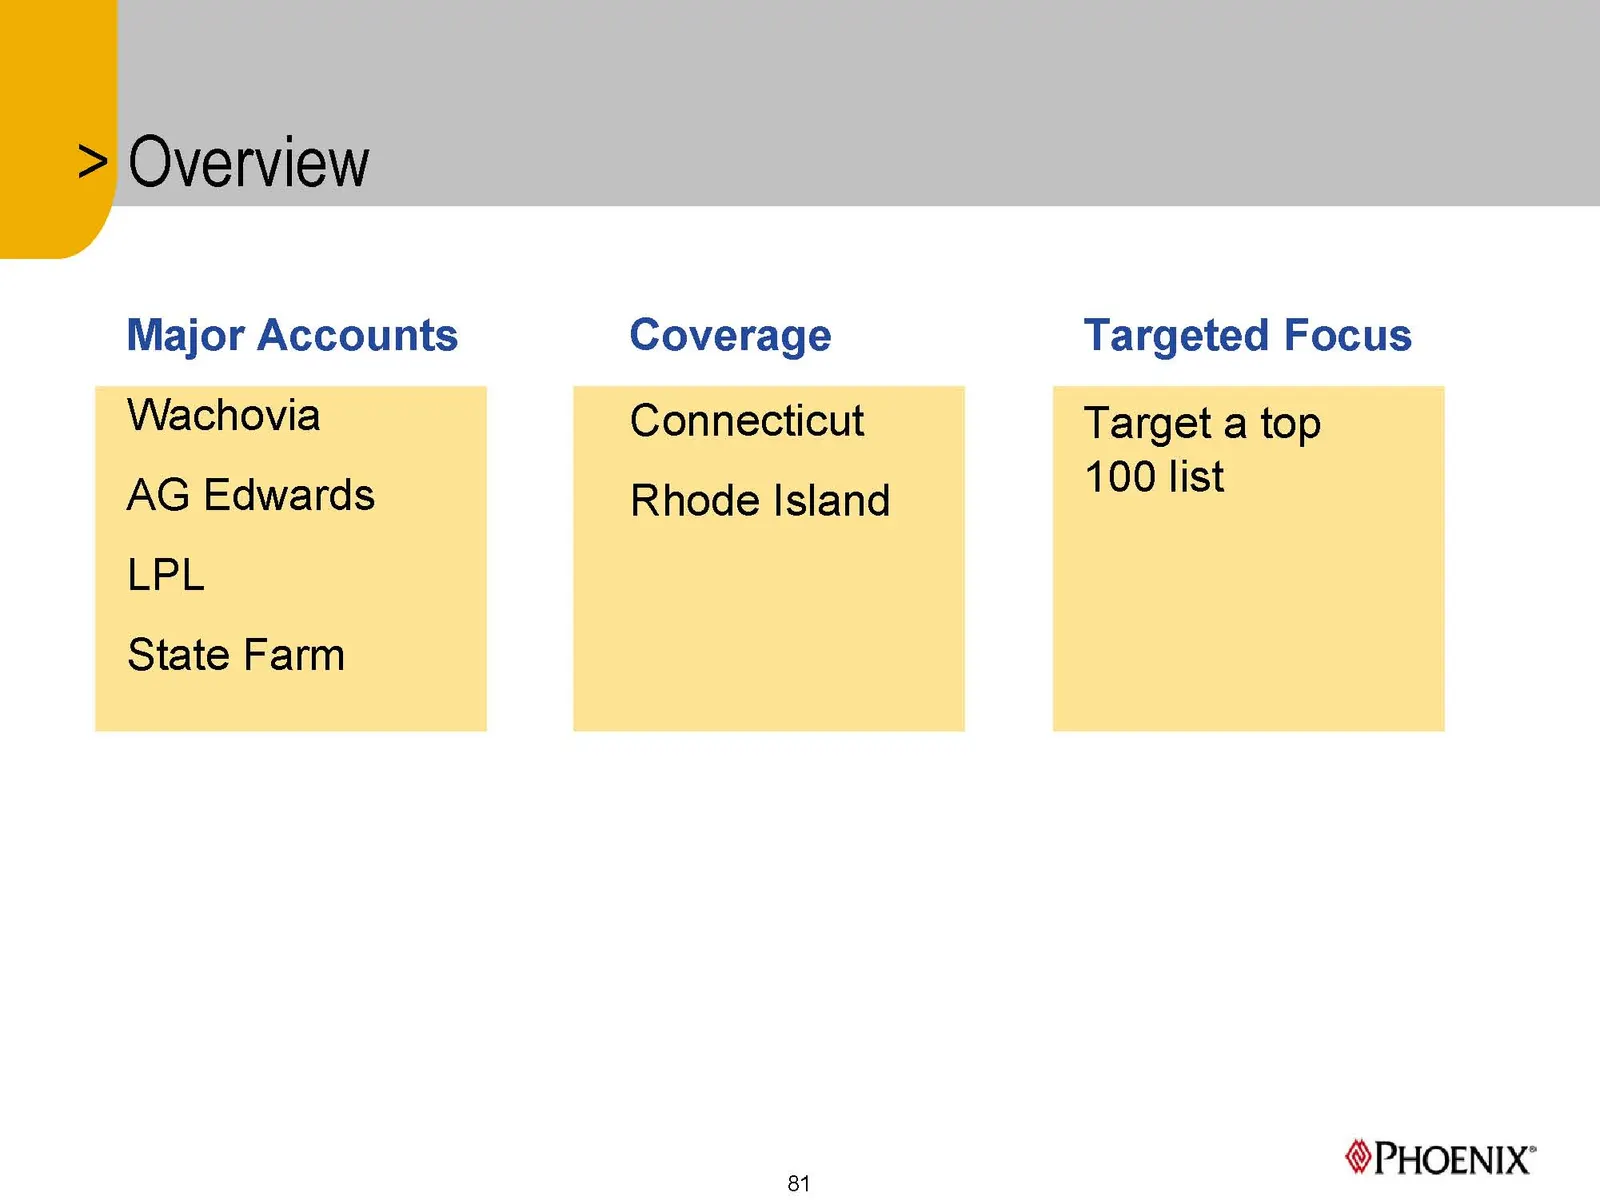
Slide 81: Overview
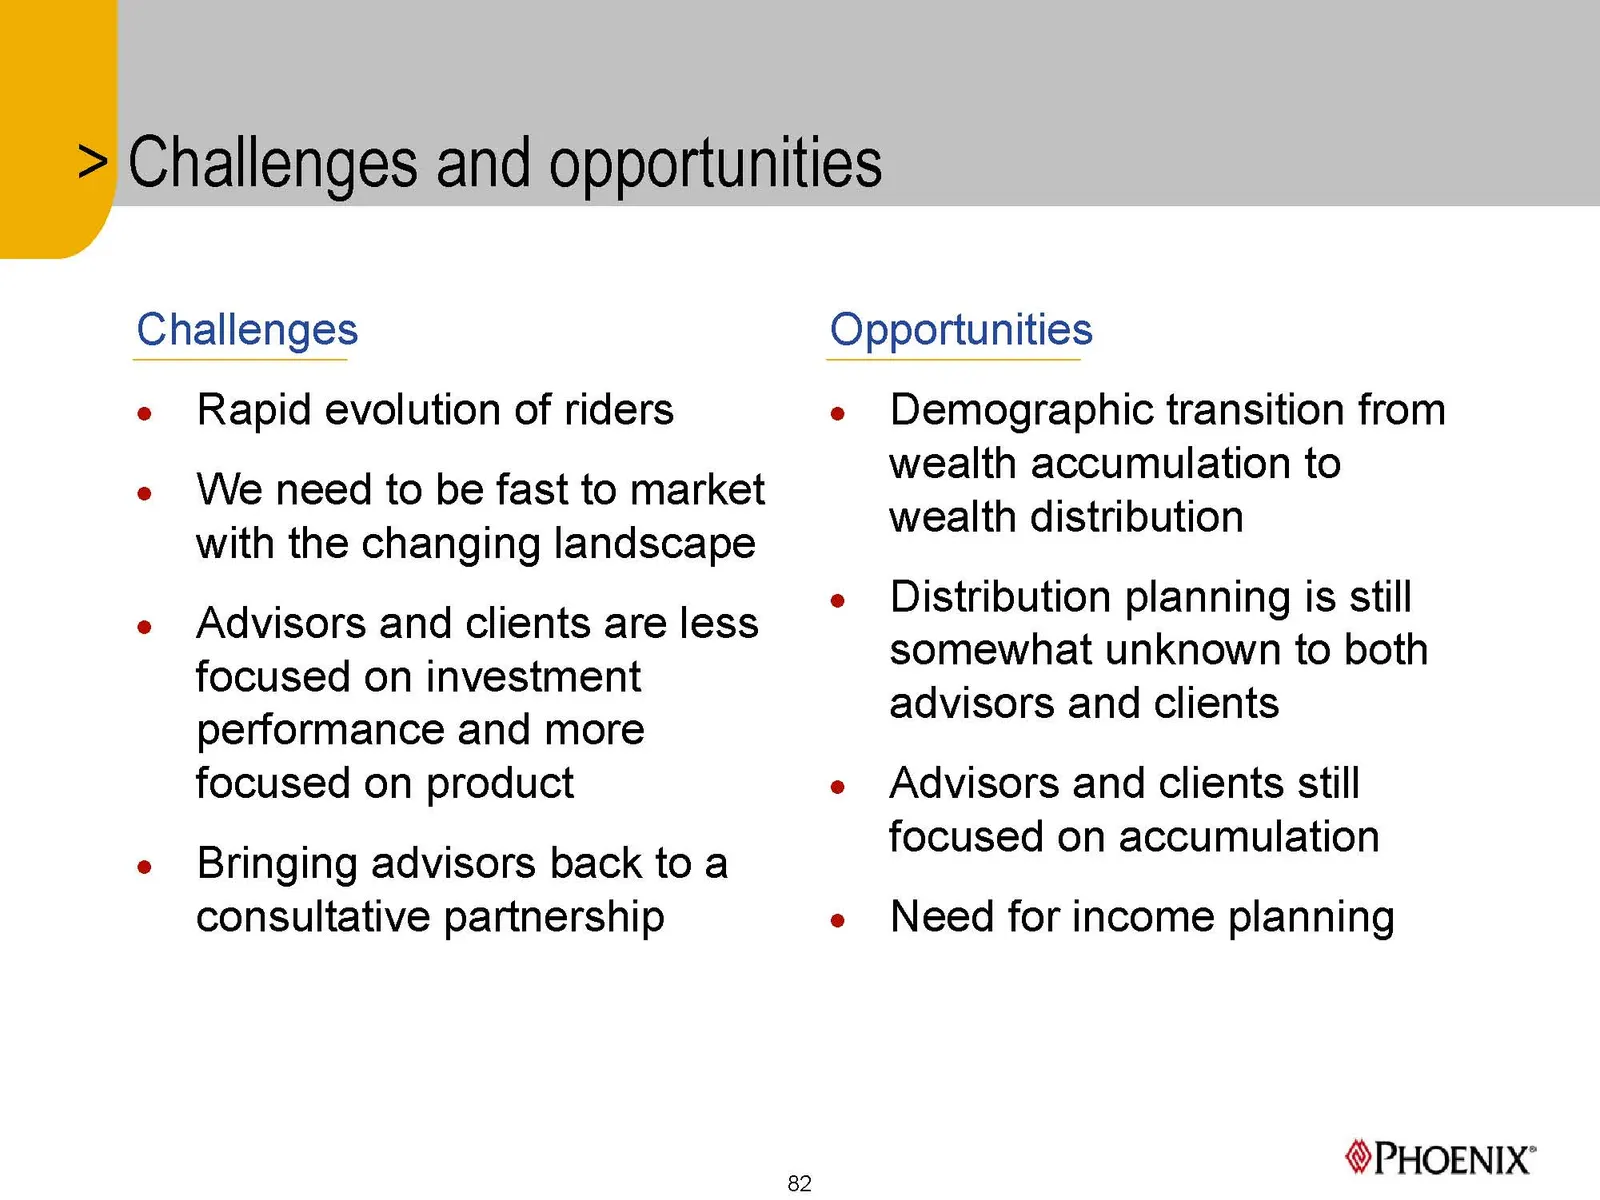
Slide 82: Challenges and opportunities
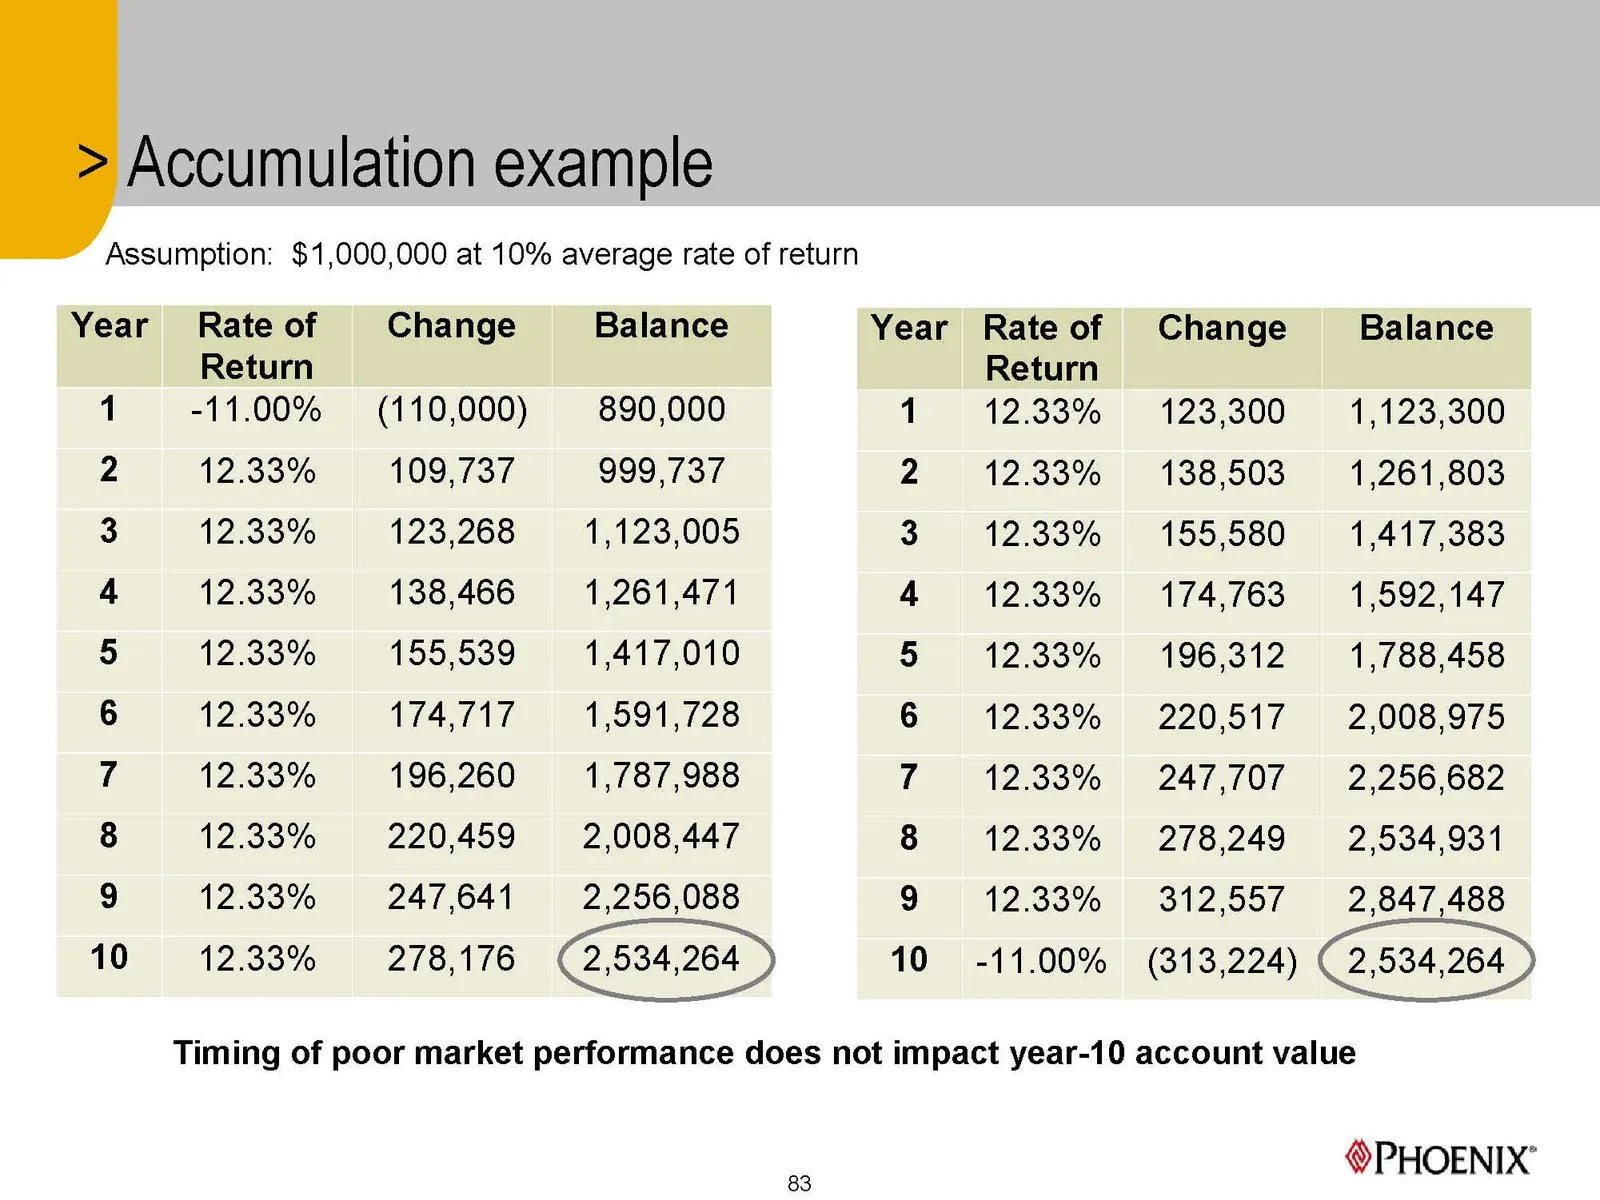
Slide 83: Accumulation example
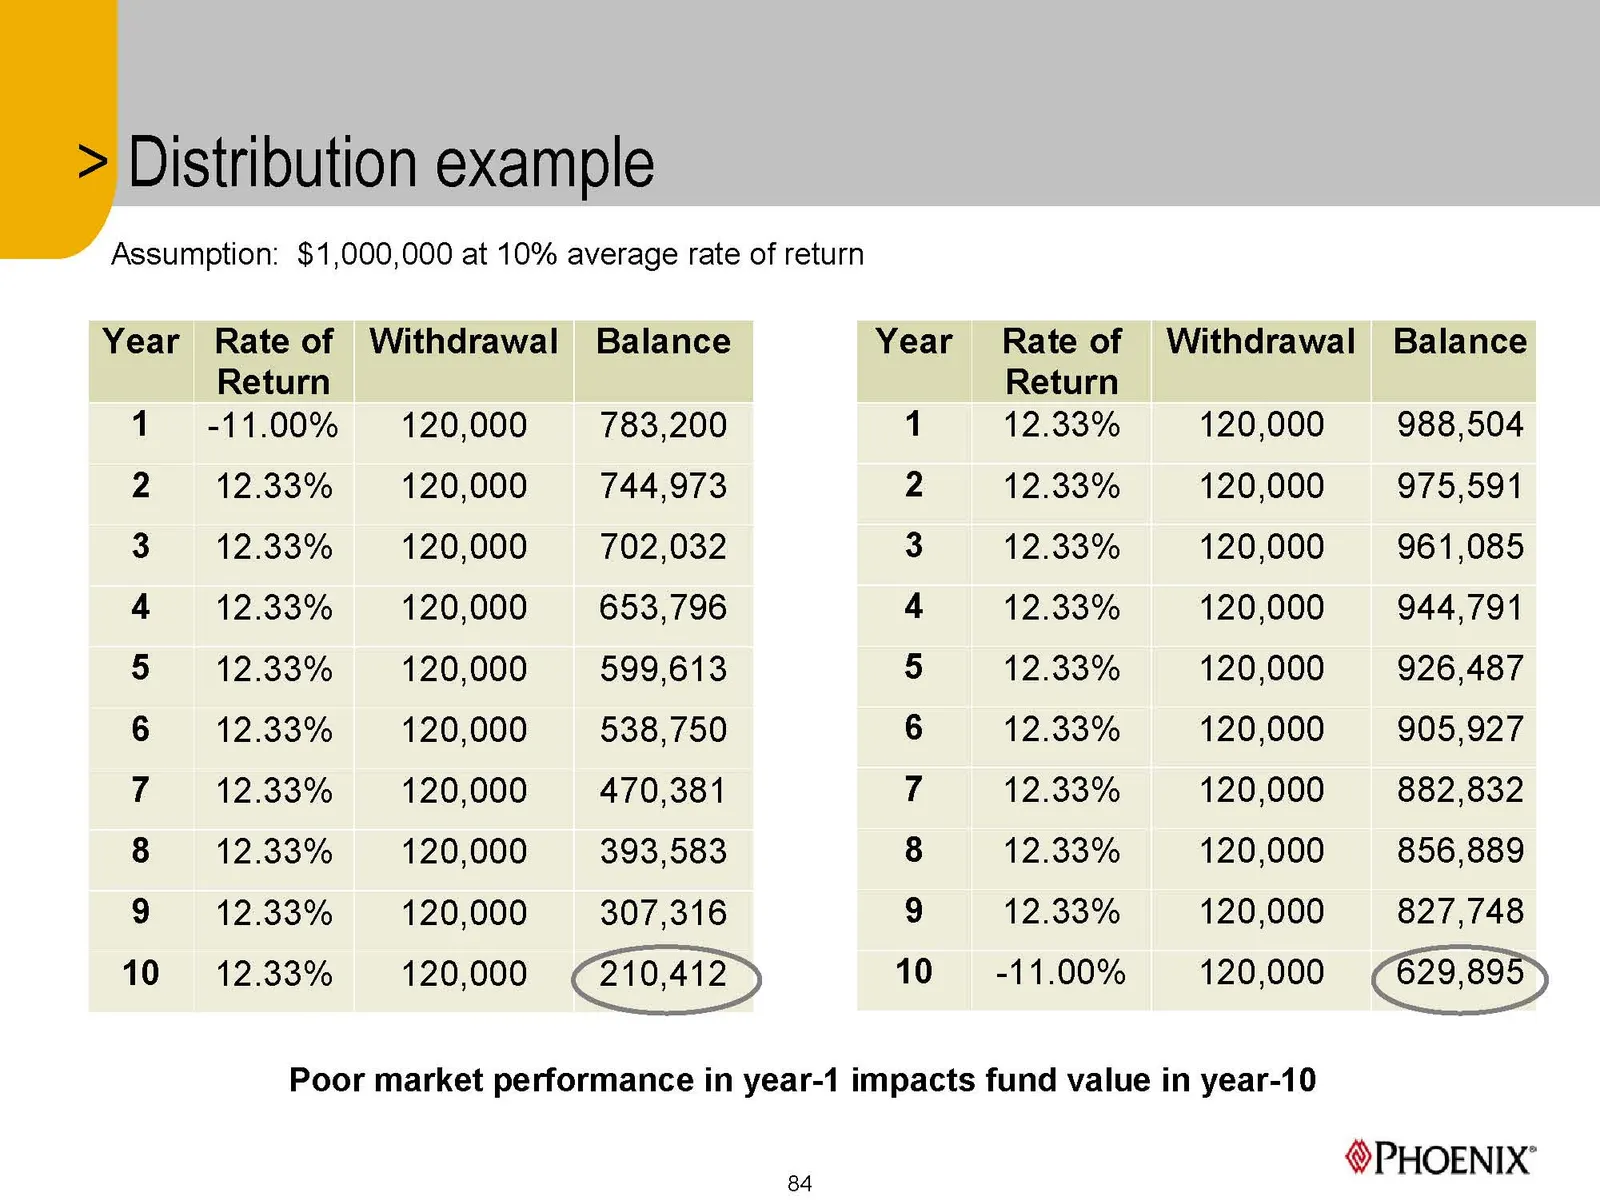
Slide 84: Distribution example
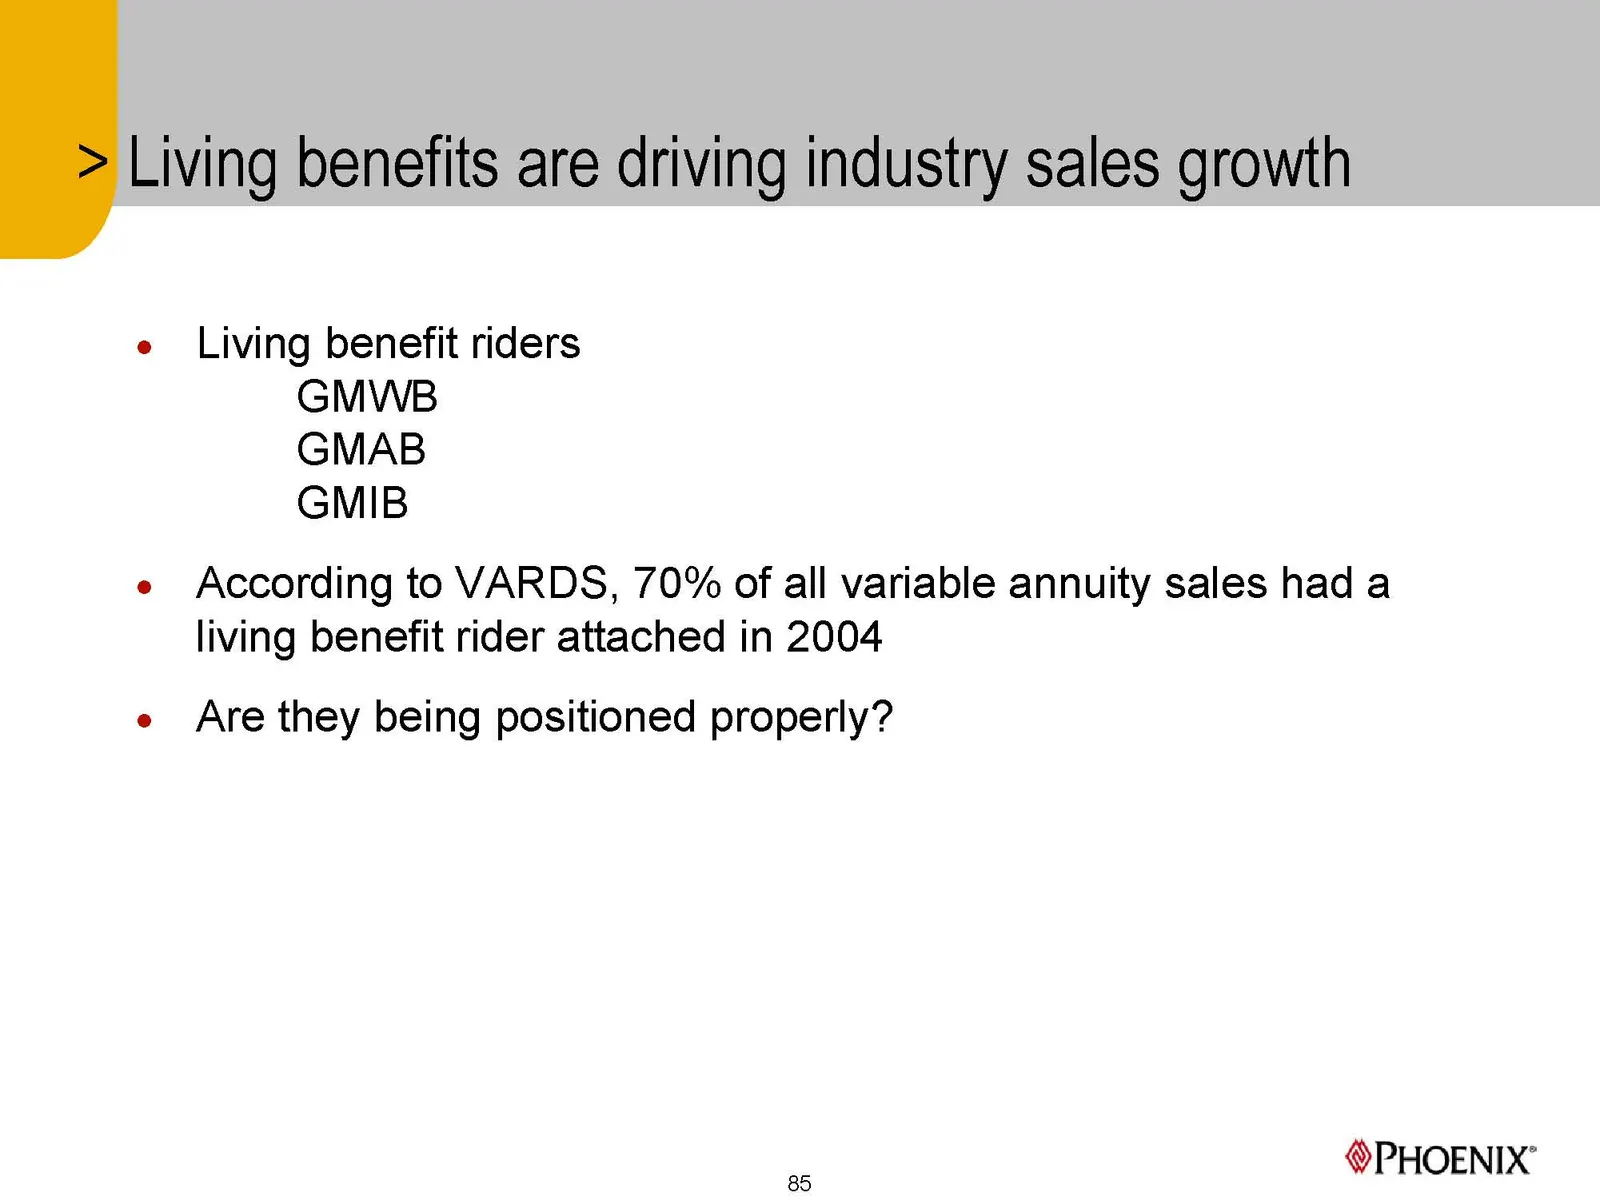
Slide 85: Living benefits are driving industry sales growth
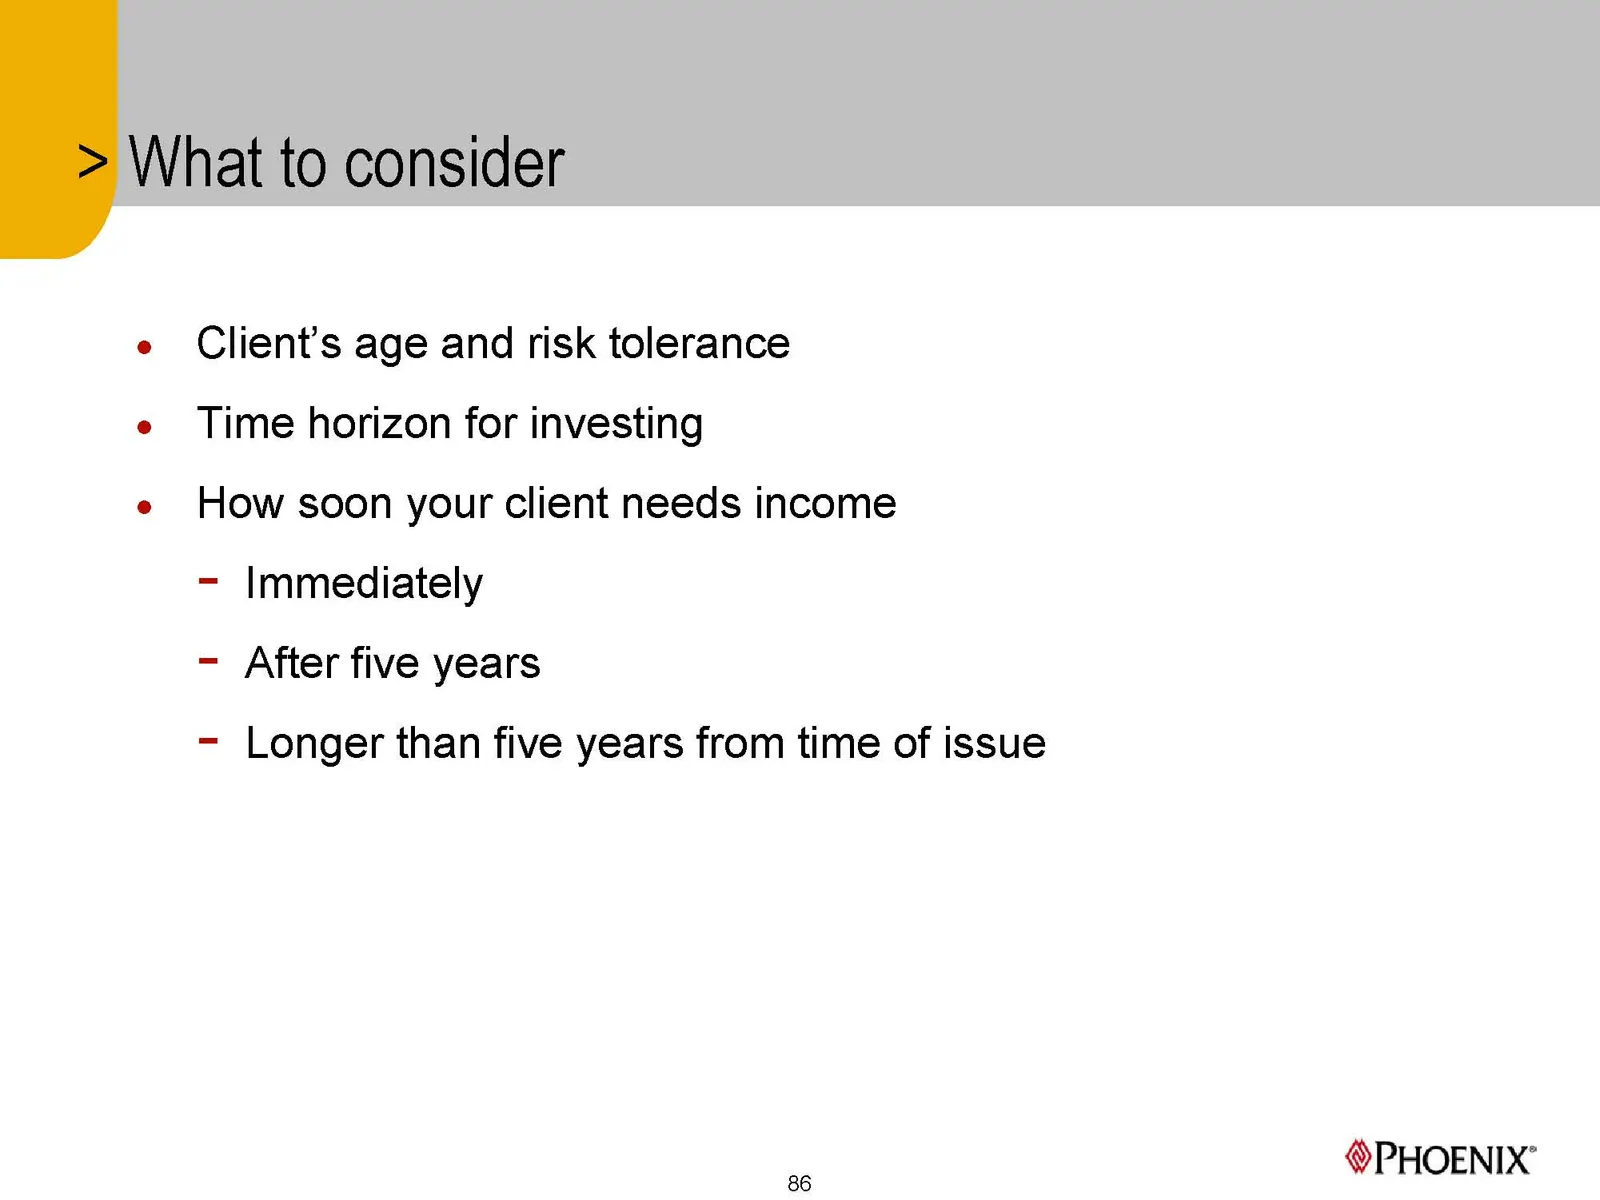
Slide 86: What to consider
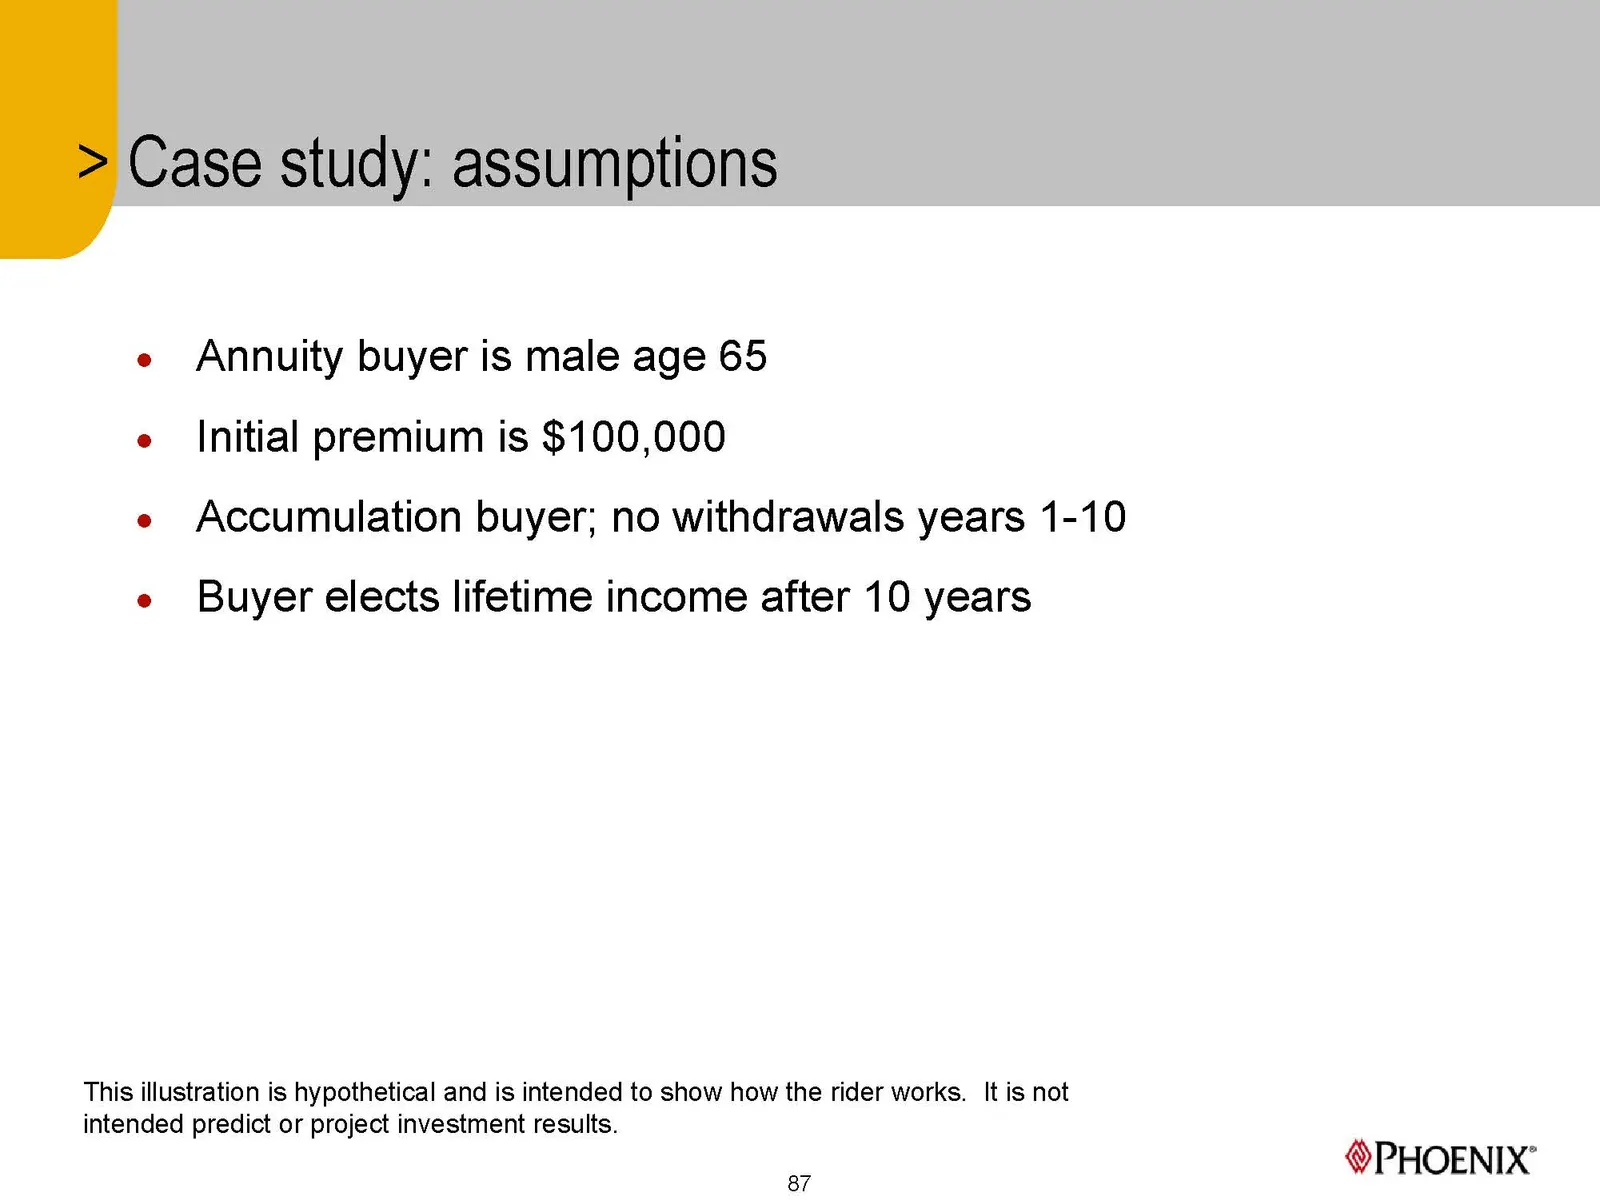
Slide 87: Case study: assumptions
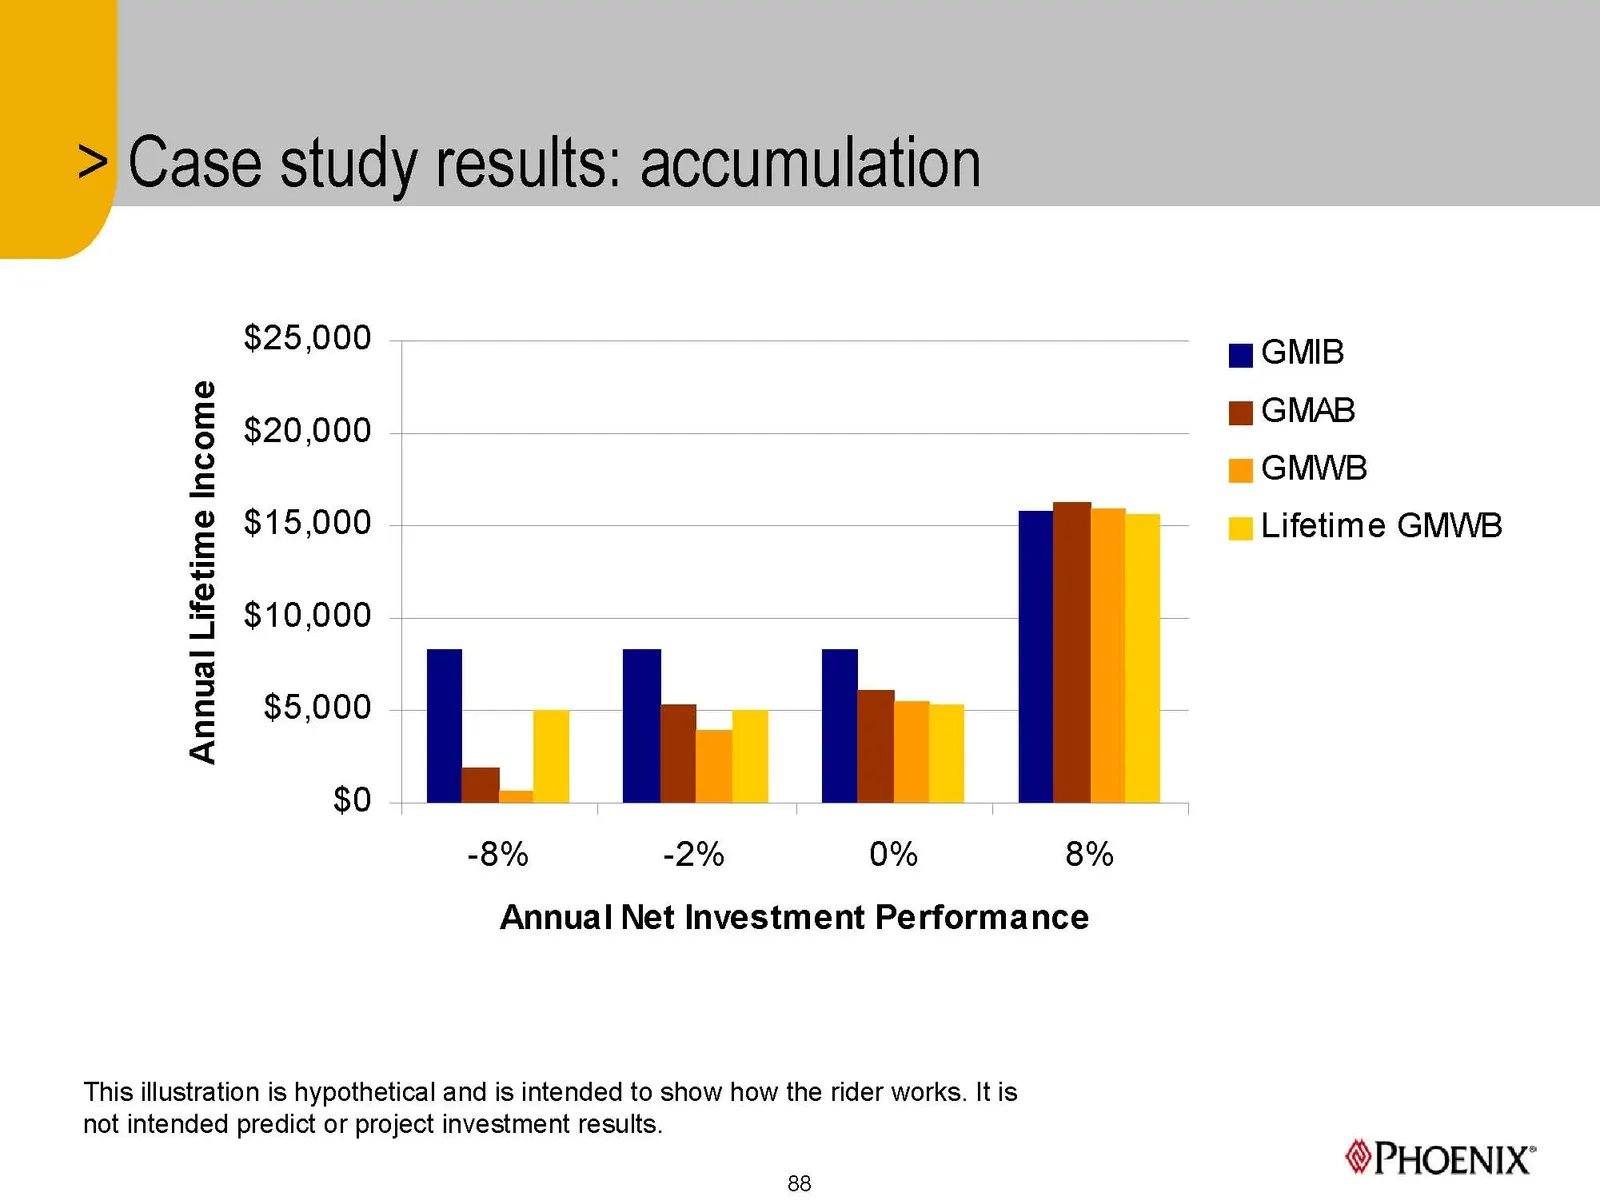
Slide 88: Case study results: accumulation
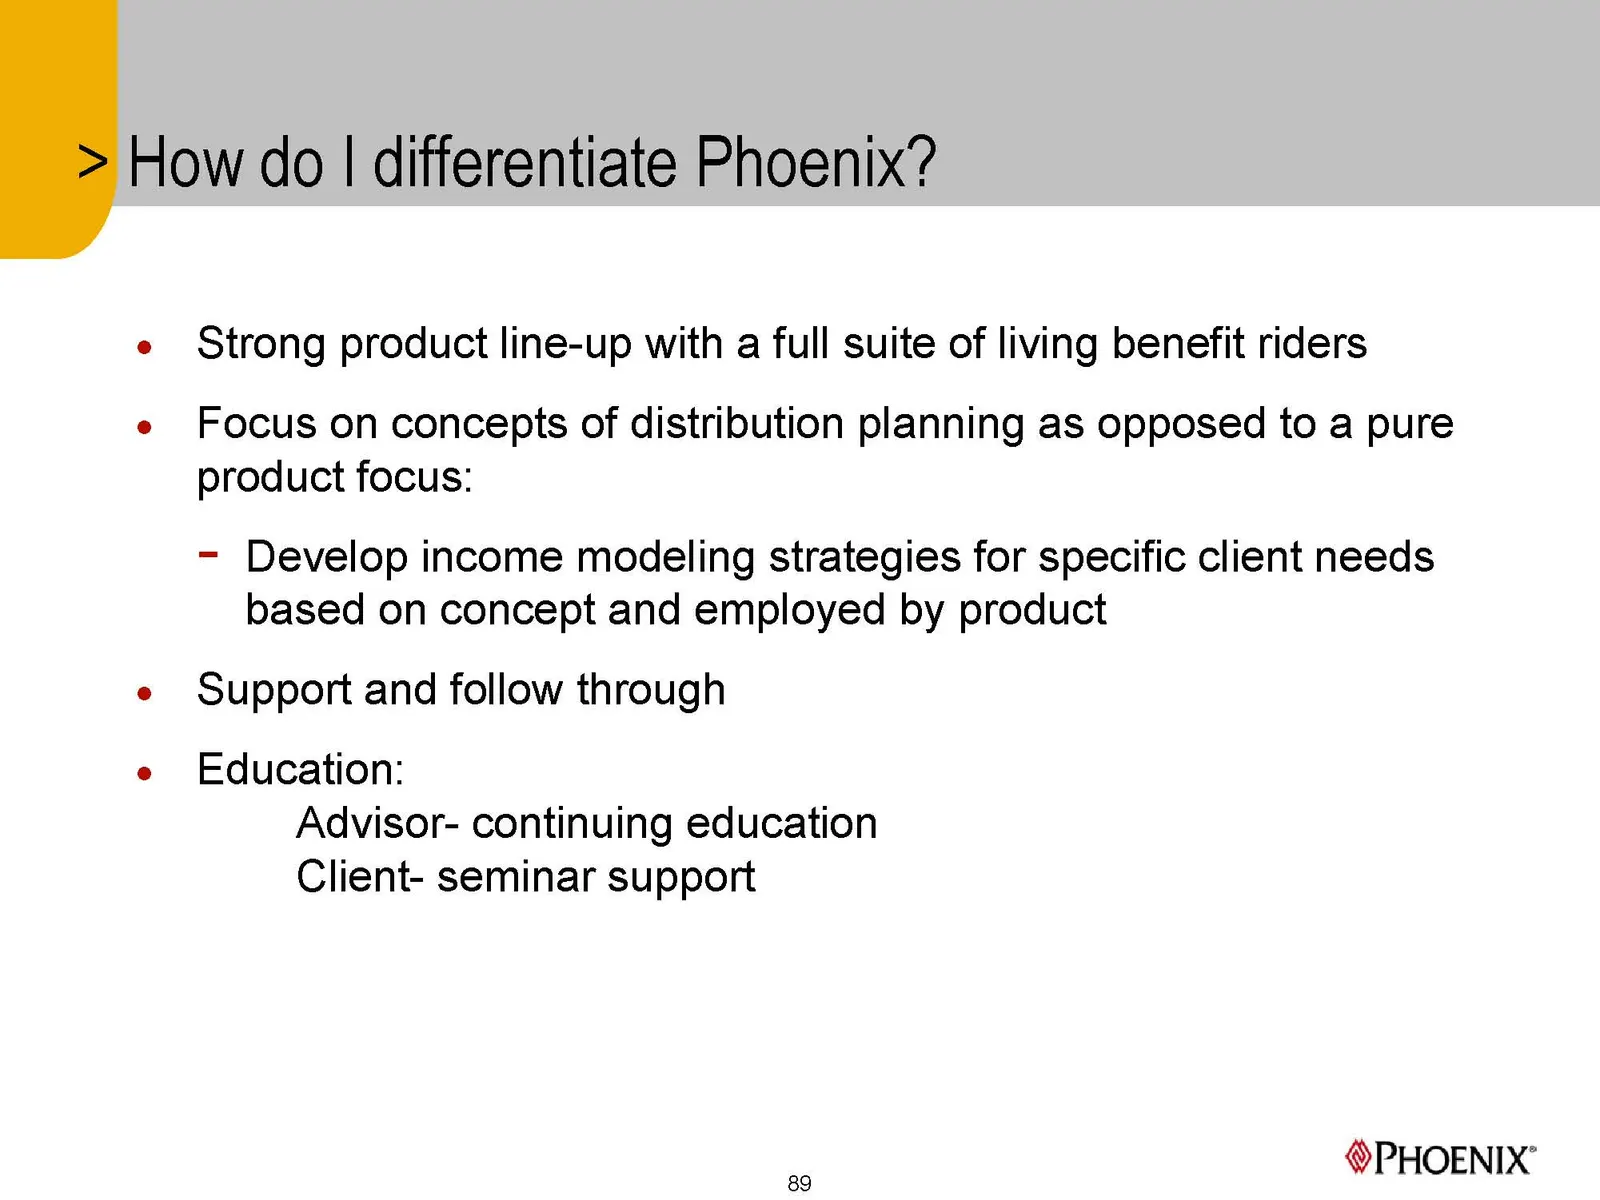
Slide 89: How do I differentiate Phoenix?
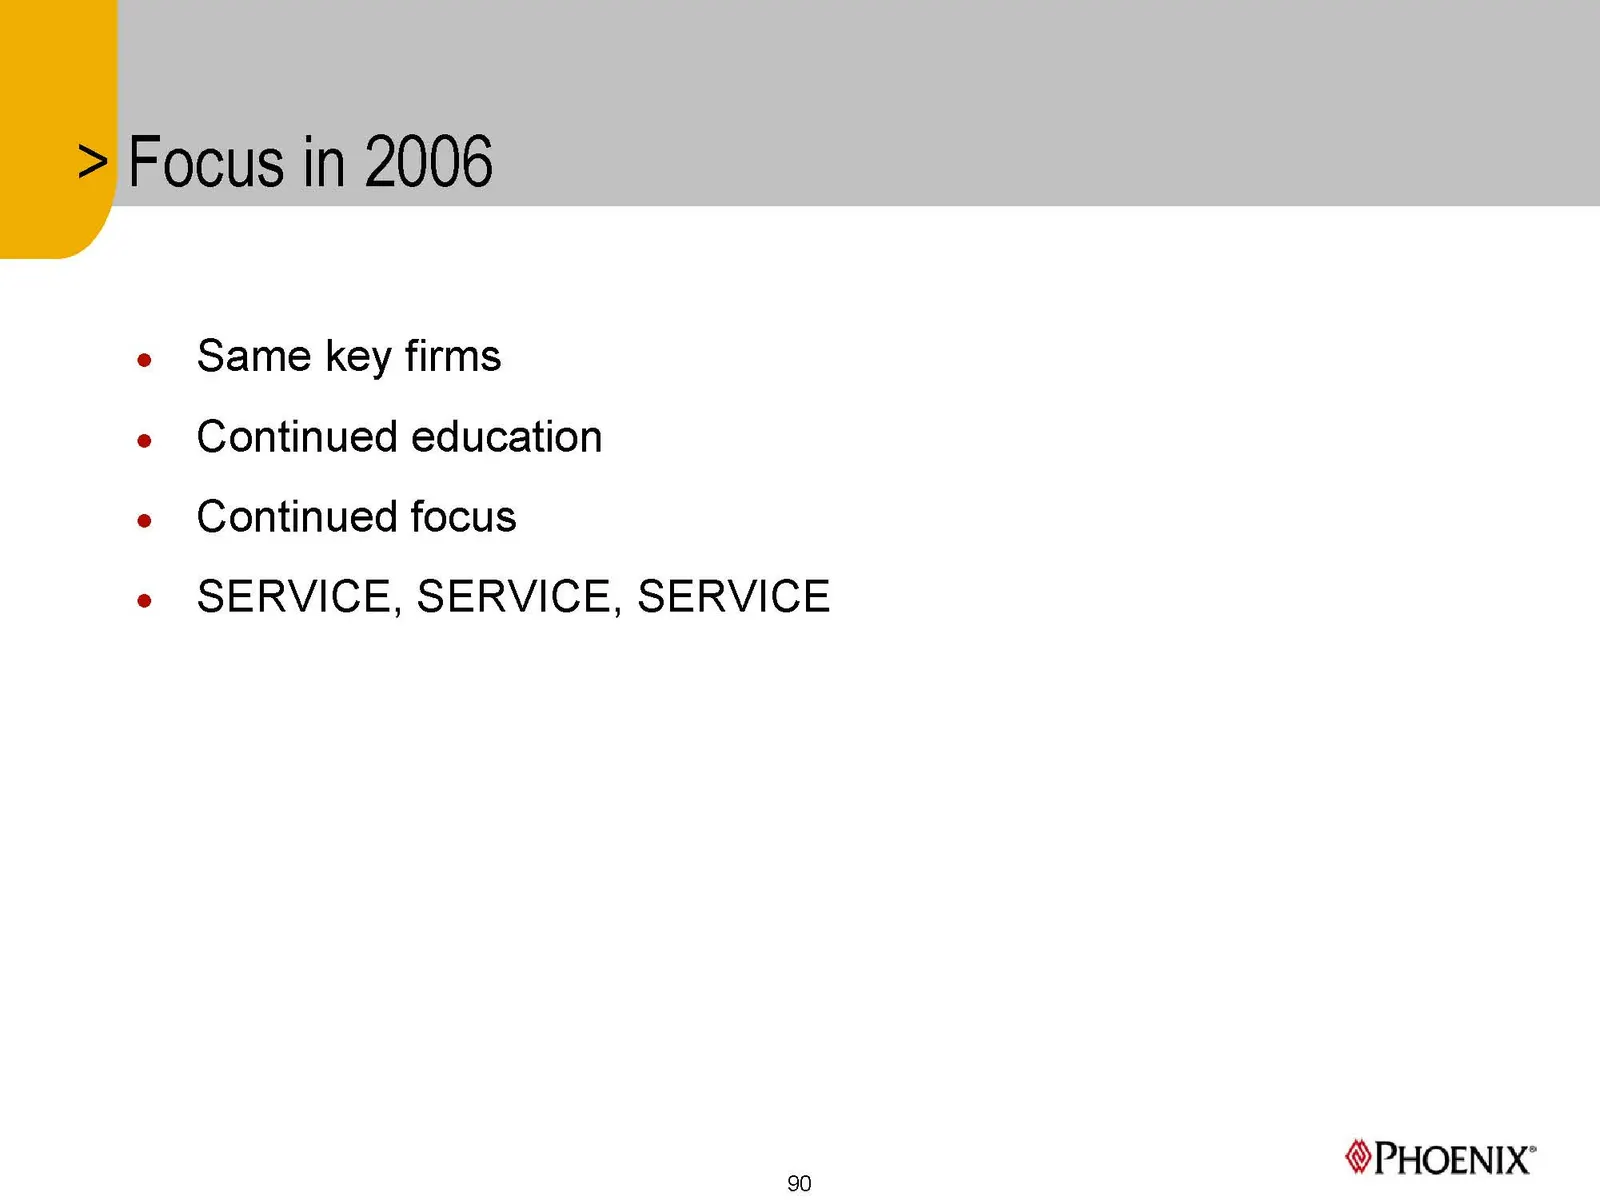
Slide 90: Focus in 2006
Slide 91: Asset Management Distribution
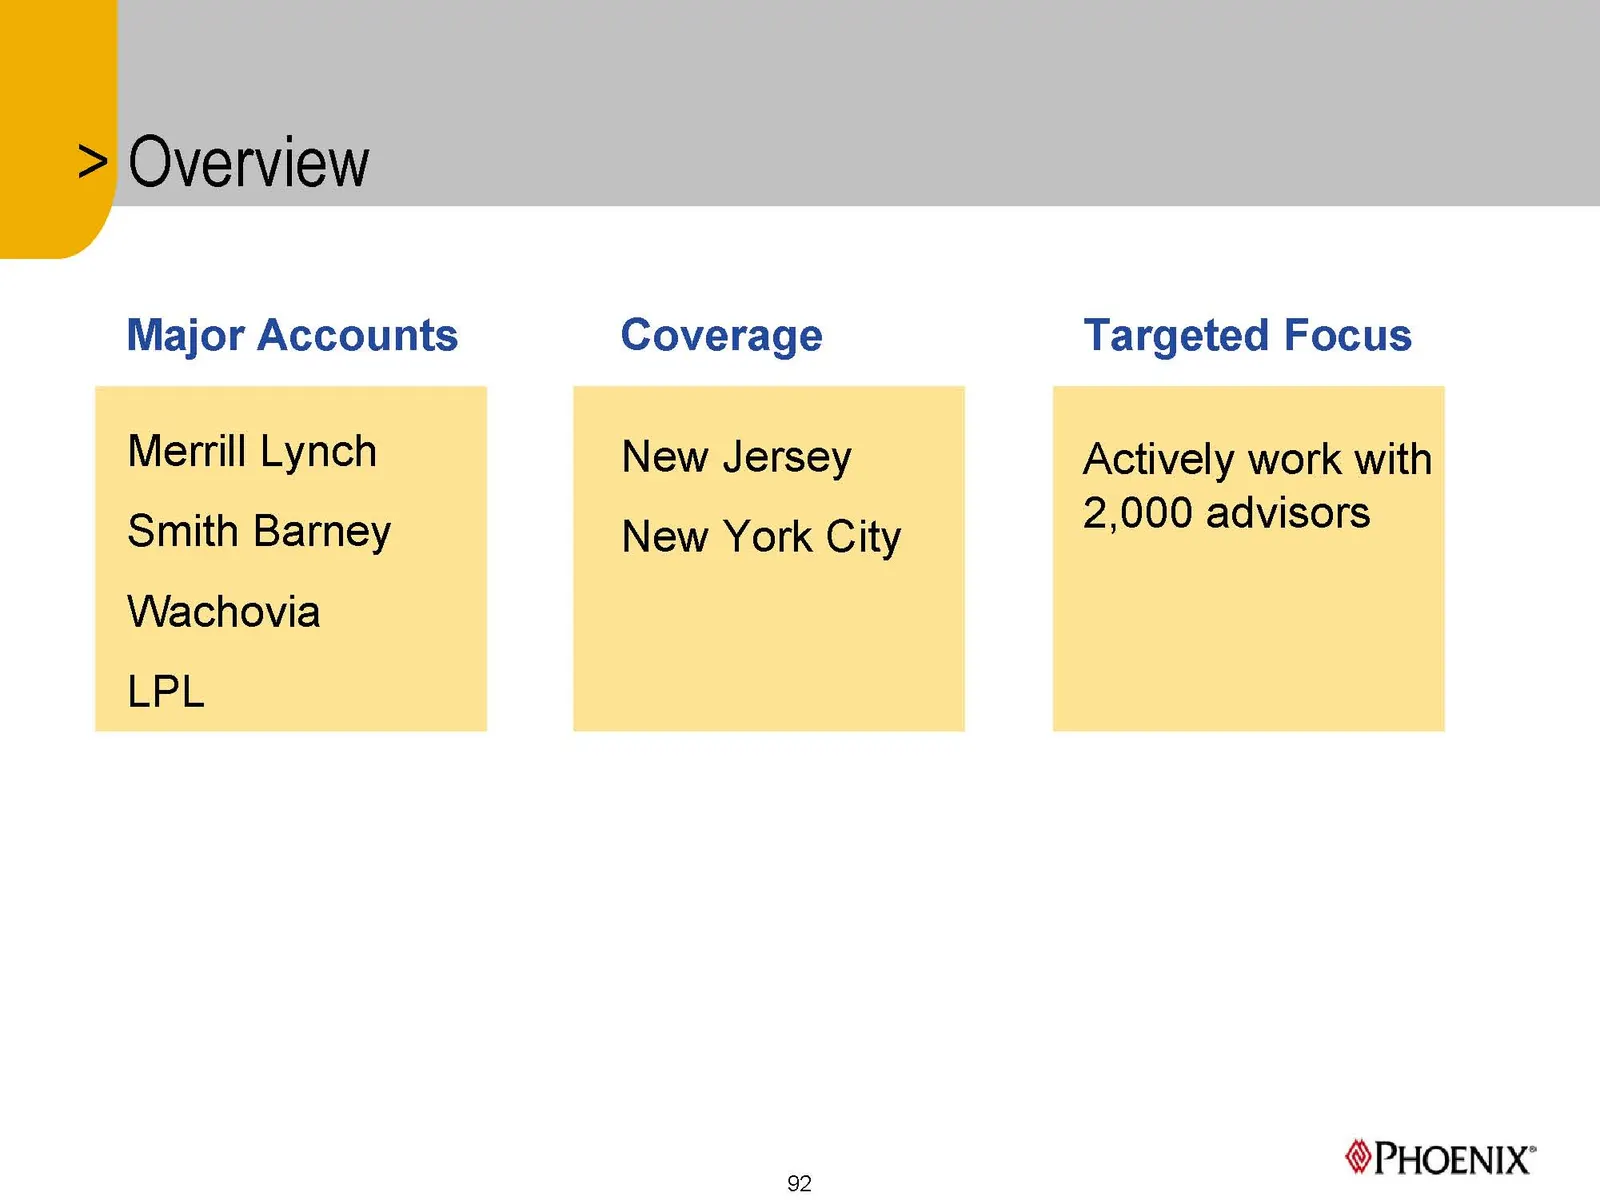
Slide 92: Overview
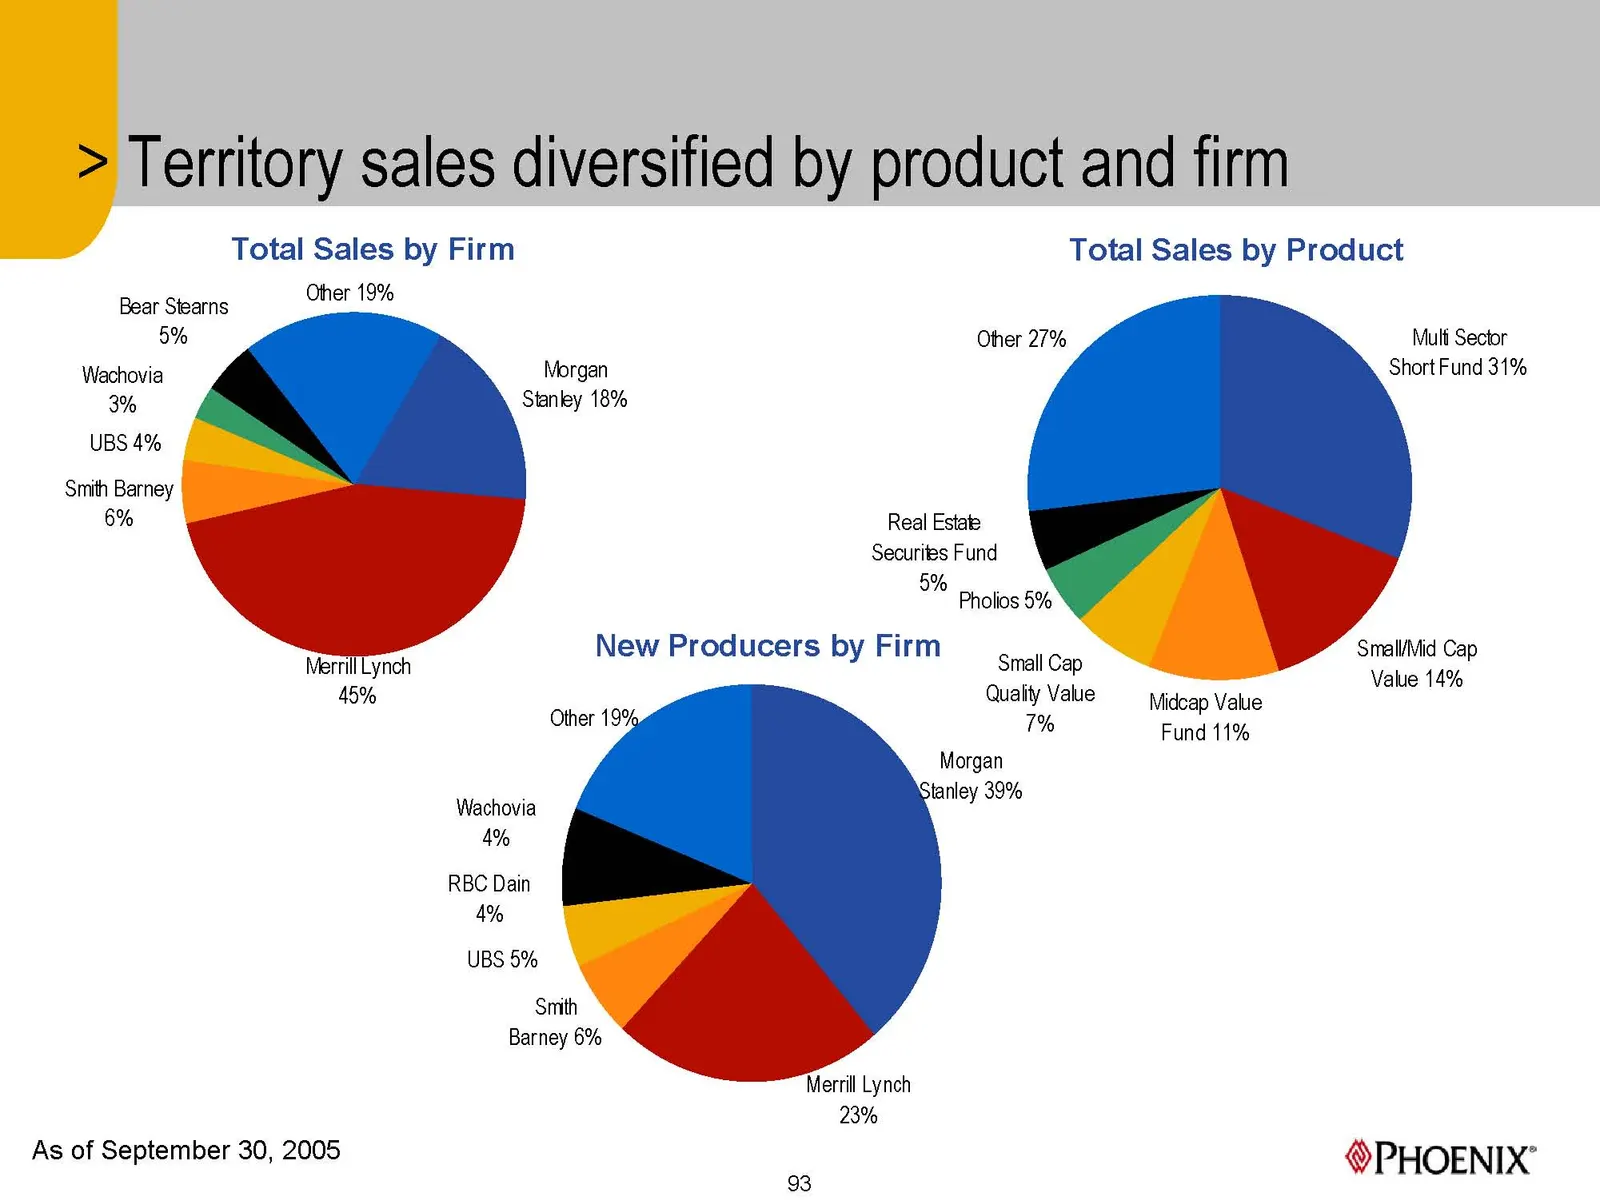
Slide 93: Territory sales diversified by product and firm
Slide 94: Challenges of selling financial products
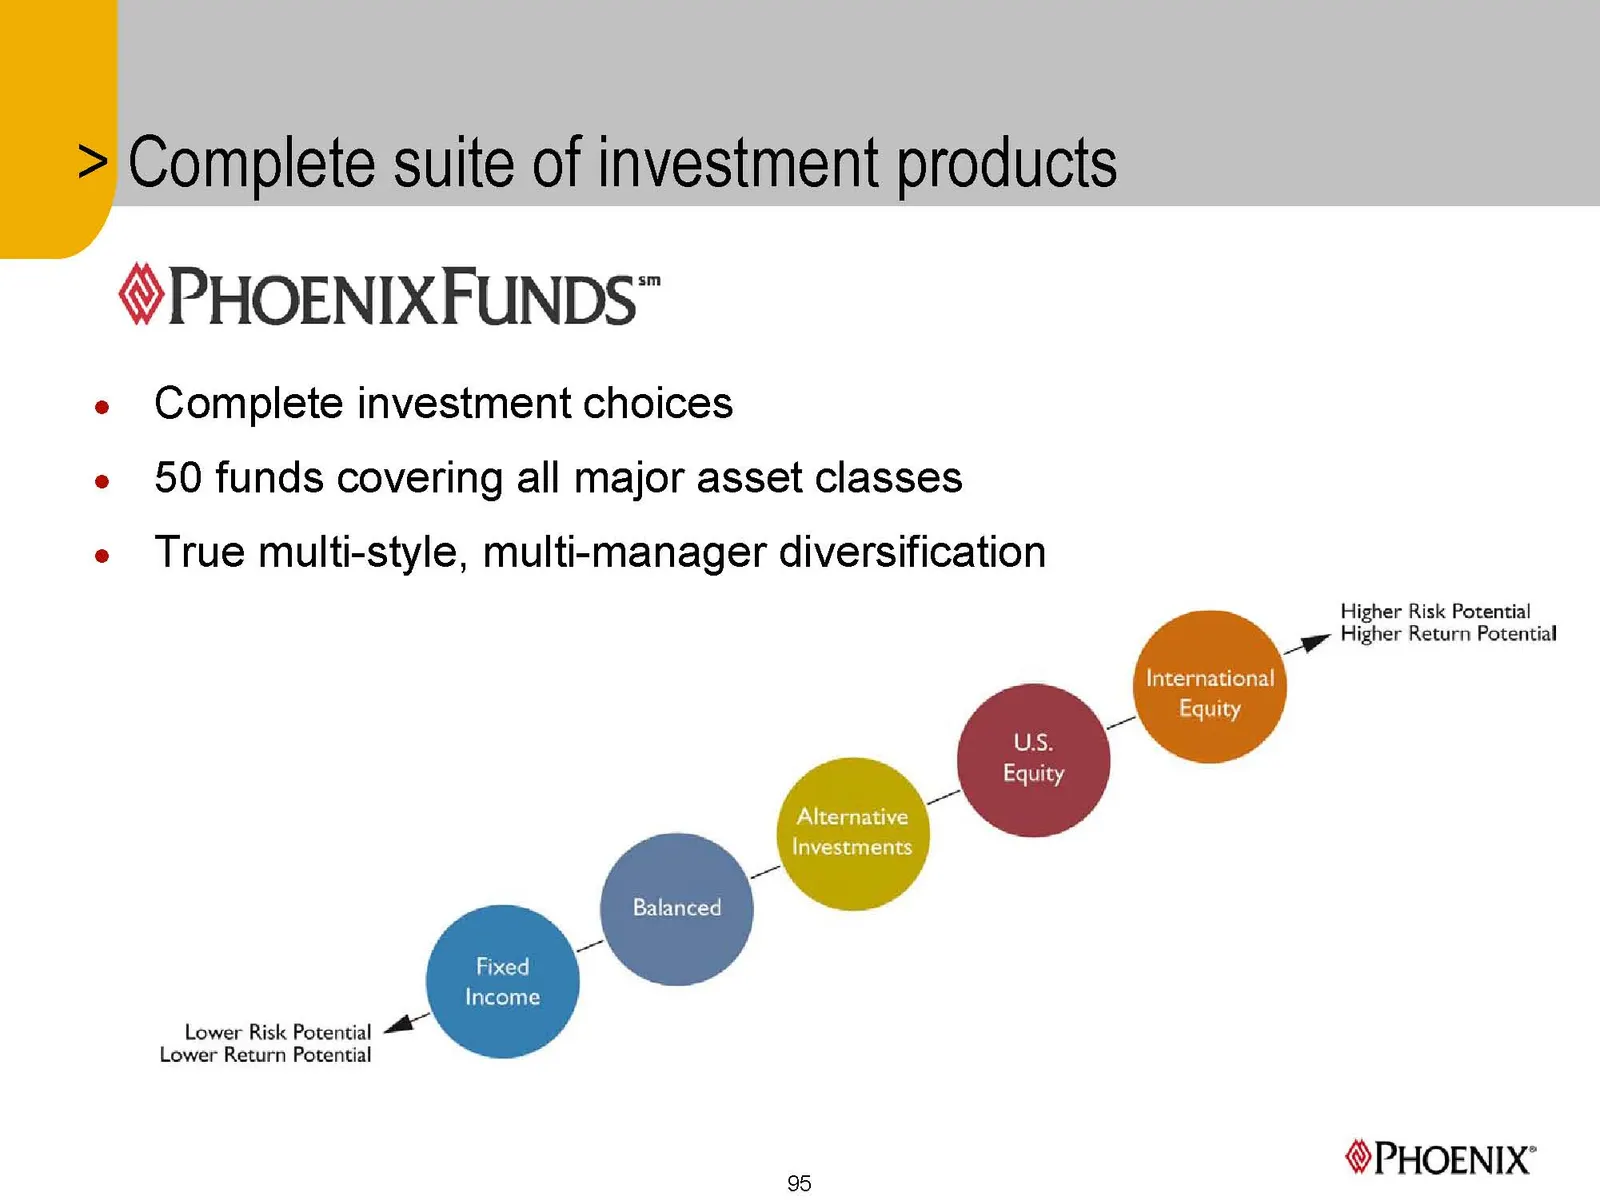
Slide 95: Complete suite of investment products
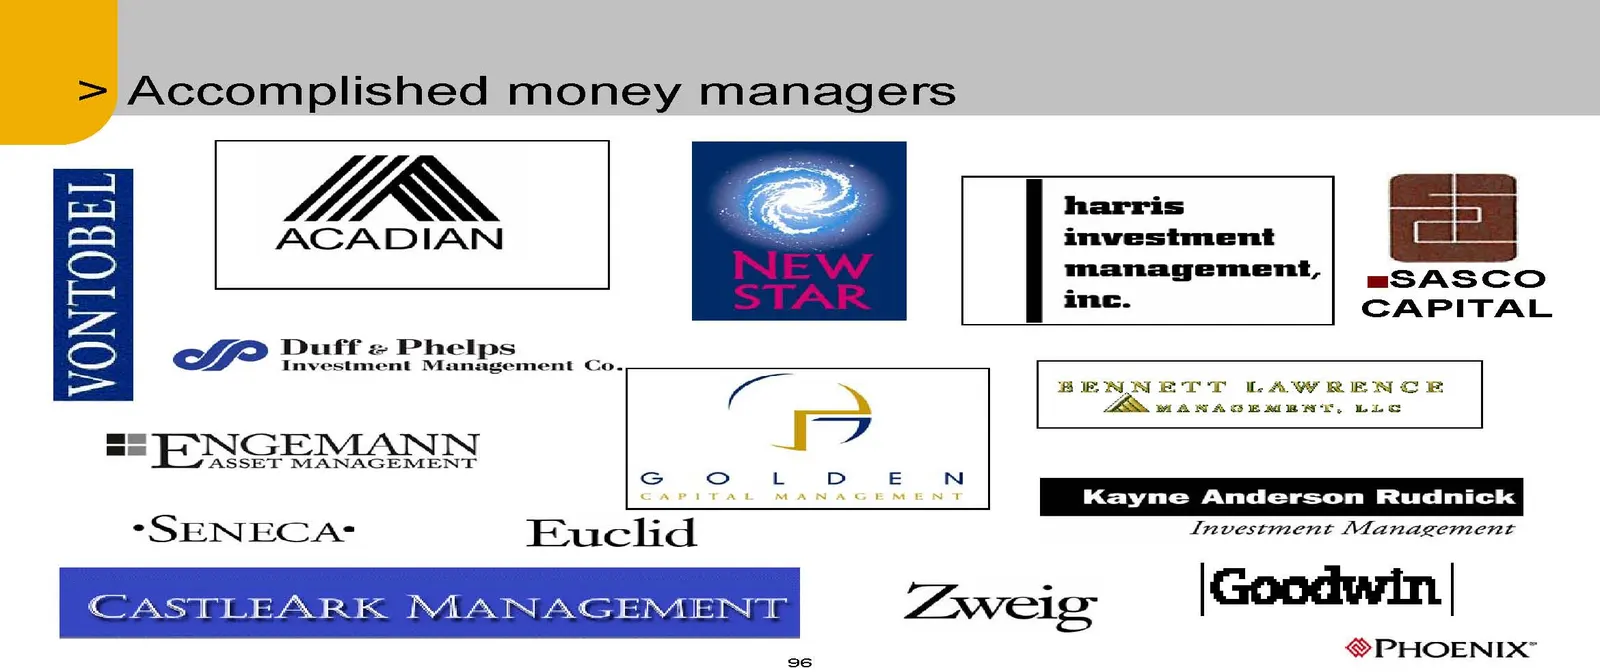
Slide 96: Accomplished money managers
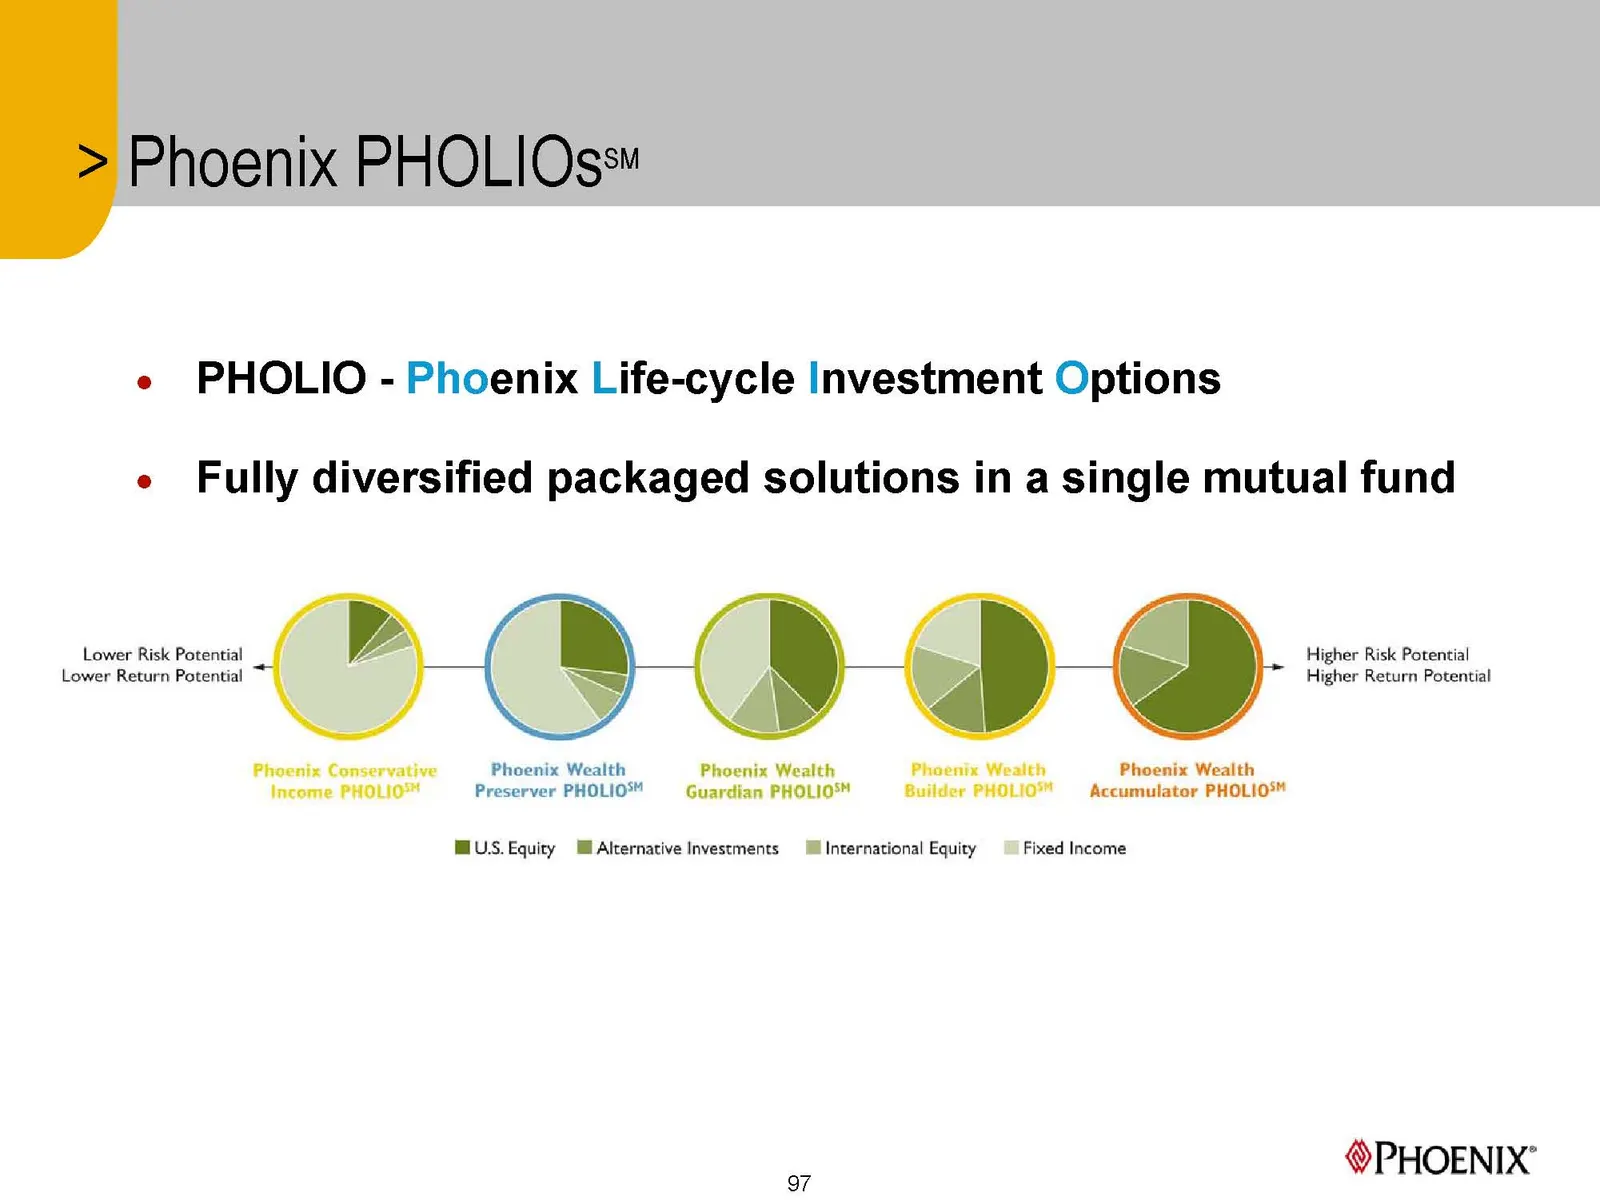
Slide 97: Phoenix PHOLIOs
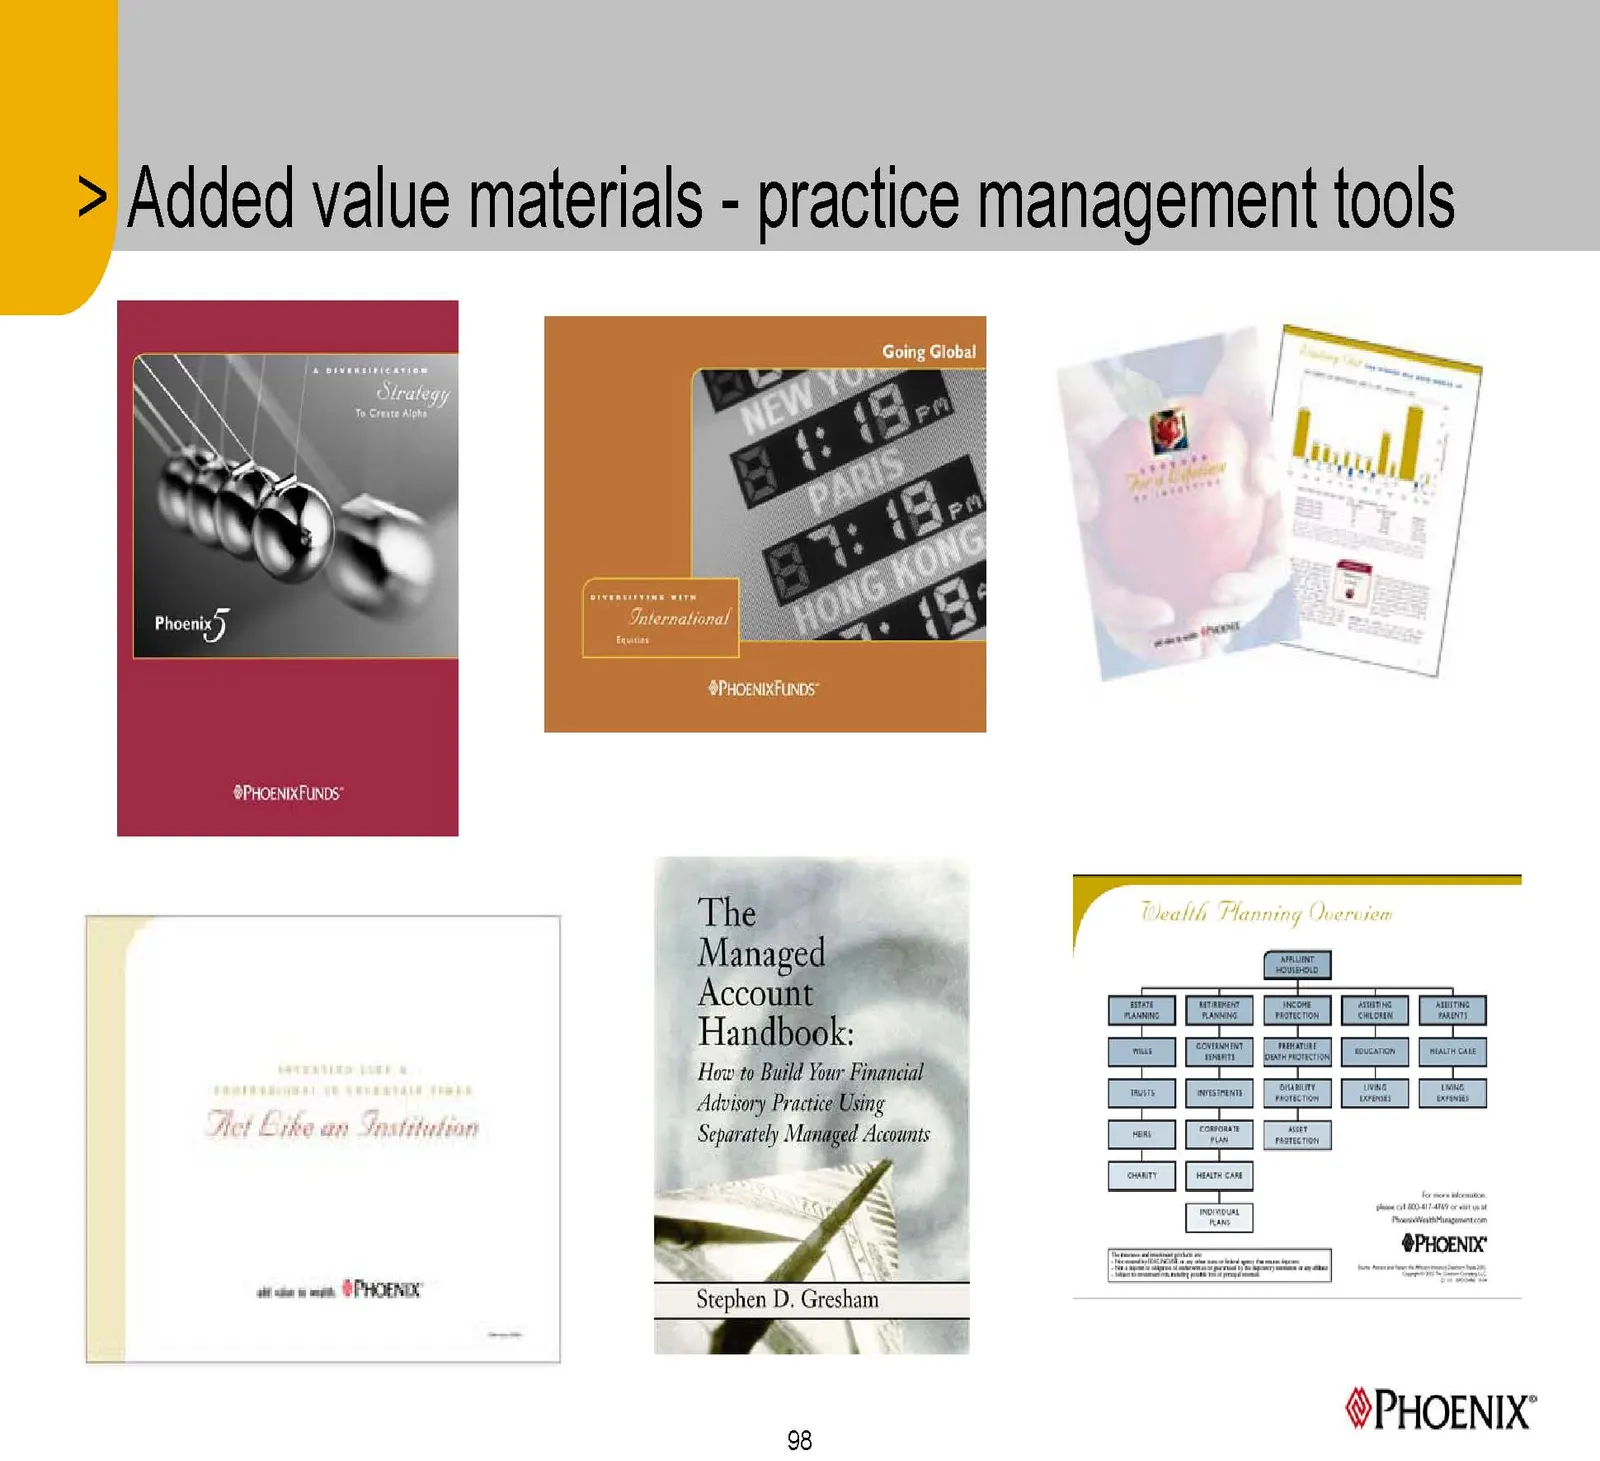
Slide 98: Added value materials - practice management tools
Slide 99: Partner of Choice Distribution - Wholesaler Panel
Slide 100: Financial Review
Slide 101: Overview
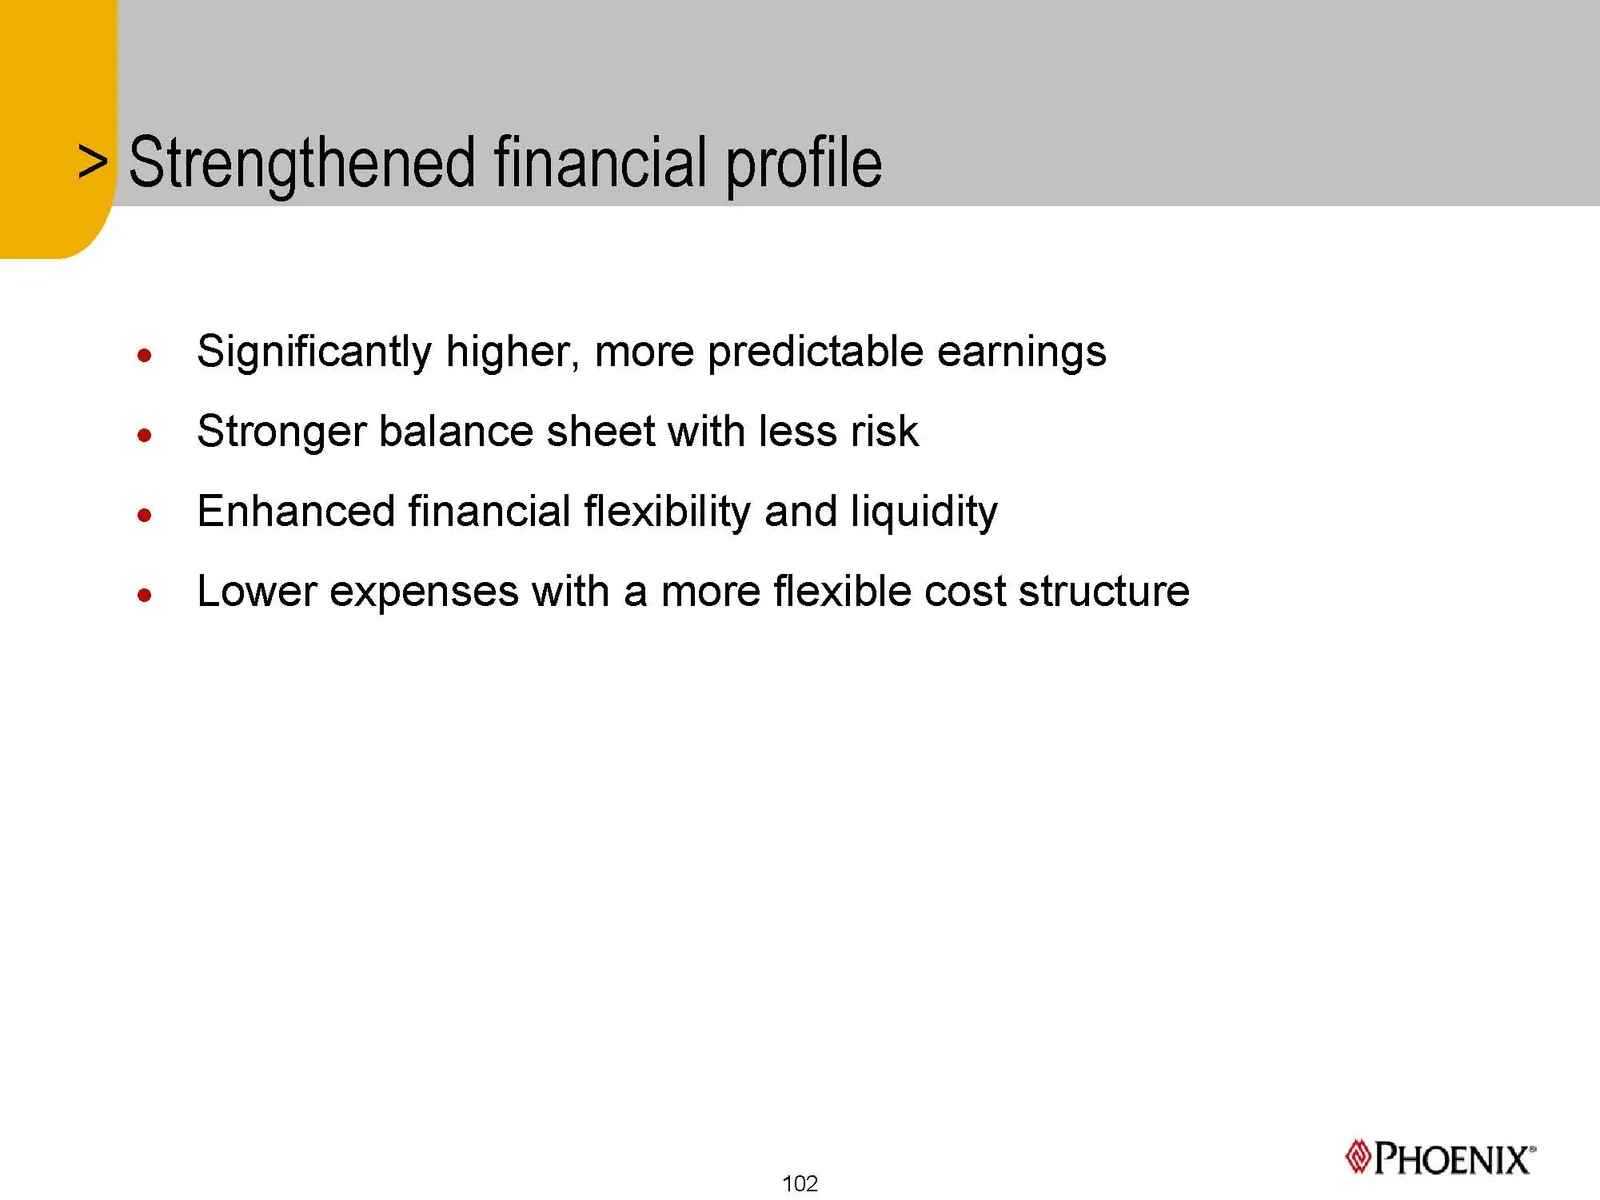
Slide 102: Strengthened financial profile
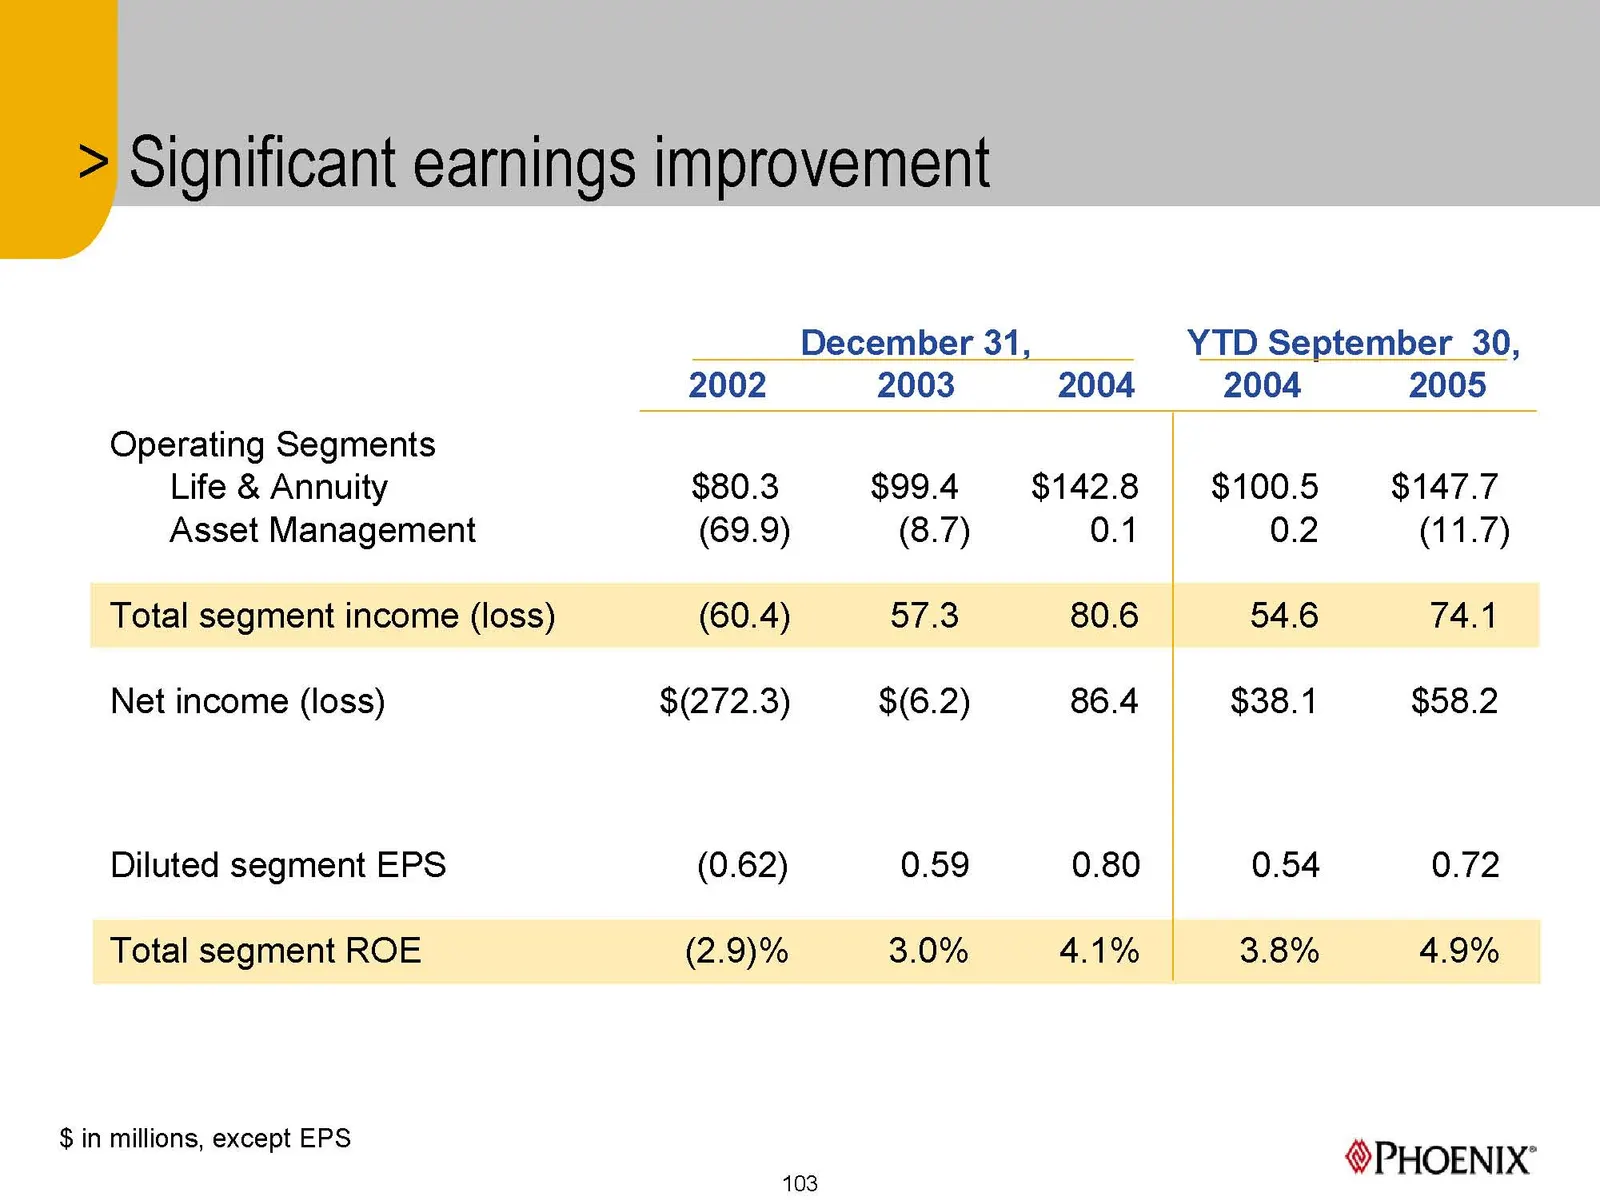
Slide 103: Significant earnings improvement
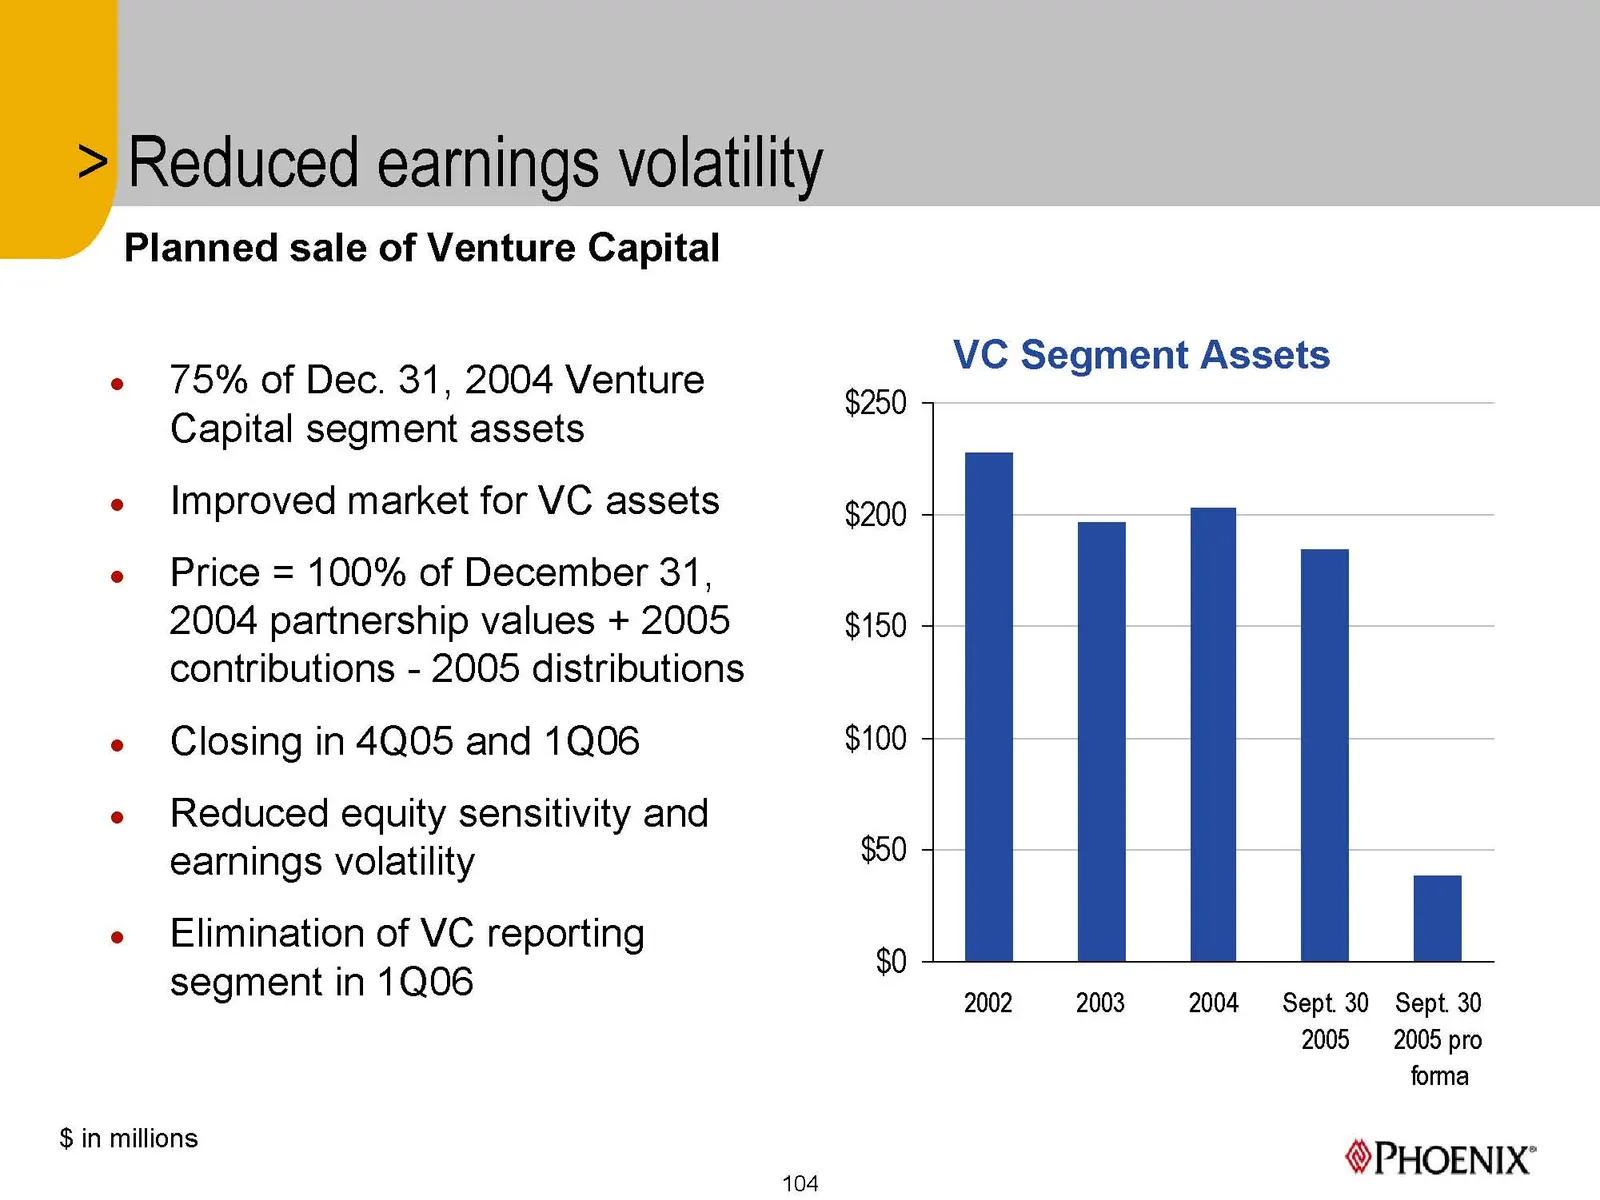
Slide 104: Reduced earnings volatility
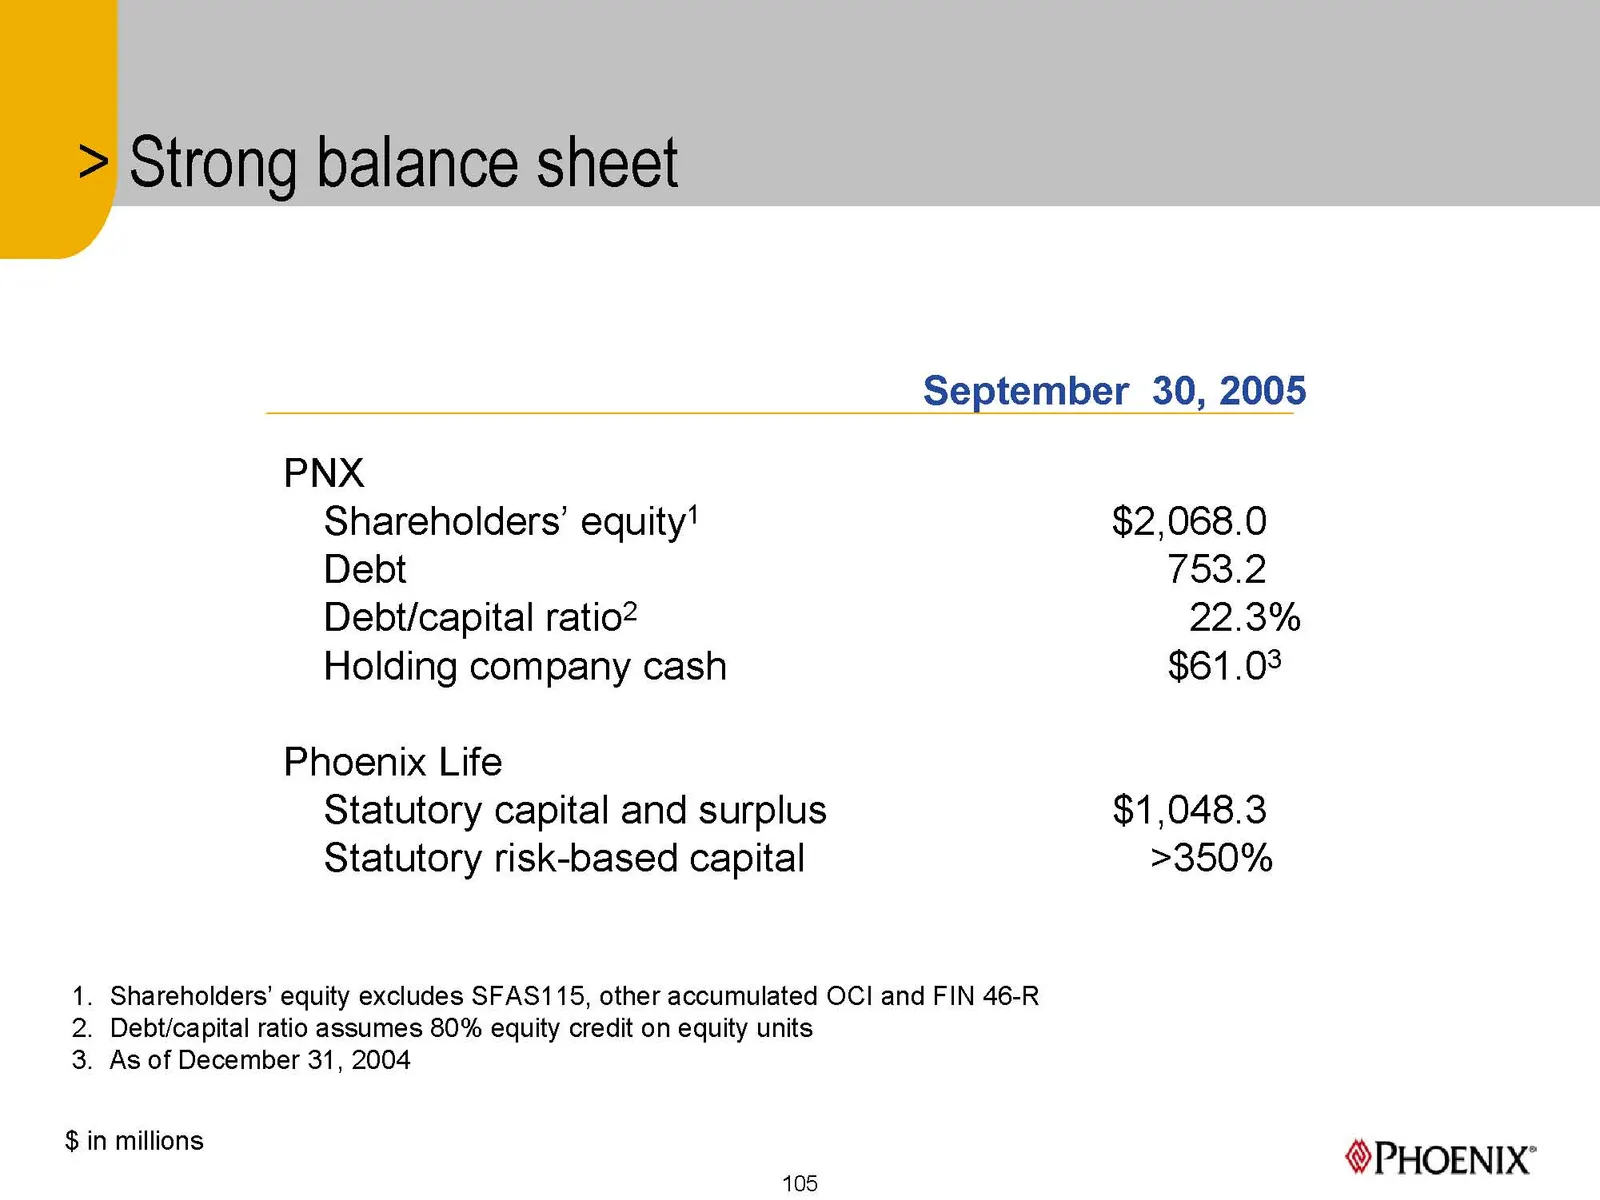
Slide 105: Strong balance sheet
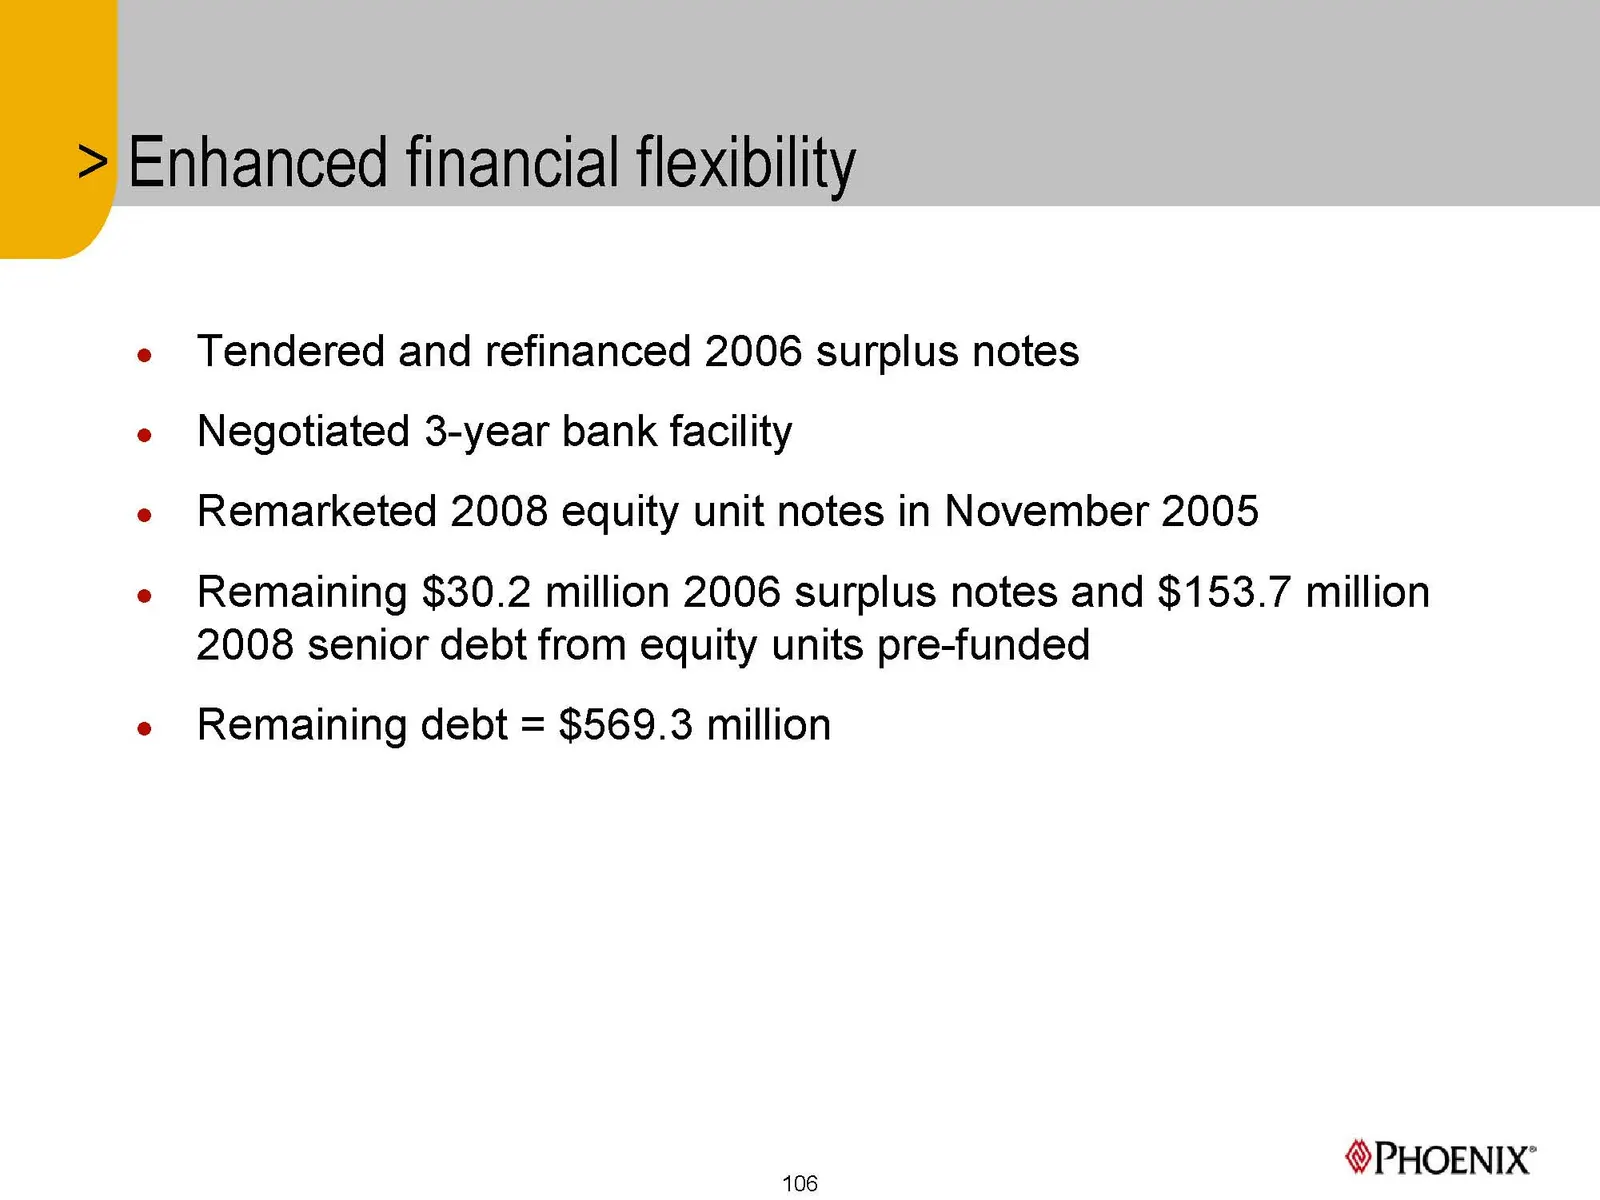
Slide 106: Enhanced financial flexibility
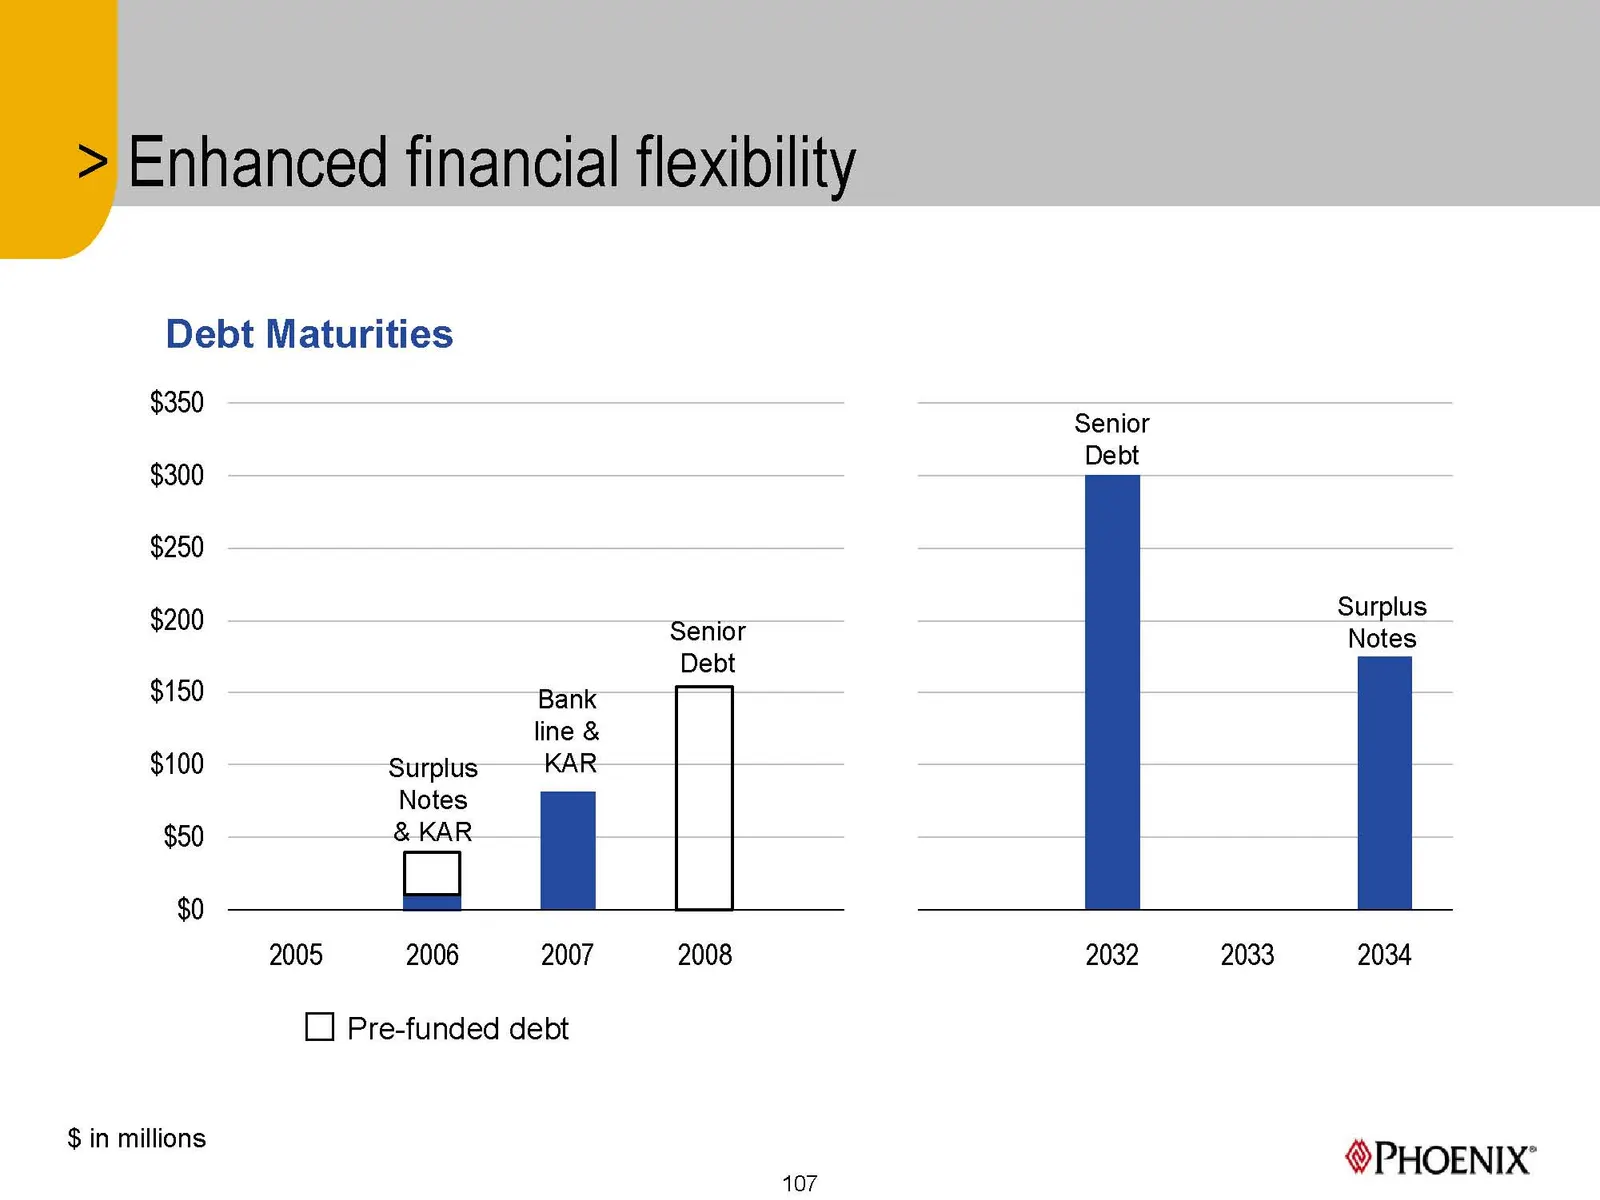
Slide 107: Enhanced financial flexibility
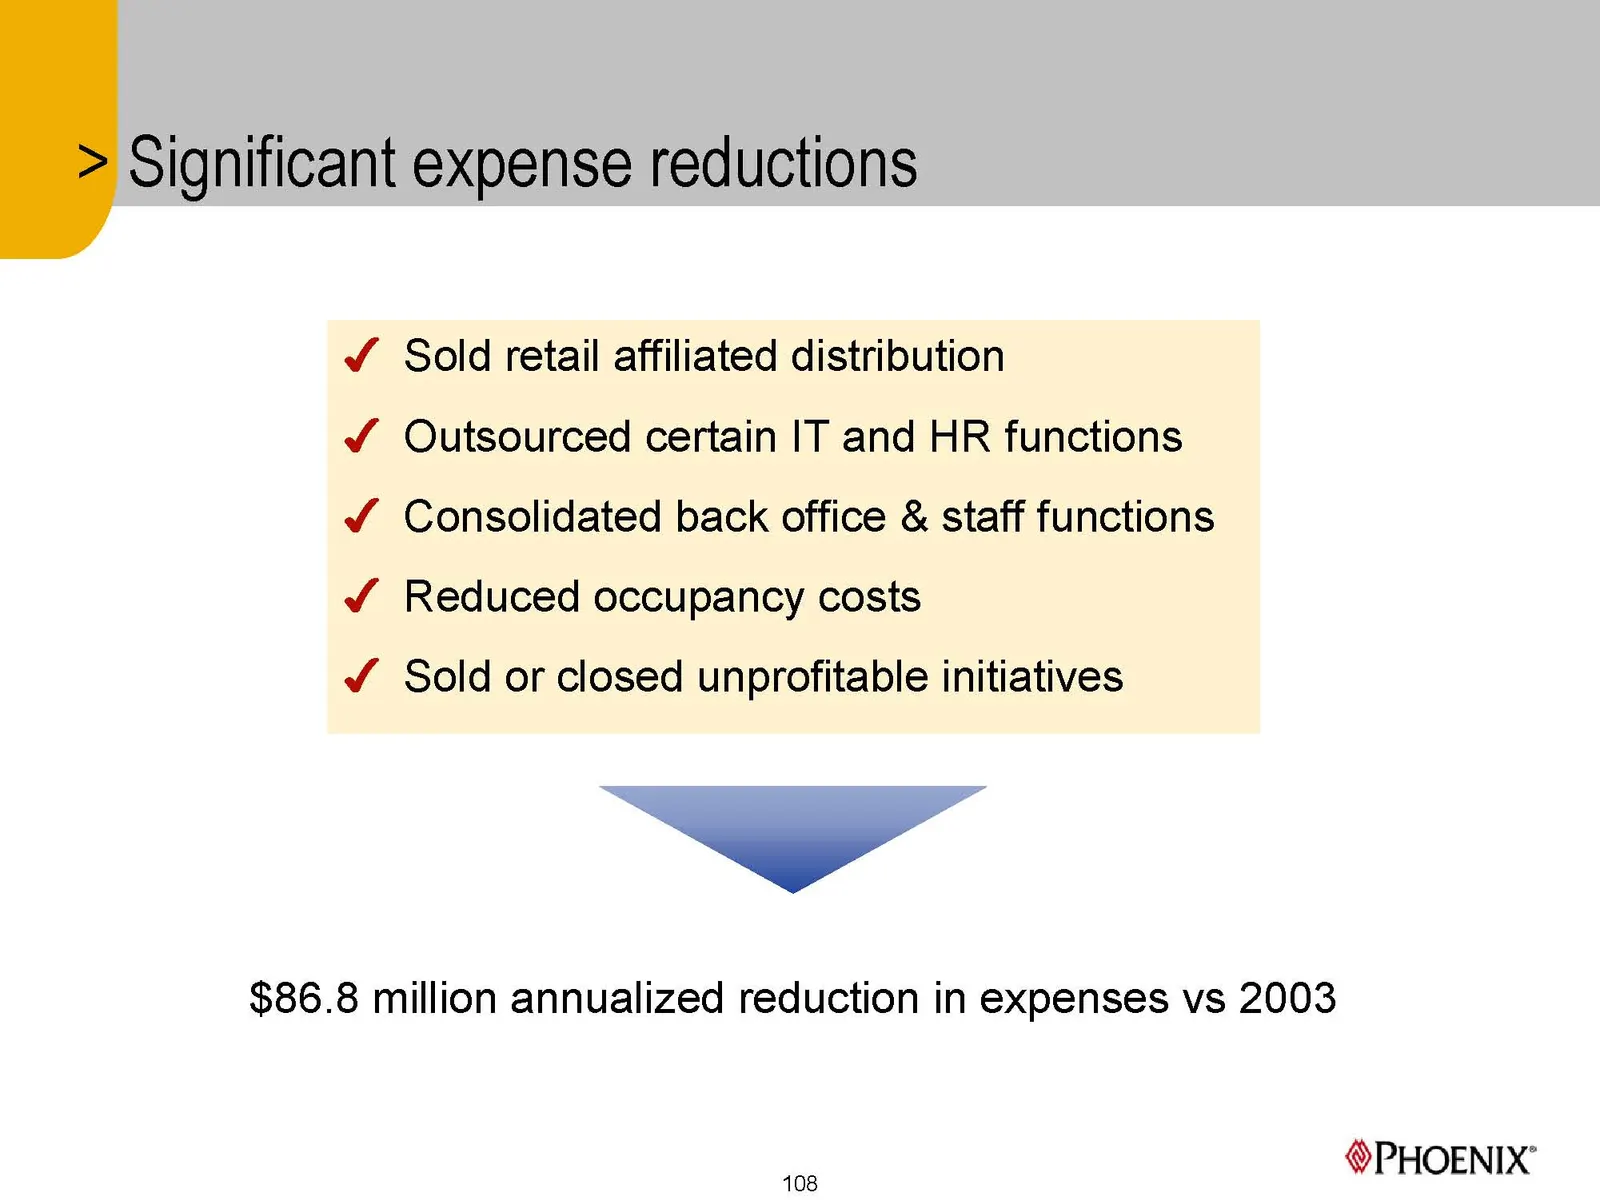
Slide 108: Significant expense reductions
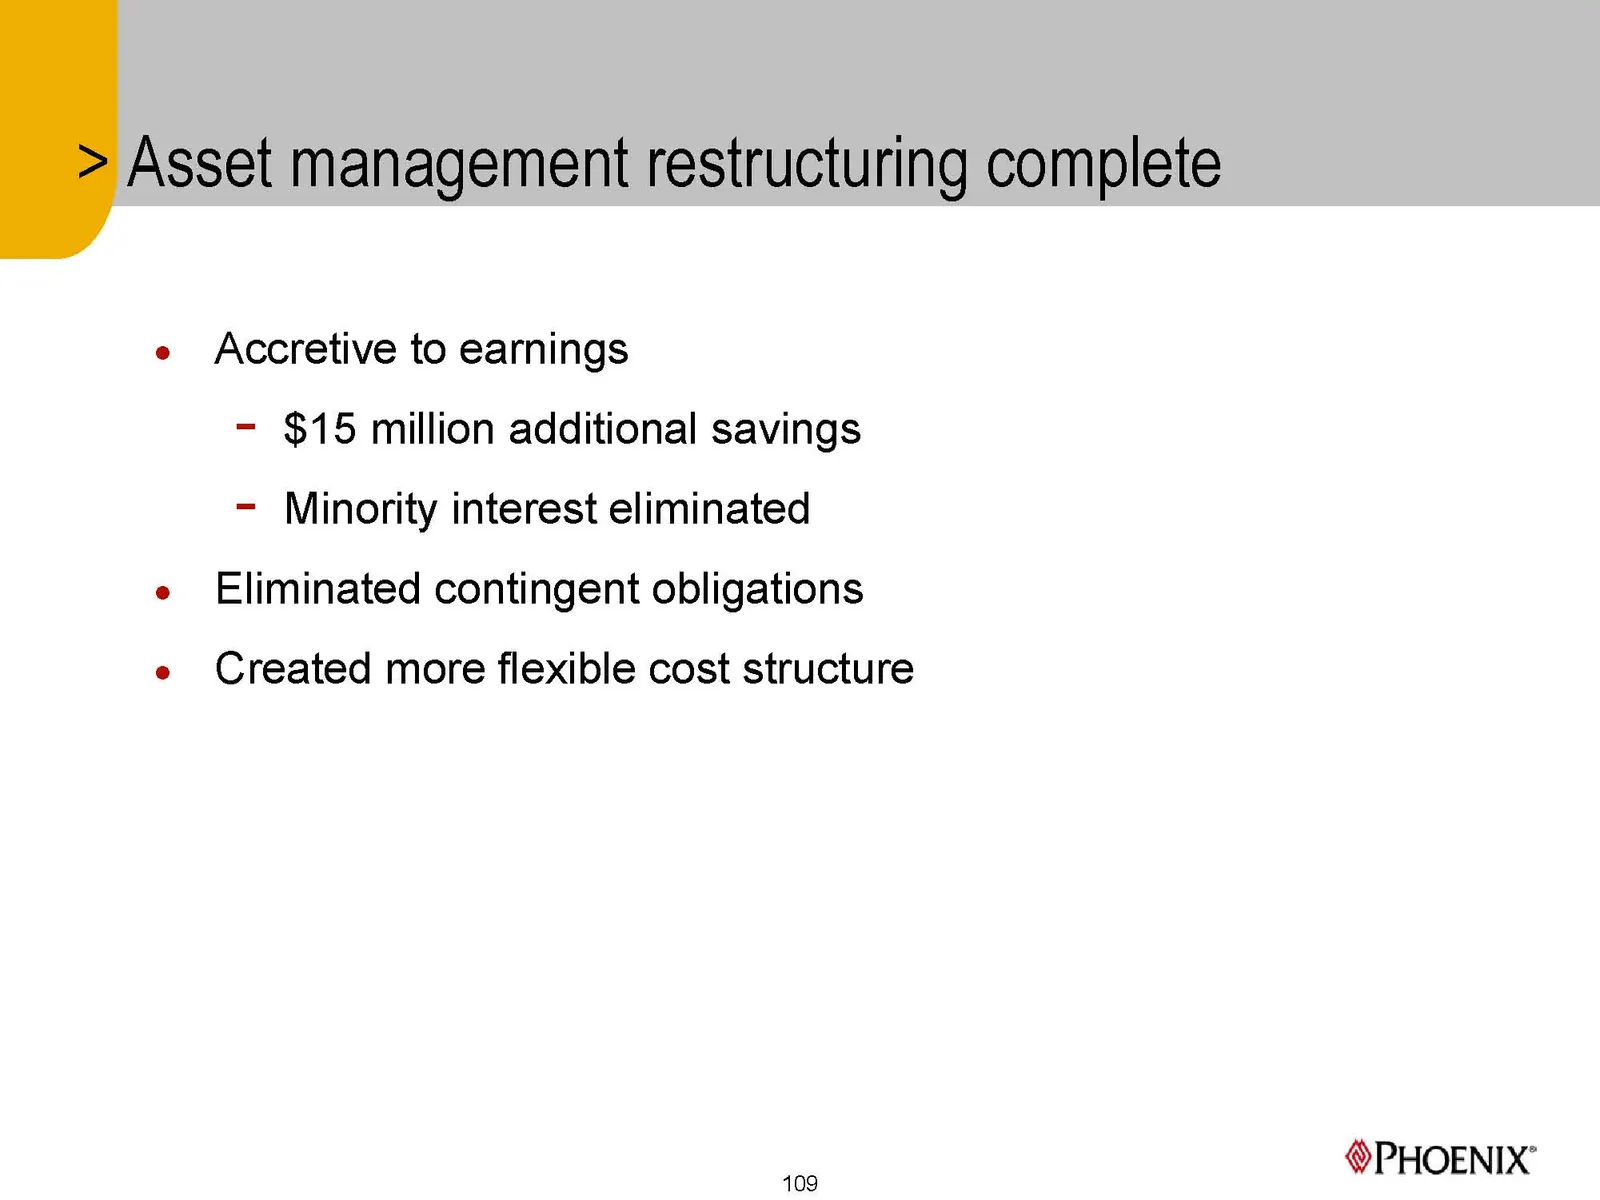
Slide 109: Asset management restructuring complete
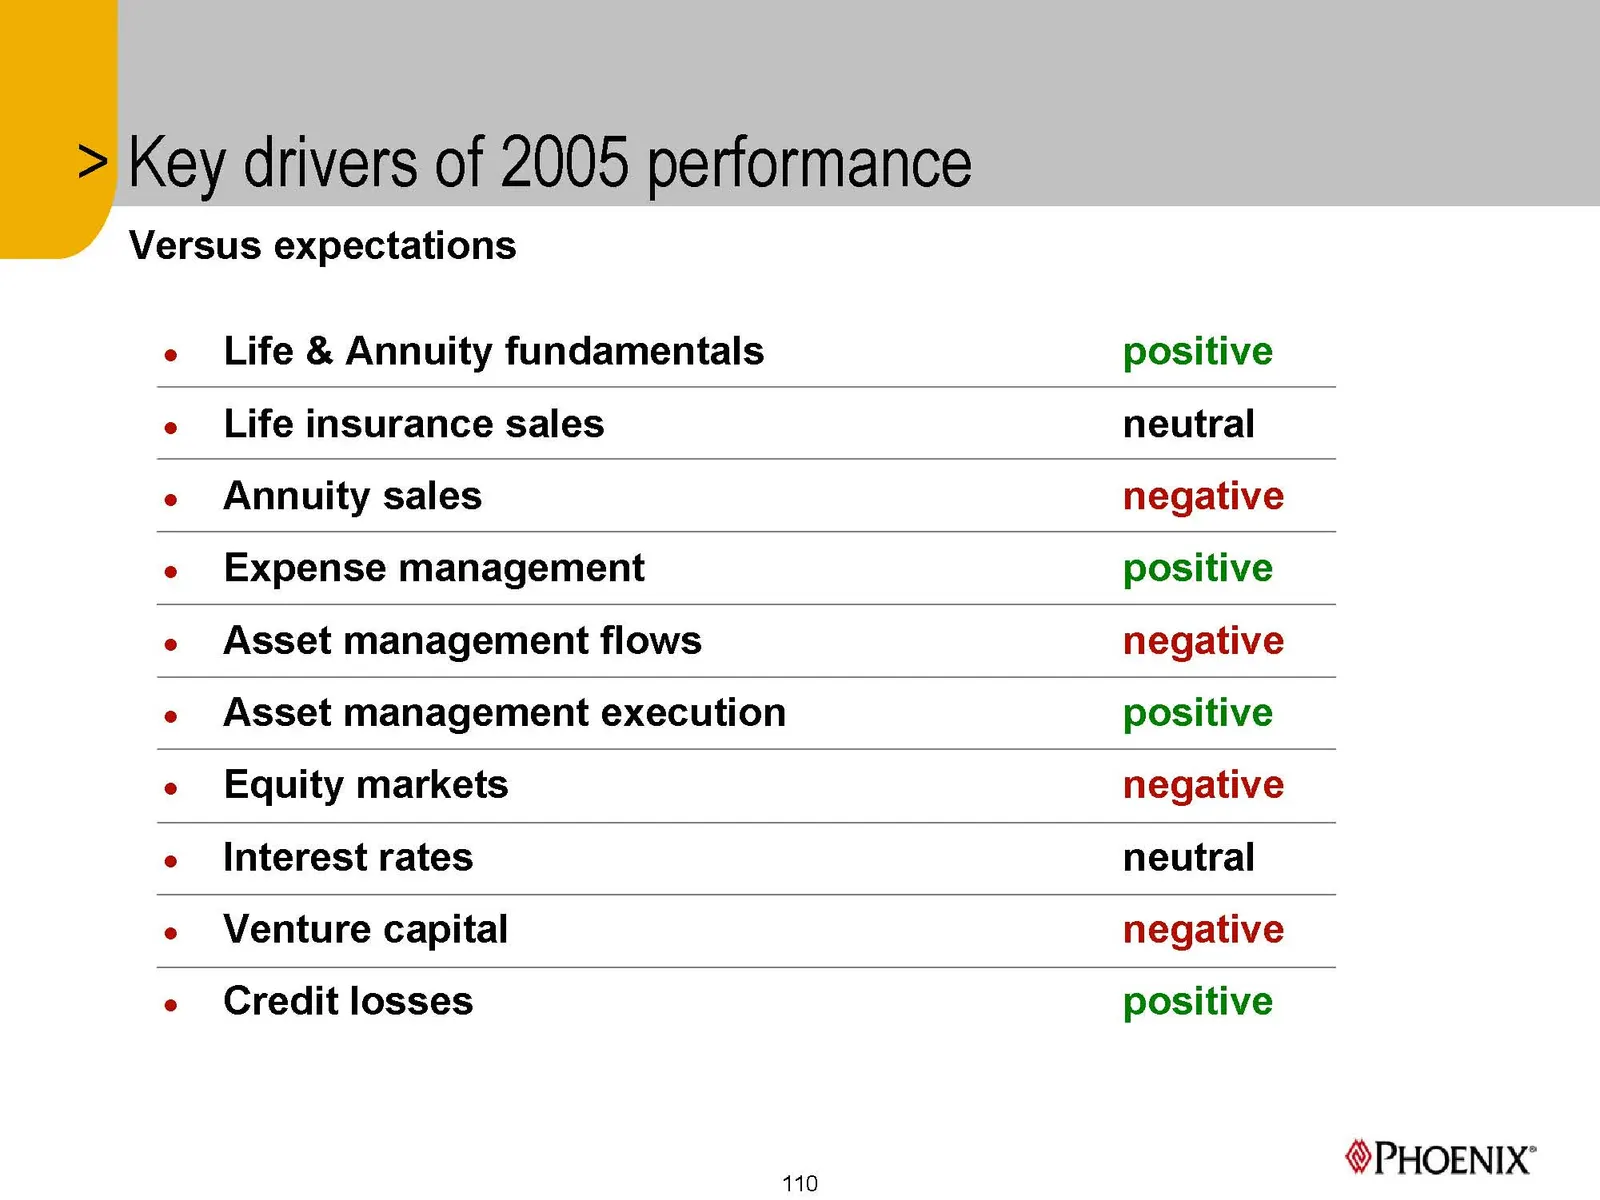
Slide 110: Key drivers of 2005 performance
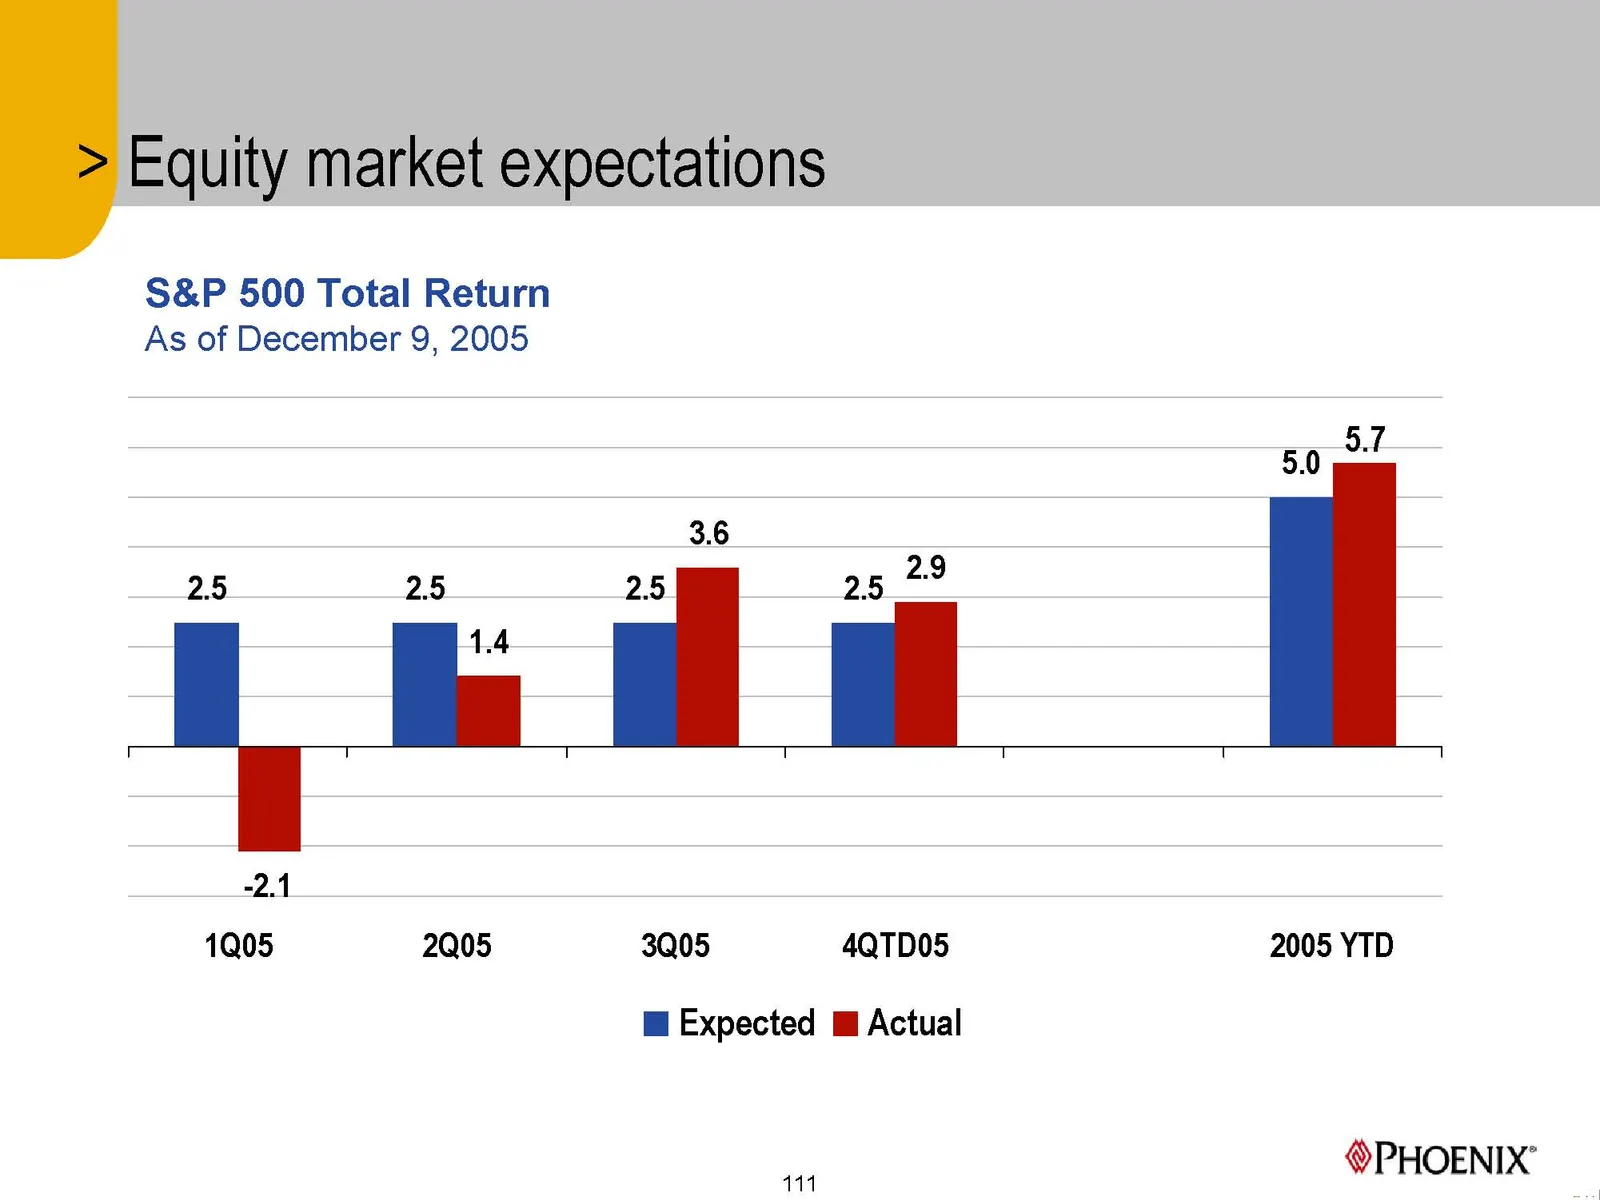
Slide 111: Equity market expectations
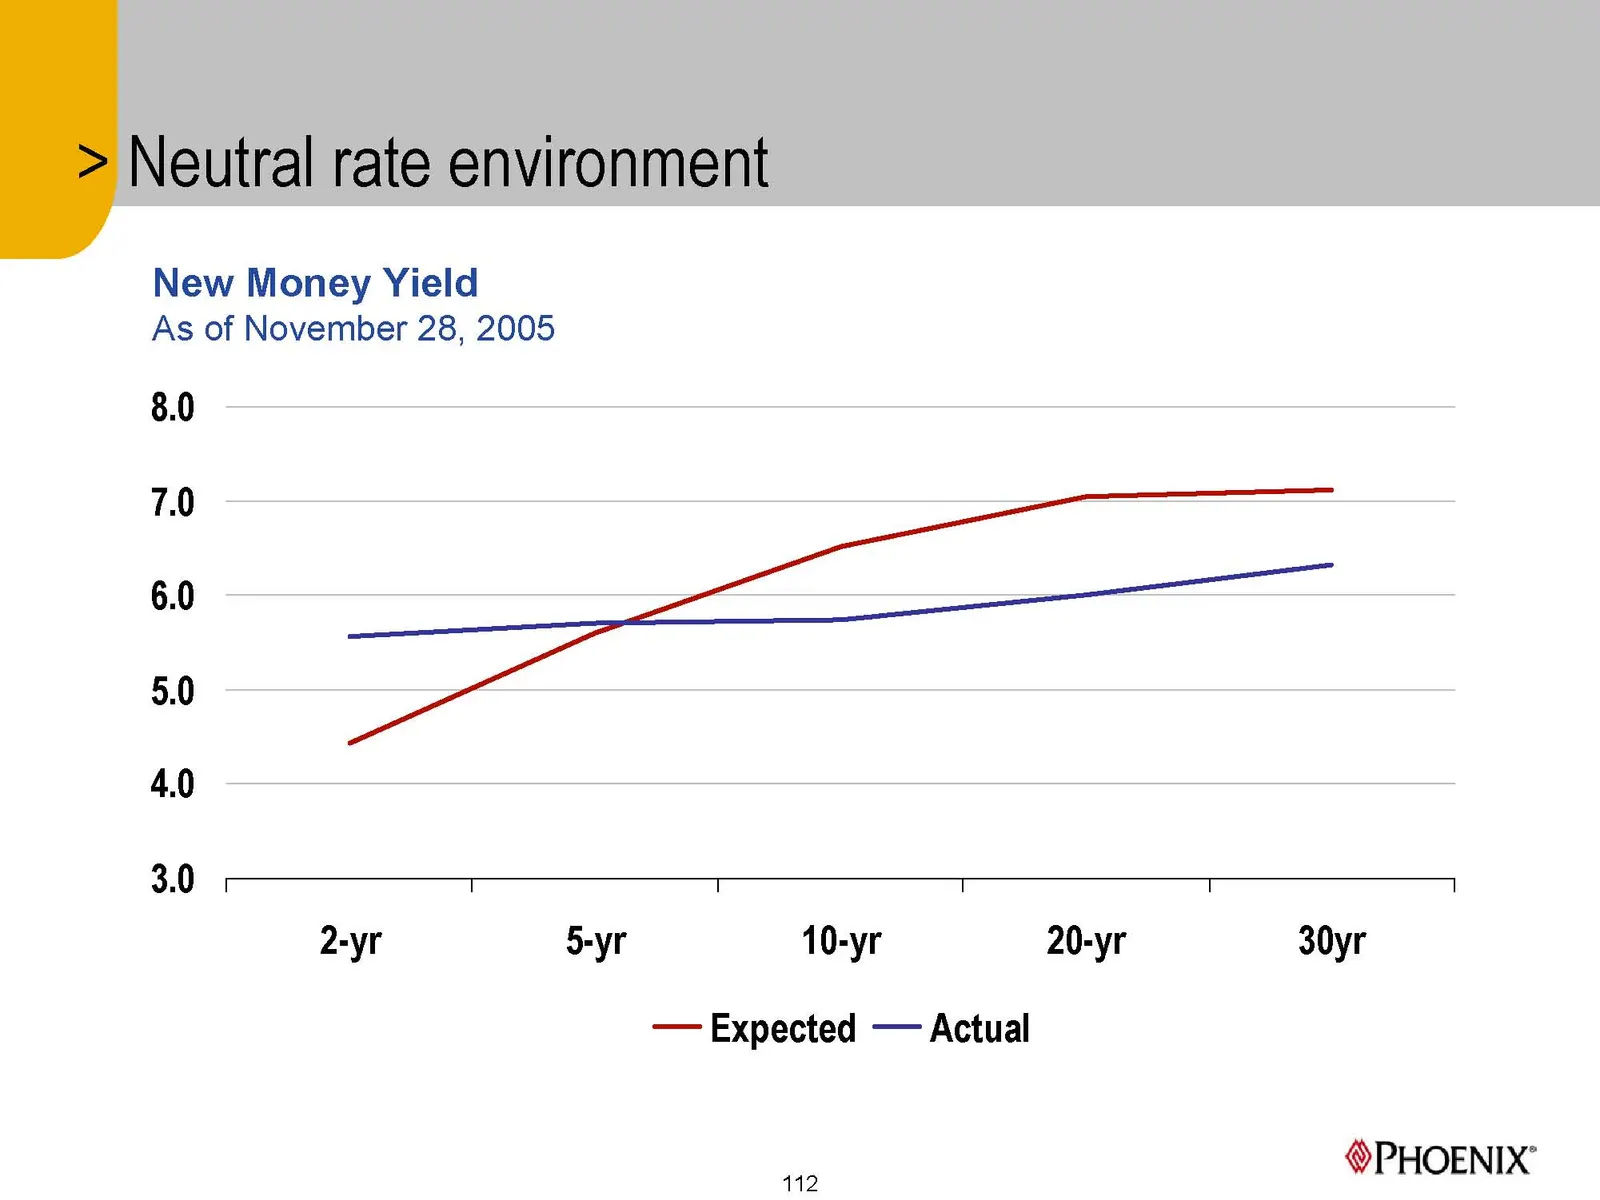
Slide 112: Neutral rate environment
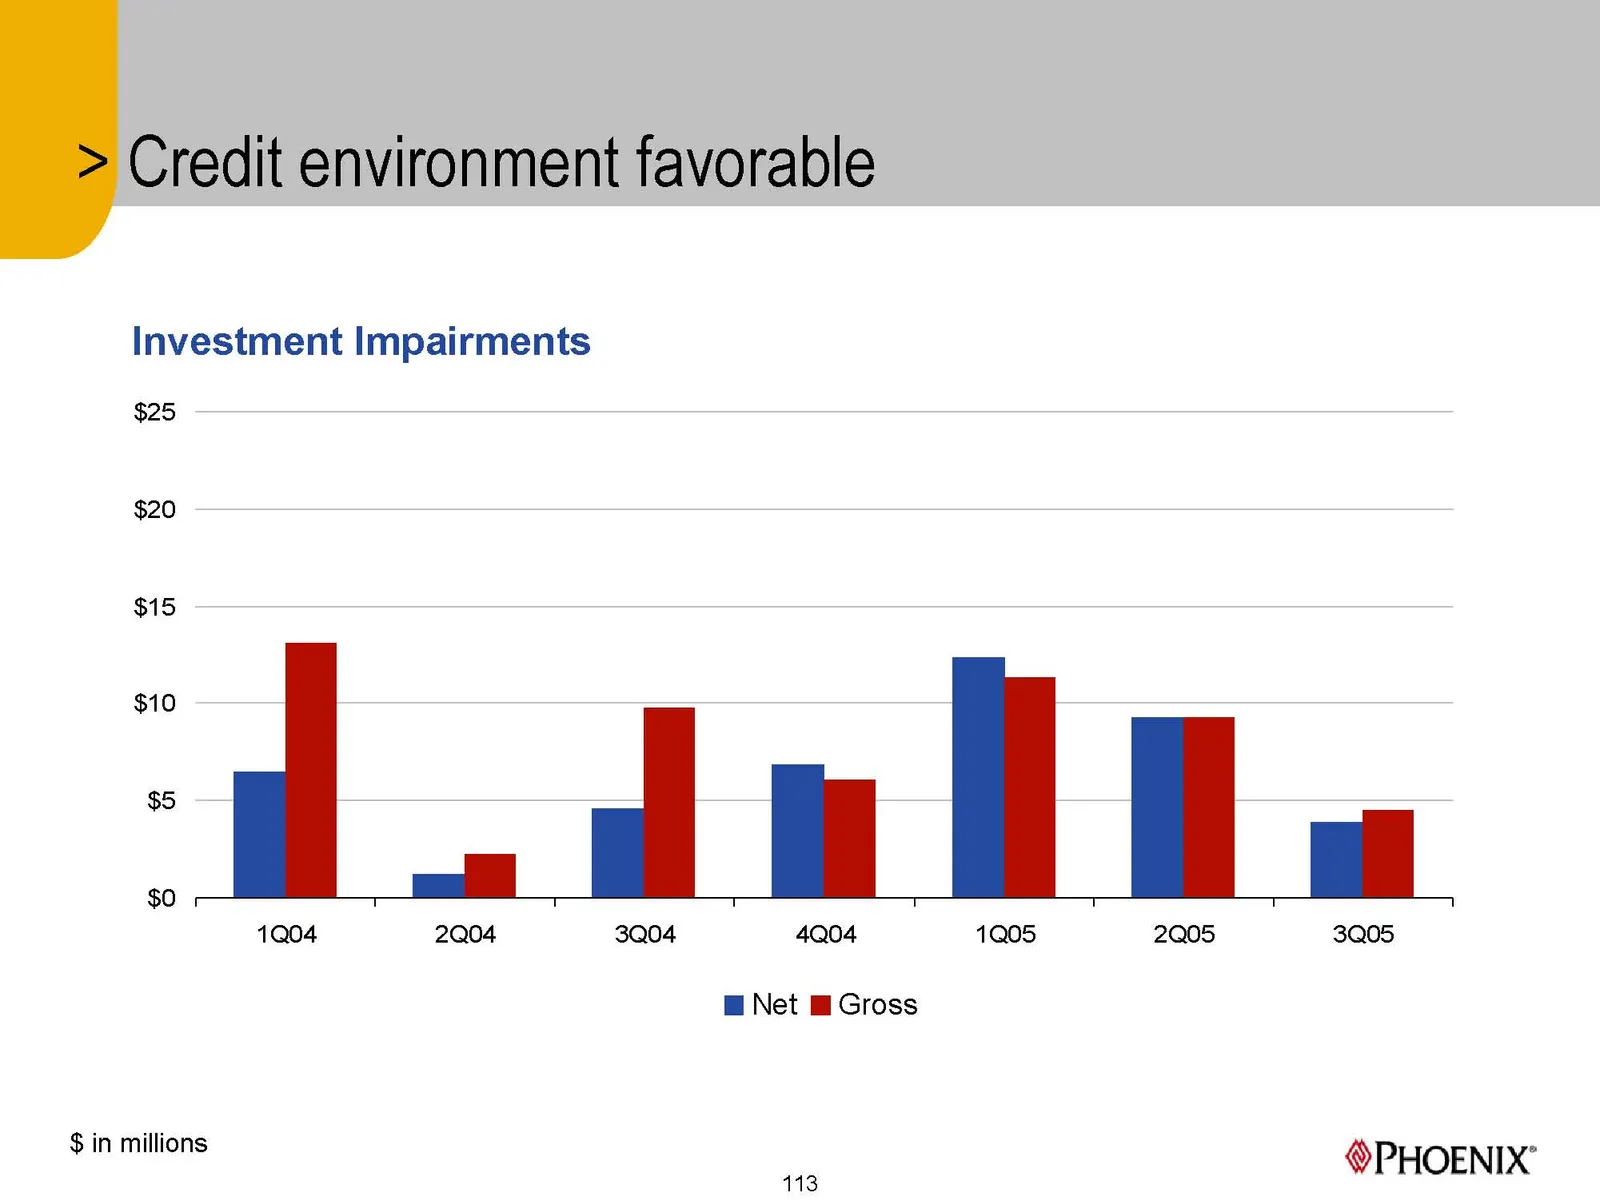
Slide 113: Credit environment favorable
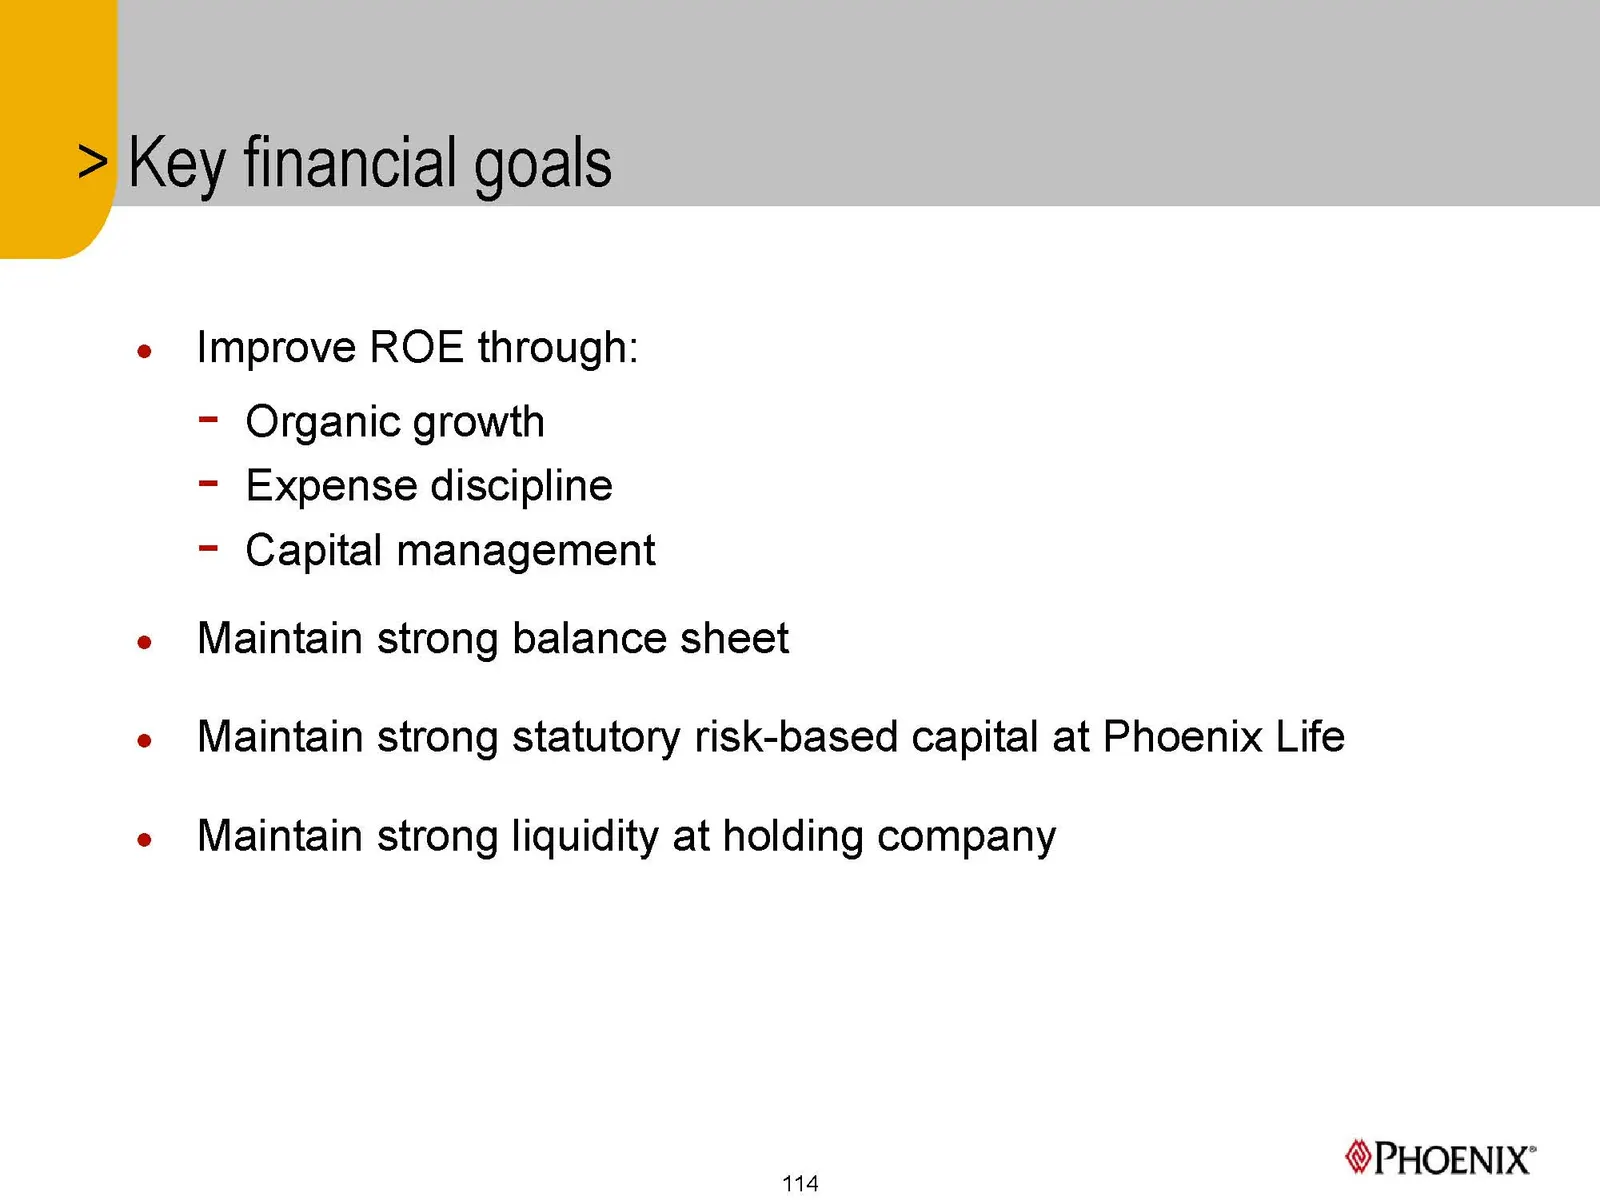
Slide 114: Key financial goals
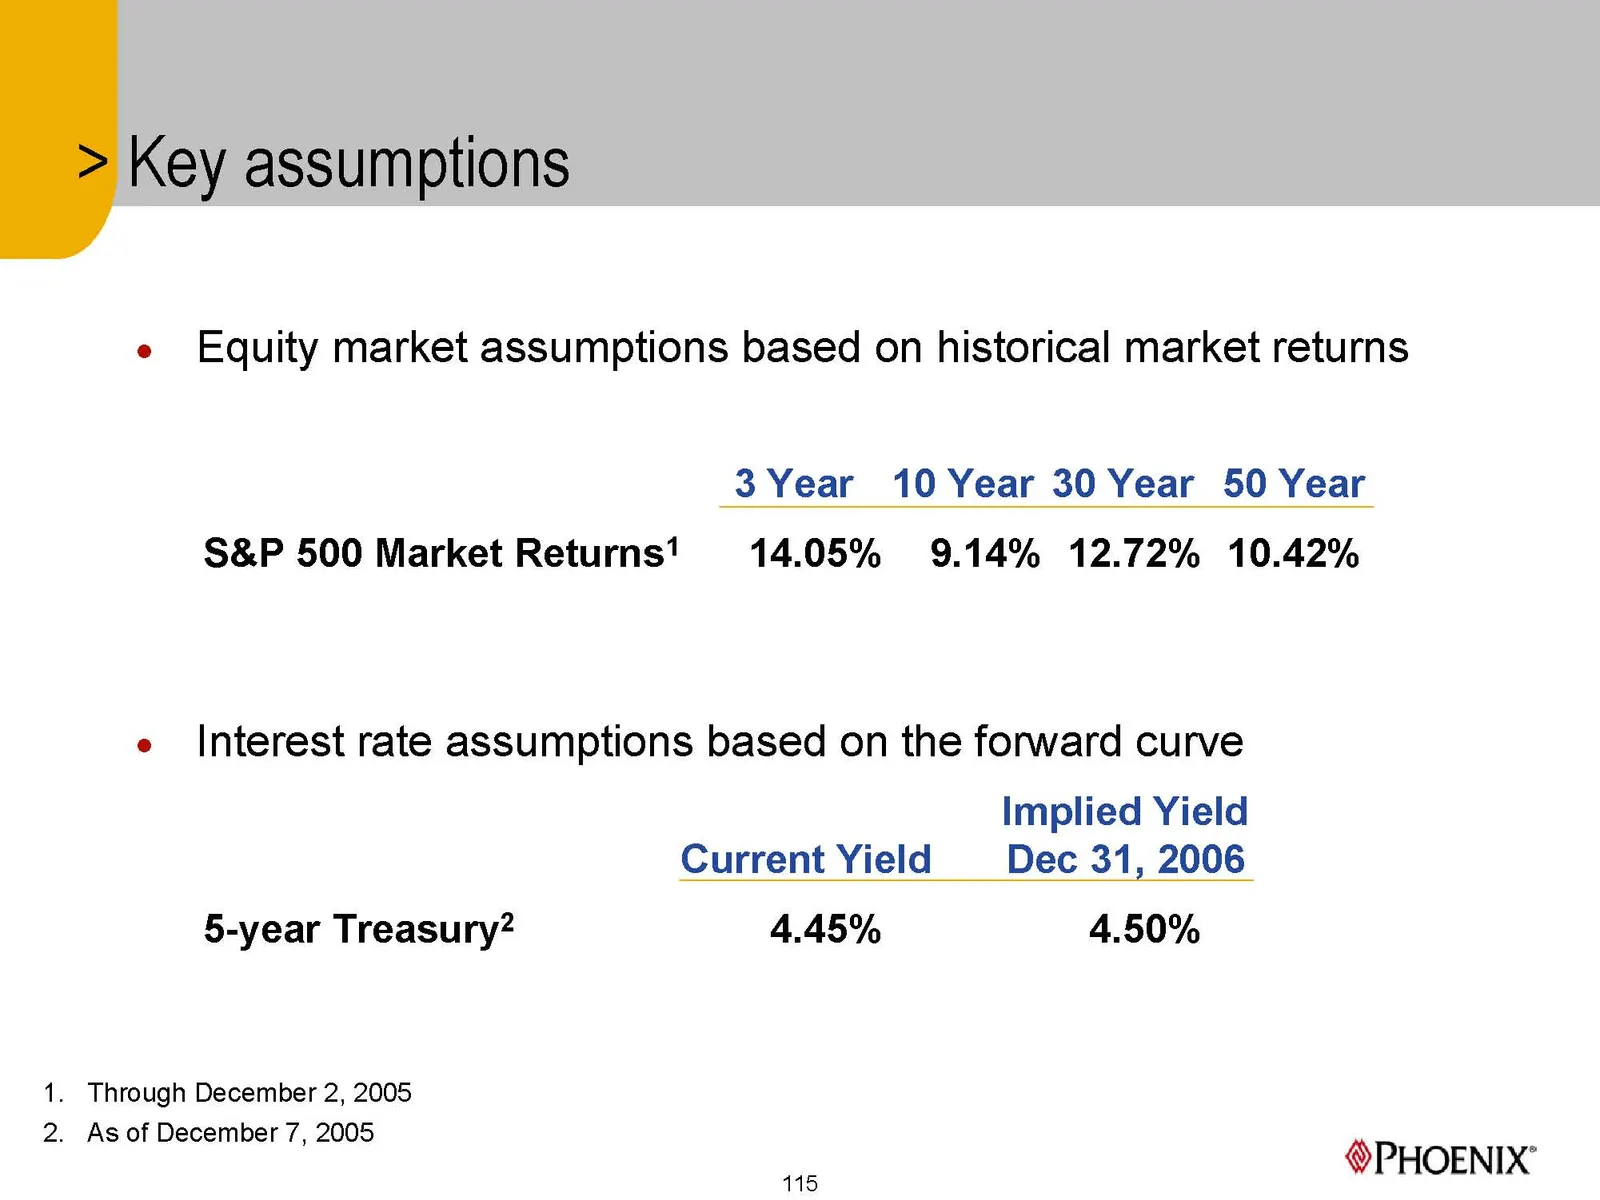
Slide 115: Key assumptions
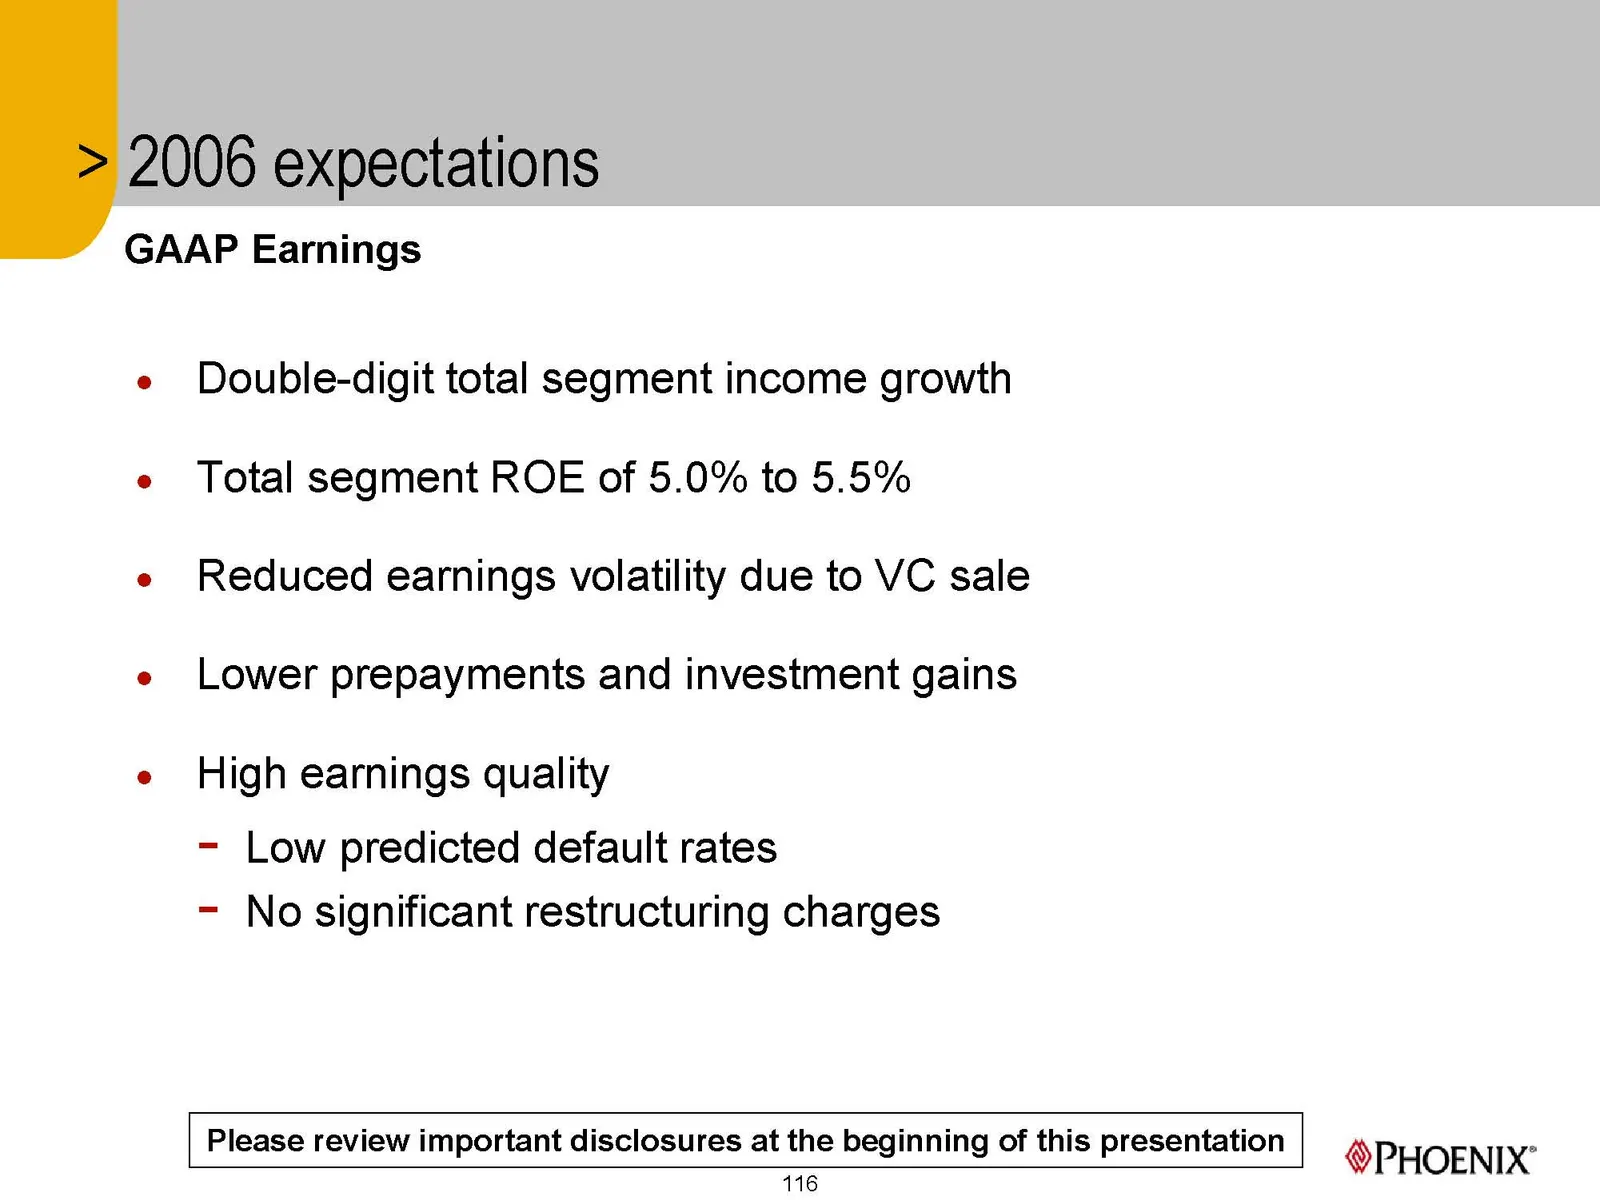
Slide 116: 2006 expectations
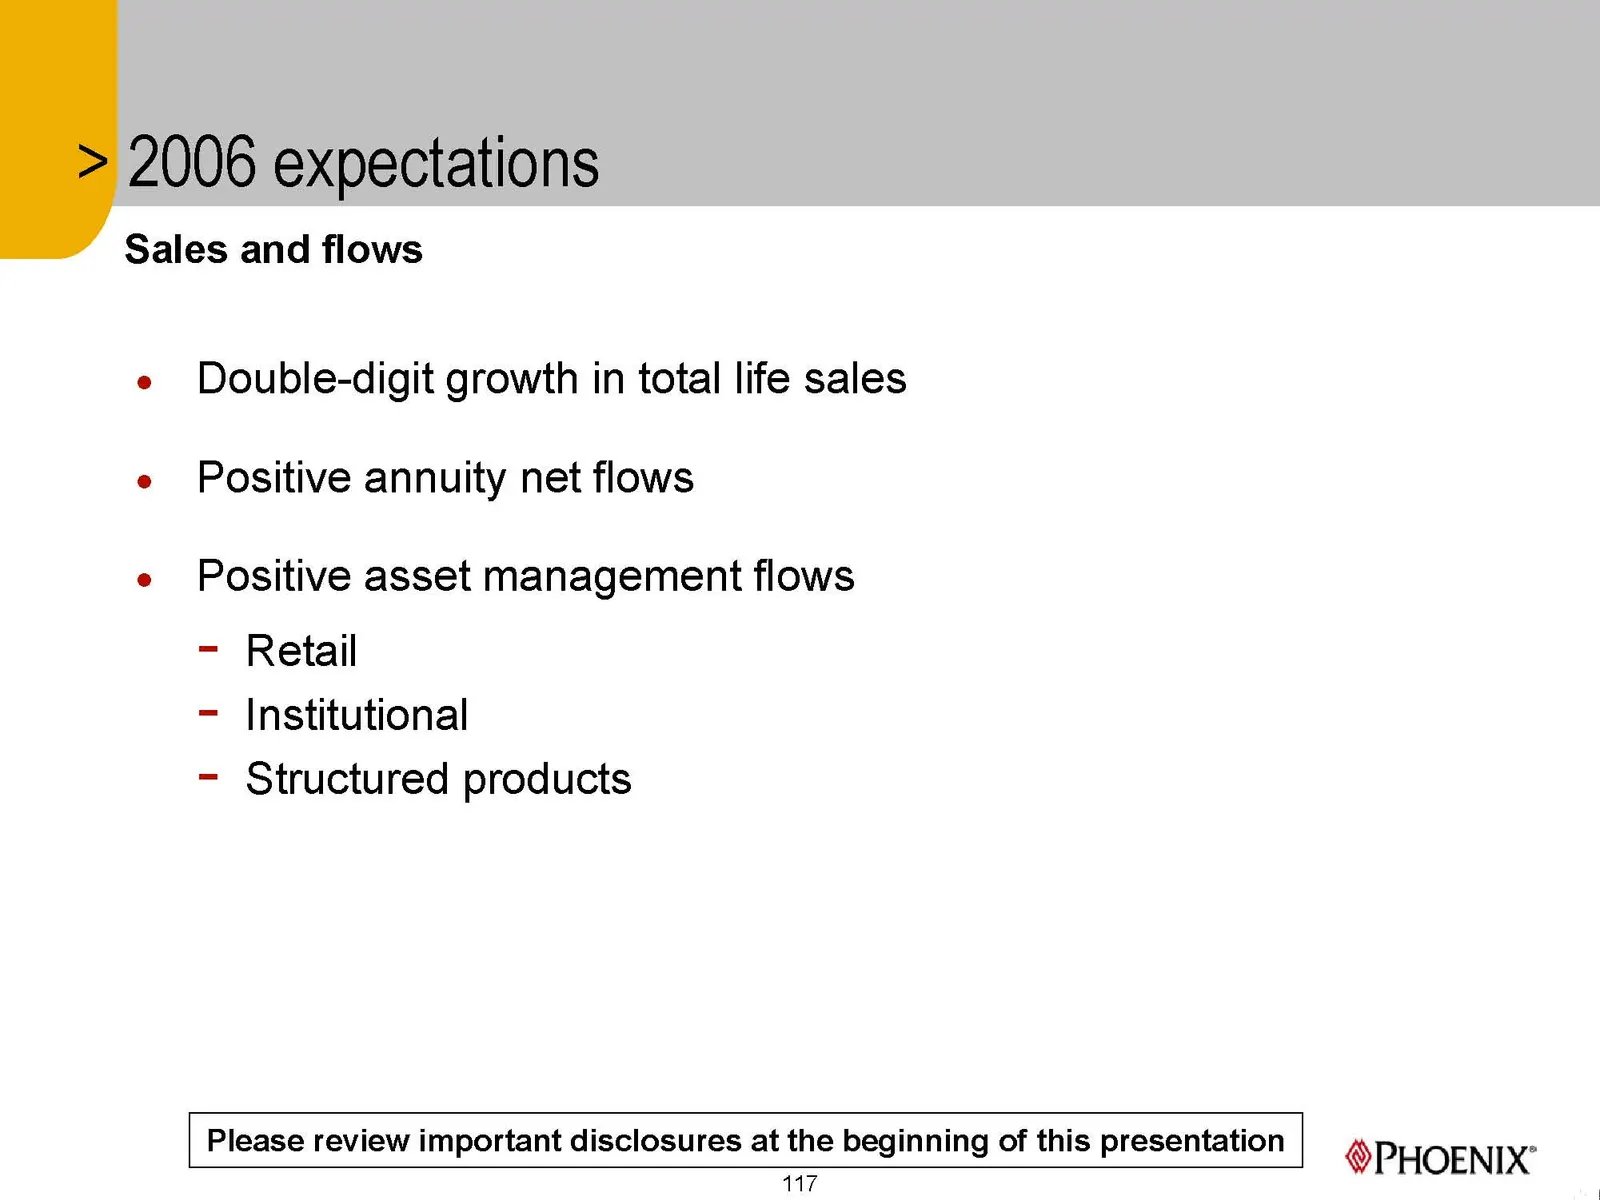
Slide 117: 2006 expectations
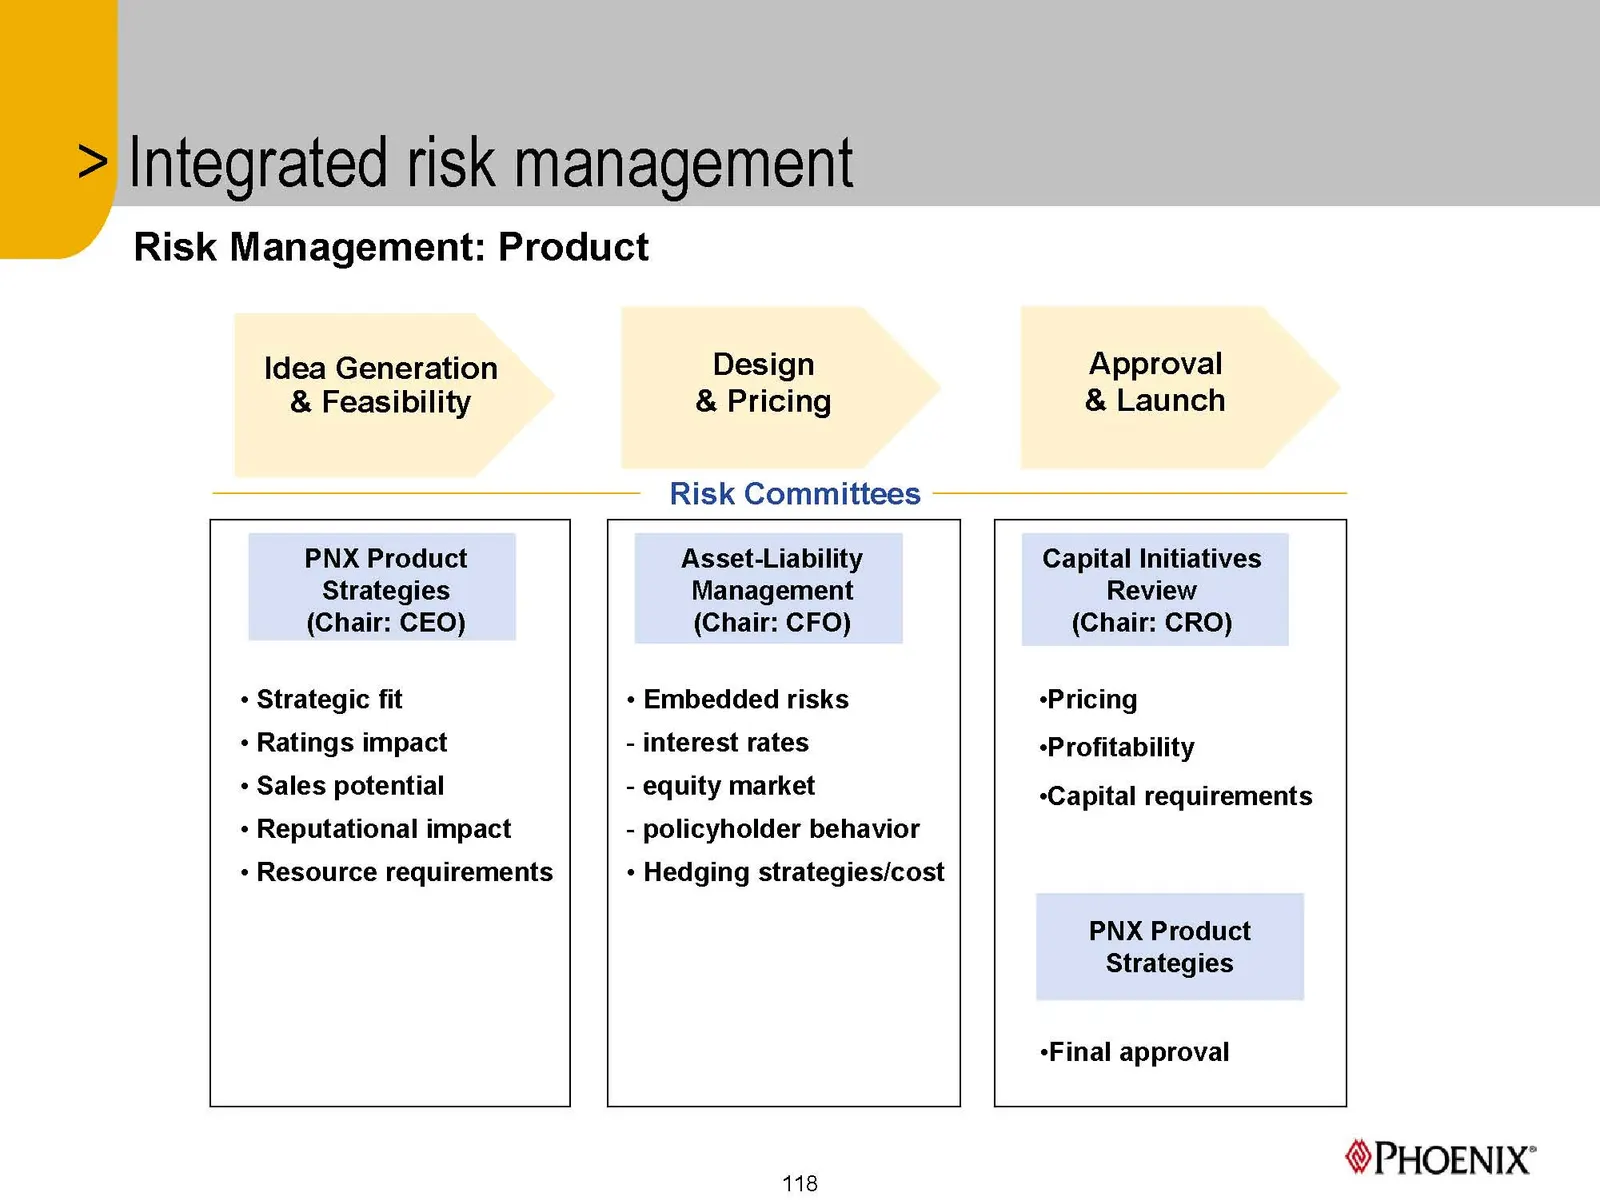
Slide 118: Integrated risk management
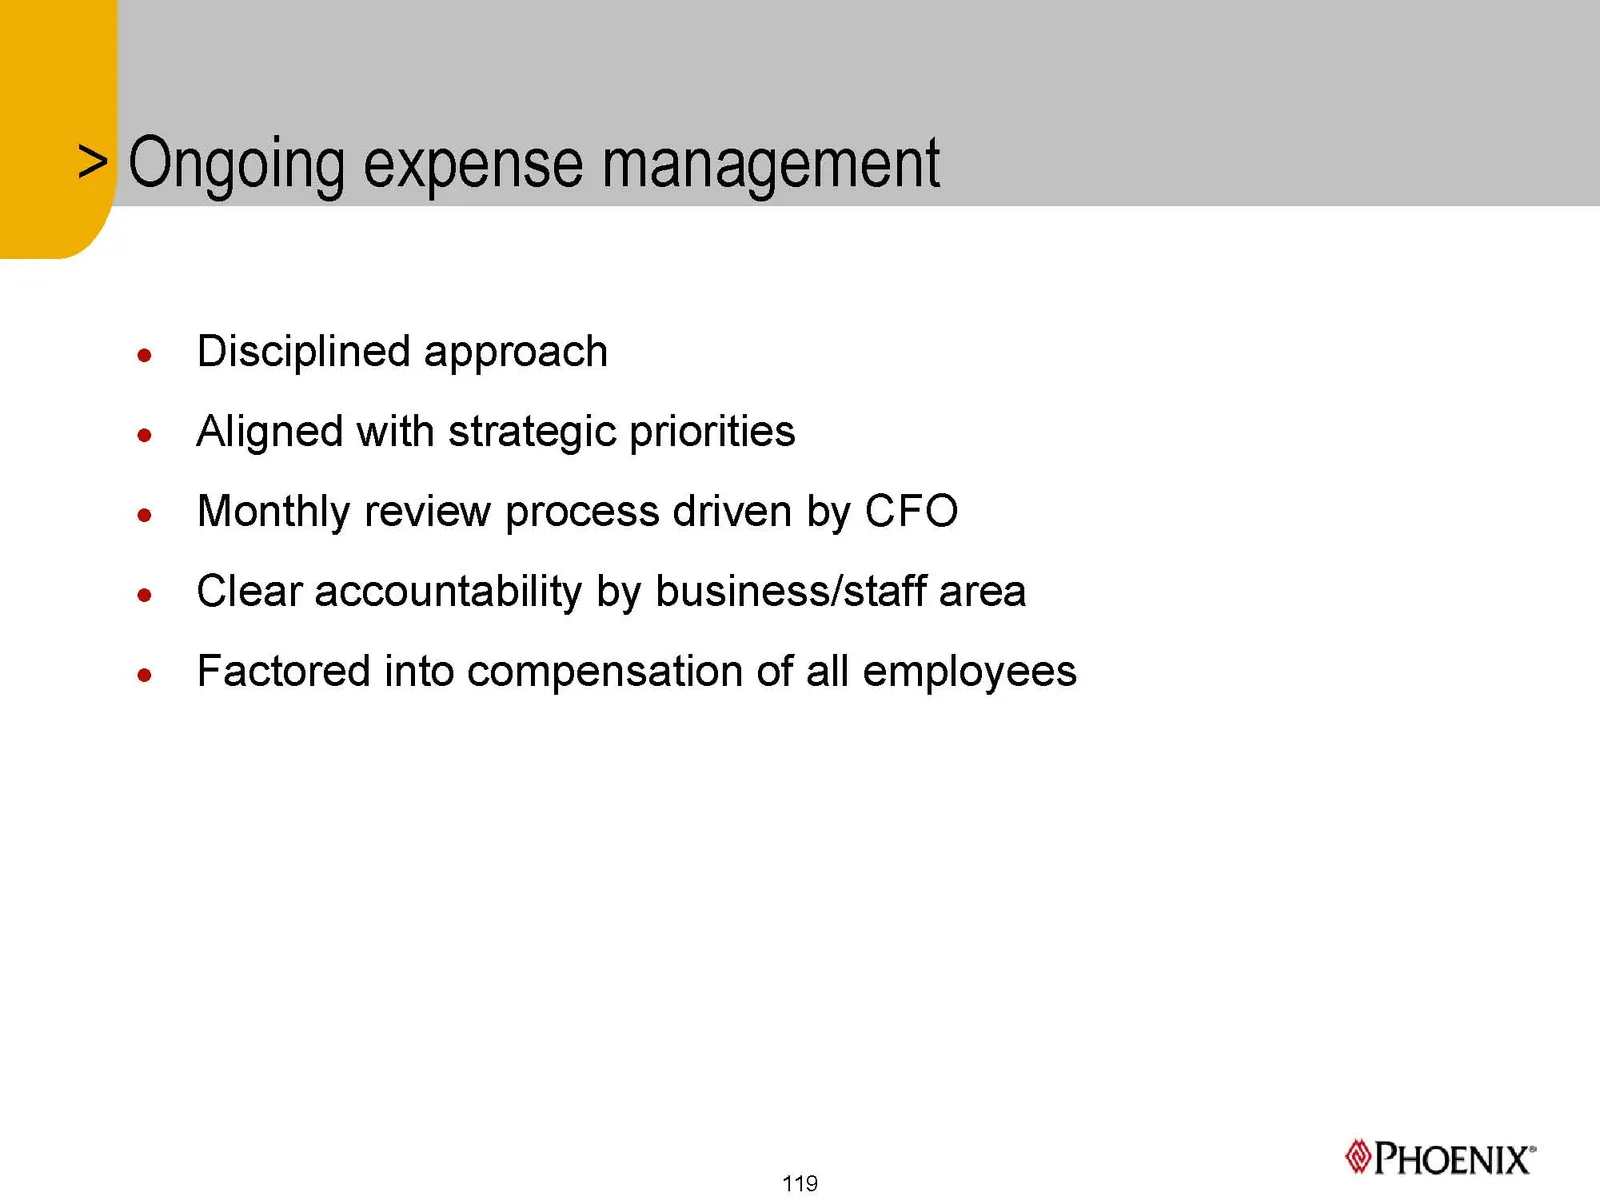
Slide 119: Ongoing expense management
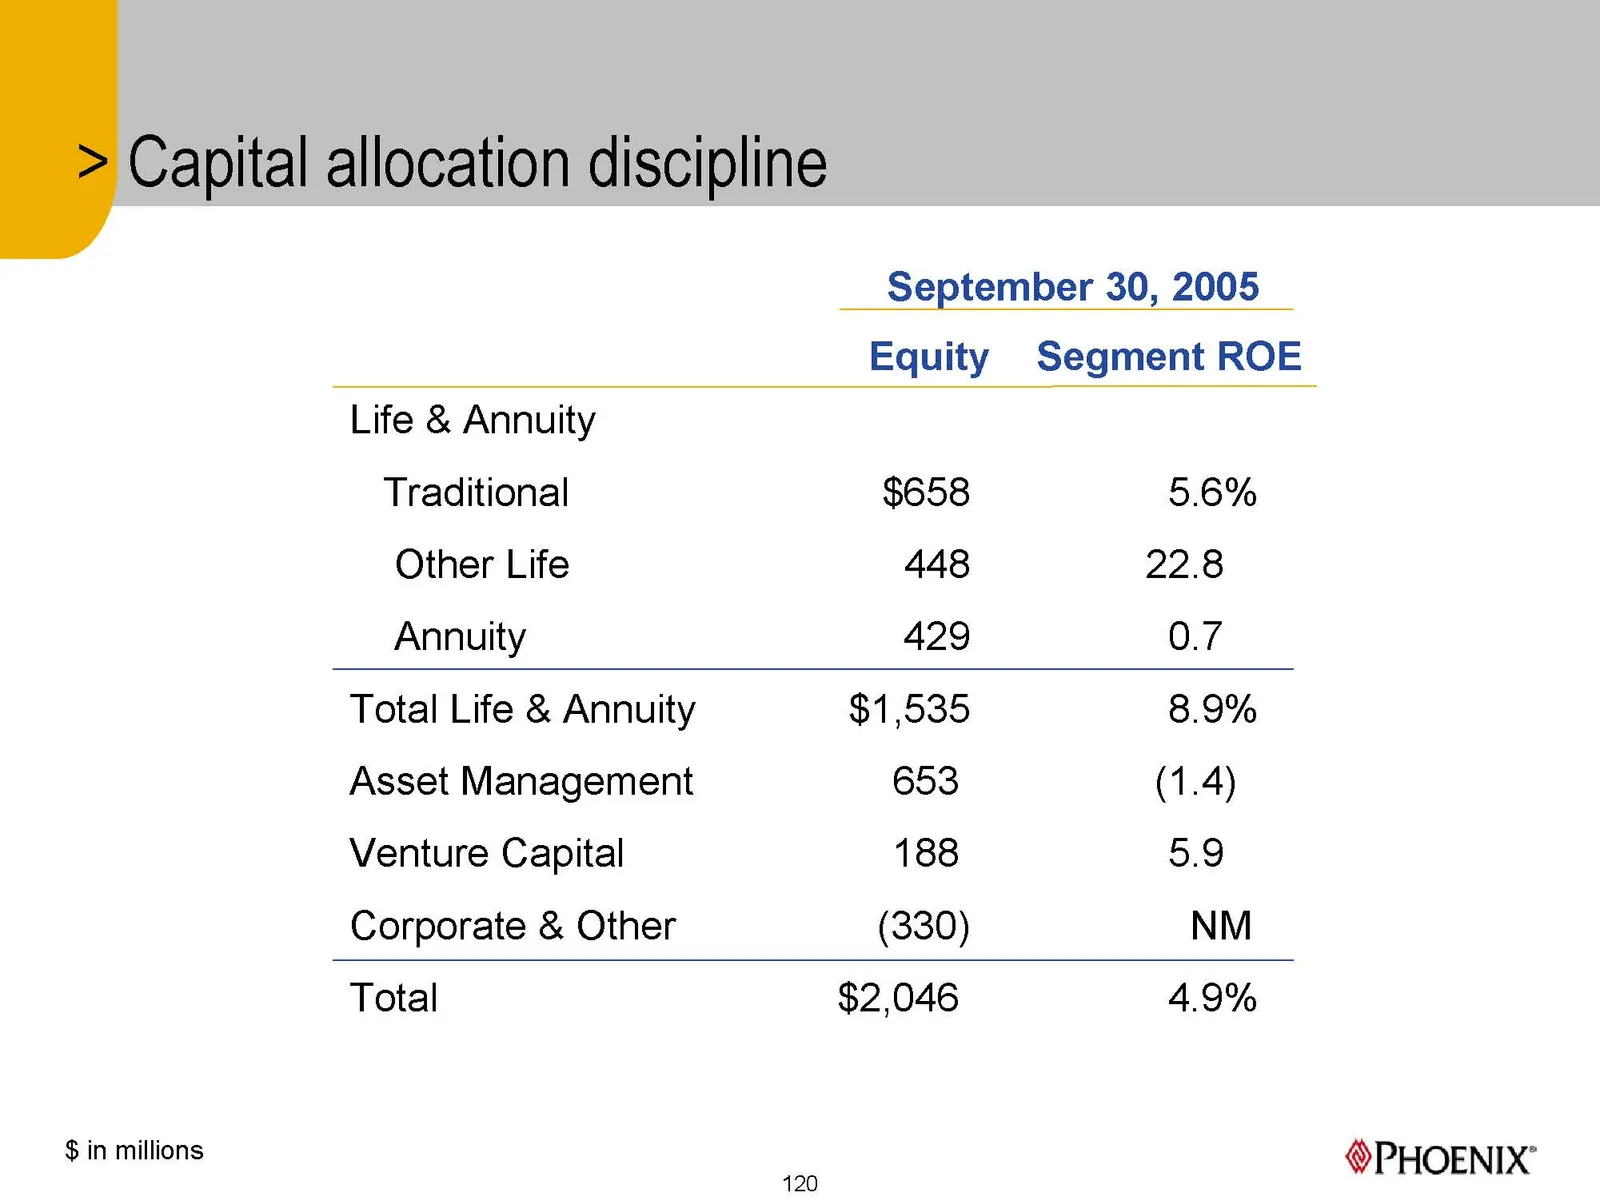
Slide 120: Capital allocation discipline
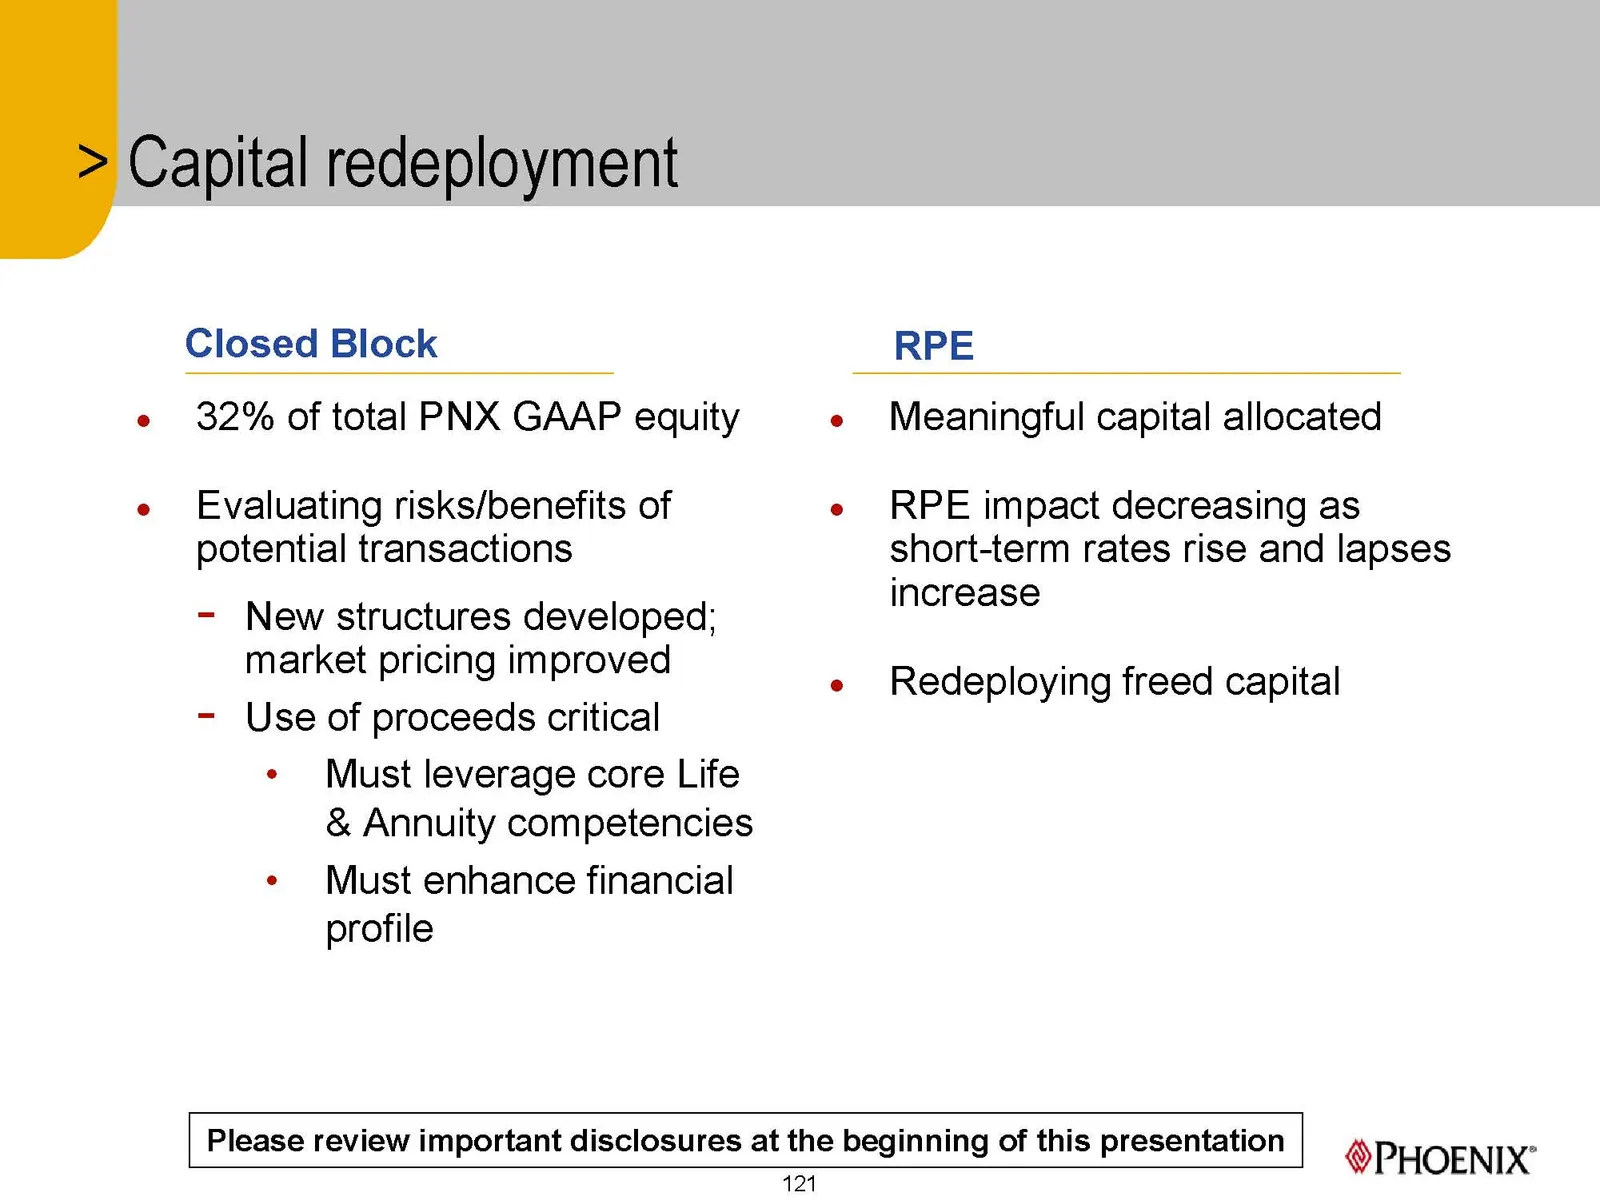
Slide 121
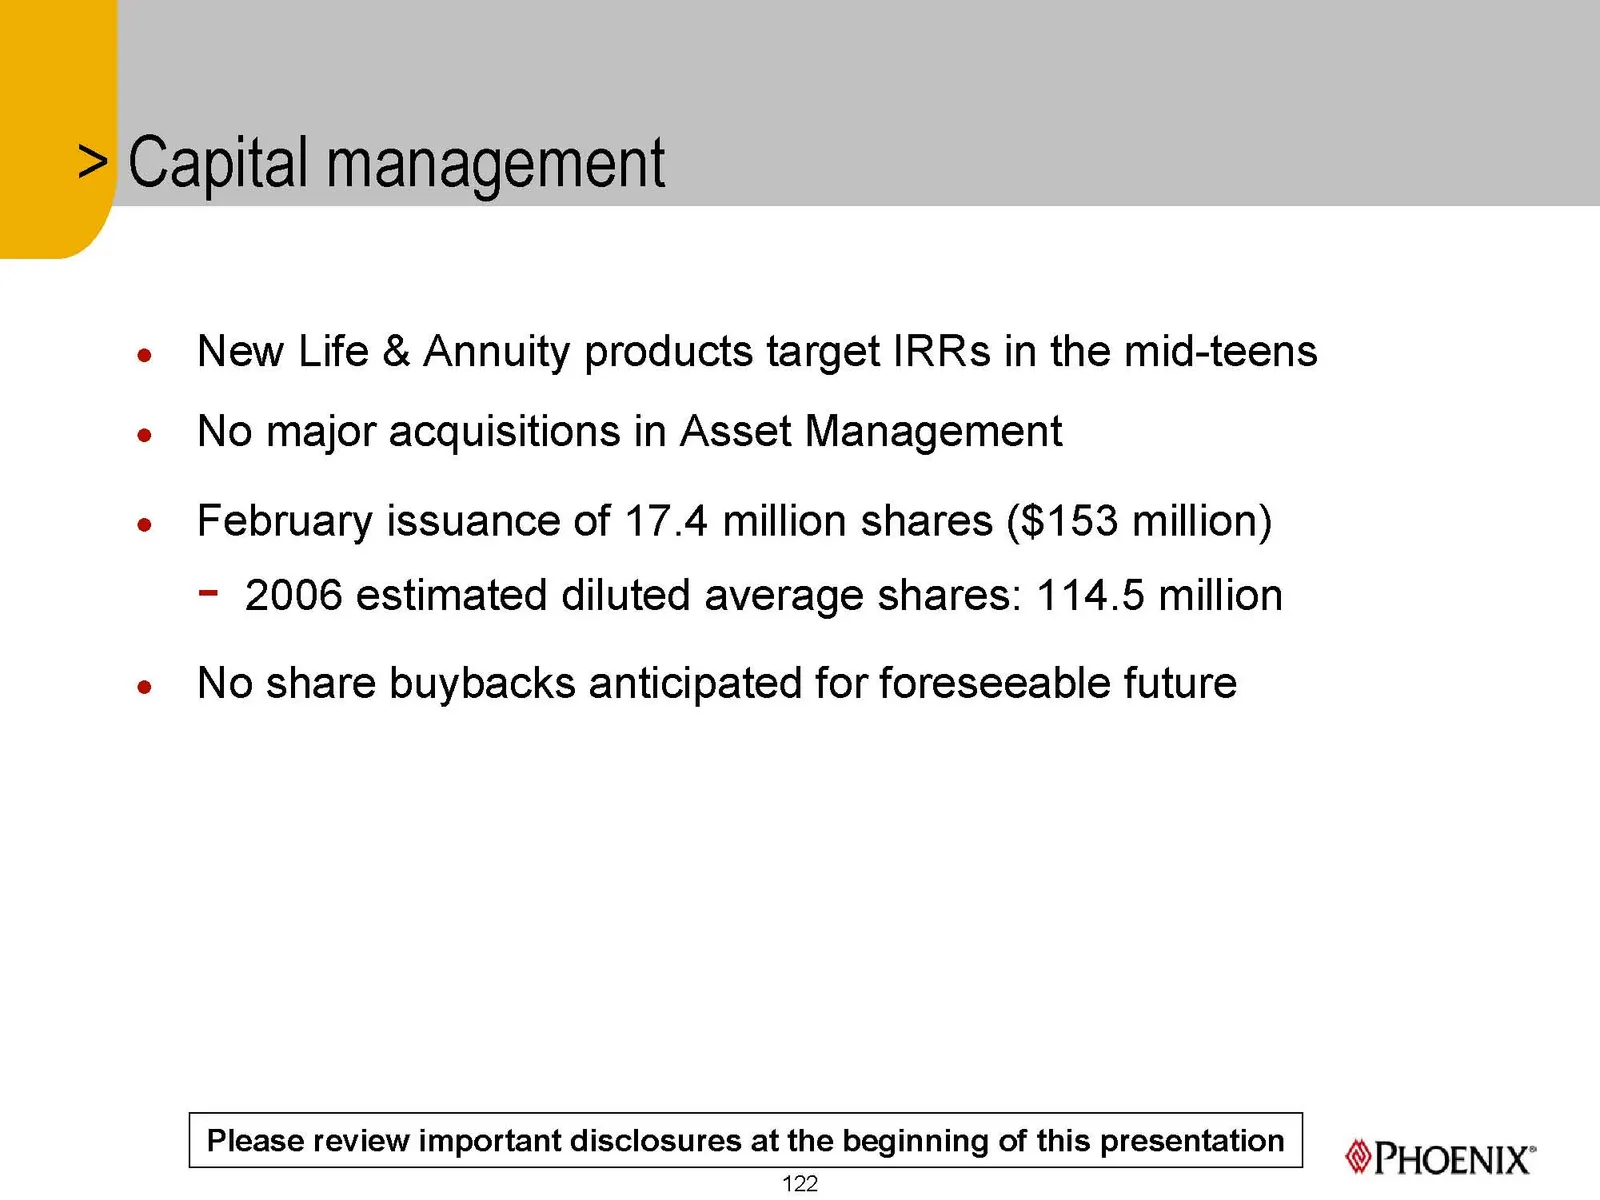
Slide 122
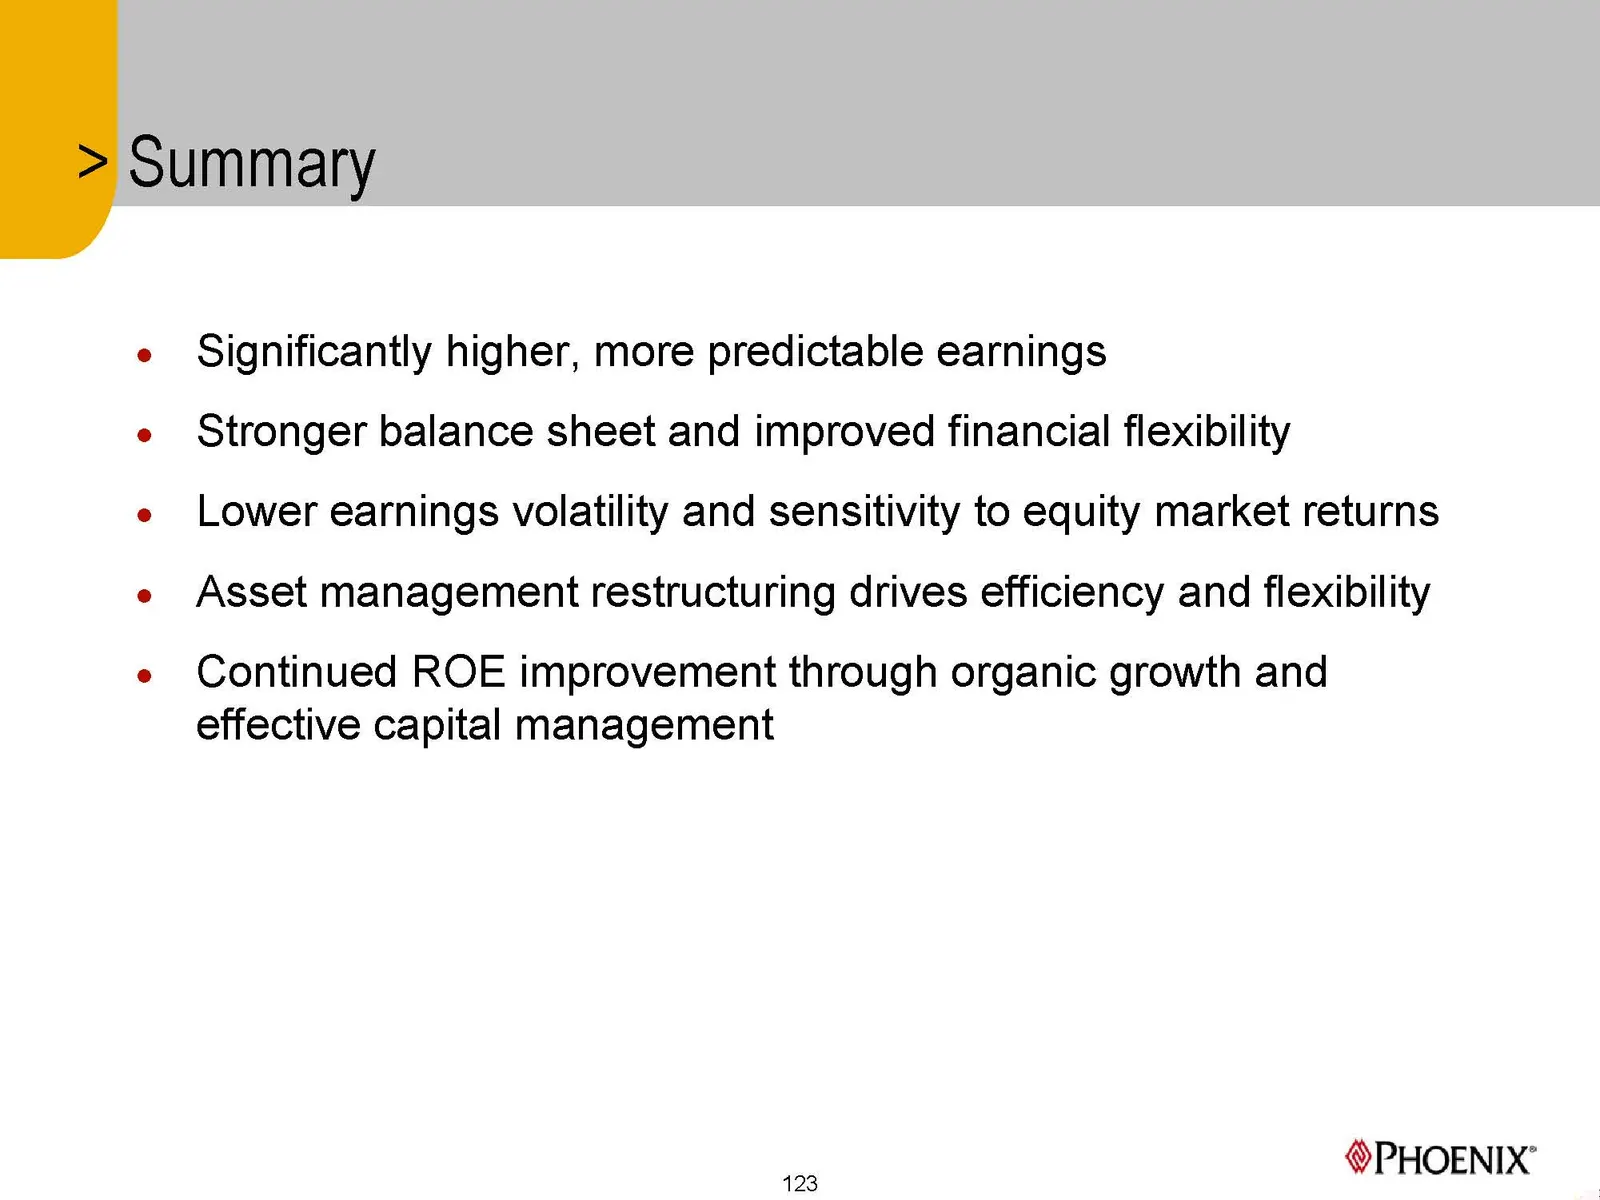
Slide 123
Slide 124
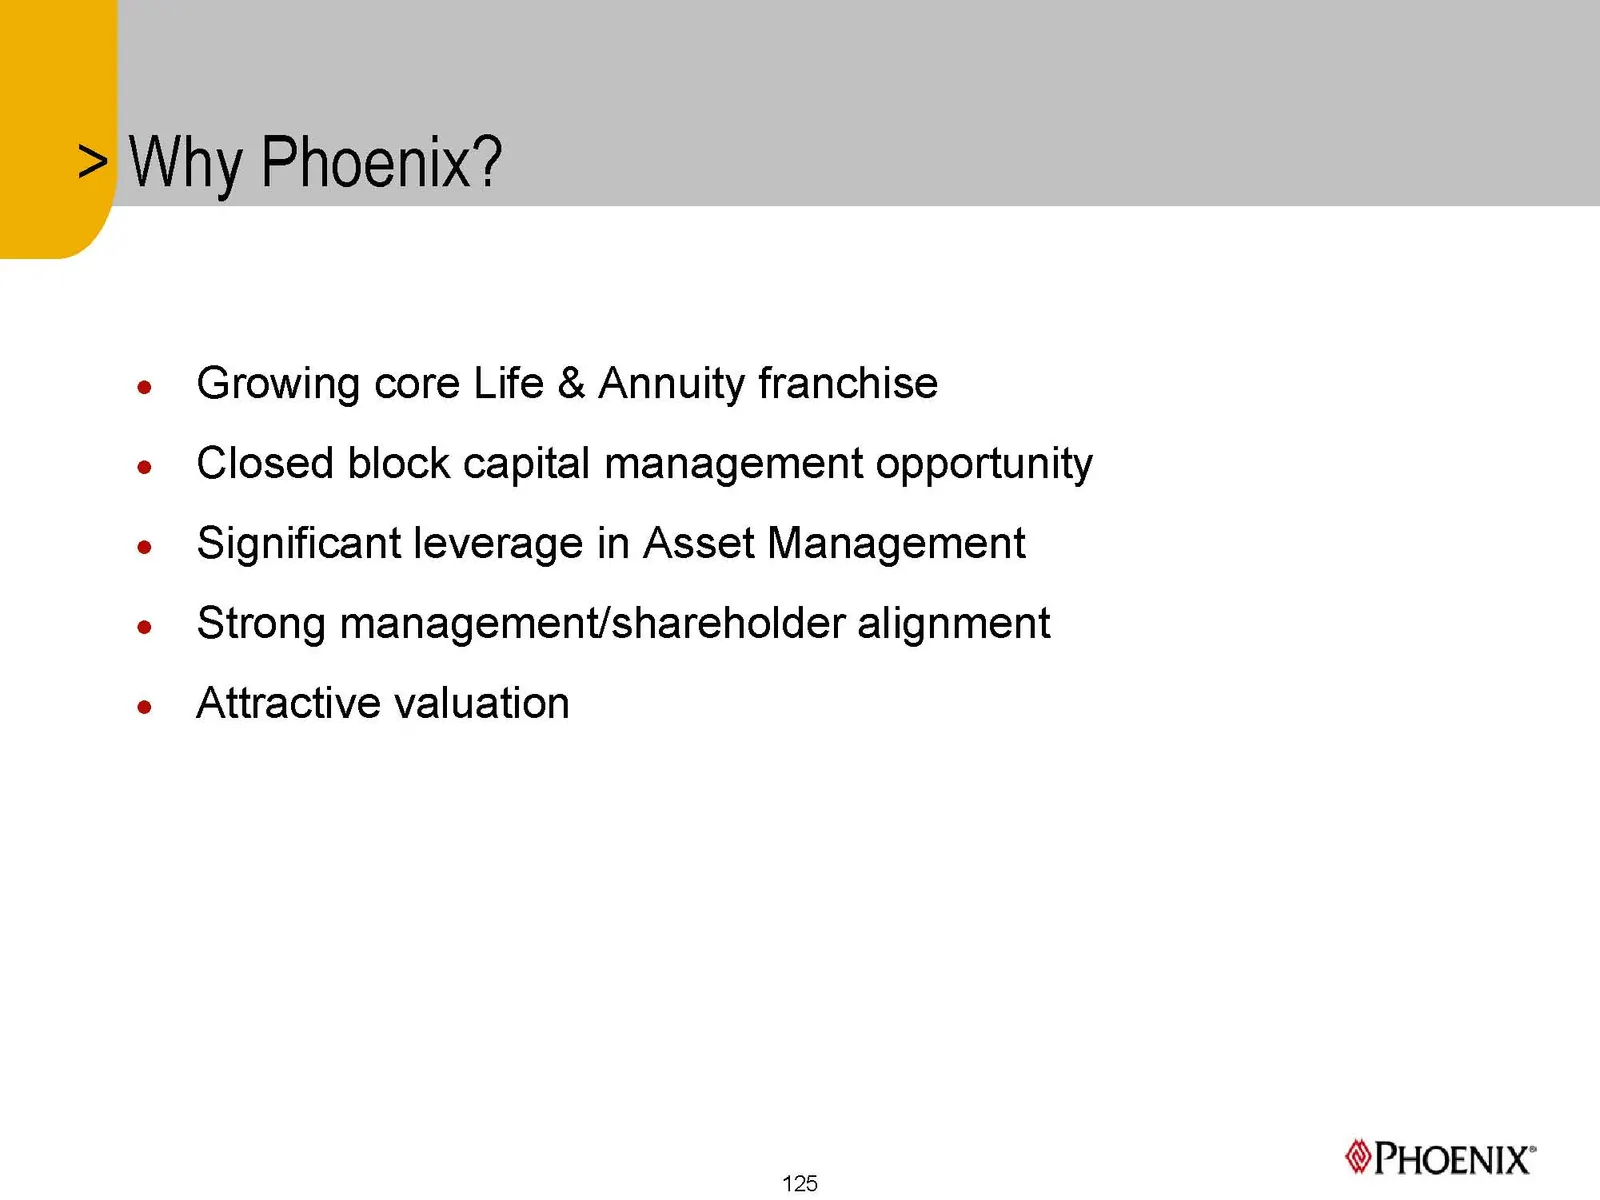
Slide 125

Slide 126
Slide 127
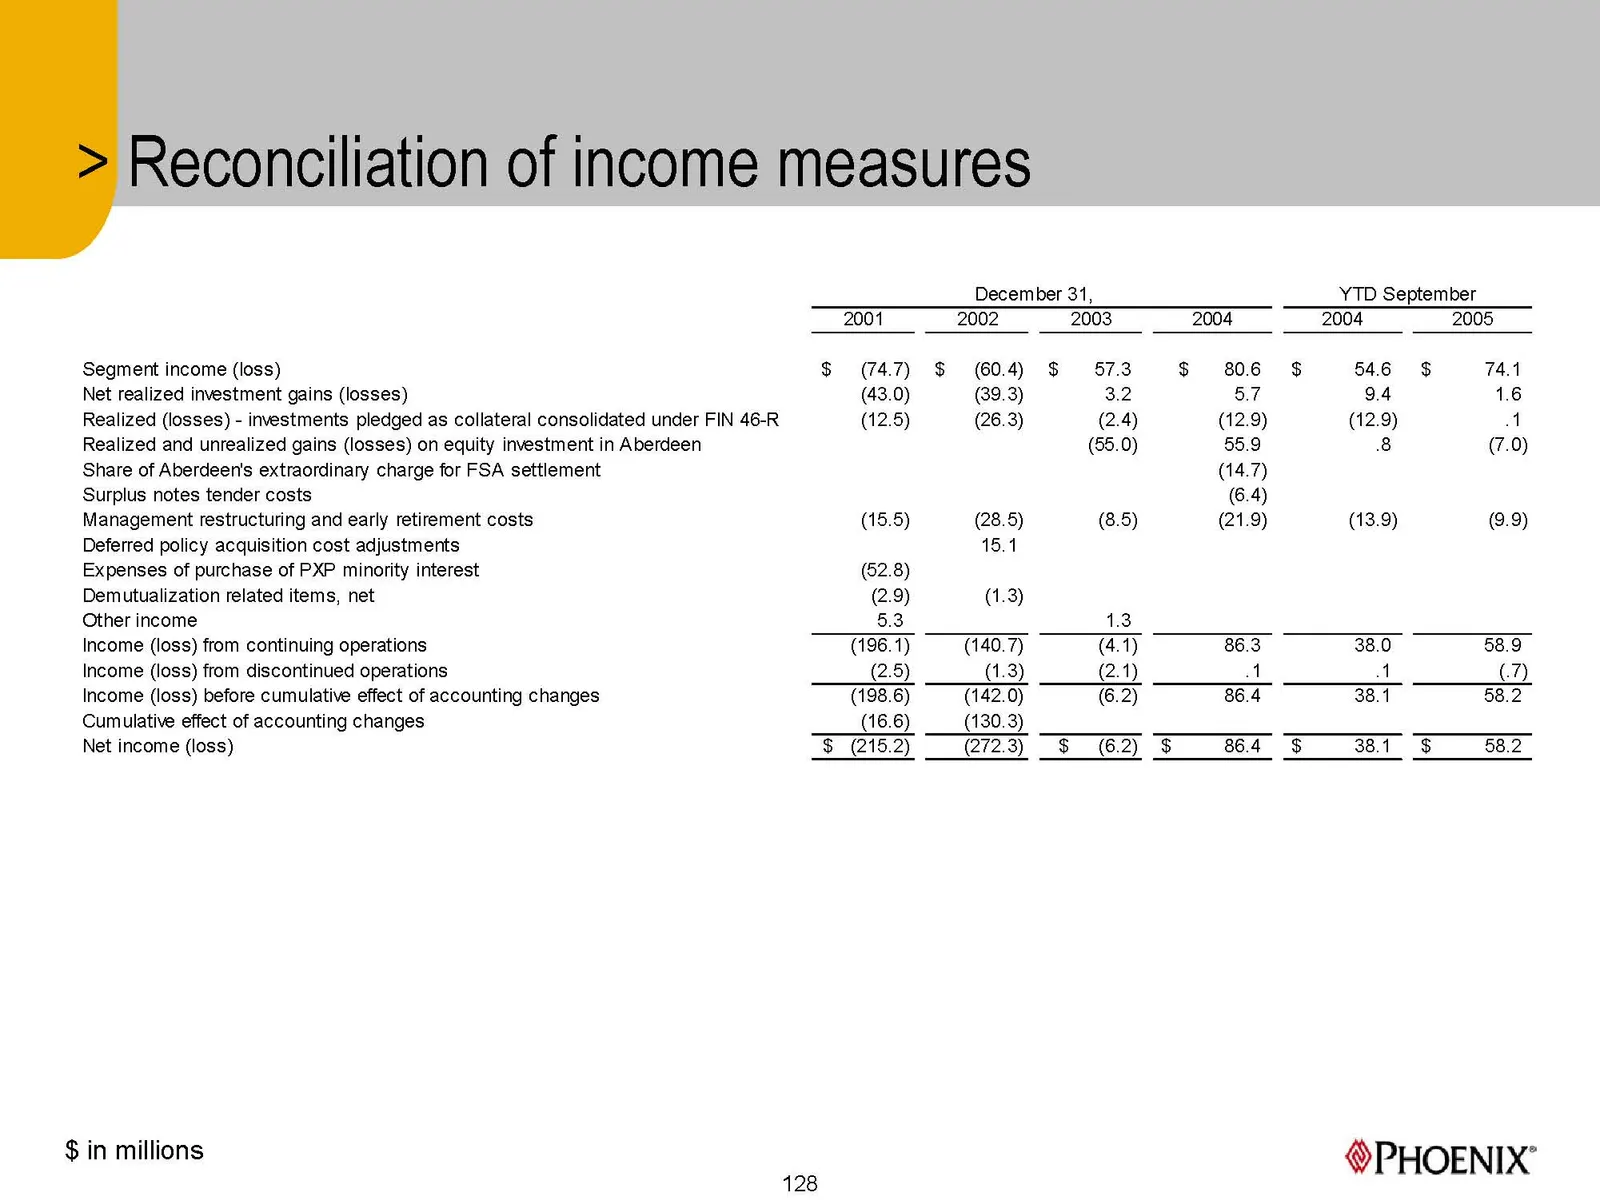
Slide 128
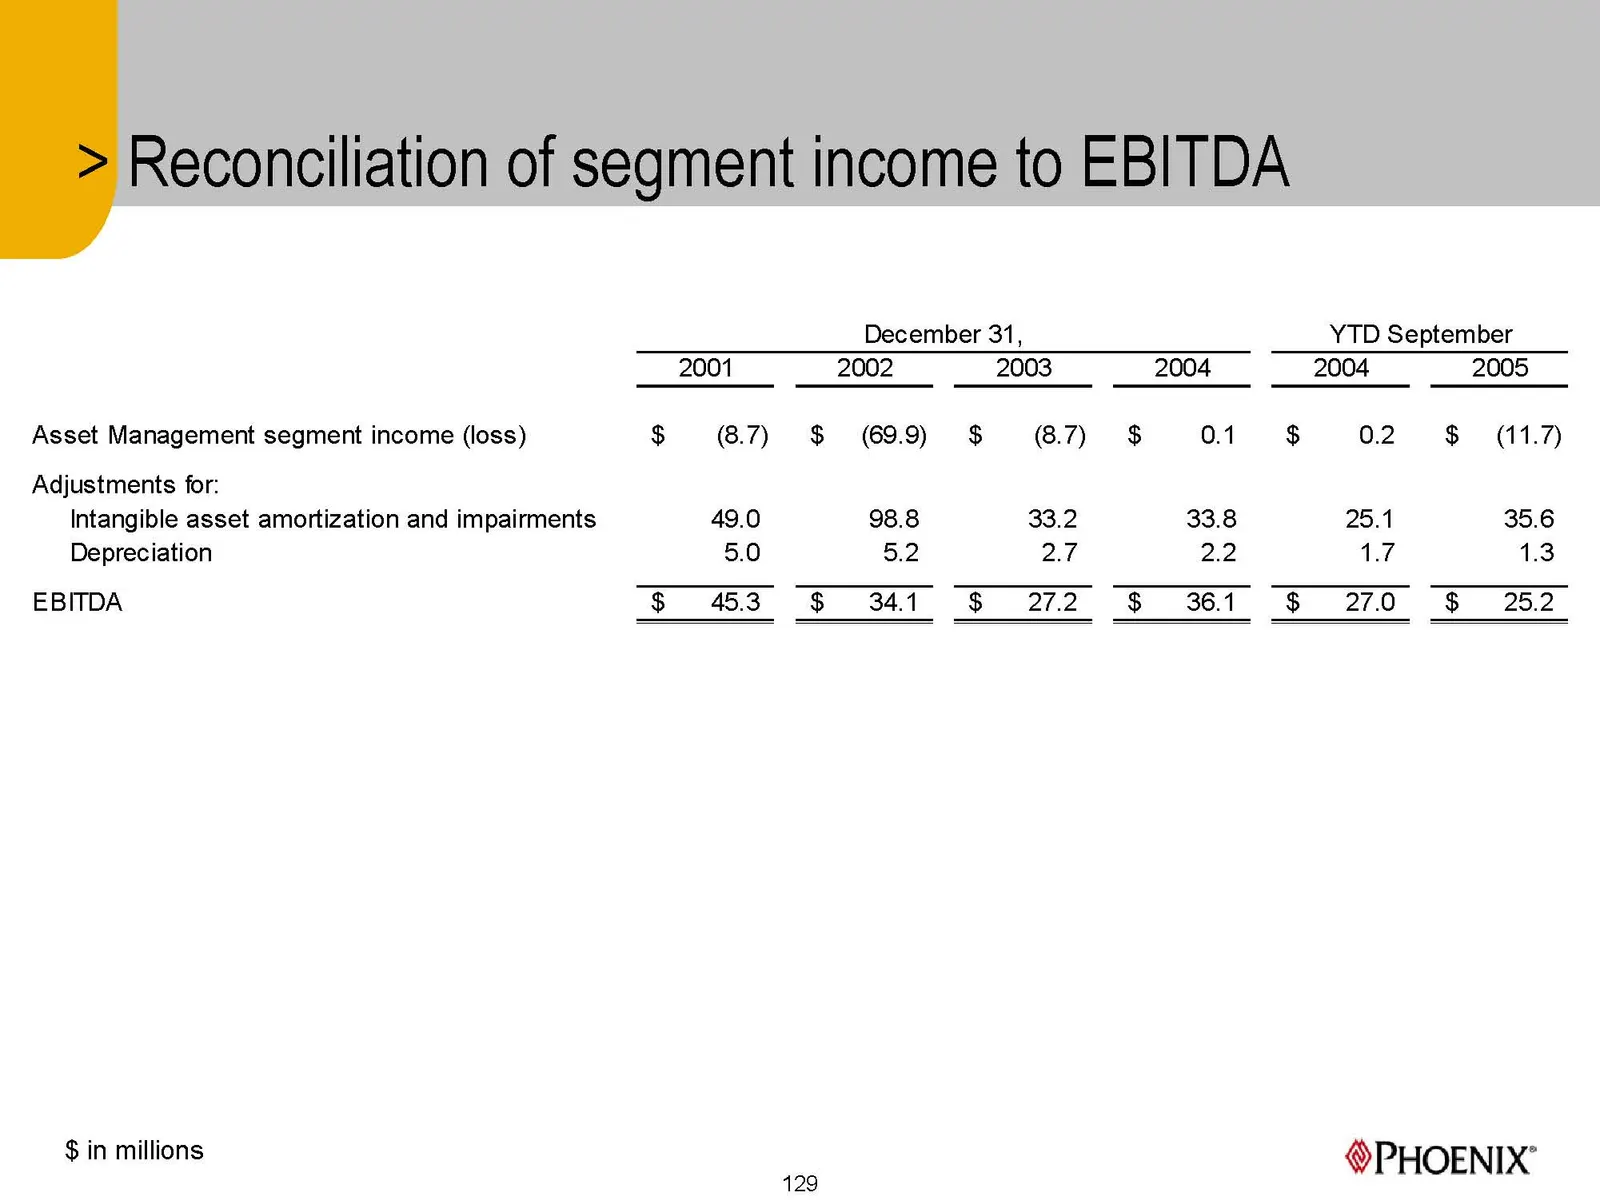
Slide 129
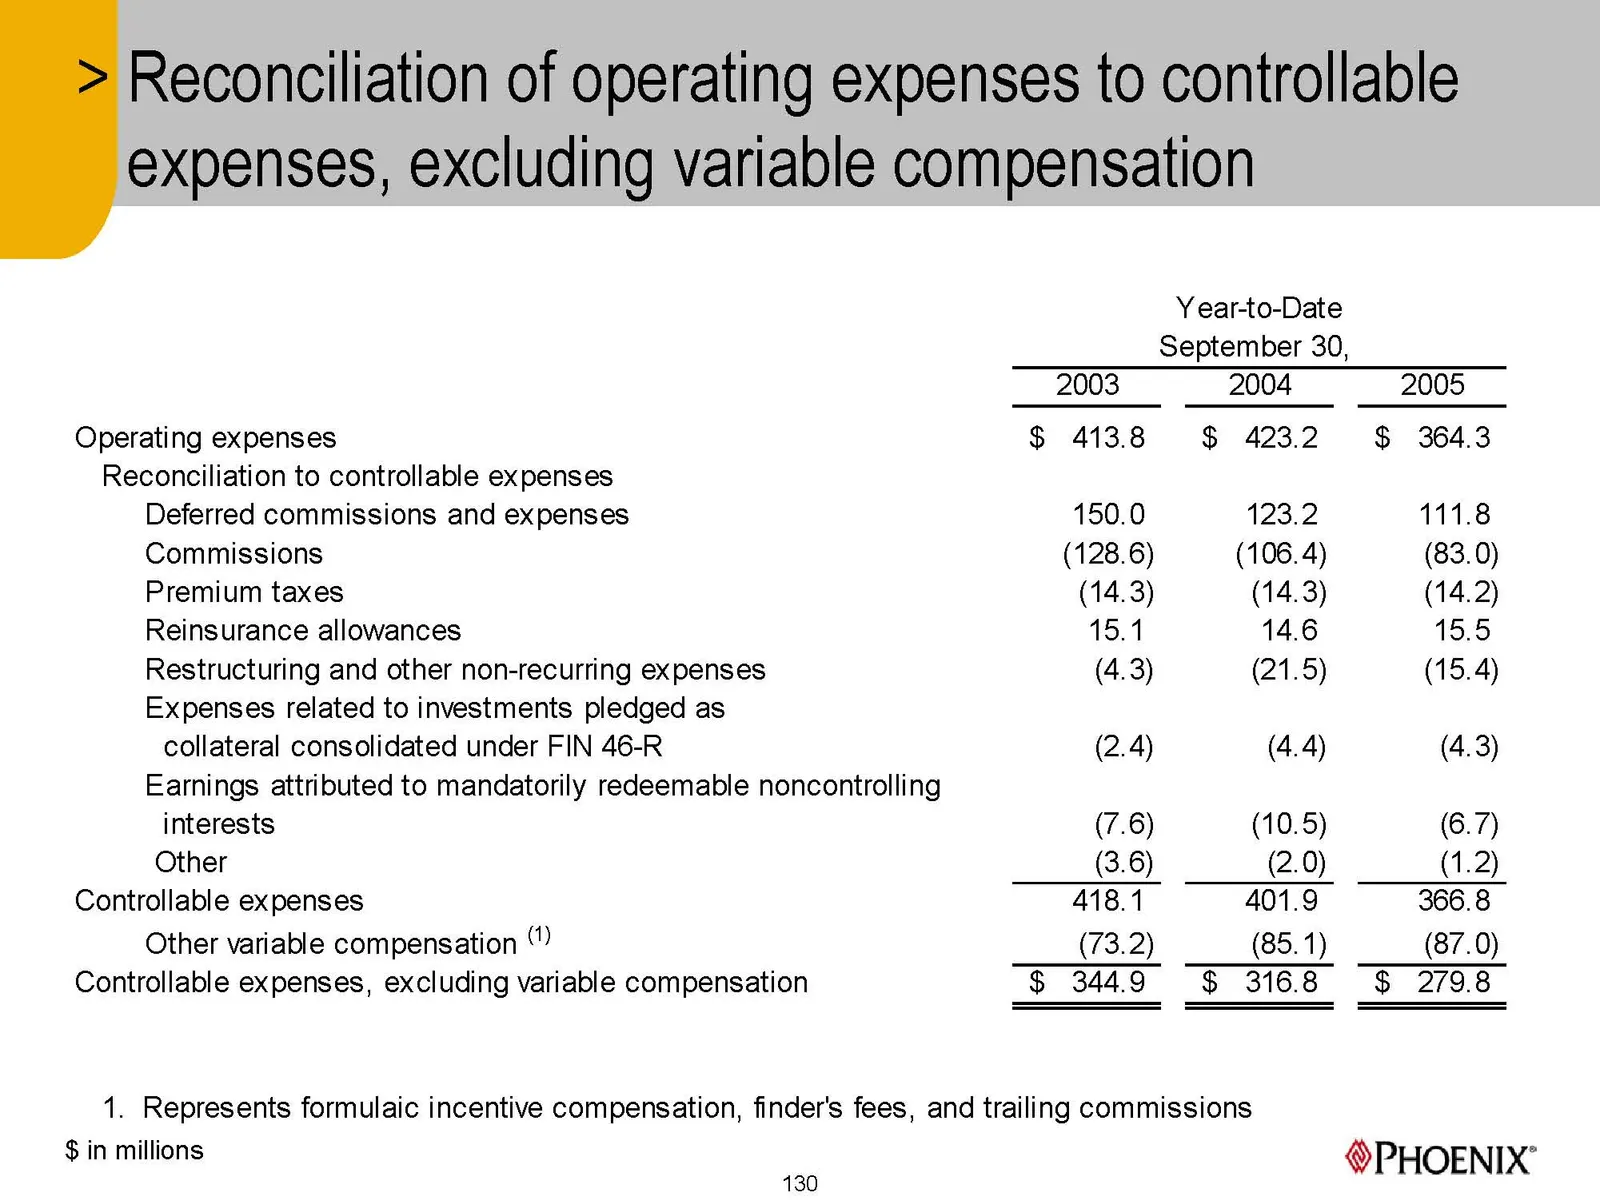
Slide 130
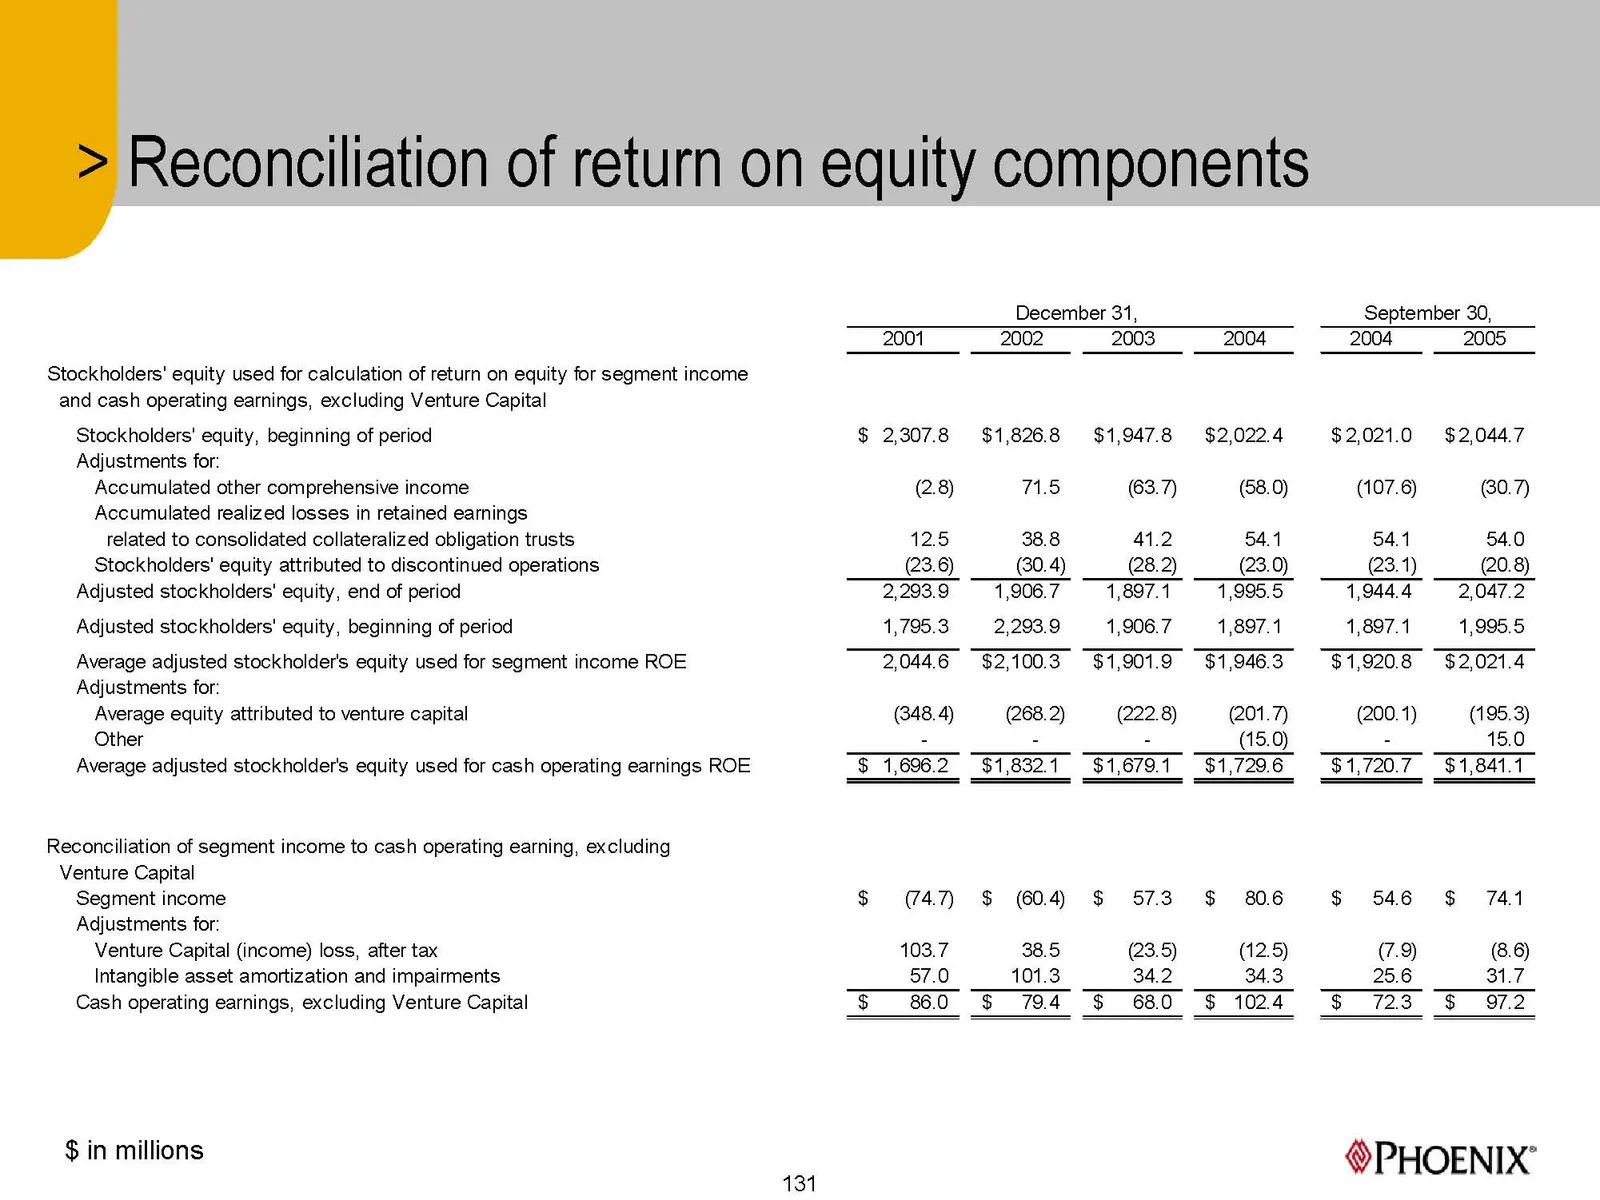
Slide 131

Slide 132
Source: SEC EDGAR · 8-K filed Dec 13, 2005
More decks from The Phoenix Companies Inc
 Q1 2016 Earnings Presentation17 slides · May 10, 2016
 Q4 2015 Earnings Presentation19 slides · Mar 15, 2016
 Q3 2015 Earnings Presentation18 slides · Nov 9, 2015
 Merger or Acquisition (September 2015)8 slides · Sep 29, 2015
 FY2014 Earnings Presentation26 slides · Mar 31, 2015
 Q1 2012 Earnings Presentation25 slides · May 4, 2012