Radware Ltd. · NASDAQ:RDWR
Radware — Q4 2017 Earnings Presentation
31 slides from Radware's earnings presentation, February 2018

Slide 1: Investor Presentation Q4 2017
INVESTOR PRESENTATION Q4 2017 February 2018
Slide 2: Safe Harbor
Safe Harbor 2 Disclaimer This presentation may contain product development, profitability and forward-looking information with other risks detailed in Radware's respect to plans, projections, or future reports filed from time to time with performance of Radware and its the Securities and Exchange su
Slide 3: Worldwide leader in application security & delivery
3 Is a worldwide leader in APPLICATION SECURITY & DELIVERY Across Datacenter and Cloud Intro
Slide 4: Impact of digital transformation
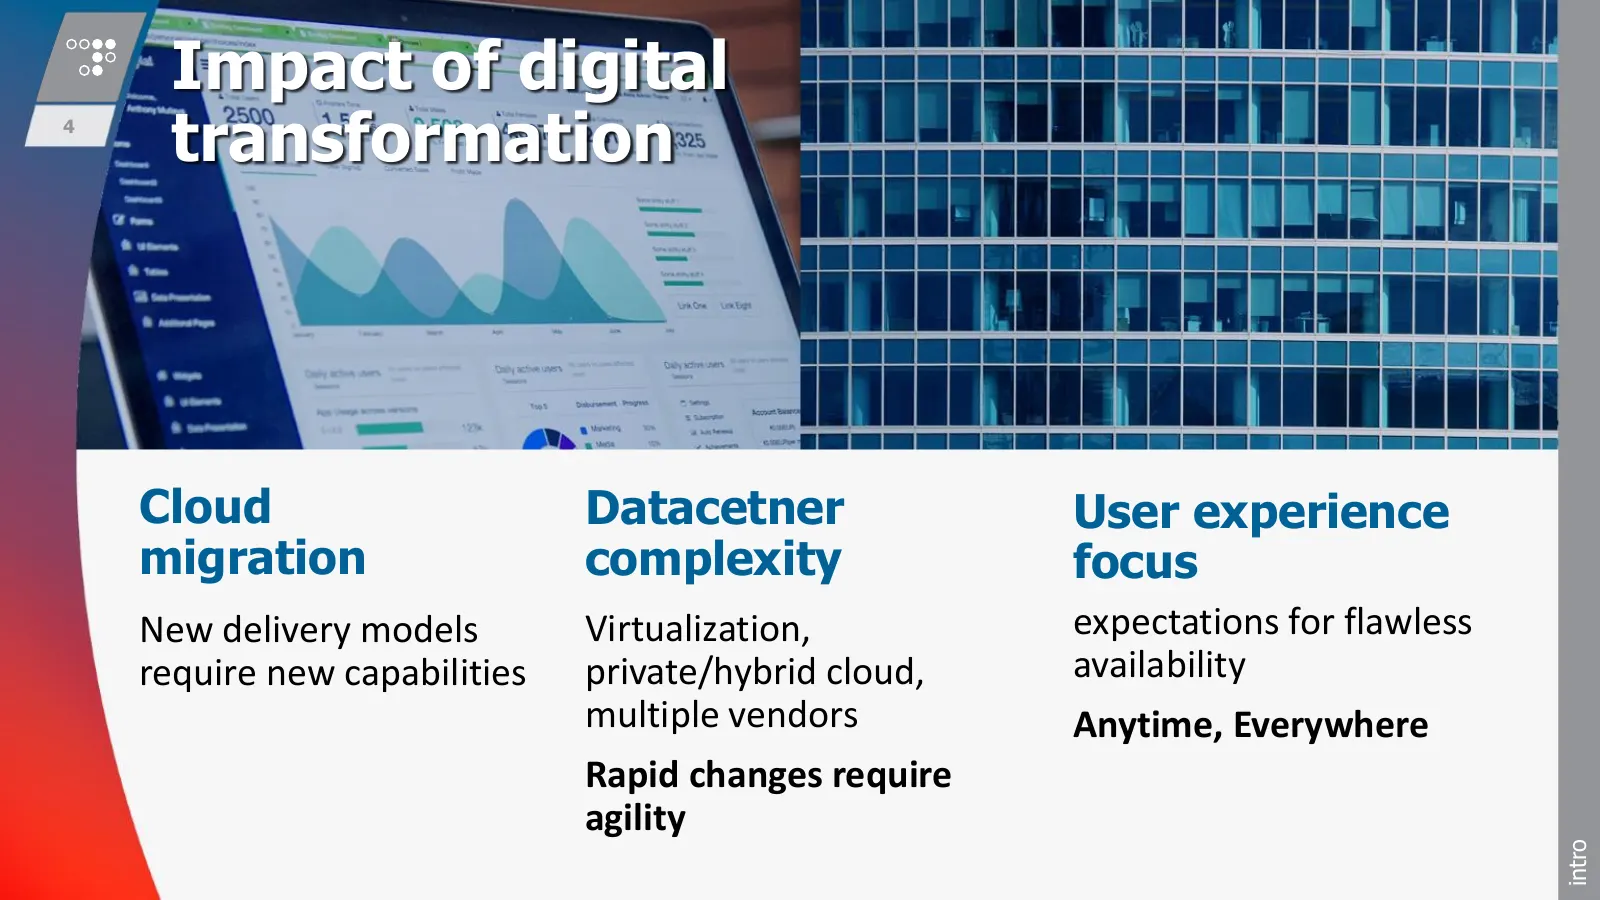
Impact of digital 4 transformation Cloud Datacetner User experience migration complexity focus New delivery models Virtualization, expectations for flawless require new capabilities private/hybrid cloud, availability multiple vendors Anytime, Everywhere Rapid changes require agility intro
Slide 5: Current state of cyber attacks
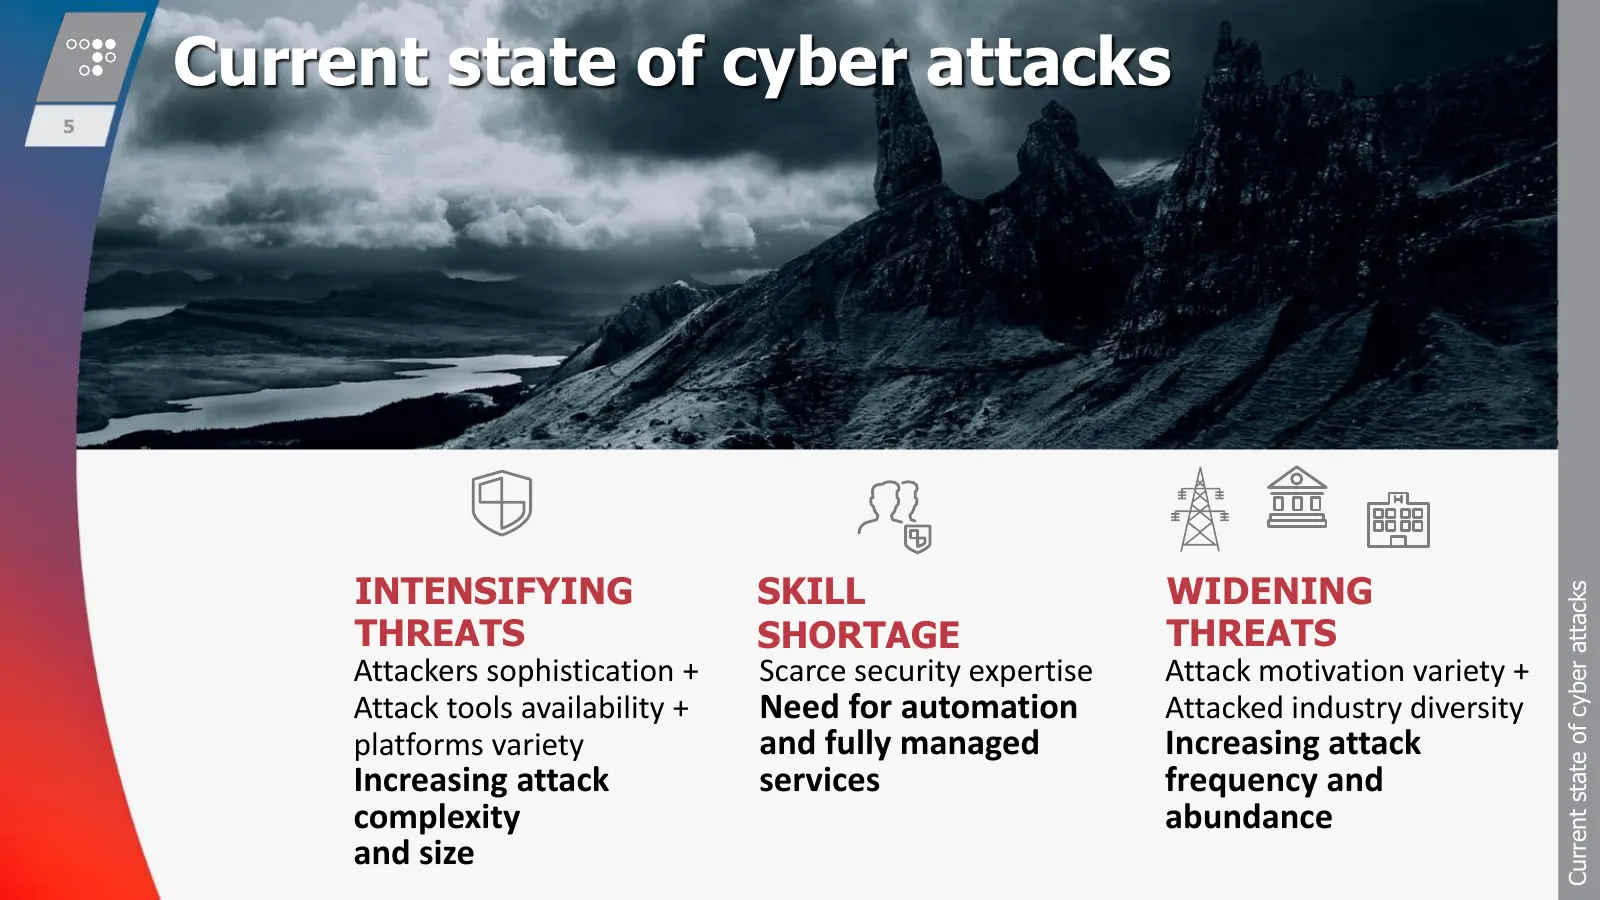
Current state of cyber attacks 5 INTENSIFYING SKILL WIDENING Current state of cyber attacks THREATS SHORTAGE THREATS Attackers sophistication + Scarce security expertise Attack motivation variety + Attack tools availability + Need for automation Attacked industry diversity platforms variety and full
Slide 6: Current state of cyber attacks
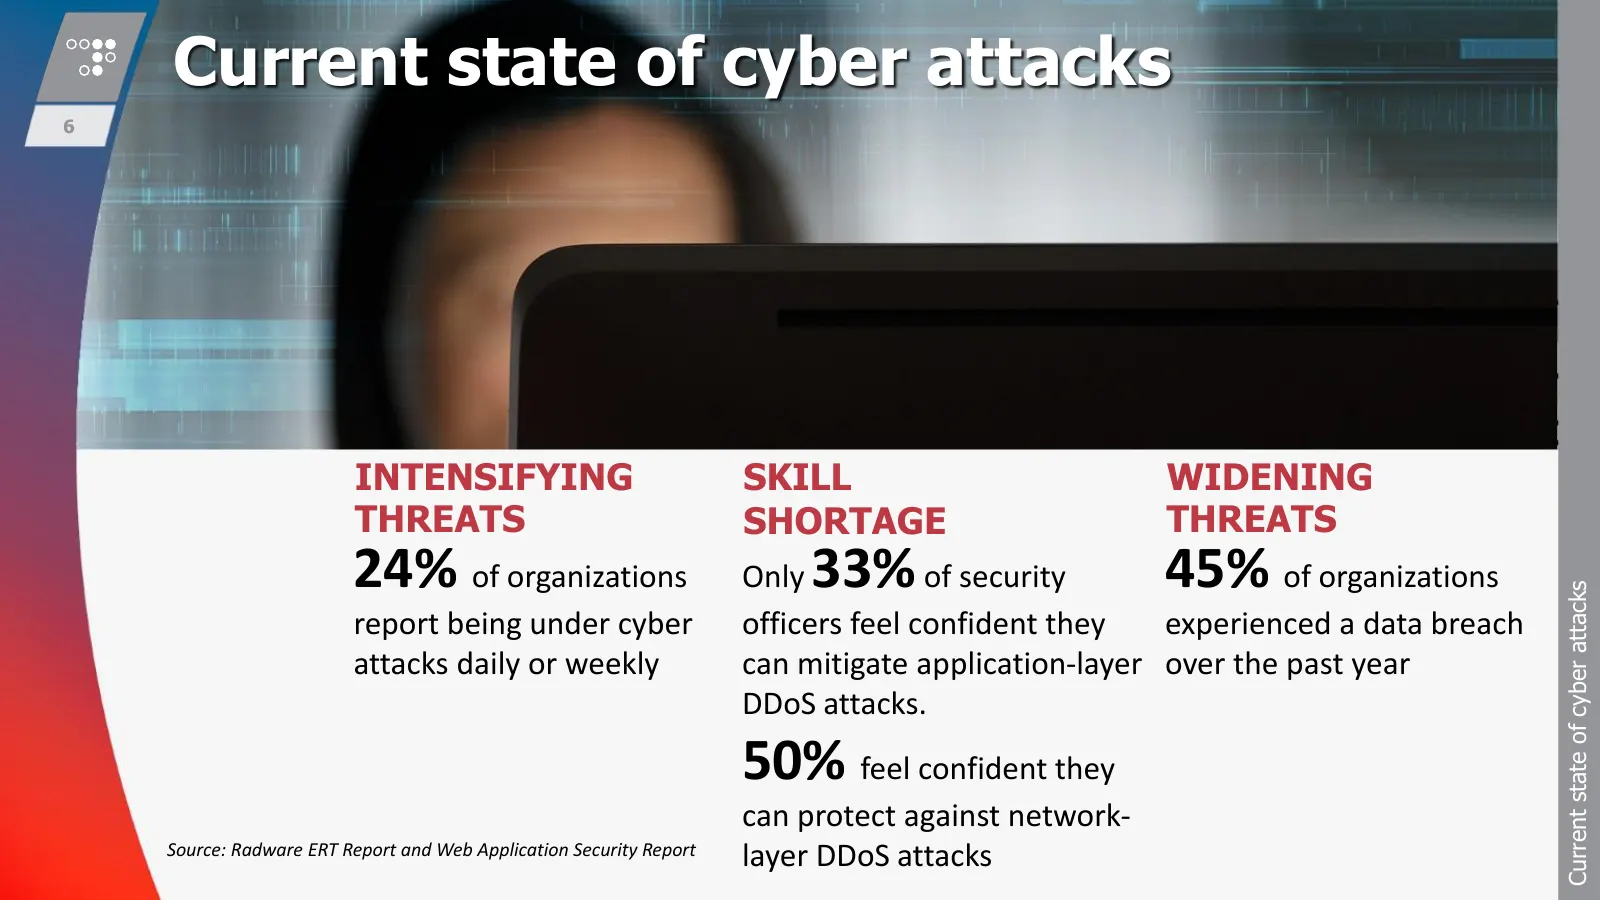
Current state of cyber attacks 6 INTENSIFYING SKILL WIDENING THREATS SHORTAGE THREATS 24% of organizations Only 33% of security 45% of organizations Current state of cyber attacks report being under cyber officers feel confident they experienced a data breach attacks daily or weekly can mitigate app
Slide 7: Our Mission: Securing the Digital User Experience
Our Mission: 7 Securing The Digital User Experience For every Through With a business continued comprehensive model. innovation. offering. intro
Slide 8: Everywhere
8 EVERYWHERE To meet every business model ARCHITECTURE
Slide 9: Solutions Architecture
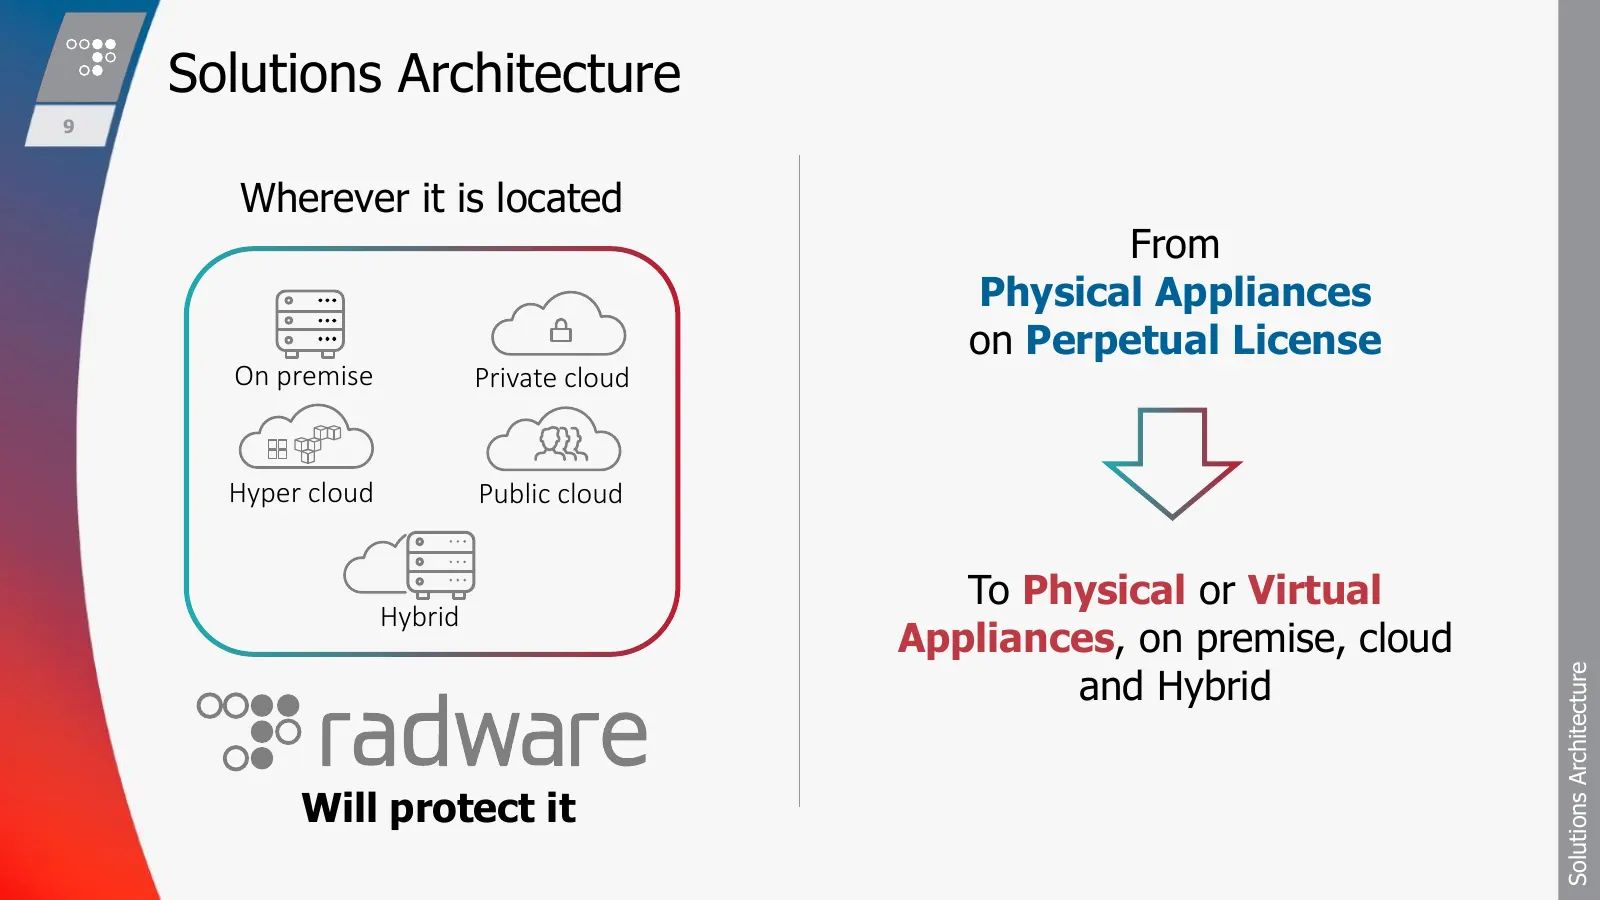
Solutions Architecture 9 Wherever it is located From Physical Appliances on Perpetual License On premise Private cloud Hyper cloud Public cloud To Physical or Virtual Hybrid Appliances, on premise, cloud and Hybrid Solutions Architecture Will protect it
Slide 10: Effective
10 EFFECTIVE Continued Innovation TECHNOLOGY EFFECTIVE
Slide 11: Comprehensive Secured Delivery
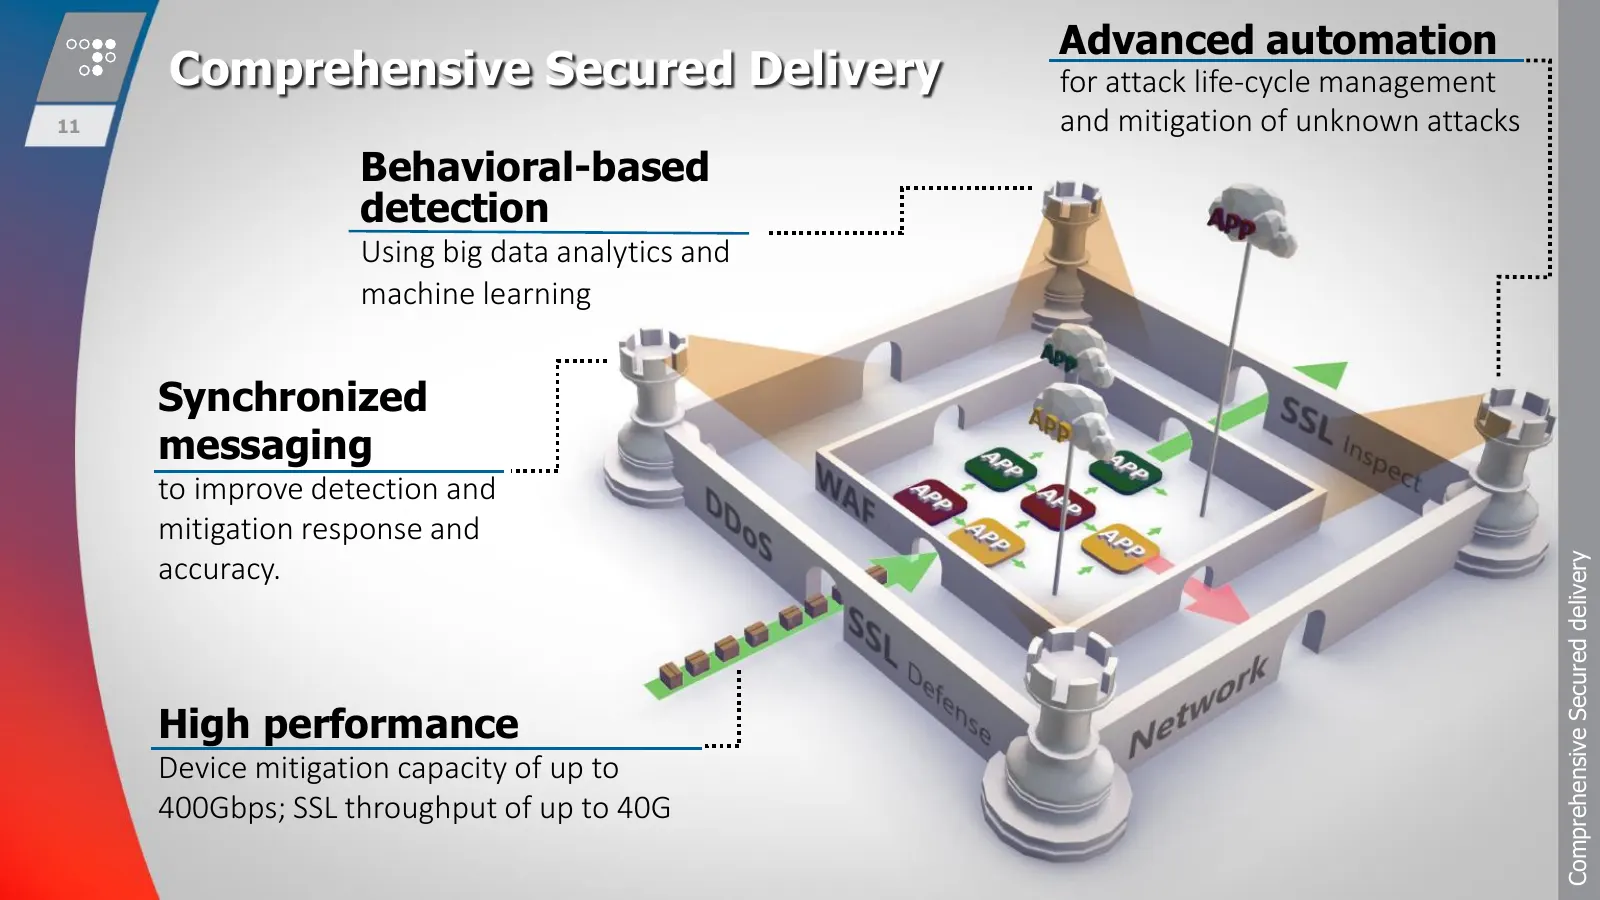
Advanced automation Comprehensive Secured Delivery for attack life-cycle management 11 and mitigation of unknown attacks Behavioral-based detection Using big data analytics and machine learning Synchronized messaging to improve detection and mitigation response and Comprehensive Secured delivery acc
Slide 12: Comprehensive Secured Delivery
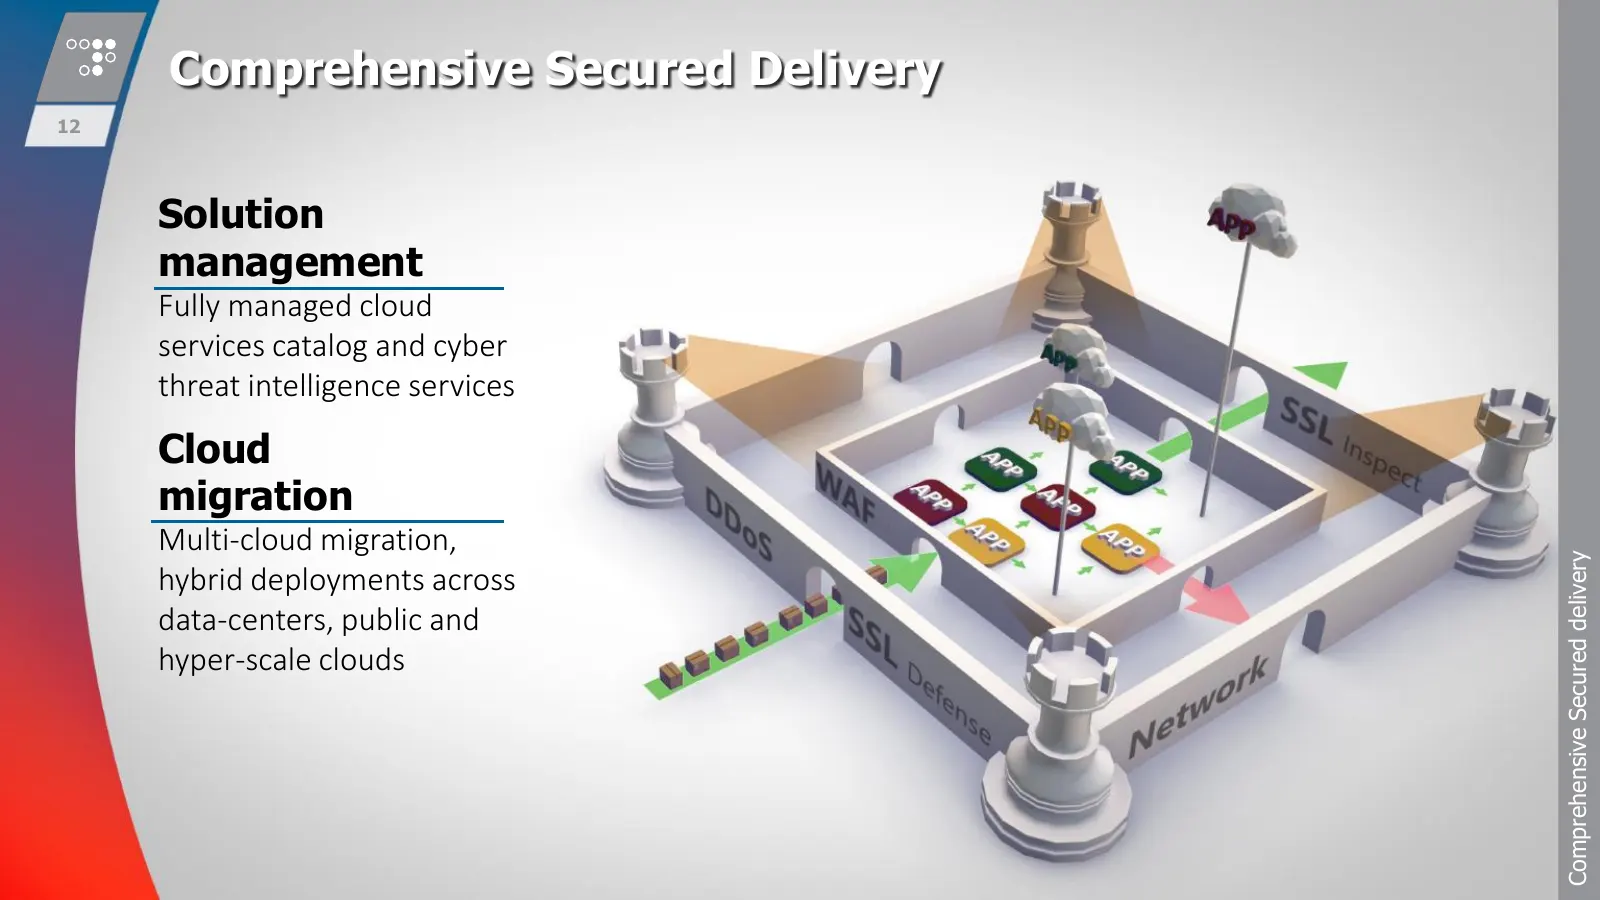
Comprehensive Secured Delivery 12 Solution management Fully managed cloud services catalog and cyber threat intelligence services Cloud migration Multi-cloud migration, Comprehensive Secured delivery hybrid deployments across data-centers, public and hyper-scale clouds
Slide 13: Easy
13 EASY Comprehensive offering SOLUTIONS Easy
Slide 14: Deep and Integrated Solution Portfolio
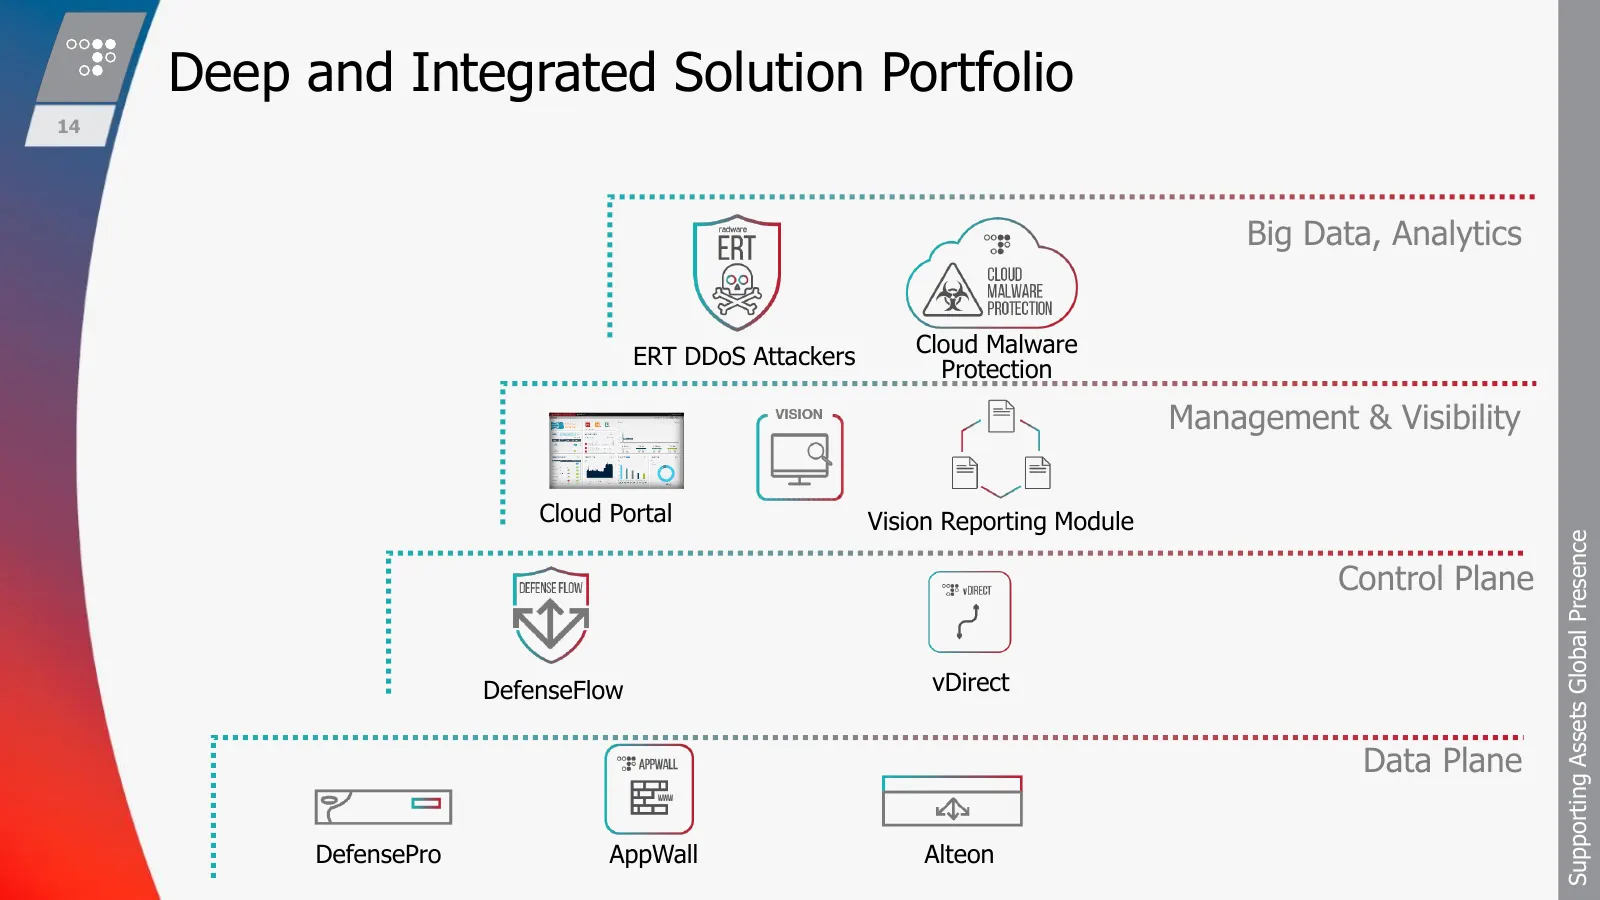
Deep and Integrated Solution Portfolio 14 Big Data, Analytics Cloud Malware ERT DDoS Attackers Protection Management & Visibility Cloud Portal Vision Reporting Module Supporting Assets Global Presence Control Plane DefenseFlow vDirect Data Plane DefensePro AppWall Alteon
Slide 15: Success Factors
15 SUCCESS FACTORS What makes it work Success factor
Slide 16: Leading Technology: Partners and Recognition
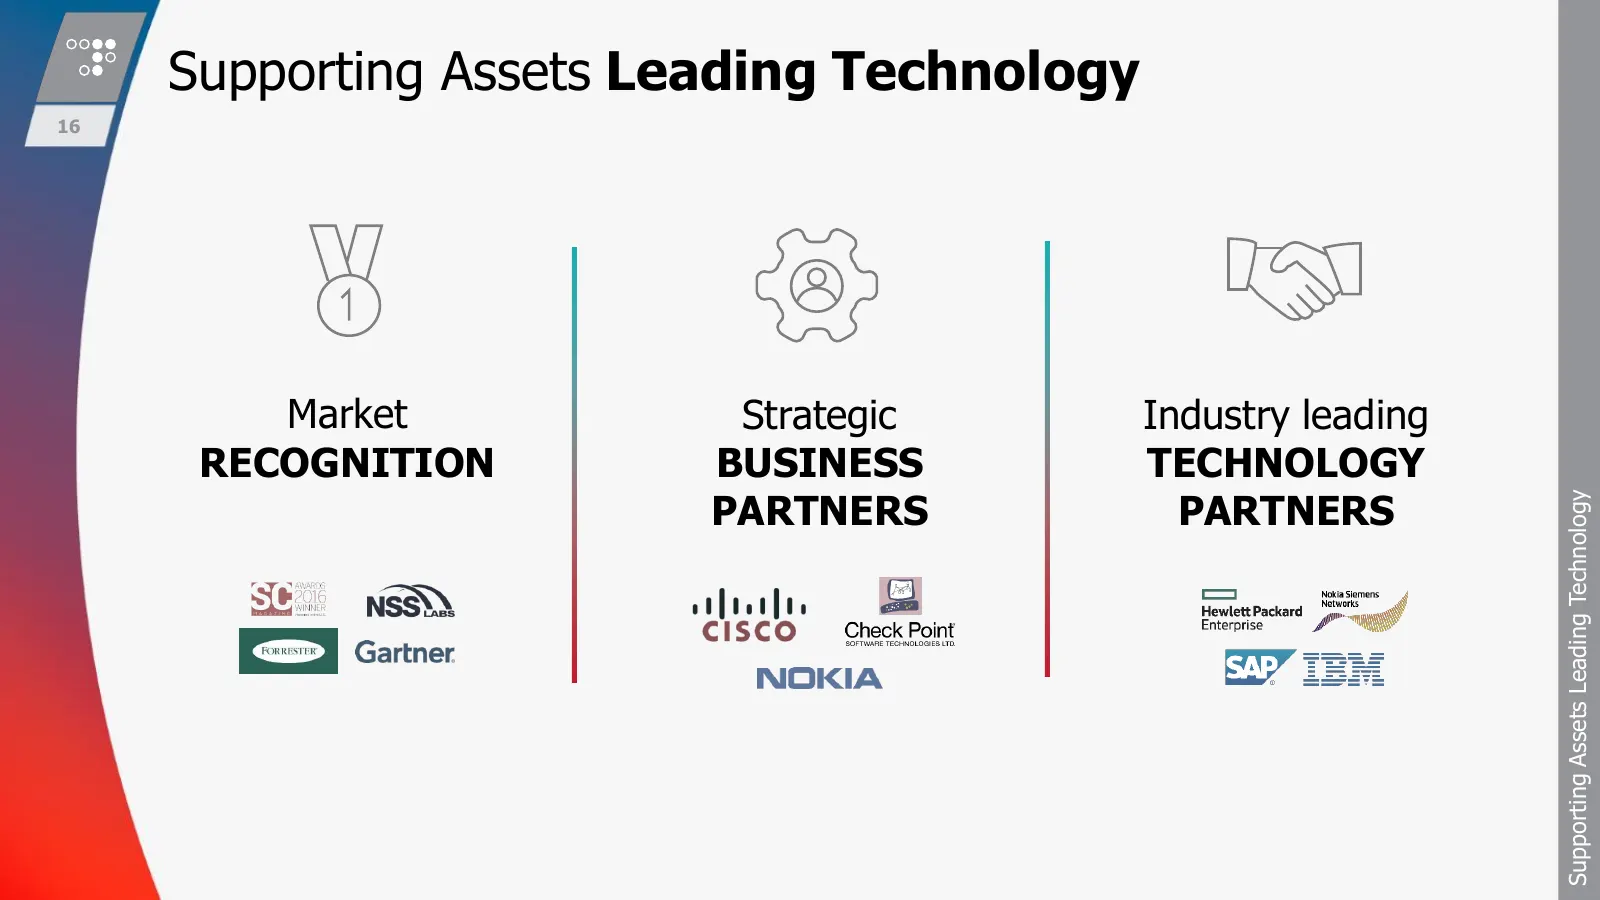
Supporting Assets Leading Technology 16 Market Strategic Industry leading RECOGNITION BUSINESS TECHNOLOGY PARTNERS PARTNERS Supporting Assets Leading Technology
Slide 17: Over 12,500 Customers
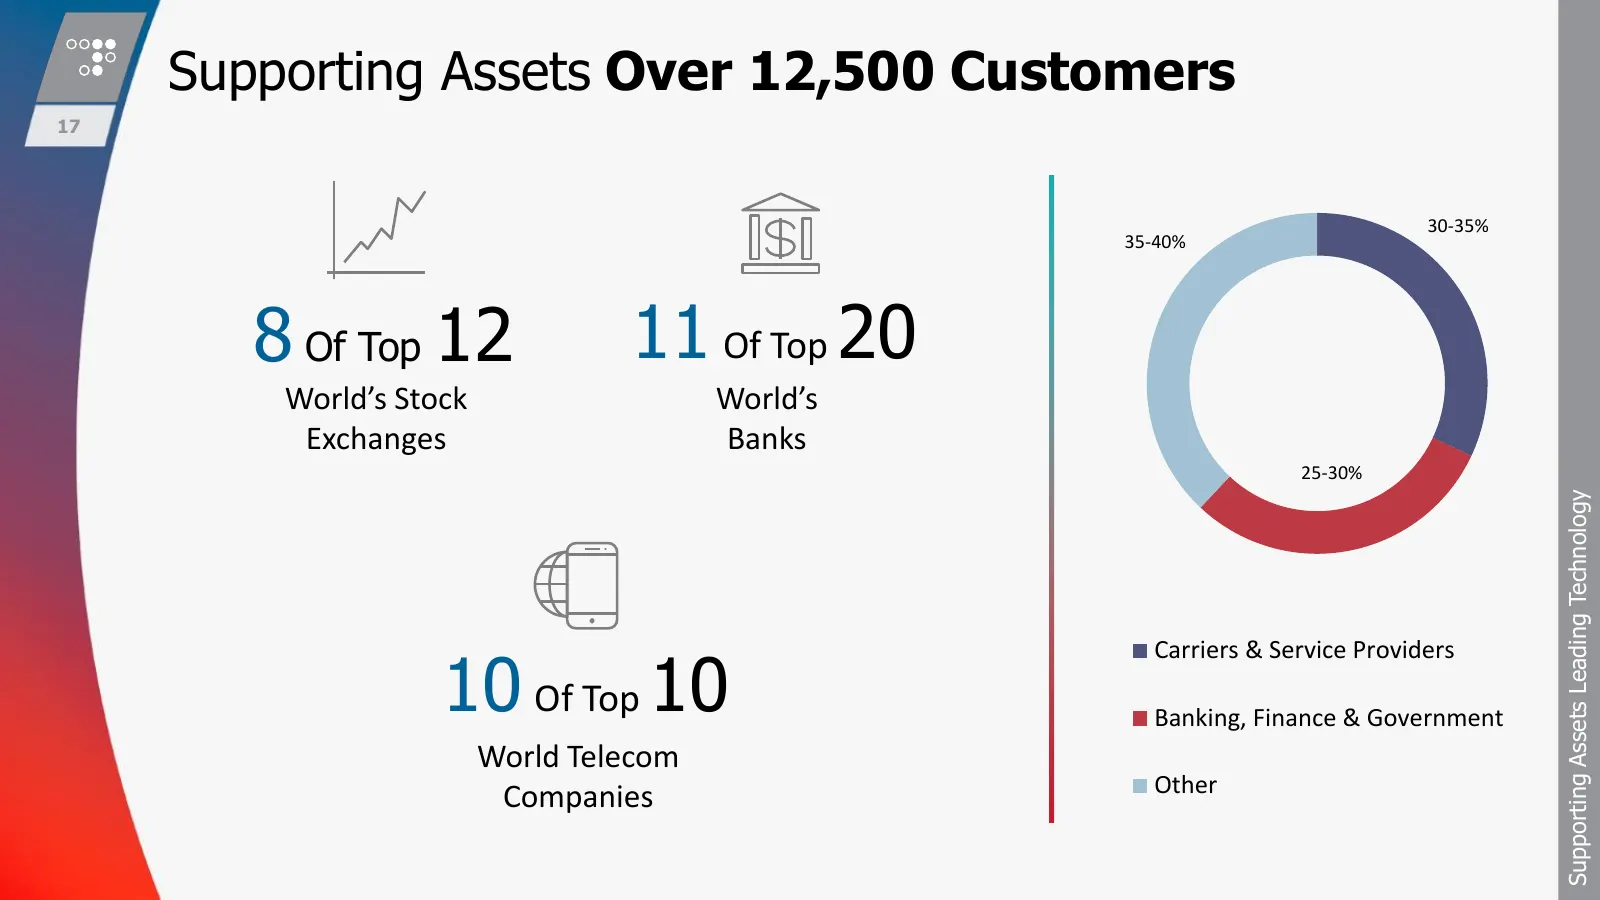
Supporting Assets Over 12,500 Customers 17 30-35% 35-40% 8 Of Top 12 11 Of Top 20 World’s Stock World’s Exchanges Banks 25-30% Supporting Assets Leading Technology 10 Of Top 10 Carriers & Service Providers Banking, Finance & Government World Telecom Other Companies
Slide 18: Global Presence
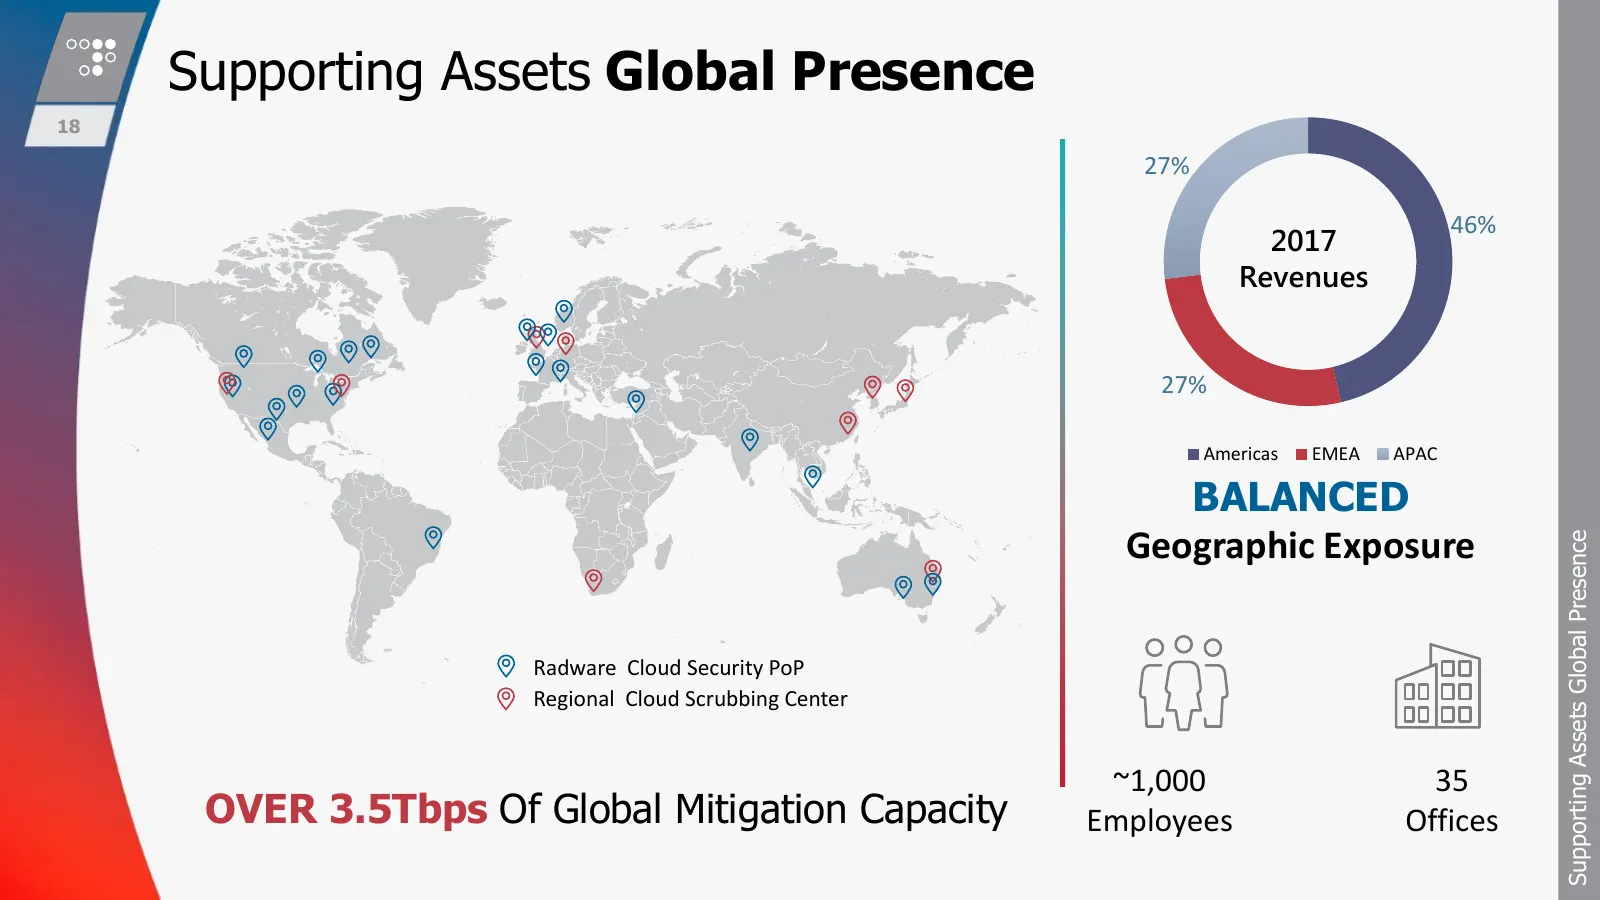
Supporting Assets Global Presence 18 27% 46% 2017 Revenues 27% Americas EMEA APAC BALANCED Geographic Exposure Supporting Assets Global Presence Radware Cloud Security PoP Regional Cloud Scrubbing Center ~1,000 35 OVER 3.5Tbps Of Global Mitigation Capacity Employees Offices
Slide 19: Our Business Strategy For Growth
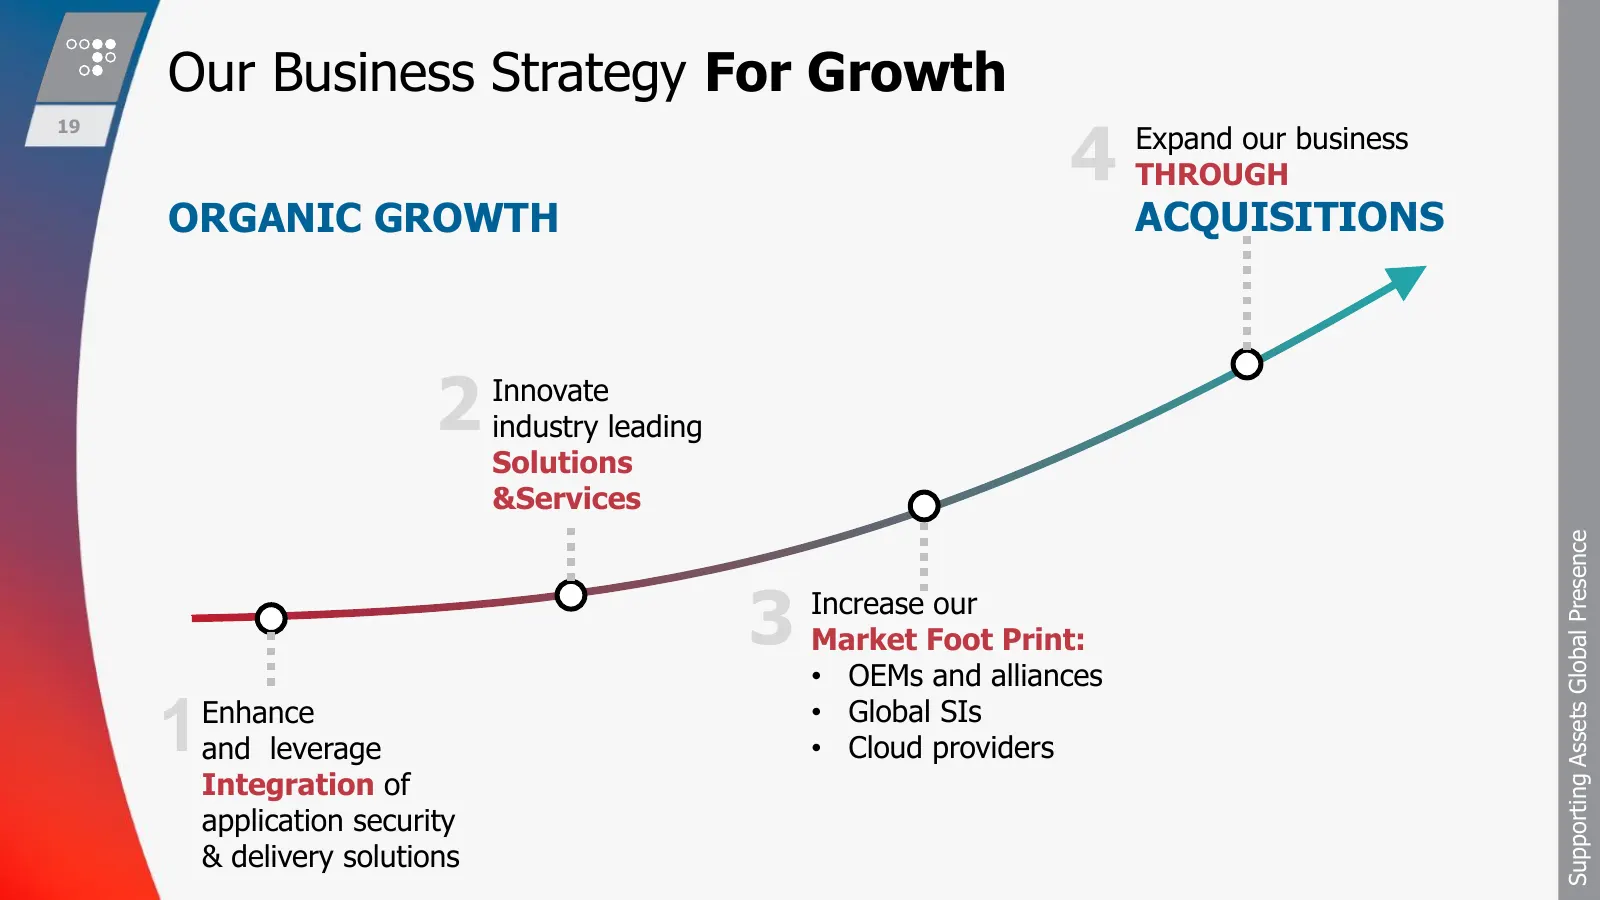
Our Business Strategy For Growth 4 19 Expand our business THROUGH ORGANIC GROWTH ACQUISITIONS 2 Innovate industry leading Solutions &Services Supporting Assets Global Presence 3 Increase our Market Foot Print: • OEMs and alliances 1 Enhance and leverage • Global SIs • Cloud providers Integration of
Slide 20: Financials
20 FINANCIALS Updated for Q4 2017 financials
Slide 21: Investment Highlights
21 Investment Highlights • Strong position in a growing market • Successful business model transition • High and growing recurring revenues • Strong and stable gross margins • Consistent cash generation
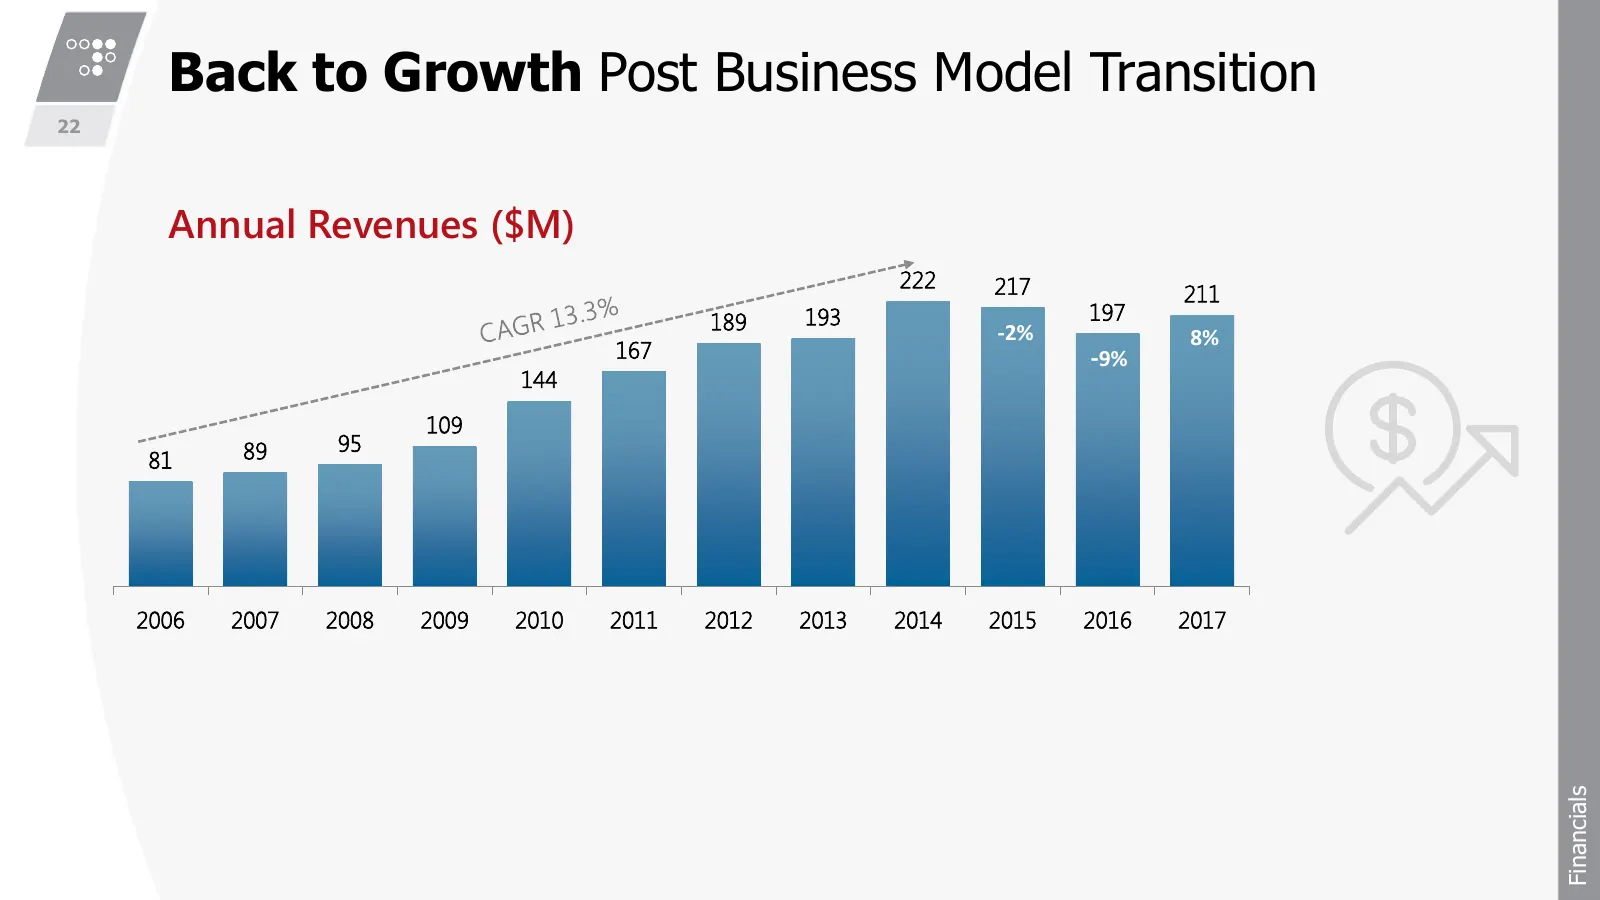
Slide 22: Back to Growth Post Business Model Transition
Back to Growth Post Business Model Transition 22 Annual Revenues ($M) 222 217 211 189 193 197 -2% 8% 167 -9% 144 109 89 95 81 2006 2007 2008 2009 2010 2011 2012 2013 2014 2015 2016 2017 Financials
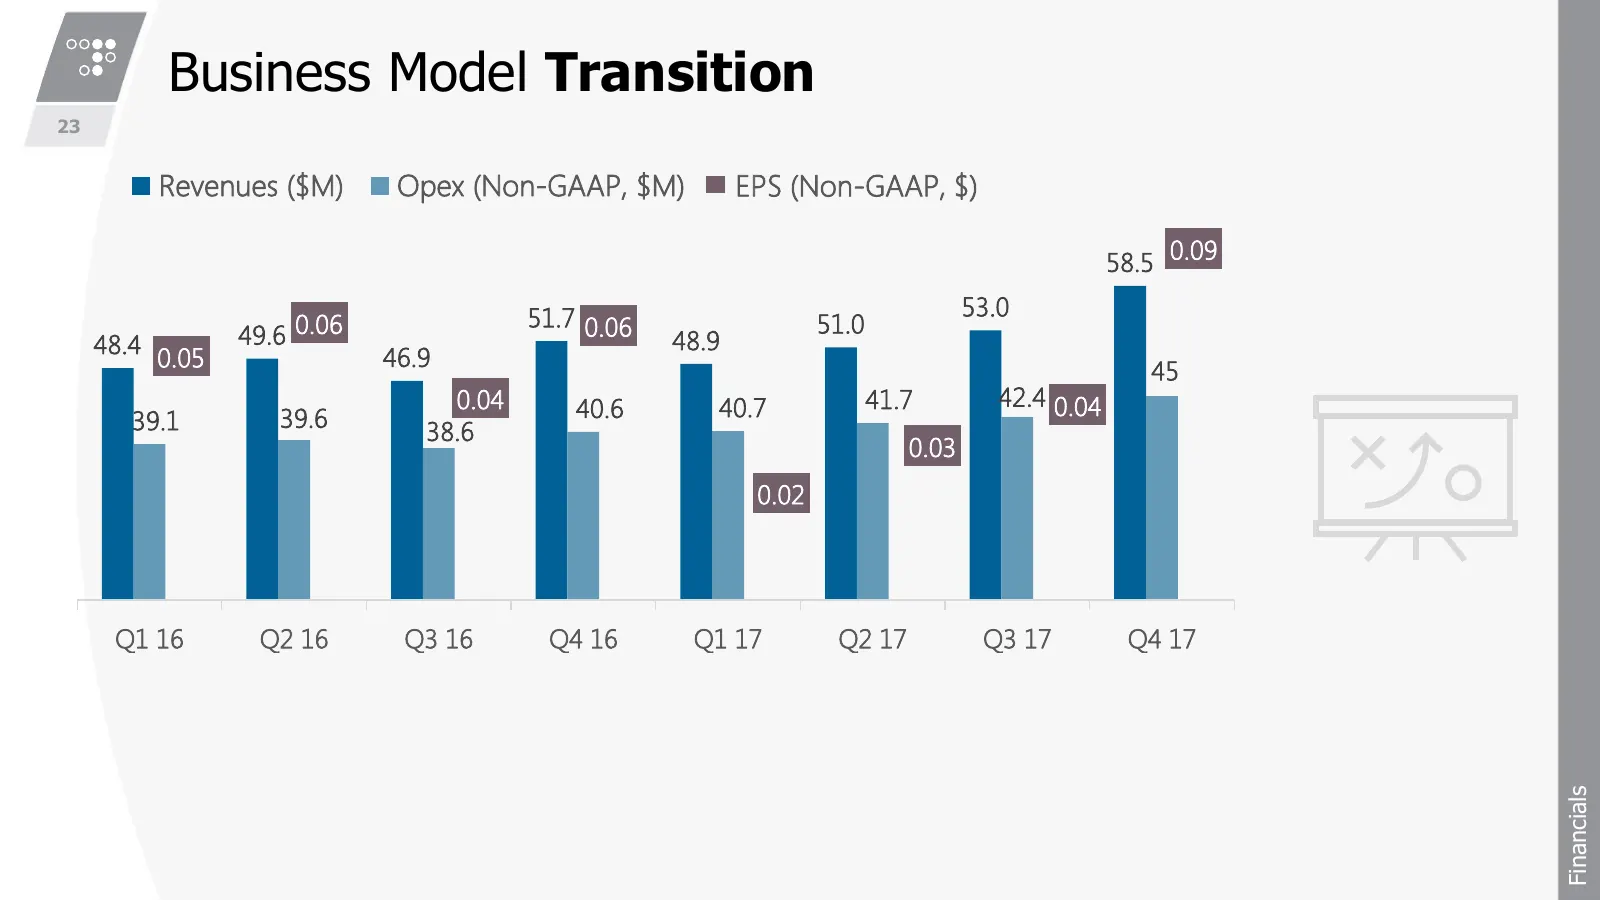
Slide 23: Business Model Transition
Business Model Transition 23 Revenues ($M) Opex (Non-GAAP, $M) EPS (Non-GAAP, $) 58.5 0.09 51.7 0.06 53.0 49.6 0.06 51.0 48.4 0.05 48.9 46.9 45 0.04 40.6 40.7 41.7 42.4 0.04 39.1 39.6 38.6 0.03 0.02 Q1 16 Q2 16 Q3 16 Q4 16 Q1 17 Q2 17 Q3 17 Q4 17 Financials
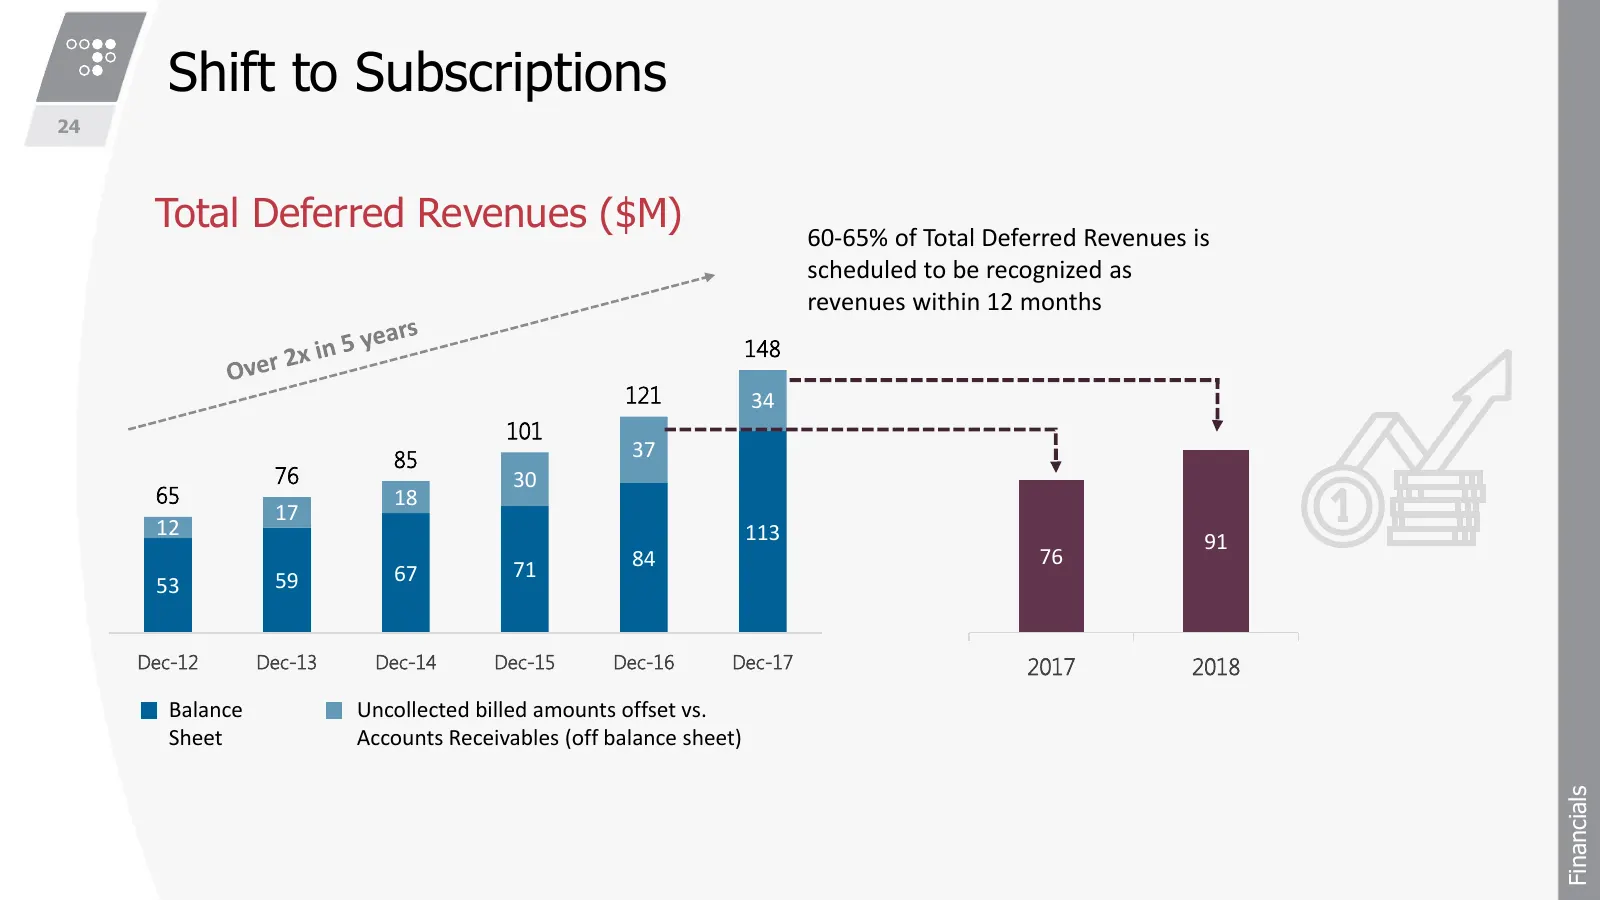
Slide 24: Shift to Subscriptions
Shift to Subscriptions 24 Total Deferred Revenues ($M) 60-65% of Total Deferred Revenues is scheduled to be recognized as revenues within 12 months 148 121 34 101 85 37 76 30 65 18 17 12 113 91 84 76 59 67 71 53 Dec-12 Dec-13 Dec-14 Dec-15 Dec-16 Dec-17 2017 2018 Balance Uncollected billed amounts o
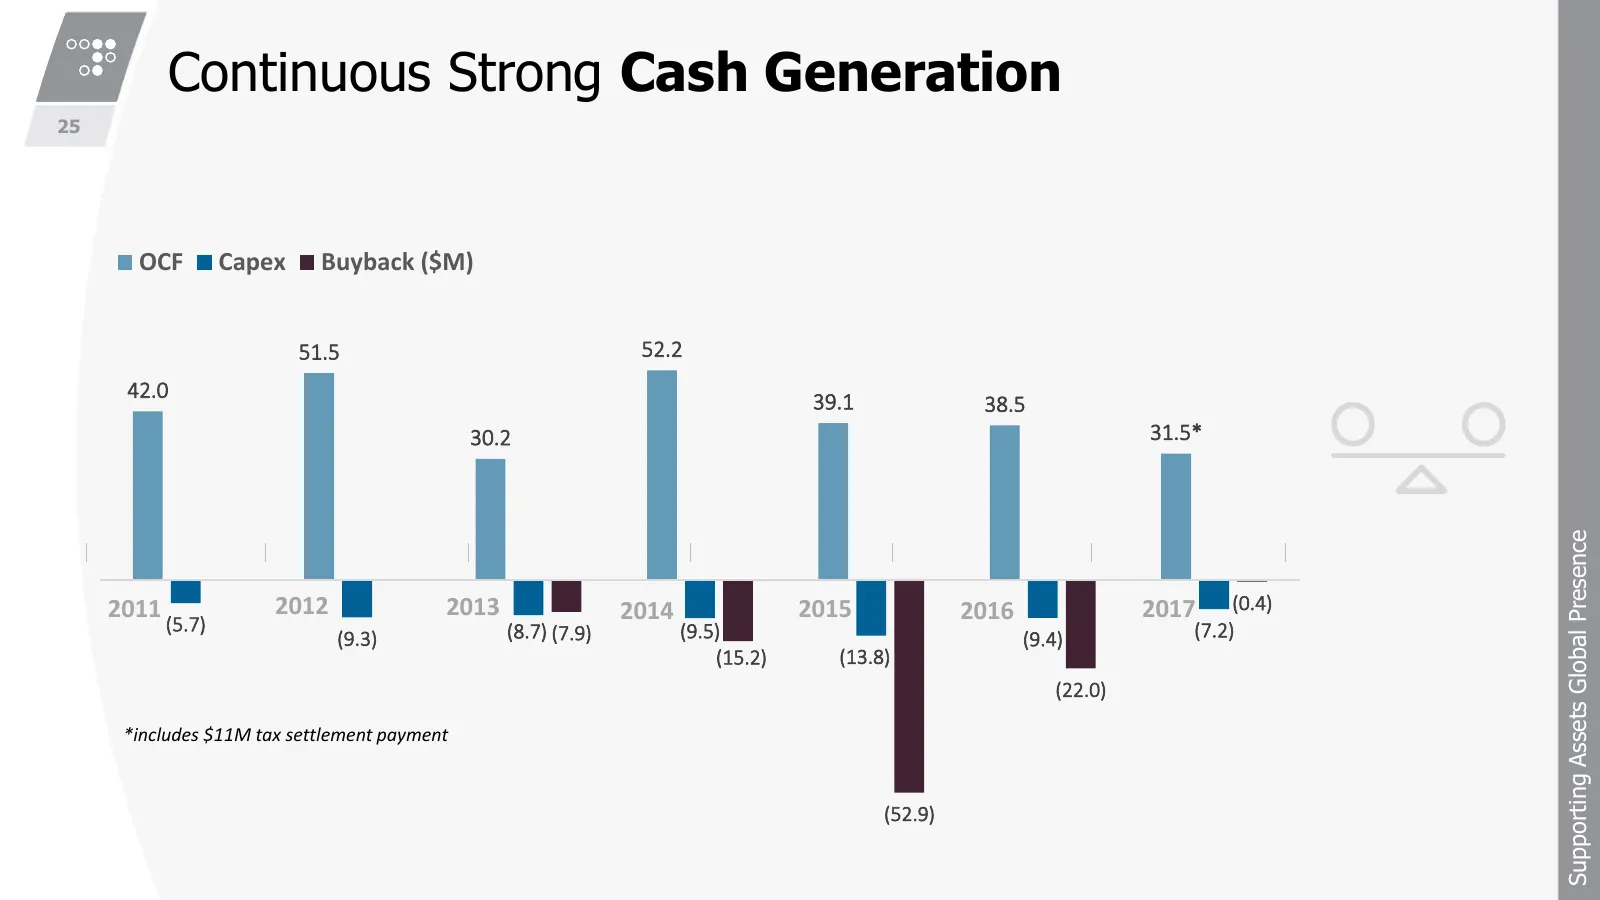
Slide 25: Continuous Strong Cash Generation
Continuous Strong Cash Generation 25 OCF Capex Buyback ($M) 51.5 52.2 42.0 39.1 38.5 30.2 31.5* Supporting Assets Global Presence 2011 2012 2013 2014 2015 2016 2017 (0.4) (5.7) (8.7) (7.9) (9.5) (7.2) (9.3) (9.4) (15.2) (13.8) (22.0) *includes $11M tax settlement payment (52.9)
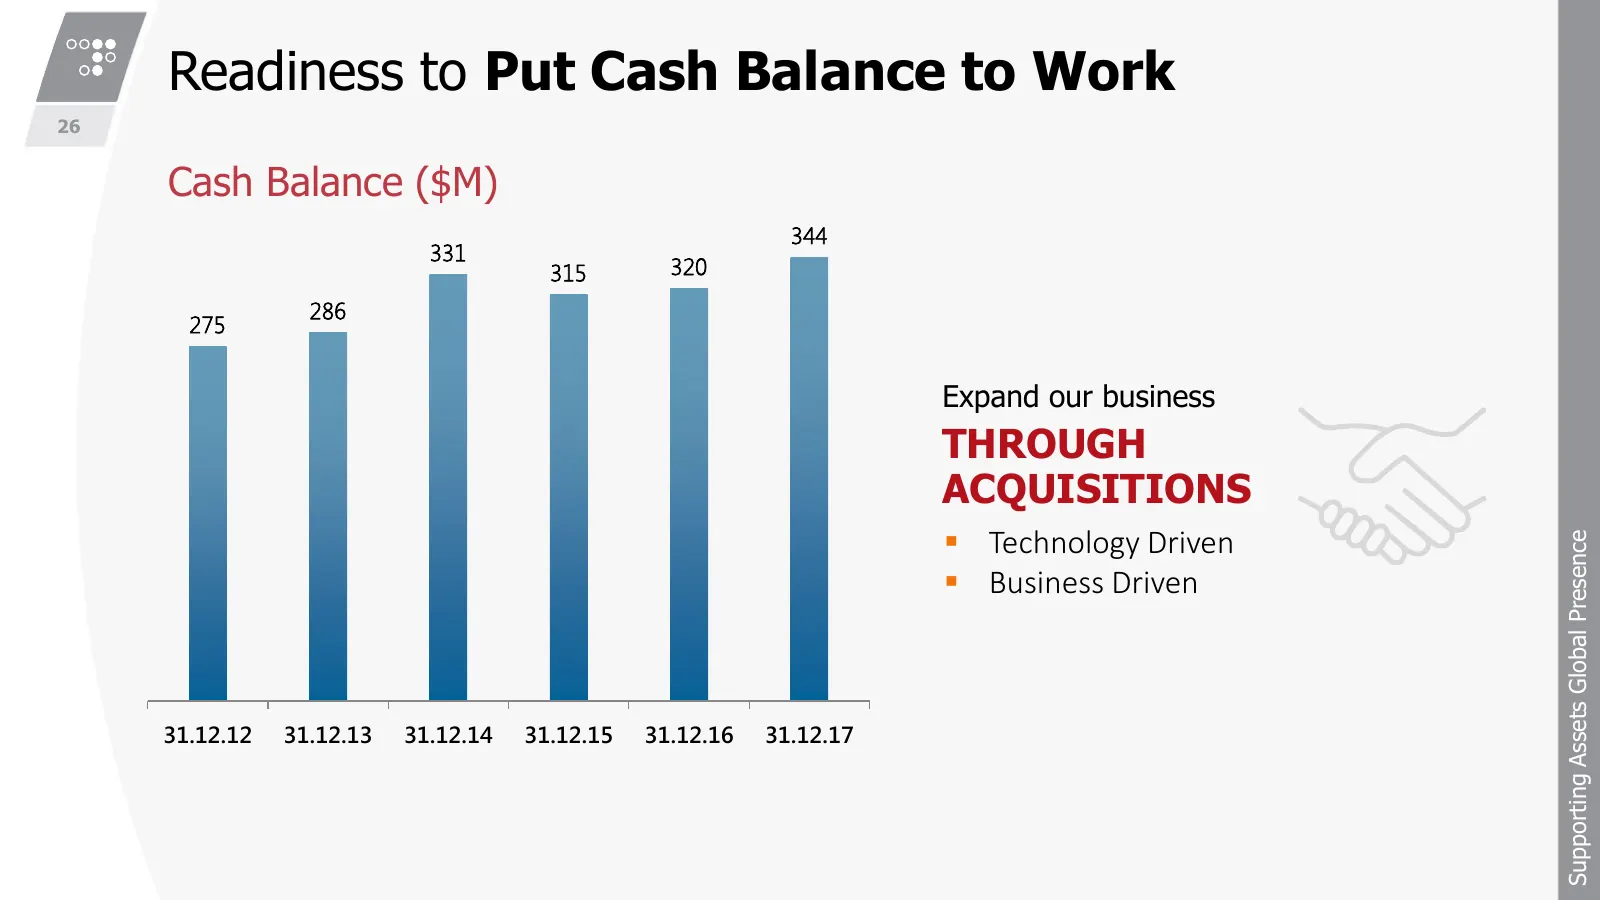
Slide 26: Readiness to Put Cash Balance to Work
Readiness to Put Cash Balance to Work 26 Cash Balance ($M) 344 331 315 320 286 275 Expand our business THROUGH ACQUISITIONS Technology Driven Supporting Assets Global Presence Business Driven 31.12.12 31.12.13 31.12.14 31.12.15 31.12.16 31.12.17

Slide 27: Appendix
27 APPENDIX financials
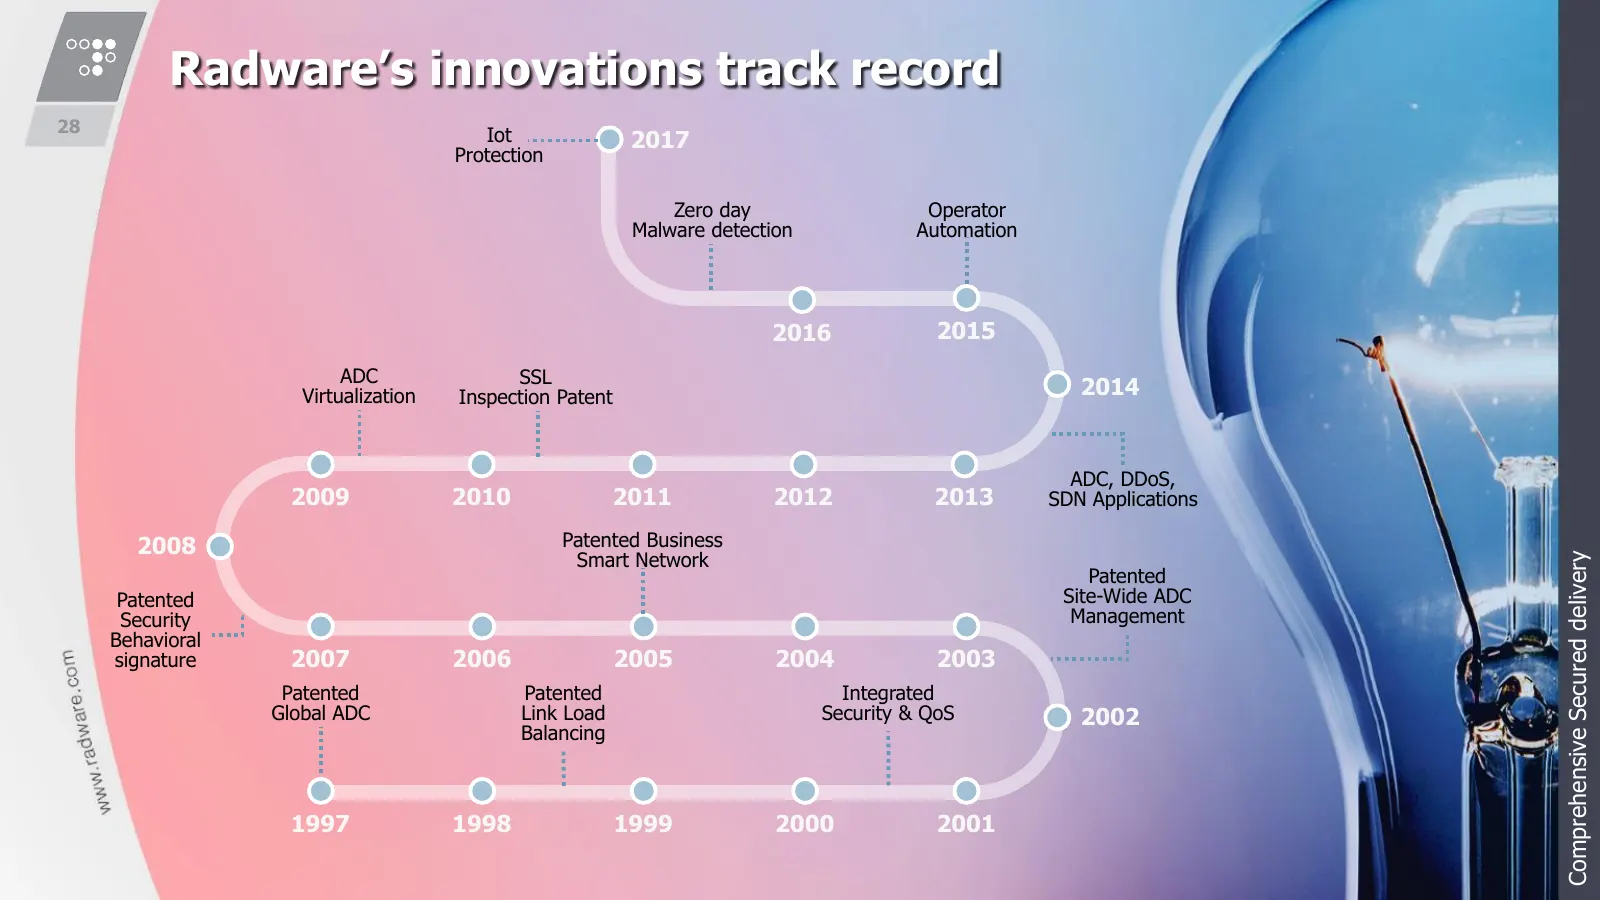
Slide 28: Radware's innovations track record
Radware’s innovations track record 28 Iot 2017 Protection Zero day Operator Malware detection Automation 2016 2015 ADC SSL Virtualization Inspection Patent 2014 ADC, DDoS, 2009 2010 2011 2012 2013 SDN Applications 2008 Patented Business Smart Network Comprehensive Secured delivery Patented Patented
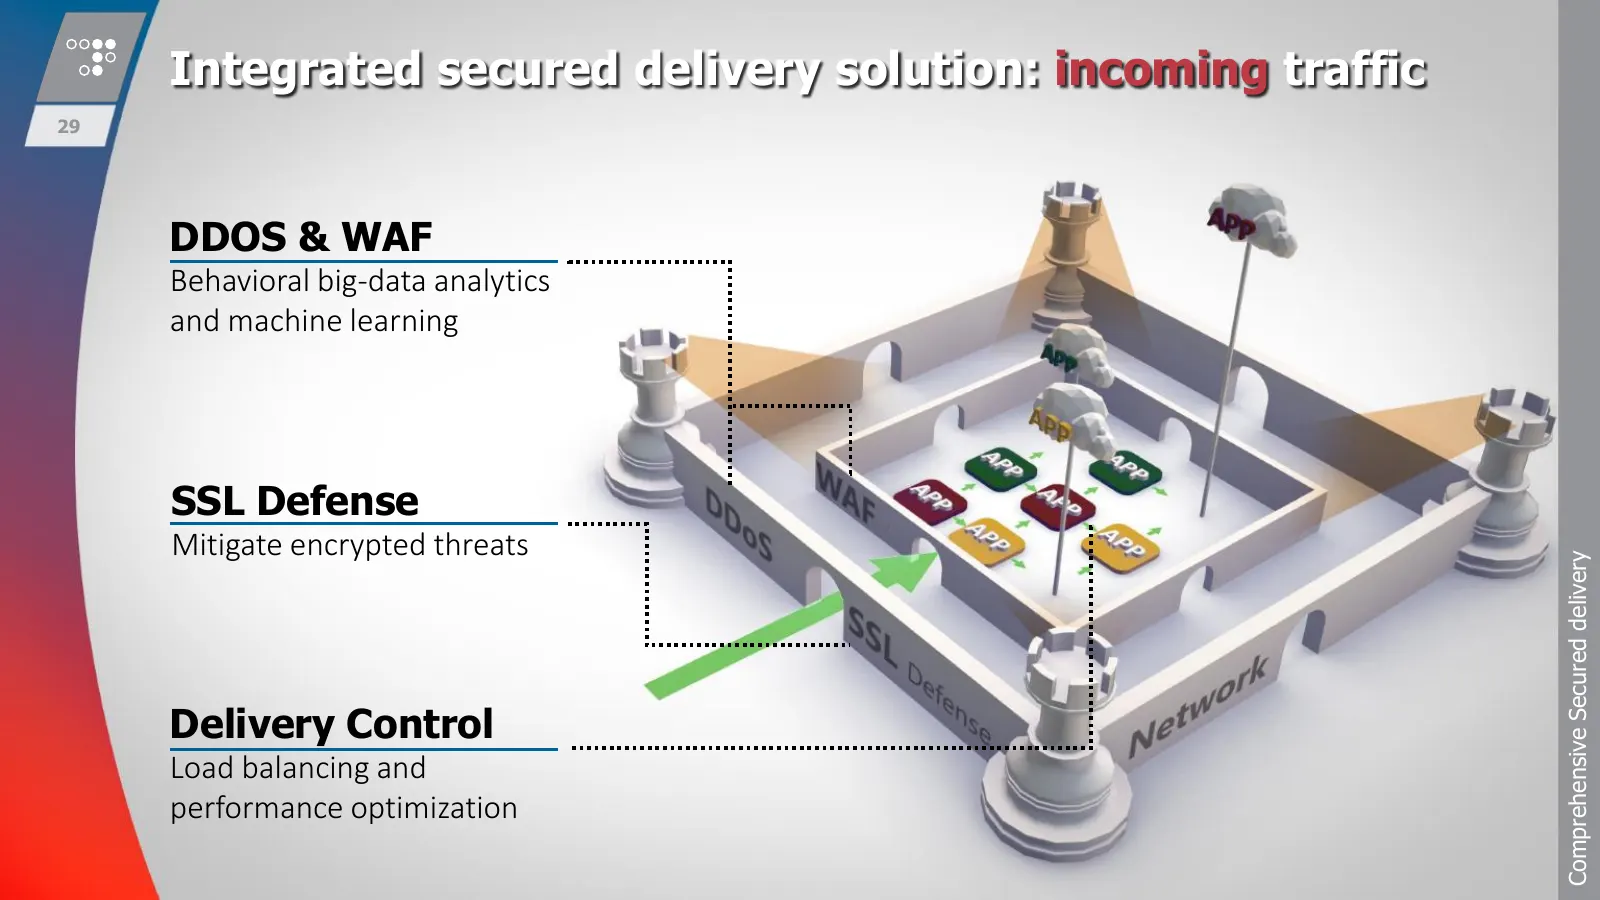
Slide 29: Integrated secured delivery solution: incoming traffic
Integrated secured delivery solution: incoming traffic 29 DDOS & WAF Behavioral big-data analytics and machine learning SSL Defense Mitigate encrypted threats Comprehensive Secured delivery Delivery Control Load balancing and performance optimization
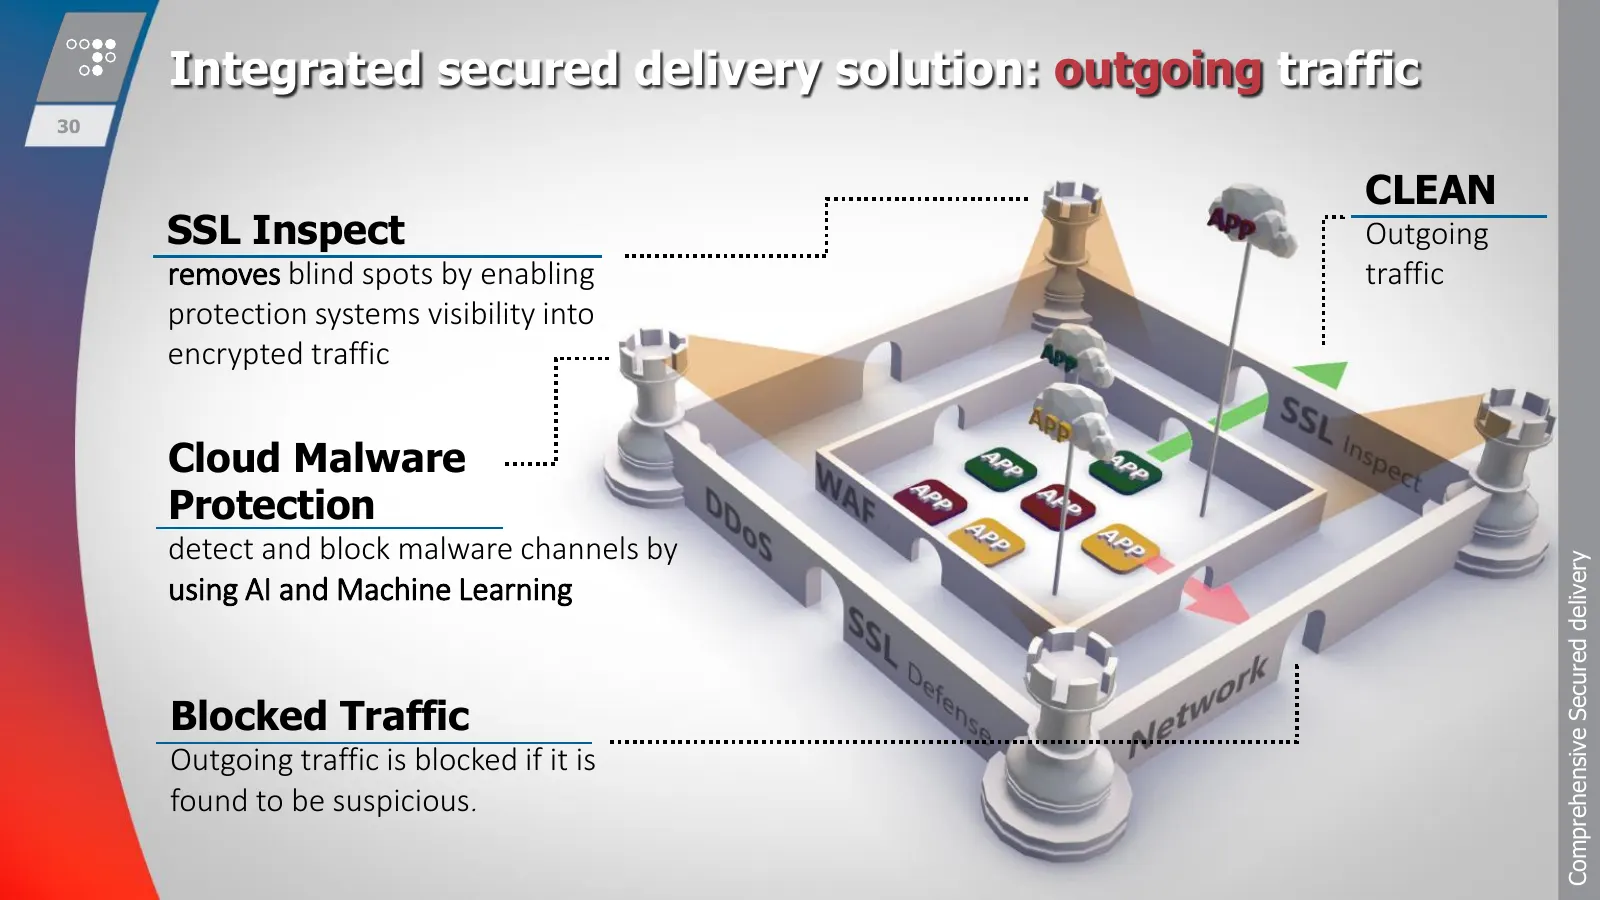
Slide 30: Integrated secured delivery solution: outgoing traffic
Integrated secured delivery solution: outgoing traffic 30 CLEAN SSL Inspect Outgoing removes blind spots by enabling traffic protection systems visibility into encrypted traffic Cloud Malware Protection detect and block malware channels by Comprehensive Secured delivery using AI and Machine Learning

Slide 31: Thank You
THANK YOU ooee os? radware
Source: Internet Archive copy of radware.com
More decks from Radware Ltd.
 Q1 2026 Earnings Presentation35 slides · May 7, 2026
 Q4 2025 Earnings Presentation30 slides · Feb 11, 2026
 Q3 2025 Earnings Presentation35 slides · Oct 29, 2025
 Q2 2025 Earnings Presentation35 slides · Jul 30, 2025
 Q1 2025 Earnings Presentation35 slides · May 7, 2025
 Q4 2024 Earnings Presentation37 slides · Feb 12, 2025