Maf Bancorp — Lehman Brothers 2006 Financial Services Conference
29 slides from Maf Bancorp's conference presentation, Sep 12, 2006
Slide 1: MAF Bancorp, Inc. Lehman Brothers 2006 Financial Services Conference
EXHIBIT 99.2 SLIDE 1 MAF BANCORP, INC. Lehman Brothers 2006 Financial Services Conference September 12-14, 2006 [MAF BANCORP, INC. LOGO APPEARS HERE]
Slide 2: Forward-Looking Information
SLIDE 2 FORWARD-LOOKING INFORMATION ---------------------------------------- Statements contained in this presentation that are not historical facts, constitute forward-looking statements (within the meaning of Section 21E of the Securities Exchange Act of 1934, as amended), which involve significan
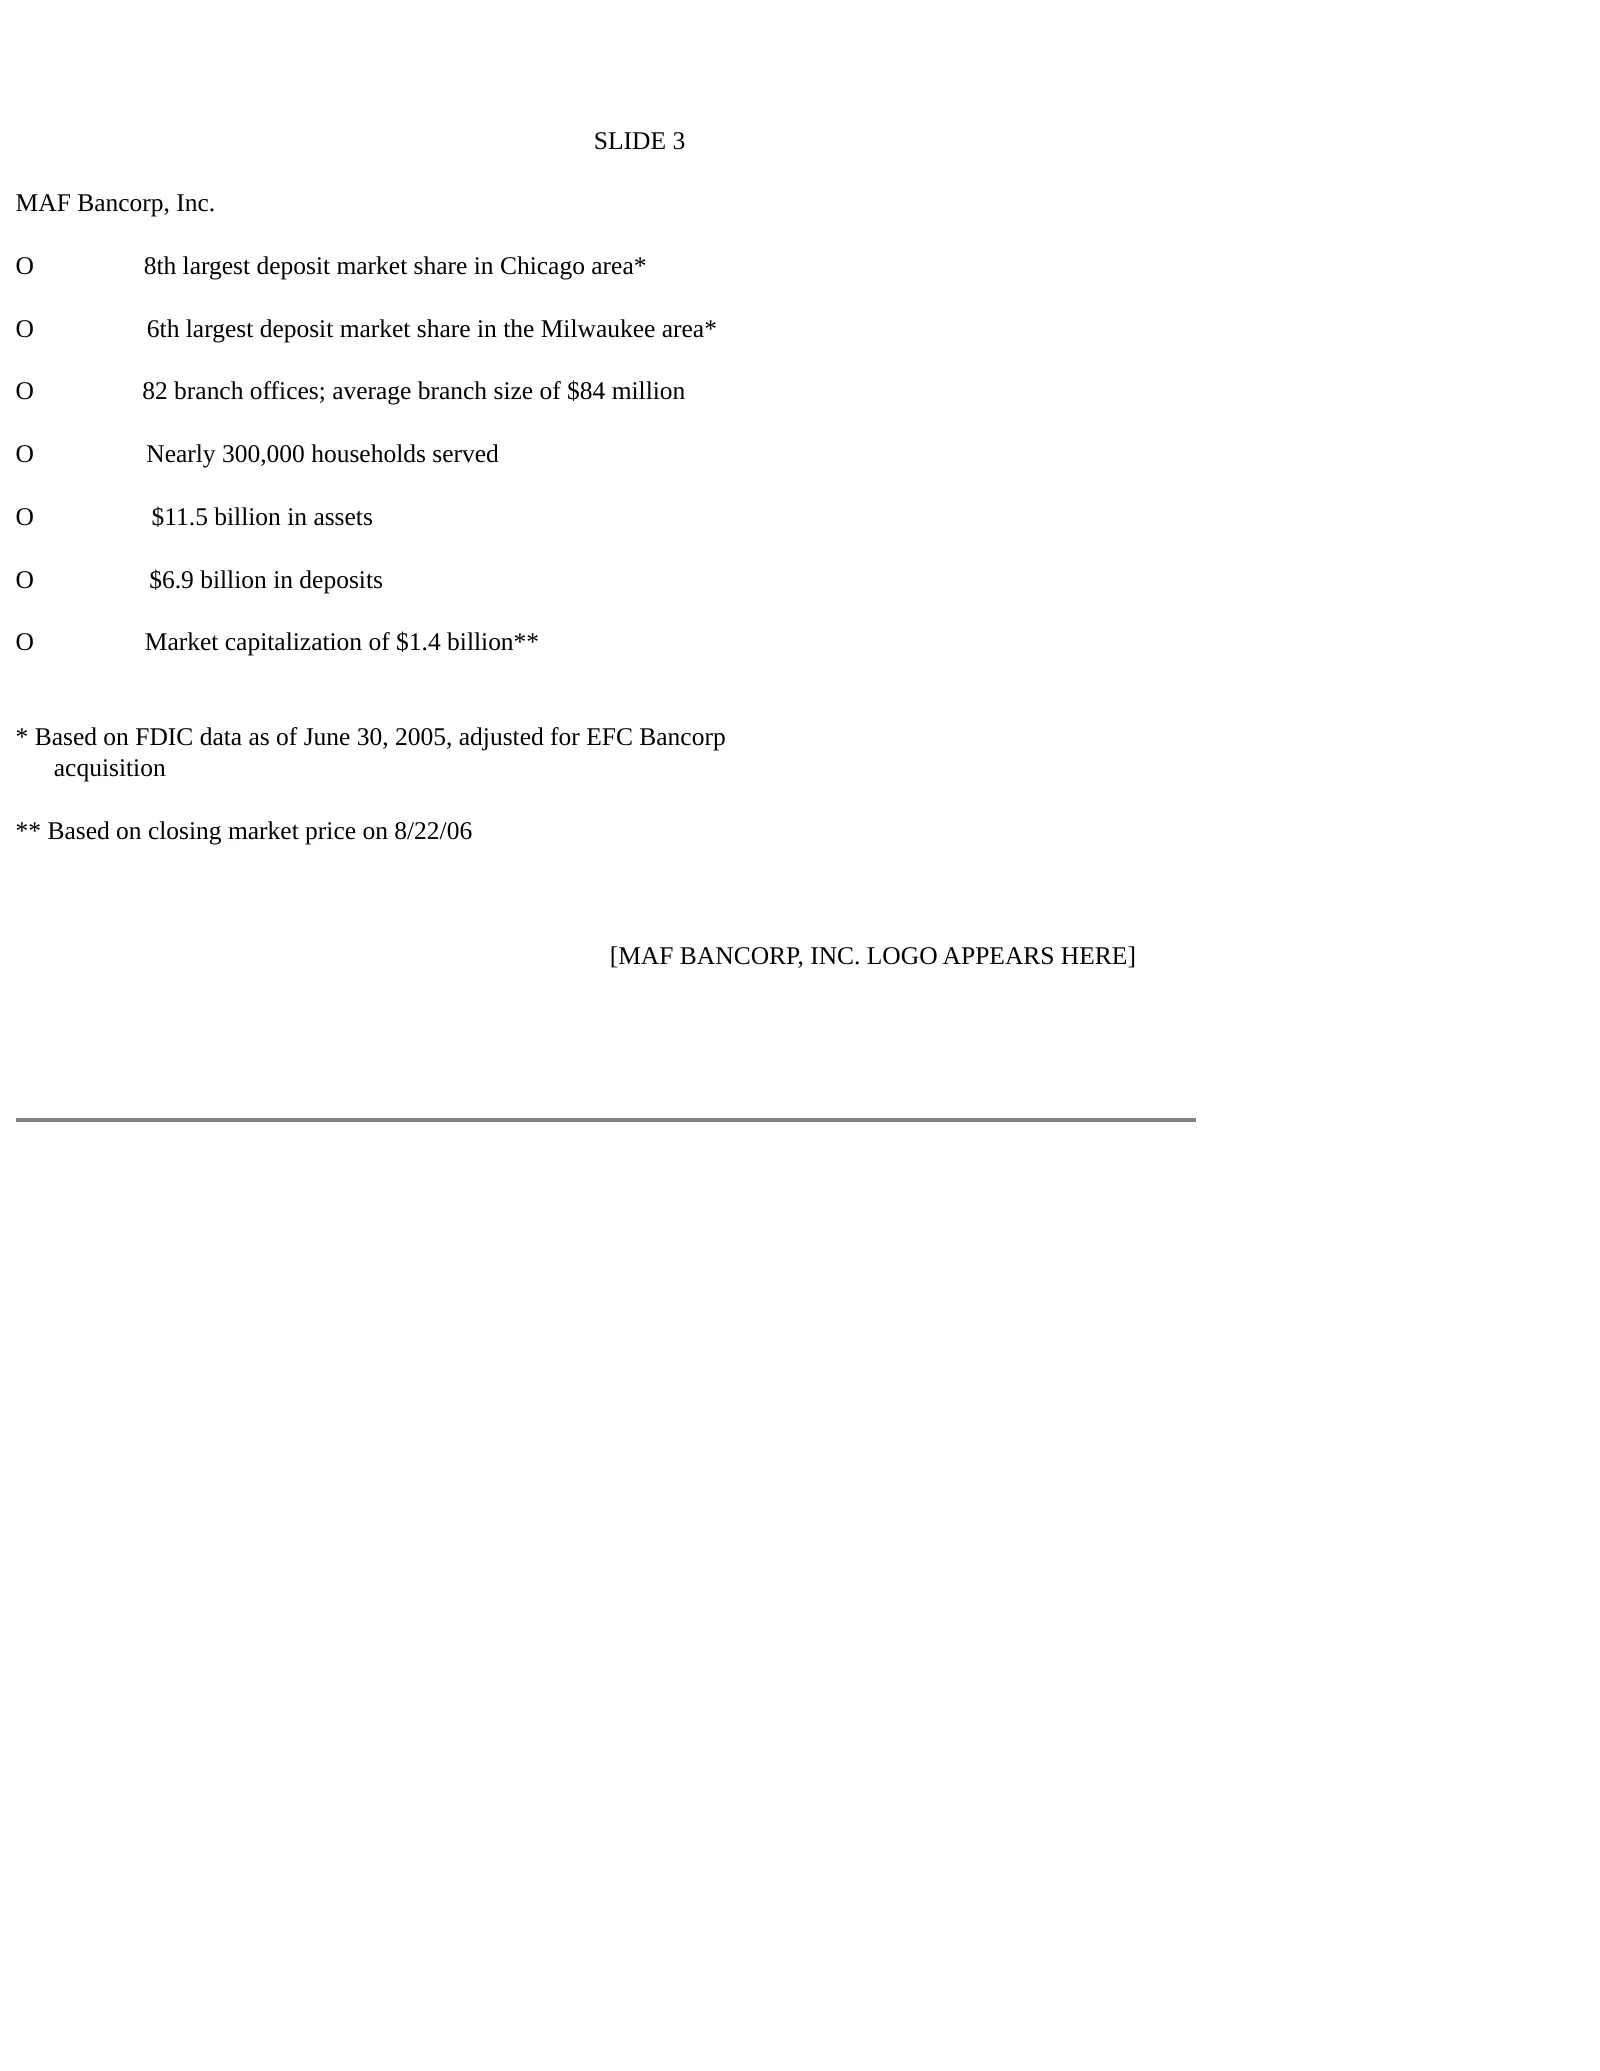
Slide 3: MAF Bancorp, Inc.
SLIDE 3 MAF Bancorp, Inc. O 8th largest deposit market share in Chicago area* O 6th largest deposit market share in the Milwaukee area* O 82 branch offices; average branch size of $84 million O Nearly 300,000 households served O $11.5 billion in assets O $6.9 billion in deposits O Market capitalizat
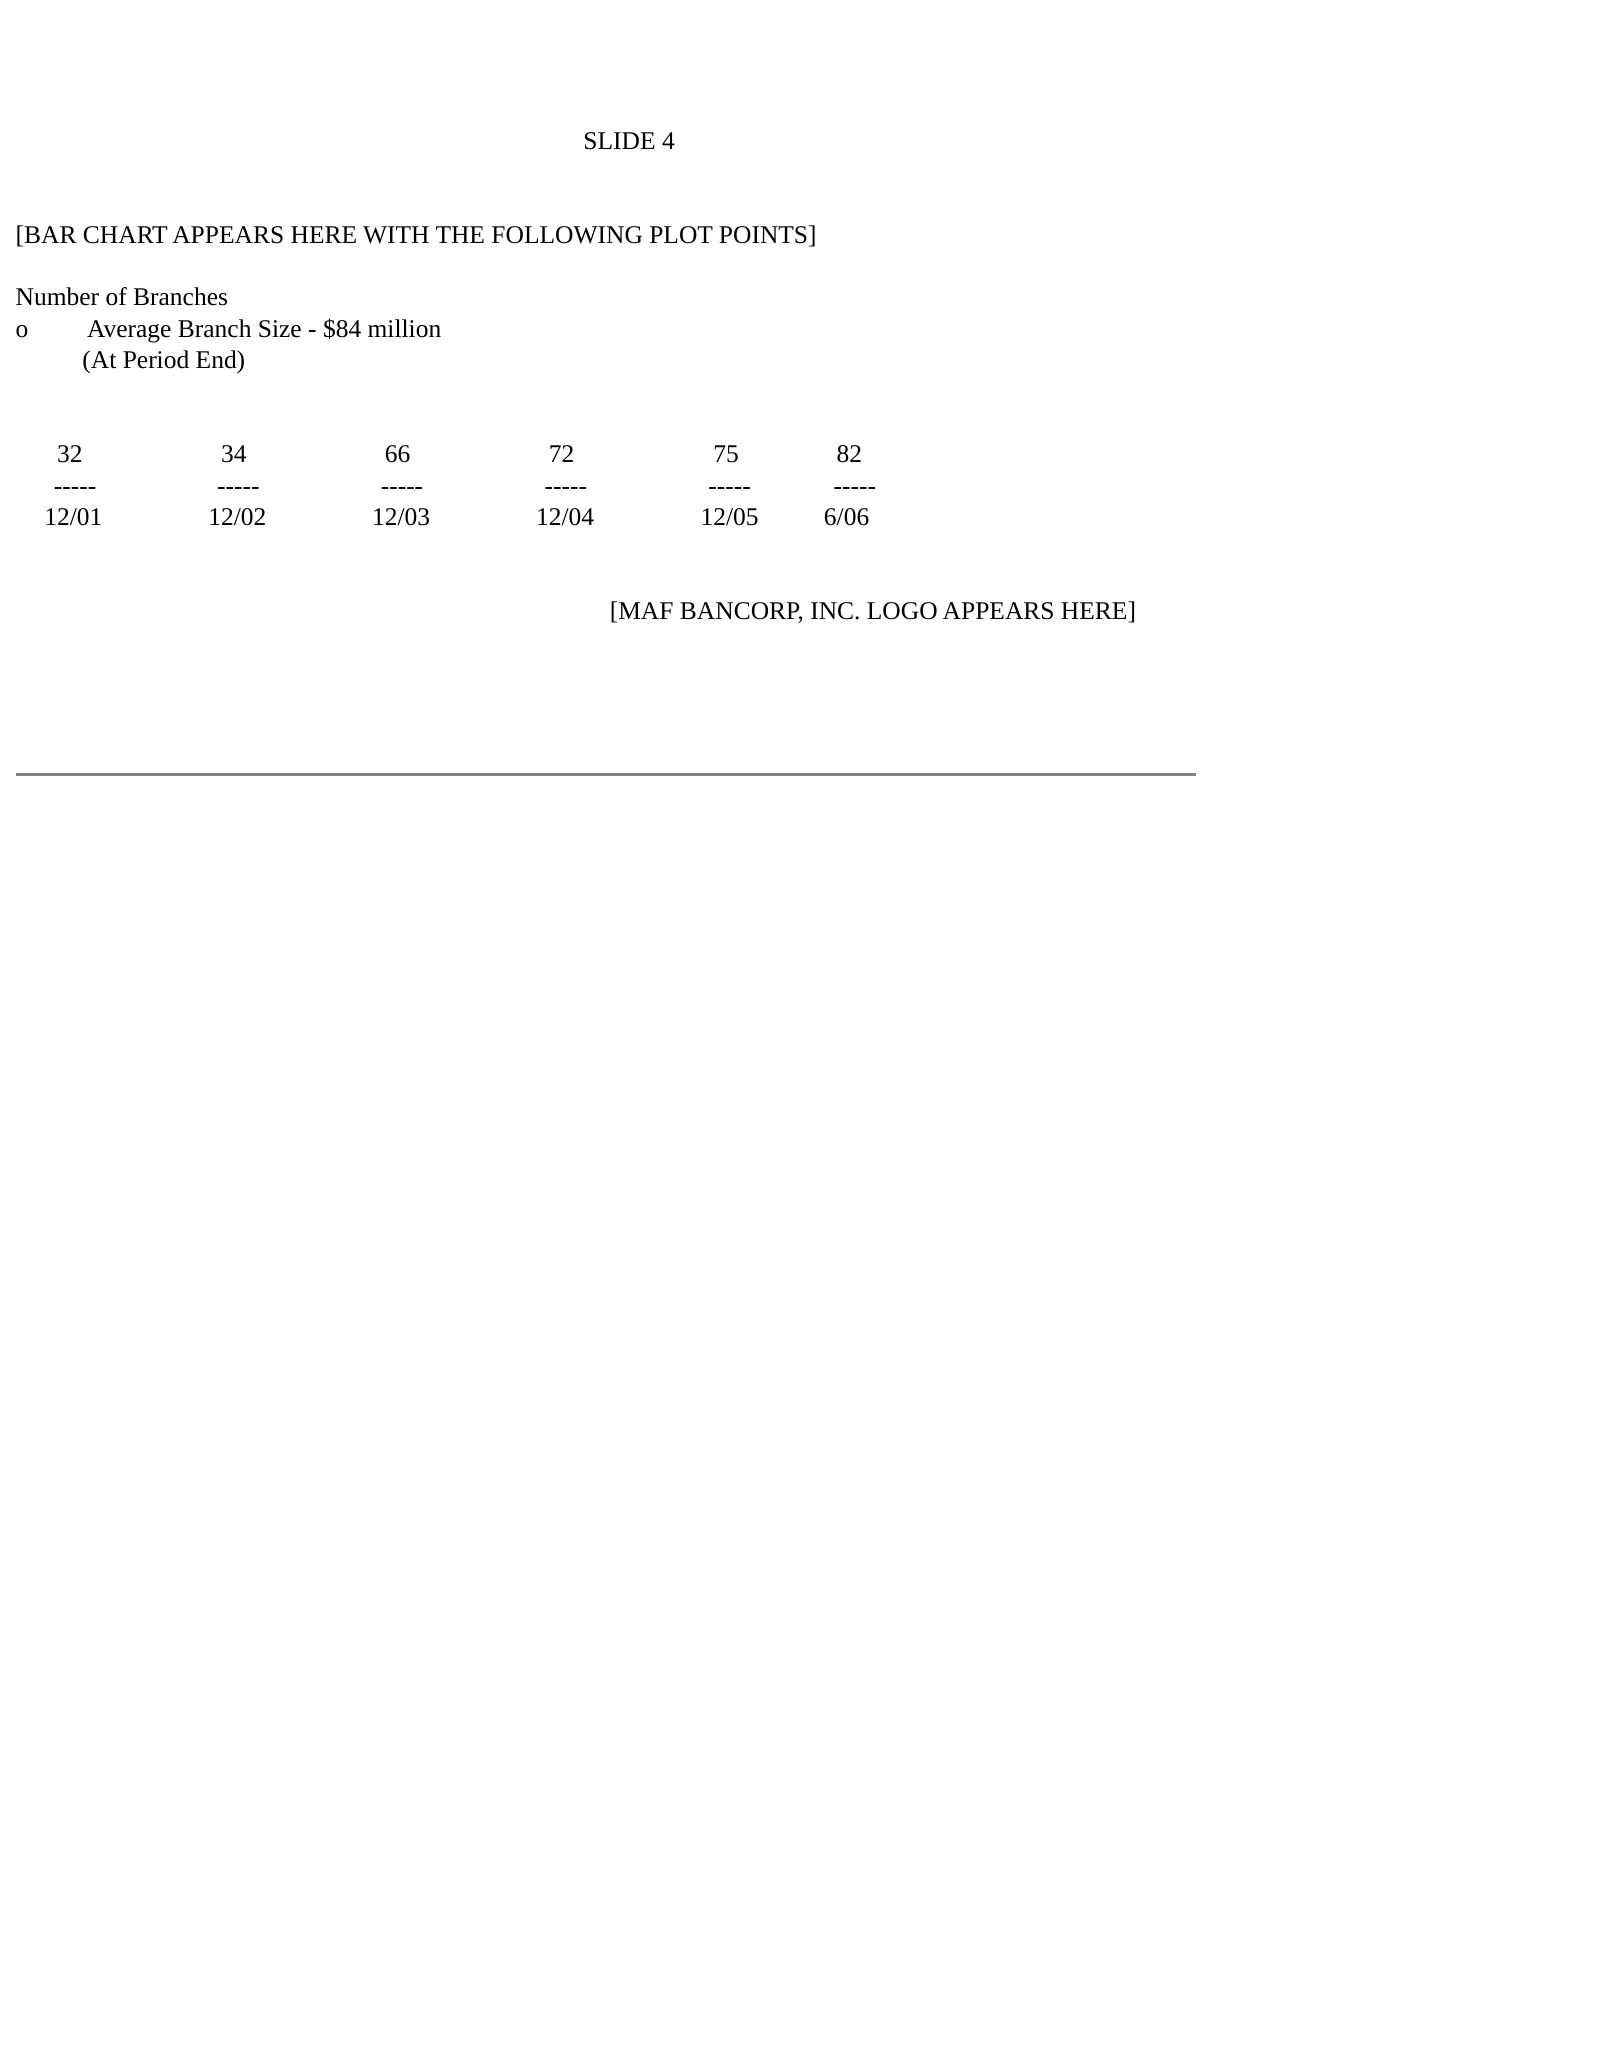
Slide 4: Number of Branches
SLIDE 4 [BAR CHART APPEARS HERE WITH THE FOLLOWING PLOT POINTS] Number of Branches o Average Branch Size - $84 million (At Period End) 32 34 66 72 75 82 ----- ----- ----- ----- ----- ----- 12/01 12/02 12/03 12/04 12/05 6/06 [MAF BANCORP, INC. LOGO APPEARS HERE]
Slide 5: MidAmerica Branch Locations Market Area Map
SLIDE 5 [MAP OF MAF BANCORP, INC.'S MARKET AREA SHOWING MIDAMERICA BRANCH LOCATIONS APPEARS HERE] [MAF BANCORP, INC. LOGO APPEARS HERE]
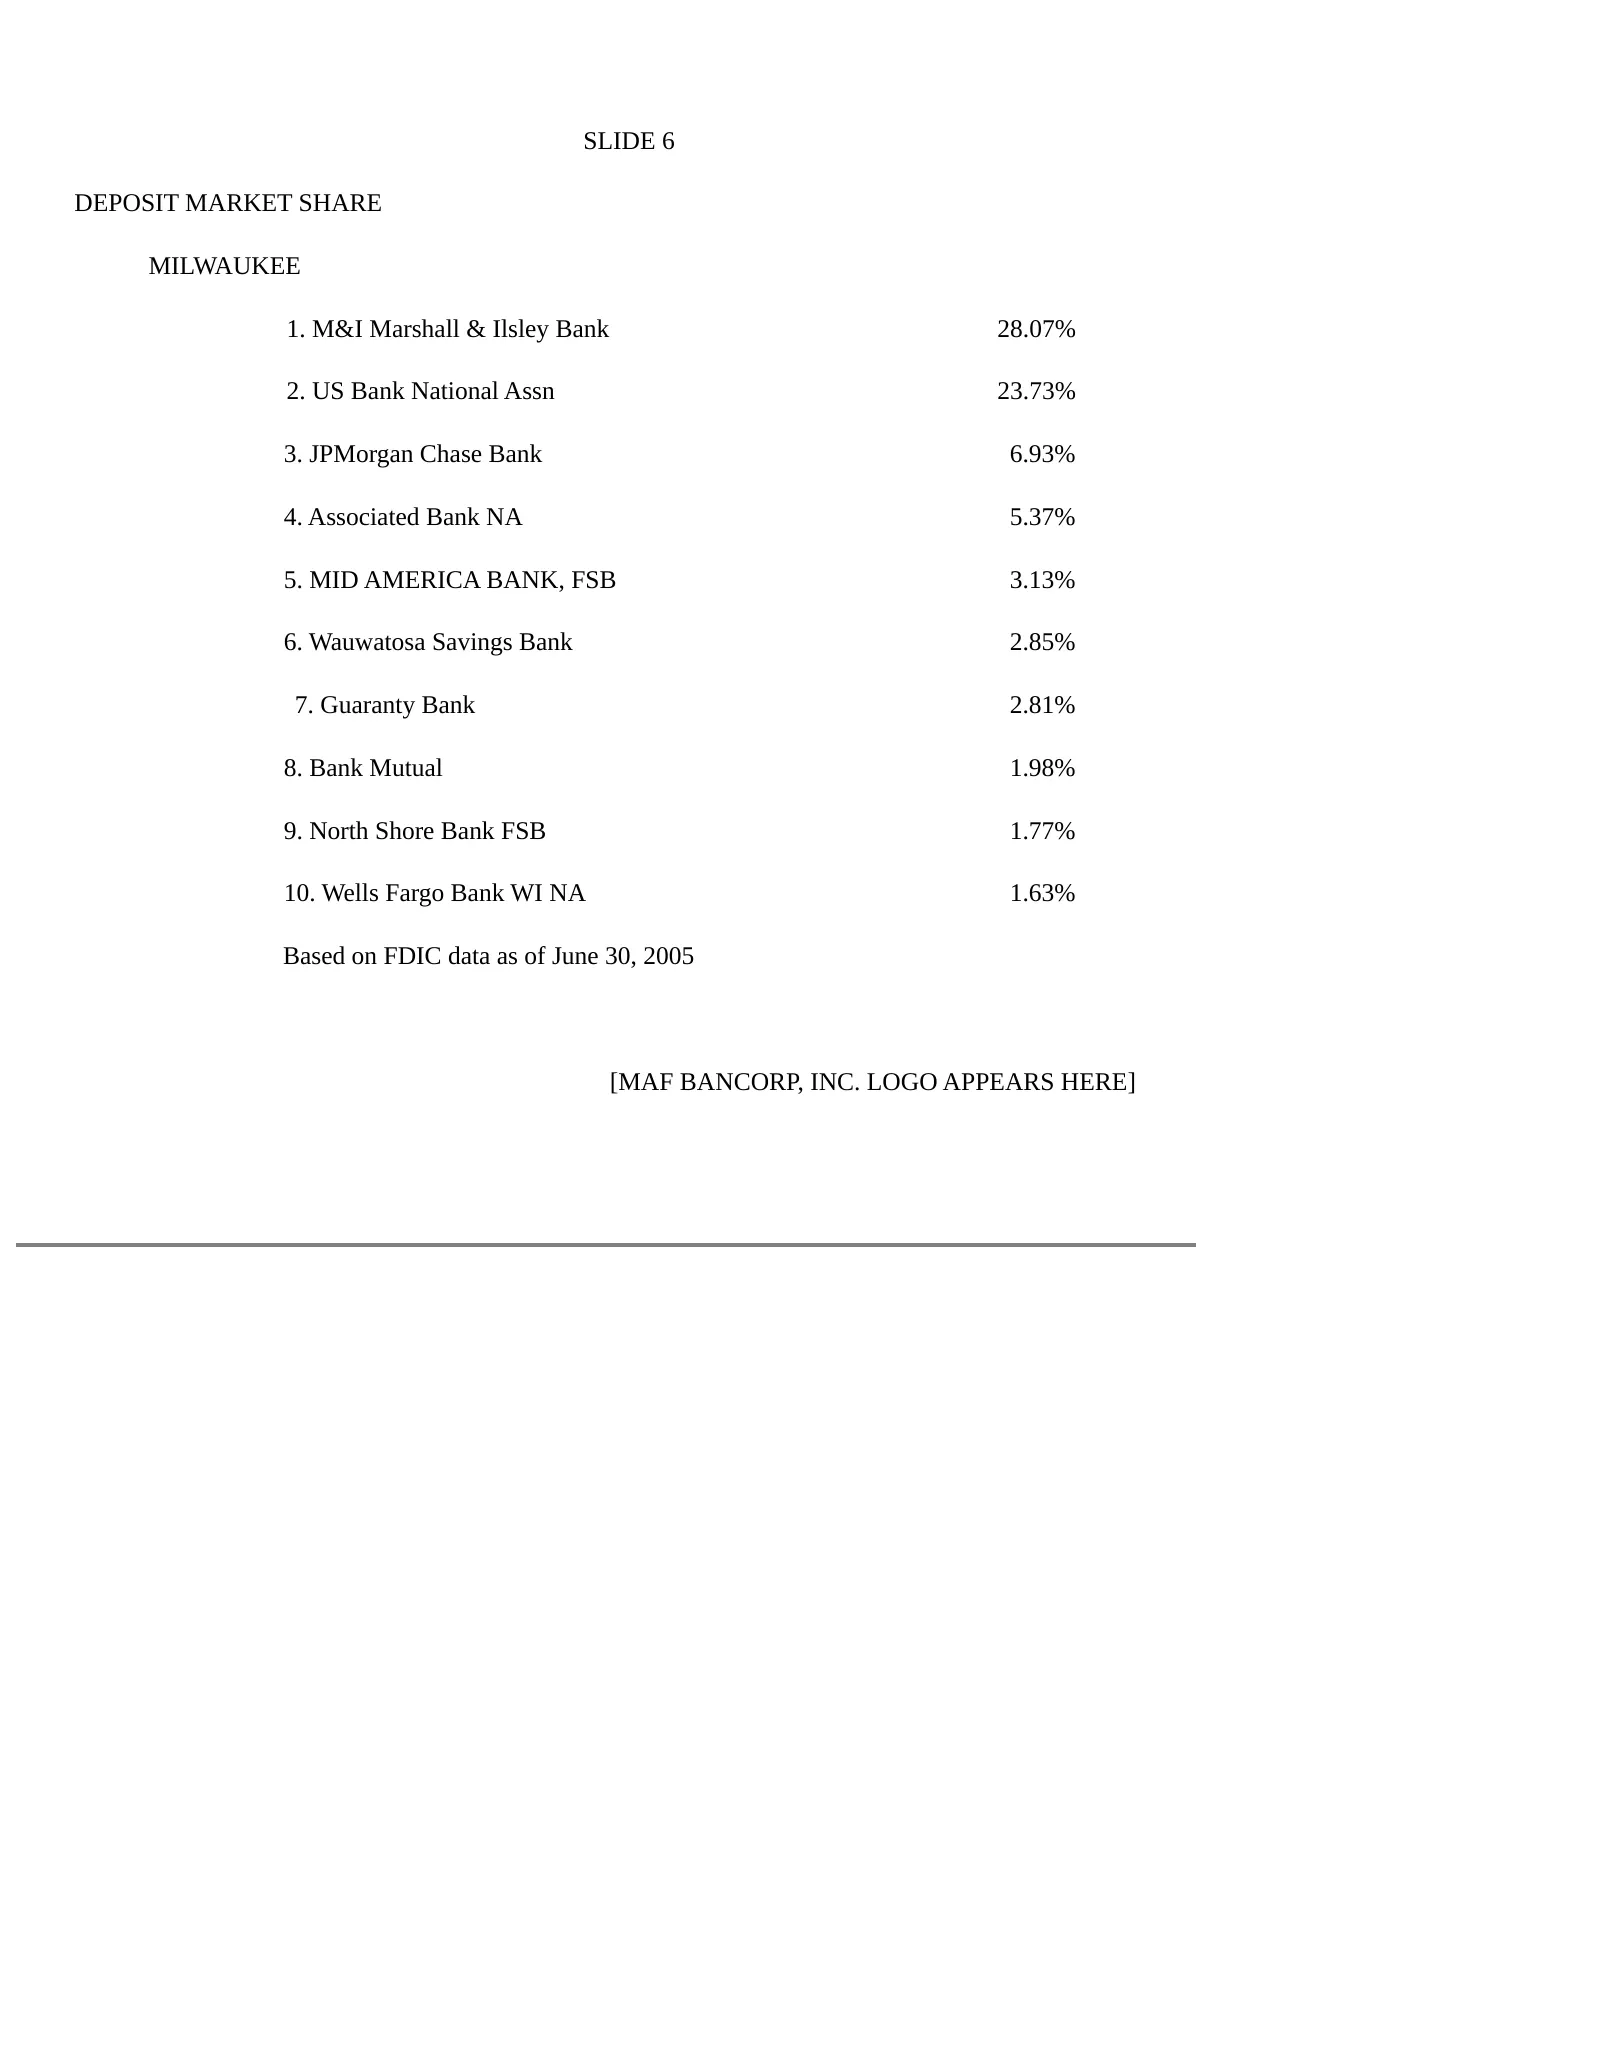
Slide 6: Deposit Market Share Milwaukee
SLIDE 6 DEPOSIT MARKET SHARE MILWAUKEE 1. M&I Marshall & Ilsley Bank 28.07% 2. US Bank National Assn 23.73% 3. JPMorgan Chase Bank 6.93% 4. Associated Bank NA 5.37% 5. MID AMERICA BANK, FSB 3.13% 6. Wauwatosa Savings Bank 2.85% 7. Guaranty Bank 2.81% 8. Bank Mutual 1.98% 9. North Shore Bank FSB 1.77
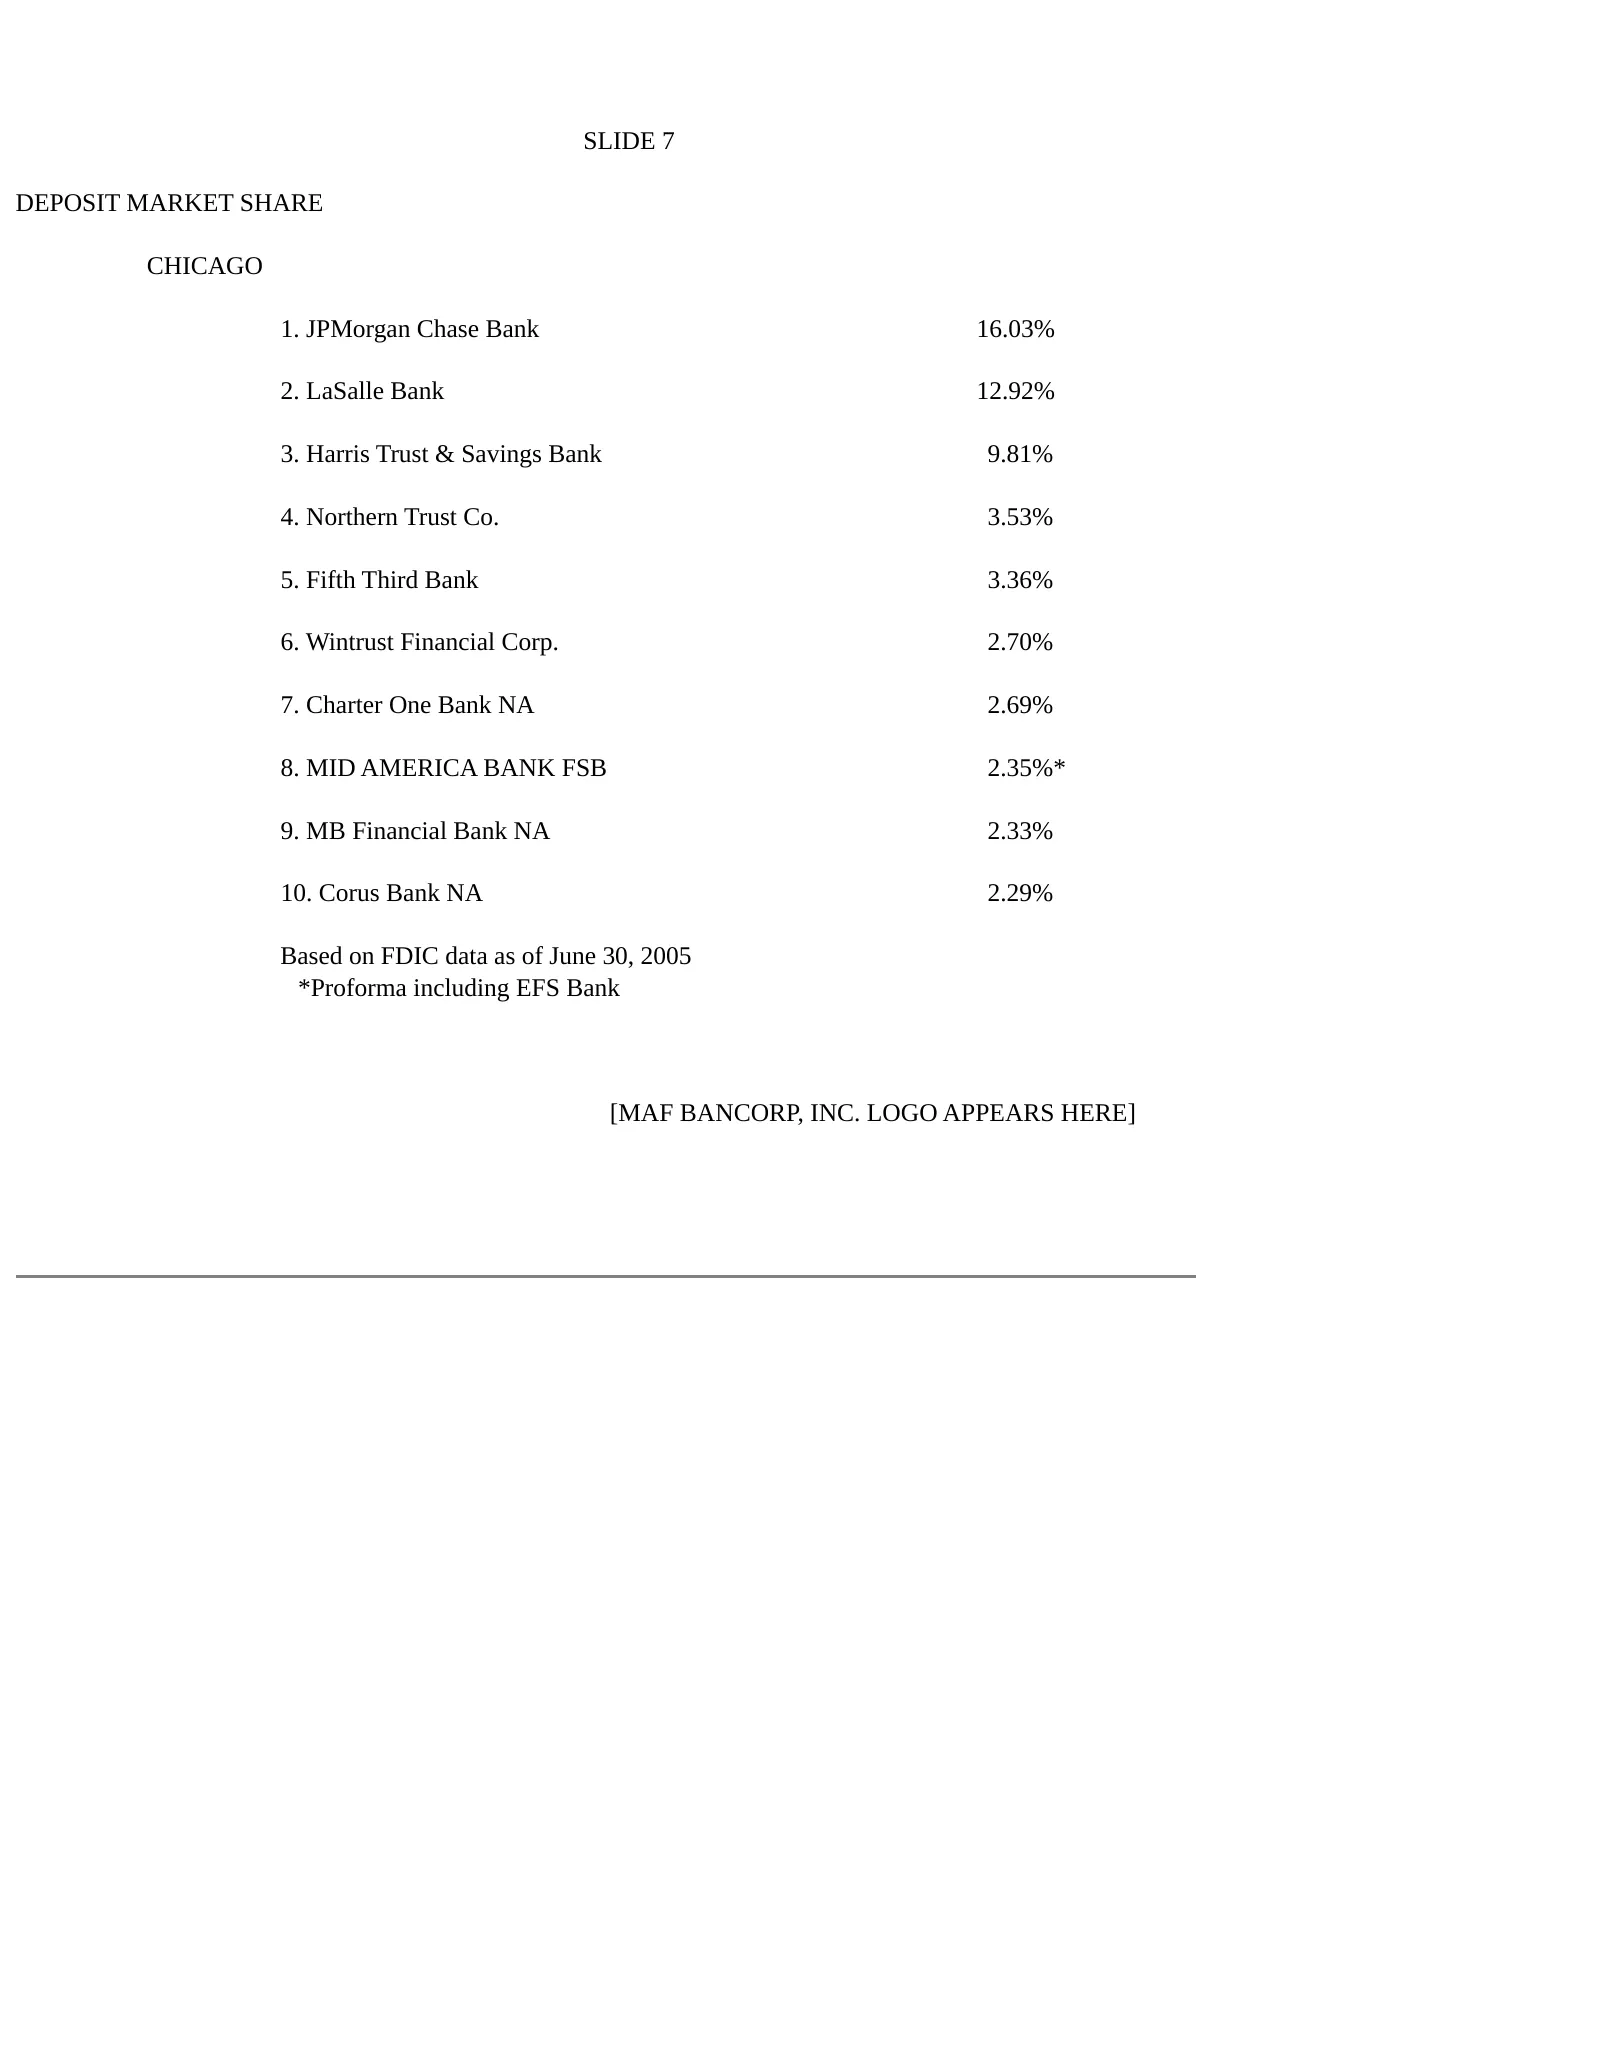
Slide 7: Deposit Market Share Chicago
SLIDE 7 DEPOSIT MARKET SHARE CHICAGO 1. JPMorgan Chase Bank 16.03% 2. LaSalle Bank 12.92% 3. Harris Trust & Savings Bank 9.81% 4. Northern Trust Co. 3.53% 5. Fifth Third Bank 3.36% 6. Wintrust Financial Corp. 2.70% 7. Charter One Bank NA 2.69% 8. MID AMERICA BANK FSB 2.35%* 9. MB Financial Bank NA 2
Slide 8: Chicago Market Area Branch Locations Map
SLIDE 8 [MAP OF MAF BANCORP, INC.'S CHICAGO MARKET AREA SHOWING MIDAMERICA BRANCH LOCATIONS APPEARS HERE] [MAF BANCORP, INC. LOGO APPEARS HERE]
Slide 9: EFC Bancorp Acquisition
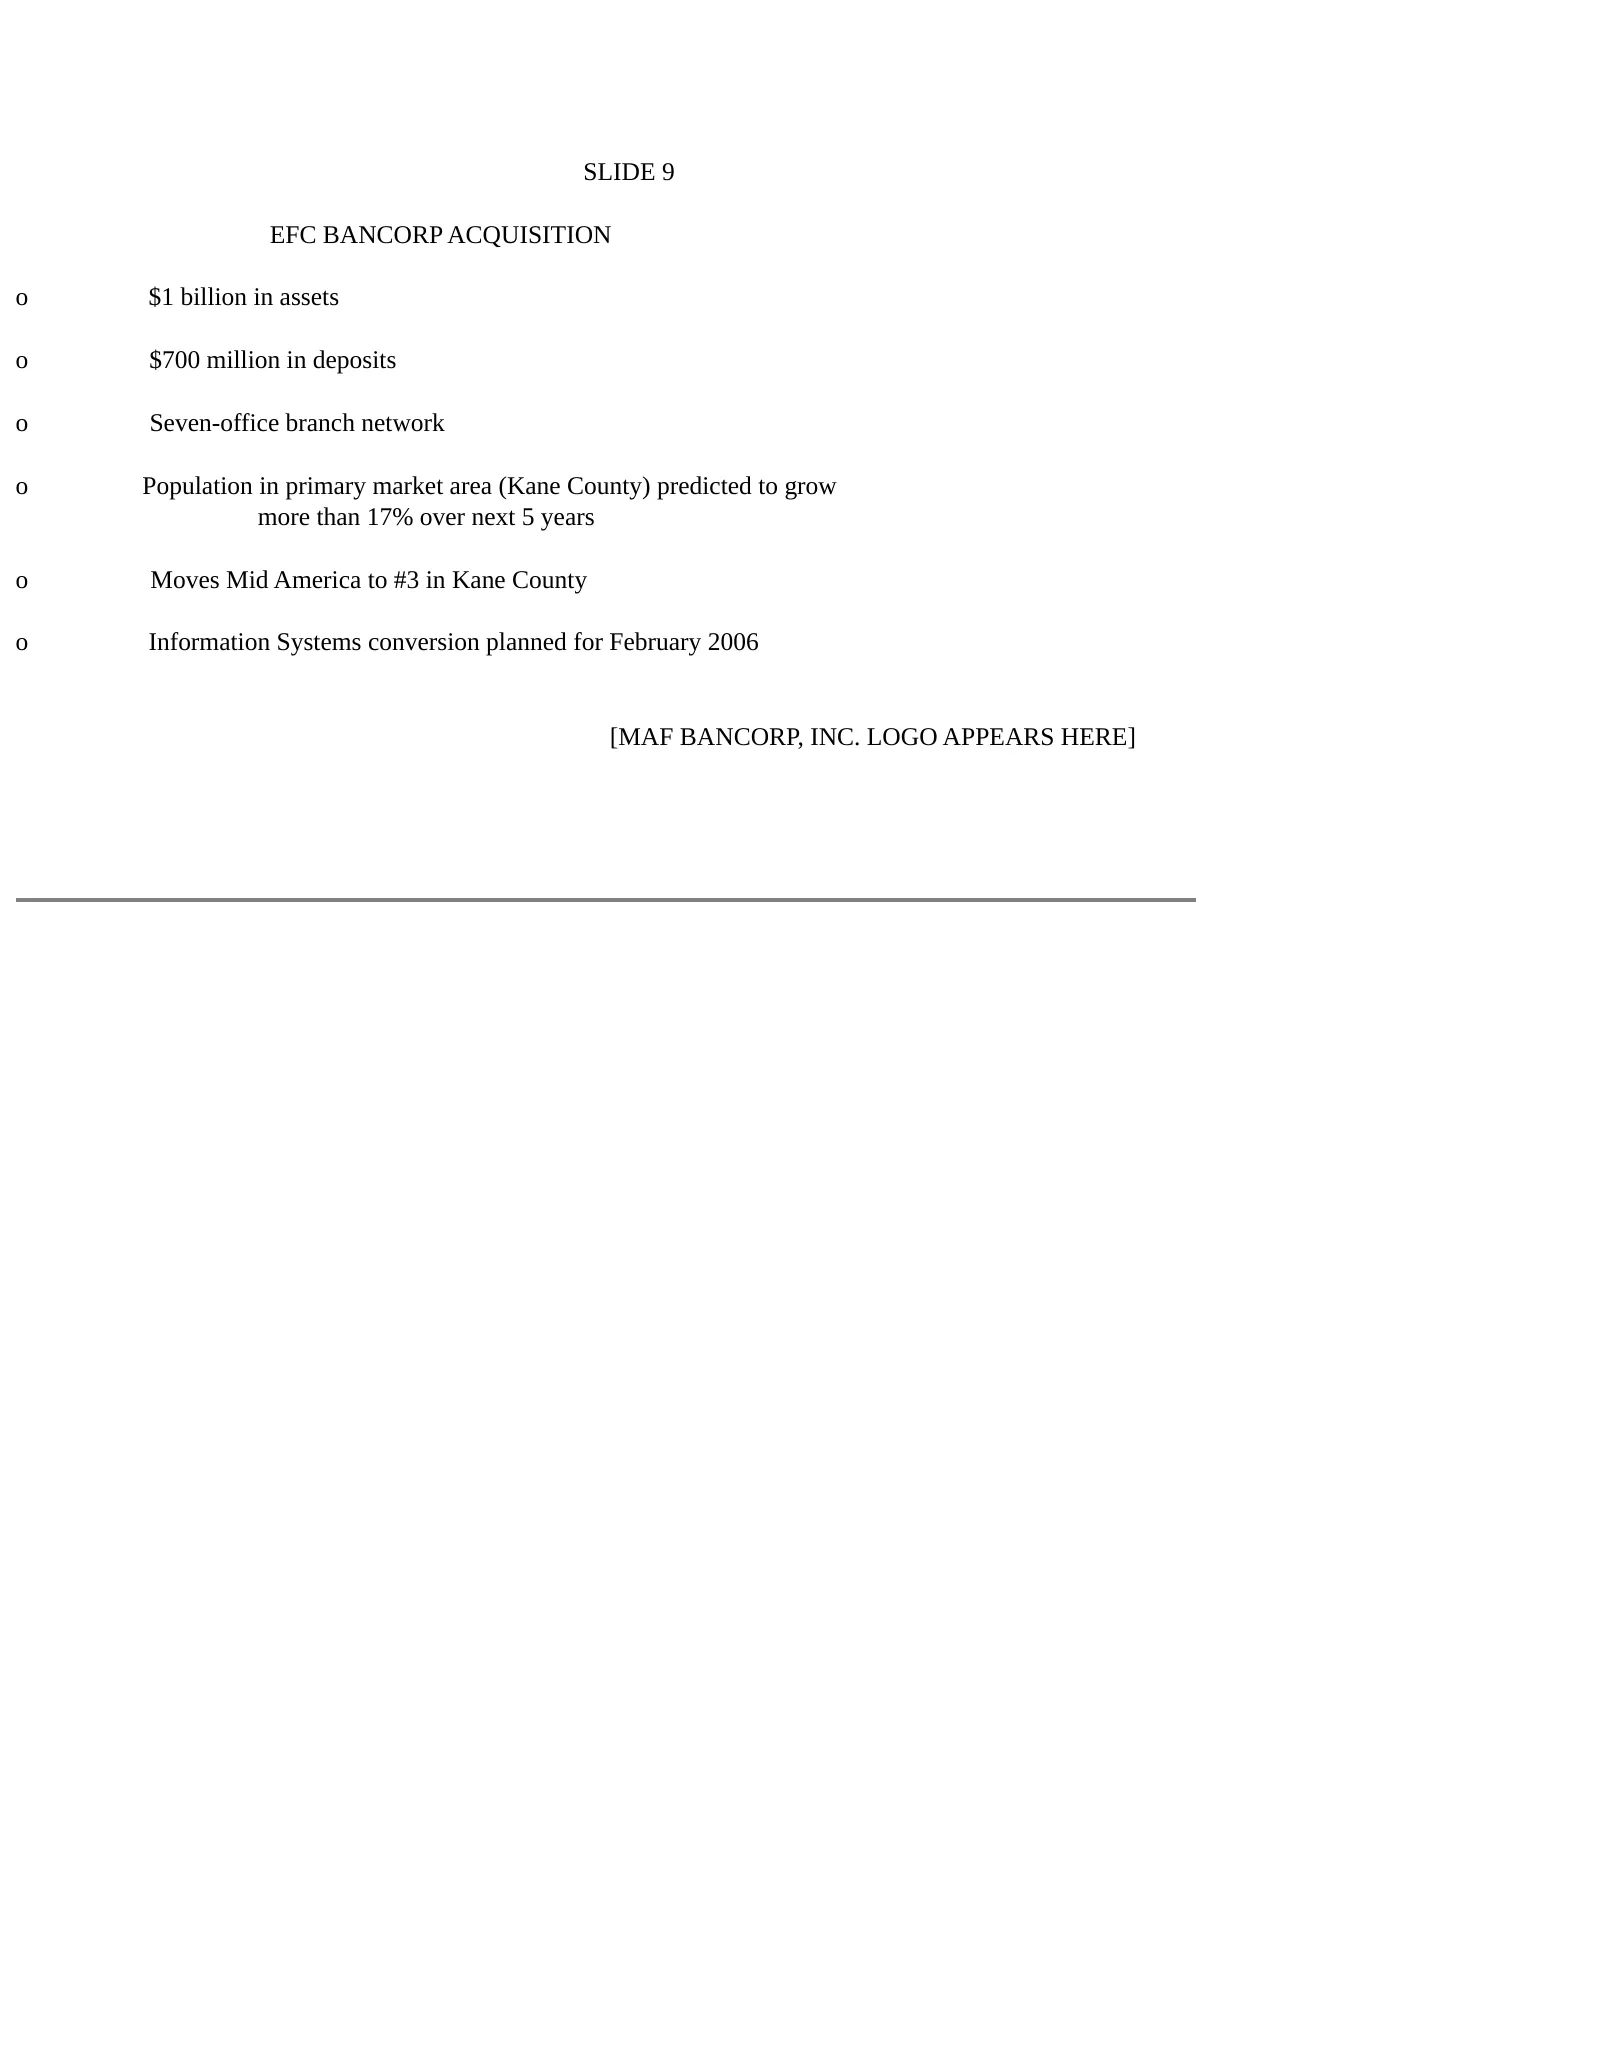
SLIDE 9 EFC BANCORP ACQUISITION o $1 billion in assets o $700 million in deposits o Seven-office branch network o Population in primary market area (Kane County) predicted to grow more than 17% over next 5 years o Moves Mid America to #3 in Kane County o Information Systems conversion planned for Fe
Slide 10: MAF Bancorp Market Area Map
SLIDE 10 [MAP OF MAF BANCORP, INC.'S MARKET AREA APPEARS HERE] [MAF BANCORP, INC. LOGO APPEARS HERE]
Slide 11: Deposit Composition – 6/30/06
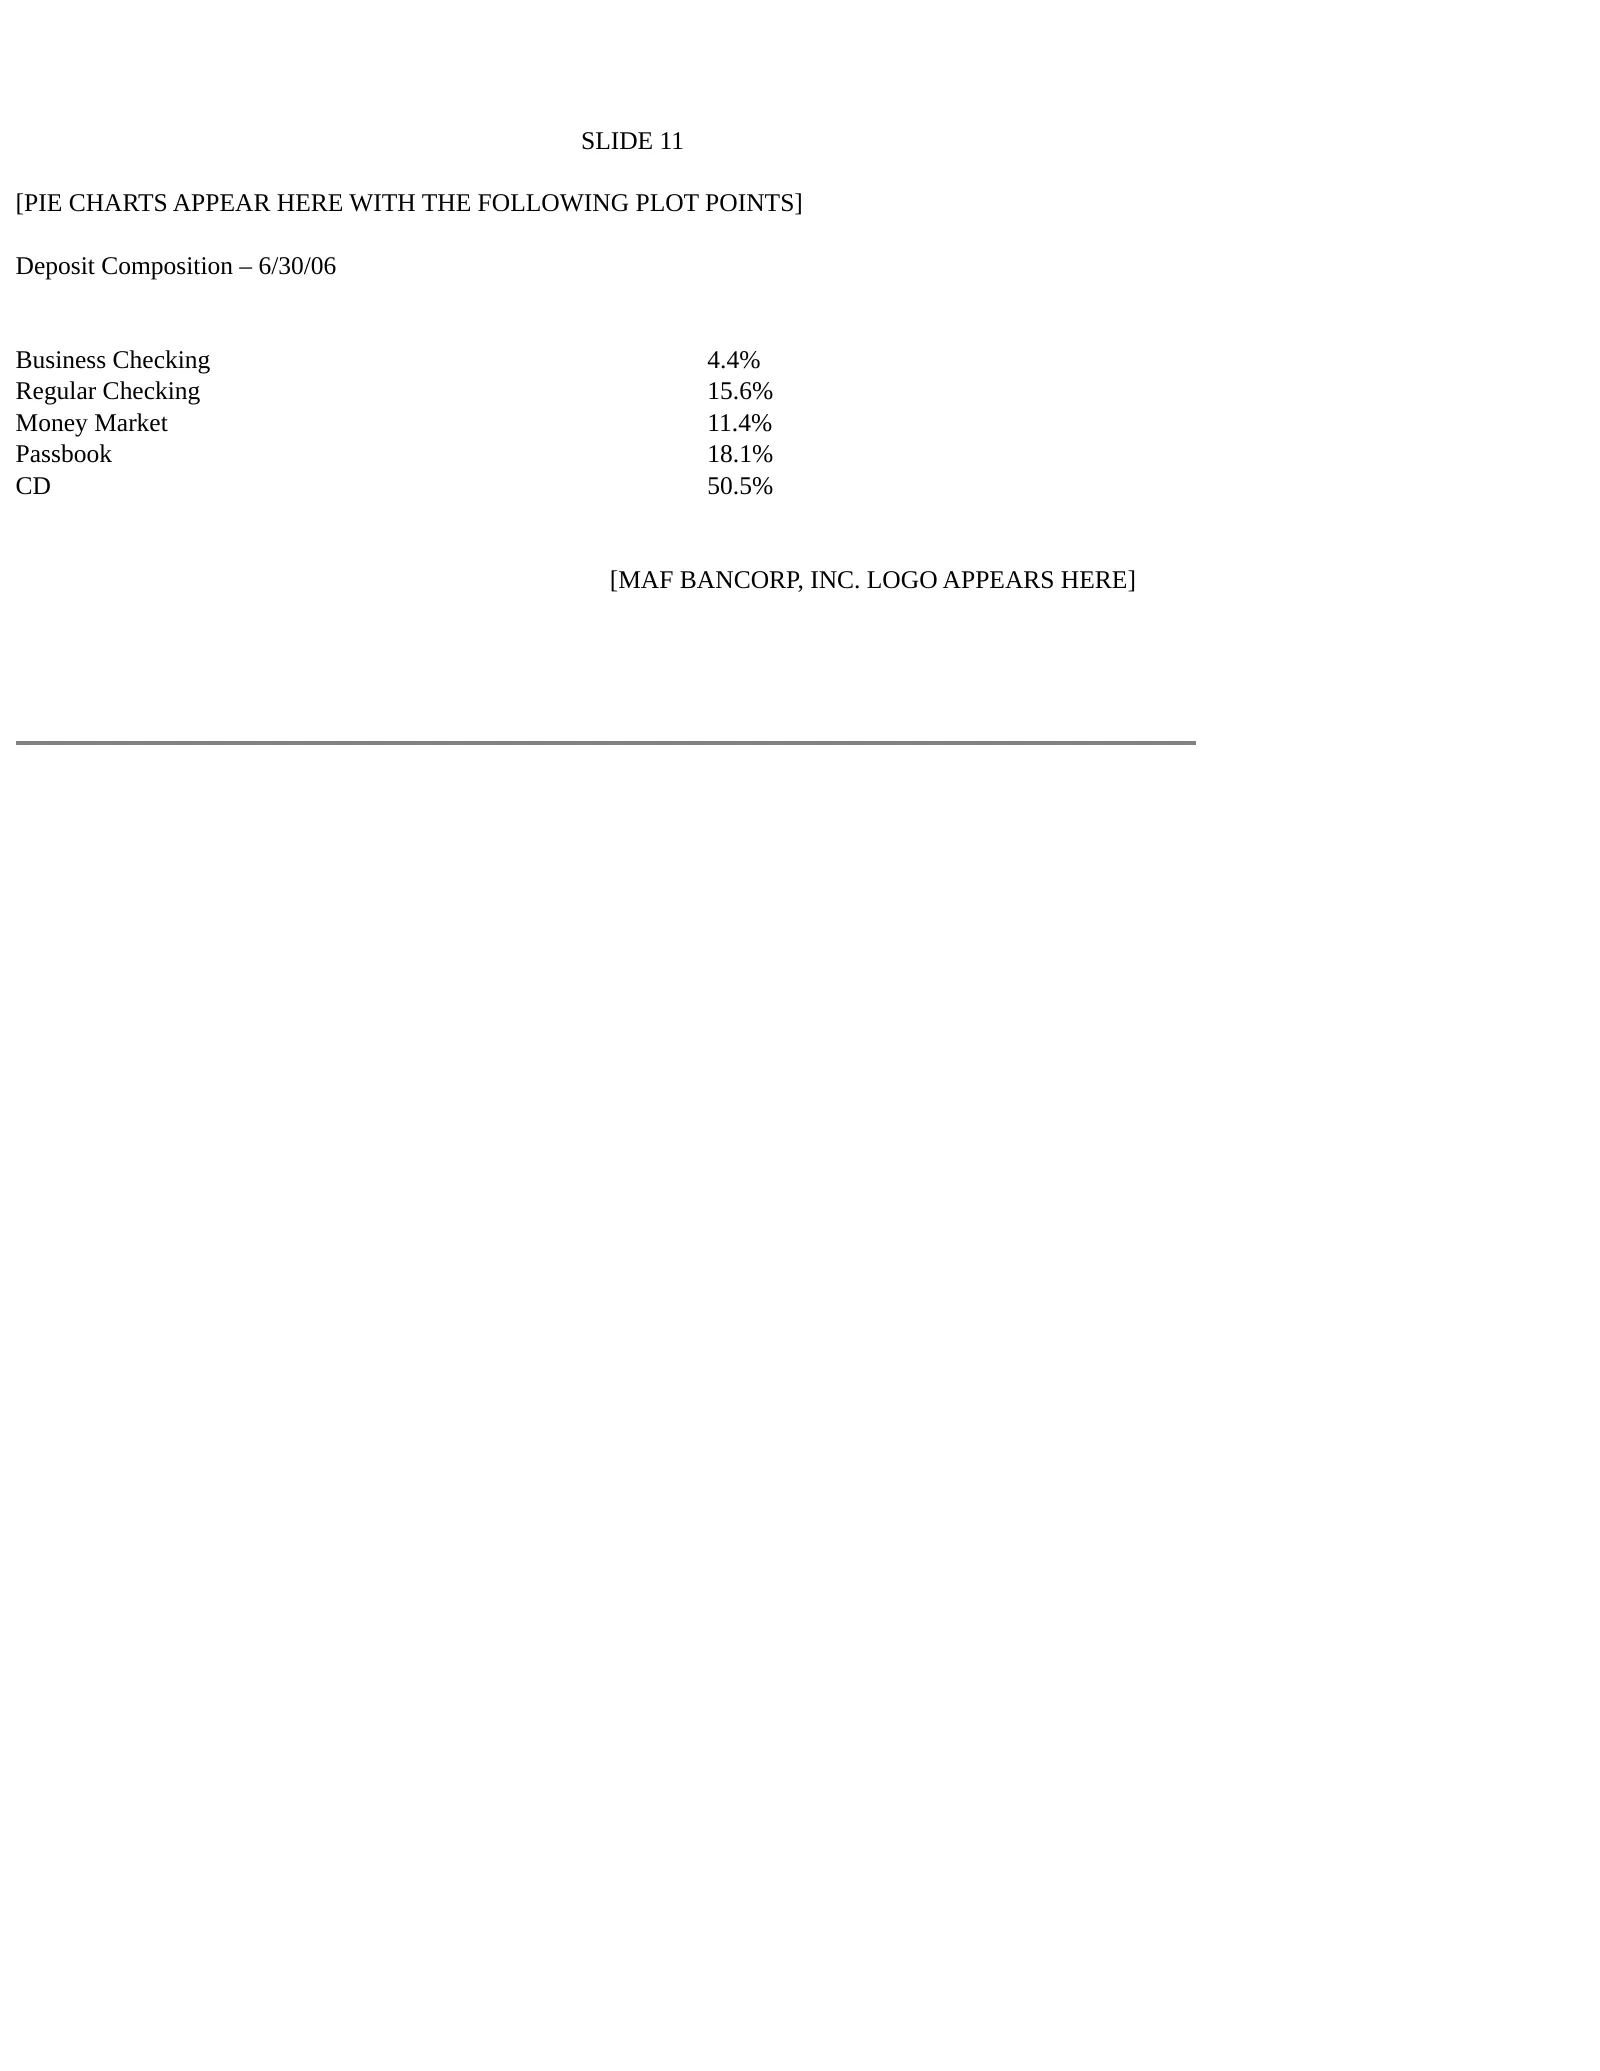
SLIDE 11 [PIE CHARTS APPEAR HERE WITH THE FOLLOWING PLOT POINTS] Deposit Composition – 6/30/06 Business Checking 4.4% Regular Checking 15.6% Money Market 11.4% Passbook 18.1% CD 50.5% [MAF BANCORP, INC. LOGO APPEARS HERE]
Slide 12: Deposit Account Service Charges
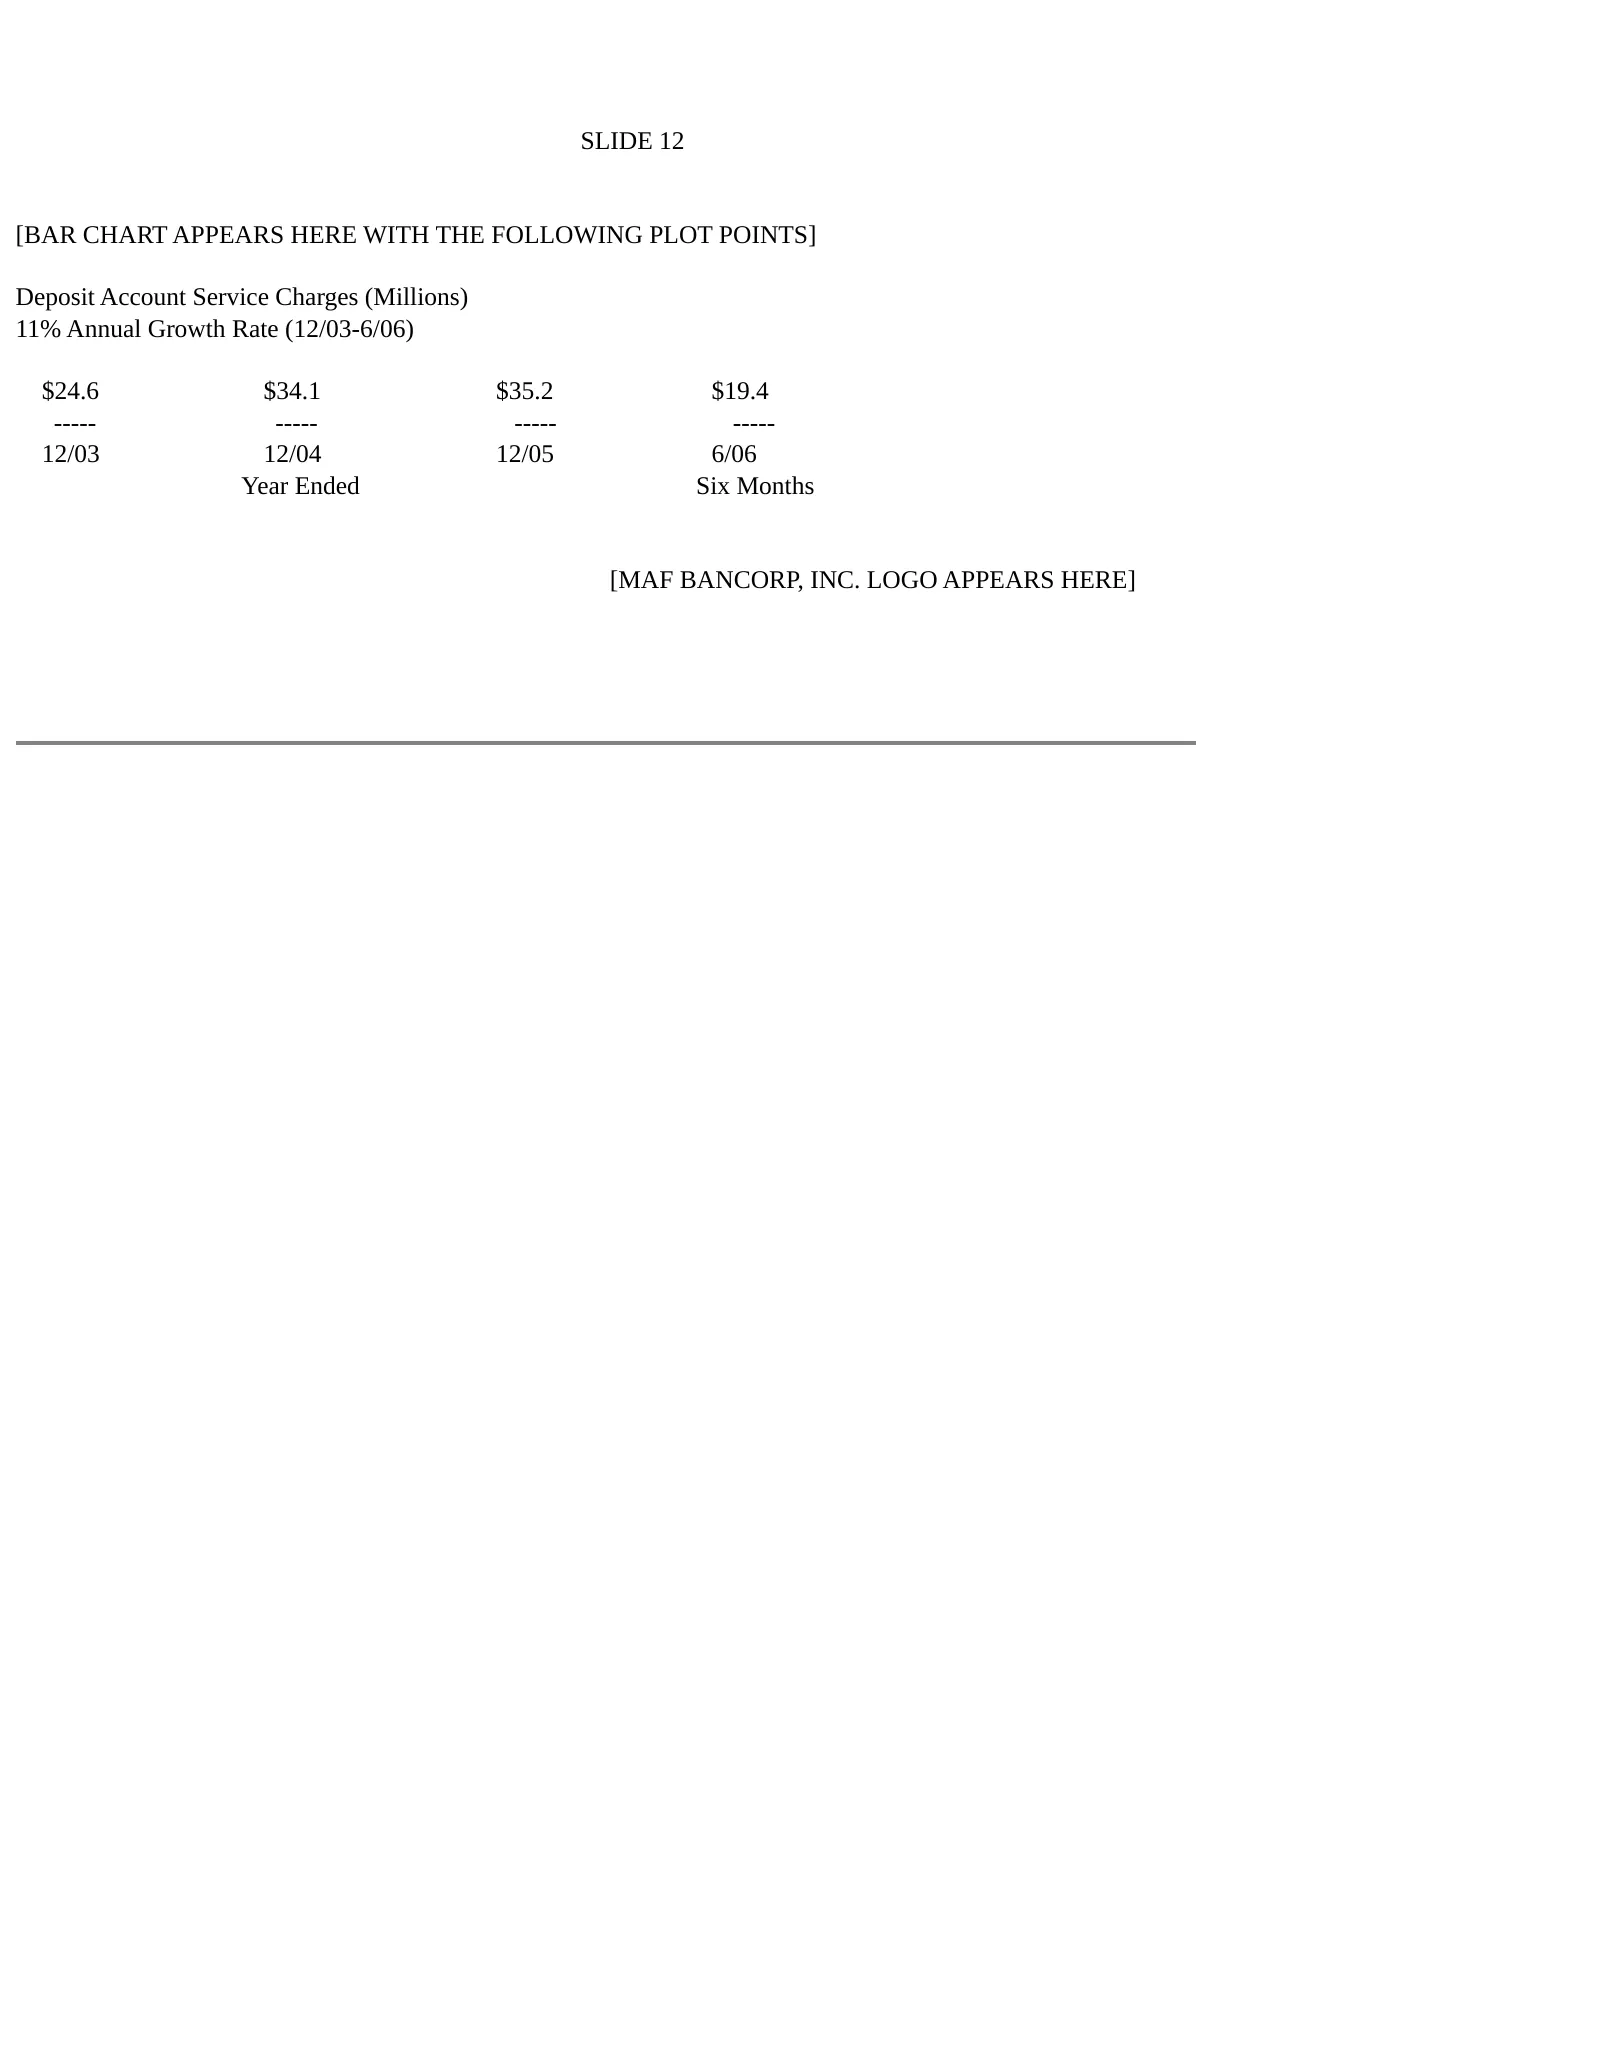
SLIDE 12 [BAR CHART APPEARS HERE WITH THE FOLLOWING PLOT POINTS] Deposit Account Service Charges (Millions) 11% Annual Growth Rate (12/03-6/06) $24.6 $34.1 $35.2 $19.4 ----- ----- ----- ----- 12/03 12/04 12/05 6/06 Year Ended Six Months [MAF BANCORP, INC. LOGO APPEARS HERE]
Slide 13: Mitigate Net Interest Margin Pressure
SLIDE 13 Mitigate Net Interest Margin Pressure o Limited asset growth o Sell more 1-4 family loans o Reduce reliance on higher-cost wholesale borrowings o Reinvest investment portfolio cash flows into loans: o Business Banking loans o HELOCs o ALT A – ARM Loans [MAF BANCORP, INC. LOGO APPEARS HERE]
Slide 14: Loan Portfolio Composition
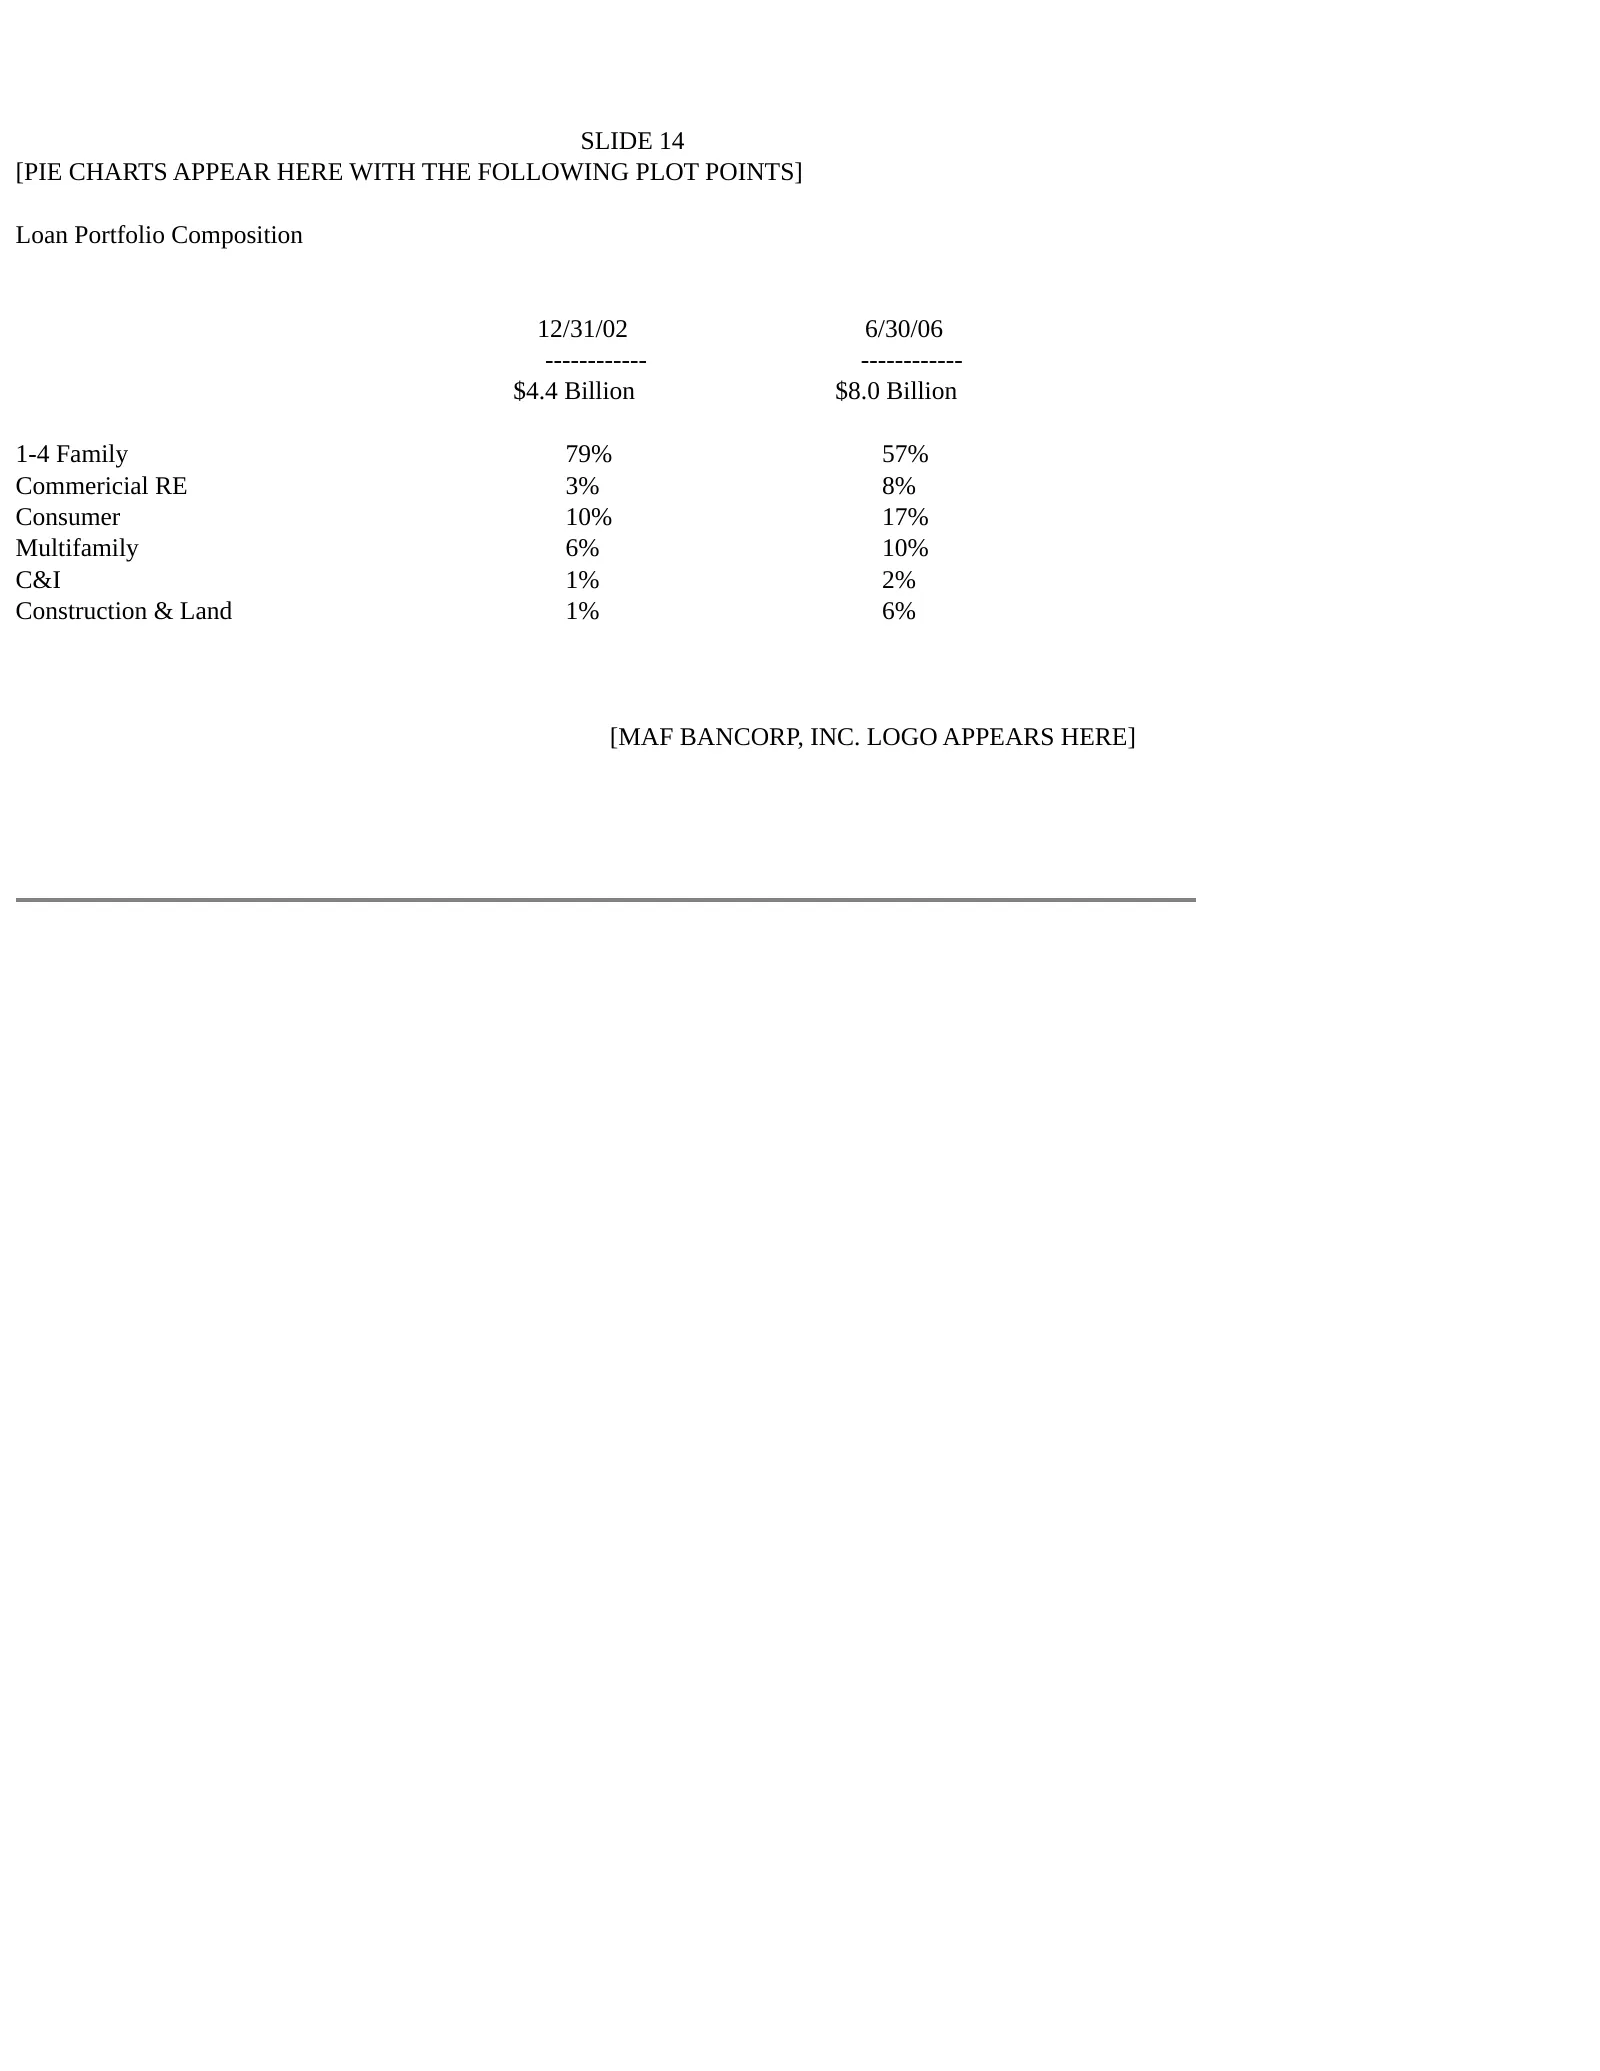
SLIDE 14 [PIE CHARTS APPEAR HERE WITH THE FOLLOWING PLOT POINTS] Loan Portfolio Composition 12/31/02 6/30/06 ------------ ------------ $4.4 Billion $8.0 Billion 1-4 Family 79% 57% Commericial RE 3% 8% Consumer 10% 17% Multifamily 6% 10% C&I 1% 2% Construction & Land 1% 6% [MAF BANCORP, INC. LOGO APP
Slide 15: Loan Diversification
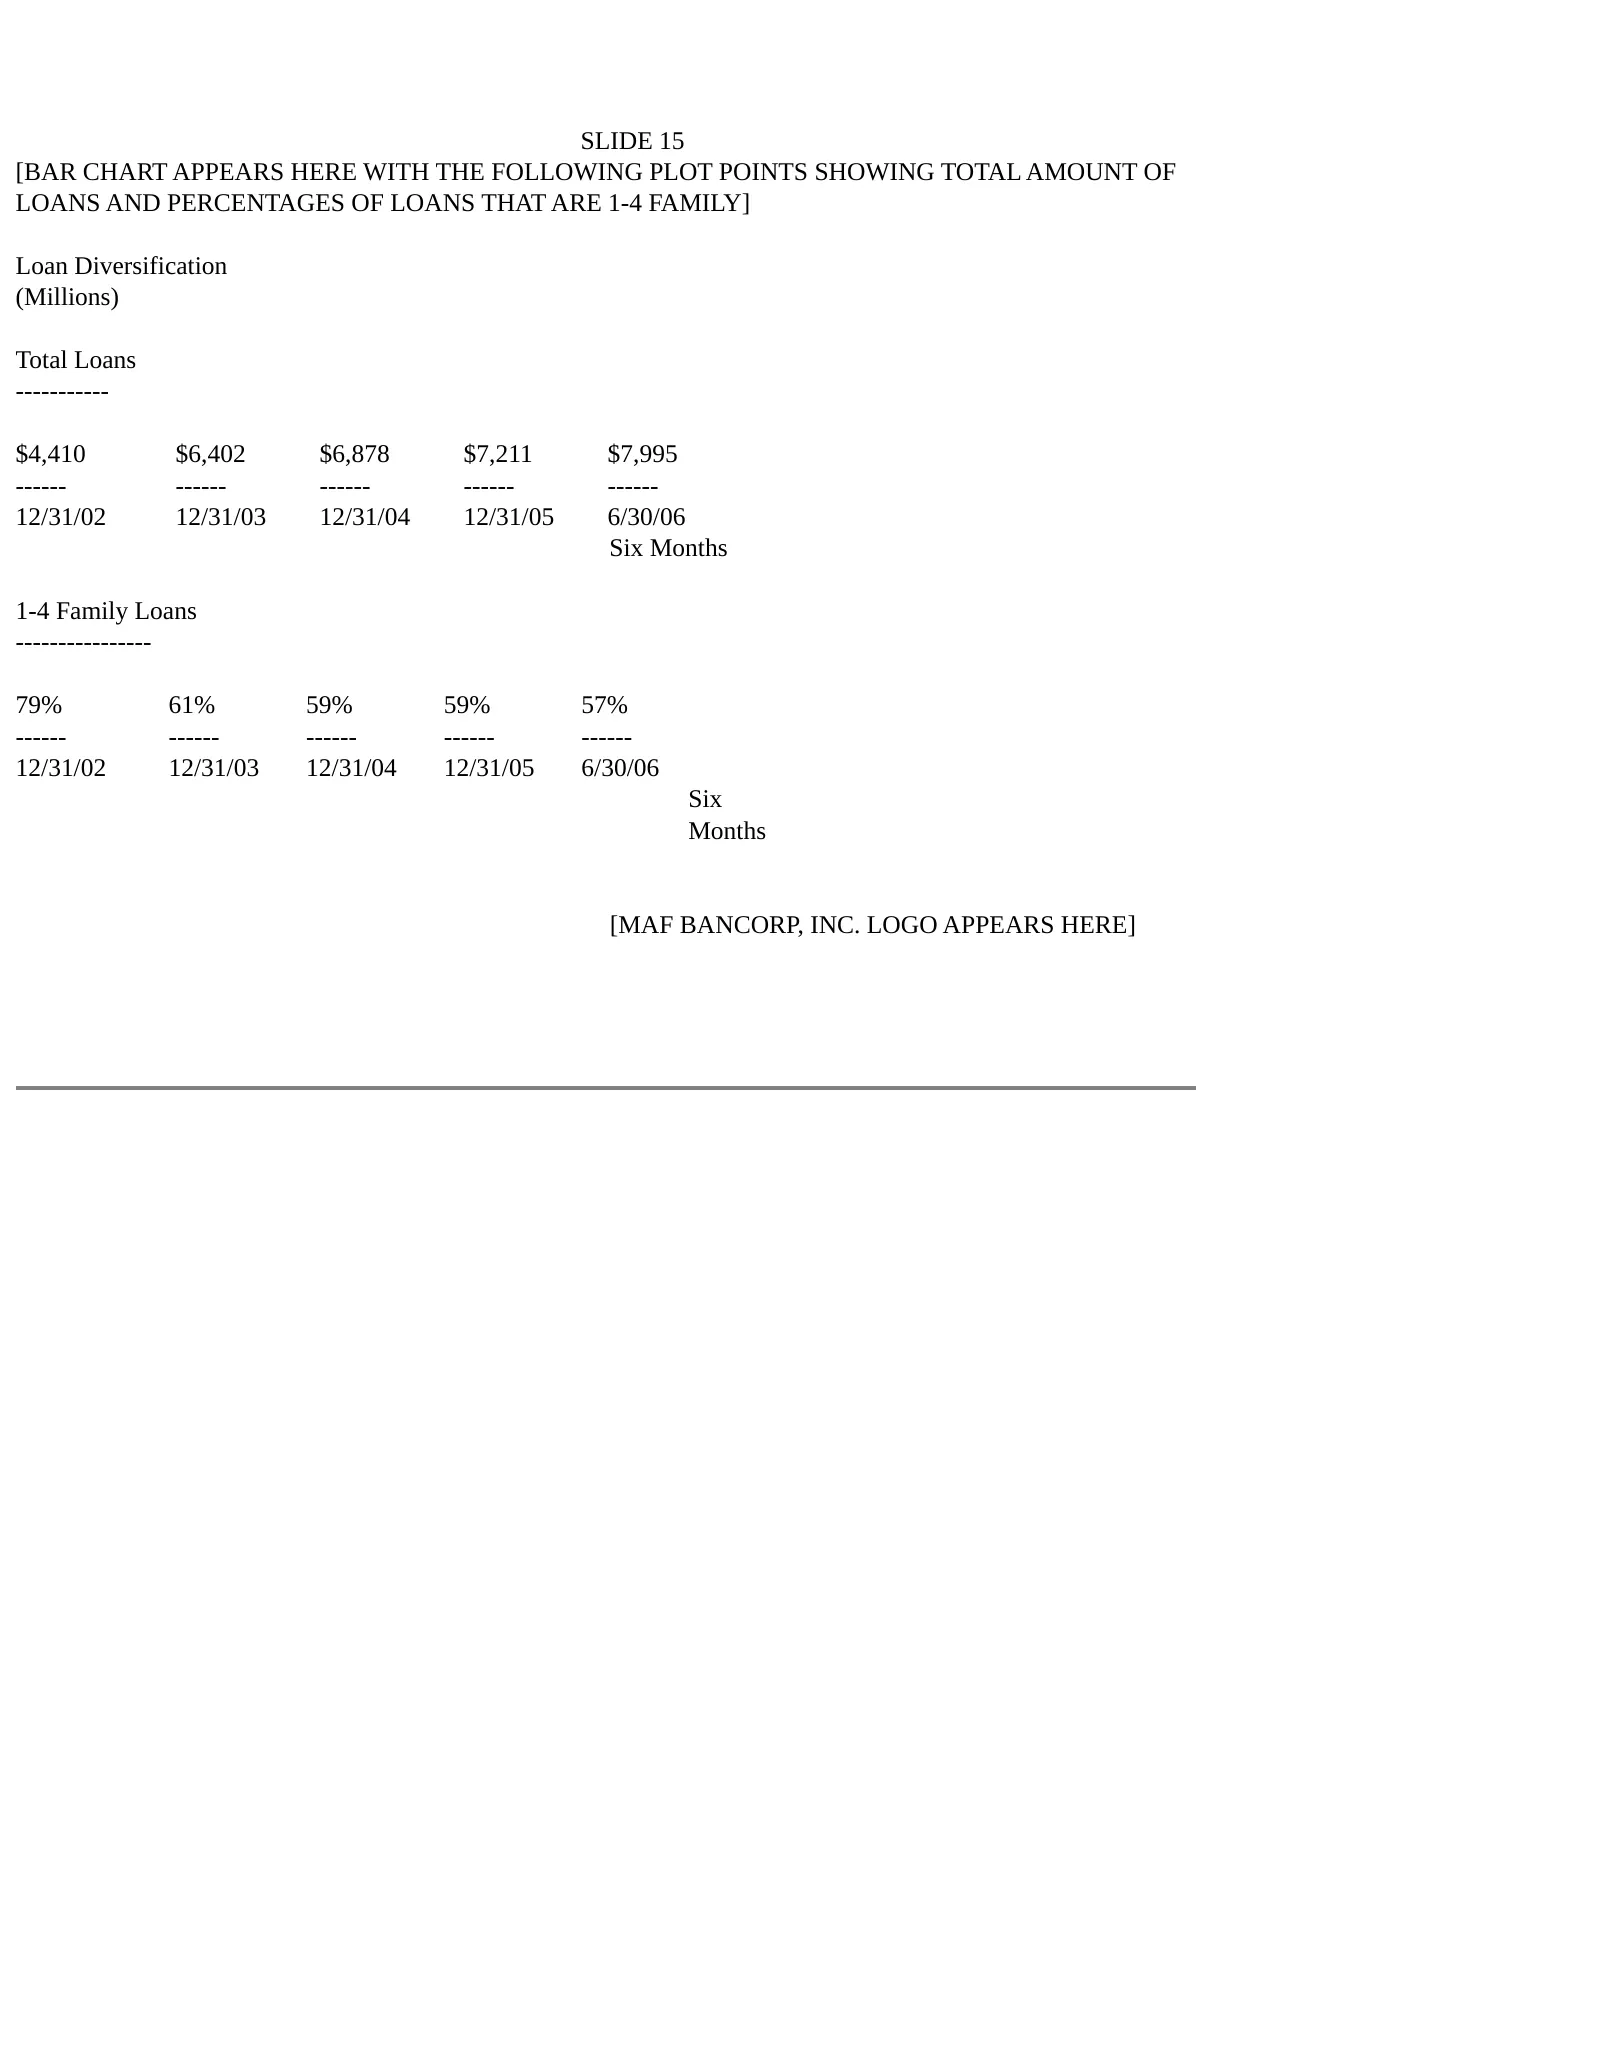
SLIDE 15 [BAR CHART APPEARS HERE WITH THE FOLLOWING PLOT POINTS SHOWING TOTAL AMOUNT OF LOANS AND PERCENTAGES OF LOANS THAT ARE 1-4 FAMILY] Loan Diversification (Millions) Total Loans ----------- $4,410 $6,402 $6,878 $7,211 $7,995 ------ ------ ------ ------ ------ 12/31/02 12/31/03 12/31/04 12/31/0
Slide 16: Business Banking
SLIDE 16 BUSINESS BANKING o Direct Connection with Business Customers o Fee Syndicated or Participation Loans o Focus on Lending and Deposit Services o Excellent Credit Quality [MAF BANCORP, INC. LOGO APPEARS HERE]
Slide 17: Home Equity Line of Credit Balances
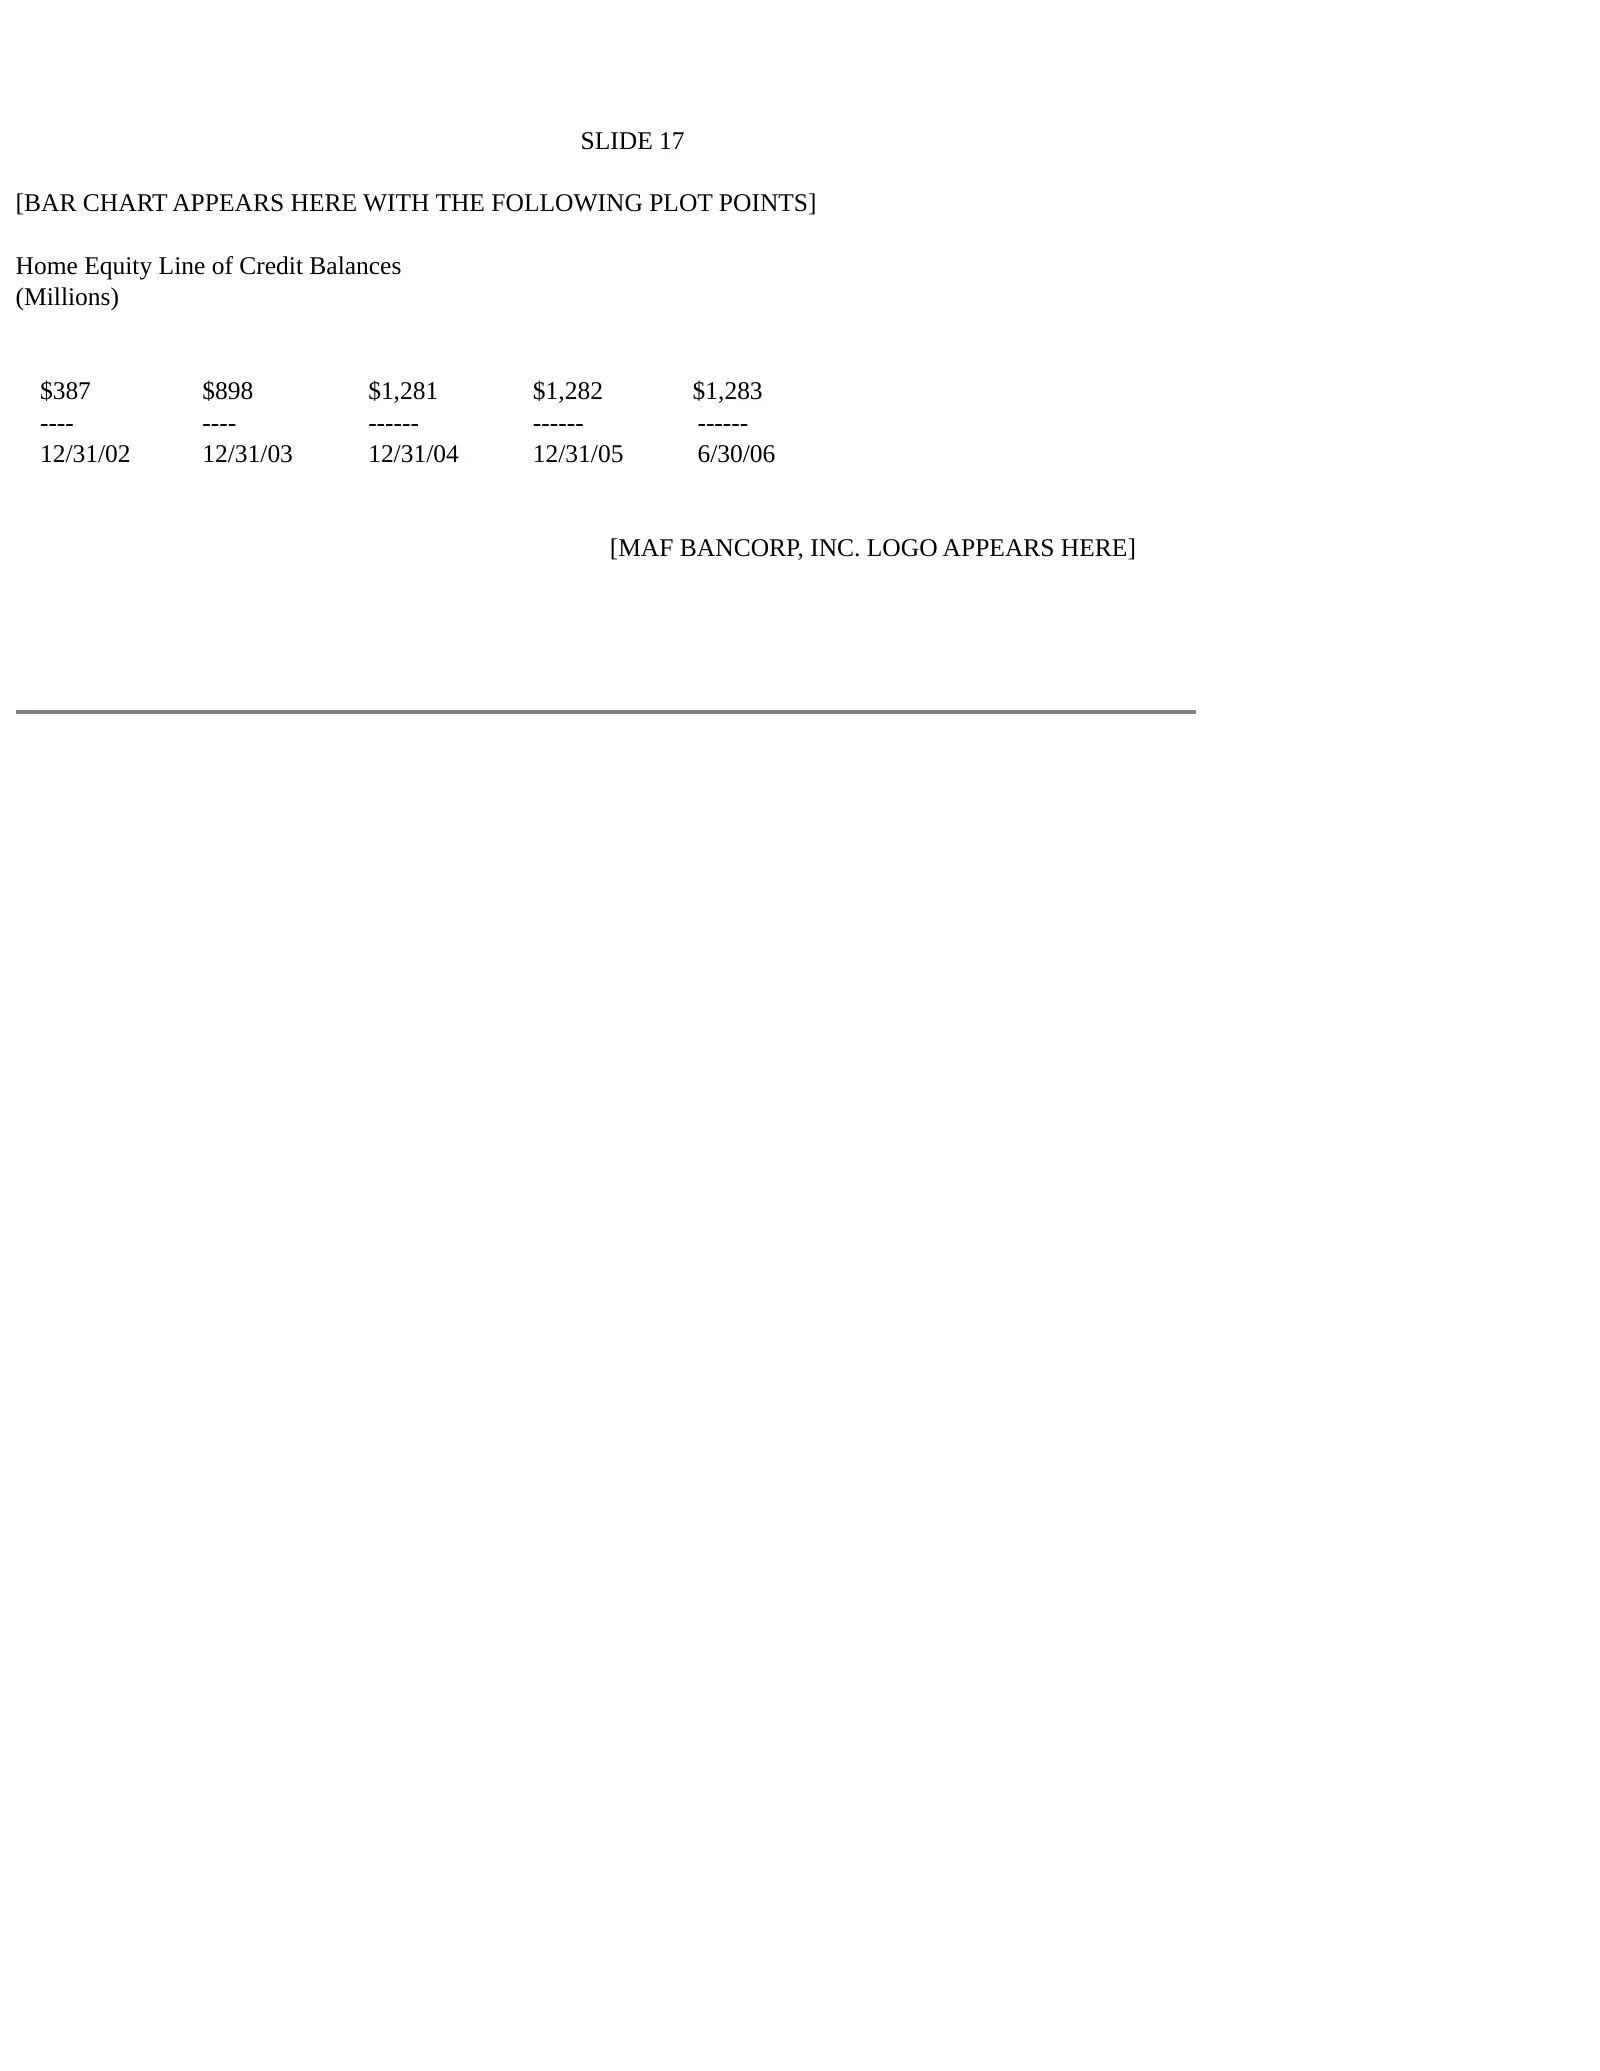
SLIDE 17 [BAR CHART APPEARS HERE WITH THE FOLLOWING PLOT POINTS] Home Equity Line of Credit Balances (Millions) $387 $898 $1,281 $1,282 $1,283 ---- ---- ------ ------ ------ 12/31/02 12/31/03 12/31/04 12/31/05 6/30/06 [MAF BANCORP, INC. LOGO APPEARS HERE]
Slide 18: Multi-Family Loan Balances
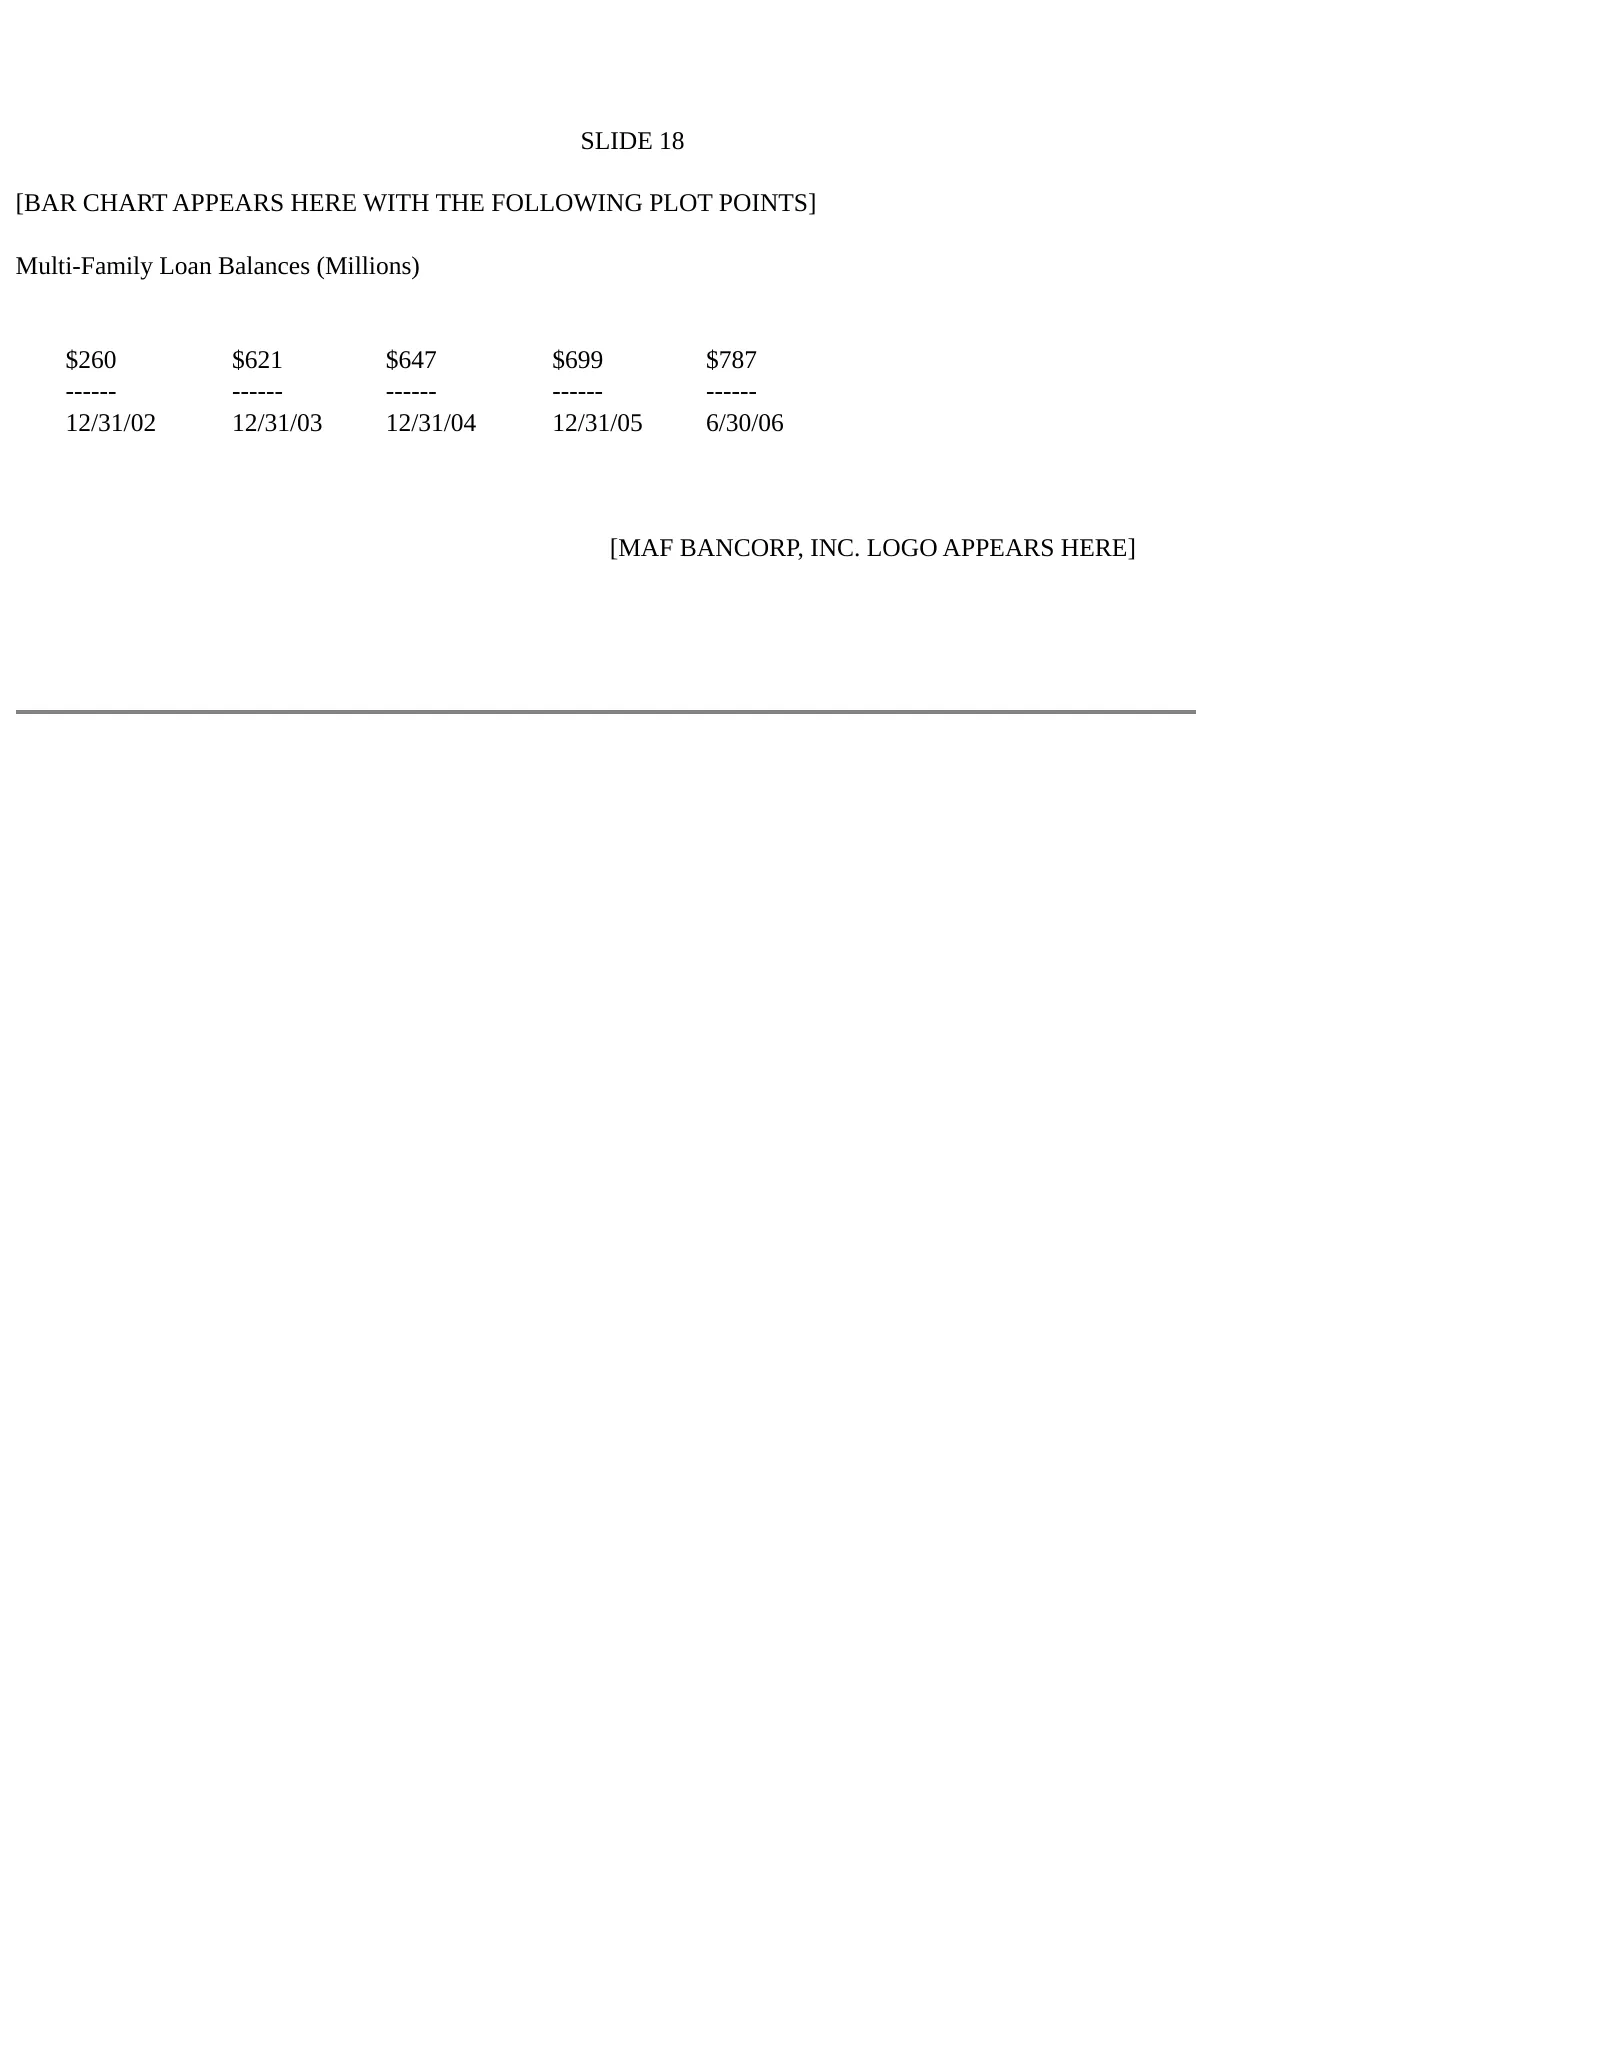
SLIDE 18 [BAR CHART APPEARS HERE WITH THE FOLLOWING PLOT POINTS] Multi-Family Loan Balances (Millions) $260 $621 $647 $699 $787 ------ ------ ------ ------ ------ 12/31/02 12/31/03 12/31/04 12/31/05 6/30/06 [MAF BANCORP, INC. LOGO APPEARS HERE]
Slide 19: Mortgage Loans - Cross Penetration
SLIDE 19 Mortgage Loans - Cross Penetration Six Months Ended June 30, 2006 o 44% - Equity Lines of Credit o 46% - Checking Accounts [MAF BANCORP, INC. LOGO APPEARS HERE]
Slide 20: Loan-Generated Fee Income
SLIDE 20 Loan-Generated Fee Income o Risk Sharing with Mortgage Insurance Companies o Title Insurance o Mortgage Servicing [MAF BANCORP, INC. LOGO APPEARS HERE]
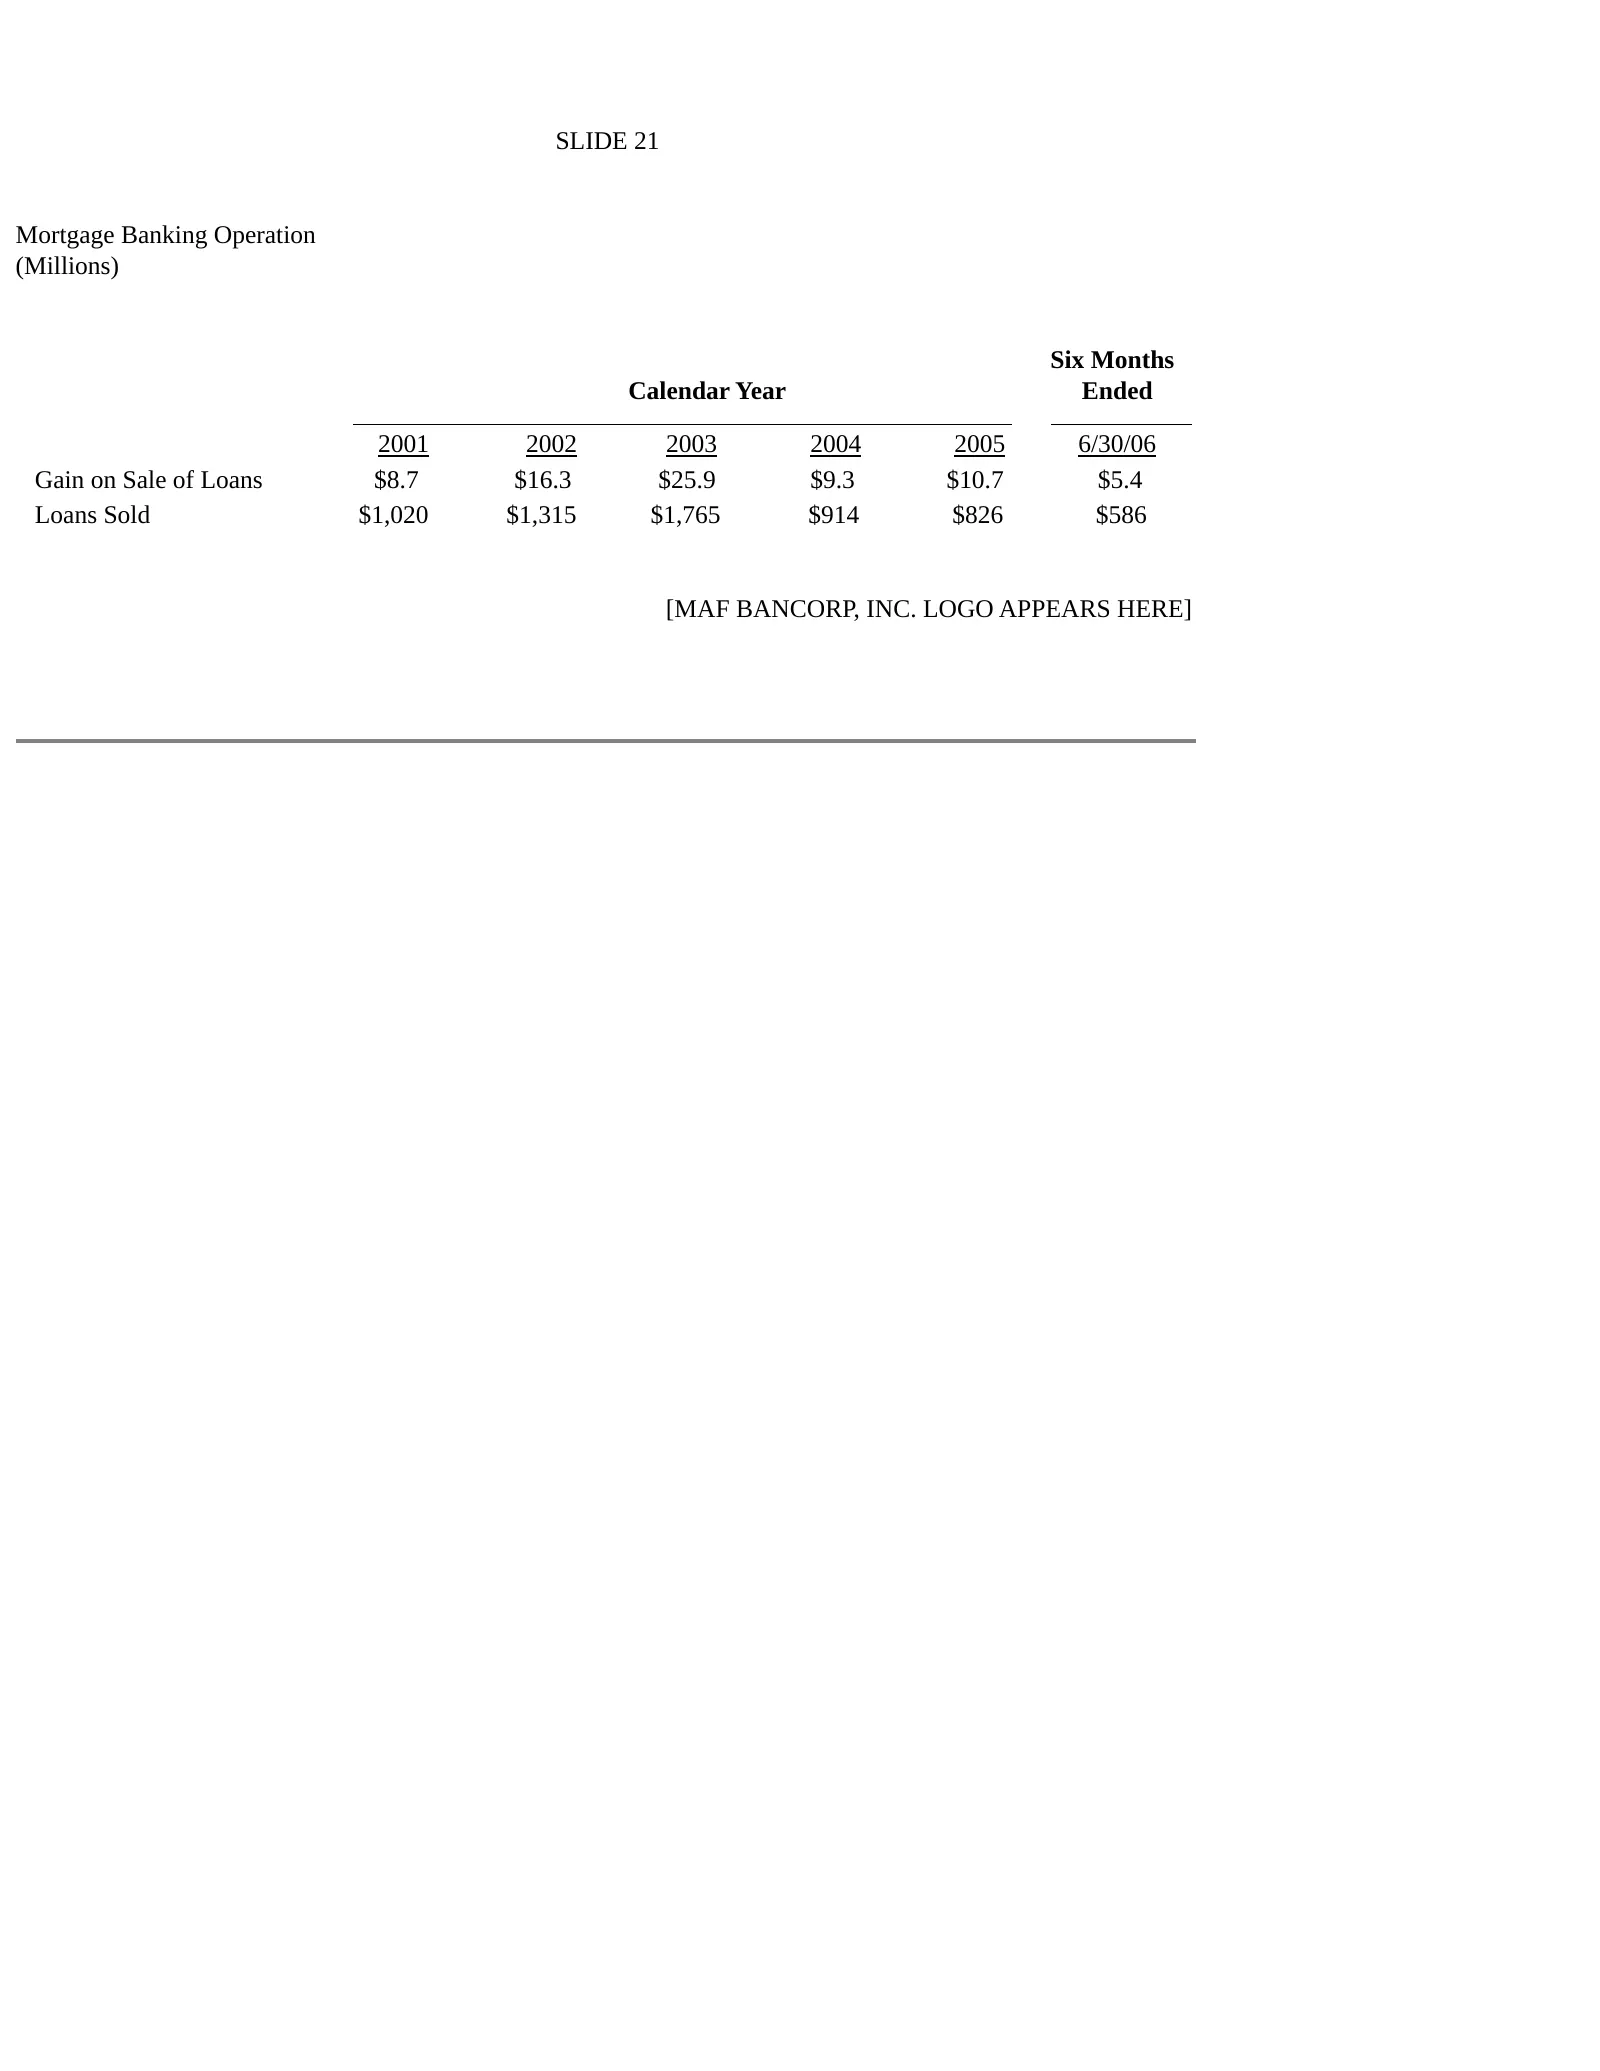
Slide 21: Mortgage Banking Operation
SLIDE 21 Mortgage Banking Operation (Millions) Six Months Calendar Year Ended 2001 2002 2003 2004 2005 6/30/06 Gain on Sale of Loans $8.7 $16.3 $25.9 $9.3 $10.7 $5.4 Loans Sold $1,020 $1,315 $1,765 $914 $826 $586 [MAF BANCORP, INC. LOGO APPEARS HERE]
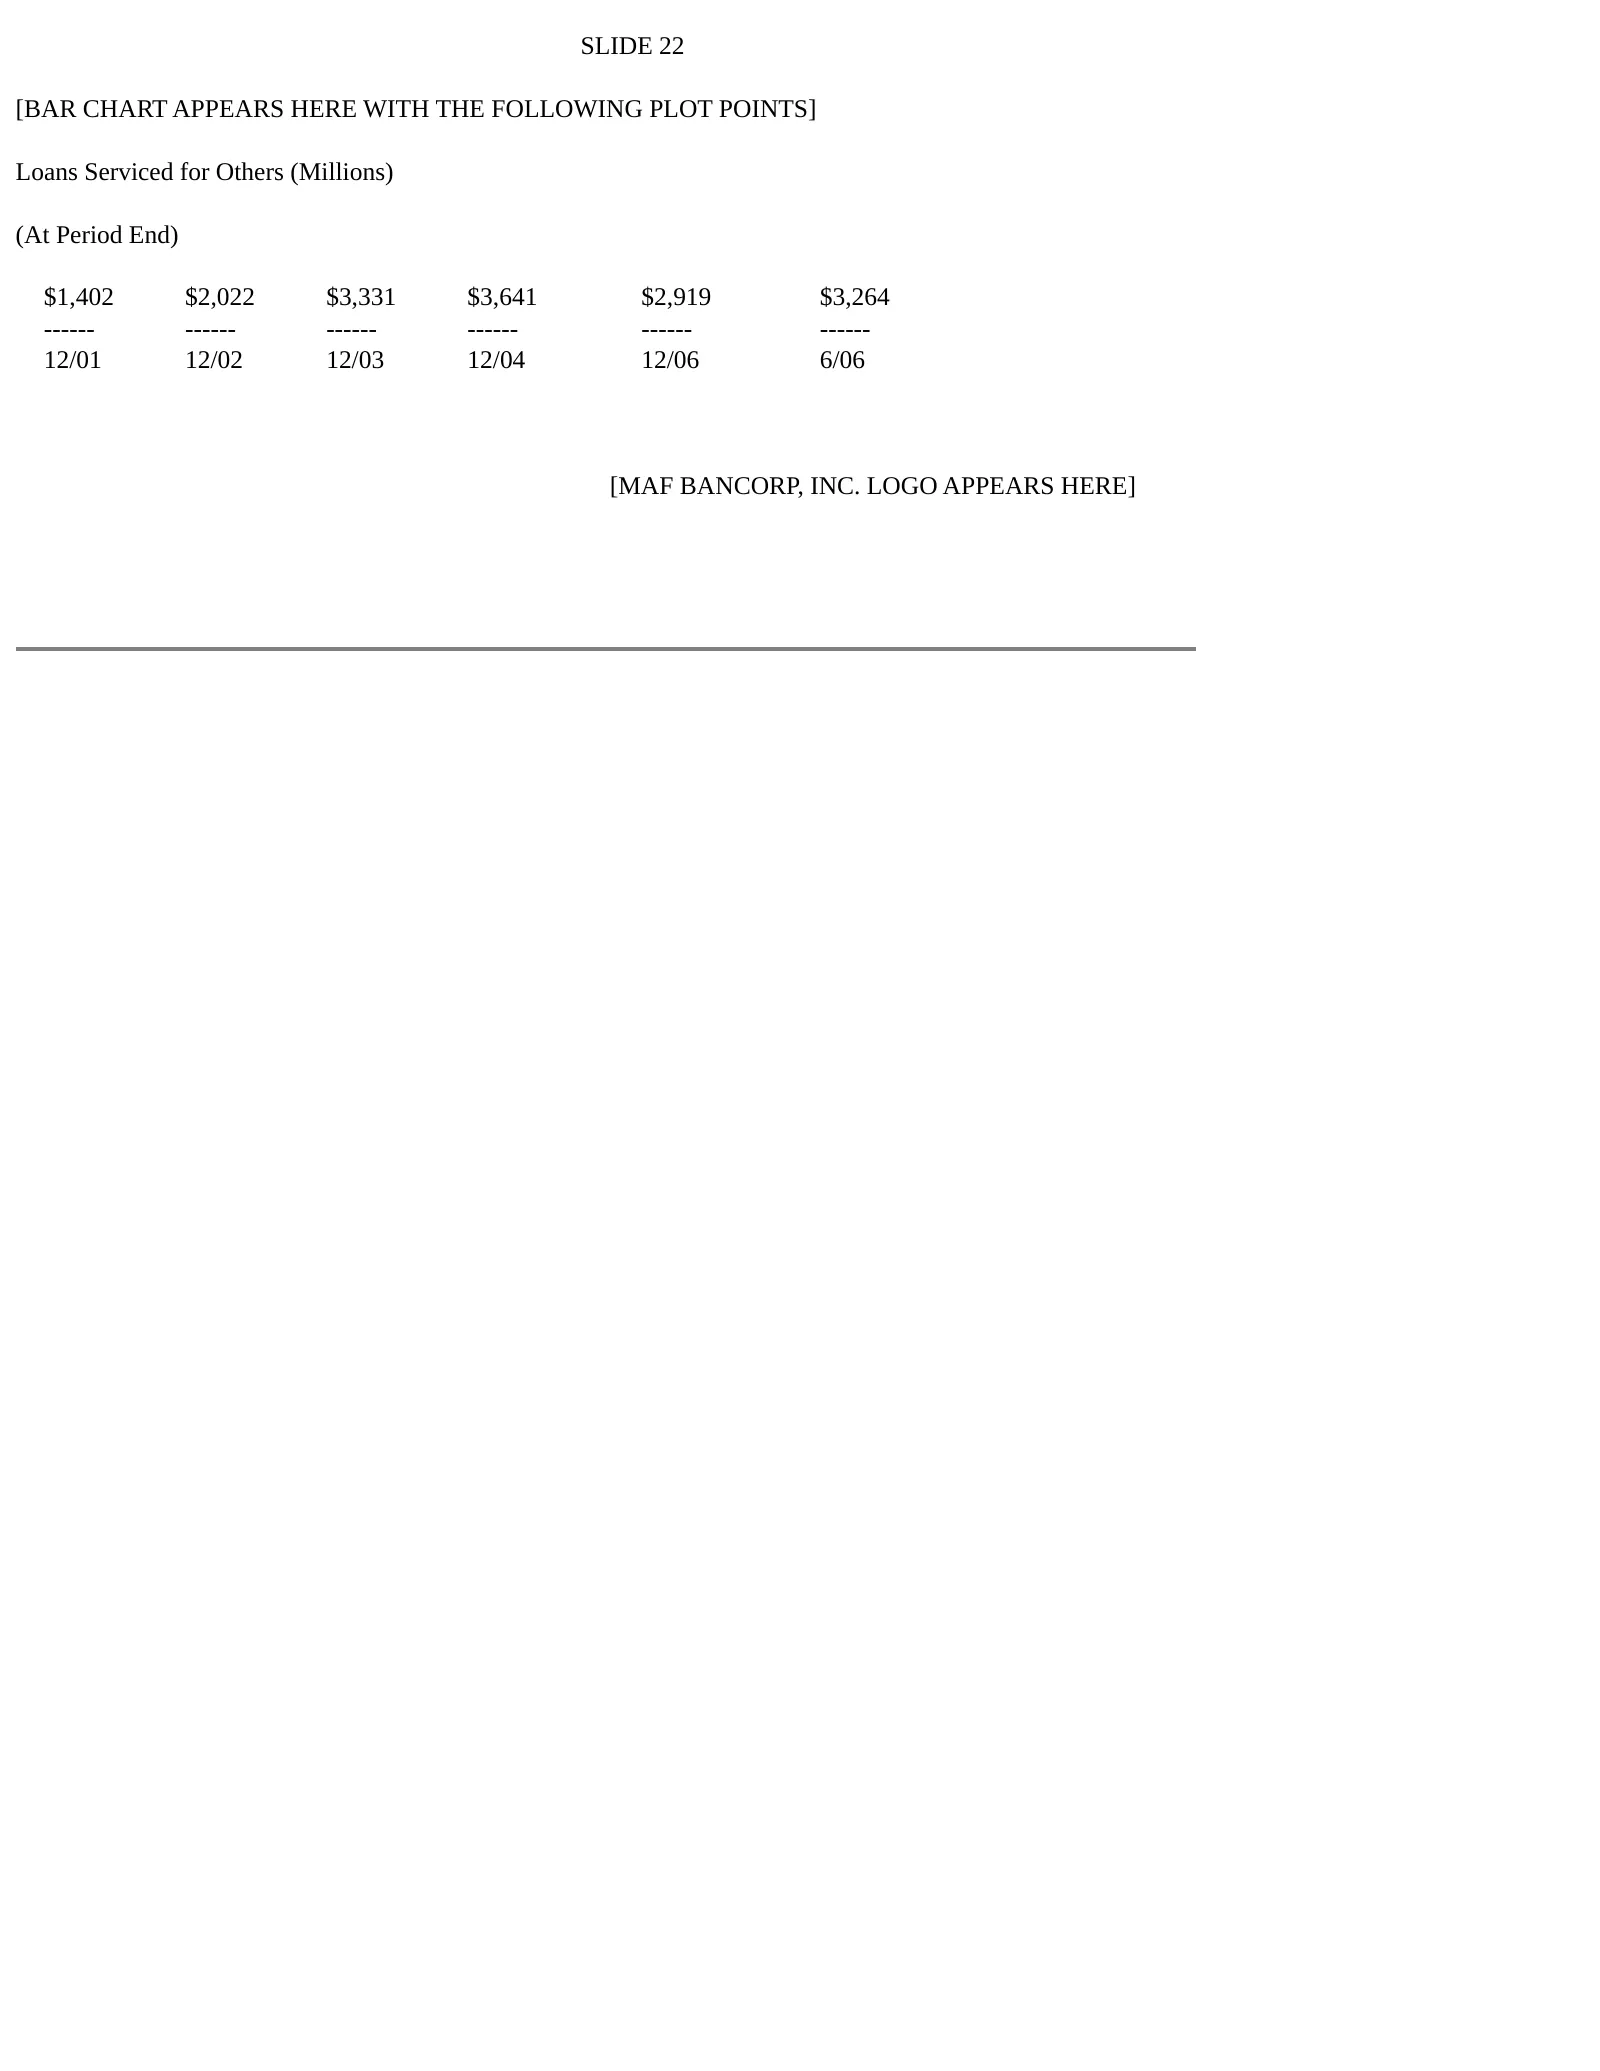
Slide 22: Loans Serviced for Others
SLIDE 22 [BAR CHART APPEARS HERE WITH THE FOLLOWING PLOT POINTS] Loans Serviced for Others (Millions) (At Period End) $1,402 $2,022 $3,331 $3,641 $2,919 $3,264 ------ ------ ------ ------ ------ ------ 12/01 12/02 12/03 12/04 12/06 6/06 [MAF BANCORP, INC. LOGO APPEARS HERE]
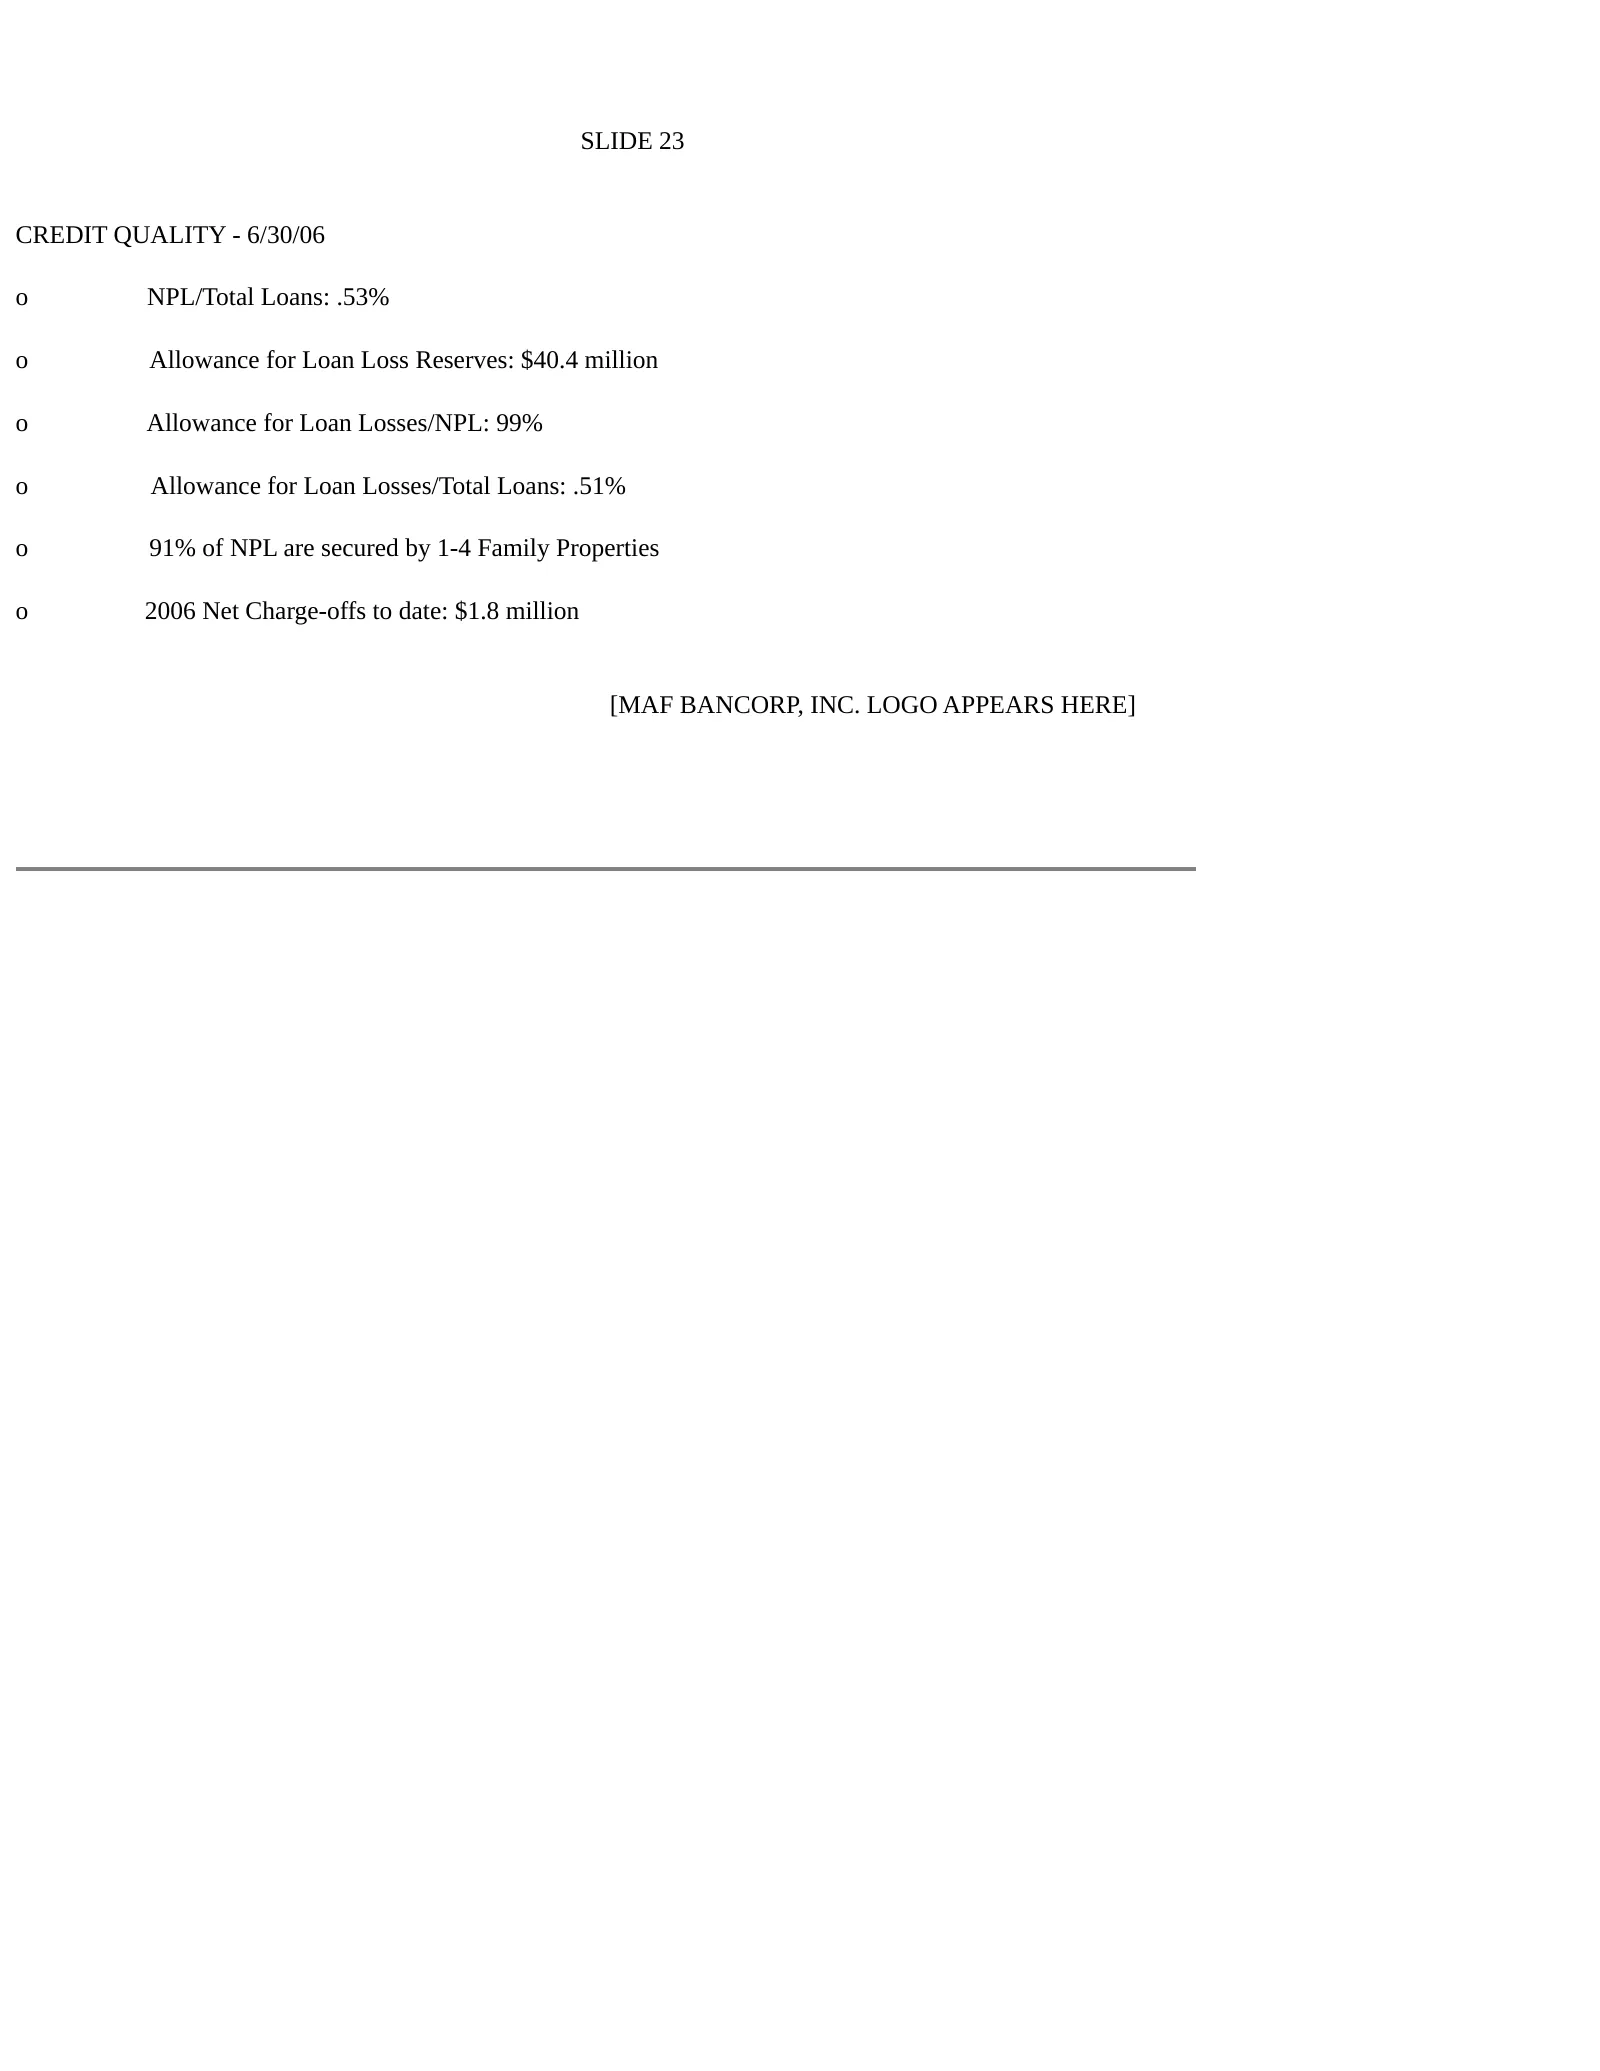
Slide 23: Credit Quality - 6/30/06
SLIDE 23 CREDIT QUALITY - 6/30/06 o NPL/Total Loans: .53% o Allowance for Loan Loss Reserves: $40.4 million o Allowance for Loan Losses/NPL: 99% o Allowance for Loan Losses/Total Loans: .51% o 91% of NPL are secured by 1-4 Family Properties o 2006 Net Charge-offs to date: $1.8 million [MAF BANCORP,
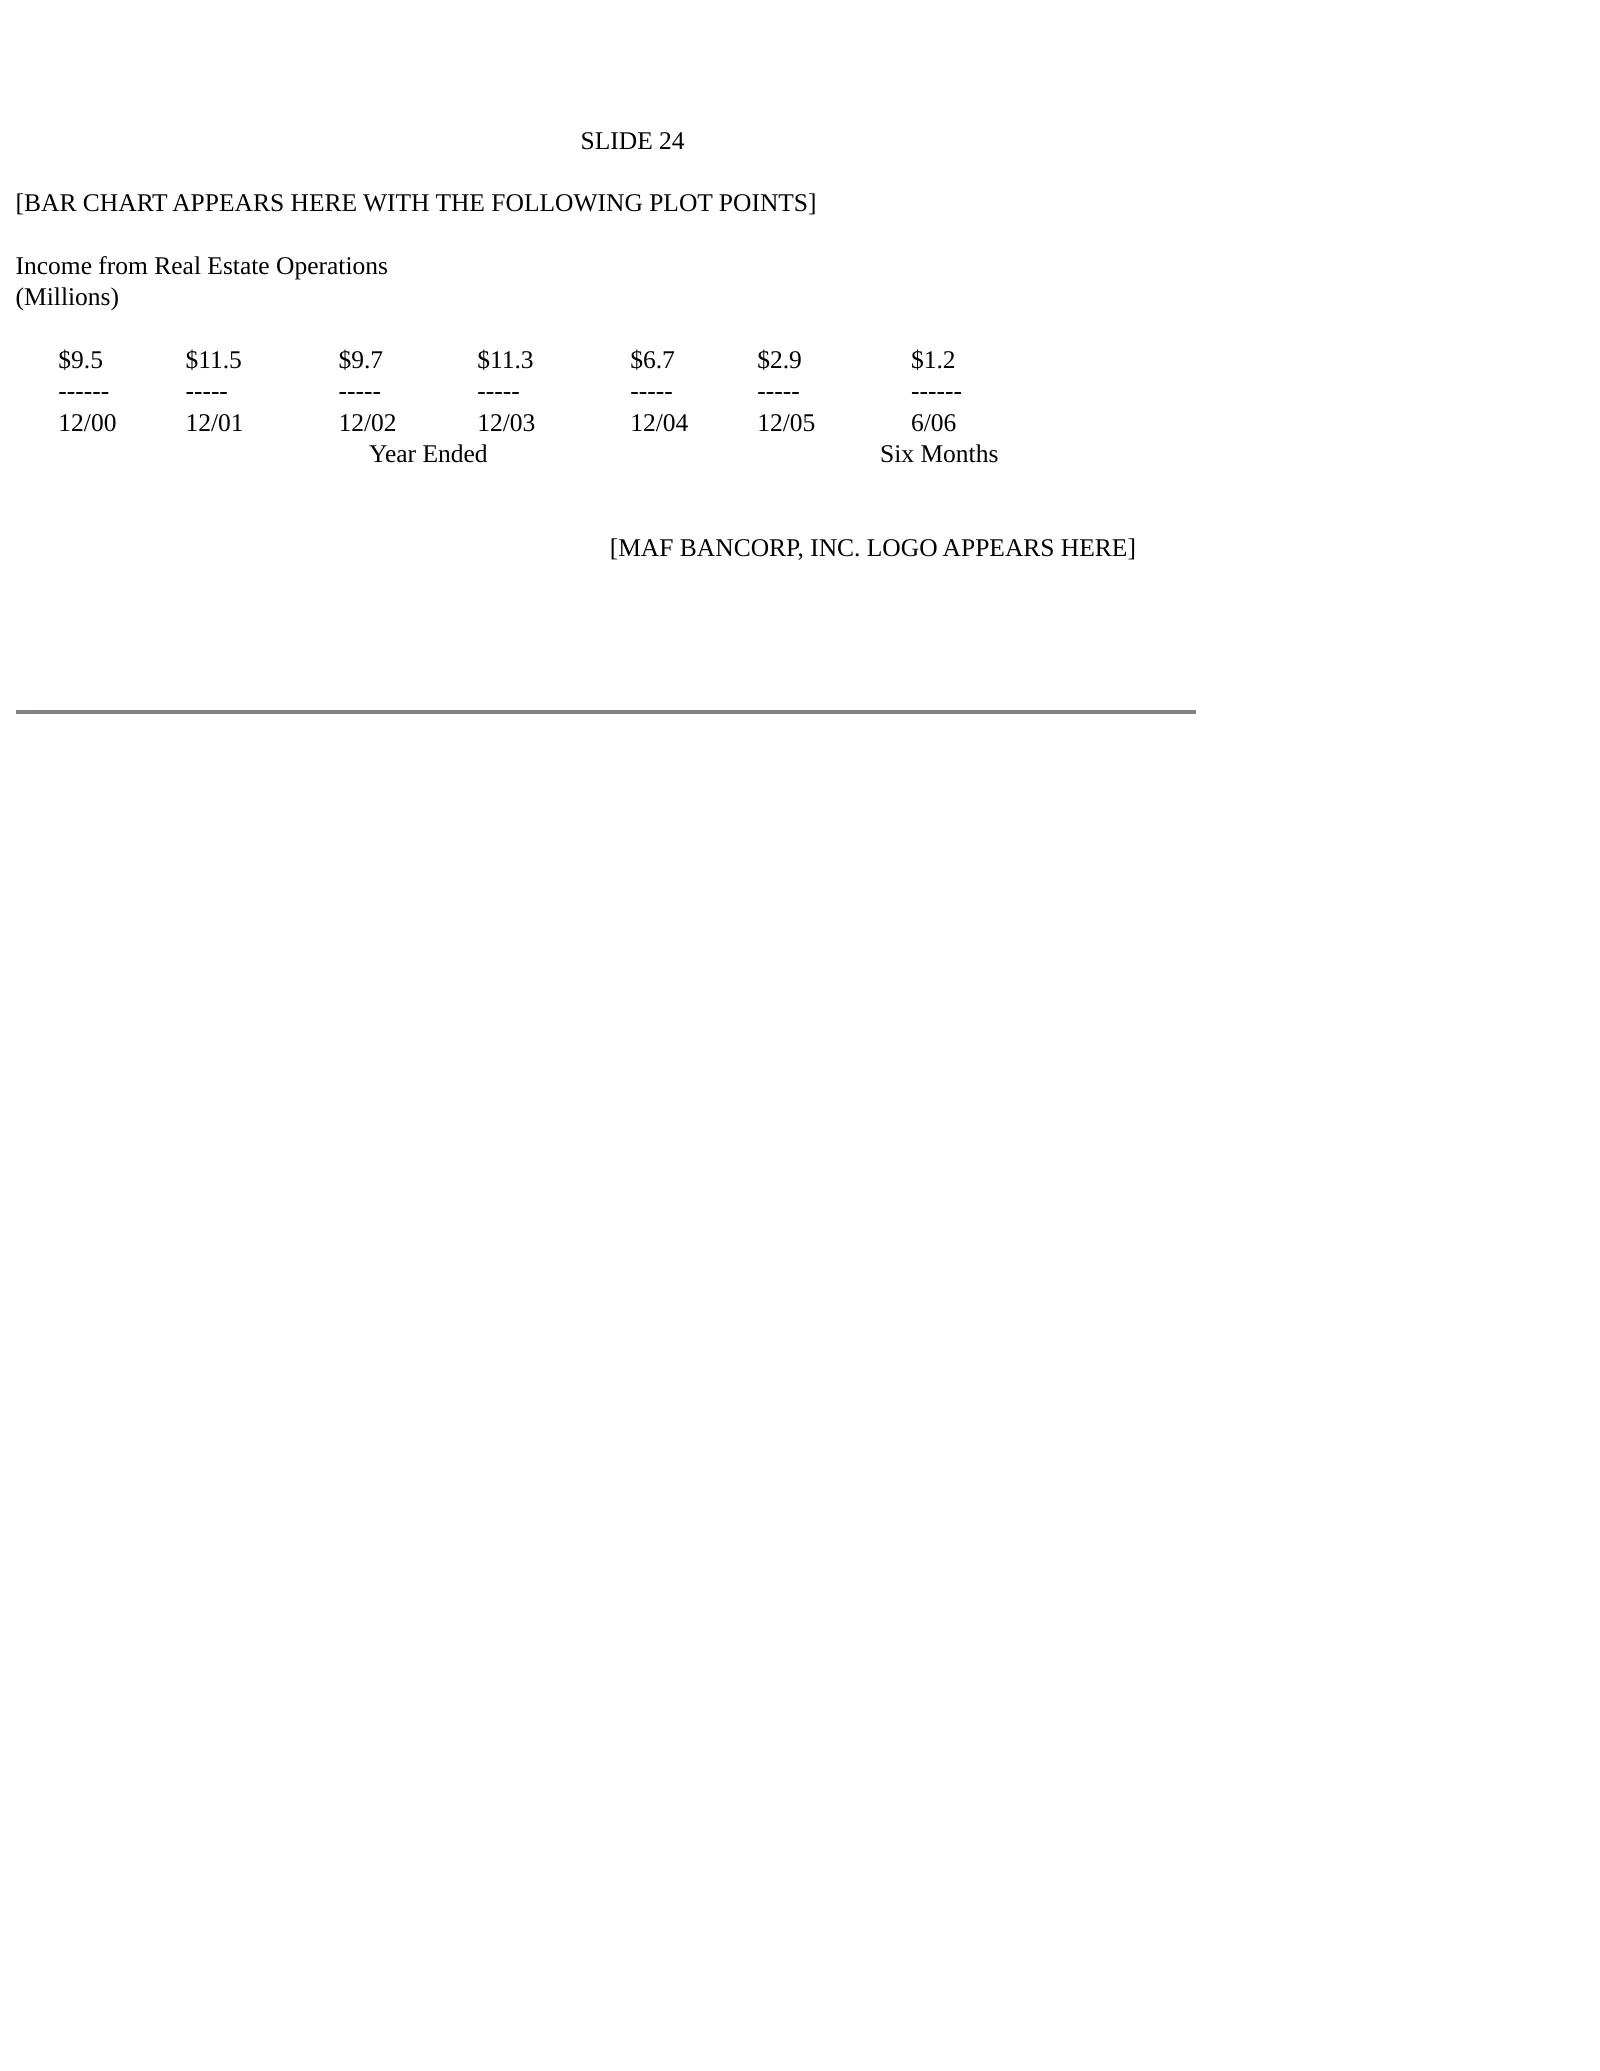
Slide 24: Income from Real Estate Operations
SLIDE 24 [BAR CHART APPEARS HERE WITH THE FOLLOWING PLOT POINTS] Income from Real Estate Operations (Millions) $9.5 $11.5 $9.7 $11.3 $6.7 $2.9 $1.2 ------ ----- ----- ----- ----- ----- ------ 12/00 12/01 12/02 12/03 12/04 12/05 6/06 Year Ended Six Months [MAF BANCORP, INC. LOGO APPEARS HERE]
Slide 25: Springbank of Plainfield Development Map
SLIDE 25 [MAP OF SPRINGBANK OF PLAINFIELD DEVELOPMENT APPEARS HERE]
Slide 26: Non Interest Expense/Average Assets
SLIDE 26 [BAR CHART APPEARS HERE WITH THE FOLLOWING PLOT POINTS] Non Interest Expense/Average Assets 1.86% 1.99% 1.84% 1.74% ----- ----- ----- ----- 12/03 12/04 12/05 6/06 Six Months [MAF BANCORP, INC. LOGO APPEARS HERE]
Slide 27: Annual Cash Dividends
SLIDE 27 [BAR CHART APPEARS HERE WITH THE FOLLOWING PLOT POINTS] Annual Cash Dividends $0.06 $0.14 $0.15 $0.18 $0.26 $0.34 ----- ----- ----- ----- ----- ----- 1994 1995 1996 1997 1998 1999 $0.39 $0.46 $0.60 $0.72 $0.84 $0.92 $1.00 ----- ----- ----- ----- ----- ----- ----- 2000 2001 2002 2003 2004 20
Slide 28: Company Highlights
SLIDE 28 Company Highlights o Growing franchise in attractive markets o Strong and varied asset - generation capabilities o Multiple non-interest income sources o Excellent credit quality [MAF BANCORP, INC. LOGO APPEARS HERE]
Slide 29: MAF Bancorp, Inc.
SLIDE 29 MAF BANCORP, INC. LOGO APPEARS HERE]
Source: SEC EDGAR · 8-K filed Sep 12, 2006
More decks from Maf Bancorp Inc
 MAF Bancorp — Merger or Acquisition (May 2007)17 slides · May 1, 2007
 Midwest 2006 Super-Community Bank Conference and Keefe, Bruyette & Woods 2006 Regional Ban34 slides · Feb 24, 2006
 America's Community Bankers Community Bank Investor Conference 200634 slides · Feb 21, 2006
 Merger or Acquisition (May 2003)38 slides · May 21, 2003