Thermadyne — Investor Presentation (January 2009)
23 slides from Thermadyne's investor presentation, Jan 22, 2009

Slide 1: Business Outlook - An Update To Investors
Thermadyne Holdings Corporation (NASDAQ: THMD) Business Outlook - An Update To Investors January 22, 2009
Slide 2: Forward-Looking Statement Disclaimer
Forward-Looking Statement Disclaimer These slides contain (and the accompanying oral discussion will contain) "forward-looking statements" within the meaning of the Private Securities Litigation Reform Act of 1995. Such statements present management's expectations, beliefs, plans and objectives and
Slide 3: Who We Are
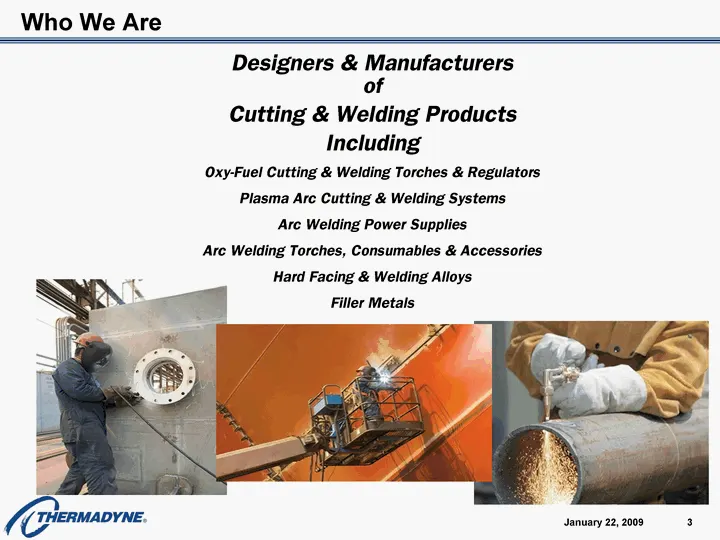
Who We Are Designers & Manufacturers of Cutting & Welding Products Including Oxy-Fuel Cutting & Welding Torches & Regulators Plasma Arc Cutting & Welding Systems Arc Welding Power Supplies Arc Welding Torches, Consumables & Accessories Hard Facing & Welding Alloys Filler Metals January 22, 2009 3
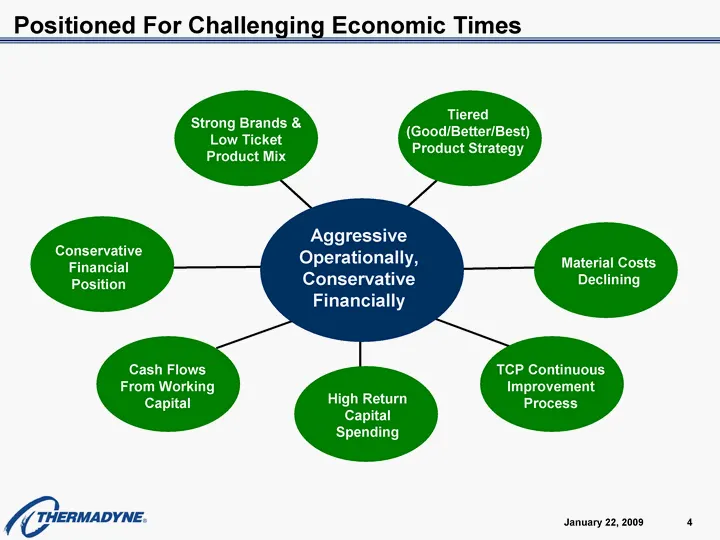
Slide 4: Aggressive Operationally, Conservative Financially
Aggressive Operationally, Conservative Financially TCP Continuous Improvement Process Strong Brands & Low Ticket Product Mix Tiered (Good/Better/Best) Product Strategy Material Costs Declining High Return Capital Spending Cash Flows From Working Capital Conservative Financial Position Positioned For
Slide 5: Steel Industry Shipment Trends - 2007 & 2008
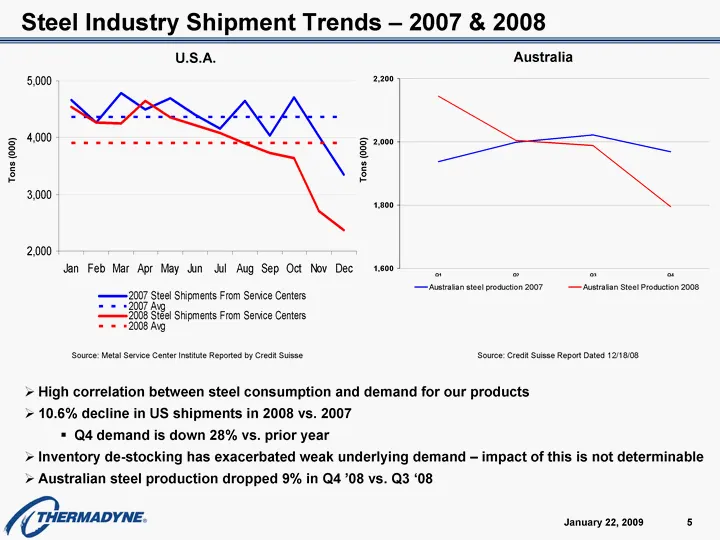
Q1 Q2 Q3 Q4 Australian steel production 2007 1937 1999 2022 1969 Australian Steel Production 2008 2145 2005 1989 1795 Steel Industry Shipment Trends - 2007 & 2008 5 High correlation between steel consumption and demand for our products 10.6% decline in US shipments in 2008 vs. 2007 Q4 demand is down
Slide 6: Thermadyne - 4Q 2008 Trends
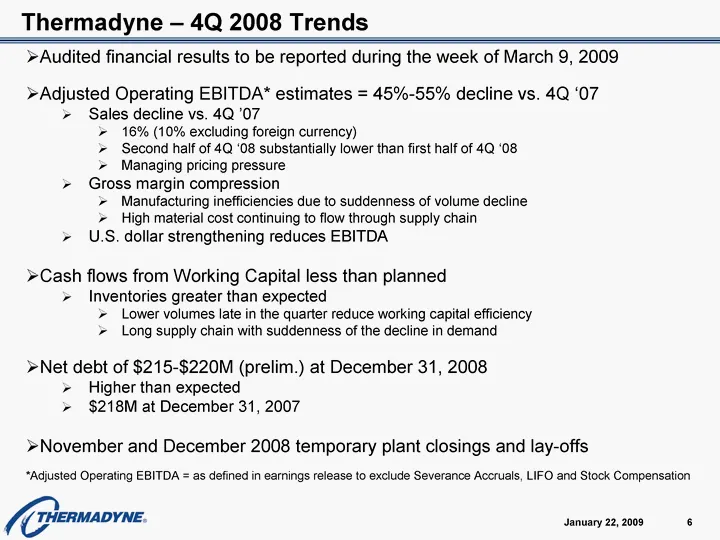
Thermadyne - 4Q 2008 Trends Audited financial results to be reported during the week of March 9, 2009 Adjusted Operating EBITDA* estimates = 45%-55% decline vs. 4Q '07 Sales decline vs. 4Q '07 16% (10% excluding foreign currency) Second half of 4Q '08 substantially lower than first half of 4Q '08 Ma
Slide 7: 2009 Outlook
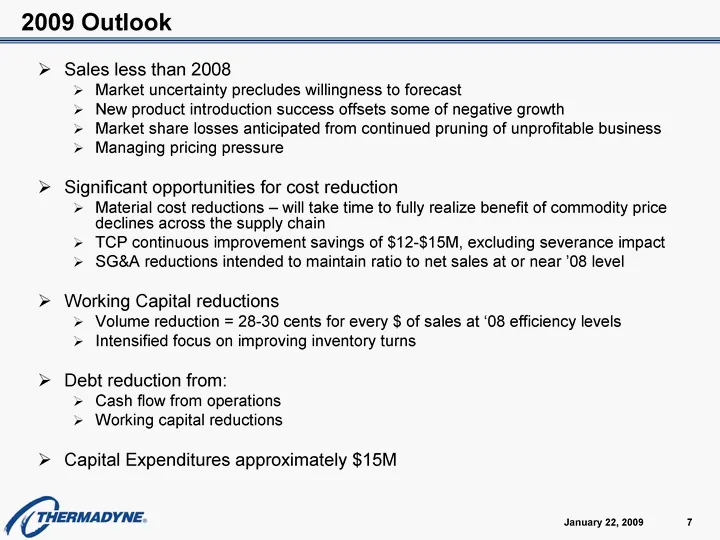
2009 Outlook Sales less than 2008 Market uncertainty precludes willingness to forecast New product introduction success offsets some of negative growth Market share losses anticipated from continued pruning of unprofitable business Managing pricing pressure Significant opportunities for cost reducti
Slide 8: 2009 Actions In Process
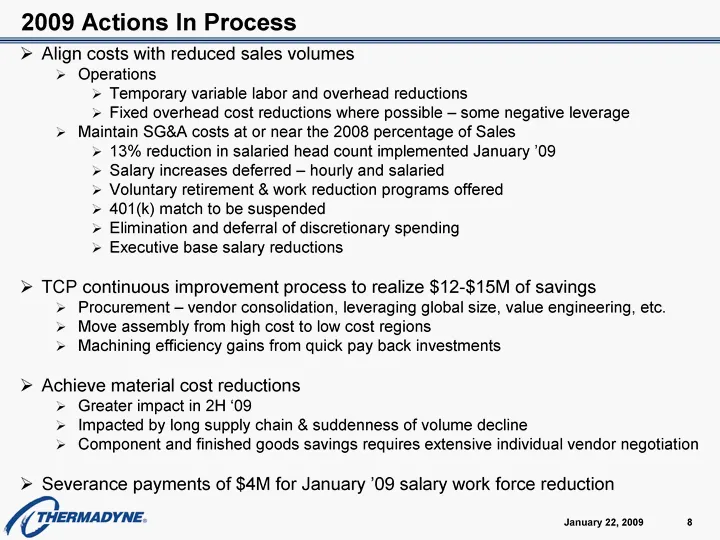
2009 Actions In Process Align costs with reduced sales volumes Operations Temporary variable labor and overhead reductions Fixed overhead cost reductions where possible - some negative leverage Maintain SG&A costs at or near the 2008 percentage of Sales 13% reduction in salaried head count implement
Slide 9: Limited Debt Maturities until 2012
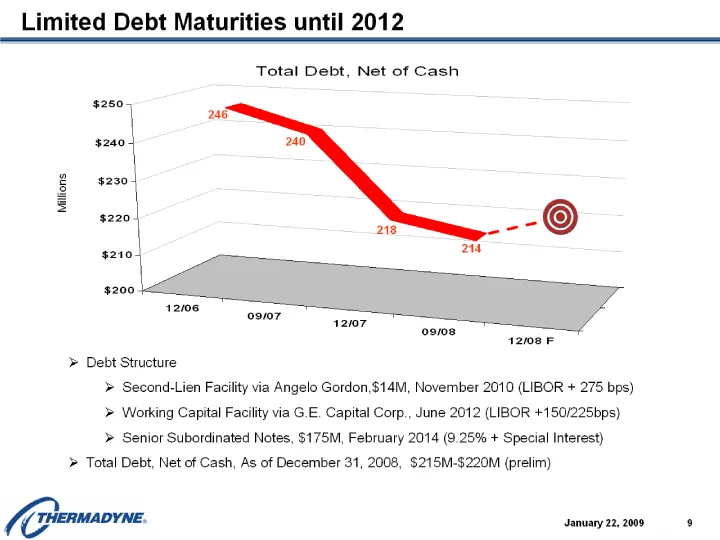
Limited Debt Maturities until 2012 Debt Structure Second-Lien Facility via Angelo Gordon,$14M, November 2010 (LIBOR + 275 bps) Working Capital Facility via G.E. Capital Corp., June 2012 (LIBOR +150/225bps) Senior Subordinated Notes, $175M, February 2014 (9.25% + Special Interest) Total Debt, Net of
Slide 10: Positioned For Challenging Economic Times - Summary
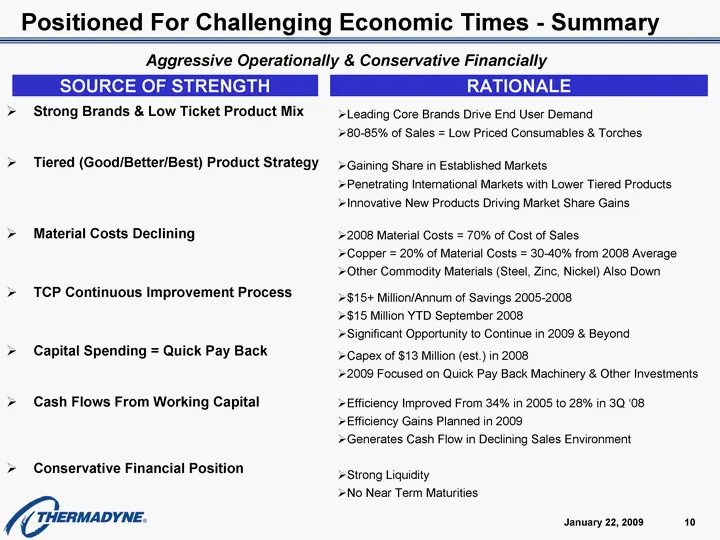
Positioned For Challenging Economic Times - Summary Leading Core Brands Drive End User Demand 80-85% of Sales = Low Priced Consumables & Torches 2008 Material Costs = 70% of Cost of Sales Copper = 20% of Material Costs = 30-40% from 2008 Average Other Commodity Materials (Steel, Zinc, Nickel) Also D
Slide 11: Aggressive Operationally, Conservative Financially - Appendix
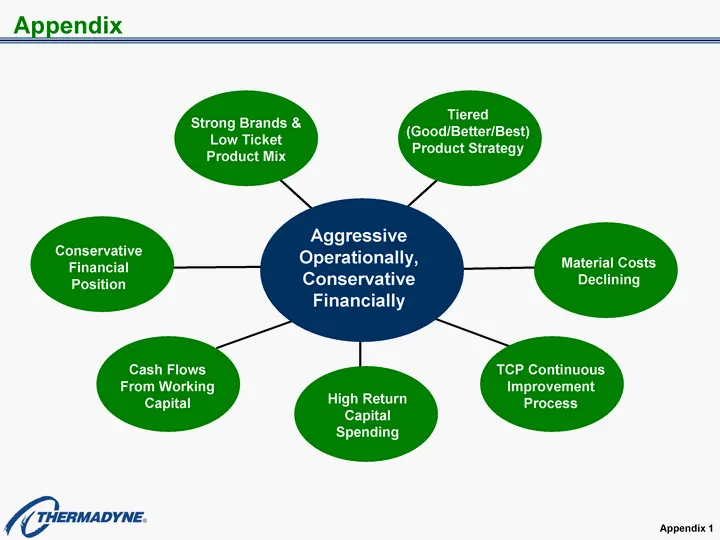
Aggressive Operationally, Conservative Financially TCP Continuous Improvement Process Strong Brands & Low Ticket Product Mix Tiered (Good/Better/Best) Product Strategy Material Costs Declining Cash Flows From Working Capital Conservative Financial Position Appendix Appendix 1 High Return Capital Spe
Slide 12: Strong Brands and Product Portfolio
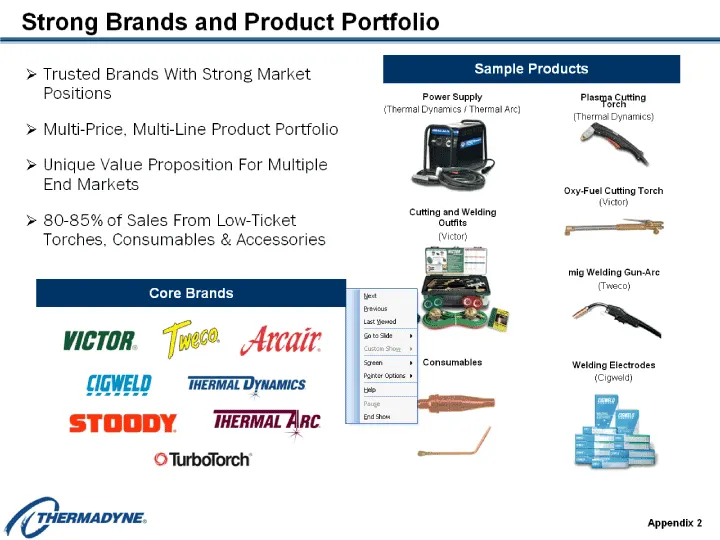
Strong Brands and Product Portfolio Trusted Brands With Strong Market Positions Multi-Price, Multi-Line Product Portfolio Unique Value Proposition For Multiple End Markets 80-85% of Sales From Low-Ticket Torches, Consumables & Accessories Sample Products Oxy-Fuel Cutting Torch (Victor) mig Welding G
Slide 13: Leadership Position in Niche Segments
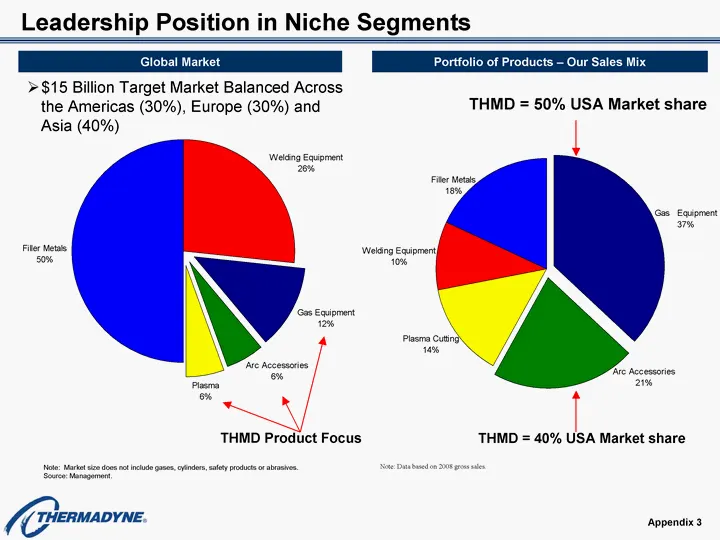
Leadership Position in Niche Segments Gas Equipment Arc Accessories Plasma Cutting Welding Equipment Filler Metals 0.37 0.21 0.14 0.1 0.18 Note: Market size does not include gases, cylinders, safety products or abrasives. Source: Management. Global Market $15 Billion Target Market Balanced Across th
Slide 14: Highly Profitable, Recurring Sales Base
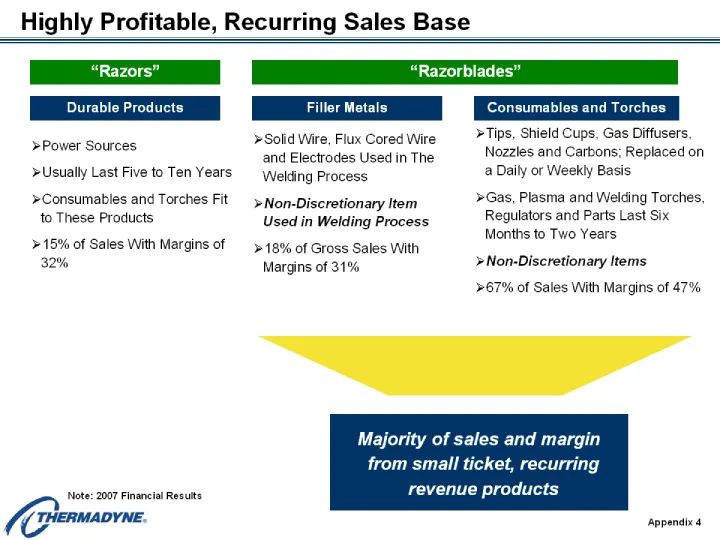
Tips, Shield Cups, Gas Diffusers, Nozzles and Carbons; Replaced on a Daily or Weekly Basis Gas, Plasma and Welding Torches, Regulators and Parts Last Six Months to Two Years Non-Discretionary Items 67% of Sales With Margins of 47% Filler Metals Solid Wire, Flux Cored Wire and Electrodes Used in The
Slide 15: We Sell to a Broad Network of Distributors
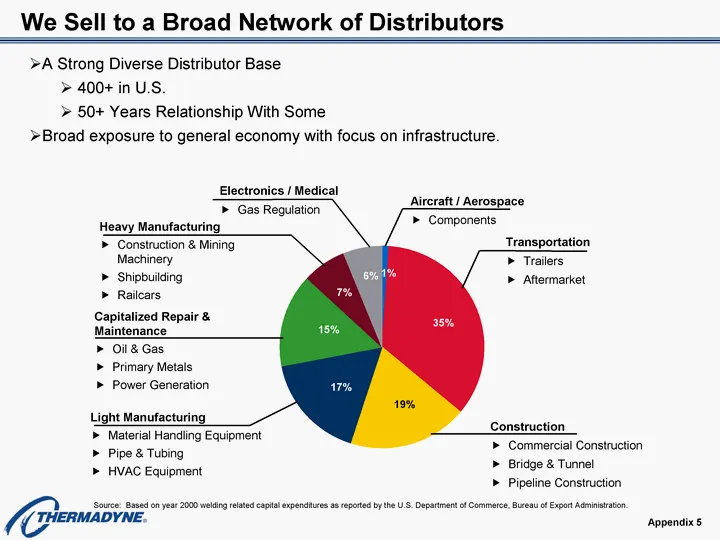
We Sell to a Broad Network of Distributors Capitalized Repair & Maintenance Oil & Gas Primary Metals Power Generation Heavy Manufacturing Construction & Mining Machinery Shipbuilding Railcars Construction Commercial Construction Bridge & Tunnel Pipeline Construction Aircraft / Aerospace Components E
Slide 16: Growing International Presence
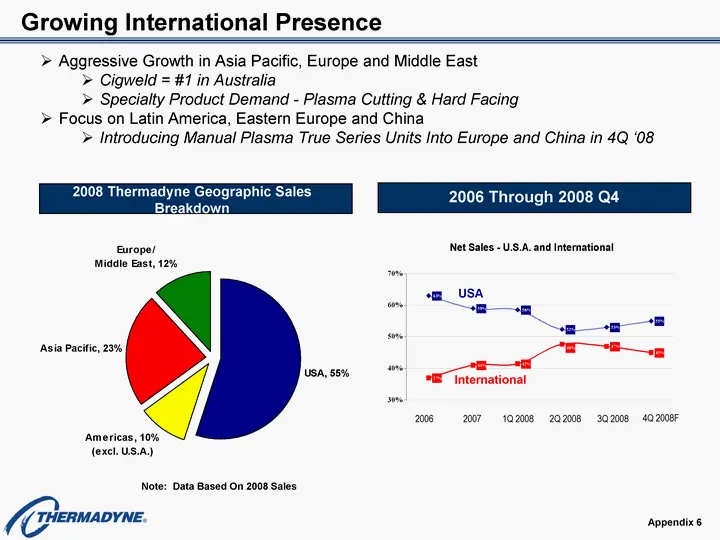
Growing International Presence 2007(1) 2008 Thermadyne Geographic Sales Breakdown Aggressive Growth in Asia Pacific, Europe and Middle East Cigweld = #1 in Australia Specialty Product Demand - Plasma Cutting & Hard Facing Focus on Latin America, Eastern Europe and China Introducing Manual Plasma Tru
Slide 17: Three-Tiered Product Strategy
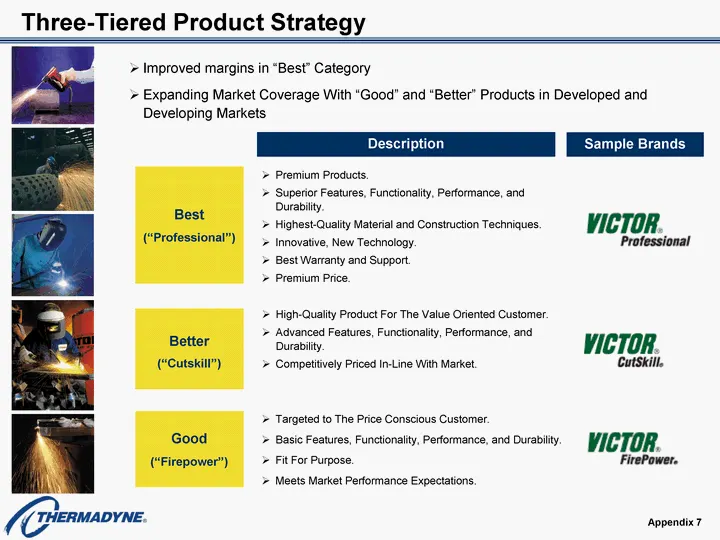
Three-Tiered Product Strategy Improved margins in "Best" Category Expanding Market Coverage With "Good" and "Better" Products in Developed and Developing Markets Description Targeted to The Price Conscious Customer. Basic Features, Functionality, Performance, and Durability. Fit For Purpose. Meets M
Slide 18: Innovation Drives Market Share
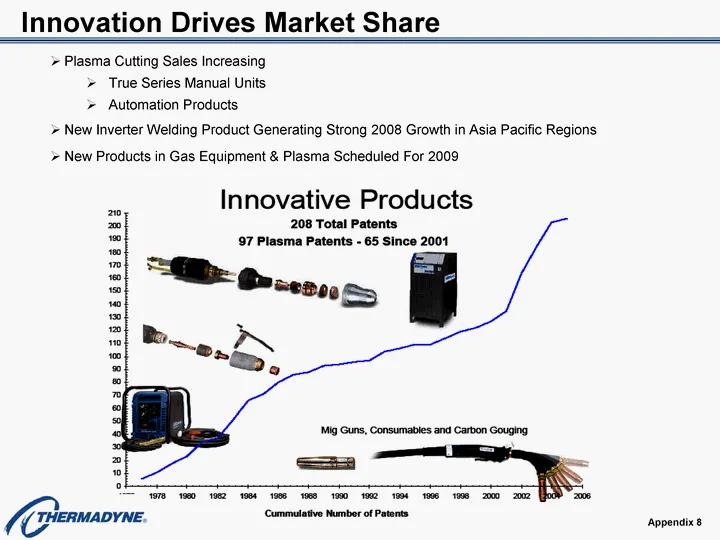
Innovation Drives Market Share Plasma Cutting Sales Increasing True Series Manual Units Automation Products New Inverter Welding Product Generating Strong 2008 Growth in Asia Pacific Regions New Products in Gas Equipment & Plasma Scheduled For 2009 Appendix 8
Slide 19: Continuous Improvement Process - TCP
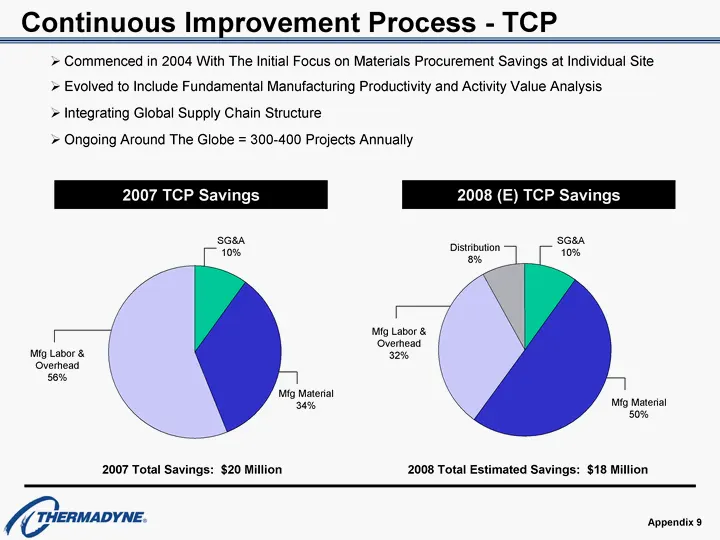
Continuous Improvement Process - TCP SG&A 10% Mfg Labor & Overhead 56% Mfg Material 34% Distribution 8% Mfg Labor & Overhead 32% SG&A 10% Mfg Material 50% SG&A, 10% Mfg - Material, 34% Mfg - Labor & Overhead, 56% Distribution East 10 50 32 8 2007 Total Savings: $20 Million 2008 Total Estimated Savin
Slide 20: Turnaround Success - Momentum Building
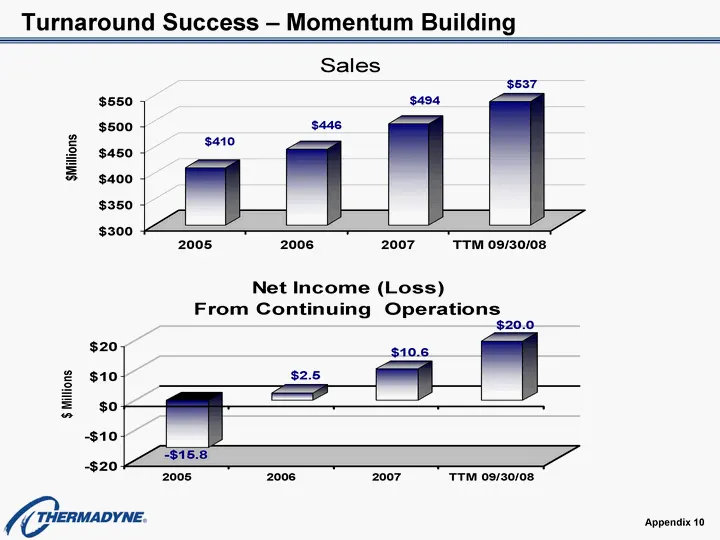
Turnaround Success - Momentum Building 2005 2006 2007 TTM 09/30/08 -15.8 2.5 10.6 20 2005 2006 2007 TTM 09/30/08 409.6 445.7 494 537 Appendix 10
Slide 21: Focused On Our Profitability - The Drivers
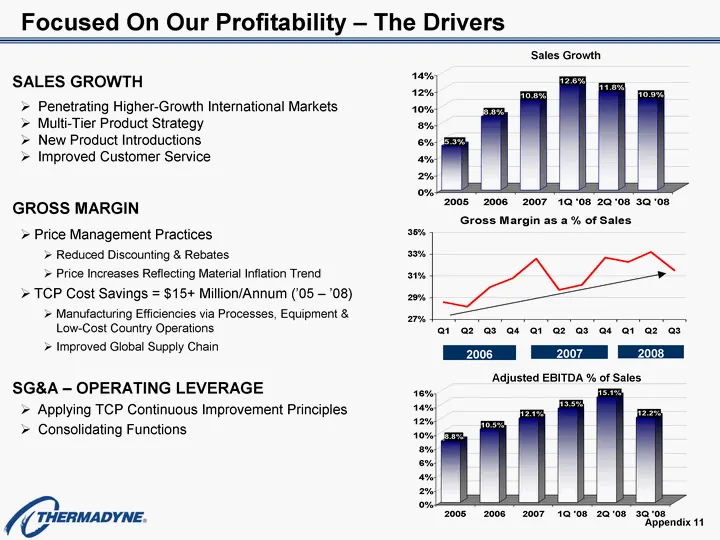
Penetrating Higher-Growth International Markets Multi-Tier Product Strategy New Product Introductions Improved Customer Service Focused On Our Profitability - The Drivers Applying TCP Continuous Improvement Principles Consolidating Functions Price Management Practices Reduced Discounting & Rebates P
Slide 22: 2008 Nine Month Financial Results
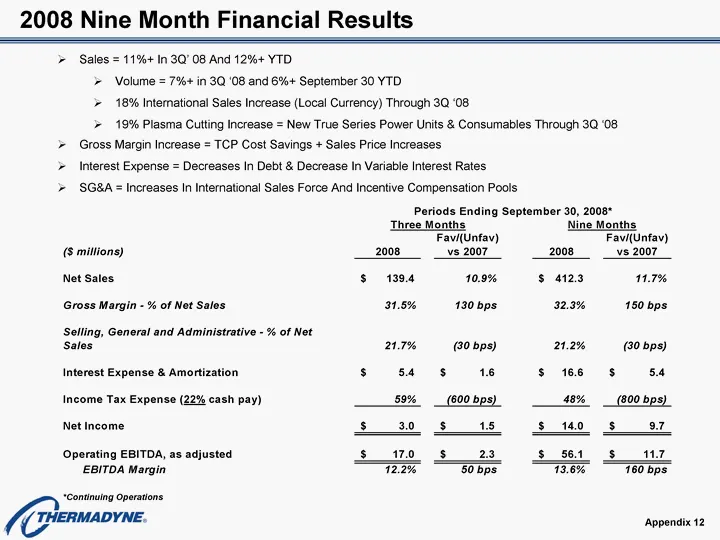
Sales = 11%+ In 3Q' 08 And 12%+ YTD Volume = 7%+ in 3Q '08 and 6%+ September 30 YTD 18% International Sales Increase (Local Currency) Through 3Q '08 19% Plasma Cutting Increase = New True Series Power Units & Consumables Through 3Q '08 Gross Margin Increase = TCP Cost Savings + Sales Price Increases
Slide 23: Cash Flows and Liquidity
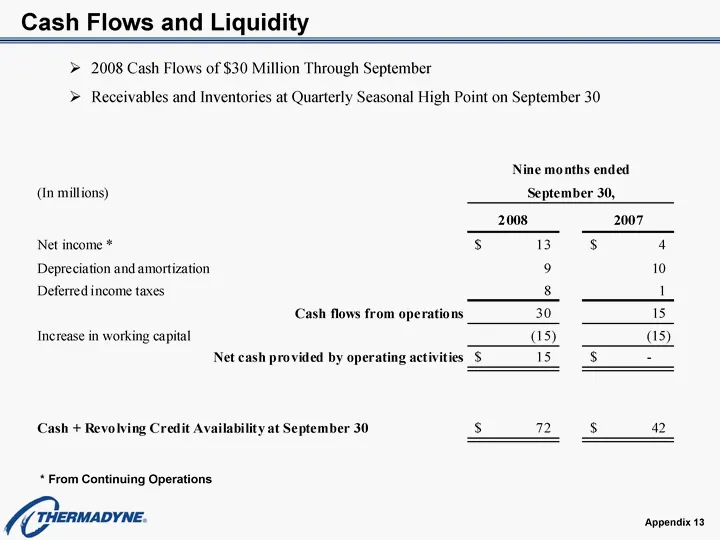
Cash Flows and Liquidity 2008 Cash Flows of $30 Million Through September Receivables and Inventories at Quarterly Seasonal High Point on September 30 * From Continuing Operations Appendix 13
Source: SEC EDGAR · 8-K filed Jan 22, 2009