Capita plc · LSE:CPI
Capita — FY2010 Earnings Presentation
49 slides from Capita's earnings presentation, February 2011
Slide 1: Results for the year ended 31 December 2010
Results for the year ended 31 December 2010
Slide 2: Highlights
Highlights Paul Pindar Chief Executive
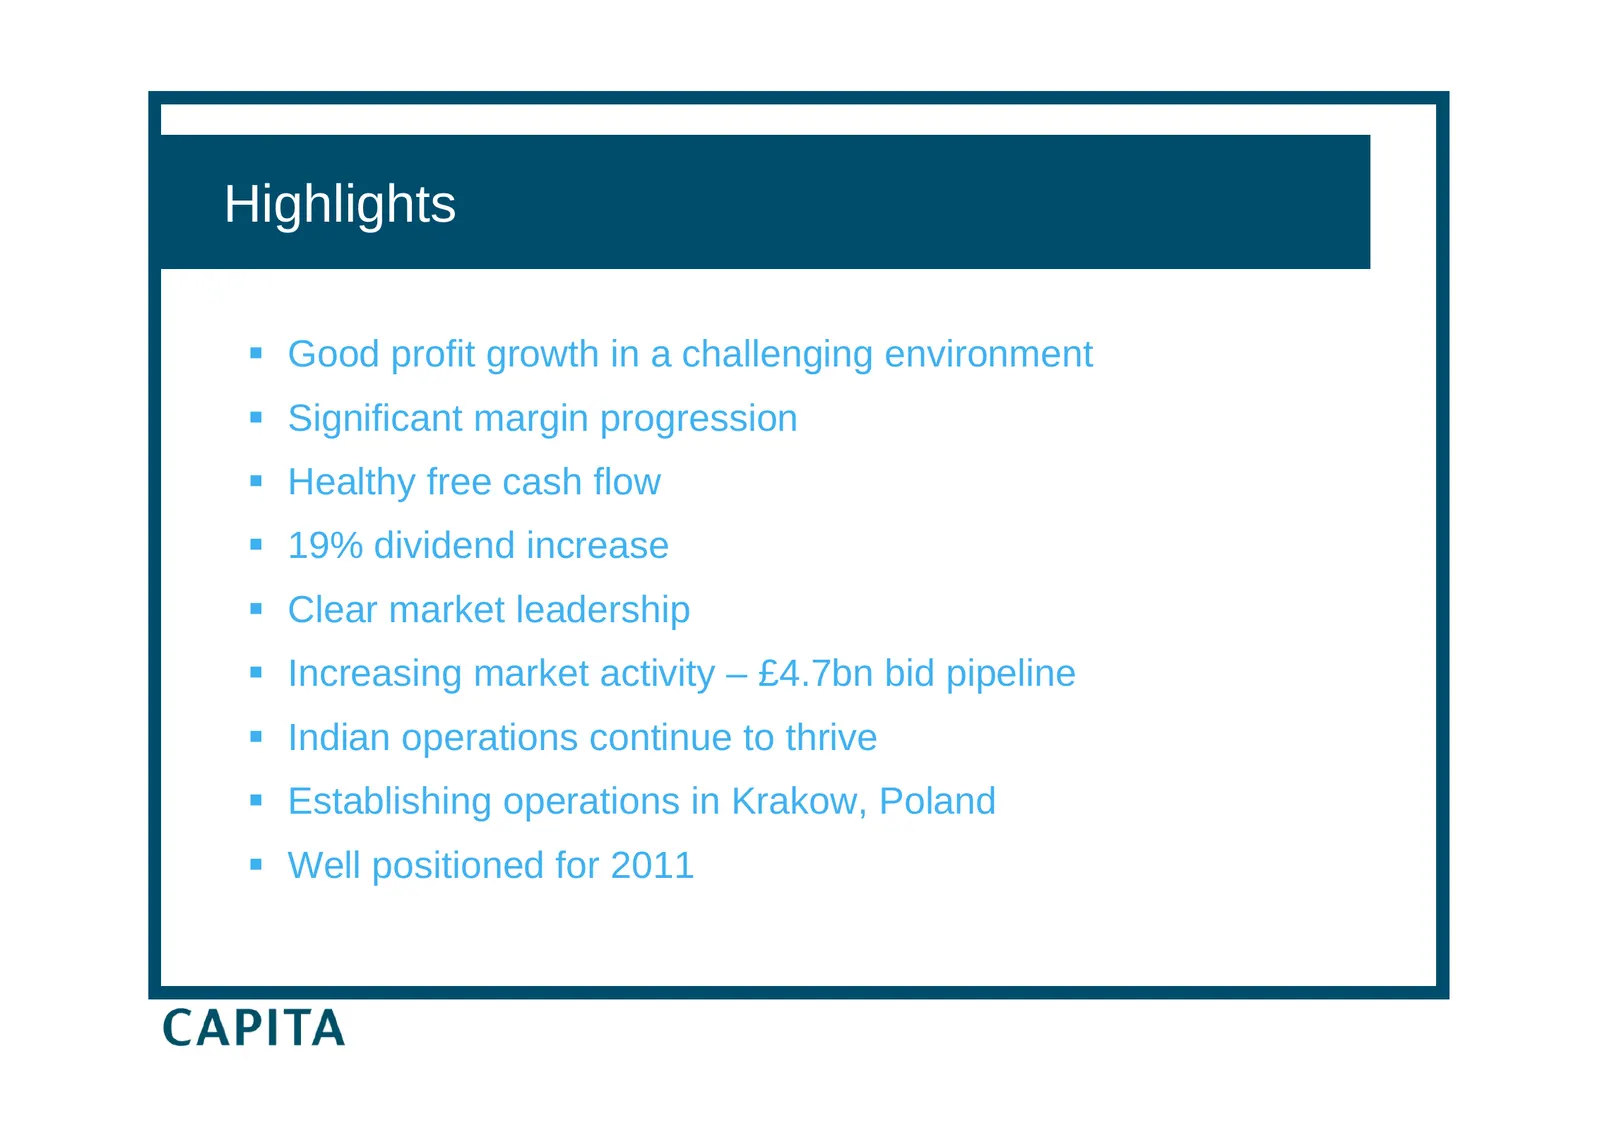
Slide 3: Highlights
Highlights Good profit growth in a challenging environment Significant margin progression Healthy free cash flow 19% dividend increase Clear market leadership Increasing market activity – £4.7bn bid pipeline Indian operations continue to thrive Establishing operations in Krakow, Pola
Slide 4: Financial results
Financial results Gordon Hurst Group Finance Director
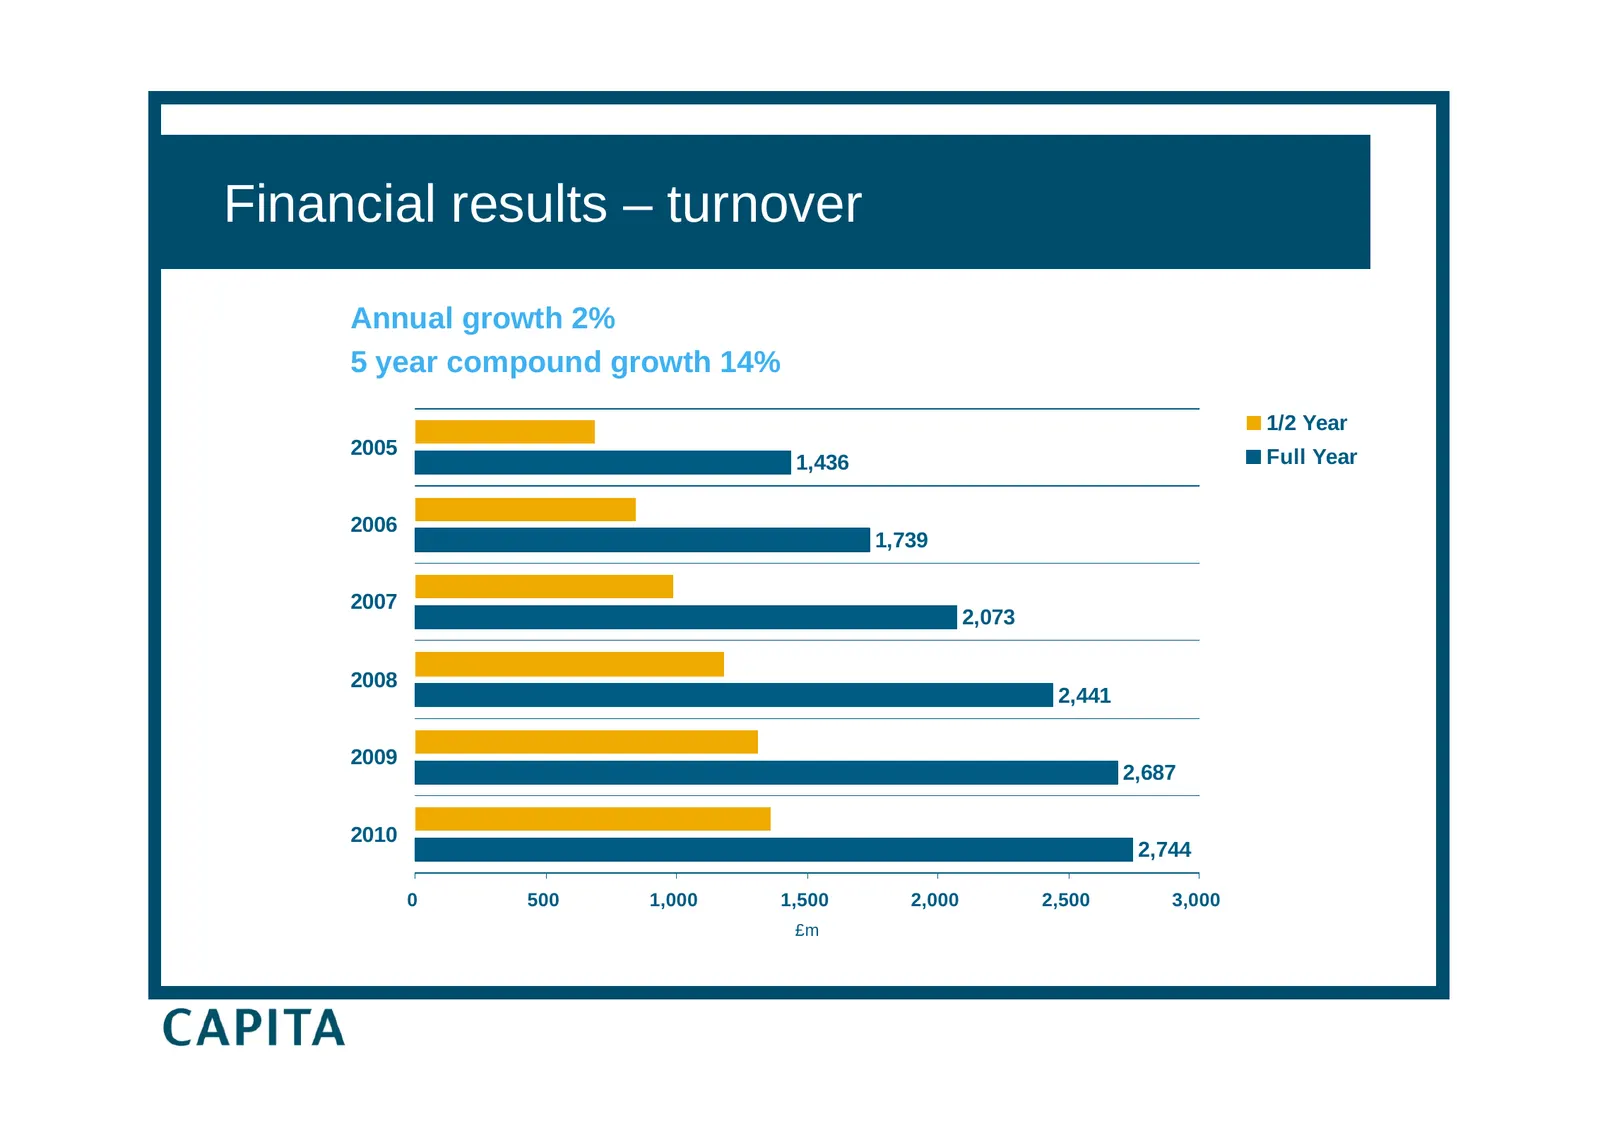
Slide 5: Financial results – turnover
Financial results – turnover Annual growth 2% 5 year compound growth 14% 1/2 Year 2005 Full Year 1,436 2006 1,739 2007 2,073 2008 2,441 2009 2,687 2010 2,744 0 500 1,000 1,500 2,000 2,500 3,000 £m
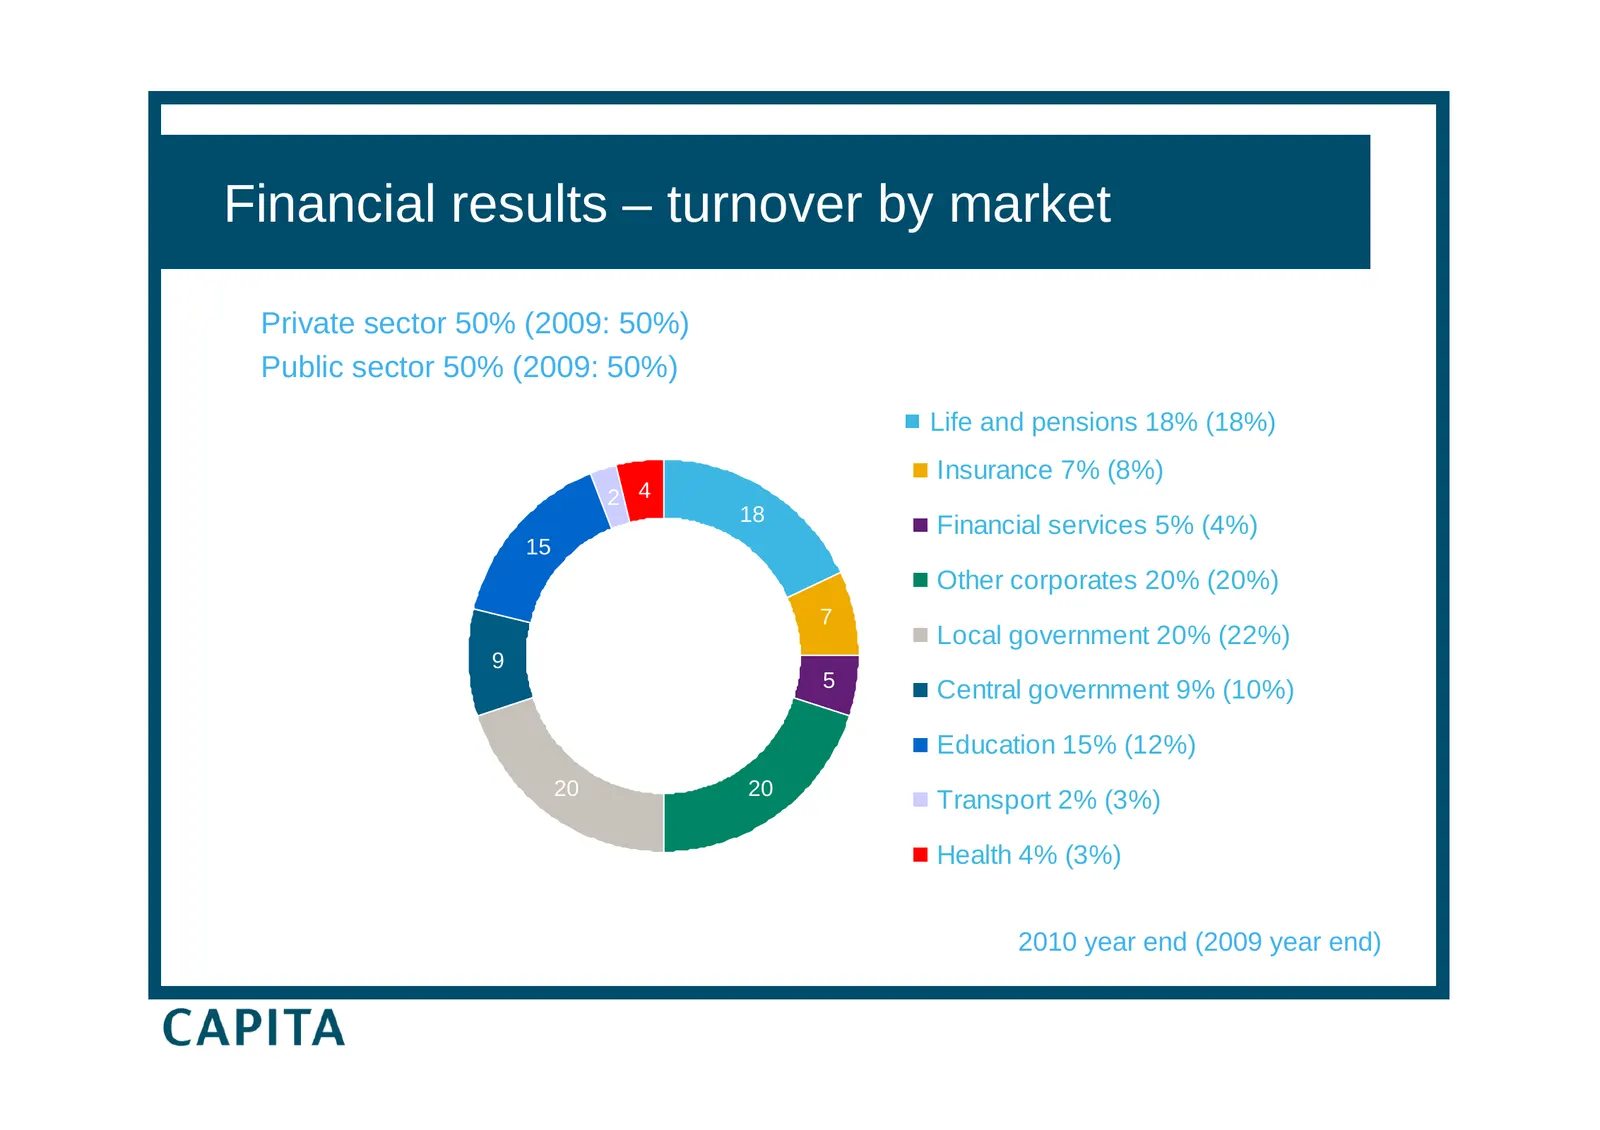
Slide 6: Financial results – turnover by market
Financial results – turnover by market Private sector 50% (2009: 50%) Public sector 50% (2009: 50%) Life and pensions 18% (18%) Insurance 7% (8%) 2 4 18 Financial services 5% (4%) 15 Other corporates 20% (20%) 7 Local government 20% (22%) 9 5 Central government 9% (10%) Education 15% (12%) 20 20 Tra
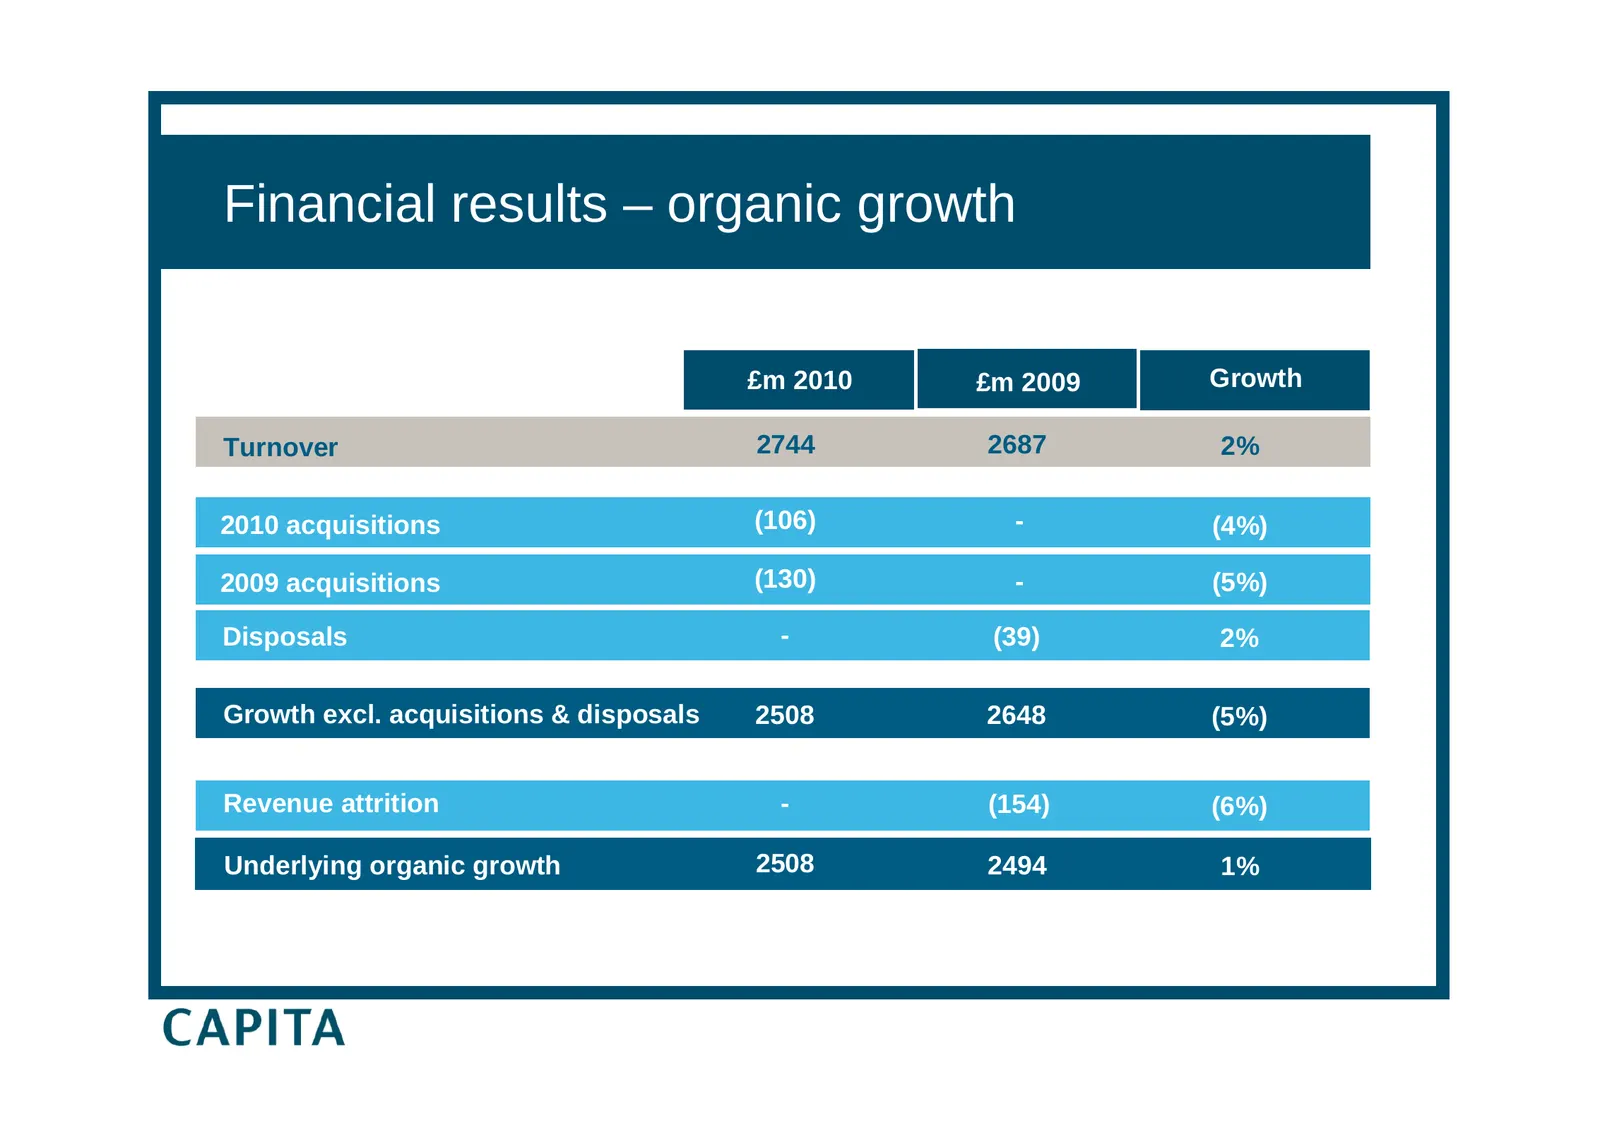
Slide 7: Financial results – organic growth
Financial results – organic growth £m £m 2010 2008 £m2007 £m 2009 Growth £m 2008 Growth Turnover 2744 2687 2% 2010 acquisitions (106) - (4%) 2009 acquisitions (130) 2001 (36) - 2003 2004 (5%) Disposals - (39) 2% Growth excl. acquisitions & disposals 2508 2648 (5%) Revenue attrition - (154) (6%) Unde
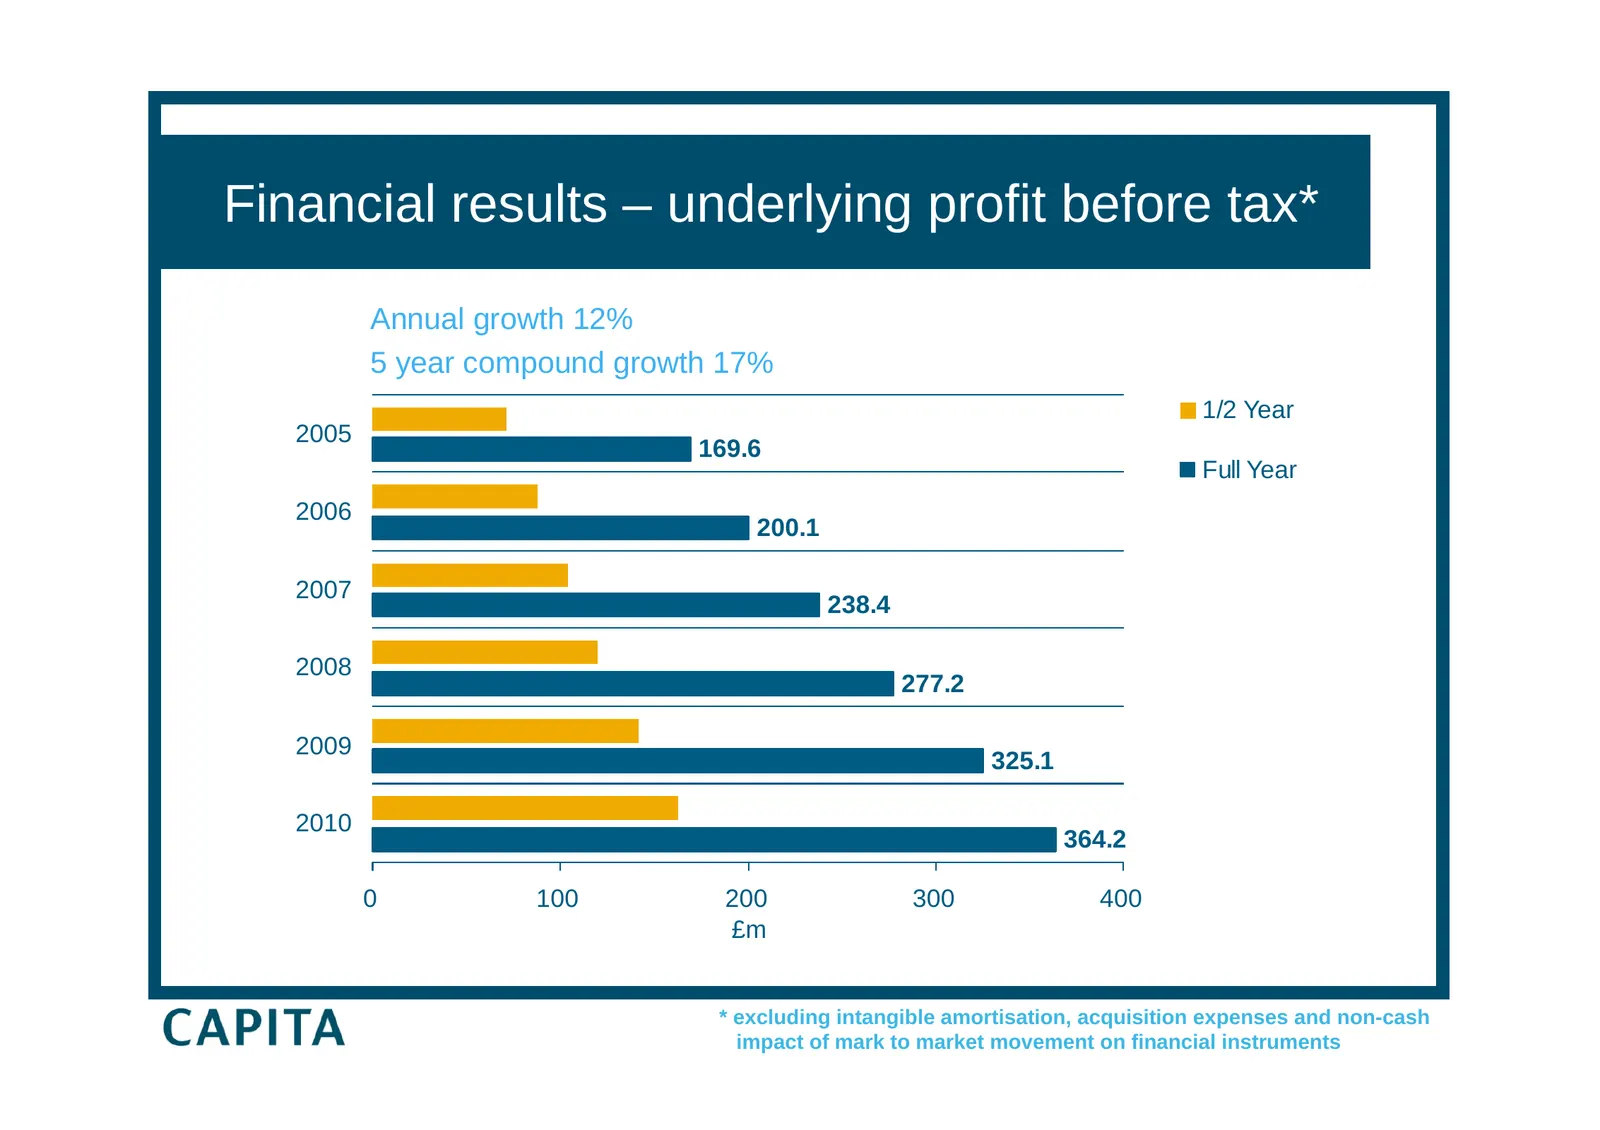
Slide 8: Financial results – underlying profit before tax
Financial results – underlying profit before tax* Annual growth 12% 5 year compound growth 17% 1/2 Year 2005 169.6 Full Year 2006 200.1 2007 238.4 2008 277.2 2009 325.1 2010 364.2 0 100 200 300 400 £m * excluding intangible amortisation, acquisition expenses and non-cash impact of mark to market mov
Slide 9: Financial results – underlying operating profit
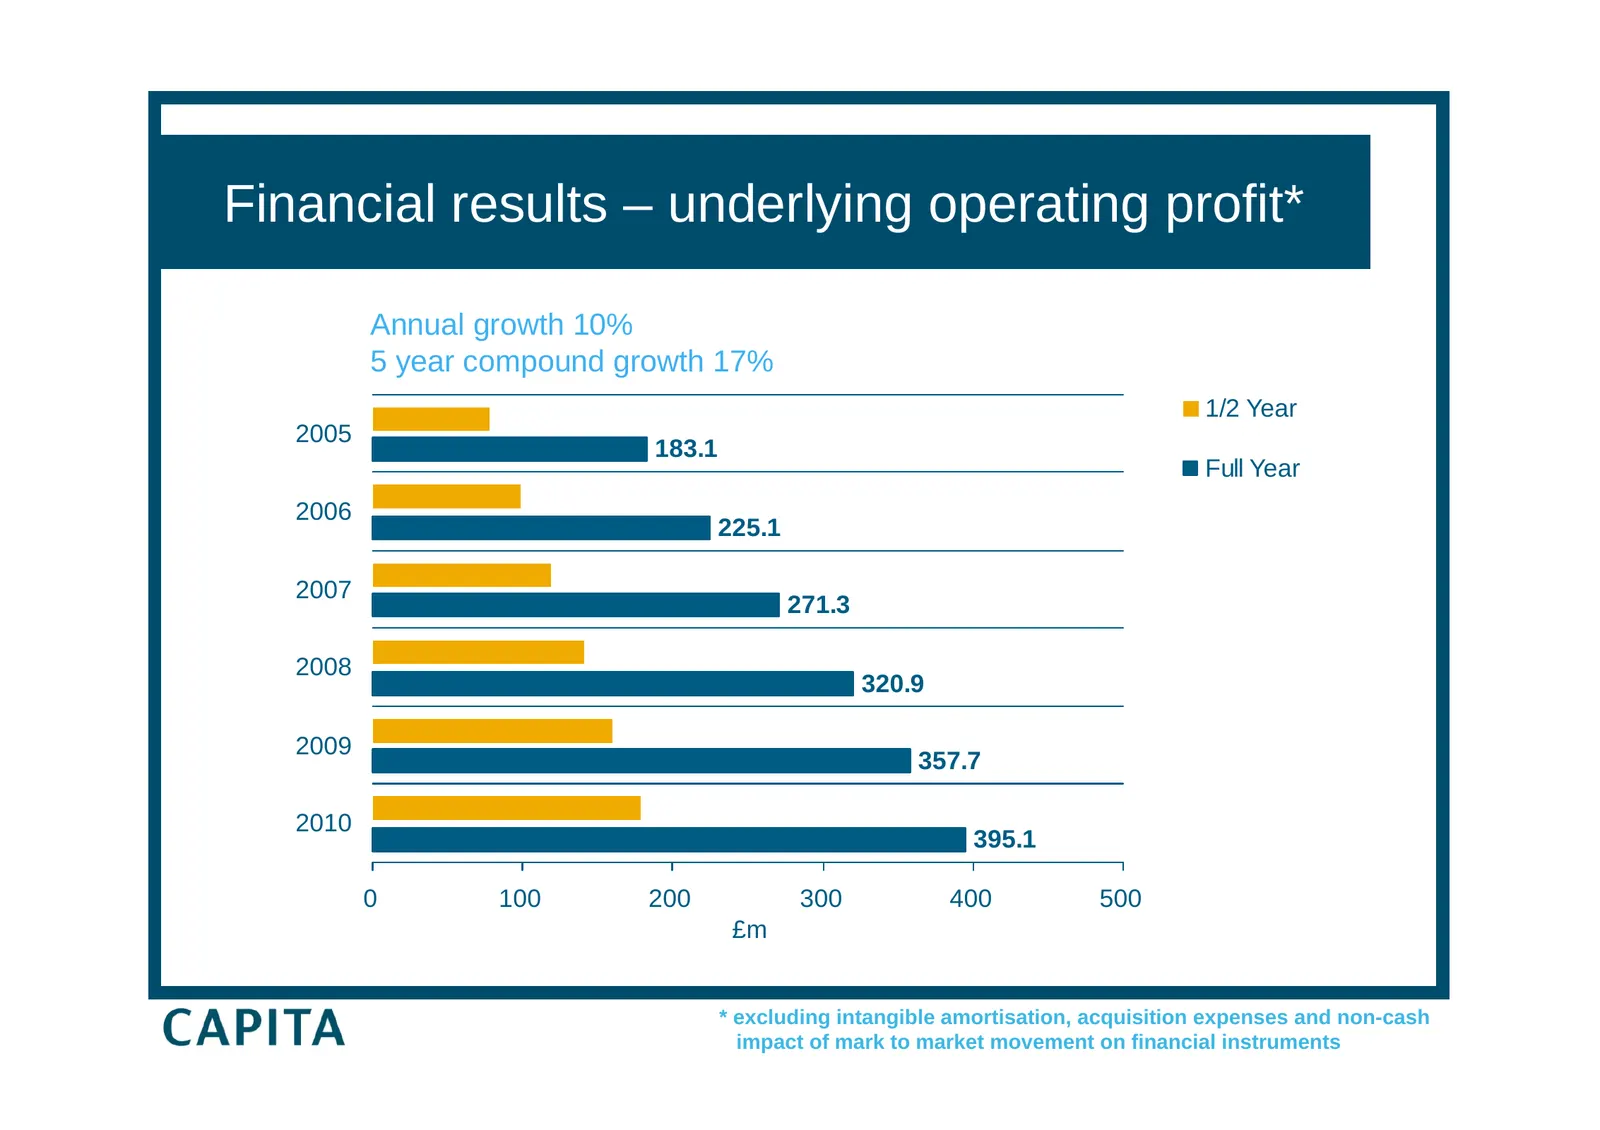
Financial results – underlying operating profit* Annual growth 10% 5 year compound growth 17% 1/2 Year 2005 183.1 Full Year 2006 225.1 2007 271.3 2008 320.9 2009 357.7 2010 395.1 0 100 200 300 400 500 £m * excluding intangible amortisation, acquisition expenses and non-cash impact of mark to market
Slide 10: Operating margin
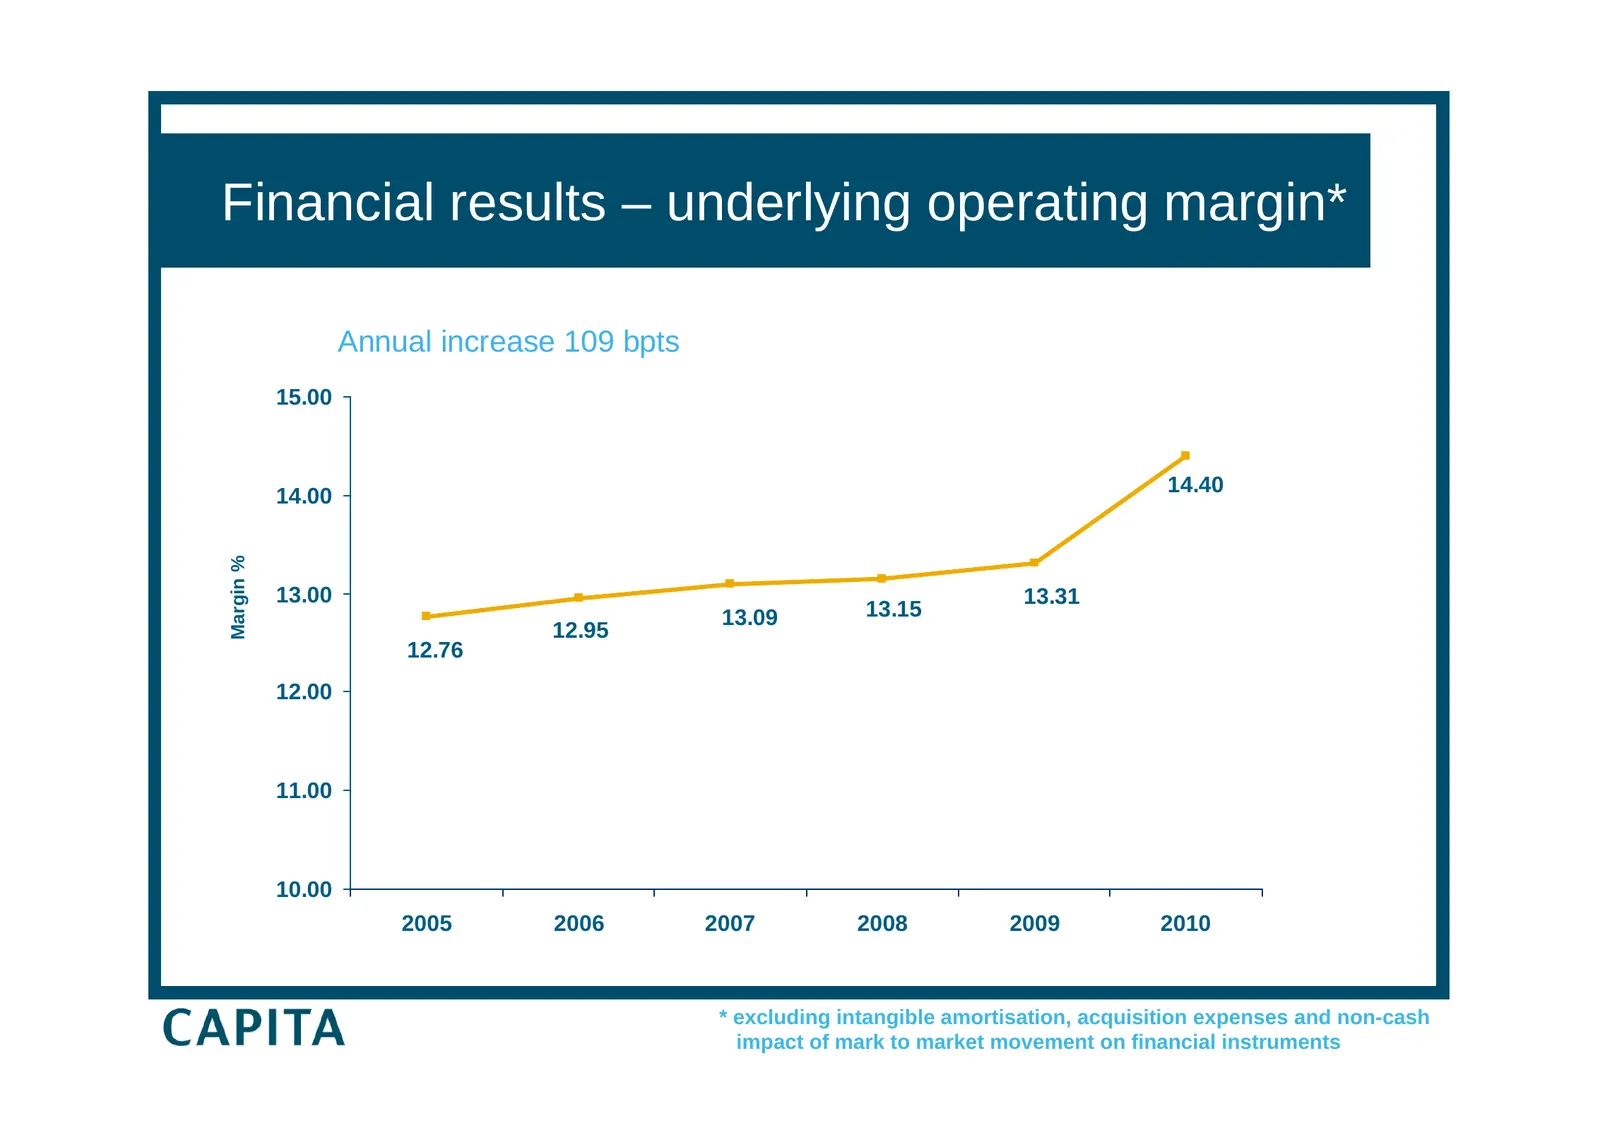
Operating margin Financial results – underlying operating margin* Annual increase 109 bpts 15.00 14.00 14.40 Margin % 13.00 13.31 13.09 13.15 12.95 12.76 12.00 11.00 10.00 2005 2006 2007 2008 2009 2010 * excluding intangible amortisation, acquisition expenses and non-cash impact of mark to market mo
Slide 11: Financial results – principal margin drivers
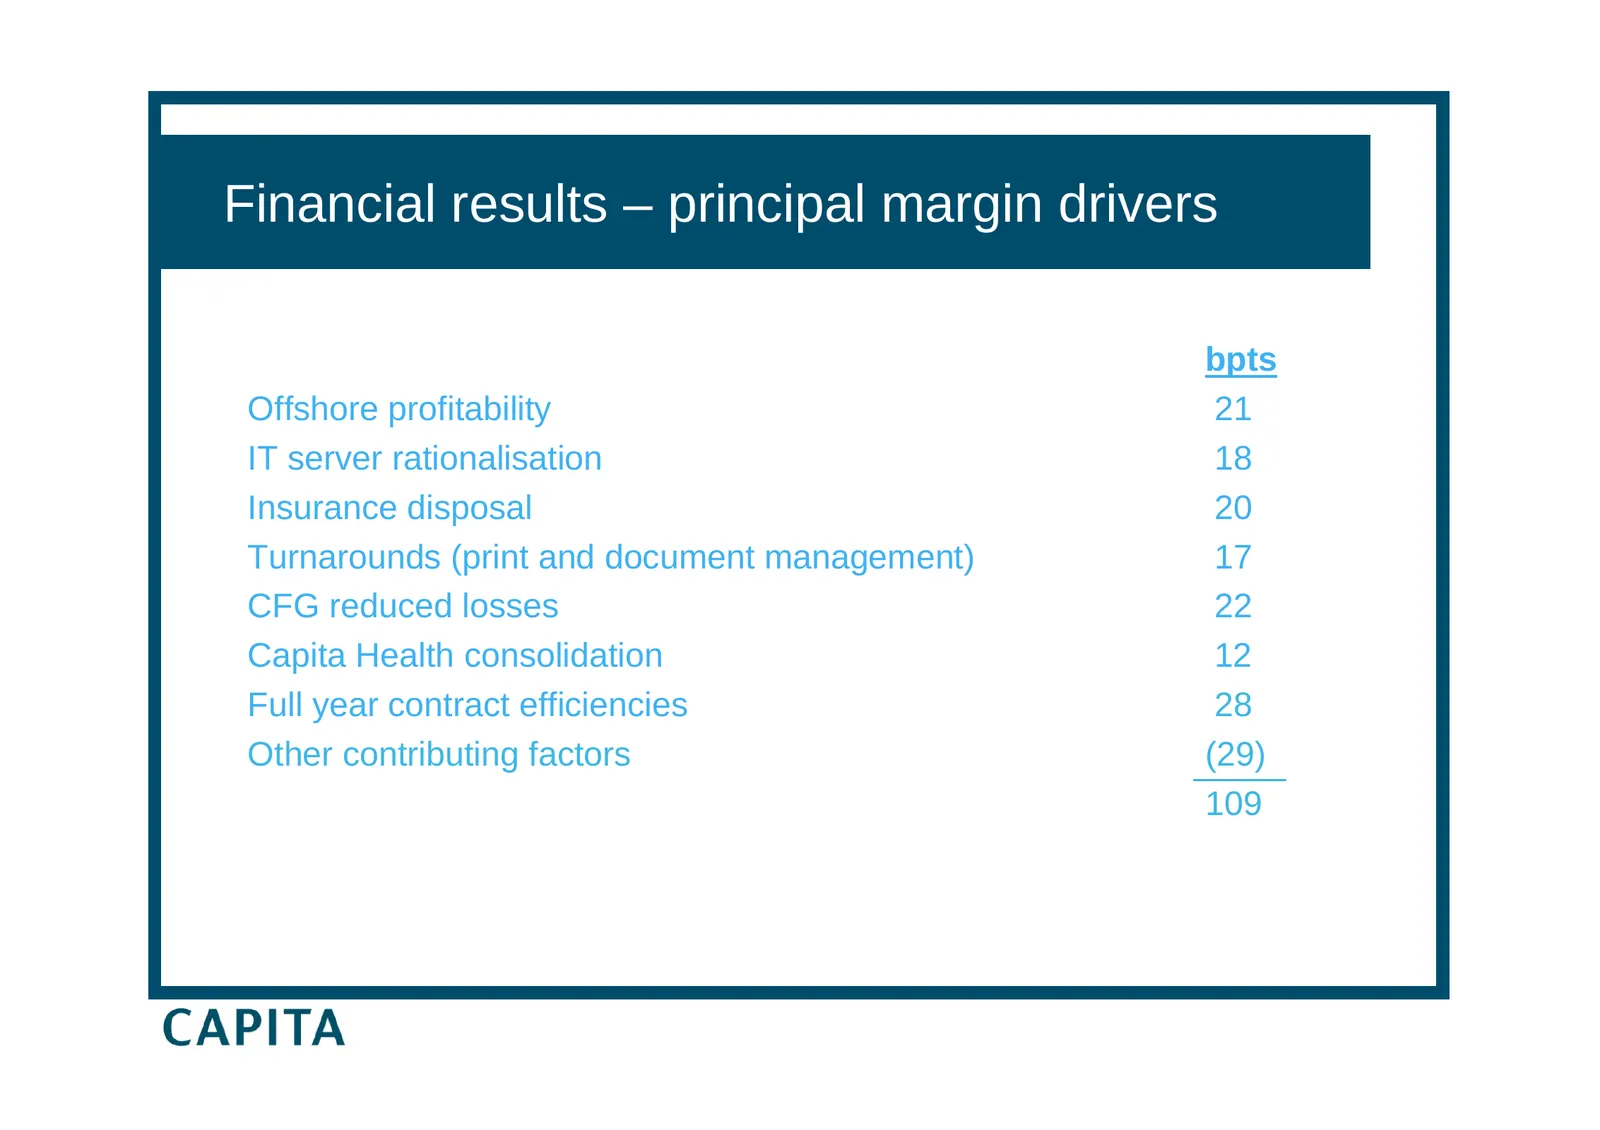
Financial results – principal margin drivers bpts Offshore profitability 21 IT server rationalisation 18 Insurance disposal 20 Turnarounds (print and document management) 17 CFG reduced losses 22 Capita Health consolidation 12 Full year contract efficiencies 28 Other contributing factors (29) 109
Slide 12: Financial results – underlying earnings per share
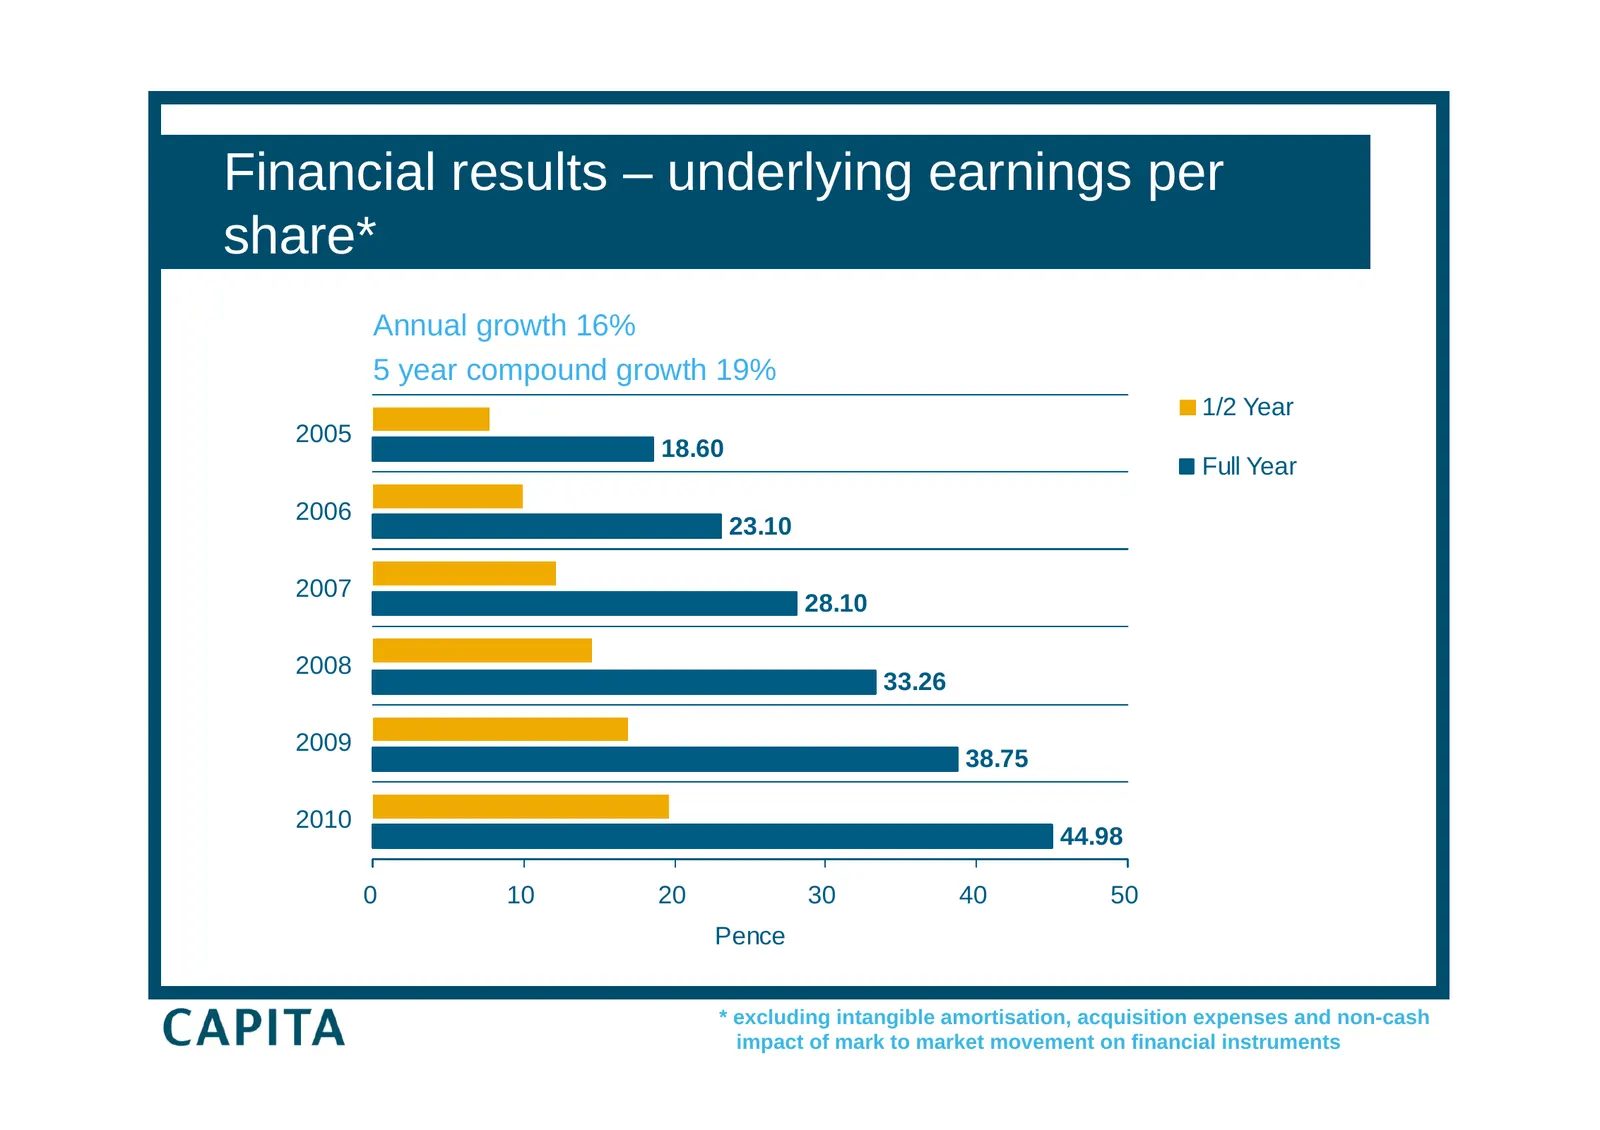
Financial results – underlying earnings per share* Annual growth 16% 5 year compound growth 19% 1/2 Year 2005 18.60 Full Year 2006 23.10 2007 28.10 2008 33.26 2009 38.75 2010 44.98 0 10 20 30 40 50 Pence * excluding intangible amortisation, acquisition expenses and non-cash impact of mark to market
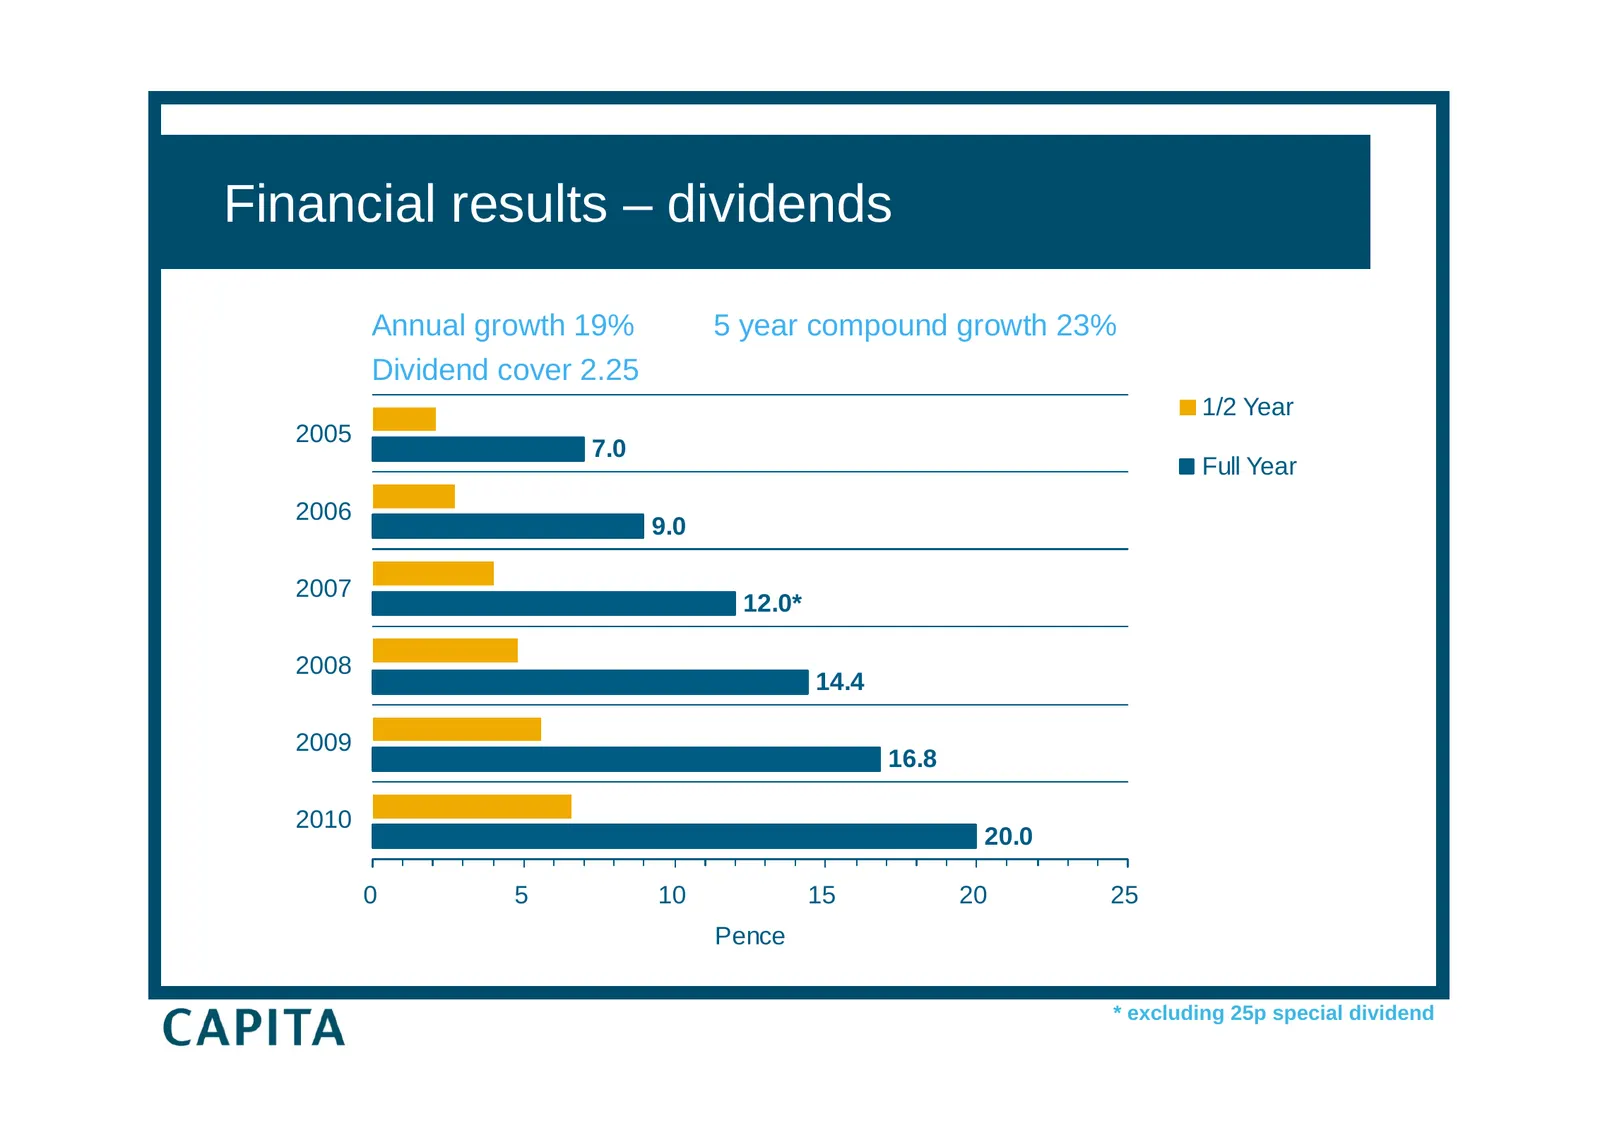
Slide 13: Financial results – dividends
Financial results – dividends Annual growth 19% 5 year compound growth 23% Dividend cover 2.25 1/2 Year 2005 7.0 Full Year 2006 9.0 2007 12.0* 2008 14.4 2009 16.8 2010 20.0 0 5 10 15 20 25 Pence * excluding 25p special dividend
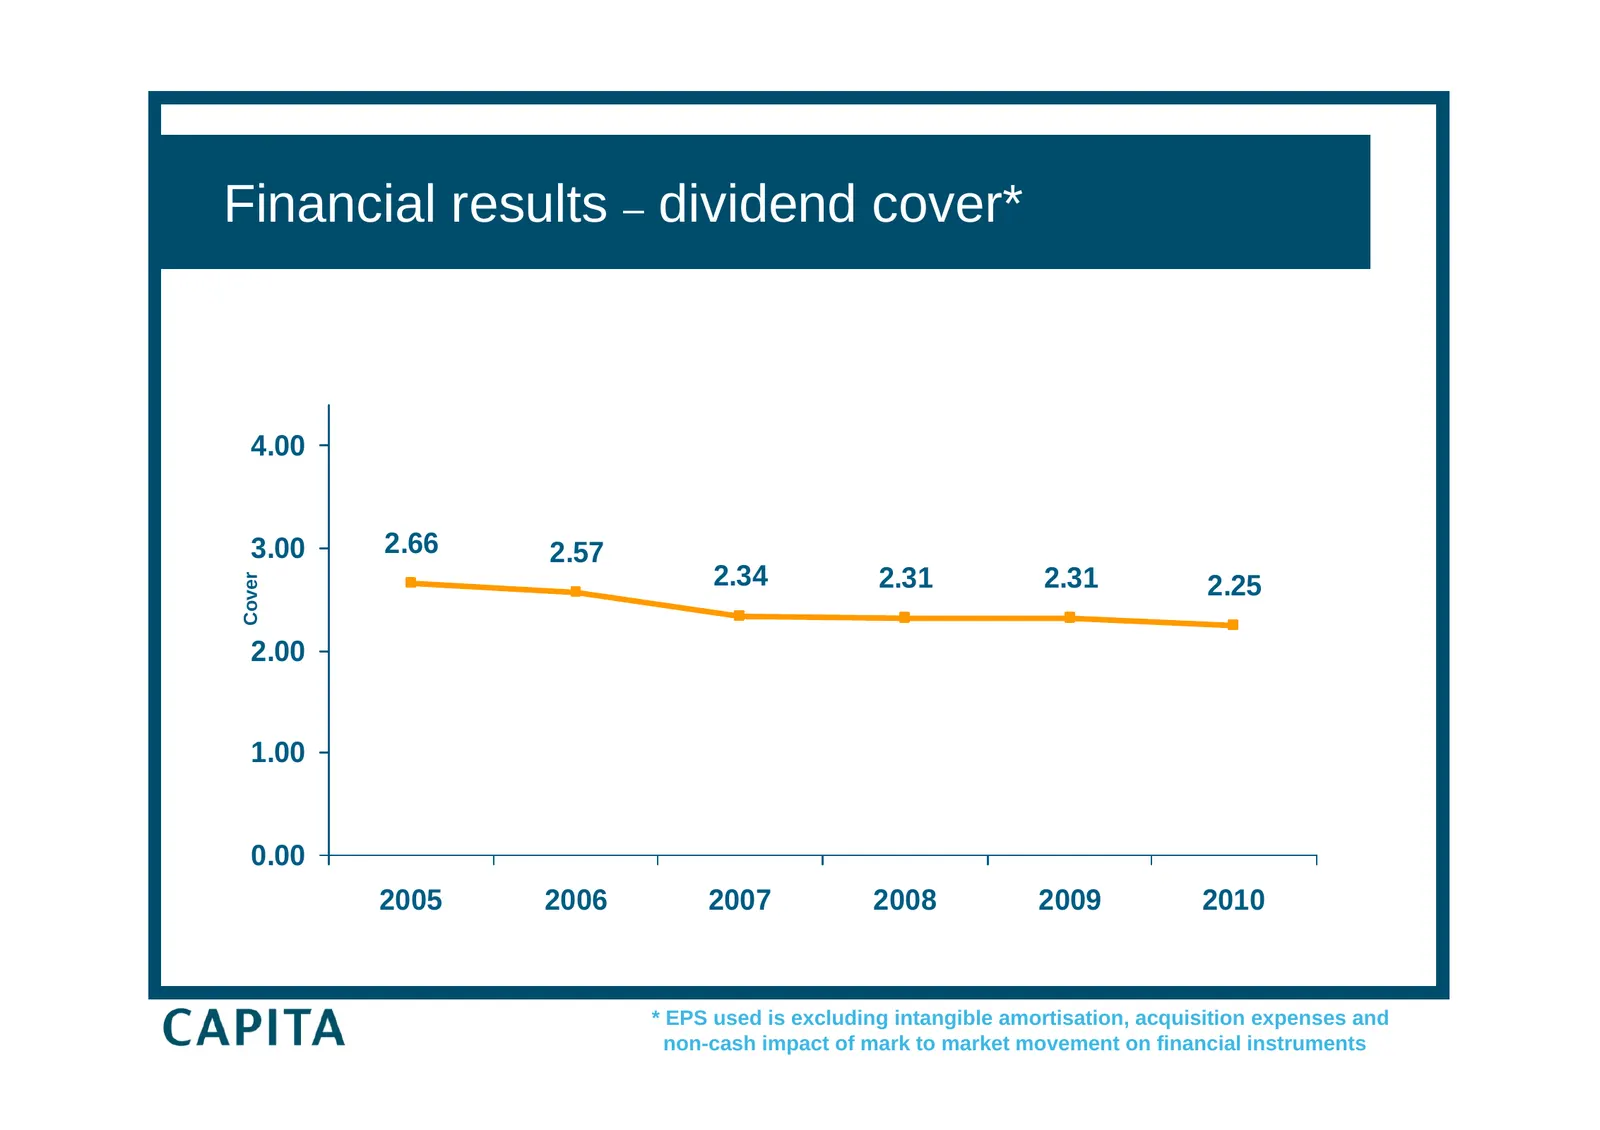
Slide 14: Financial results – dividend cover
Financial results – dividend cover* 4.00 3.00 2.66 2.57 2.34 2.31 2.31 Cover 2.25 2.00 1.00 0.00 2005 2006 2007 2008 2009 2010 * EPS used is excluding intangible amortisation, acquisition expenses and non-cash impact of mark to market movement on financial instruments
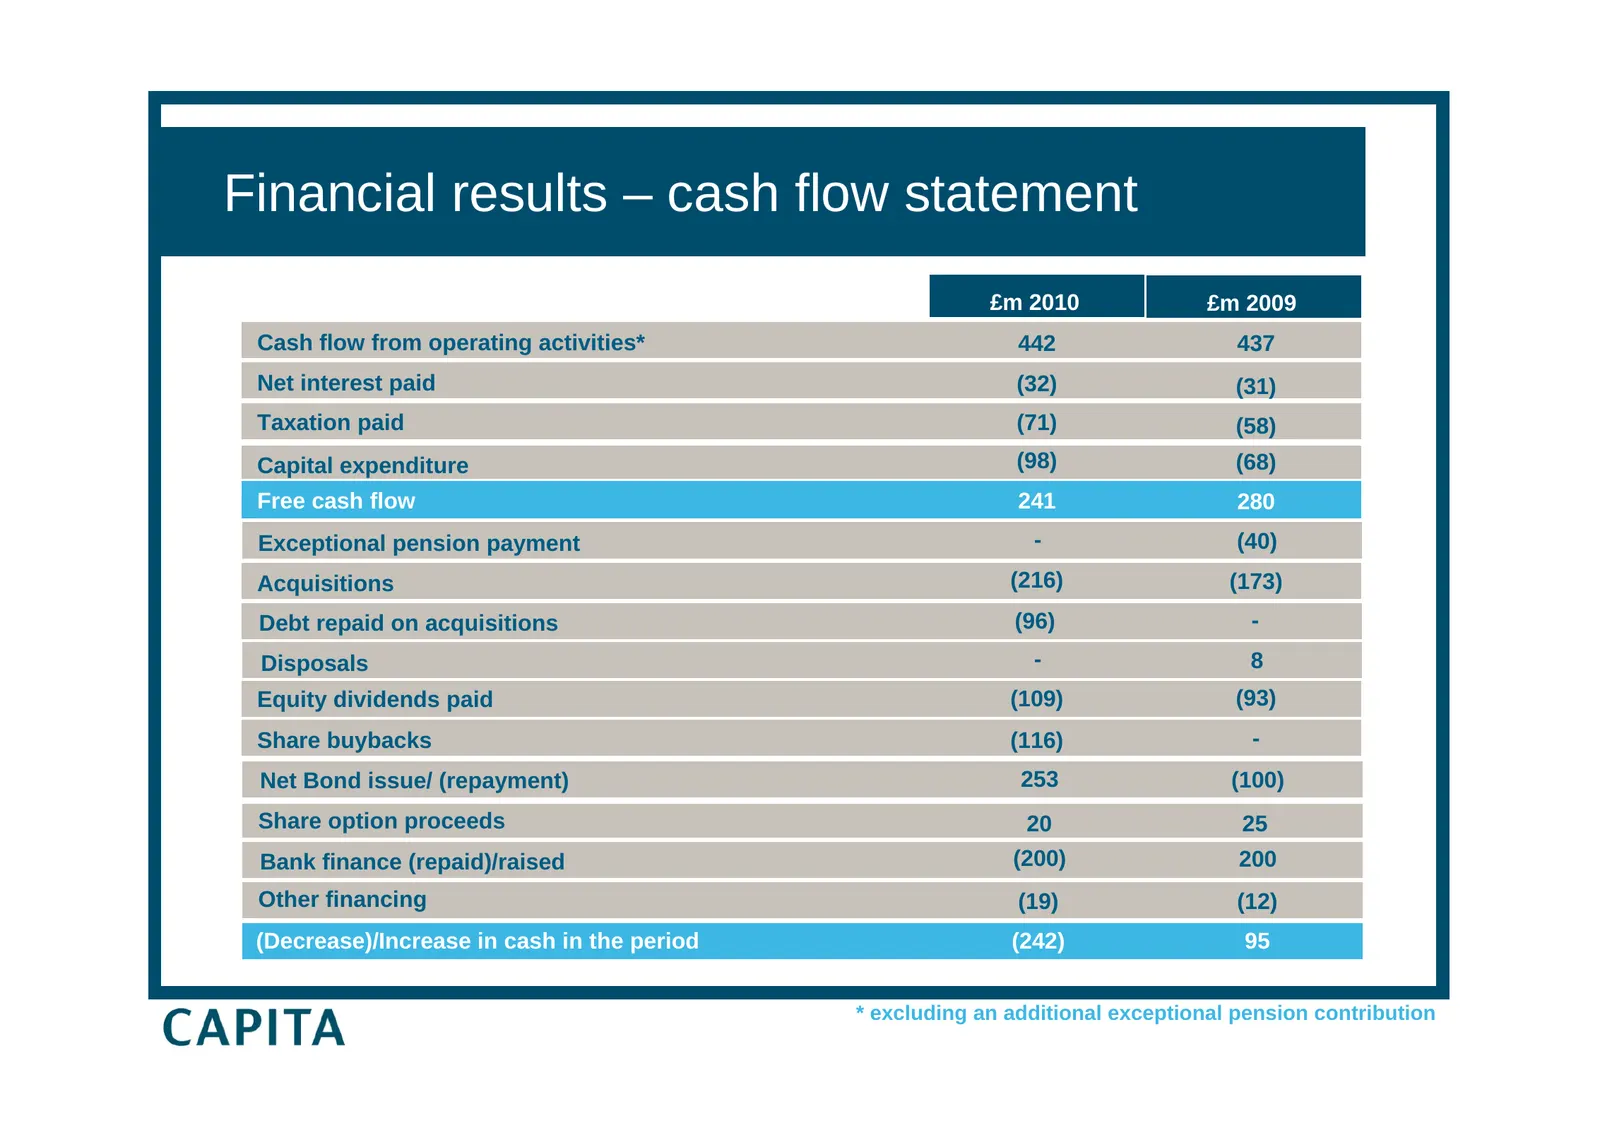
Slide 15: Financial results – cash flow statement
Financial results – cash flow statement £m 2010 £m 2009 £m 2006 Cash flow from operating activities* 442 437 Net interest paid (32) (31) Taxation paid (71) (58) Capital expenditure (98) (68) Free cash flow 241 280 Exceptional pension payment - (40) Acquisitions (216) (173) Debt repaid on acquisition
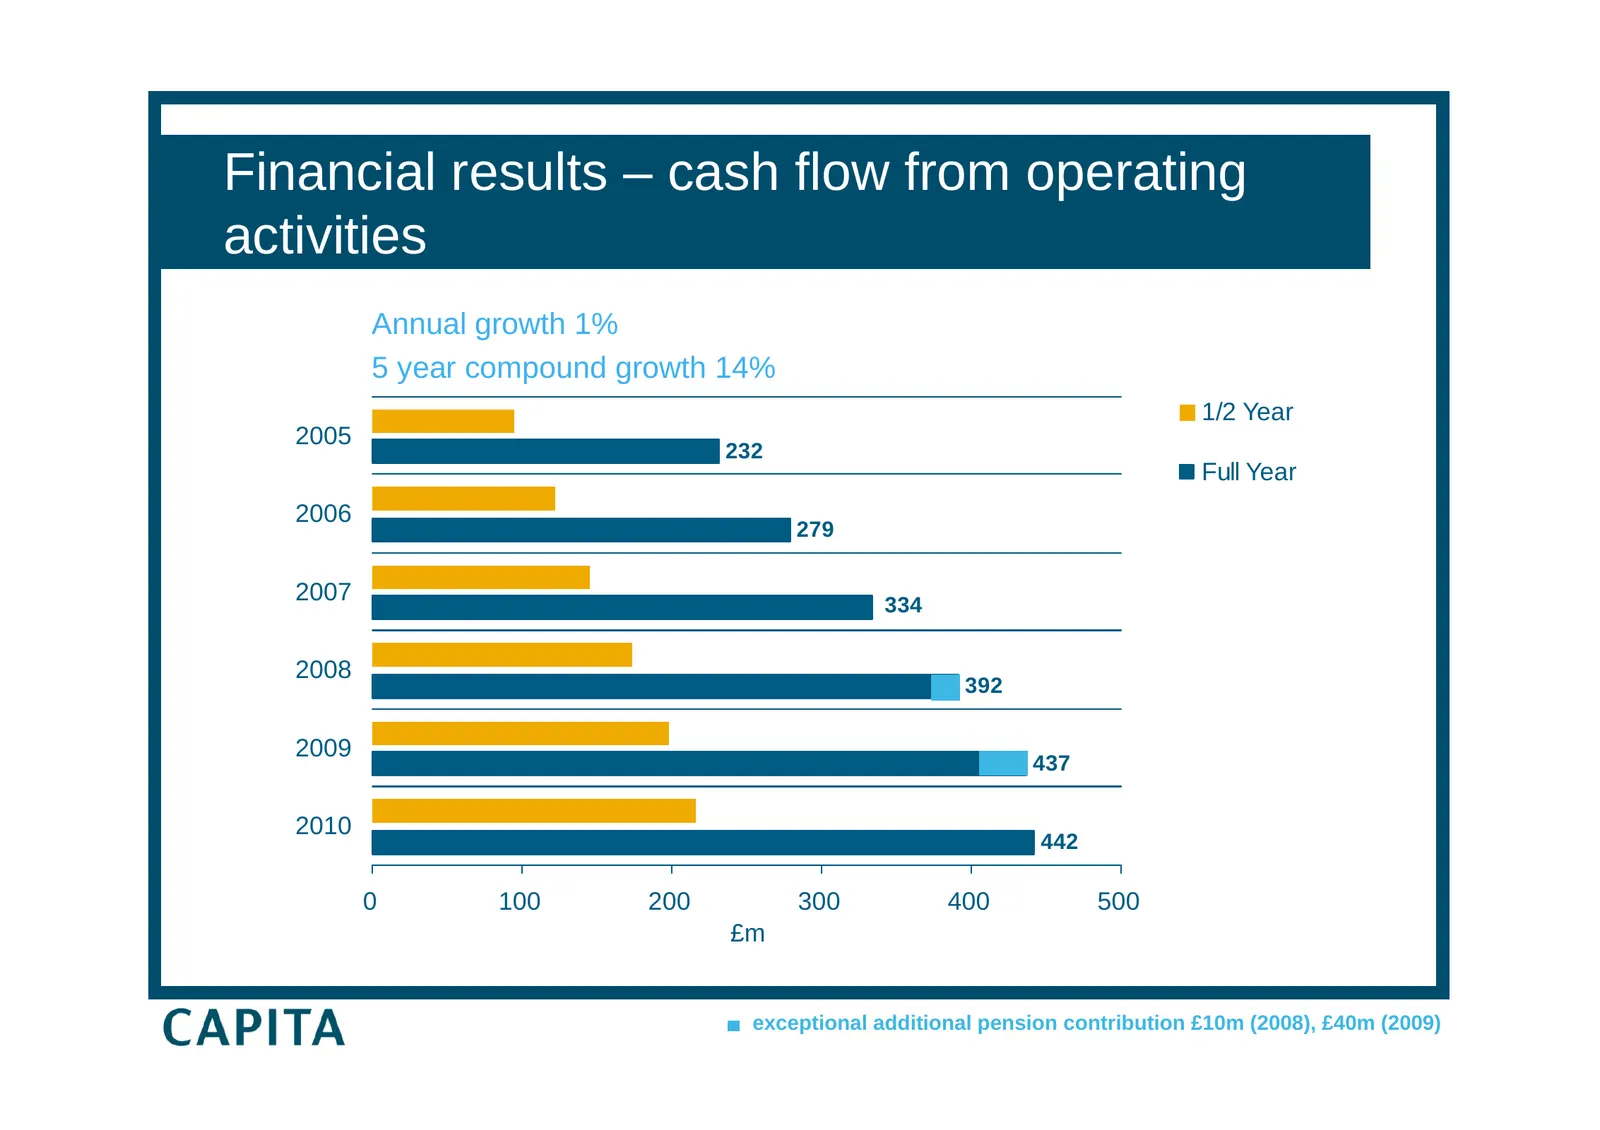
Slide 16: Financial results – cash flow from operating activities
Financial results – cash flow from operating activities Annual growth 1% 5 year compound growth 14% 1/2 Year 2005 232 Full Year 2006 279 2007 334 2008 392 2009 437 2010 442 0 100 200 300 400 500 £m exceptional additional pension contribution £10m (2008), £40m (2009)
Slide 17: Financial results – free cash flow
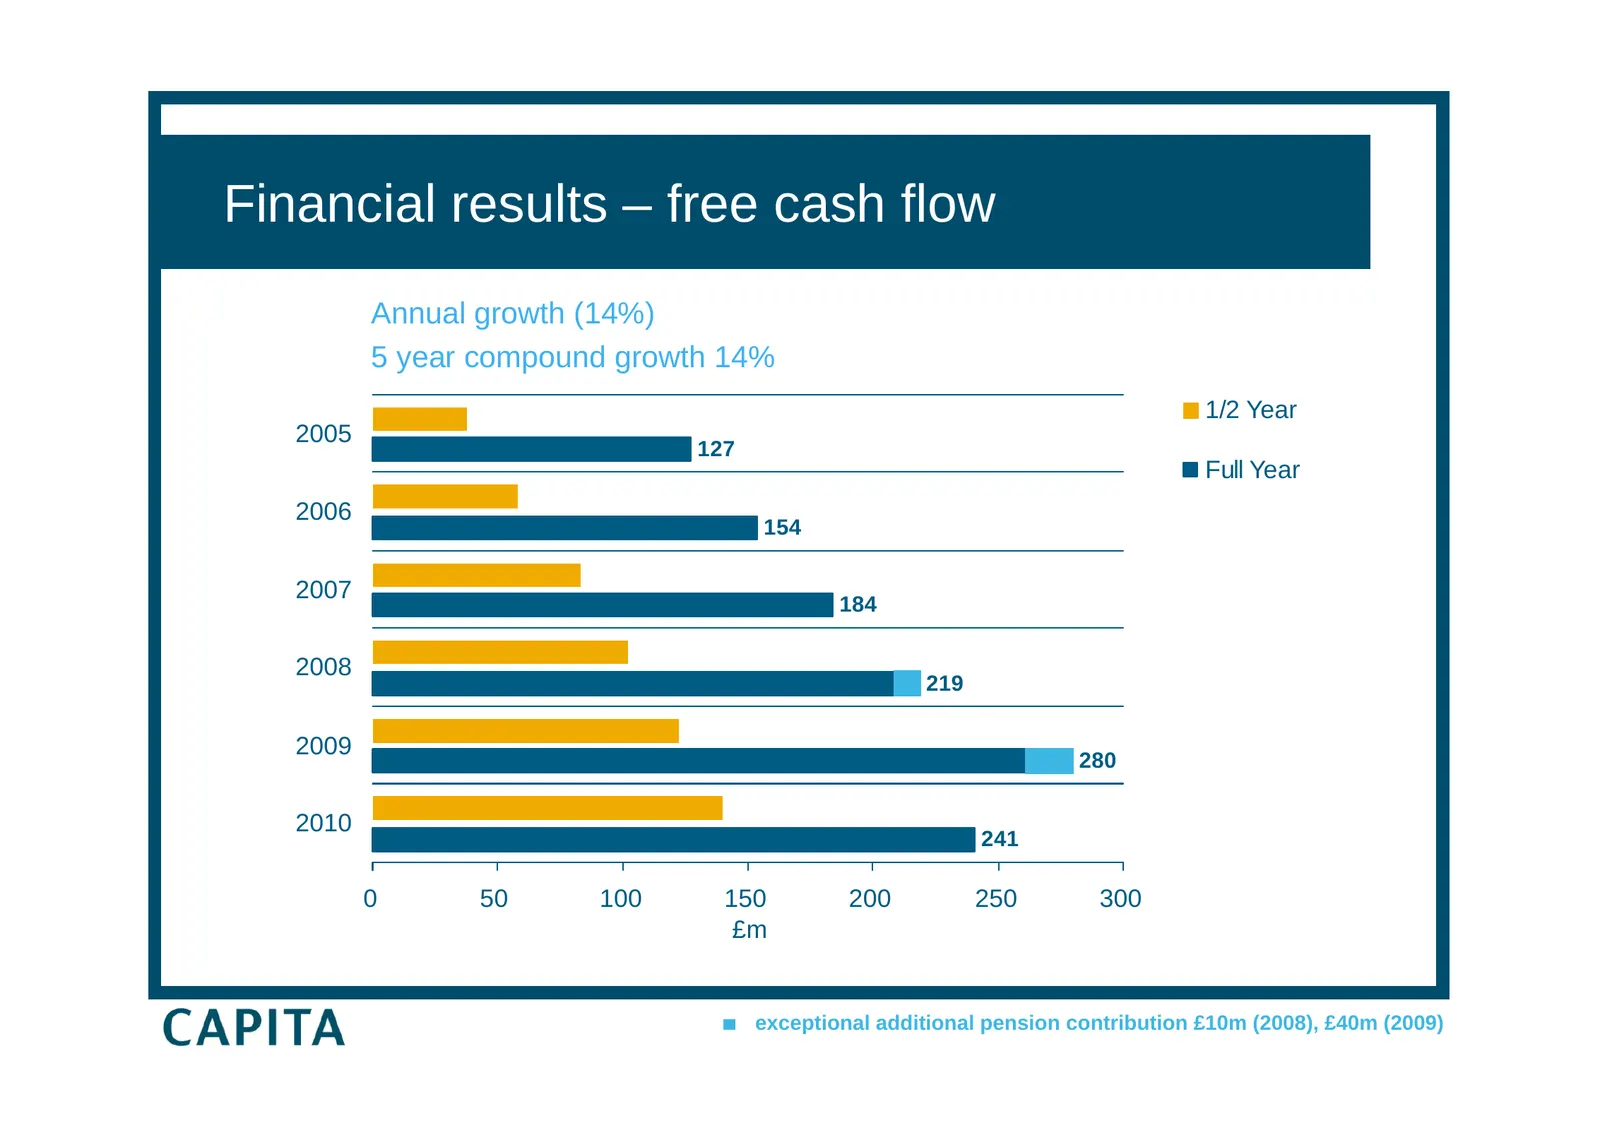
Financial results – free cash flow Annual growth (14%) 5 year compound growth 14% 1/2 Year 2005 127 Full Year 2006 154 2007 184 2008 219 2009 280 2010 241 0 50 100 150 200 250 300 £m exceptional additional pension contribution £10m (2008), £40m (2009)
Slide 18: Financial results – capex as % turnover
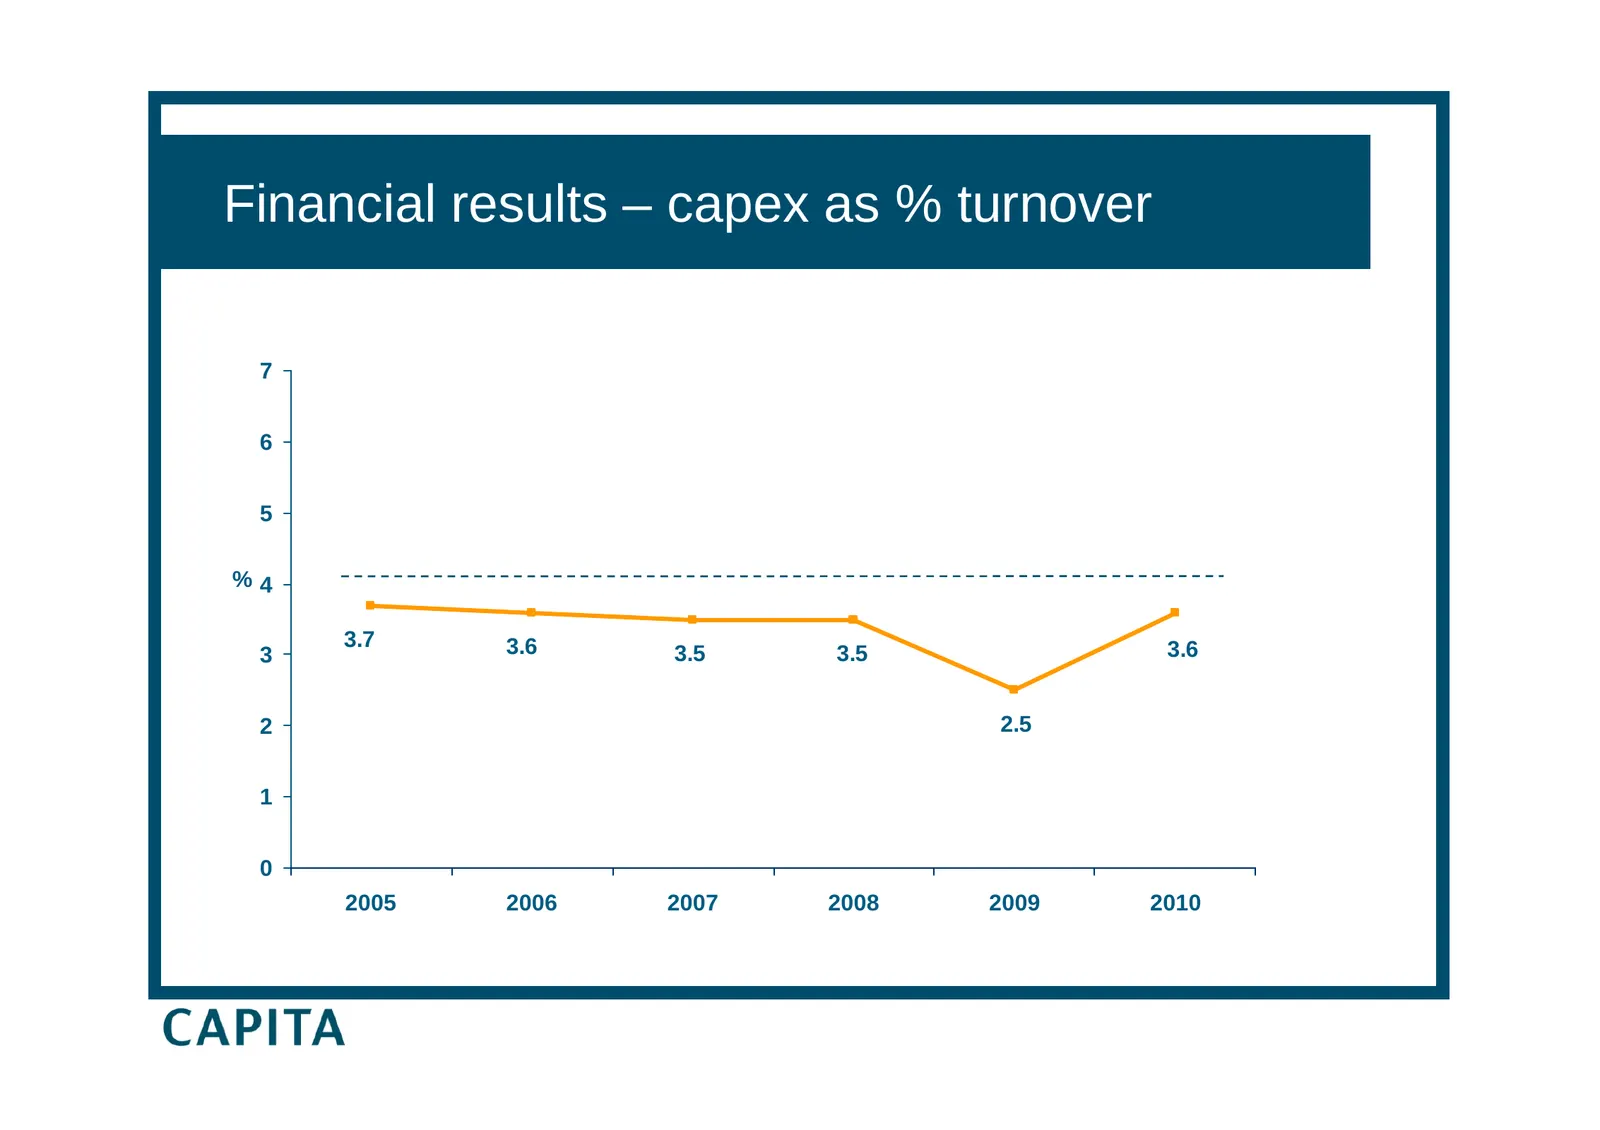
Financial results – capex as % turnover 7 6 5 %4 3.7 3.6 3.6 3 3.5 3.5 2 2.5 1 0 2005 2006 2007 2008 2009 2010
Slide 19: Underlying net return on capital
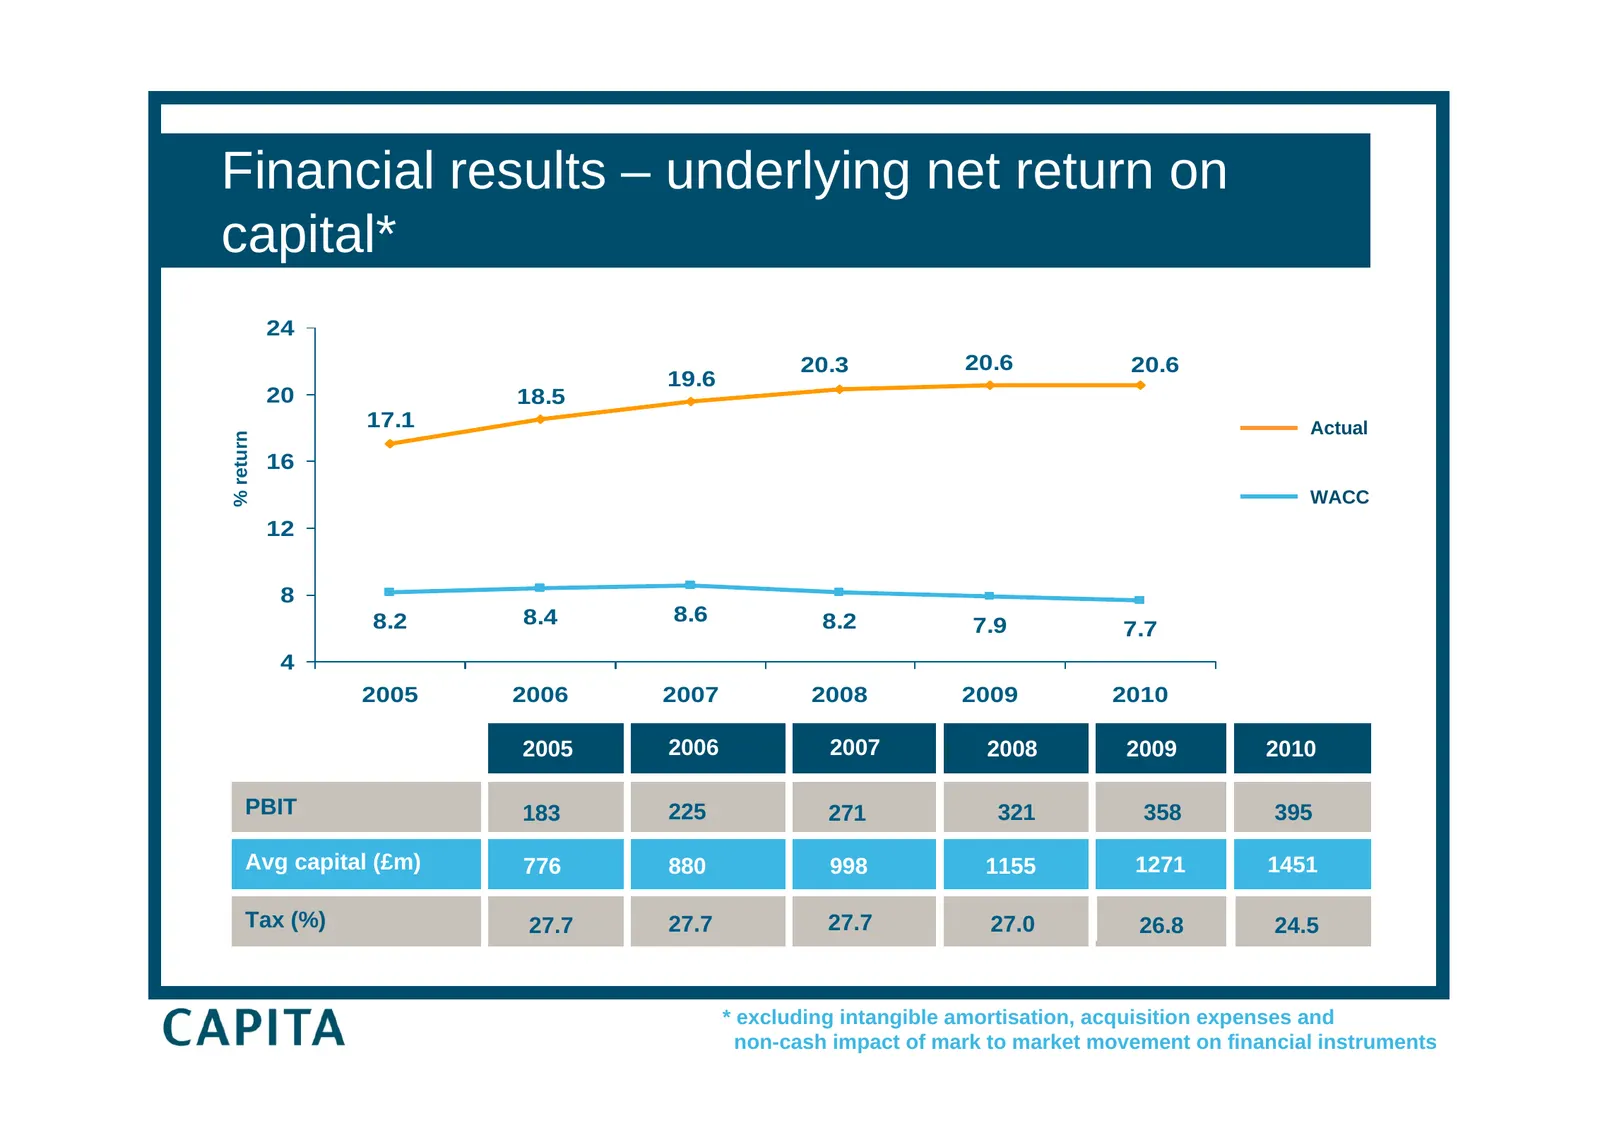
Net return Financial on capital results – underlying net return on capital* 24 20.3 20.6 20.6 19.6 20 18.5 17.1 Actual % return 16 WACC 12 8 8.2 8.4 8.6 8.2 7.9 7.7 4 2005 2006 2007 2008 2009 2010 2005 2006 2007 2008 2009 2010 PBIT 183 225 271 321 358 395 Avg capital (£m) 776 880 998 1155 1271 1451
Slide 20: Free cash flow return on capital
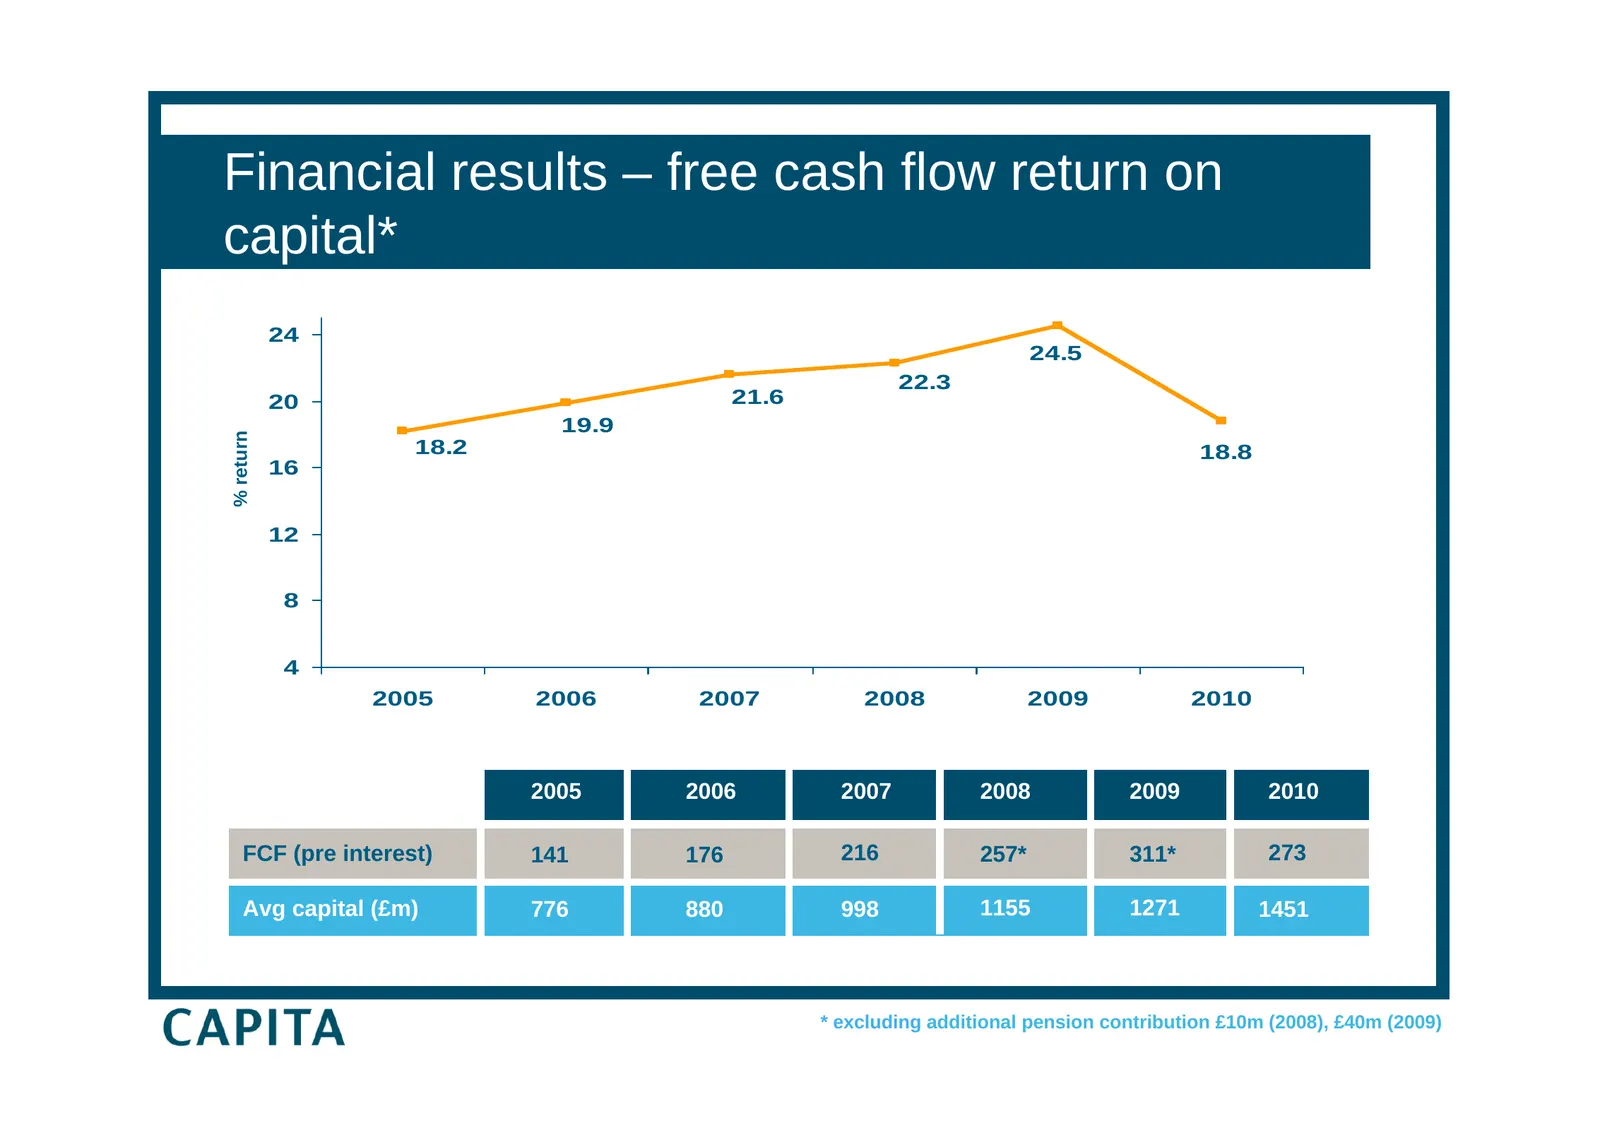
Financial results – free cash flow return on capital* 24 24.5 22.3 20 21.6 19.9 % return 18.2 18.8 16 12 8 4 2005 2006 2007 2008 2009 2010 2005 2006 2007 2008 2009 2010 FCF (pre interest) 141 176 216 257* 311* 273 Avg capital (£m) 776 880 998 1155 1271 1451 * excluding additional pension contributio
Slide 21: Financial results – balance sheet gearing
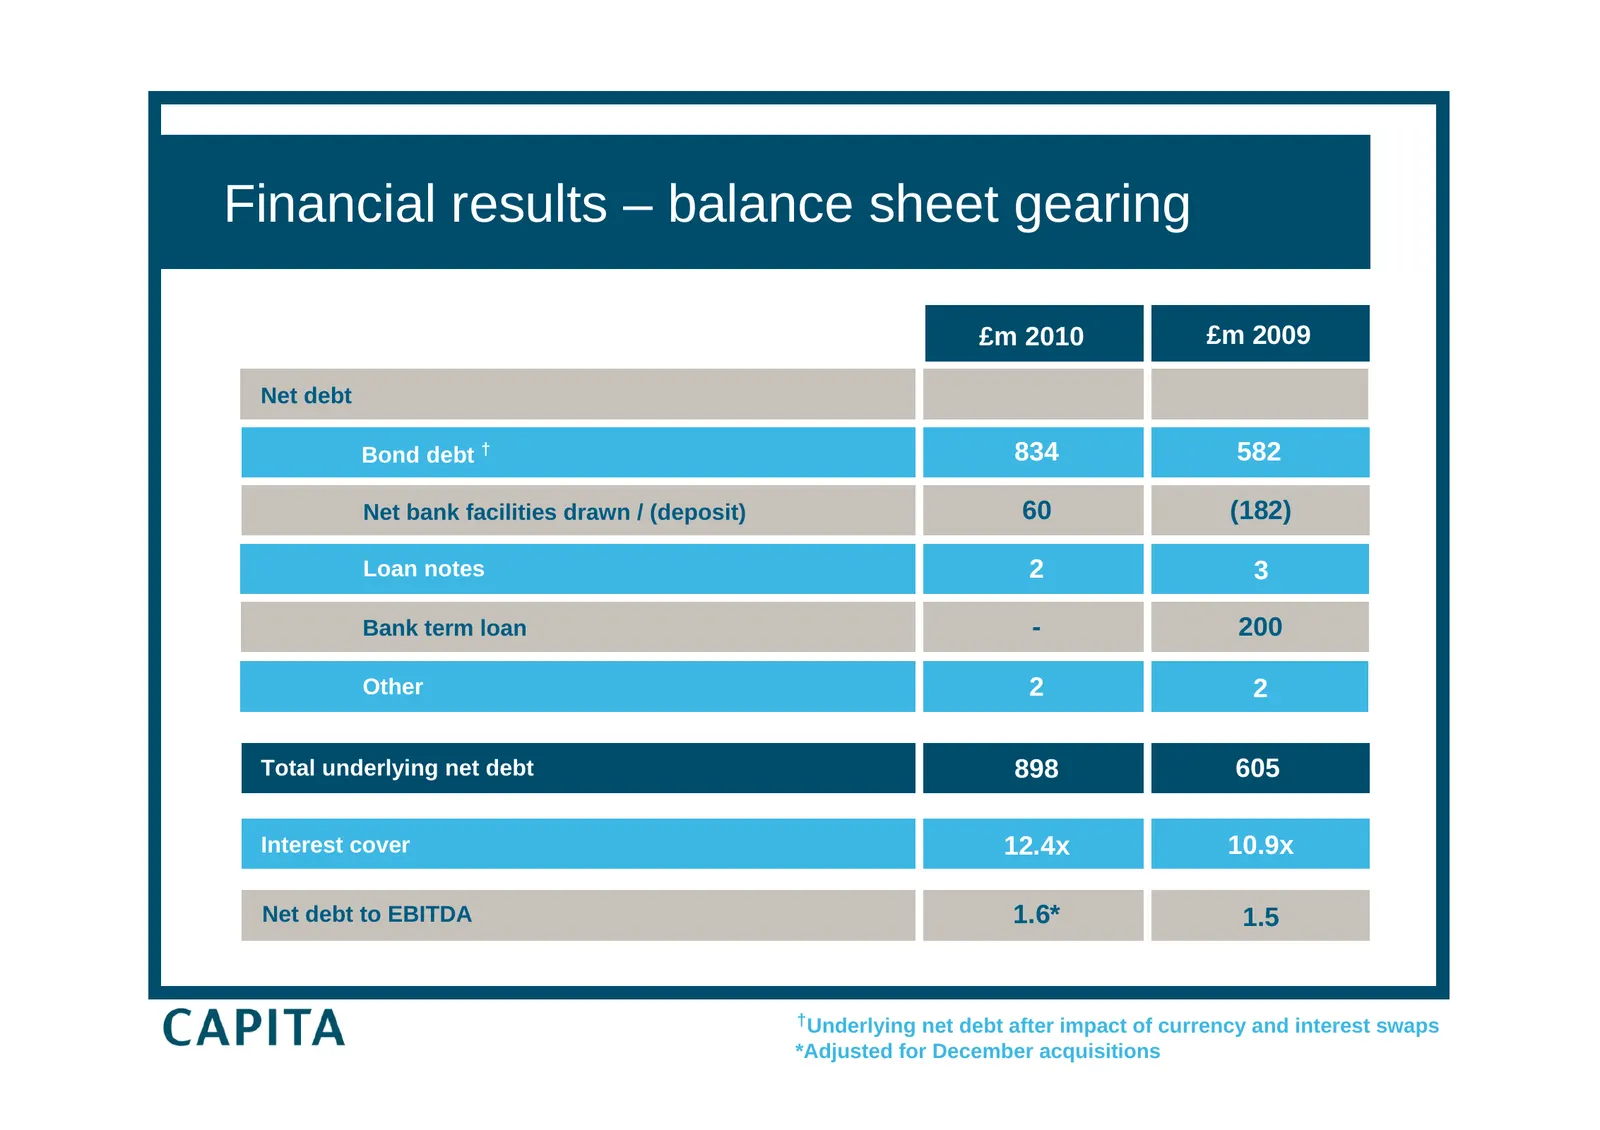
Financial results – balance sheet gearing £m 2010 £m 2009 Net debt Bond debt † 834 582 Net bank facilities drawn / (deposit) 60 (182) Loan notes 2 3 Bank term loan - 200 Other 2 2 Total underlying net debt 898 605 Interest cover 12.4x 10.9x Net debt to EBITDA 1.6* 1.5 † Underlying net debt after imp
Slide 22: Financial results – debt profile
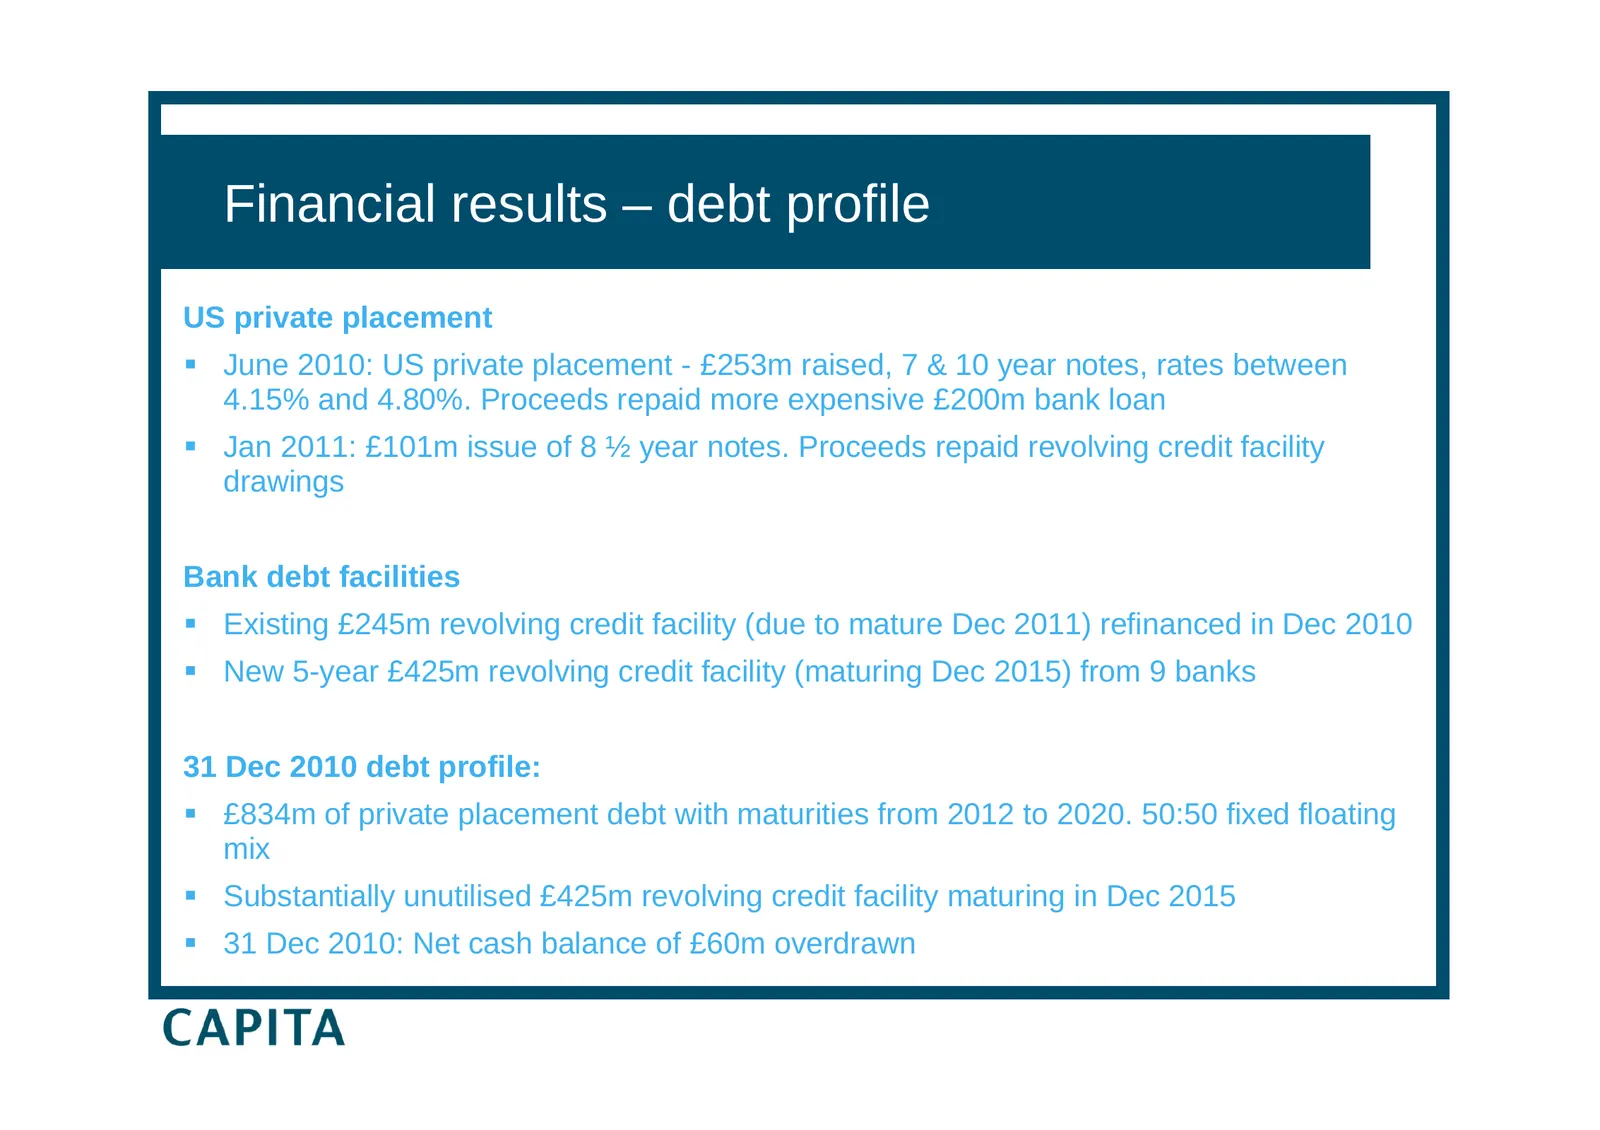
Financial results – debt profile US private placement June 2010: US private placement - £253m raised, 7 & 10 year notes, rates between 4.15% and 4.80%. Proceeds repaid more expensive £200m bank loan Jan 2011: £101m issue of 8 ½ year notes. Proceeds repaid revolving credit facility drawings Bank
Slide 23: Financial results – returns to shareholders in respect of 2010
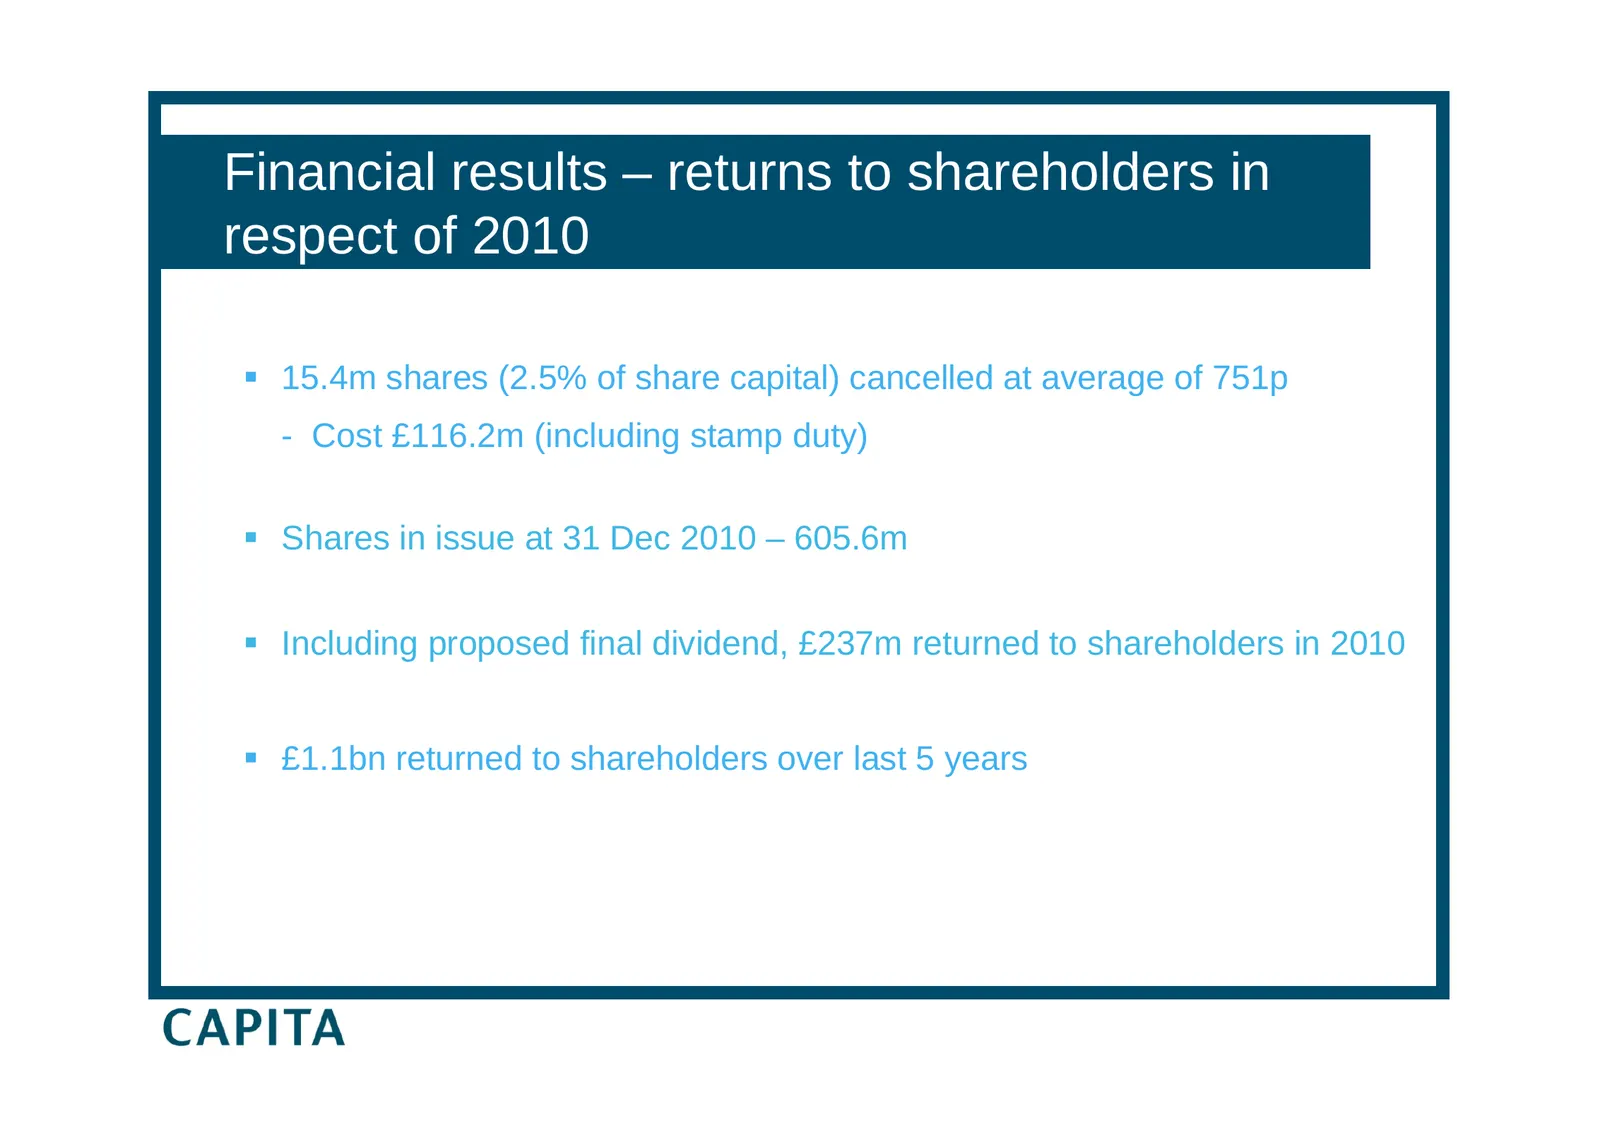
Financial results – returns to shareholders in respect of 2010 15.4m shares (2.5% of share capital) cancelled at average of 751p - Cost £116.2m (including stamp duty) Shares in issue at 31 Dec 2010 – 605.6m Including proposed final dividend, £237m returned to shareholders in 2010 £1.1bn retu
Slide 24: Generating growth through contract wins and acquisitions
Generating growth through contract wins and acquisitions Paul Pindar Chief Executive
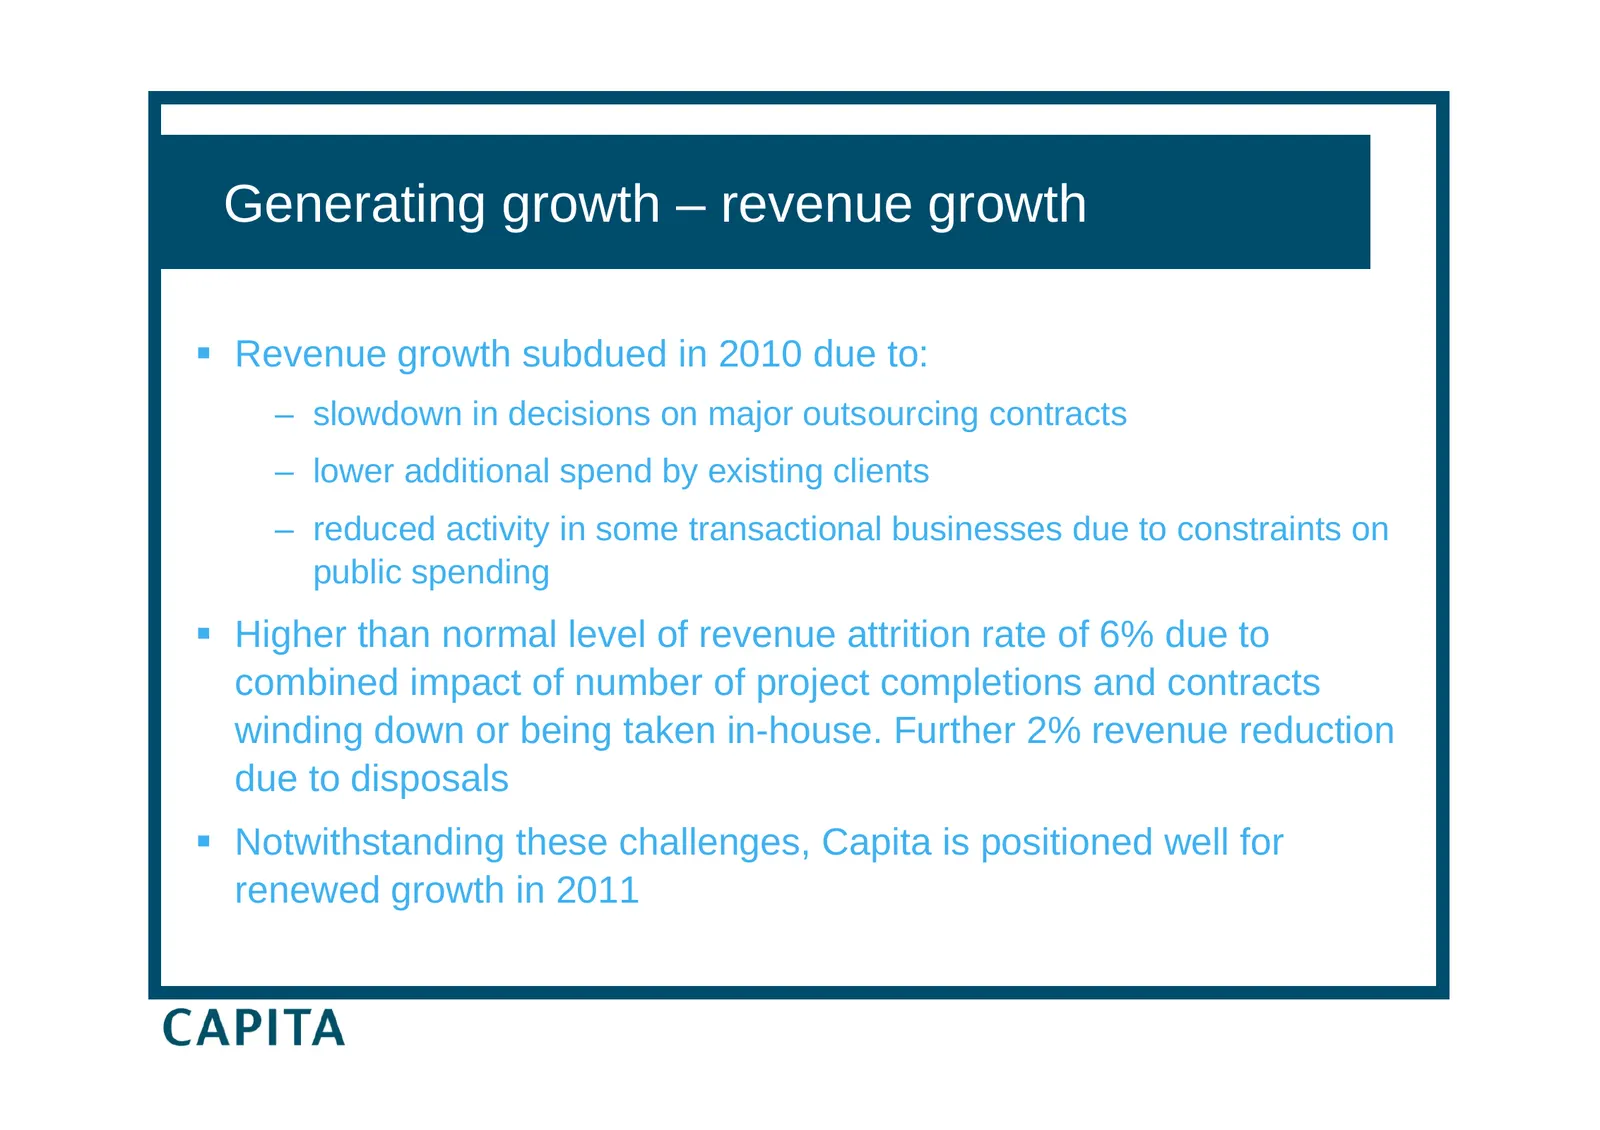
Slide 25: Generating growth – revenue growth
Generating growth – revenue growth Revenue growth subdued in 2010 due to: – slowdown in decisions on major outsourcing contracts – lower additional spend by existing clients – reduced activity in some transactional businesses due to constraints on public spending Higher than normal level of reve
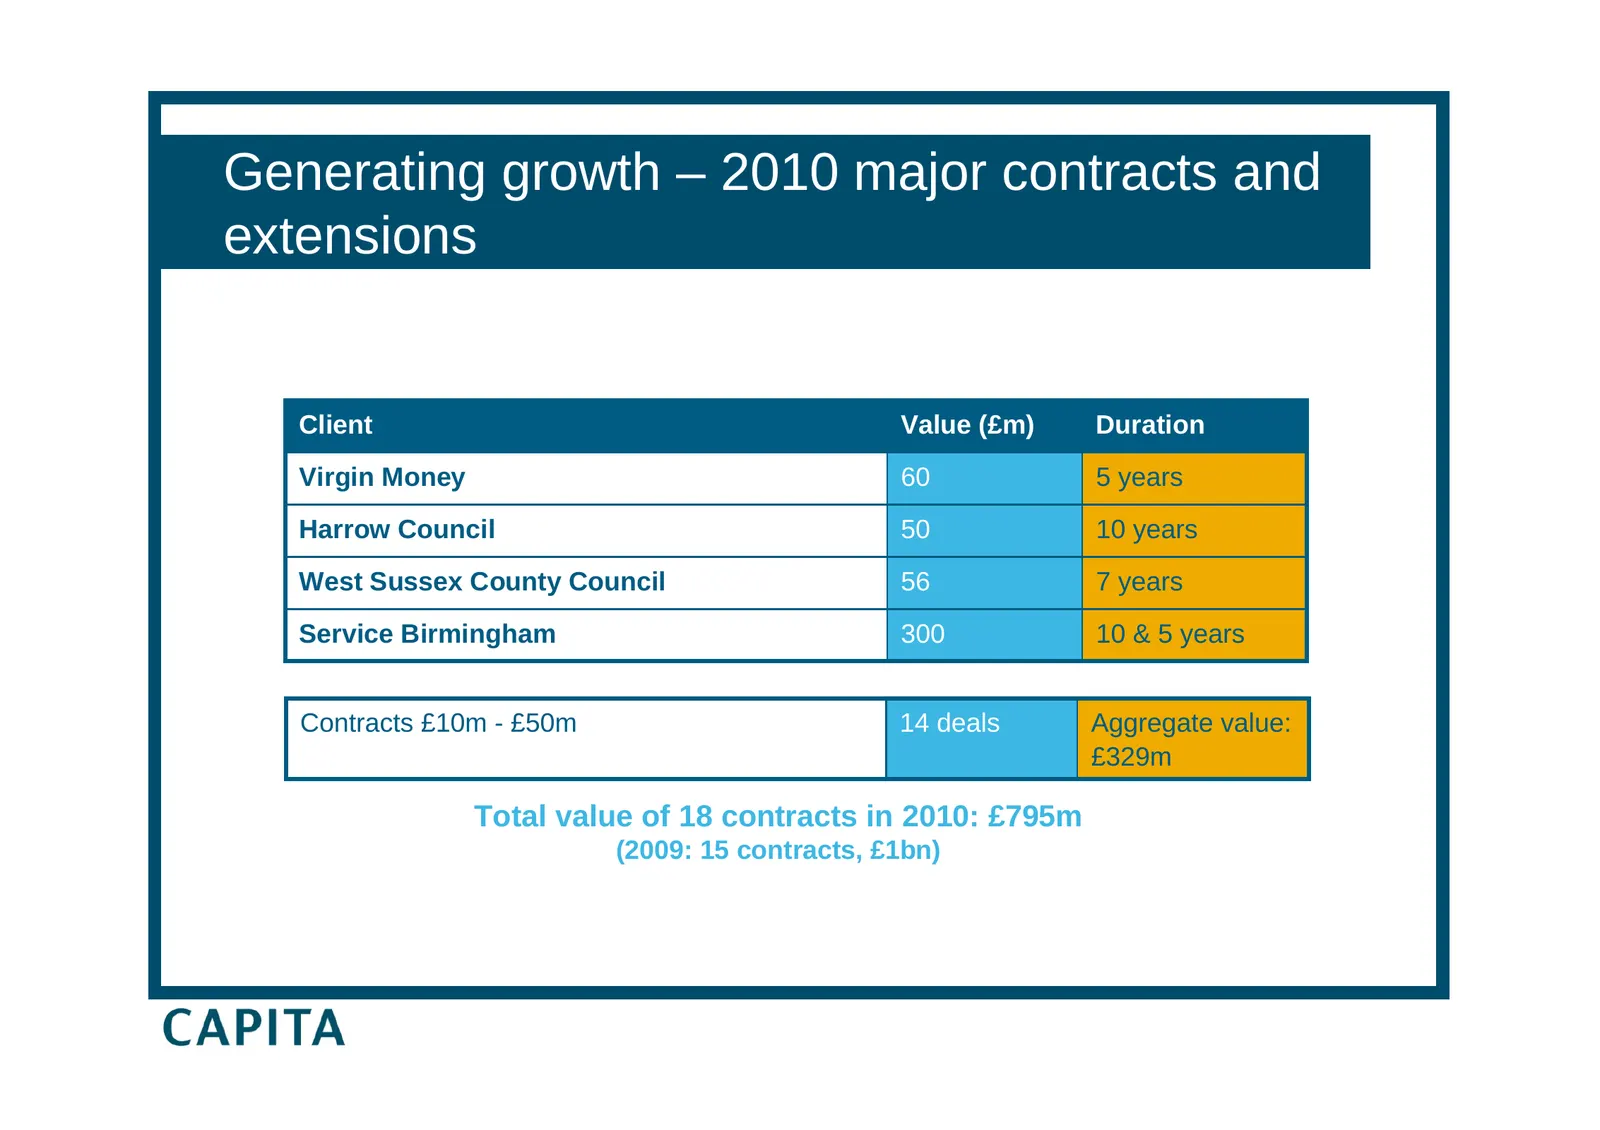
Slide 26: Generating growth – 2010 major contracts and extensions
Generating growth – 2010 major contracts and extensions Client Value (£m) Duration Virgin Money 60 5 years Harrow Council 50 10 years West Sussex County Council 56 7 years Service Birmingham 300 10 & 5 years Contracts £10m - £50m 14 deals Aggregate value: £329m Total value of 18 contracts in 2010: £
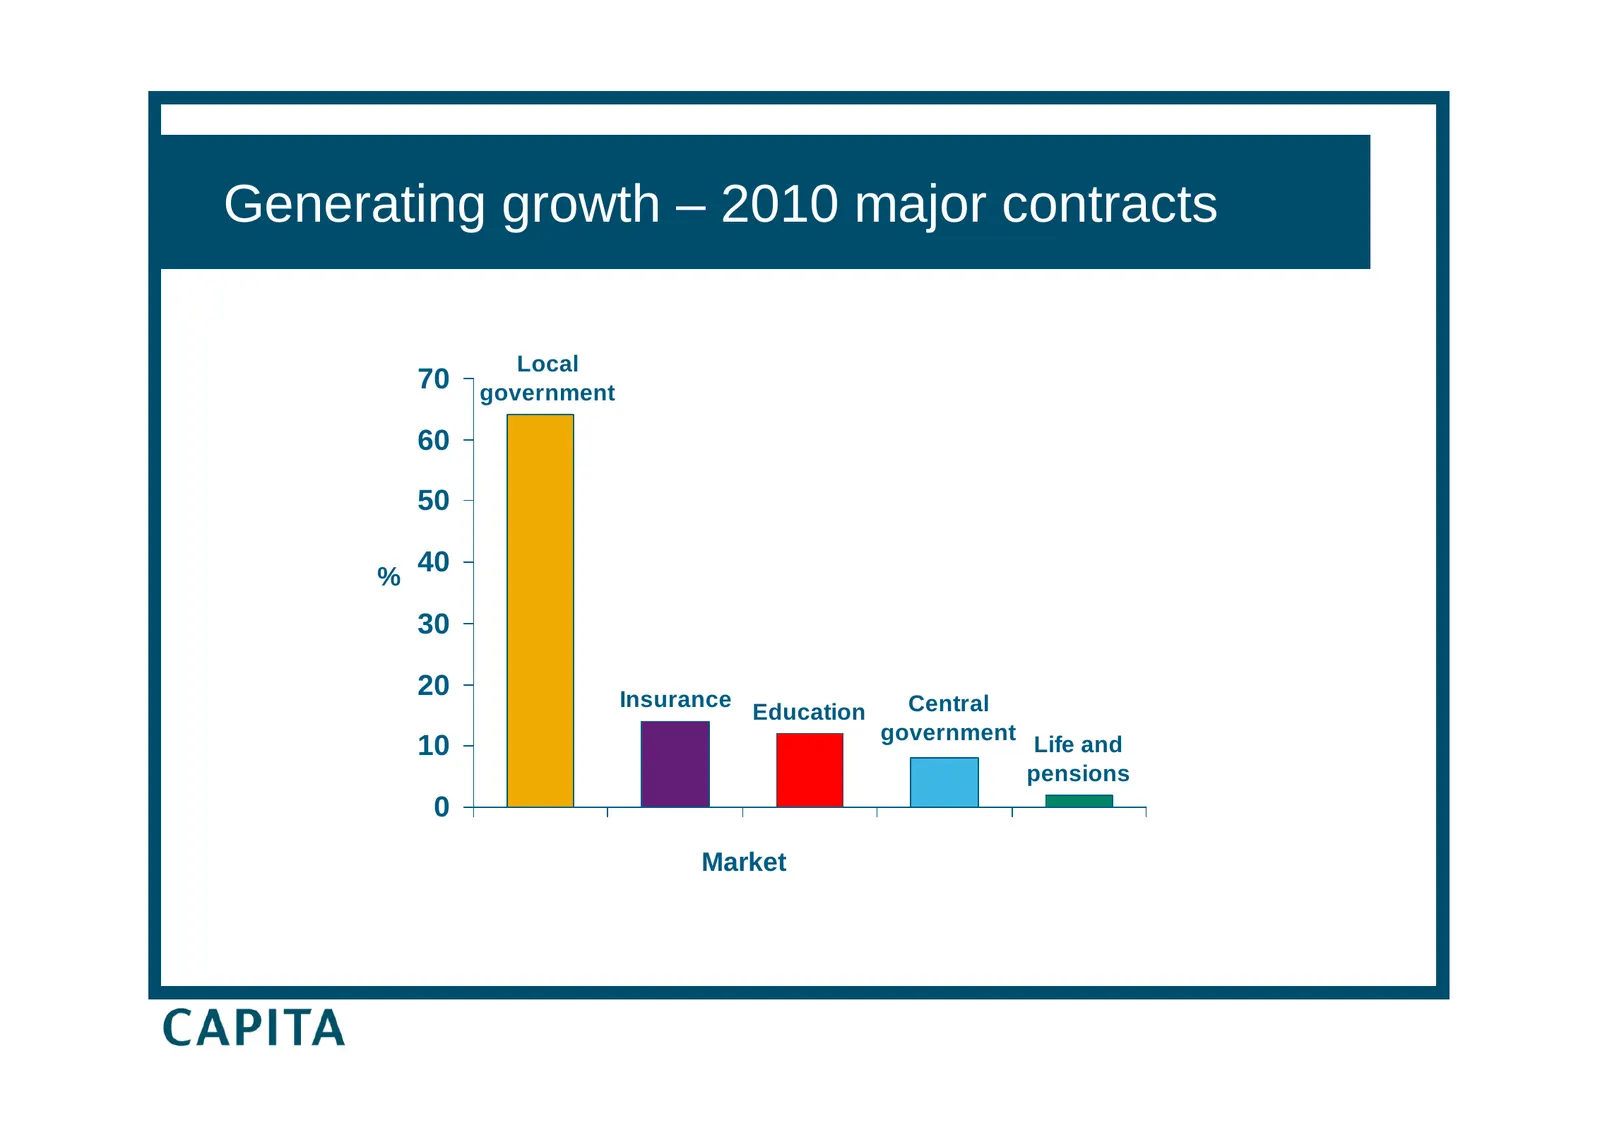
Slide 27: Generating growth – 2010 major contracts
Generating growth – 2010 major contracts Local 70 government 60 50 % 40 30 20 Insurance Education Central government 10 Life and pensions 0 Market
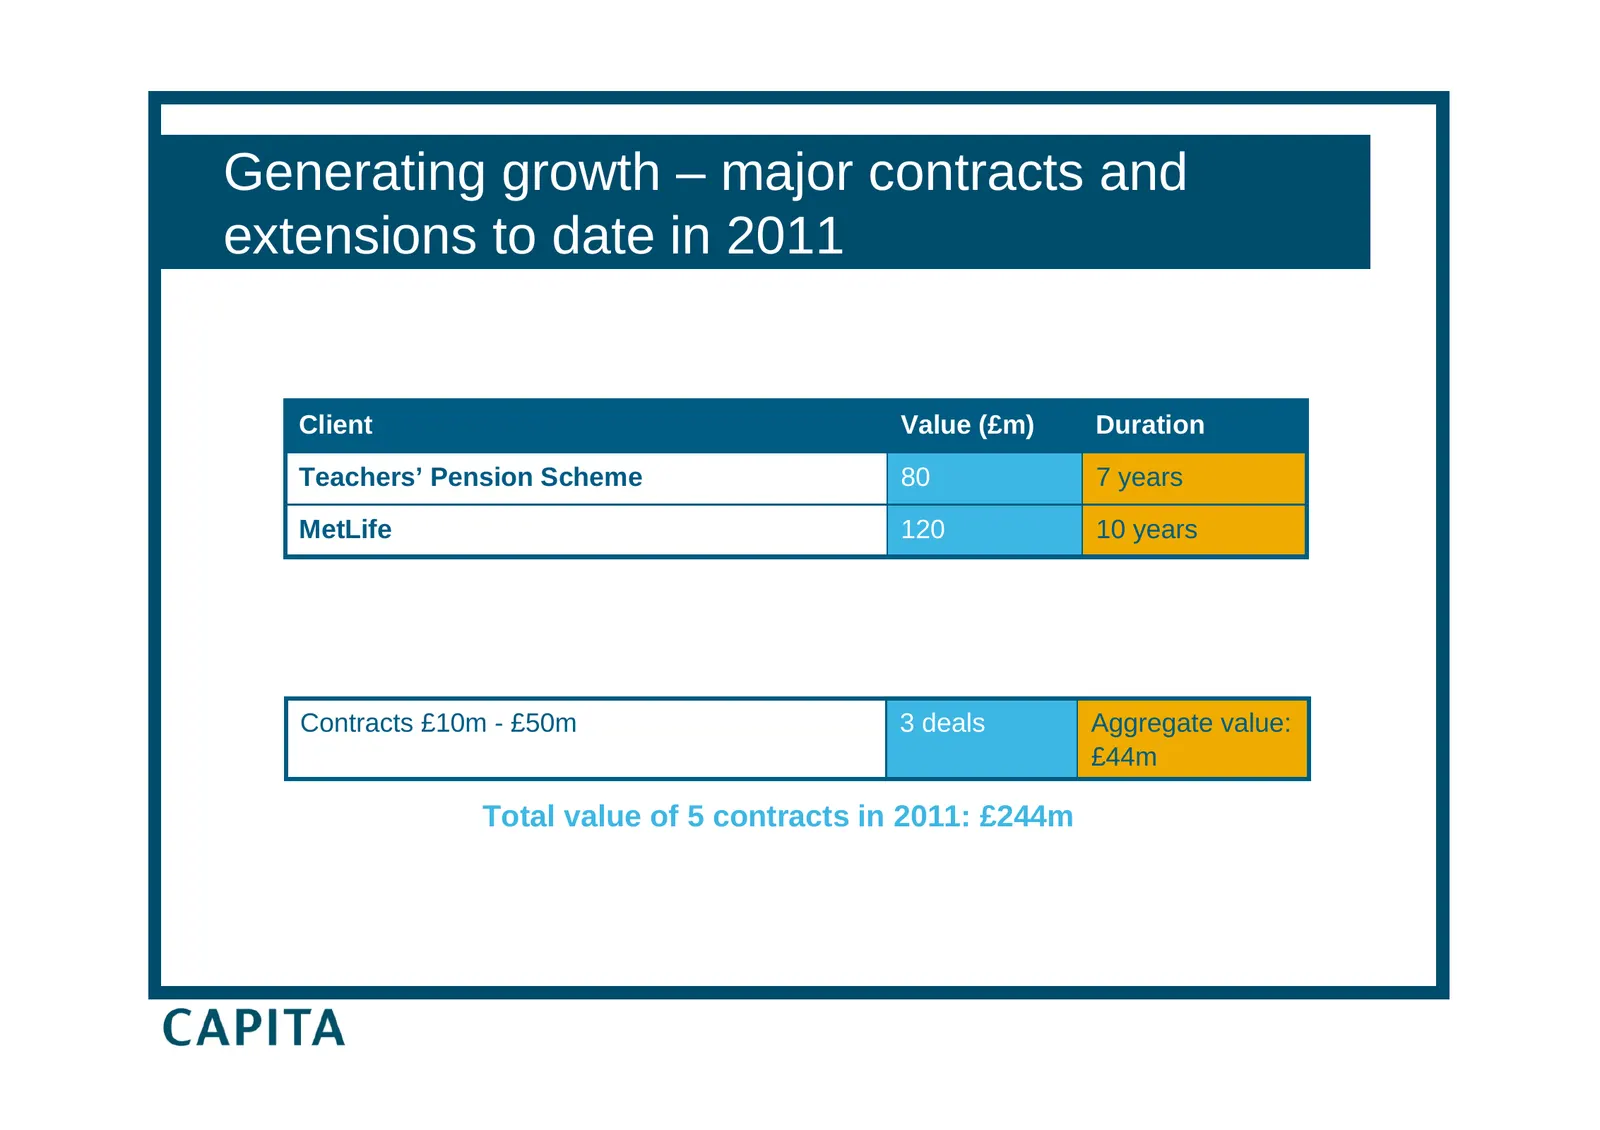
Slide 28: Generating growth – major contracts and extensions to date in 2011
Generating growth – major contracts and extensions to date in 2011 Client Value (£m) Duration Teachers’ Pension Scheme 80 7 years MetLife 120 10 years Contracts £10m - £50m 3 deals Aggregate value: £44m Total value of 5 contracts in 2011: £244m
Slide 29: Generating growth – Teachers' Pension Scheme
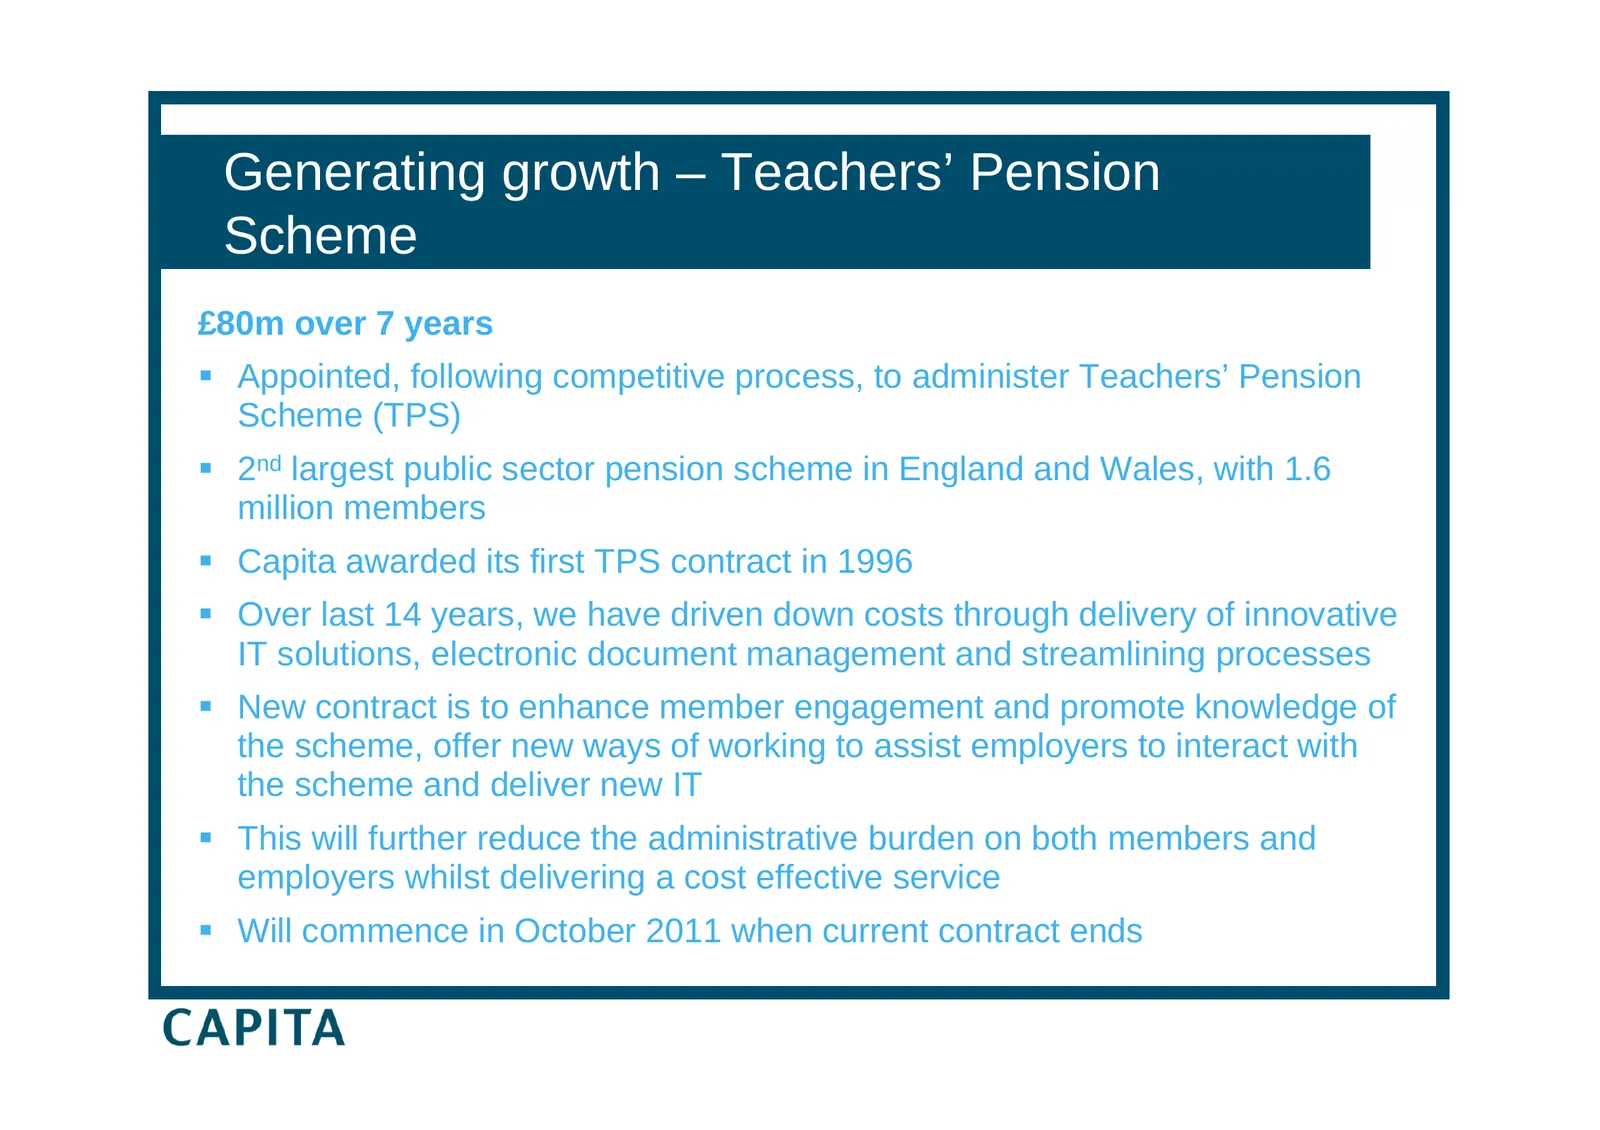
Generating growth – Teachers’ Pension Scheme £80m over 7 years Appointed, following competitive process, to administer Teachers’ Pension Scheme (TPS) 2nd largest public sector pension scheme in England and Wales, with 1.6 million members Capita awarded its first TPS contract in 1996 Over las
Slide 30: Generating growth – MetLife
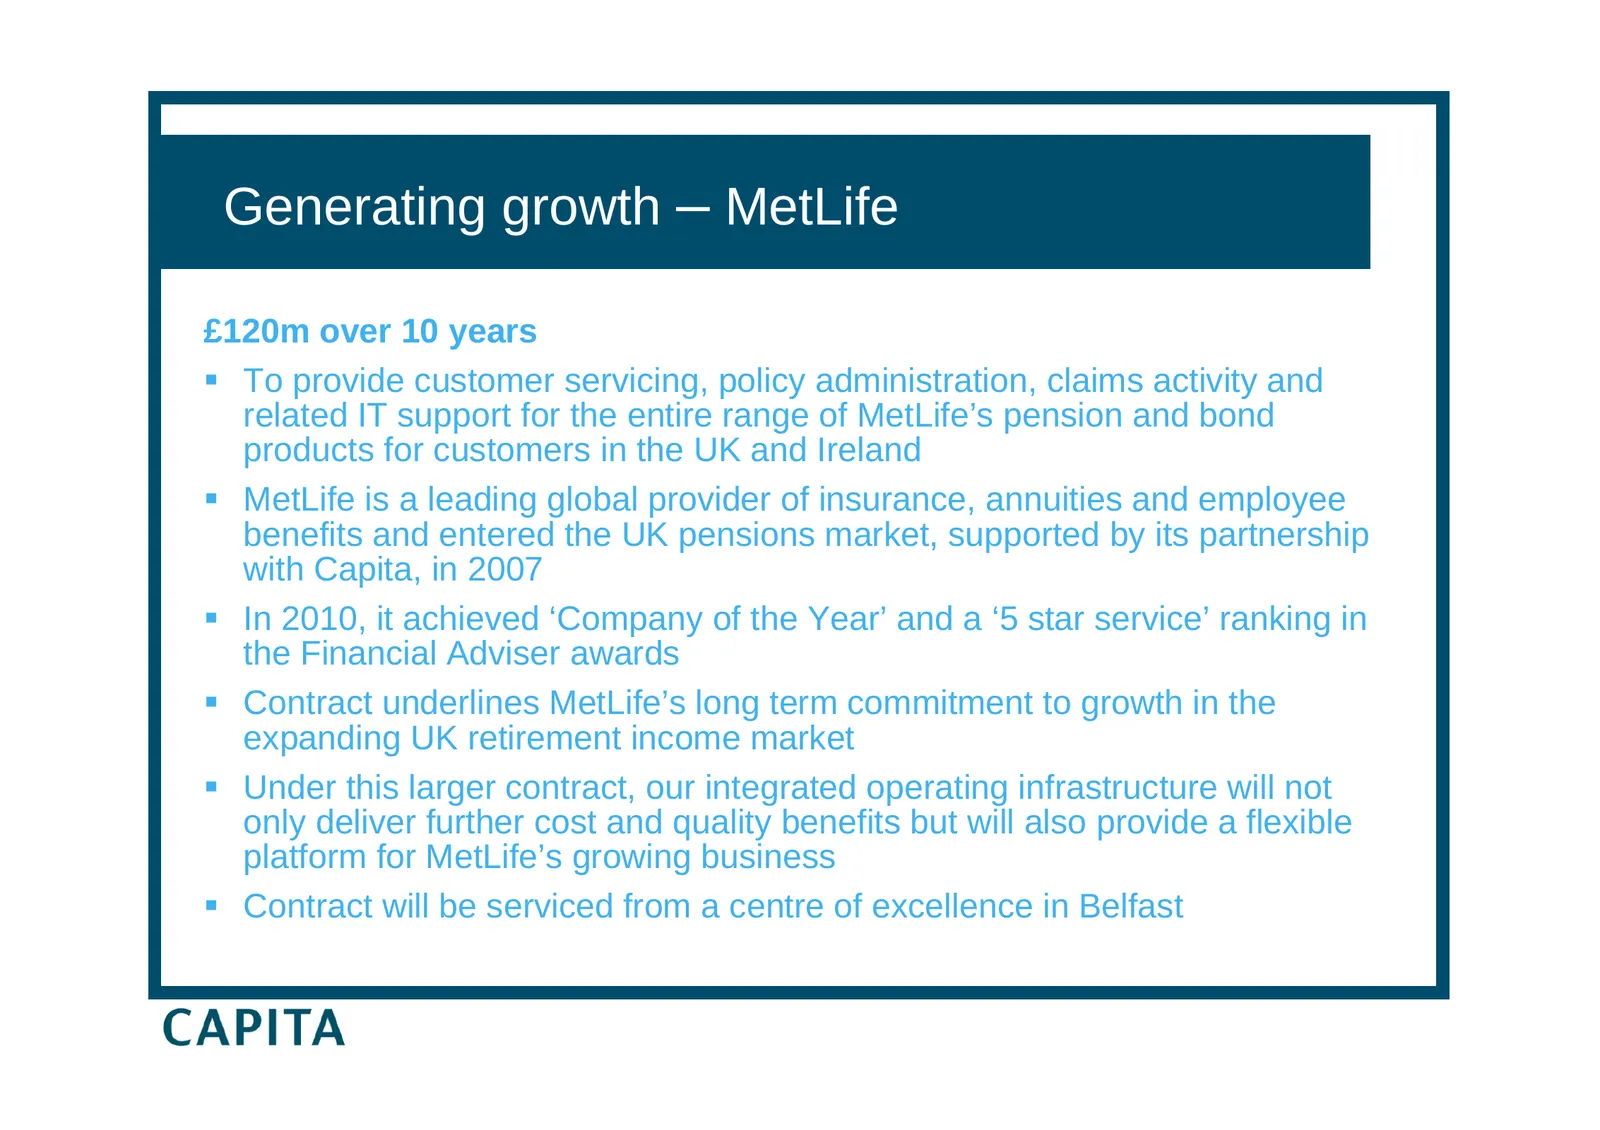
Generating growth – MetLife £120m over 10 years To provide customer servicing, policy administration, claims activity and related IT support for the entire range of MetLife’s pension and bond products for customers in the UK and Ireland MetLife is a leading global provider of insurance, annuitie
Slide 31: Generating growth – existing major contracts due for rebid
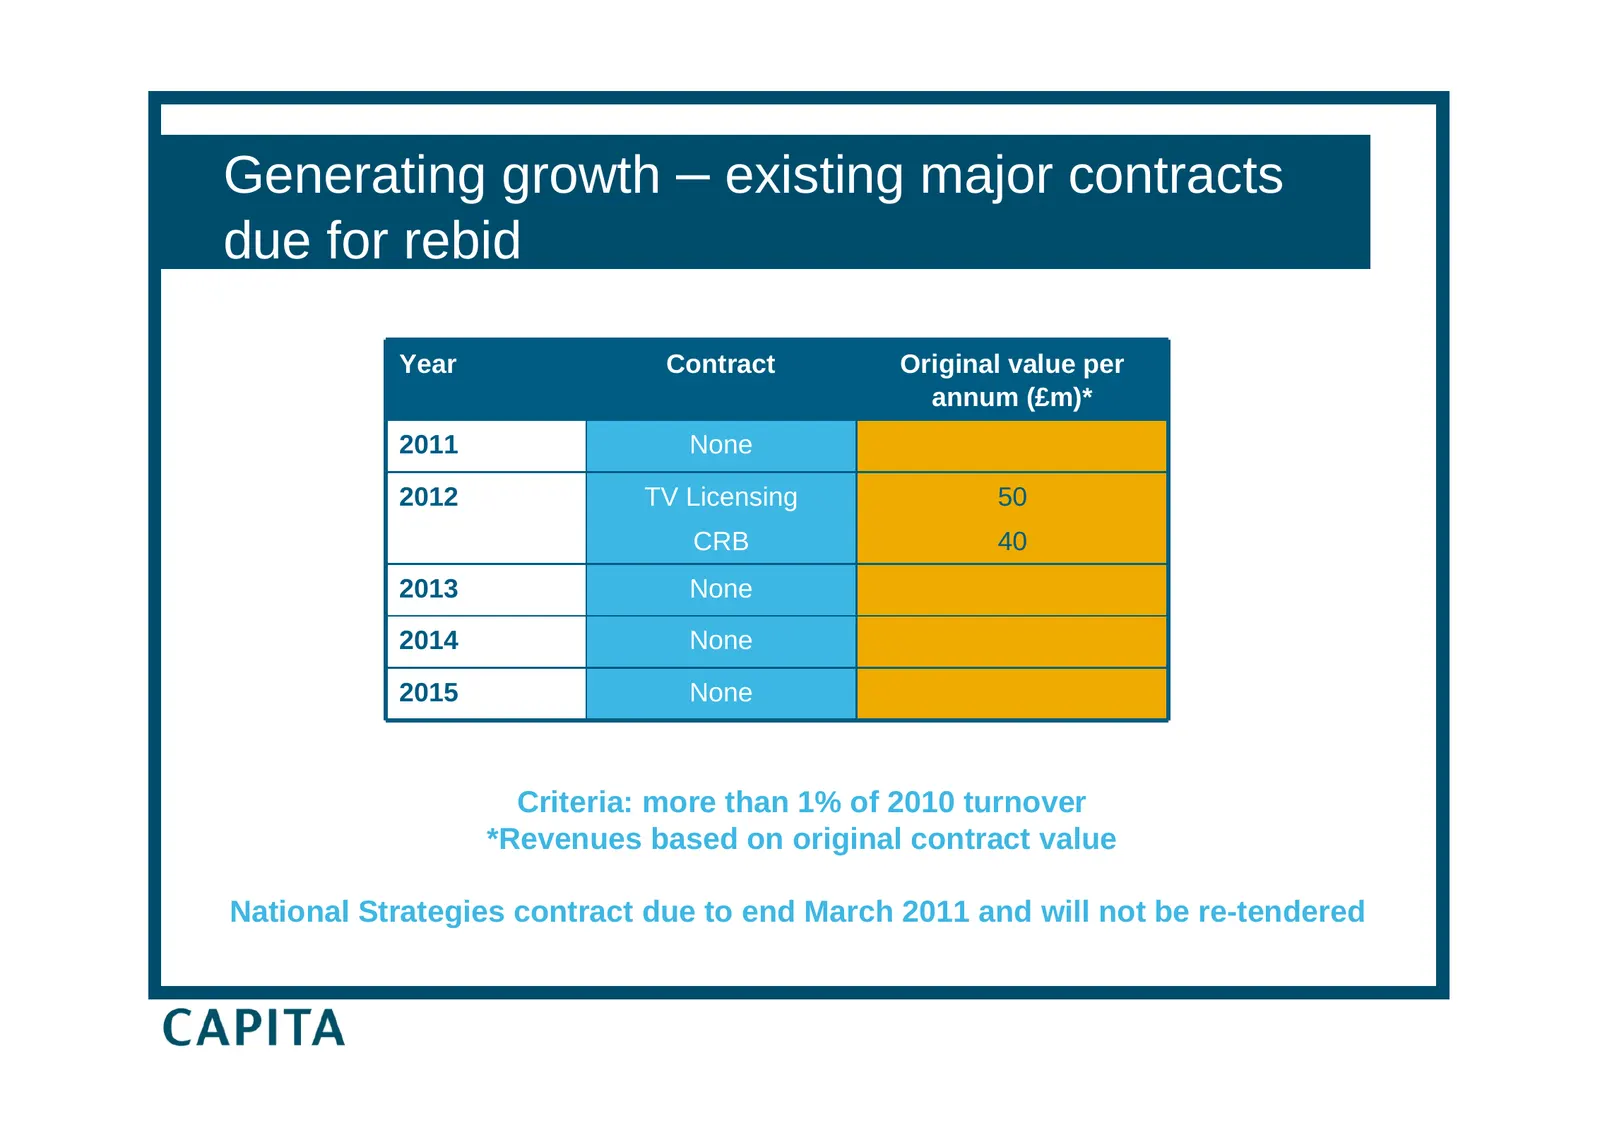
Generating growth – existing major contracts due for rebid Year Contract Original value per annum (£m)* 2011 None 2012 TV Licensing 50 CRB 40 2013 None 2014 None 2015 None Criteria: more than 1% of 2010 turnover *Revenues based on original contract value National Strategies contract due to end March
Slide 32: Generating growth – bid activity
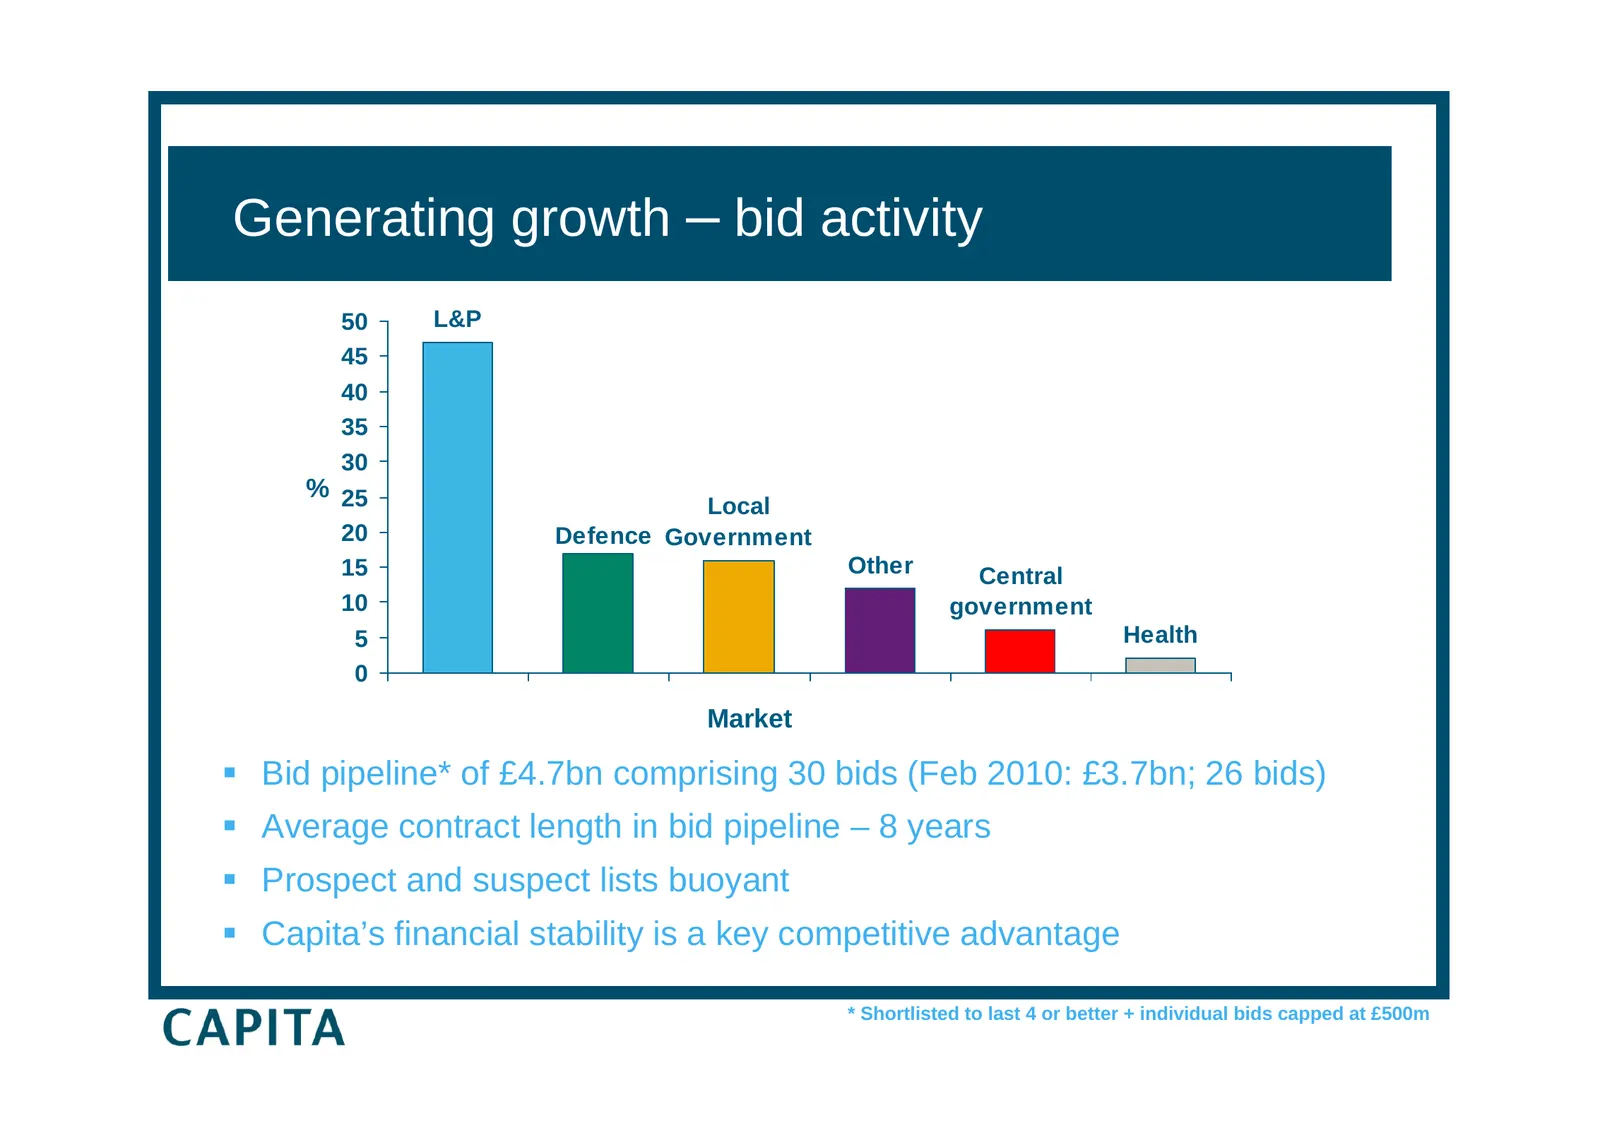
Generating growth – bid activity 50 L&P 45 40 35 30 % 25 Local 20 Defence Government 15 Other Central 10 government 5 Health 0 Market Bid pipeline* of £4.7bn comprising 30 bids (Feb 2010: £3.7bn; 26 bids) Average contract length in bid pipeline – 8 years Prospect and suspect lists buoyant Ca
Slide 33: Fuelling growth – 2010 acquisitions
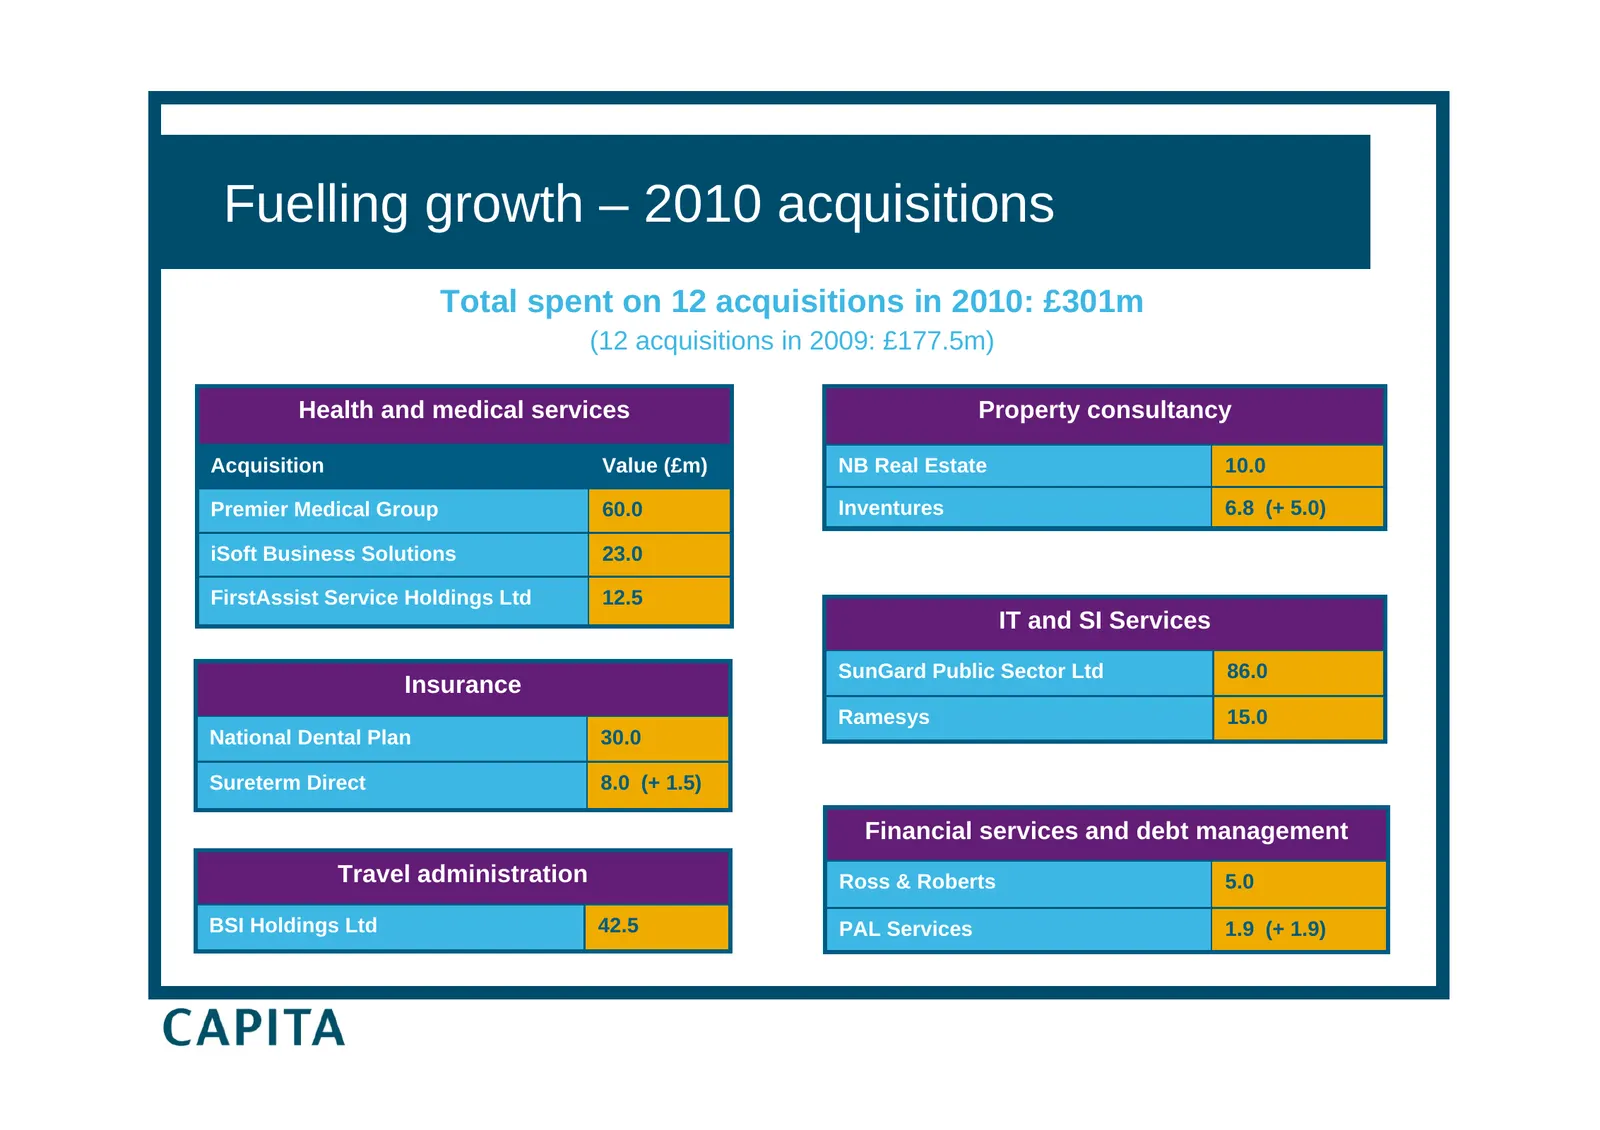
Fuelling growth – 2010 acquisitions Total spent on 12 acquisitions in 2010: £301m (12 acquisitions in 2009: £177.5m) Health and medical services Property consultancy Acquisition Value (£m) NB Real Estate 10.0 Premier Medical Group 60.0 Inventures 6.8 (+ 5.0) iSoft Business Solutions 23.0 FirstAssist
Slide 34: Generating growth – 2010 acquisitions
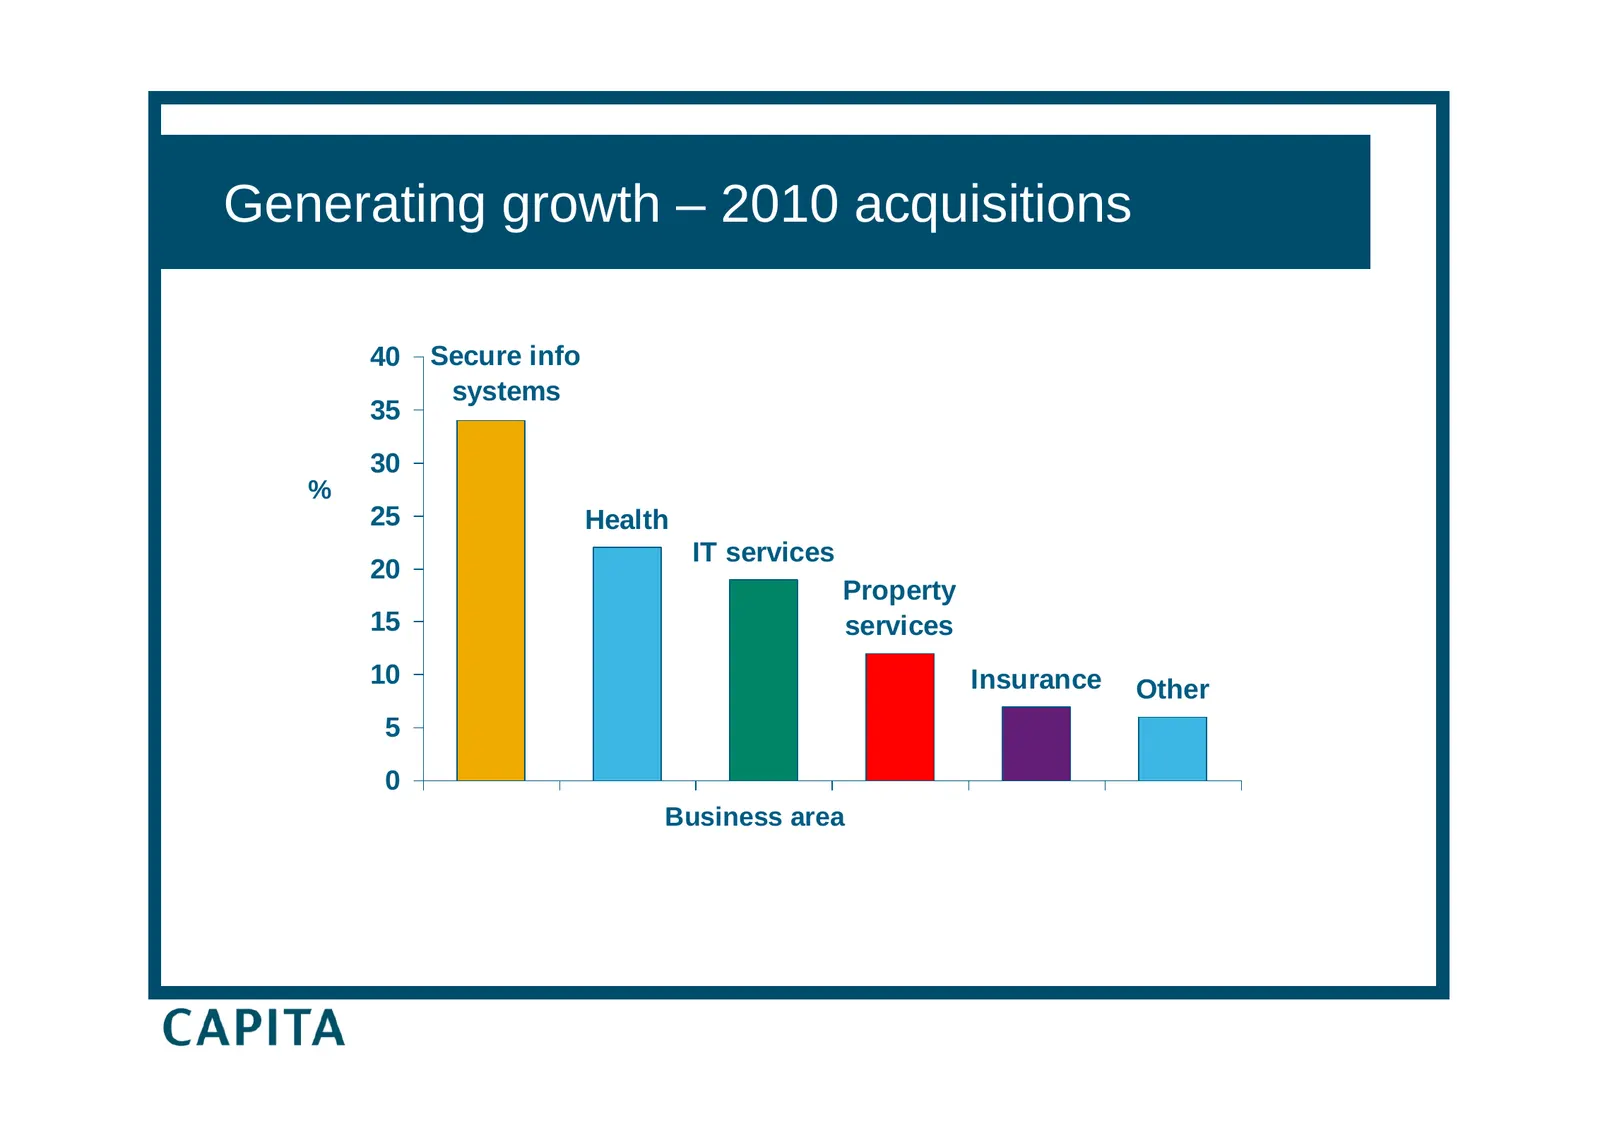
Generating growth – 2010 acquisitions 40 Secure info systems 35 30 % 25 Health IT services 20 Property 15 services 10 Insurance Other 5 0 Business area
Slide 35: Fuelling growth – 2011 year to date acquisitions
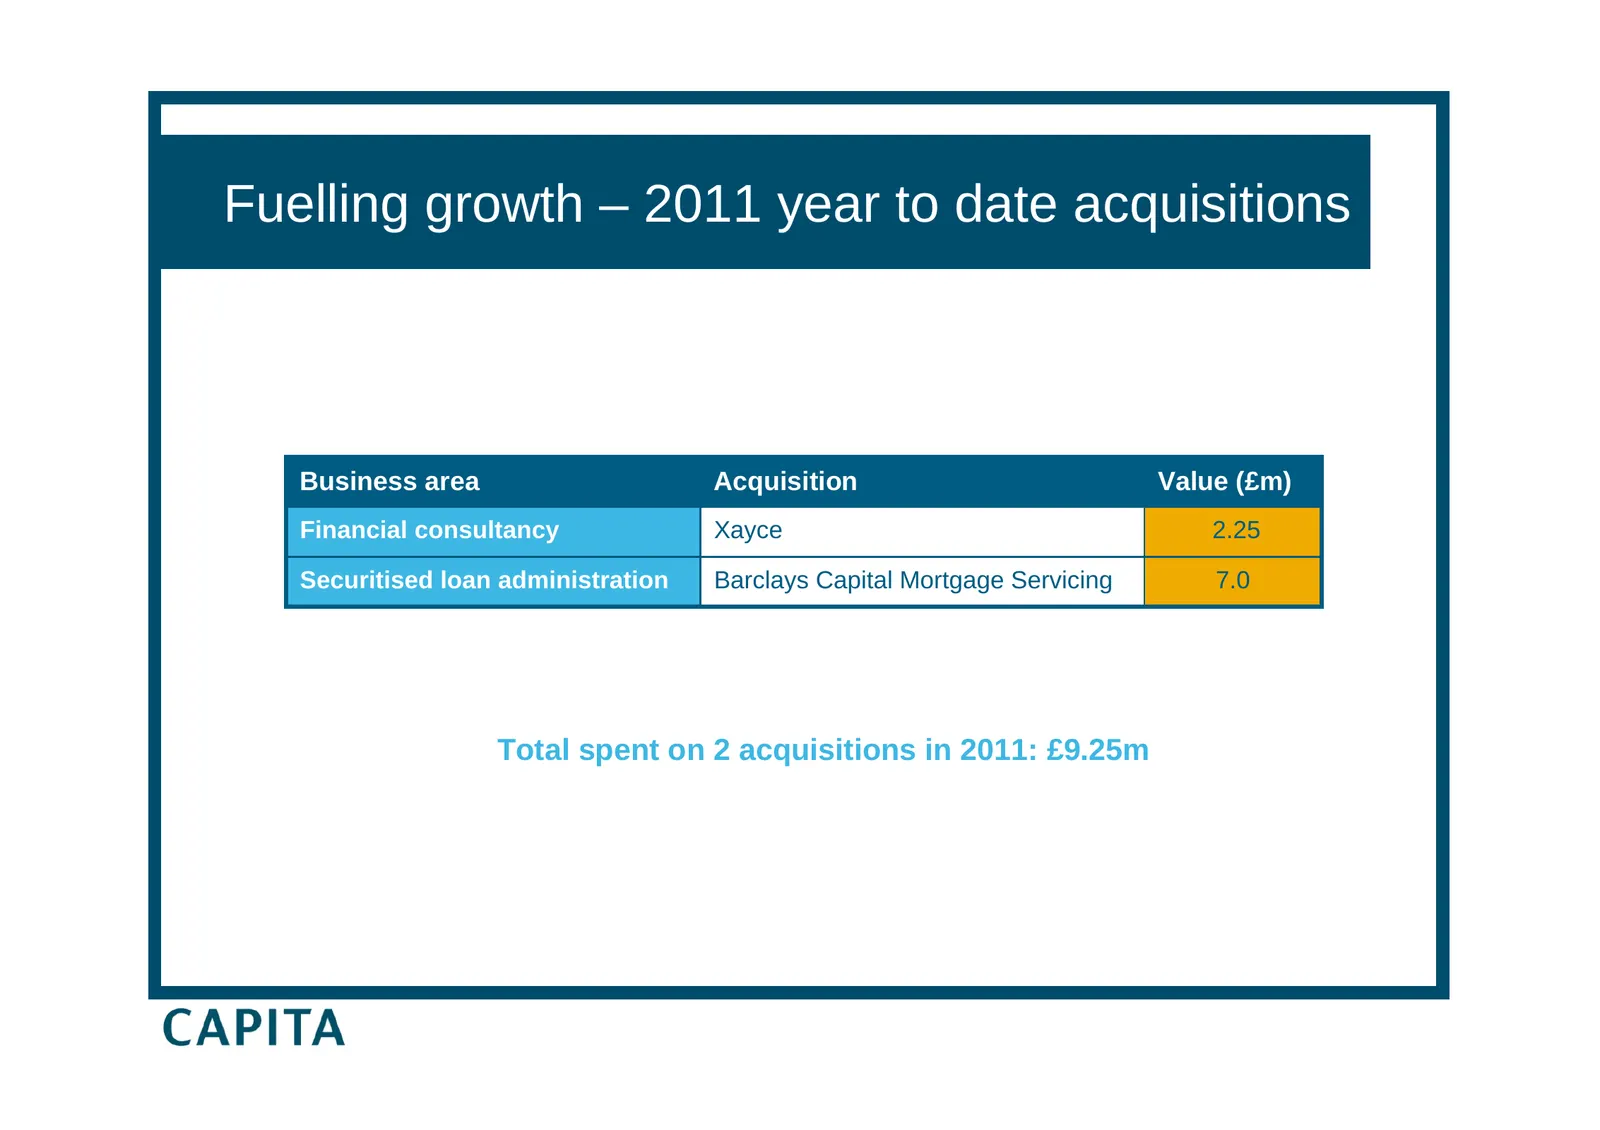
Fuelling growth – 2011 year to date acquisitions Business area Acquisition Value (£m) Financial consultancy Xayce 2.25 Securitised loan administration Barclays Capital Mortgage Servicing 7.0 Total spent on 2 acquisitions in 2011: £9.25m
Slide 36: Group organisational structure – 2010
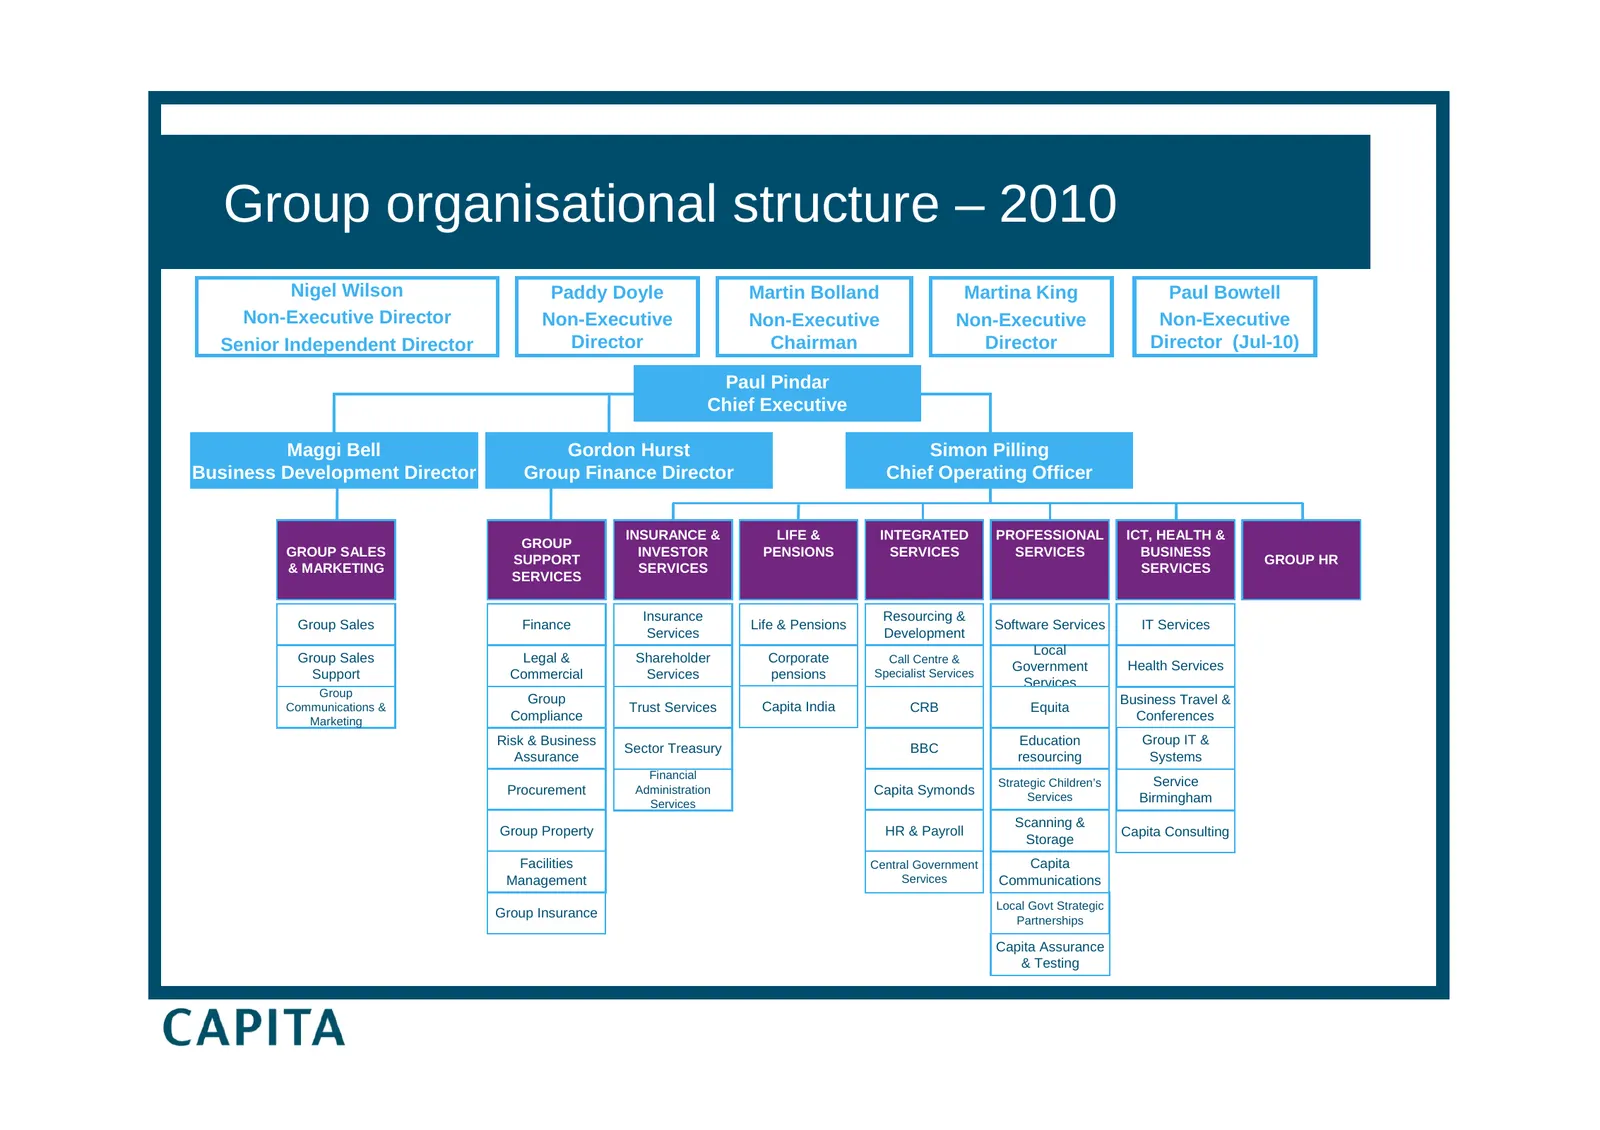
Group organisational structure – 2010 Nigel Wilson Paddy Doyle Martin Bolland Martina King Paul Bowtell Non-Executive Director Non-Executive Non-Executive Non-Executive Non-Executive Senior Independent Director Director Chairman Director Director (Jul-10) Paul Pindar Chief Executive Maggi Bell Gordo
Slide 37: Group organisational structure – current
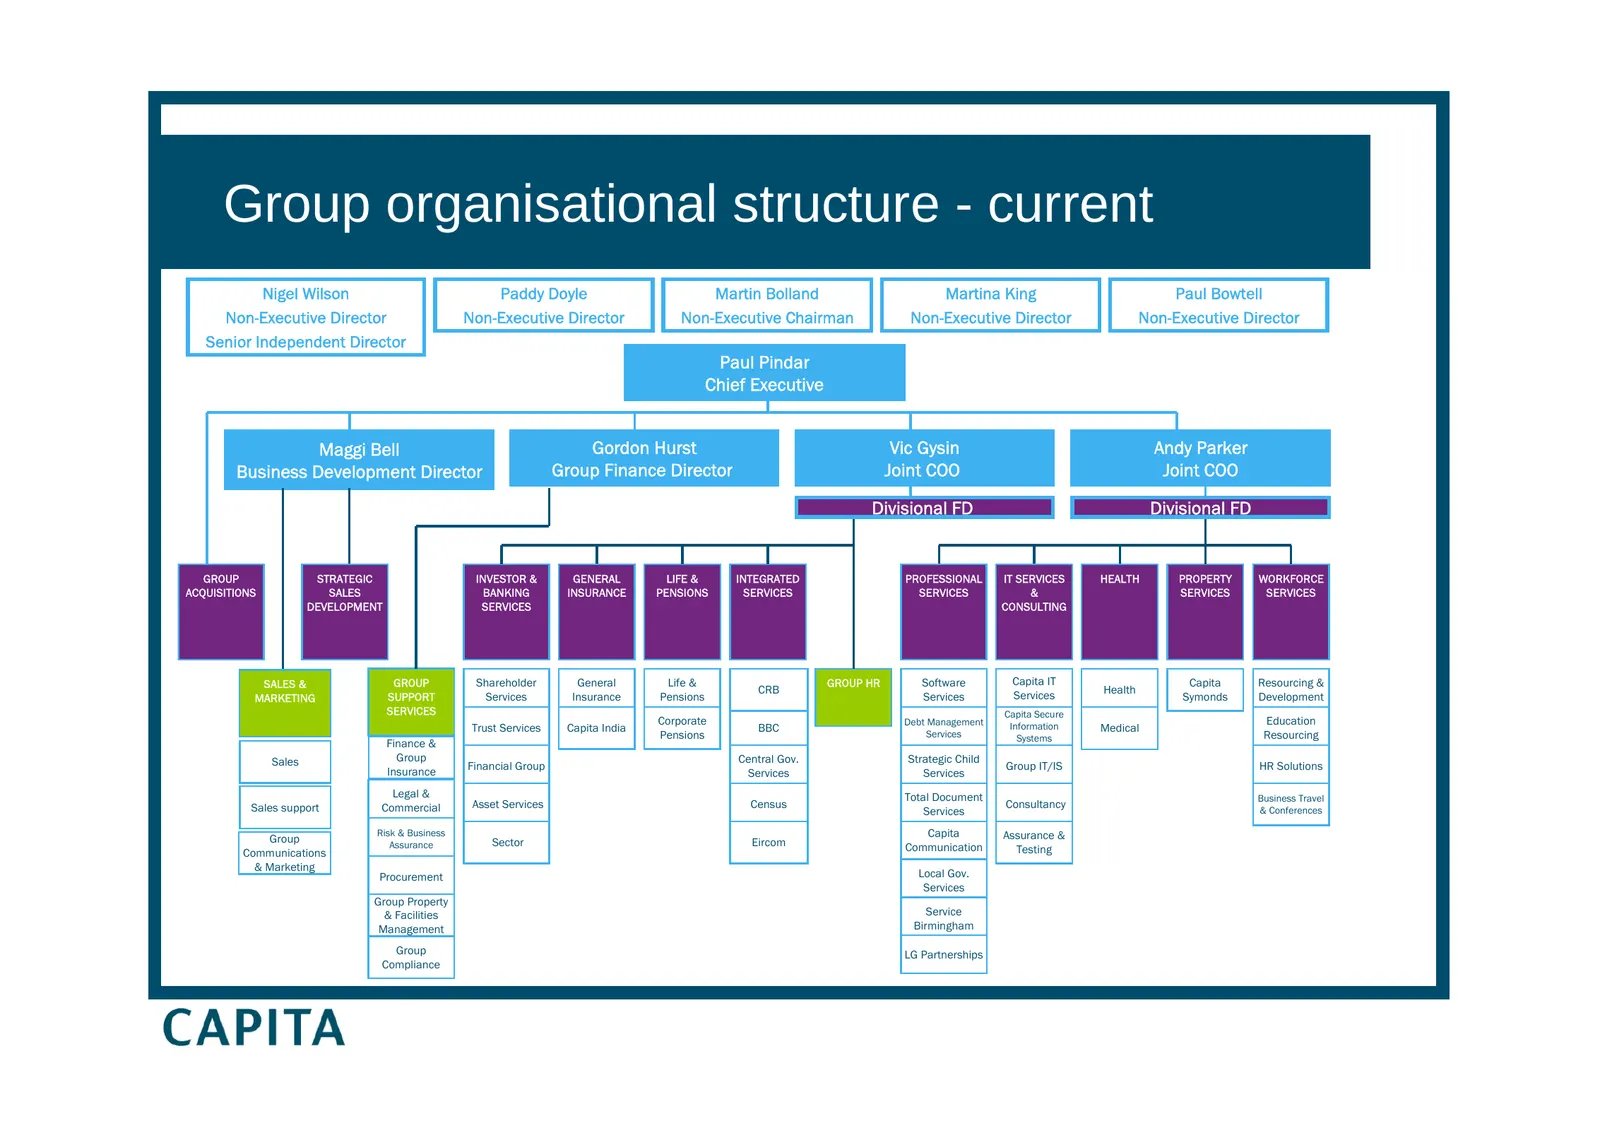
Group organisational structure - current Nigel Wilson Paddy Doyle Martin Bolland Martina King Paul Bowtell Non-Executive Director Non-Executive Director Non-Executive Chairman Non-Executive Director Non-Executive Director Senior Independent Director Paul Pindar Chief Executive Maggi Bell Gordon Hurs
Slide 38: Fuelling future growth
Fuelling future growth Maggi Bell Business Development Director
Slide 39: Fuelling future growth – UK BPO market
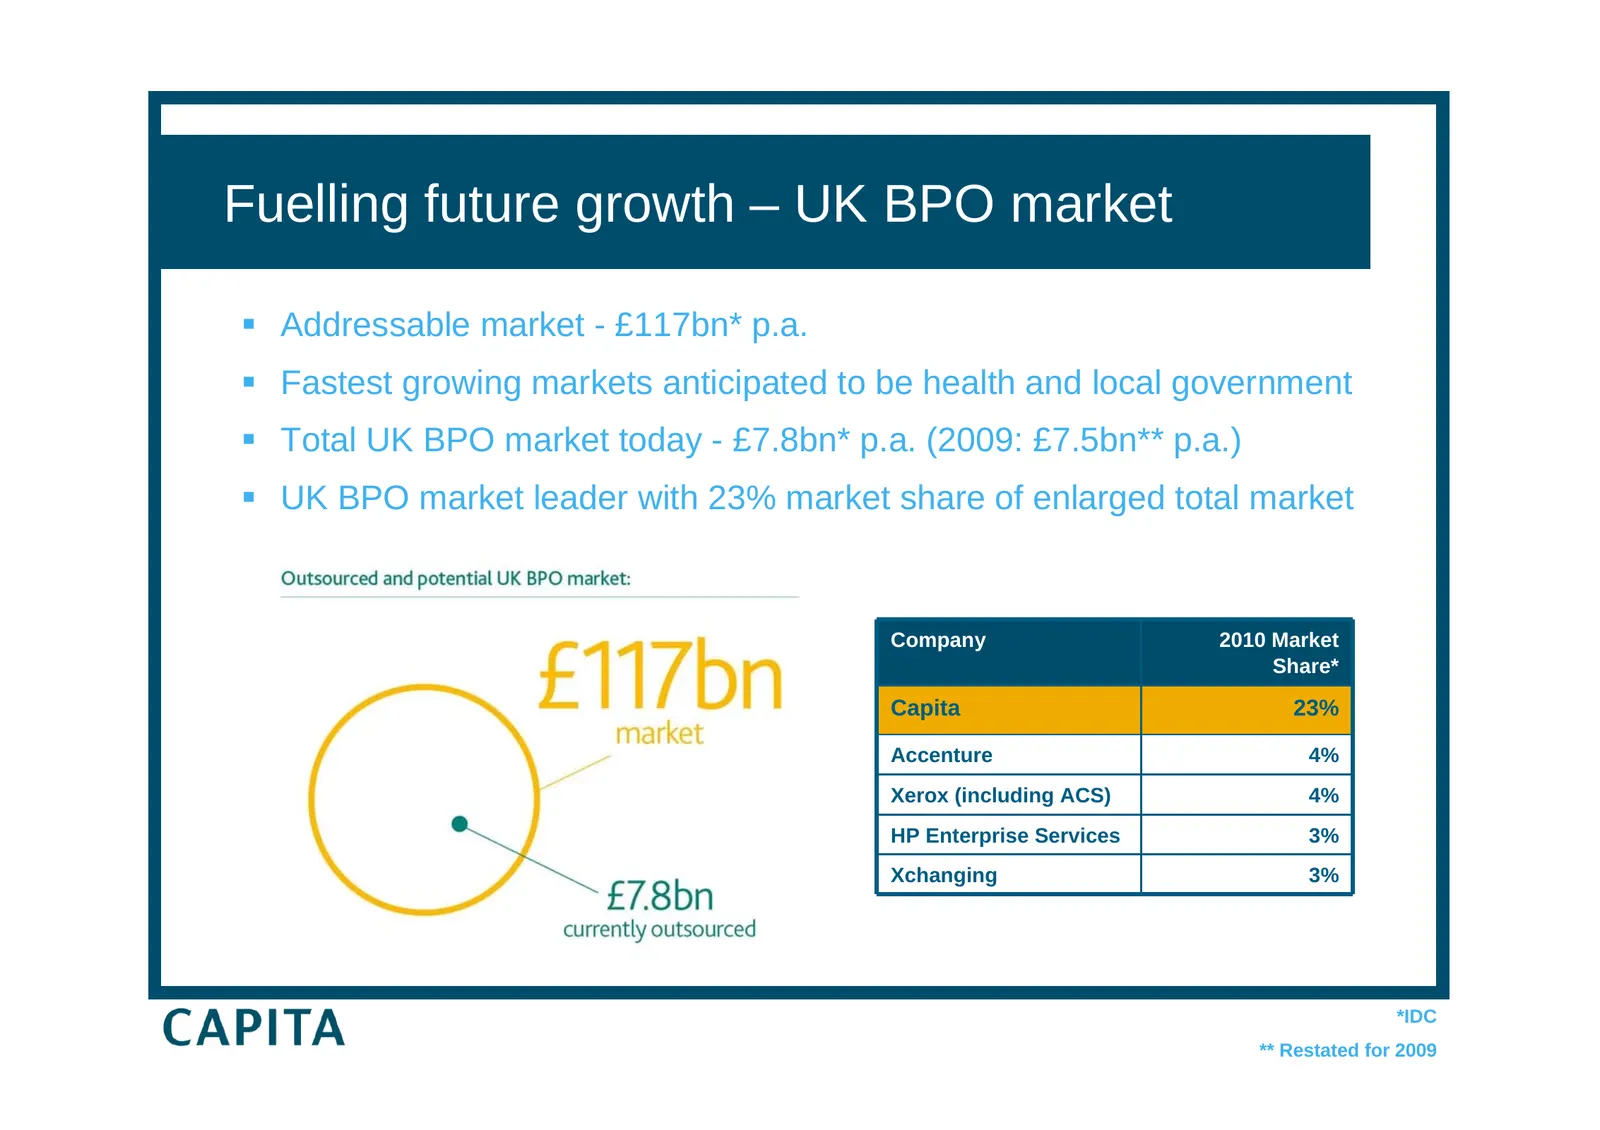
Fuelling future growth – UK BPO market Addressable market - £117bn* p.a. Fastest growing markets anticipated to be health and local government Total UK BPO market today - £7.8bn* p.a. (2009: £7.5bn** p.a.) UK BPO market leader with 23% market share of enlarged total market Company 2010 Marke
Slide 40: Fuelling growth – bid activity
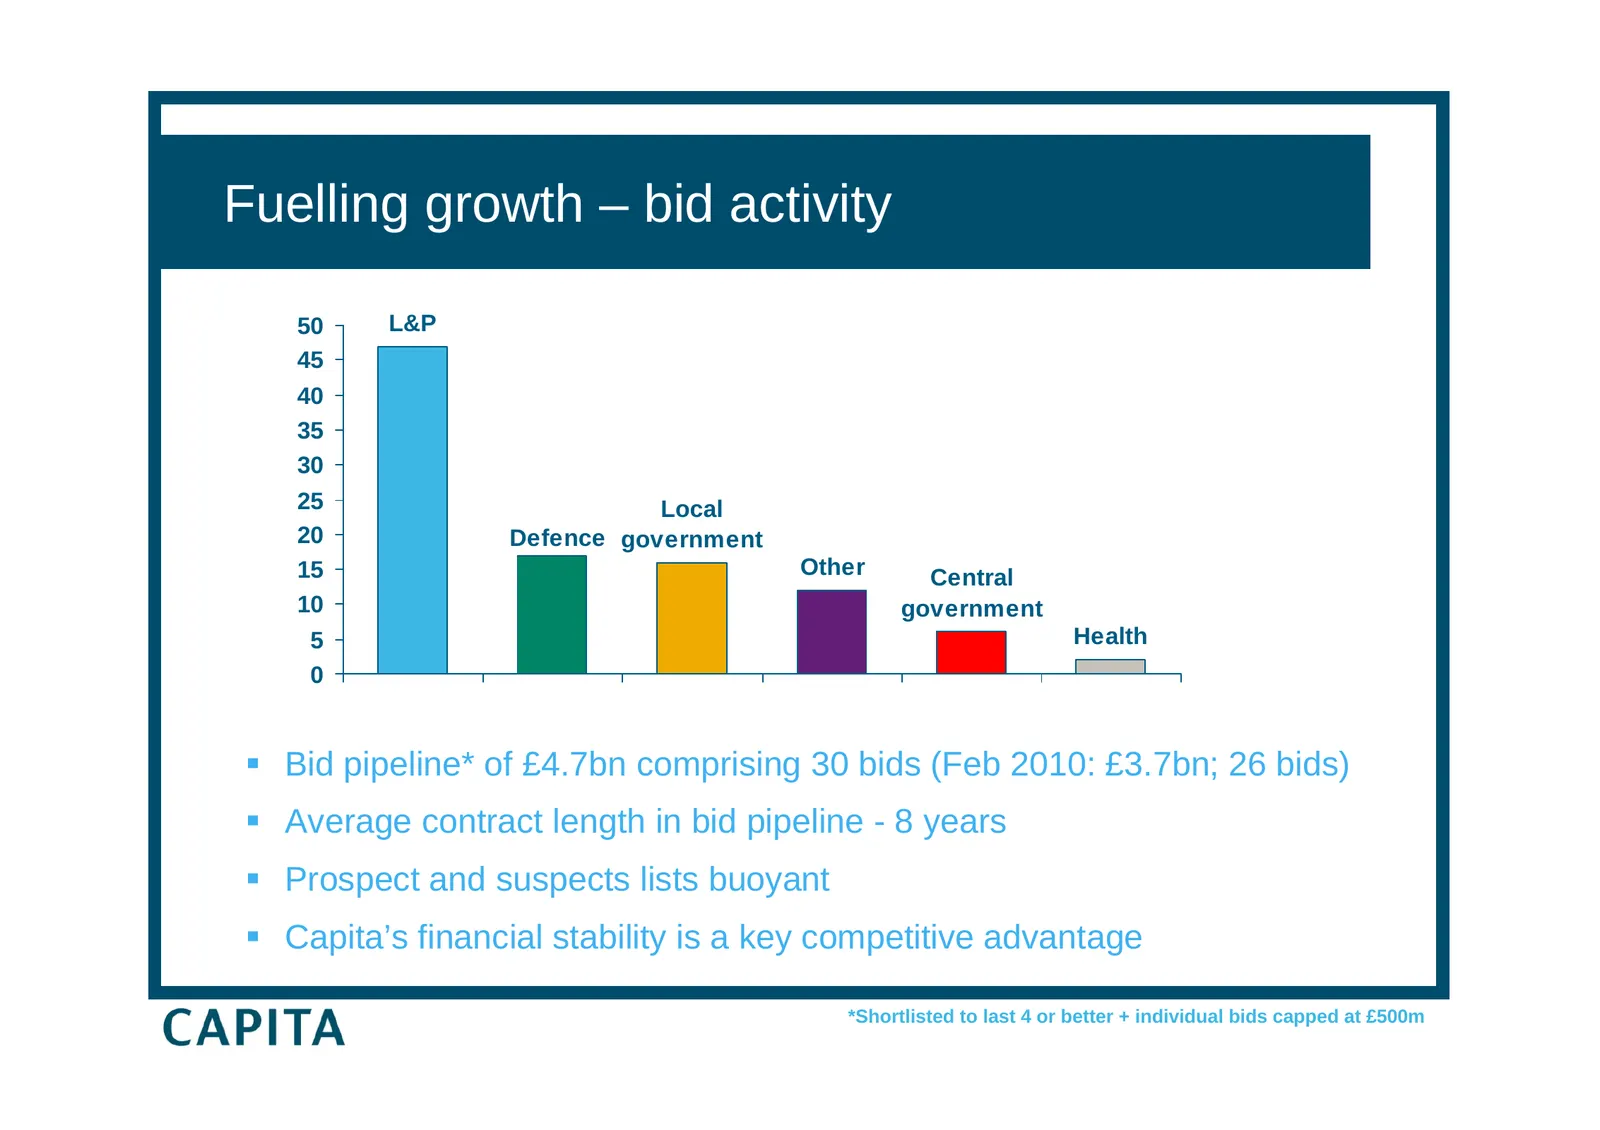
Fuelling growth – bid activity 50 L&P 45 40 35 30 25 Local 20 Defence government 15 Other Central 10 government 5 Health 0 Bid pipeline* of £4.7bn comprising 30 bids (Feb 2010: £3.7bn; 26 bids) Average contract length in bid pipeline - 8 years Prospect and suspects lists buoyant Capita’s fin
Slide 41: Fuelling future growth – central government
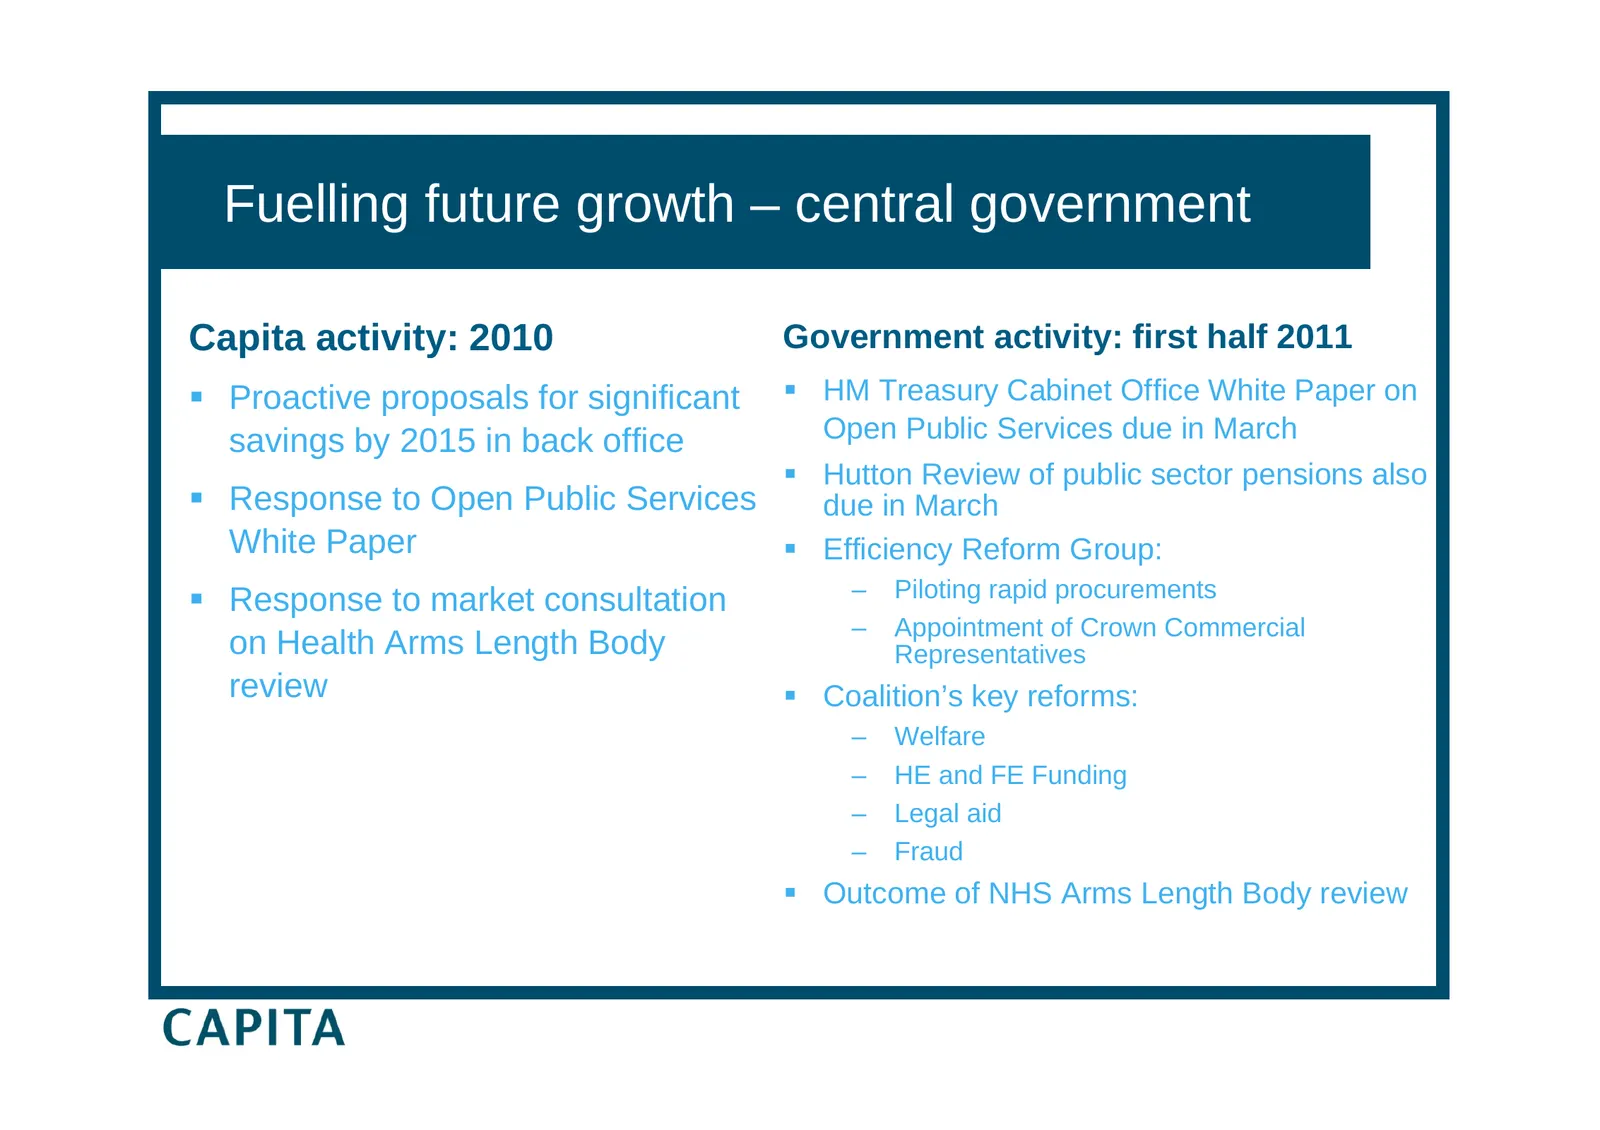
Fuelling future growth – central government Capita activity: 2010 Government activity: first half 2011 HM Treasury Cabinet Office White Paper on Proactive proposals for significant savings by 2015 in back office Open Public Services due in March Hutton Review of public sector pensions also R
Slide 42: Fuelling future growth – local government
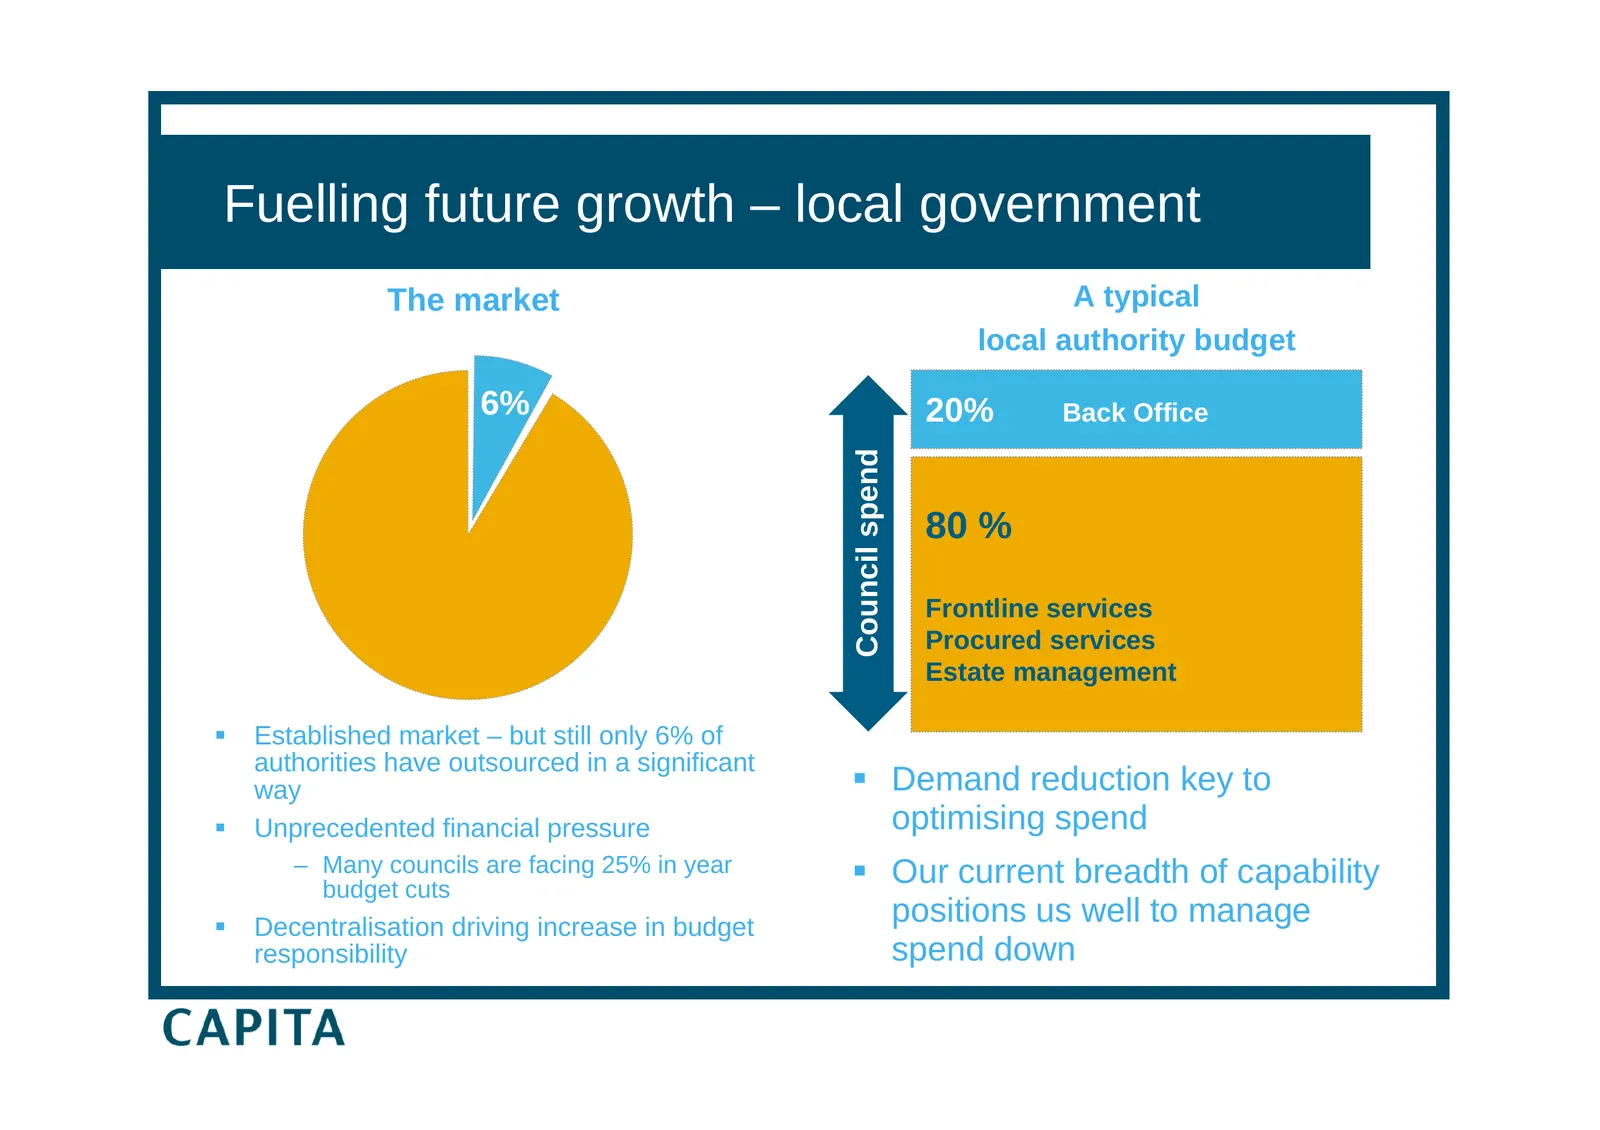
Fuelling future growth – local government The market A typical local authority budget 6% 20% Back Office Council spend 80 % Frontline services Procured services Estate management Established market – but still only 6% of authorities have outsourced in a significant way Demand reduction key to
Slide 43: Fuelling future growth – SunGard Public Sector Ltd
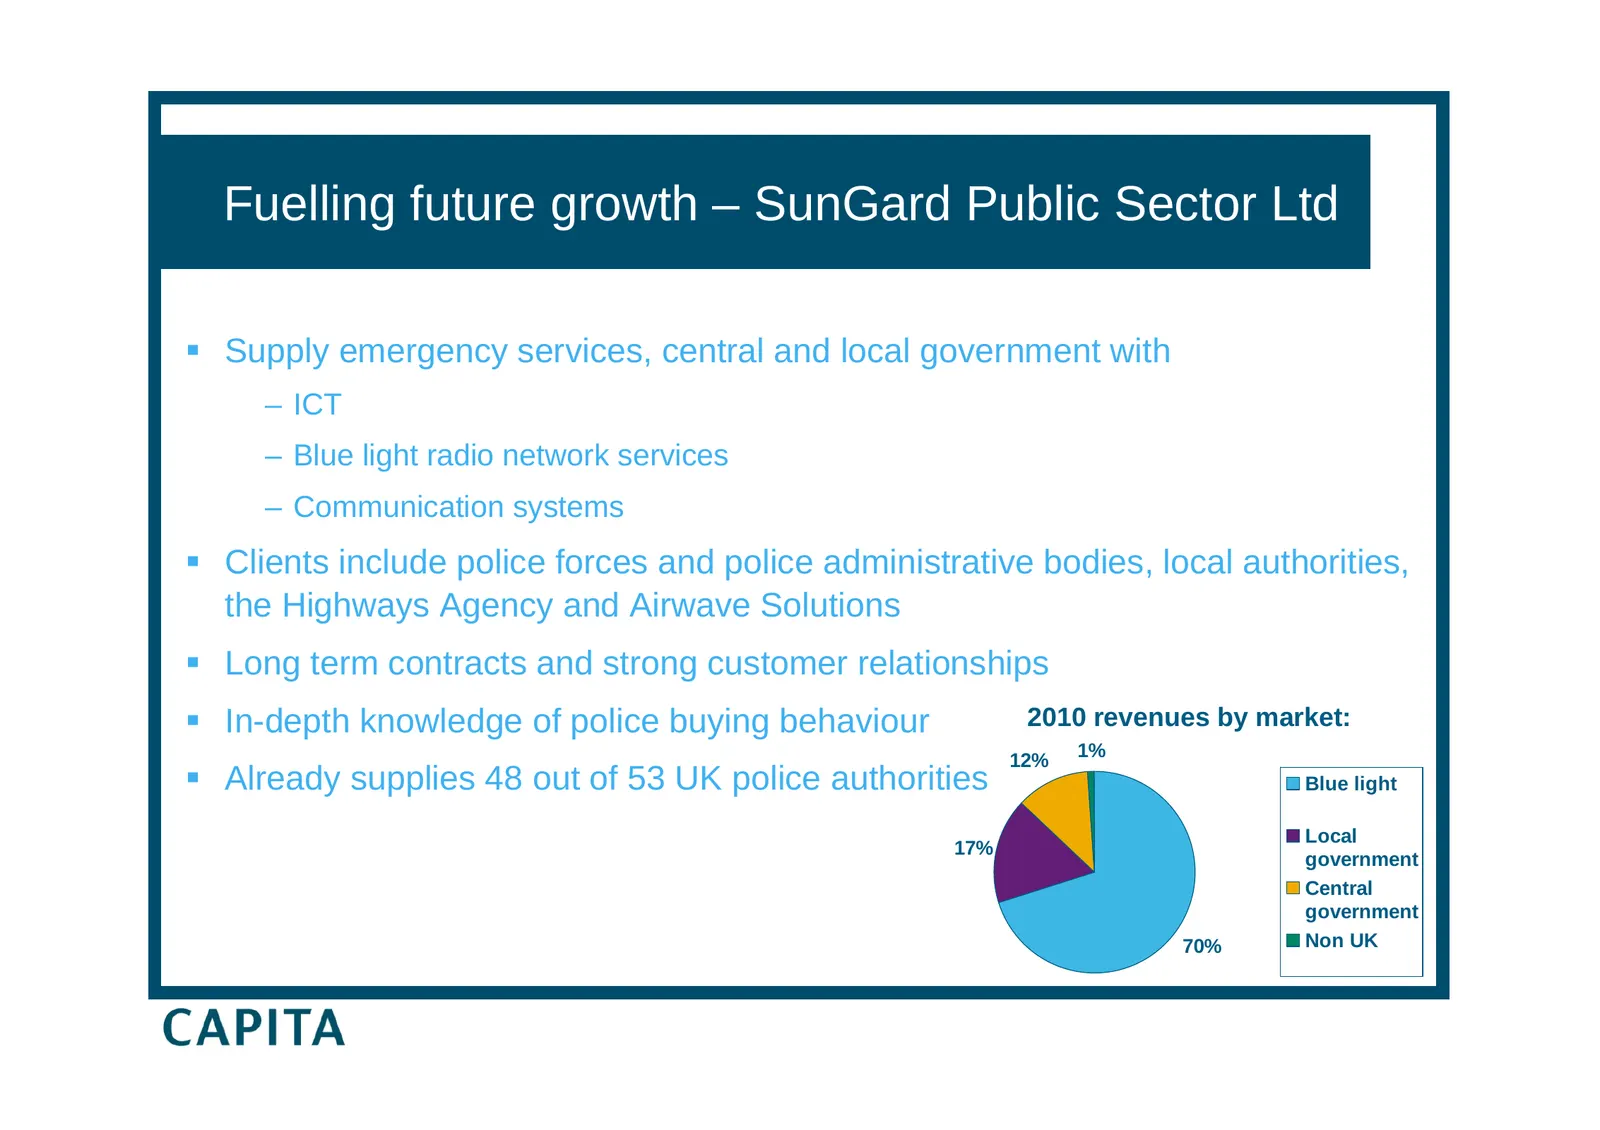
Fuelling future growth – SunGard Public Sector Ltd Supply emergency services, central and local government with – ICT – Blue light radio network services – Communication systems Clients include police forces and police administrative bodies, local authorities, the Highways Agency and Airwave Sol
Slide 44: Fuelling future growth – police
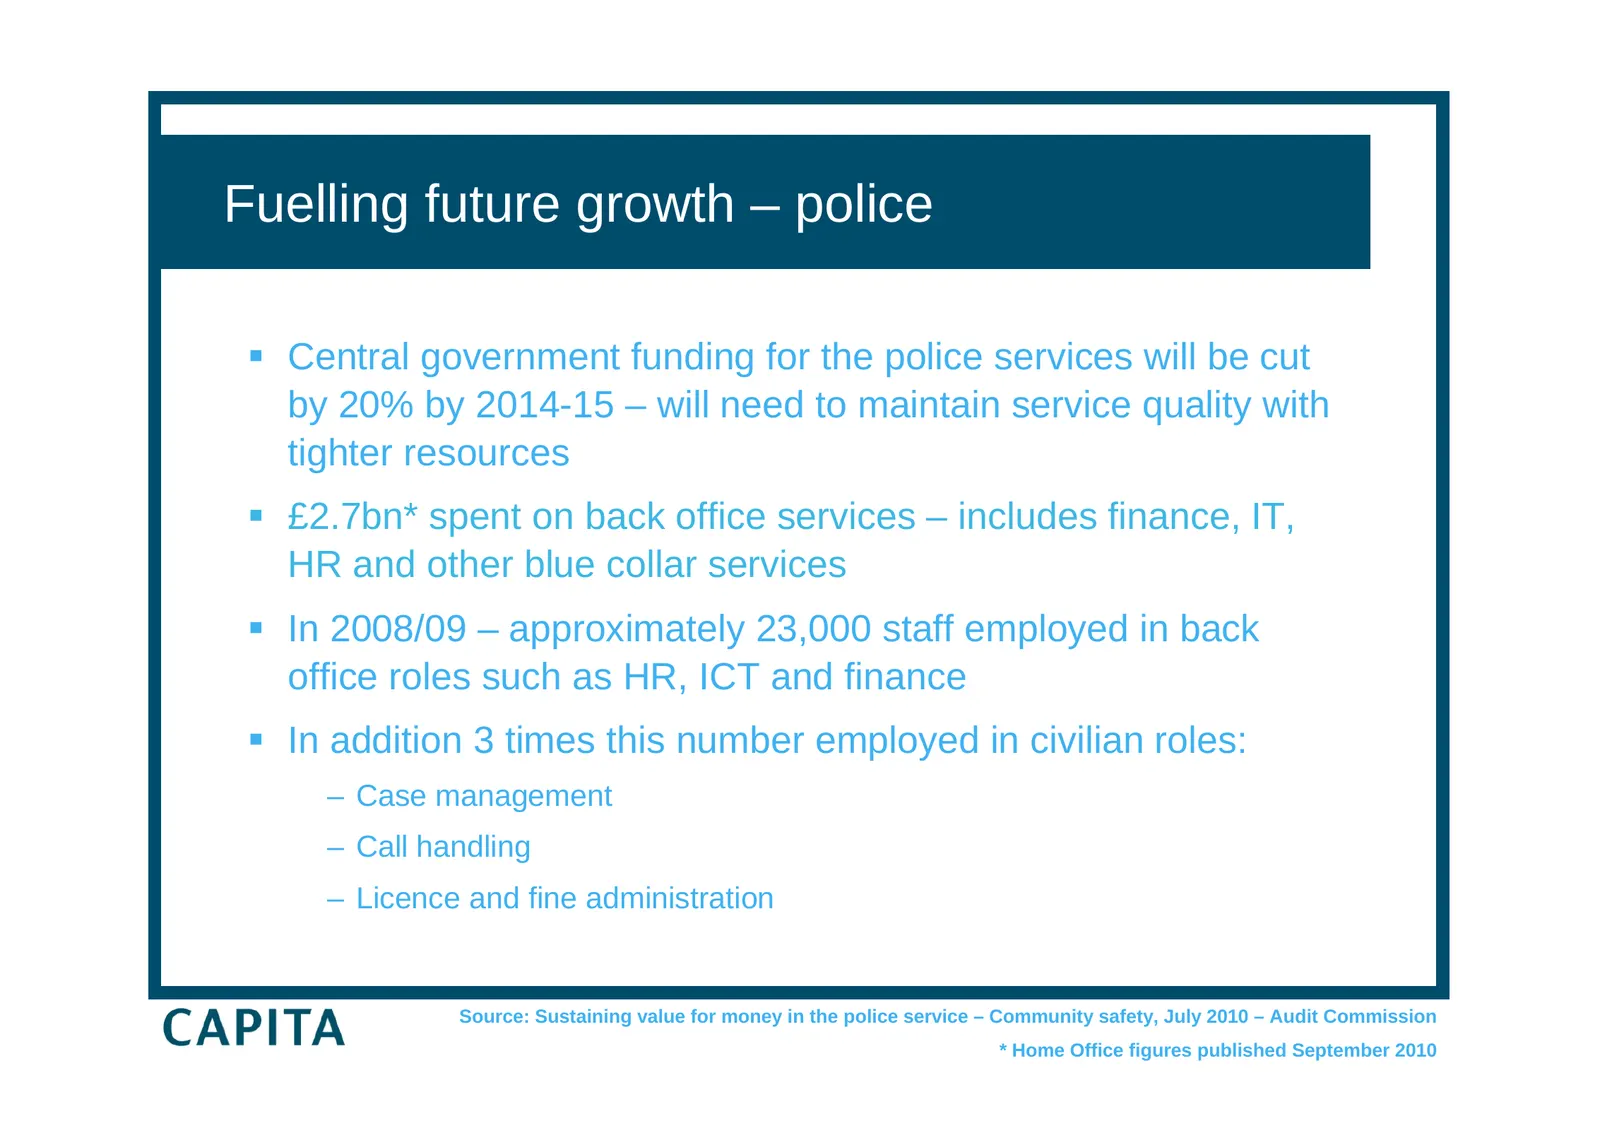
Fuelling future growth – police Central government funding for the police services will be cut by 20% by 2014-15 – will need to maintain service quality with tighter resources £2.7bn* spent on back office services – includes finance, IT, HR and other blue collar services In 2008/09 – approxima
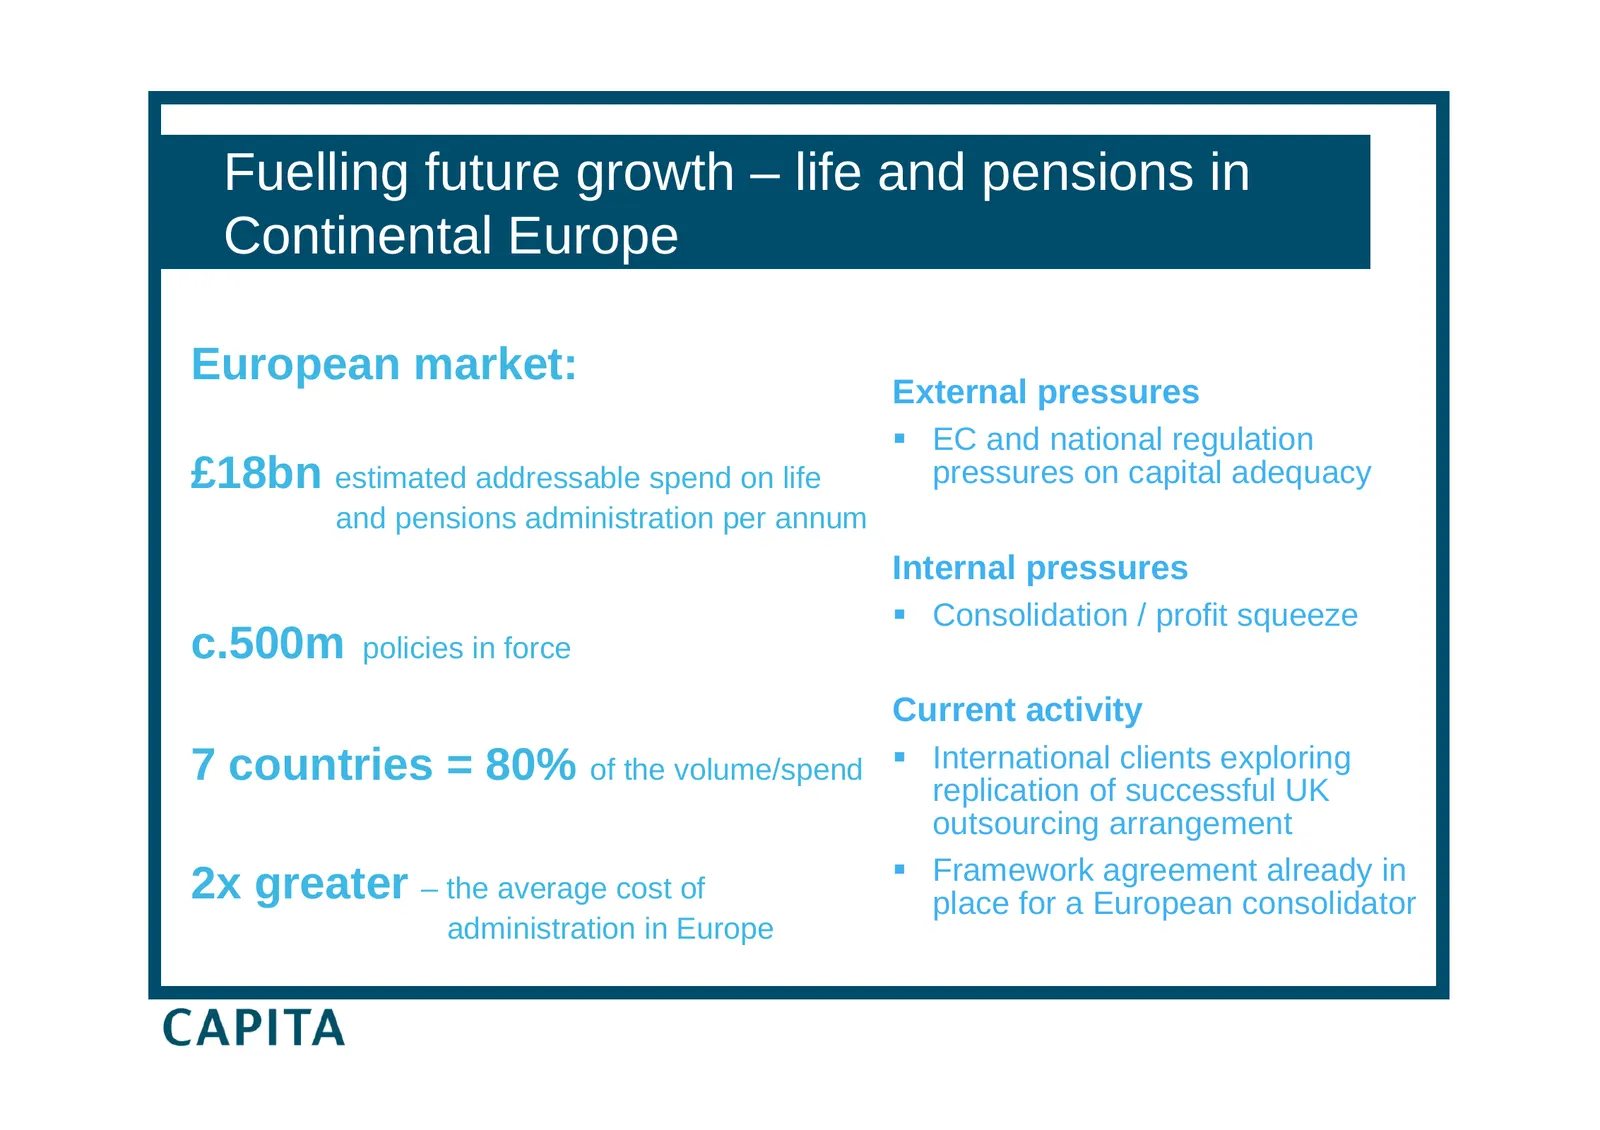
Slide 45: Fuelling future growth – life and pensions in Continental Europe
Fuelling future growth – life and pensions in Continental Europe European market: External pressures EC and national regulation £18bn estimated addressable spend on life pressures on capital adequacy and pensions administration per annum £18bn* Internal pressures Consolidation / profit squeeze c
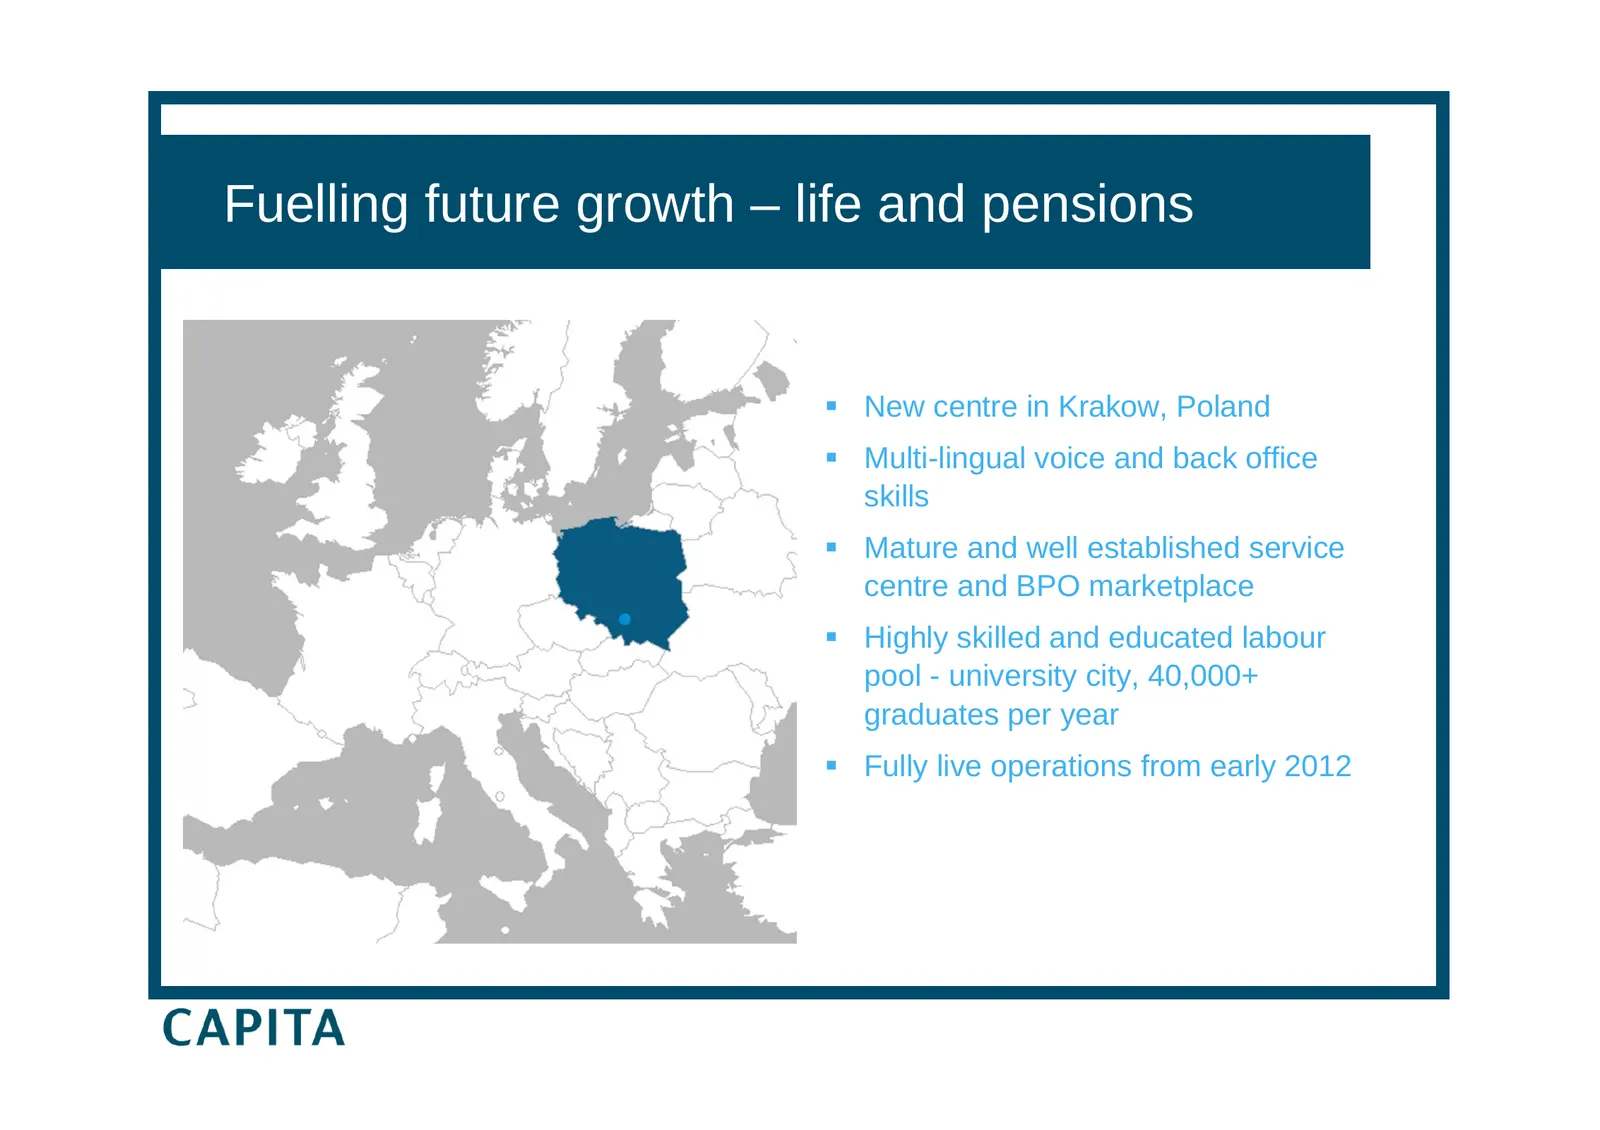
Slide 46: Fuelling future growth – life and pensions
Fuelling future growth – life and pensions New centre in Krakow, Poland Multi-lingual voice and back office skills Mature and well established service centre and BPO marketplace Highly skilled and educated labour pool - university city, 40,000+ graduates per year Fully live operations from
Slide 47: Prospects
Prospects Paul Pindar Chief Executive
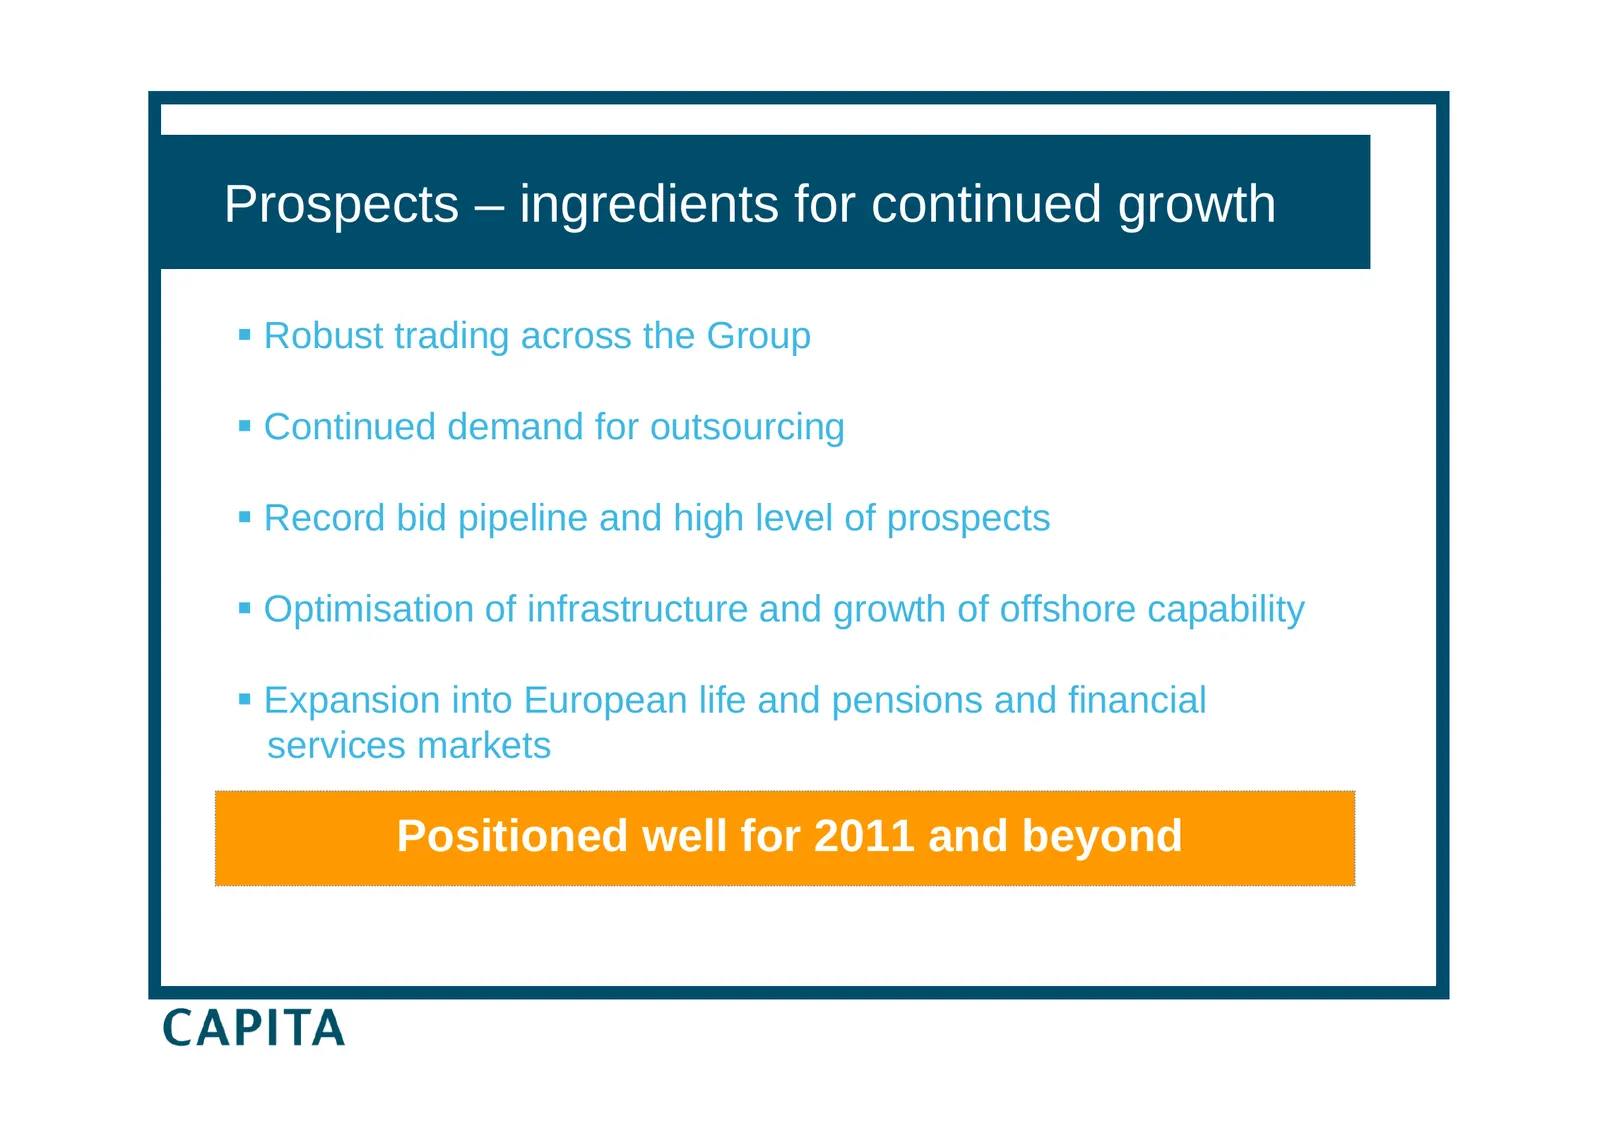
Slide 48: Prospects – ingredients for continued growth
Prospects – ingredients for continued growth Robust trading across the Group Continued demand for outsourcing Record bid pipeline and high level of prospects Optimisation of infrastructure and growth of offshore capability Expansion into European life and pensions and financial services ma
Slide 49: Results for the year ended 31 December 2010
Results for the year ended 31 December 2010
Source: Internet Archive copy of capita.com
More decks from Capita plc
 H1 2026 Earnings Presentation44 slides · Aug 4, 2026
 FY2025 Earnings Presentation46 slides · March 2026
 Merger or Acquisition (March 2026)10 slides · March 2026
 H1 2025 Earnings Presentation51 slides · August 2025
 FY2024 Earnings Presentation44 slides · March 2025
 H1 2024 Earnings Presentation33 slides · Aug 1, 2024