PT Sarana Menara Nusantara Tbk · IDX:TOWR
PT Sarana Menara Nusantara Tbk — Q4 2015 Earnings Presentation
17 slides from PT Sarana Menara Nusantara Tbk's earnings presentation, Dec 24, 2016
Slide 1: Indonesia's Premier Tower Company: 4Q 2015 Results Presentation
PROTELINDO PT. SARANA MENARA NUSANTARA, TBK. (TOWR) Indonesia’s Premier Tower Company 4Q 2015 Results Presentation
Slide 2: Disclaimer
Disclaimer These materials have been prepared by PT Sarana Menara Nusantara, Tbk. (the “Company”) and have not been independently verified. No representation or warranty, expressed or implied, is made and no reliance should be placed on the accuracy, fairness or completeness of the information prese
Slide 3: Agenda
Agenda Financial Results Operational Performance 2015 Guidance and Results Achievements and Subsequent Events Change in Accounting Policy 2
Slide 4: Full Year Financial Results: Revenue
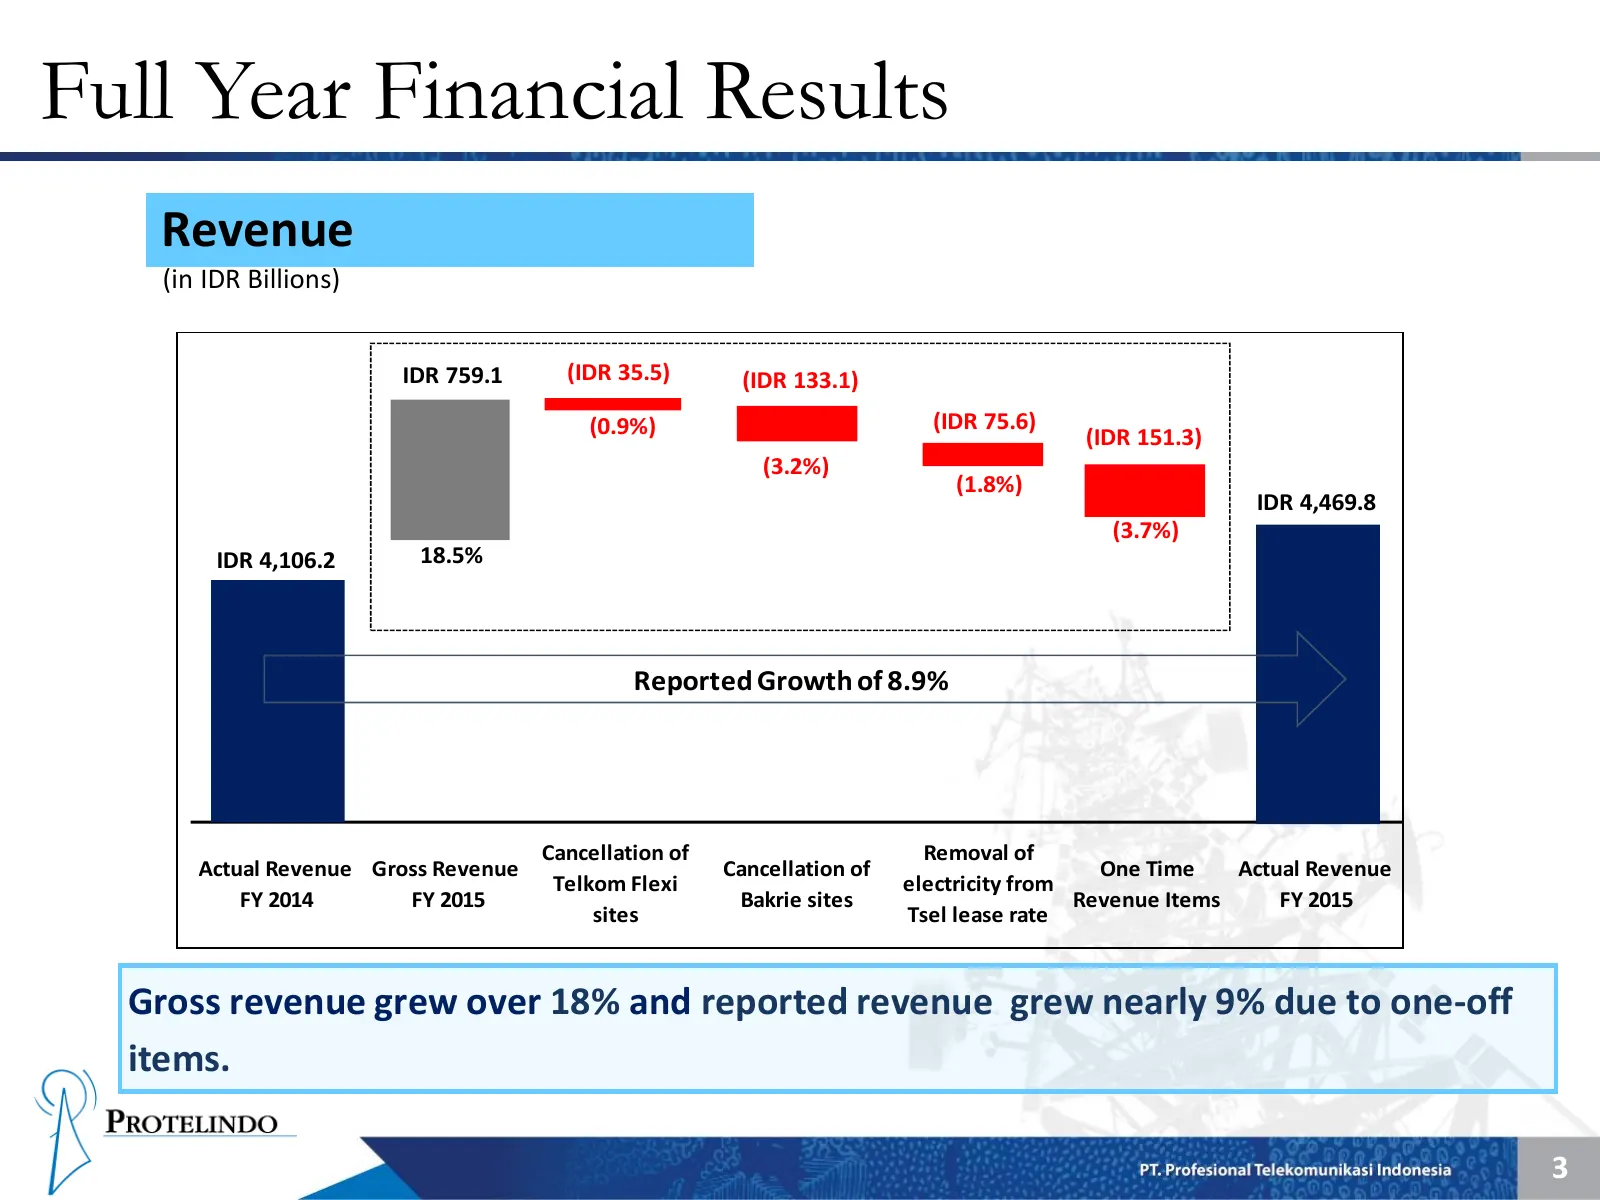
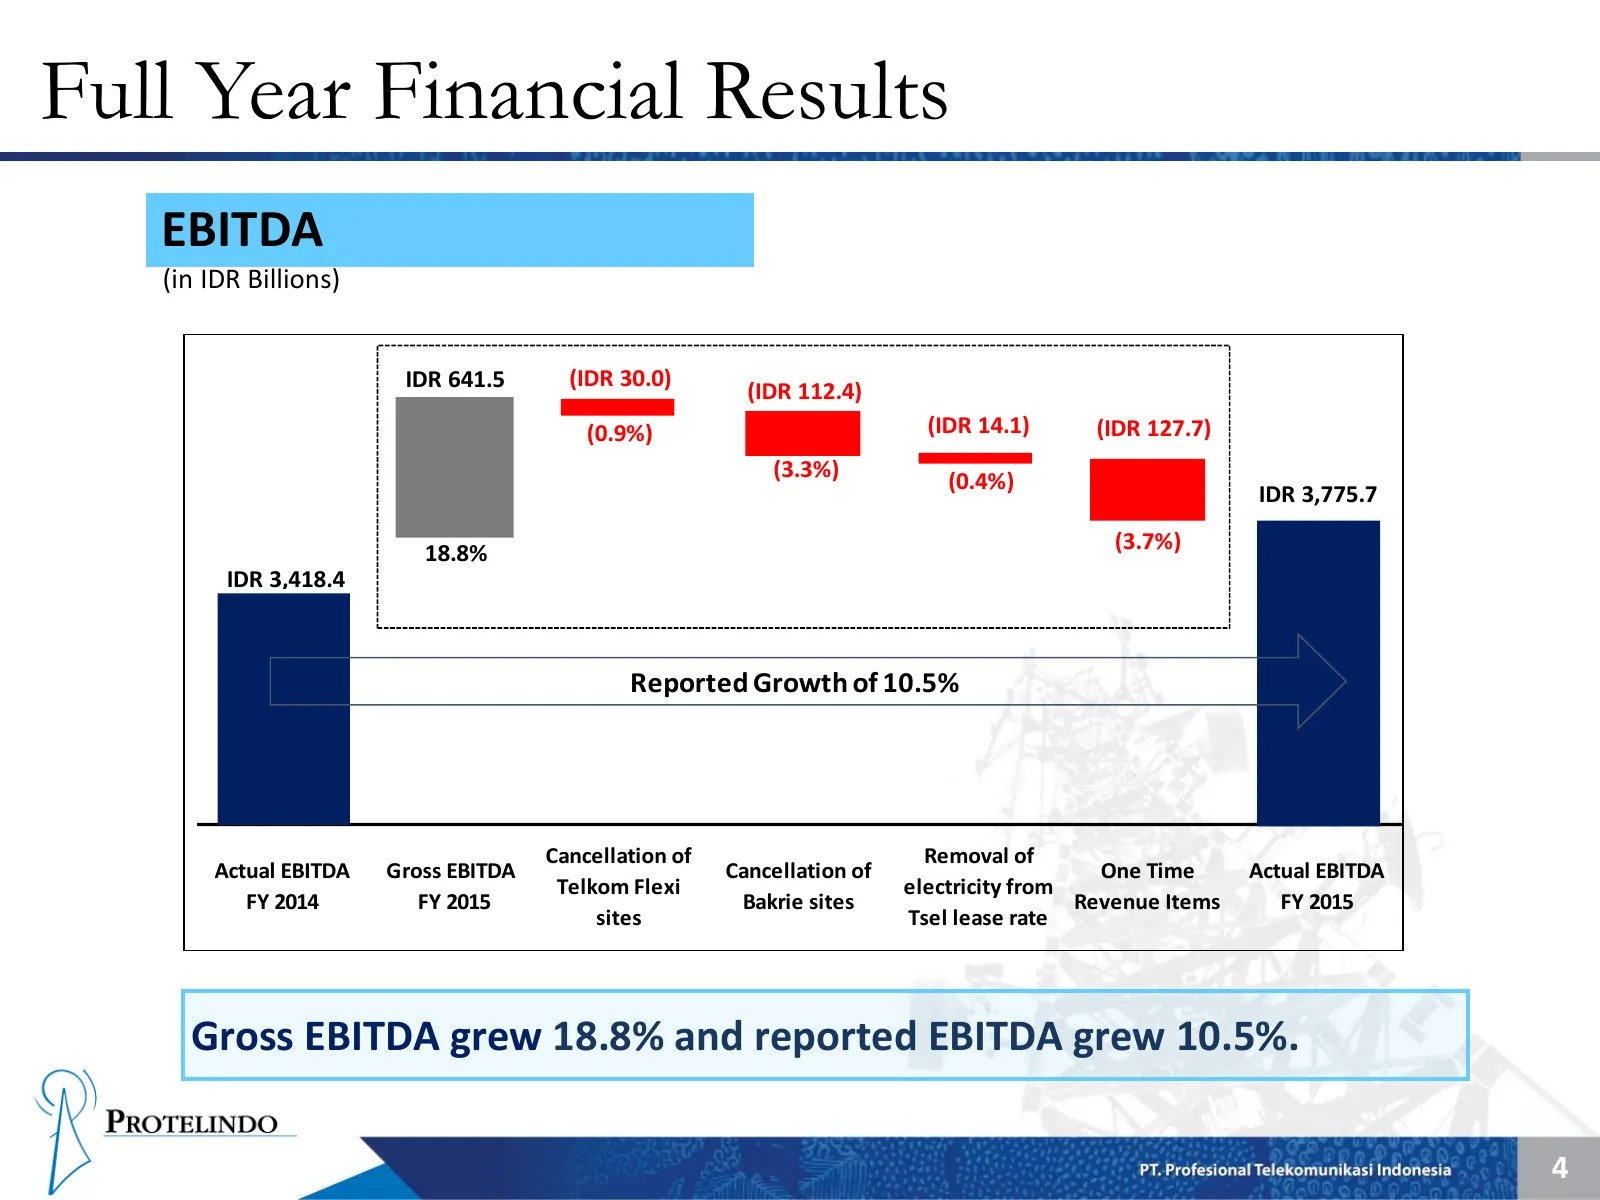
Full Year Financial Results Revenue (in IDR Billions) IDR 759.1 (IDR 35.5) (IDR 133.1) (0.9%) (IDR 75.6) (IDR 151.3) (3.2%) (1.8%) IDR 4,469.8 (3.7%) IDR 4,106.2 18.5% Reported Growth of 8.9% Cancellation of Removal of Actual Revenue Gross Revenue Cancellation of One Time Actual Revenue Telkom Flexi
Slide 5: Full Year Financial Results: EBITDA
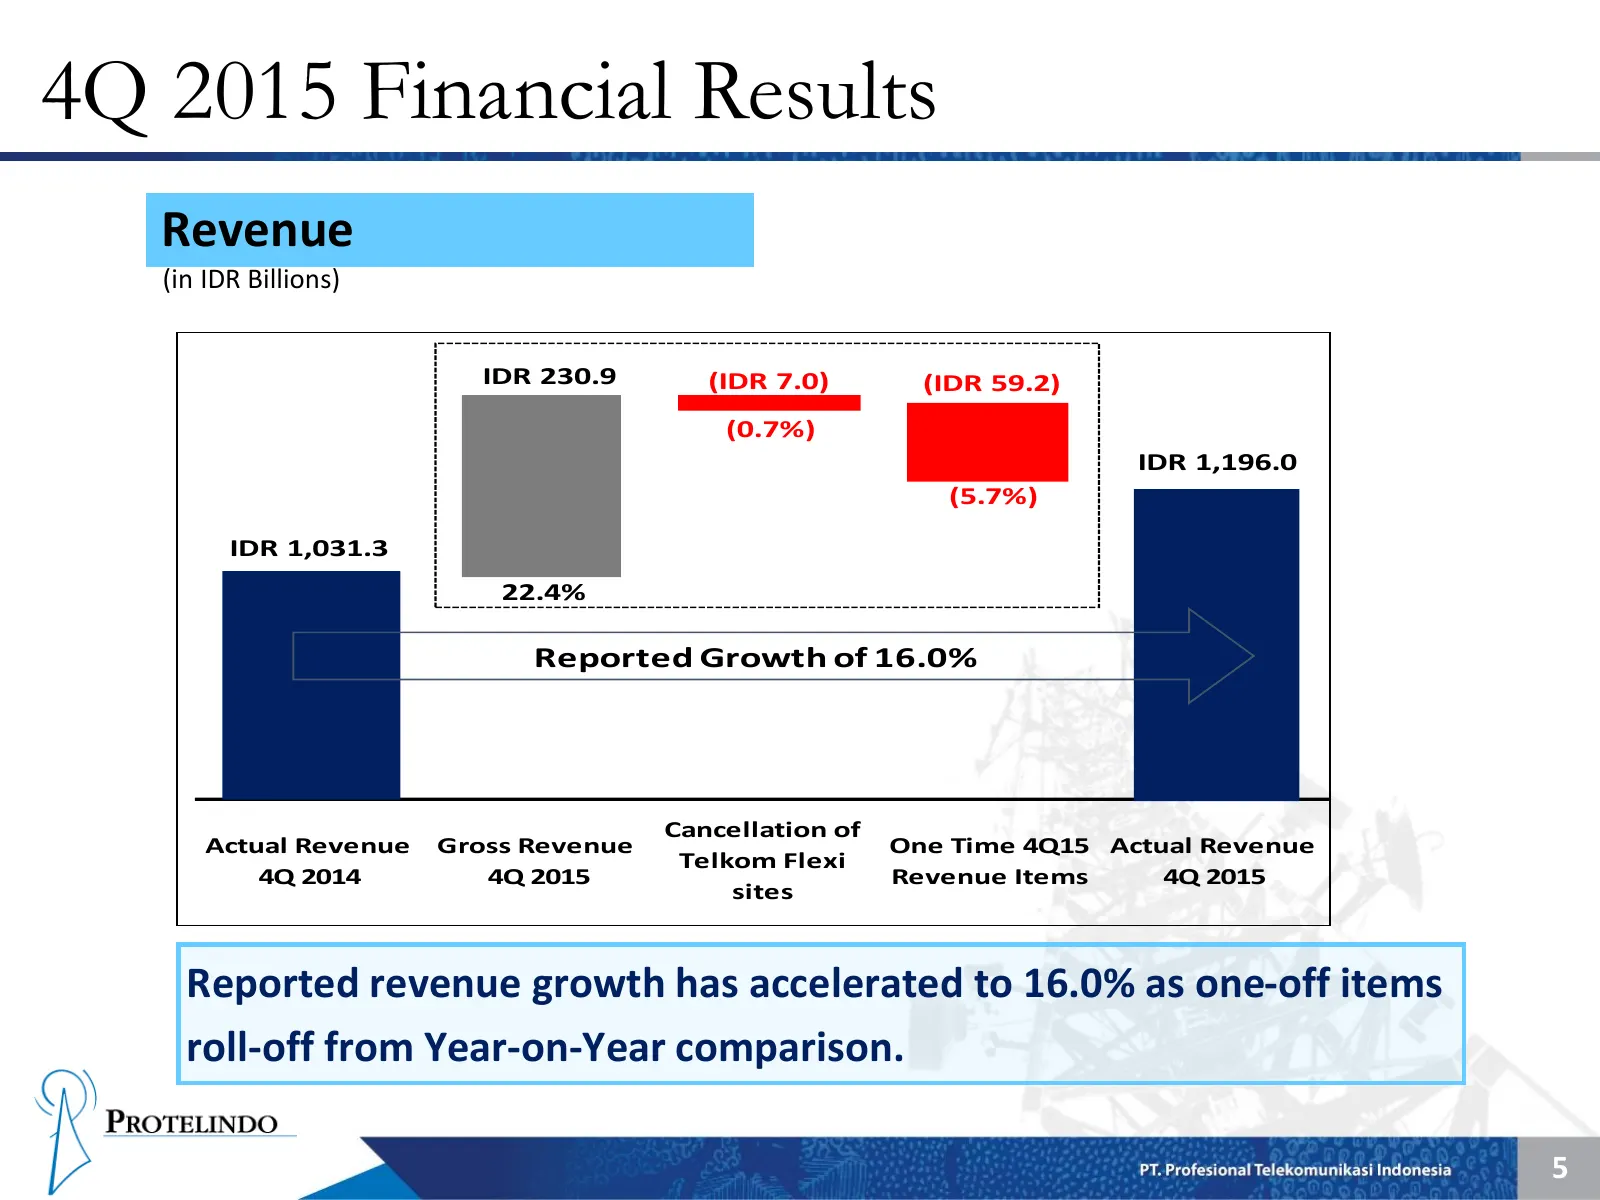
Full Year Financial Results EBITDA (in IDR Billions) 6 IDR 641.5 (IDR 30.0) (IDR 112.4) (0.9%) (IDR 14.1) (IDR 127.7) (3.3%) (0.4%) IDR 3,775.7 18.8% (3.7%) IDR 3,418.4 Reported Growth of 10.5% Cancellation of Removal of Actual EBITDA Gross EBITDA Cancellation of One Time Actual EBITDA Telkom Flexi
Slide 6: 4Q 2015 Financial Results: Revenue
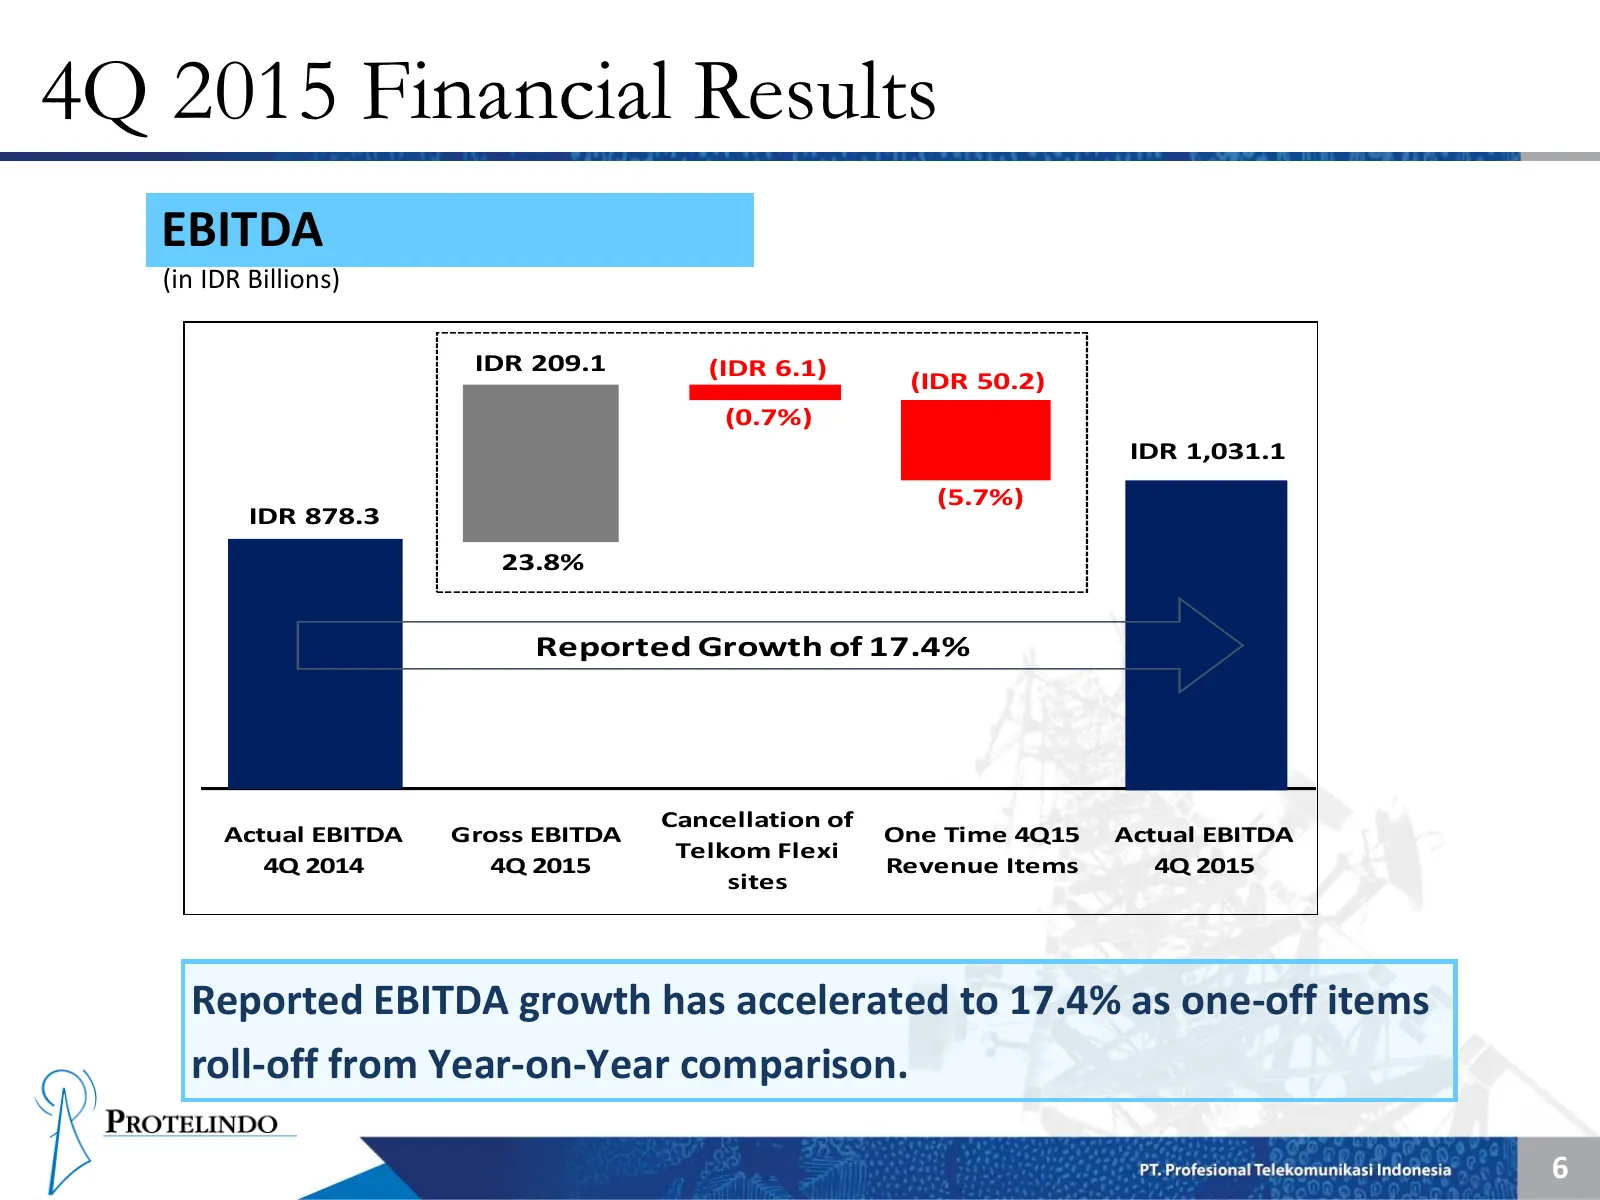
4Q 2015 Financial Results Revenue (in IDR Billions) IDR 230.9 (IDR 7.0) (IDR 59.2) (0.7%) IDR 1,196.0 (5.7%) IDR 1,031.3 22.4% Reported Growth of 16.0% Cancellation of Actual Revenue Gross Revenue One Time 4Q15 Actual Revenue Telkom Flexi 4Q 2014 4Q 2015 Revenue Items 4Q 2015 sites Reported revenue
Slide 7: 4Q 2015 Financial Results: EBITDA
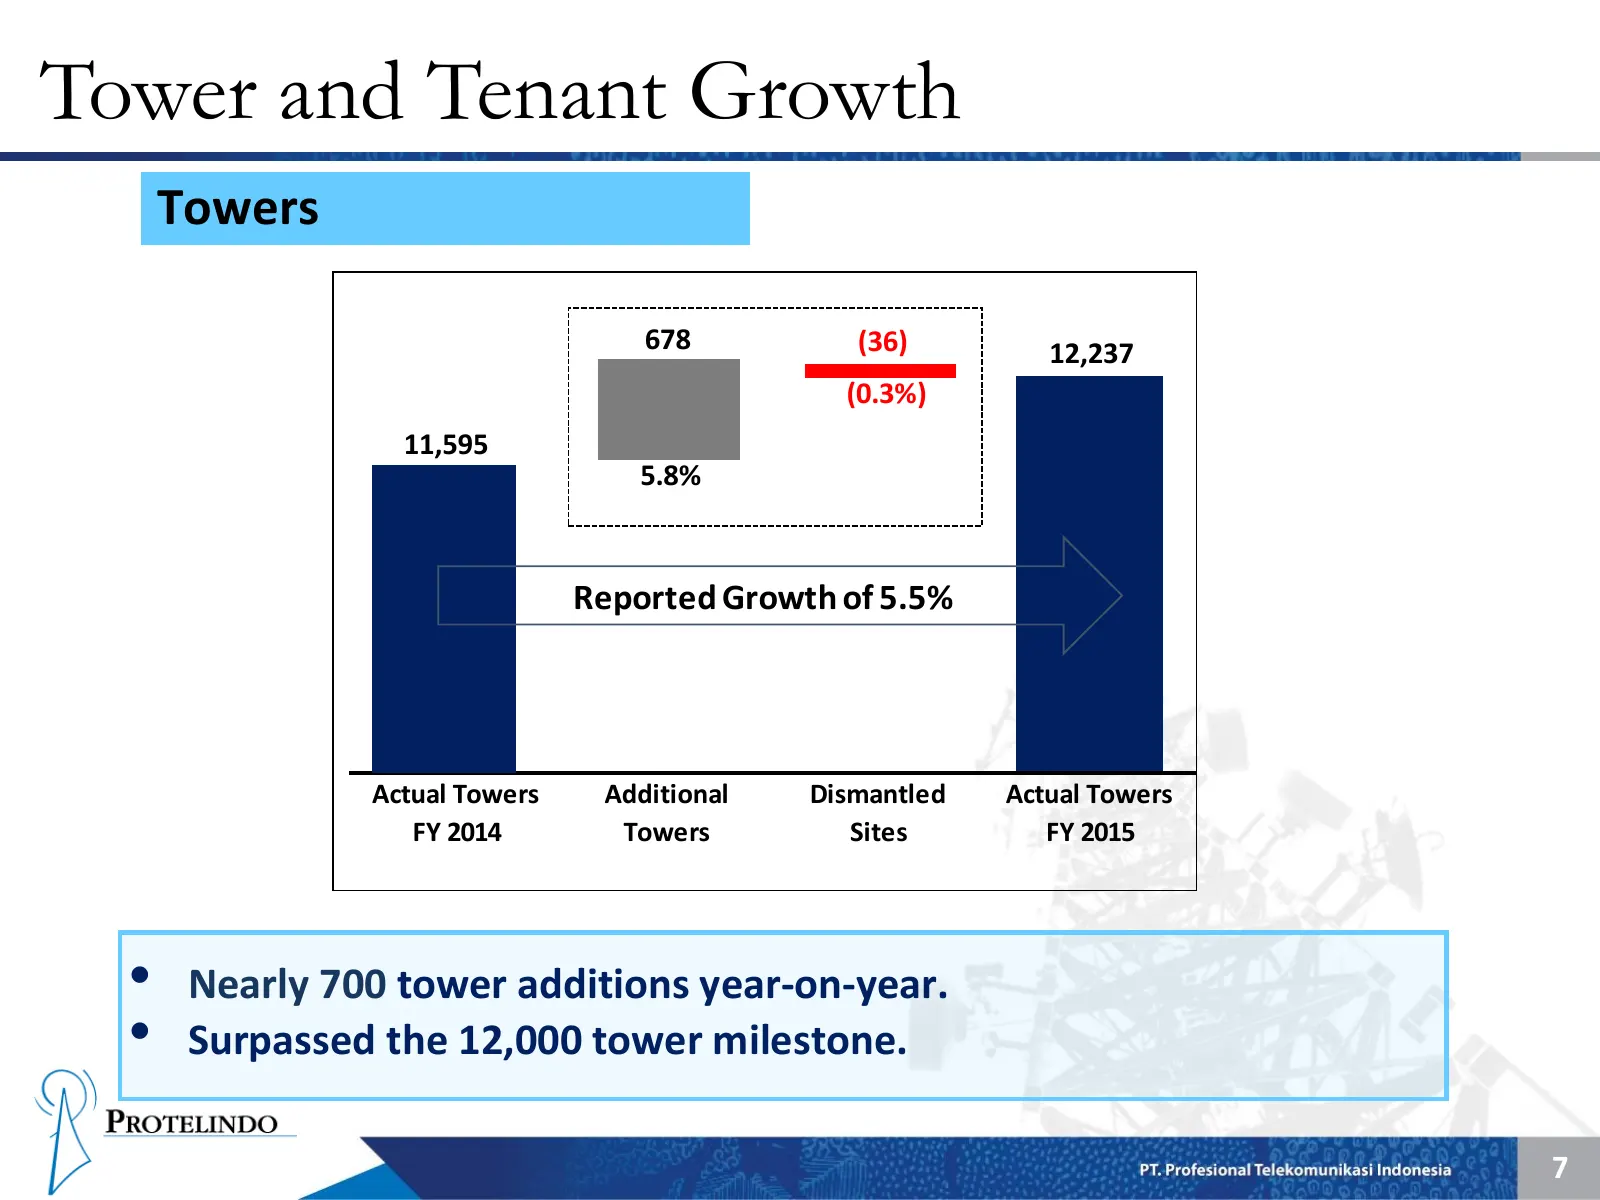
4Q 2015 Financial Results EBITDA (in IDR Billions) 6 IDR 209.1 (IDR 6.1) (IDR 50.2) (0.7%) IDR 1,031.1 (5.7%) IDR 878.3 23.8% Reported Growth of 17.4% Cancellation of Actual EBITDA Gross EBITDA One Time 4Q15 Actual EBITDA Telkom Flexi 4Q 2014 4Q 2015 Revenue Items 4Q 2015 sites Reported EBITDA growt
Slide 8: Tower and Tenant Growth: Towers
Tower and Tenant Growth Towers 678 (36) 12,237 (0.3%) 11,595 5.8% Reported Growth of 5.5% Actual Towers Additional Dismantled Actual Towers FY 2014 Towers Sites FY 2015 • Nearly 700 tower additions year-on-year. • Surpassed the 12,000 tower milestone. 7
Slide 9: Tower and Tenant Growth: Tenants
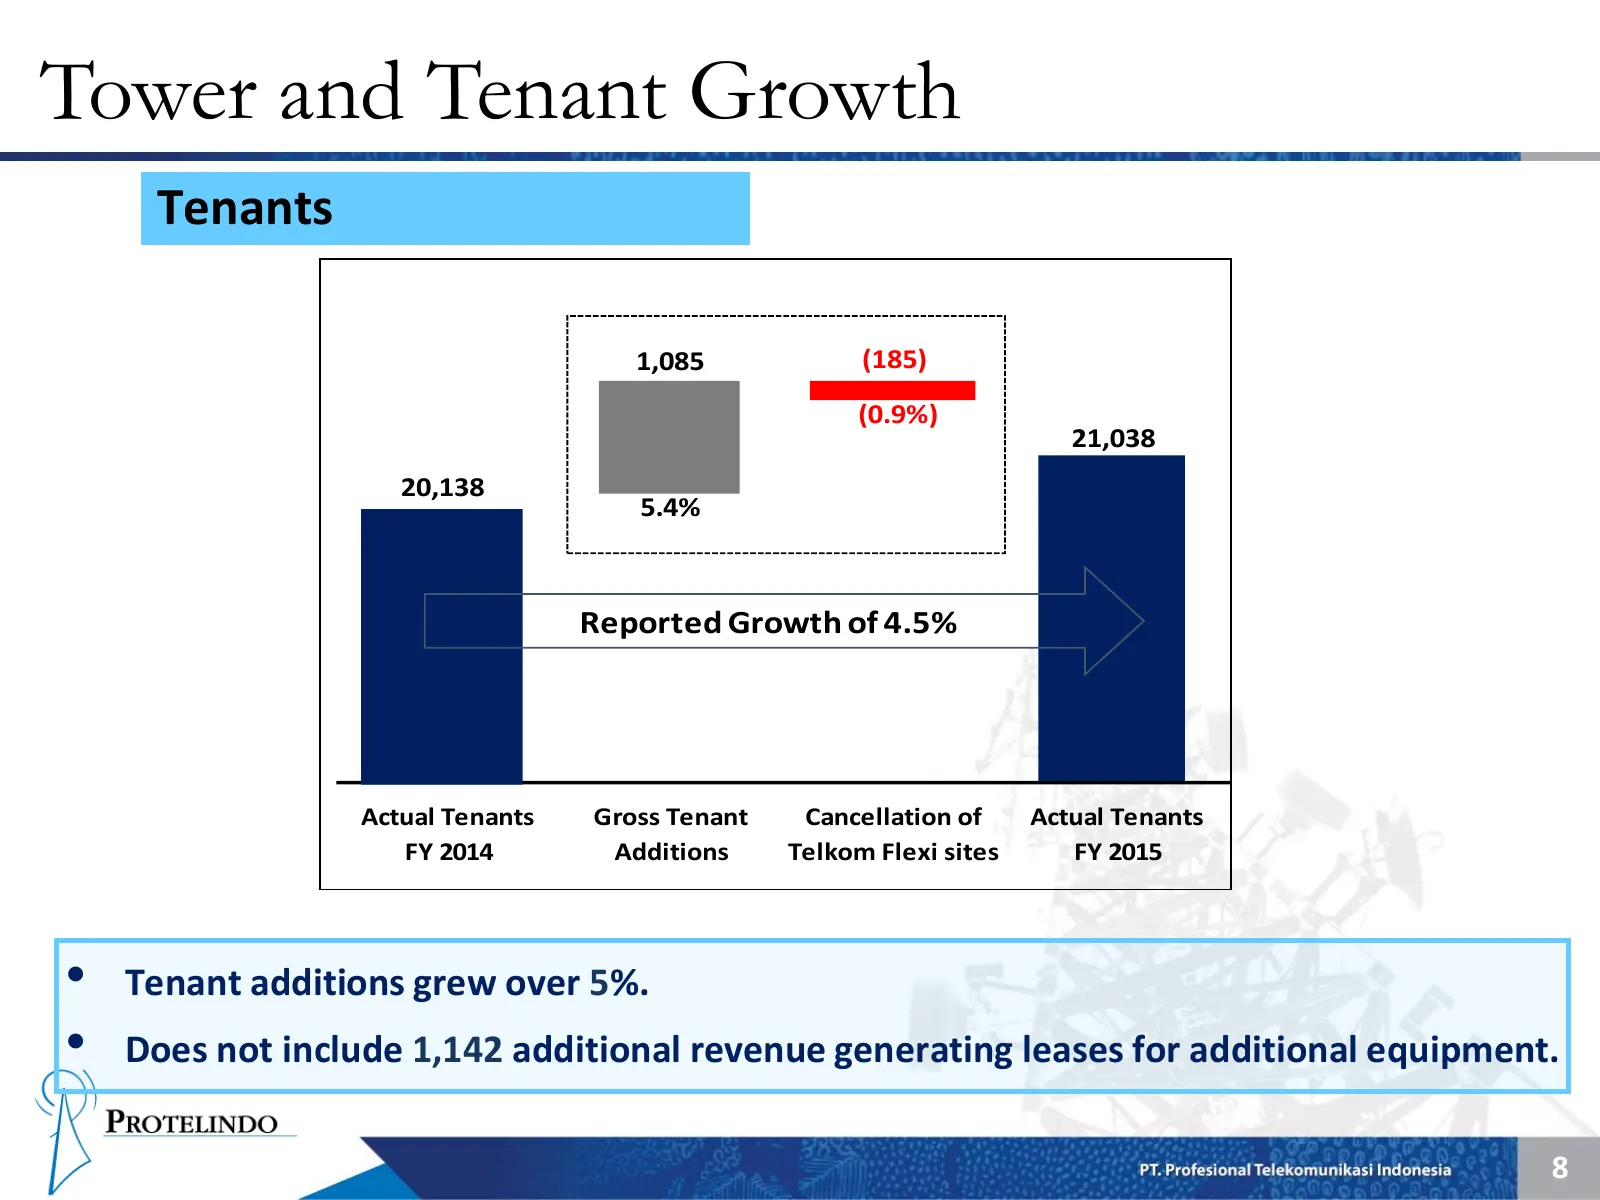
Tower and Tenant Growth Tenants 1,085 (185) (0.9%) 21,038 20,138 5.4% Reported Growth of 4.5% Actual Tenants Gross Tenant Cancellation of Actual Tenants FY 2014 Additions Telkom Flexi sites FY 2015 • Tenant additions grew over 5%. • Does not include 1,142 additional revenue generating leases for add
Slide 10: 2015 Guidance and Results
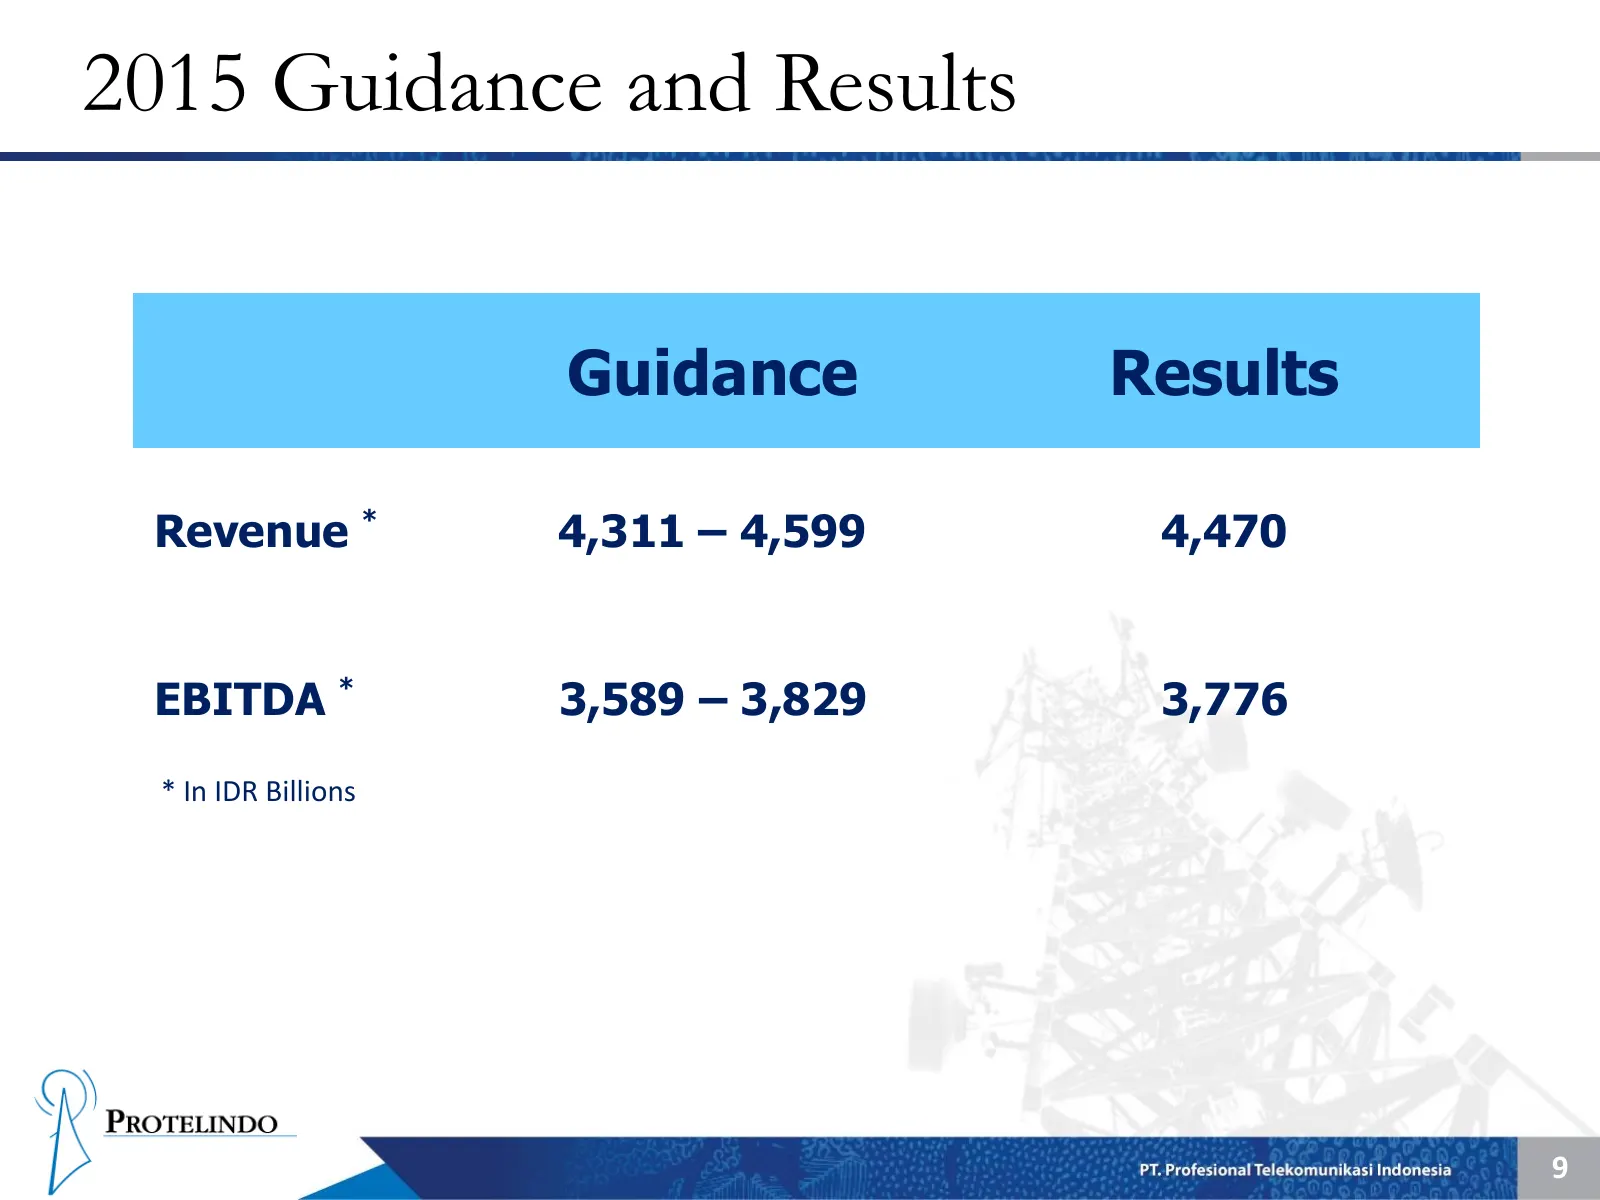
2015 Guidance and Results Guidance Results Revenue * 4,311 – 4,599 4,470 EBITDA * 3,589 – 3,829 3,776 * In IDR Billions 9
Slide 11: Debt Profile: Long Tenors, Low Margins
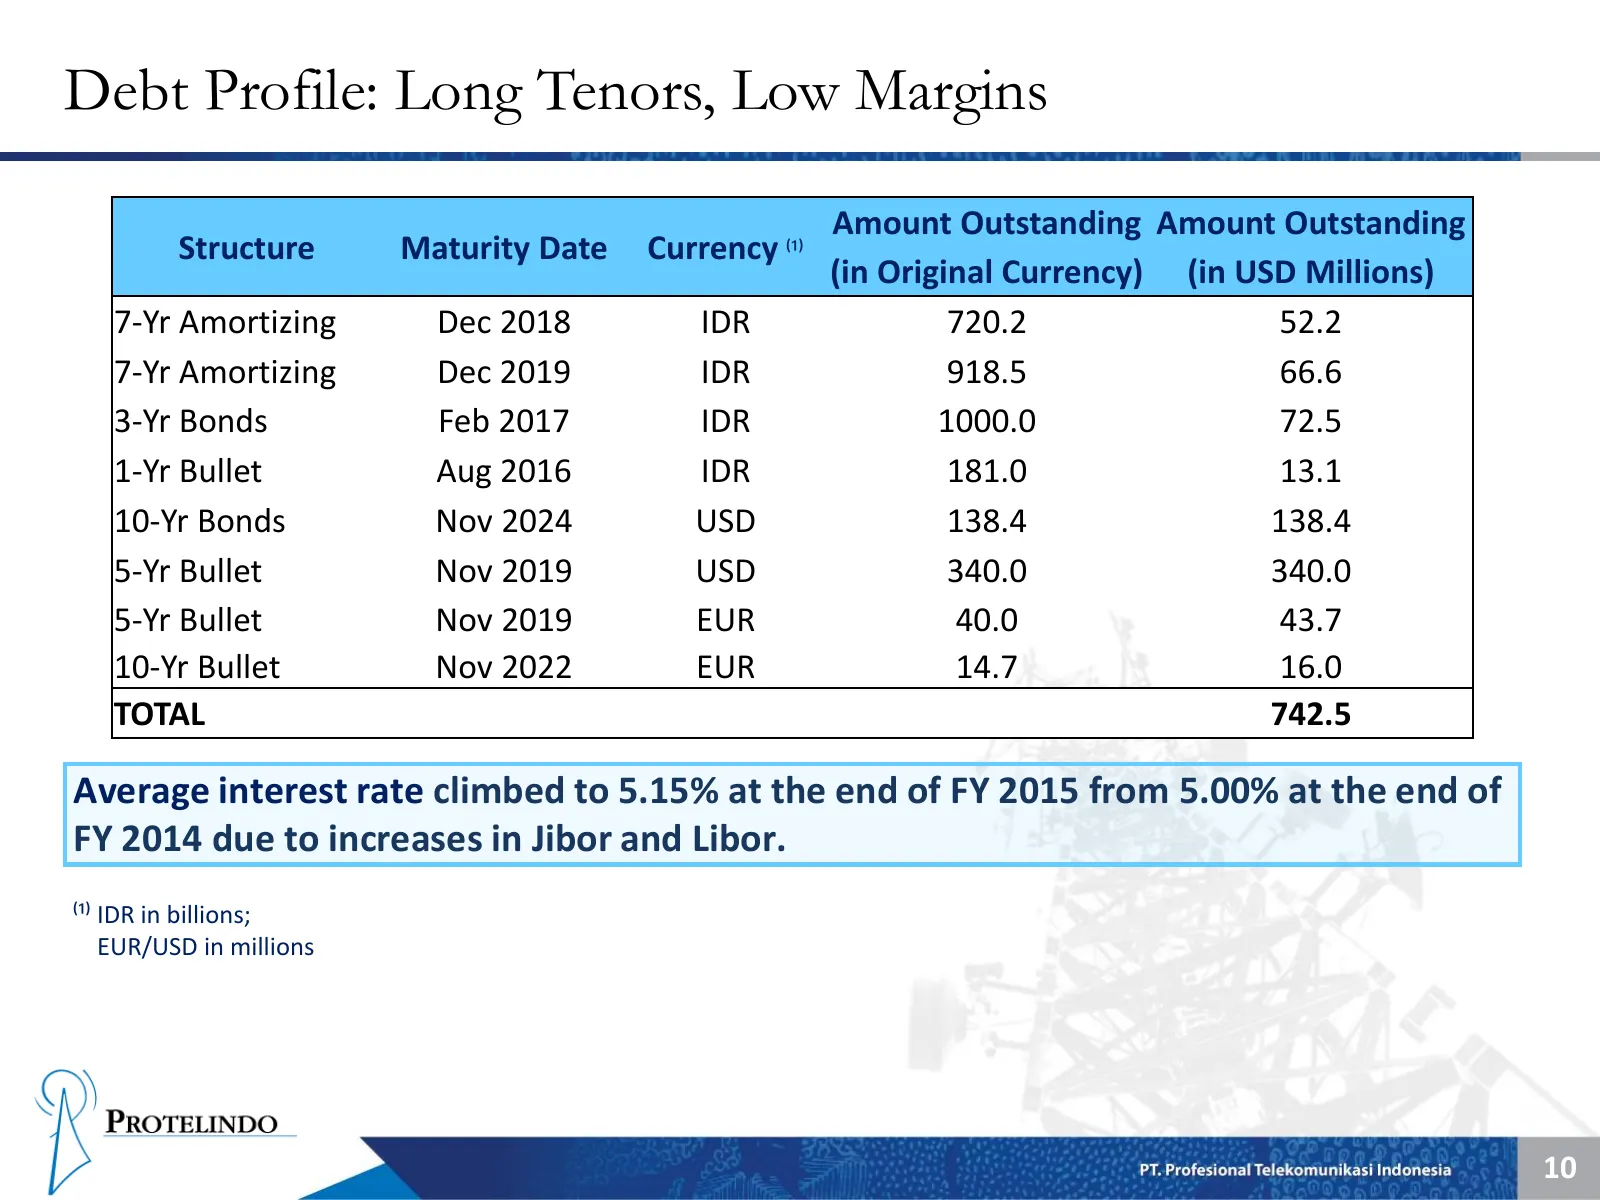
Debt Profile: Long Tenors, Low Margins Amount Outstanding Amount Outstanding Structure Maturity Date Currency ⁽¹⁾ (in Original Currency) (in USD Millions) 7-Yr Amortizing Dec 2018 IDR 720.2 52.2 7-Yr Amortizing Dec 2019 IDR 918.5 66.6 3-Yr Bonds Feb 2017 IDR 1000.0 72.5 1-Yr Bullet Aug 2016 IDR 181.
Slide 12: Achievements and Subsequent Events: Acquisitions
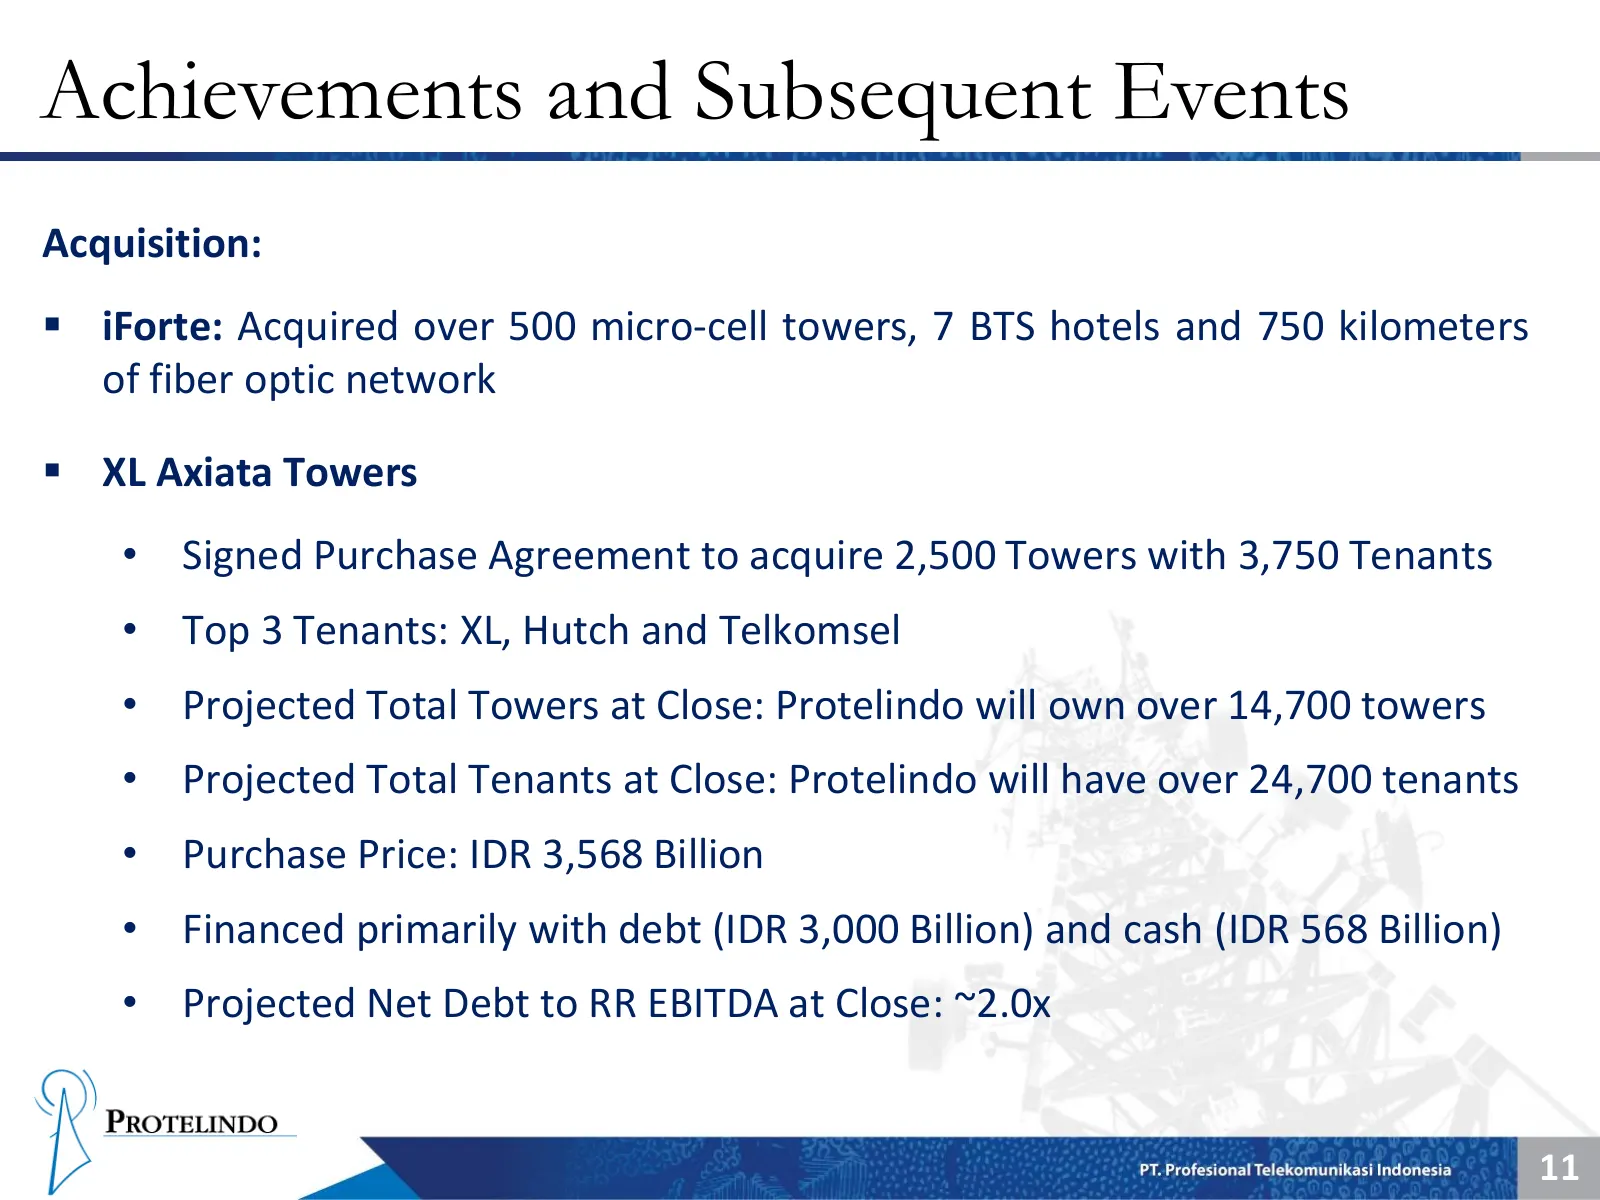
Achievements and Subsequent Events Acquisition: iForte: Acquired over 500 micro-cell towers, 7 BTS hotels and 750 kilometers of fiber optic network XL Axiata Towers • Signed Purchase Agreement to acquire 2,500 Towers with 3,750 Tenants • Top 3 Tenants: XL, Hutch and Telkomsel • Projected Total T
Slide 13: Achievements and Subsequent Events: Credit Ratings
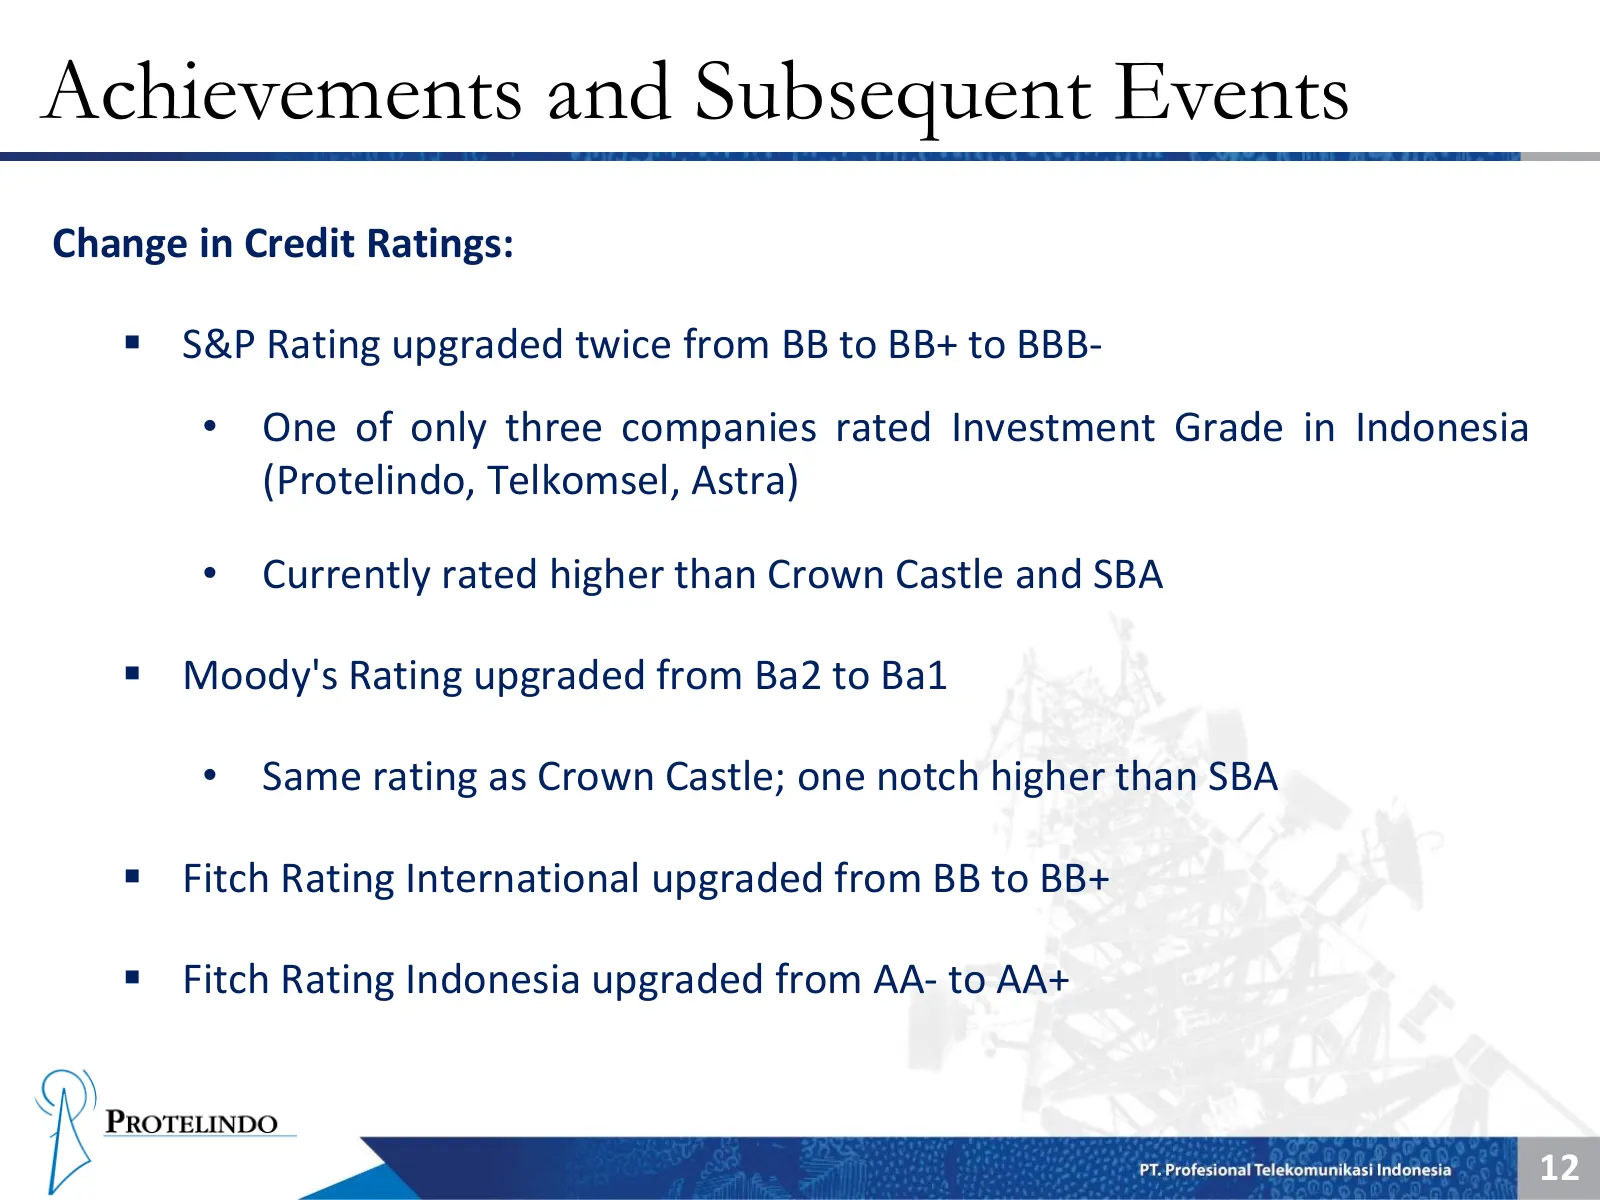
Achievements and Subsequent Events Change in Credit Ratings: S&P Rating upgraded twice from BB to BB+ to BBB- • One of only three companies rated Investment Grade in Indonesia (Protelindo, Telkomsel, Astra) • Currently rated higher than Crown Castle and SBA Moody's Rating upgraded from Ba2 to Ba
Slide 14: Regulator-Driven Change in Accounting Policy
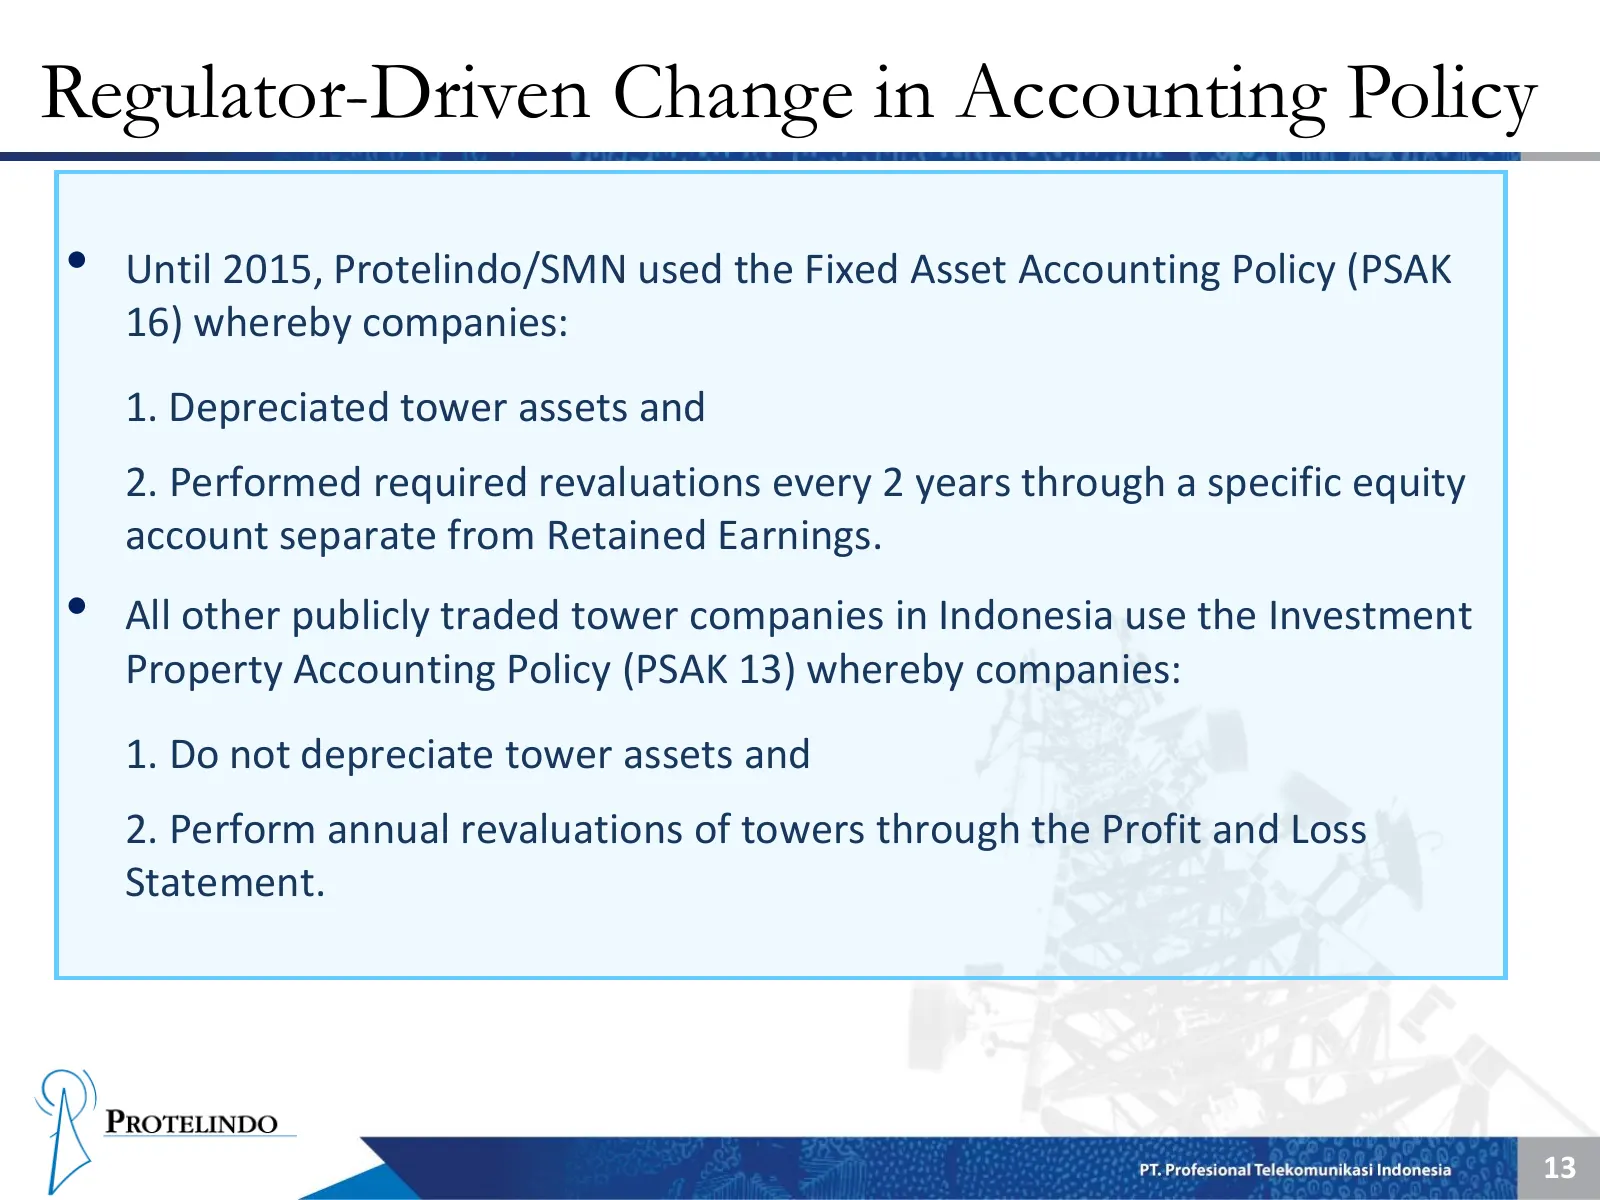
Regulator-Driven Change in Accounting Policy • Until 2015, Protelindo/SMN used the Fixed Asset Accounting Policy (PSAK 16) whereby companies: 1. Depreciated tower assets and 2. Performed required revaluations every 2 years through a specific equity account separate from Retained Earnings. • All othe
Slide 15: Regulator Driven Change in Accounting Policy
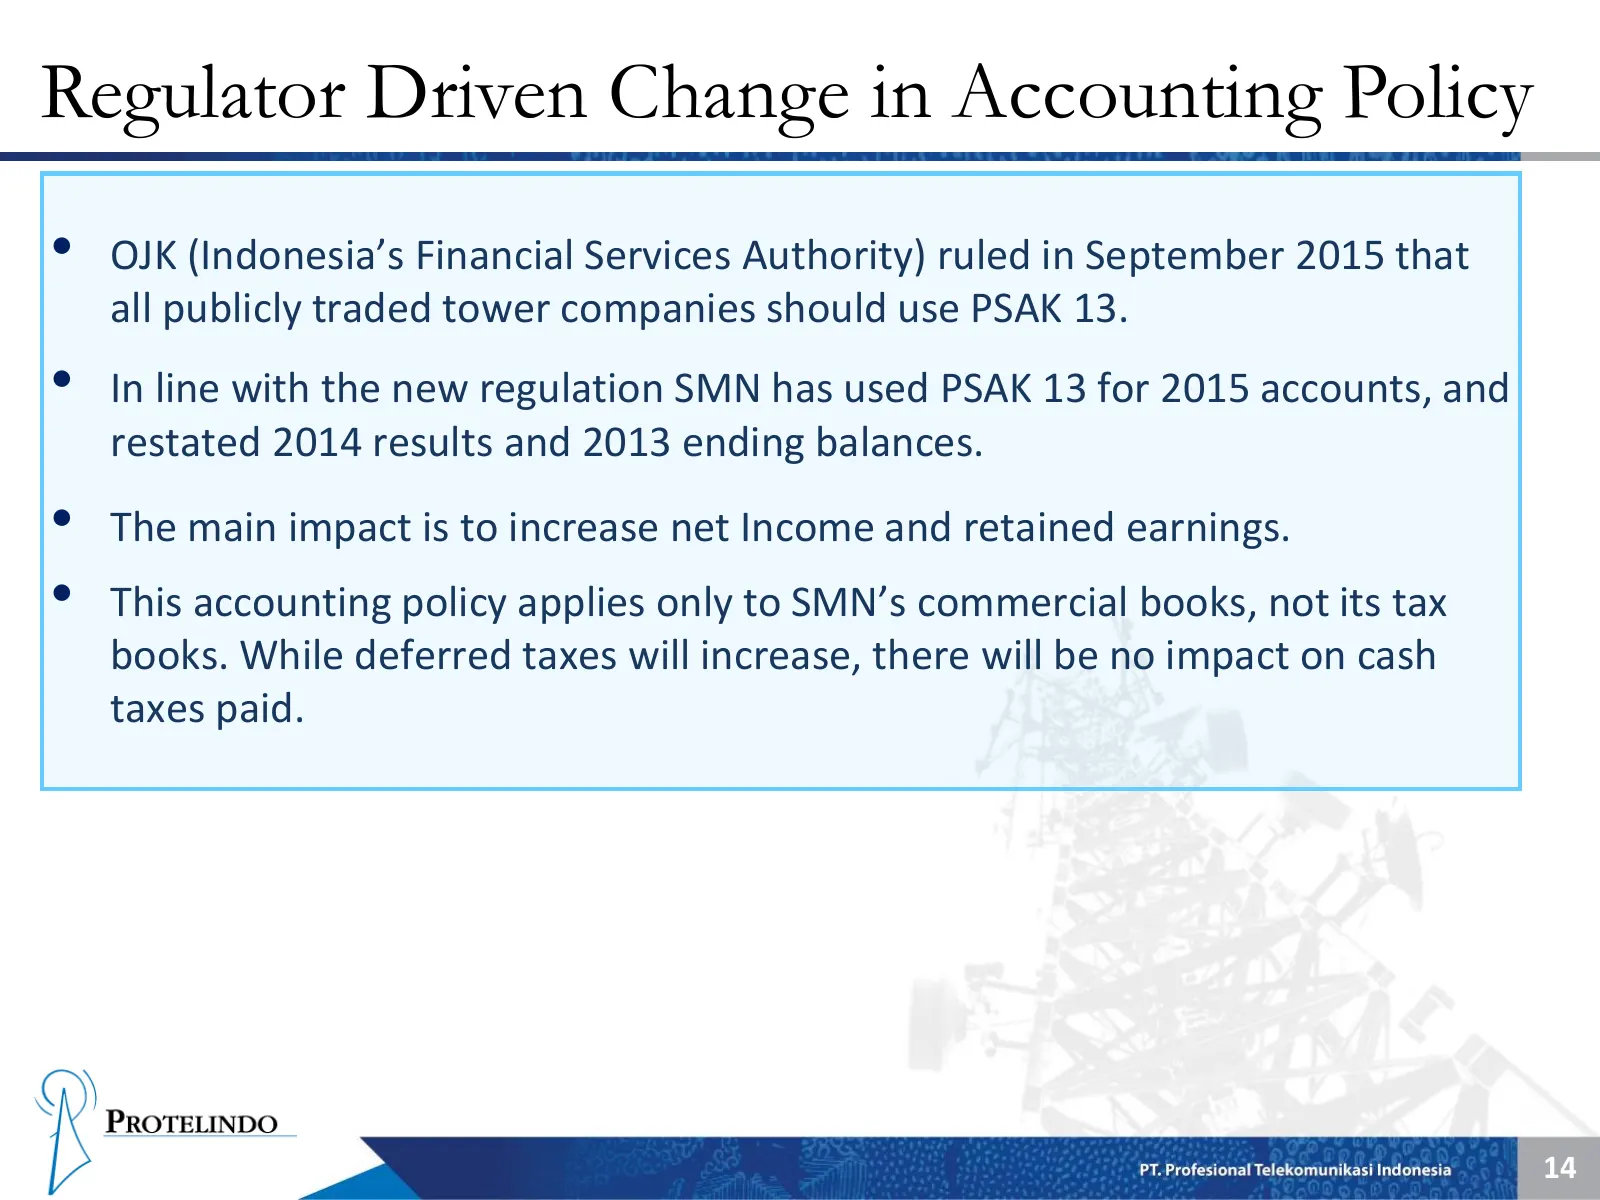
Regulator Driven Change in Accounting Policy • OJK (Indonesia’s Financial Services Authority) ruled in September 2015 that all publicly traded tower companies should use PSAK 13. • In line with the new regulation SMN has used PSAK 13 for 2015 accounts, and restated 2014 results and 2013 ending balan
Slide 16: Impact of Accounting Changes: Net Profit After Tax
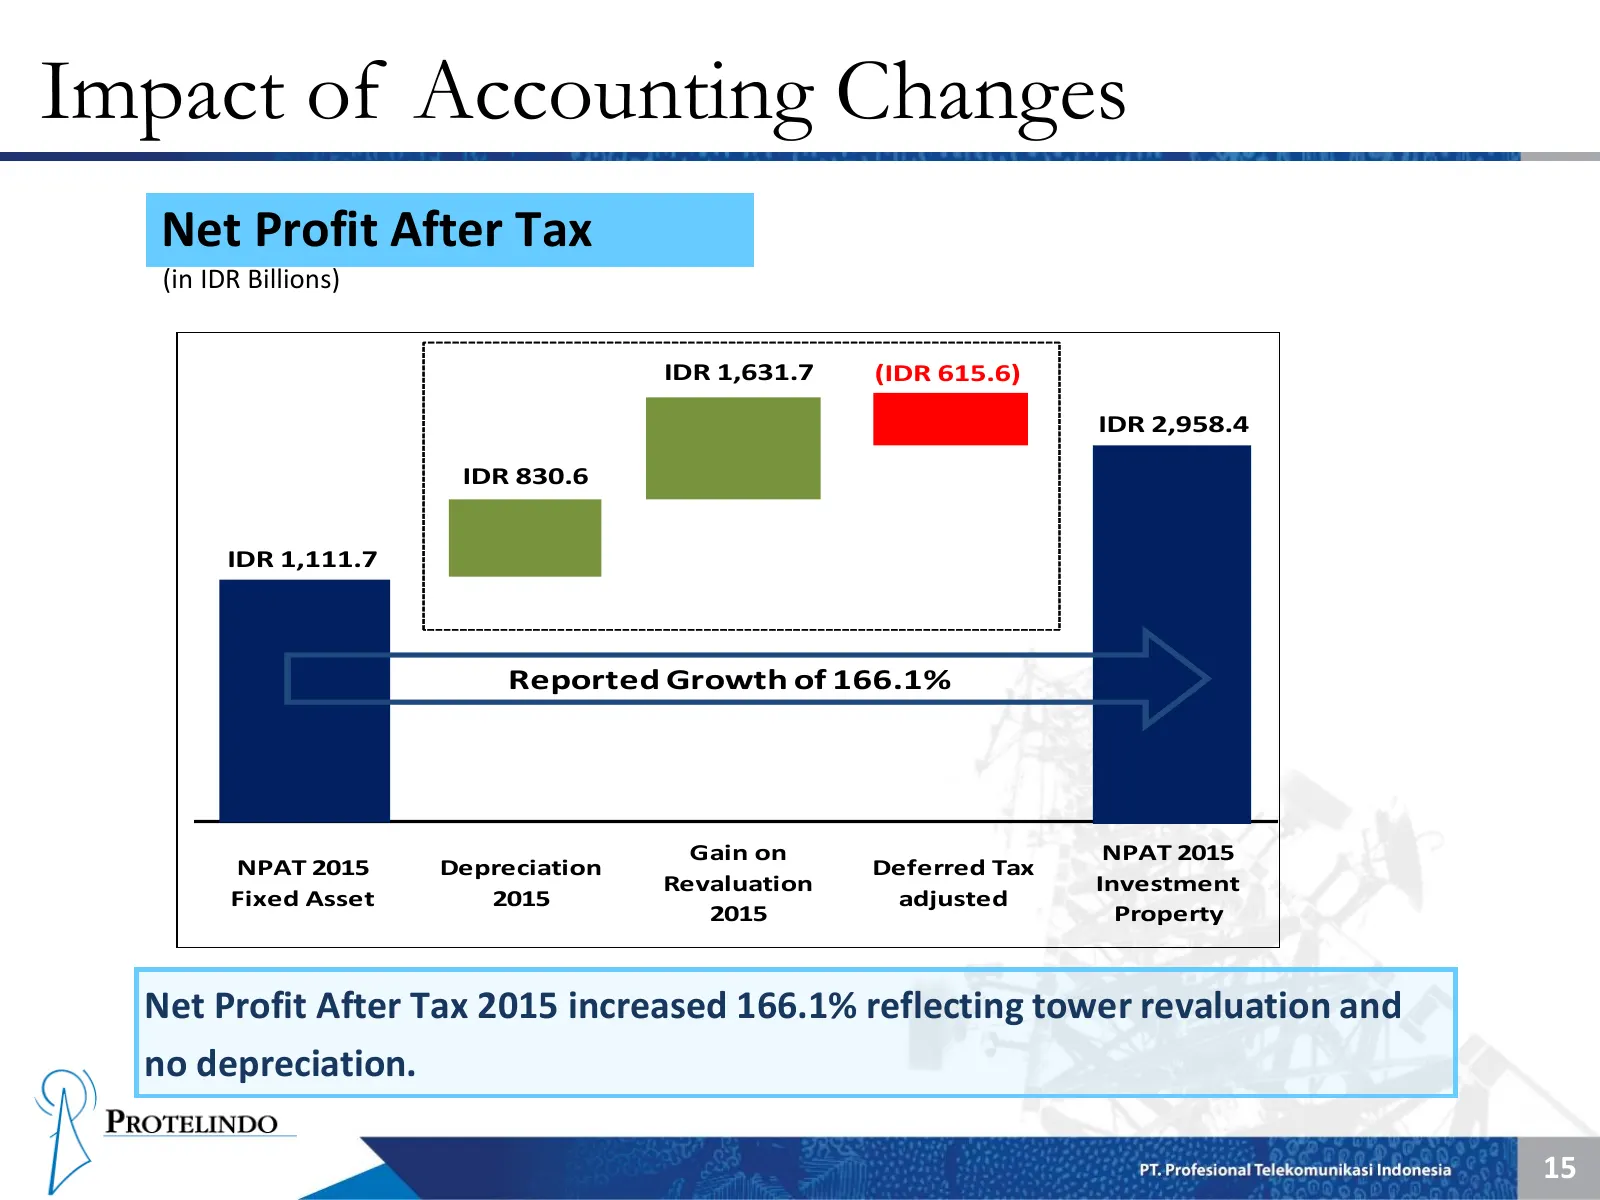
Impact of Accounting Changes Net Profit After Tax (in IDR Billions) IDR 1,631.7 (IDR 615.6) IDR 2,958.4 IDR 830.6 IDR 1,111.7 Reported Growth of 166.1% Gain on NPAT 2015 NPAT 2015 Depreciation Deferred Tax Revaluation Investment Fixed Asset 2015 adjusted 2015 Property Net Profit After Tax 2015 incre
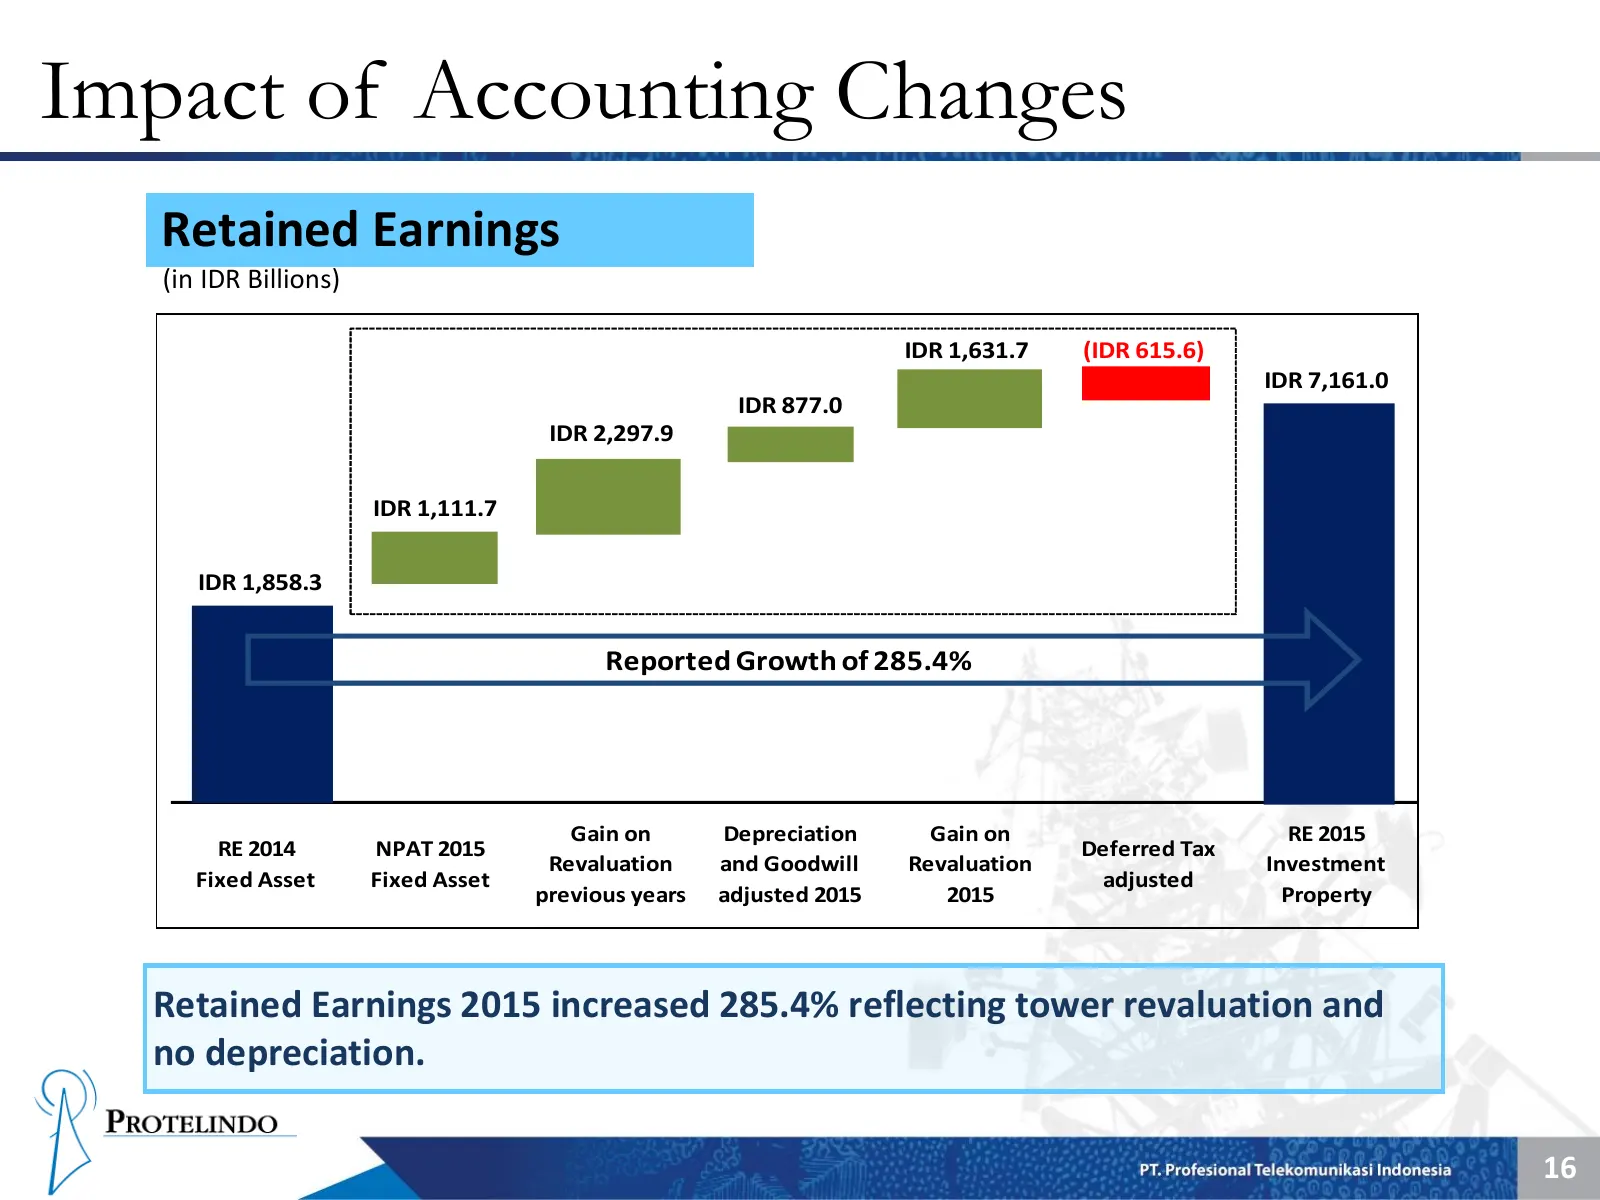
Slide 17: Impact of Accounting Changes: Retained Earnings
Impact of Accounting Changes Retained Earnings (in IDR Billions) IDR 1,631.7 (IDR 615.6) IDR 7,161.0 IDR 877.0 IDR 2,297.9 IDR 1,111.7 IDR 1,858.3 Reported Growth of 285.4% Gain on Depreciation Gain on RE 2015 RE 2014 NPAT 2015 Deferred Tax Revaluation and Goodwill Revaluation Investment Fixed Asset
Source: Internet Archive copy of ptsmn.co.id
More decks from PT Sarana Menara Nusantara Tbk
 Q2 2026 Earnings Presentation25 slides · Aug 14, 2026
 Q1 2026 Earnings Presentation25 slides · Jun 3, 2026
 Q4 2025 Earnings Presentation24 slides · Apr 6, 2026
 Q2 2023 Earnings Presentation26 slides · Sep 28, 2023
 Q1 2023 Earnings Presentation26 slides · May 2023
 FY2022 Earnings Presentation26 slides · Apr 6, 2023