F-Secure Oyj · OMXHEX:FSECURE
F-Secure Oyj — Q1 2021 Earnings Presentation
17 slides from F-Secure Oyj's earnings presentation, May 6, 2021
Slide 1: Software businesses for both corporate and consumer customers growing
SOFTWAREBUSINESSESFORBOTH CORPORATEANDCONSUMERCUSTOMERS GROWING Q1/2021 Highlights Juhani Hintikka, President & CEO
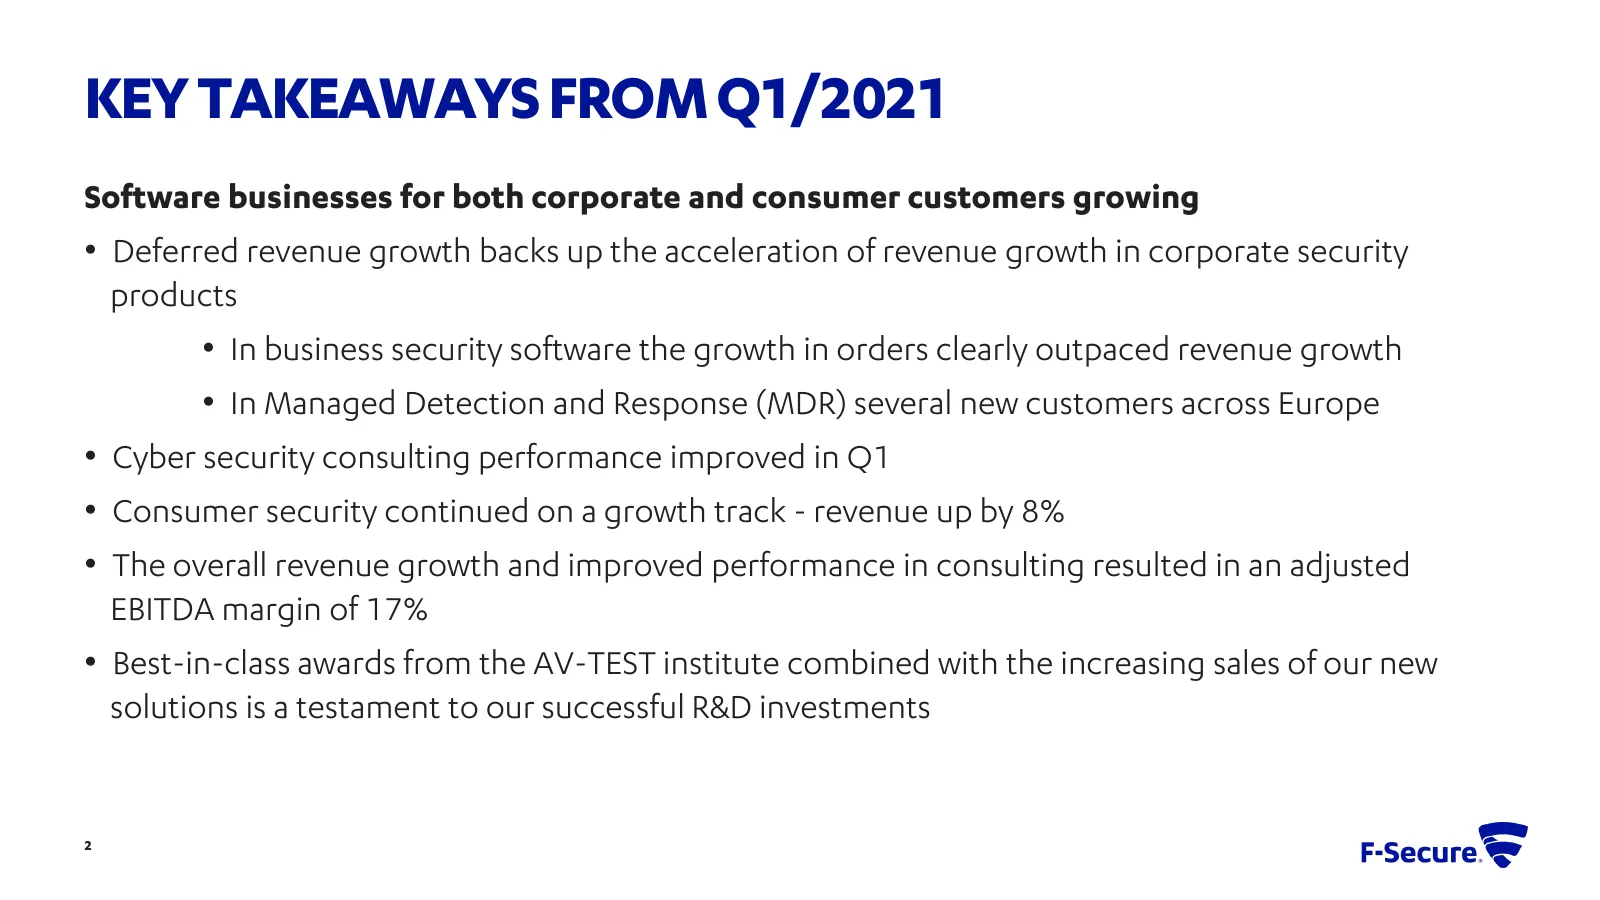
Slide 2: Key takeaways from Q1/2021
KEY TAKEAWAYS FROM Q1/2021 Software businesses for both corporate and consumer customers growing • Deferred revenue growth backs up the acceleration of revenue growth in corporate security products • In business security software the growth in orders clearly outpaced revenue growth • In Managed Dete
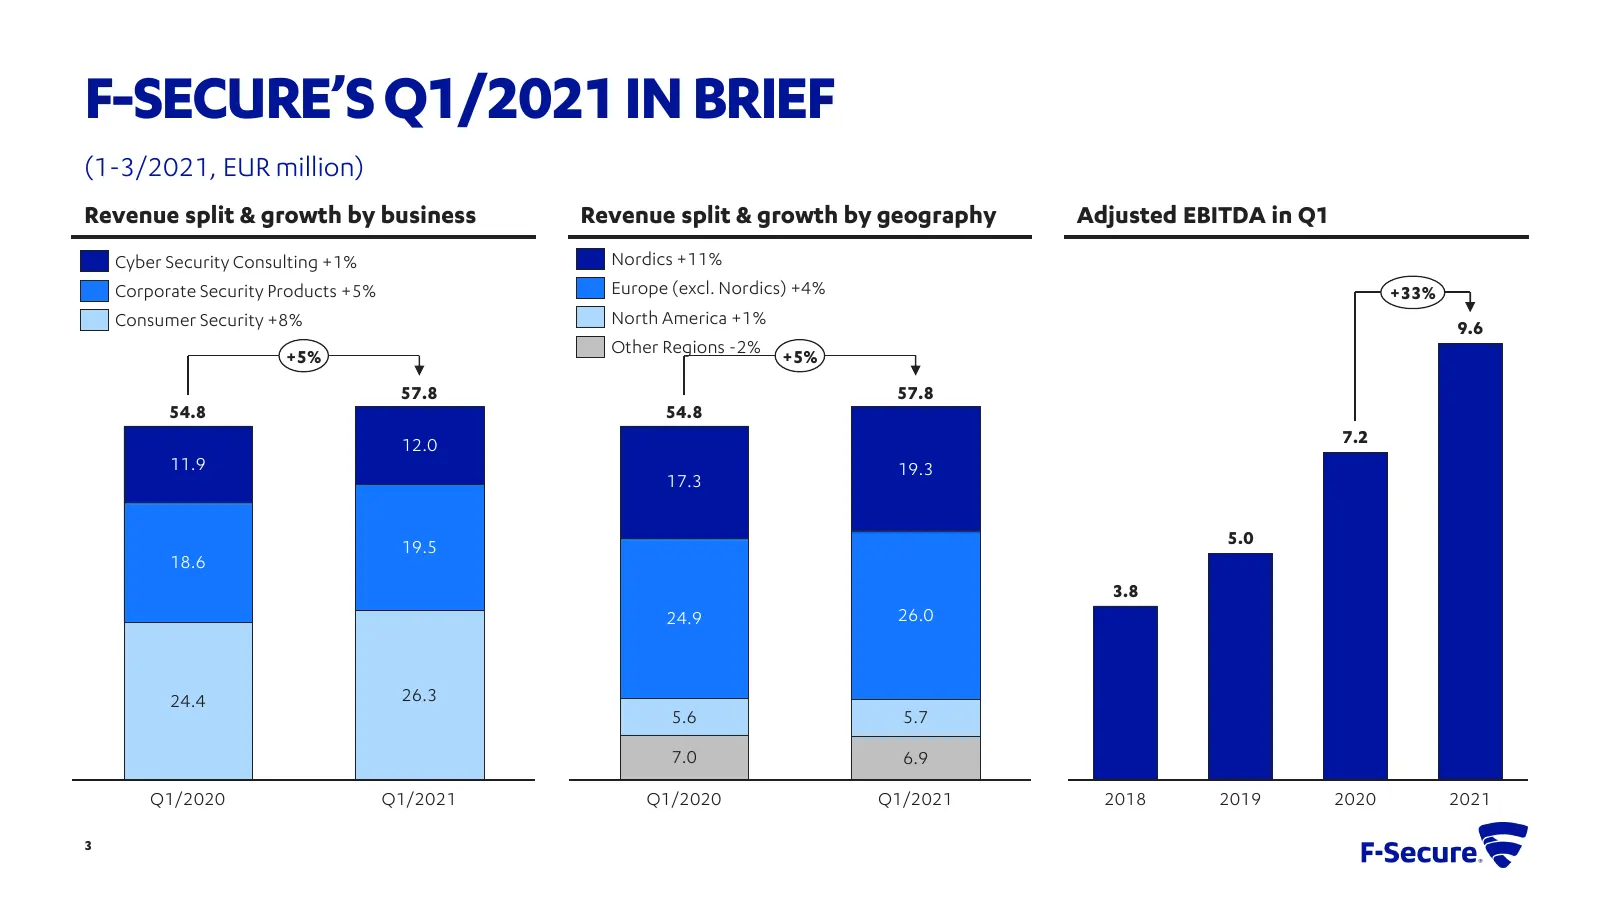
Slide 3: F-Secure's Q1/2021 in brief
F-SECURE’S Q1/2021 IN BRIEF (1-3/2021, EUR million) Revenue split & growth by business Revenue split & growth by geography Adjusted EBITDA in Q1 Cyber Security Consulting +1% Nordics +11% Corporate Security Products +5% Europe (excl. Nordics) +4% +33% Consumer Security +8% North America +1% 9.6 +5%
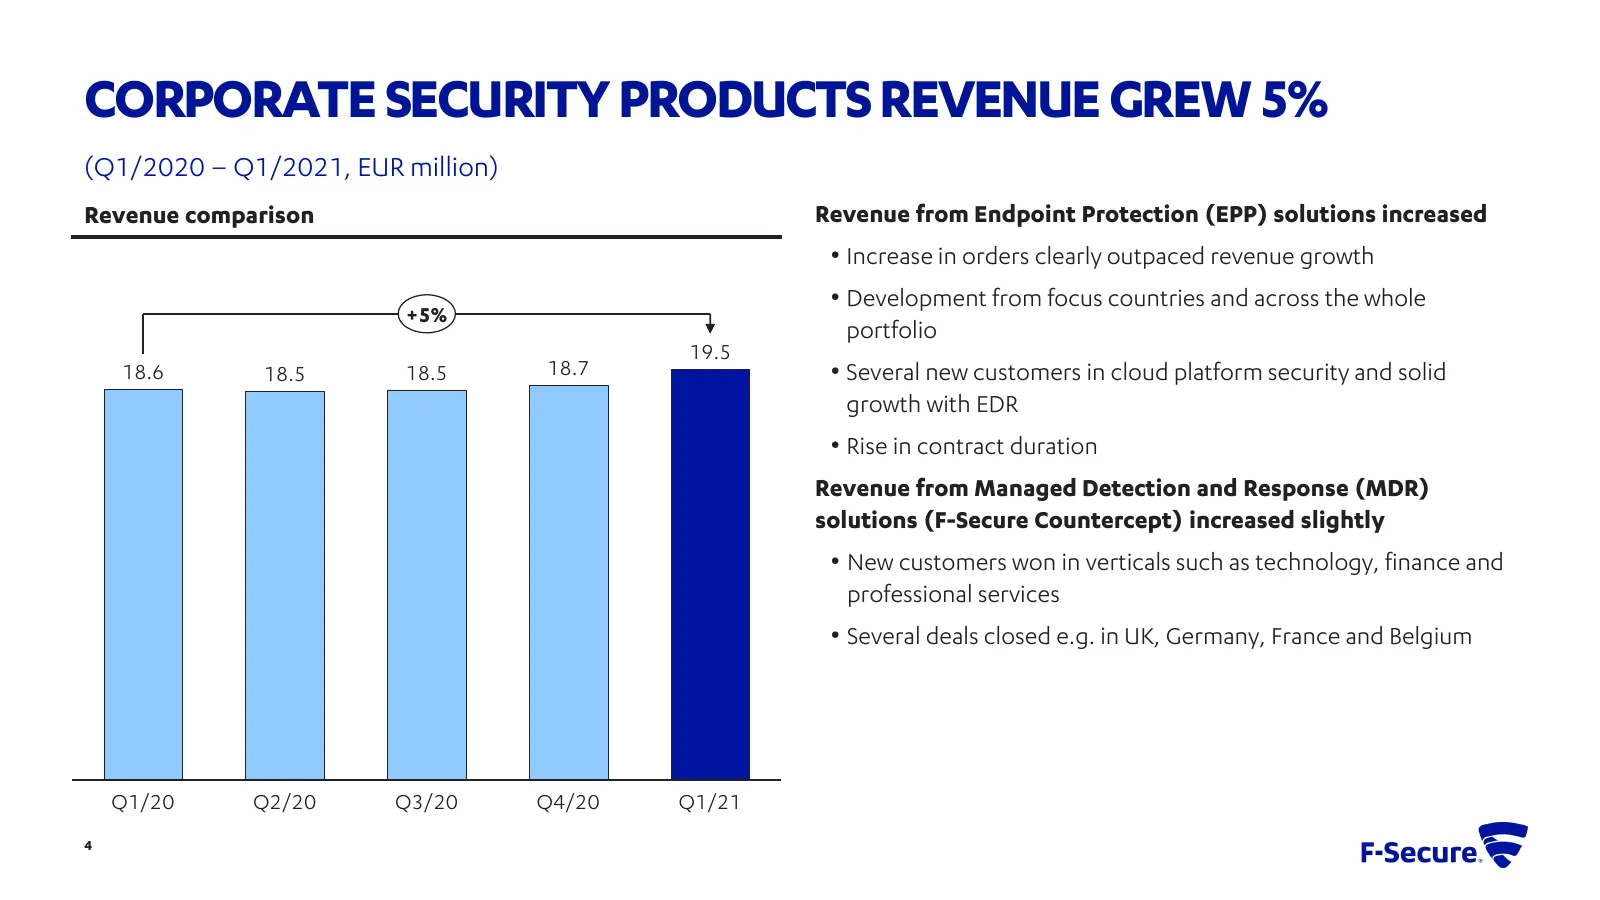
Slide 4: Corporate security products revenue grew 5%
CORPORATE SECURITY PRODUCTS REVENUE GREW 5% (Q1/2020 – Q1/2021, EUR million) Revenue comparison Revenue from Endpoint Protection (EPP) solutions increased • Increase in orders clearly outpaced revenue growth • Development from focus countries and across the whole +5% portfolio 19.5 18.6 18.5 18.5 18
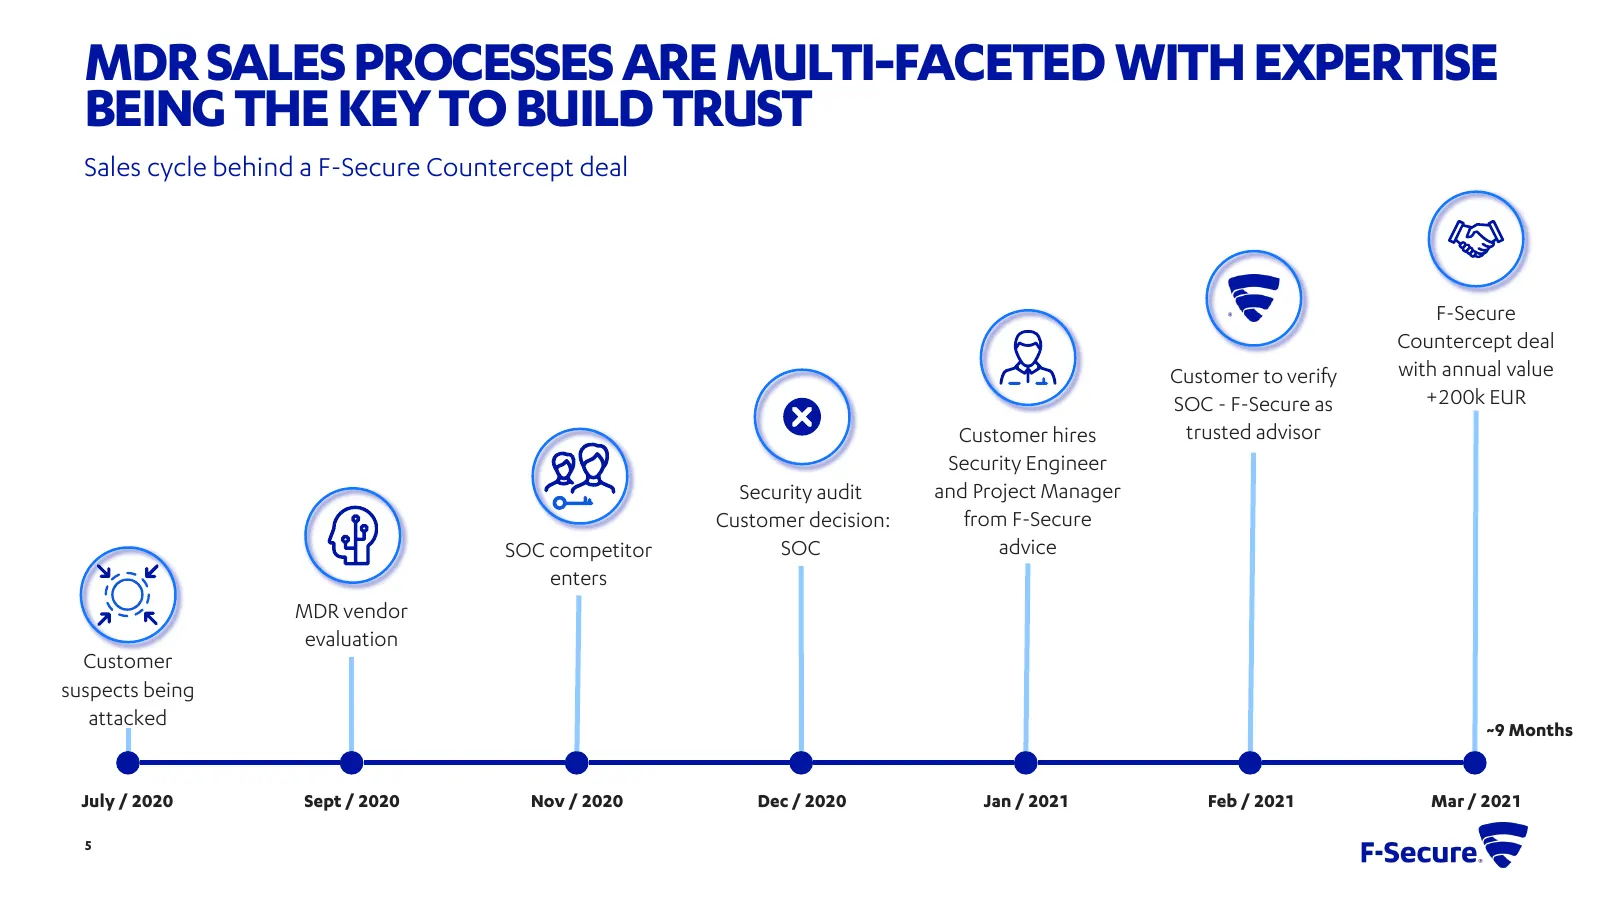
Slide 5: MDR sales processes are multi-faceted with expertise being the key to build trust
MDR SALES PROCESSES ARE MULTI-FACETED WITH EXPERTISE BEING THE KEY TO BUILD TRUST Sales cycle behind a F-Secure Countercept deal F-Secure Countercept deal Customer to verify with annual value SOC - F-Secure as +200k EUR Customer hires trusted advisor Security Engineer Security audit and Project Mana
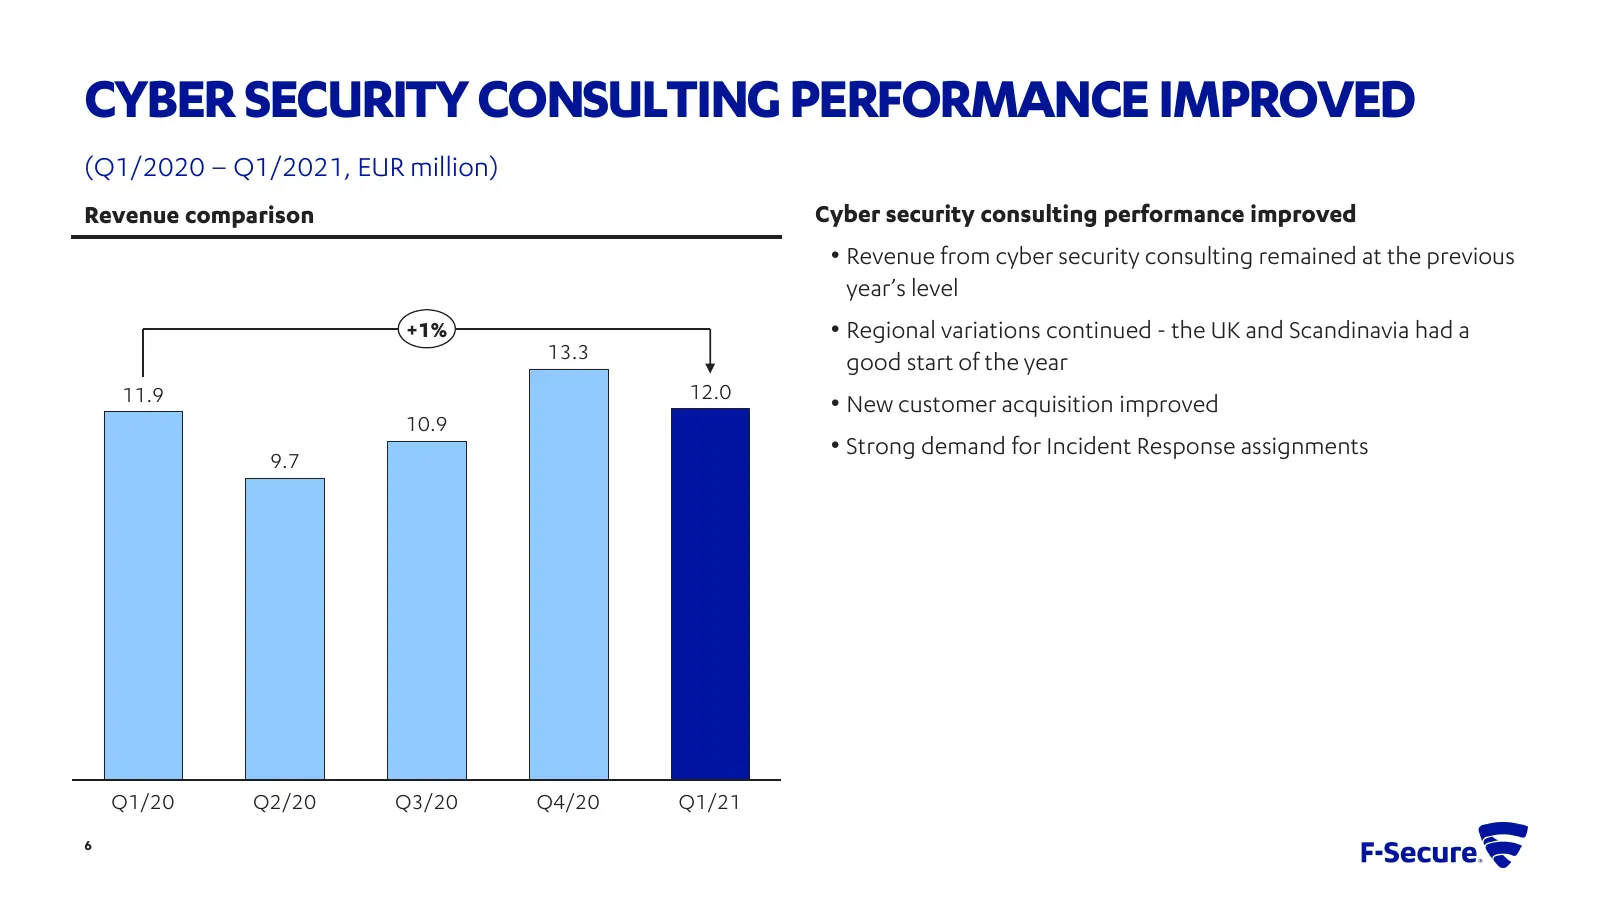
Slide 6: Cyber security consulting performance improved
CYBER SECURITY CONSULTING PERFORMANCE IMPROVED (Q1/2020 – Q1/2021, EUR million) Revenue comparison Cyber security consulting performance improved • Revenue from cyber security consulting remained at the previous year’s level +1% • Regional variations continued - the UK and Scandinavia had a 13.3 goo
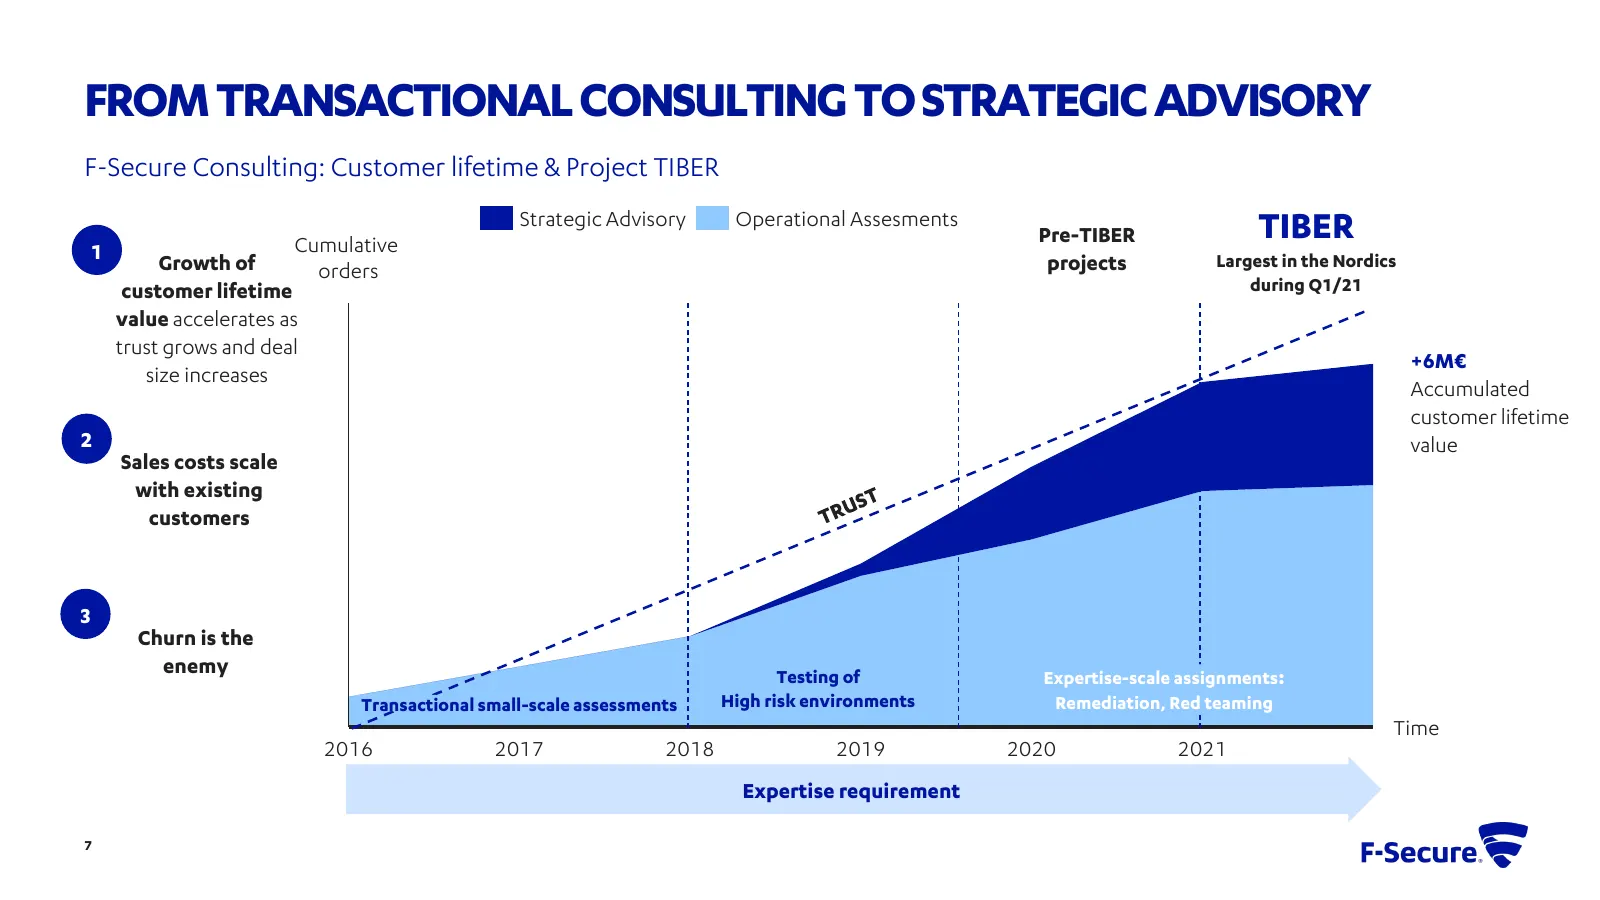
Slide 7: From transactional consulting to strategic advisory
FROM TRANSACTIONAL CONSULTING TO STRATEGIC ADVISORY F-Secure Consulting: Customer lifetime & Project TIBER Cumulative Strategic Advisory Operational Assesments Pre-TIBER TIBER 1 projects Largest in the Nordics Growth of orders customer lifetime during Q1/21 value accelerates as trust grows and deal
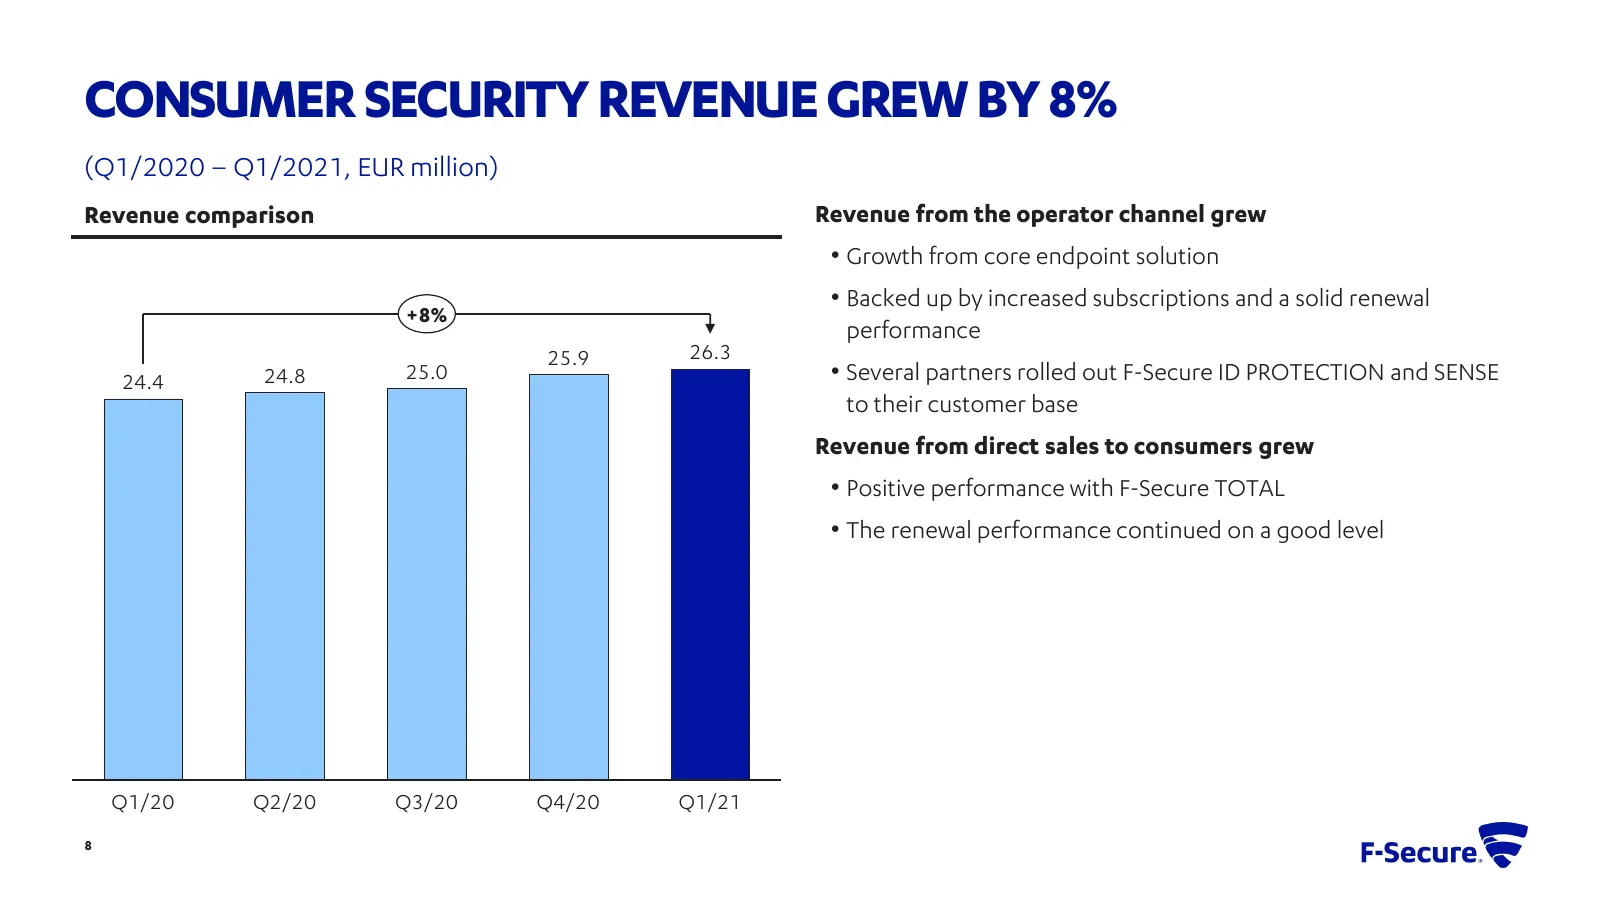
Slide 8: Consumer security revenue grew by 8%
CONSUMER SECURITY REVENUE GREW BY 8% (Q1/2020 – Q1/2021, EUR million) Revenue comparison Revenue from the operator channel grew • Growth from core endpoint solution • Backed up by increased subscriptions and a solid renewal +8% performance 25.9 26.3 24.4 24.8 25.0 • Several partners rolled out F-Sec
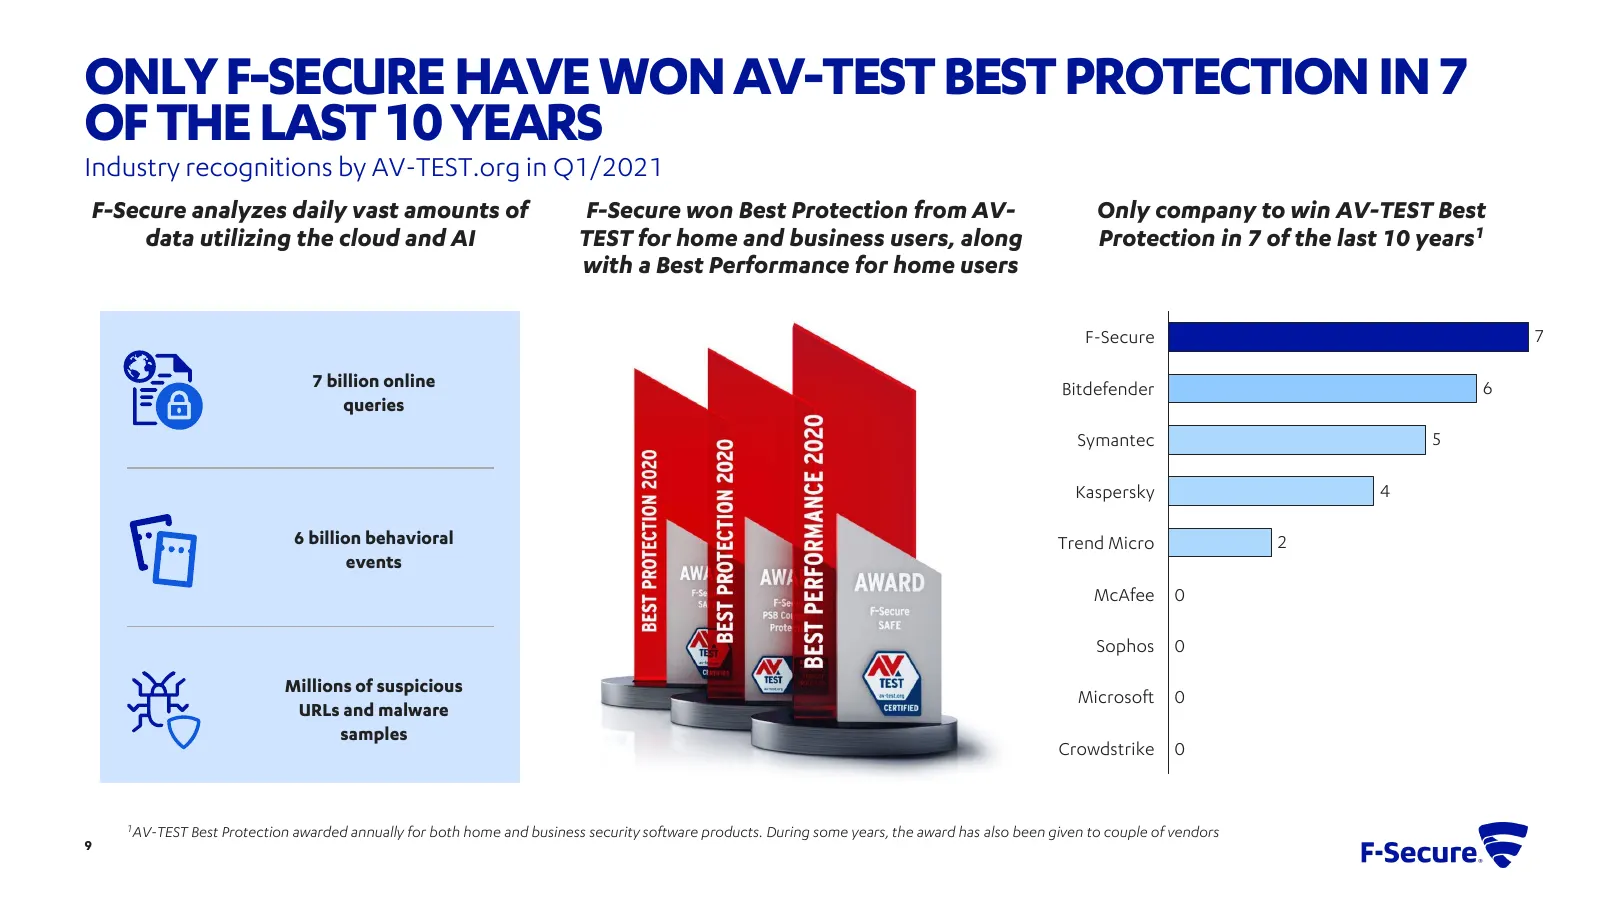
Slide 9: Only F-Secure have won AV-TEST Best Protection in 7 of the last 10 years
ONLY F-SECURE HAVE WON AV-TEST BEST PROTECTION IN 7 OF THE LAST 10 YEARS Industry recognitions by AV-TEST.org in Q1/2021 F-Secure analyzes daily vast amounts of F-Secure won Best Protection from AV- Only company to win AV-TEST Best data utilizing the cloud and AI TEST for home and business users, al
Slide 10: Revenue growth driving improved profitability
REVENUE GROWTH DRIVING IMPROVED PROFITABILITY Q1/2021 Financial review Eriikka Söderström, CFO
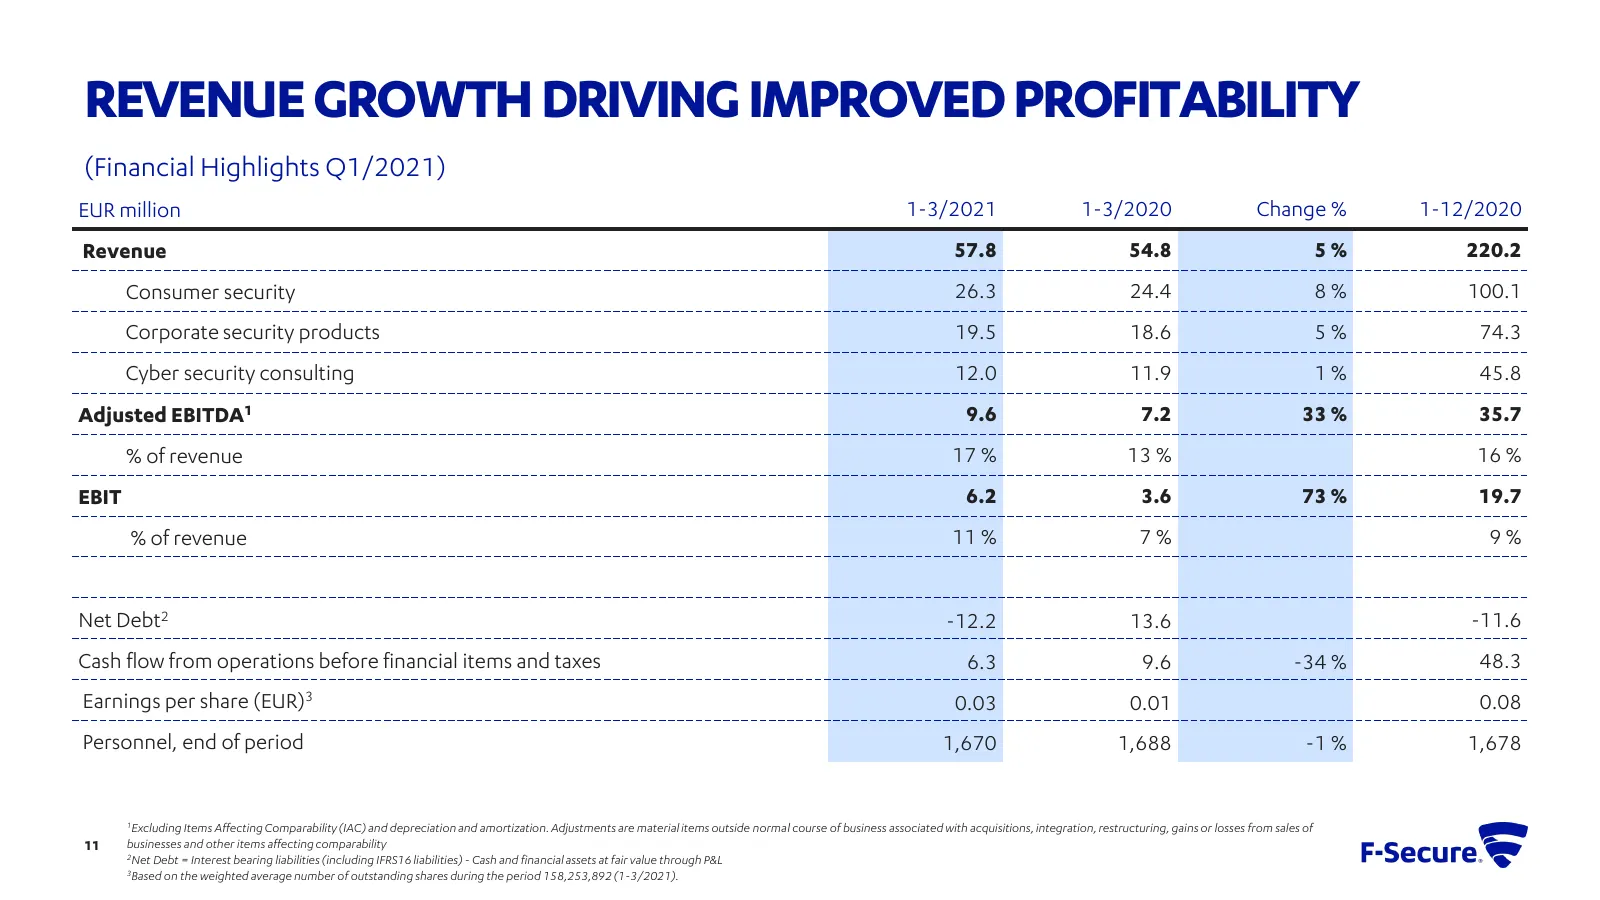
Slide 11: Revenue growth driving improved profitability
REVENUE GROWTH DRIVING IMPROVED PROFITABILITY (Financial Highlights Q1/2021) EUR million 1-3/2021 1-3/2020 Change % 1-12/2020 Revenue 57.8 54.8 5% 220.2 Consumer security 26.3 24.4 8% 100.1 Corporate security products 19.5 18.6 5% 74.3 Cyber security consulting 12.0 11.9 1% 45.8 Adjusted EBITDA1 9.6
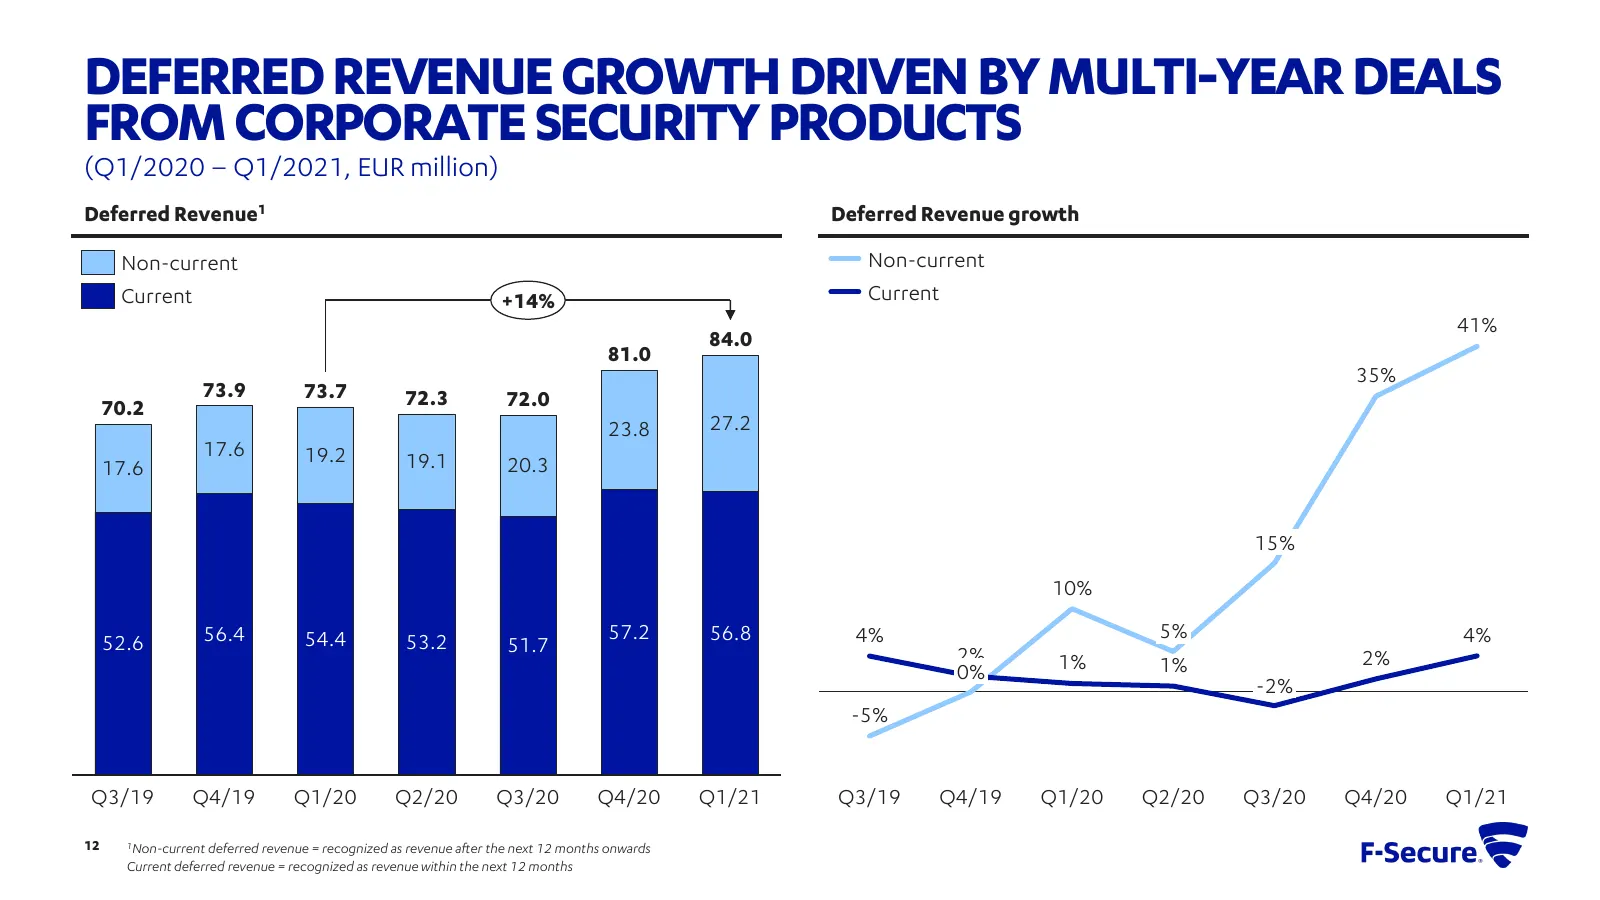
Slide 12: Deferred revenue growth driven by multi-year deals from corporate security products
DEFERRED REVENUE GROWTH DRIVEN BY MULTI-YEAR DEALS FROM CORPORATE SECURITY PRODUCTS (Q1/2020 – Q1/2021, EUR million) Deferred Revenue1 Deferred Revenue growth Non-current Non-current Current +14% Current 41% 84.0 81.0 35% 73.9 73.7 72.3 72.0 70.2 23.8 27.2 17.6 19.2 17.6 19.1 20.3 15% 10% 56.4 54.4
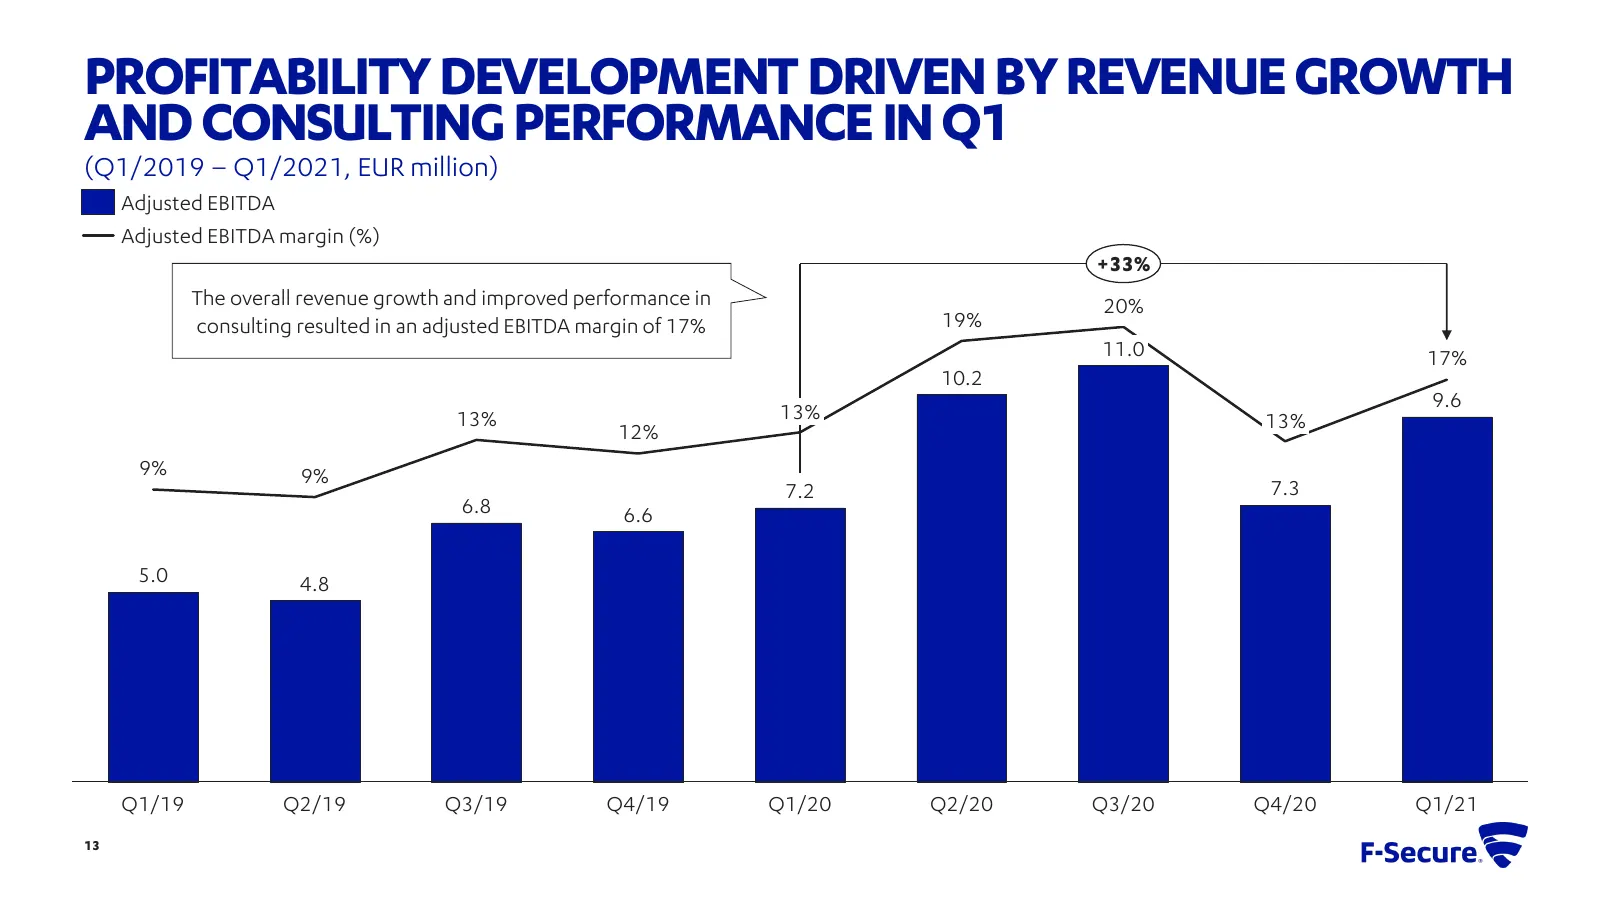
Slide 13: Profitability development driven by revenue growth and consulting performance in Q1
PROFITABILITY DEVELOPMENT DRIVEN BY REVENUE GROWTH AND CONSULTING PERFORMANCE IN Q1 (Q1/2019 – Q1/2021, EUR million) Adjusted EBITDA Adjusted EBITDA margin (%) +33% The overall revenue growth and improved performance in 20% consulting resulted in an adjusted EBITDA margin of 17% 19% 11.0 17% 10.2 9.
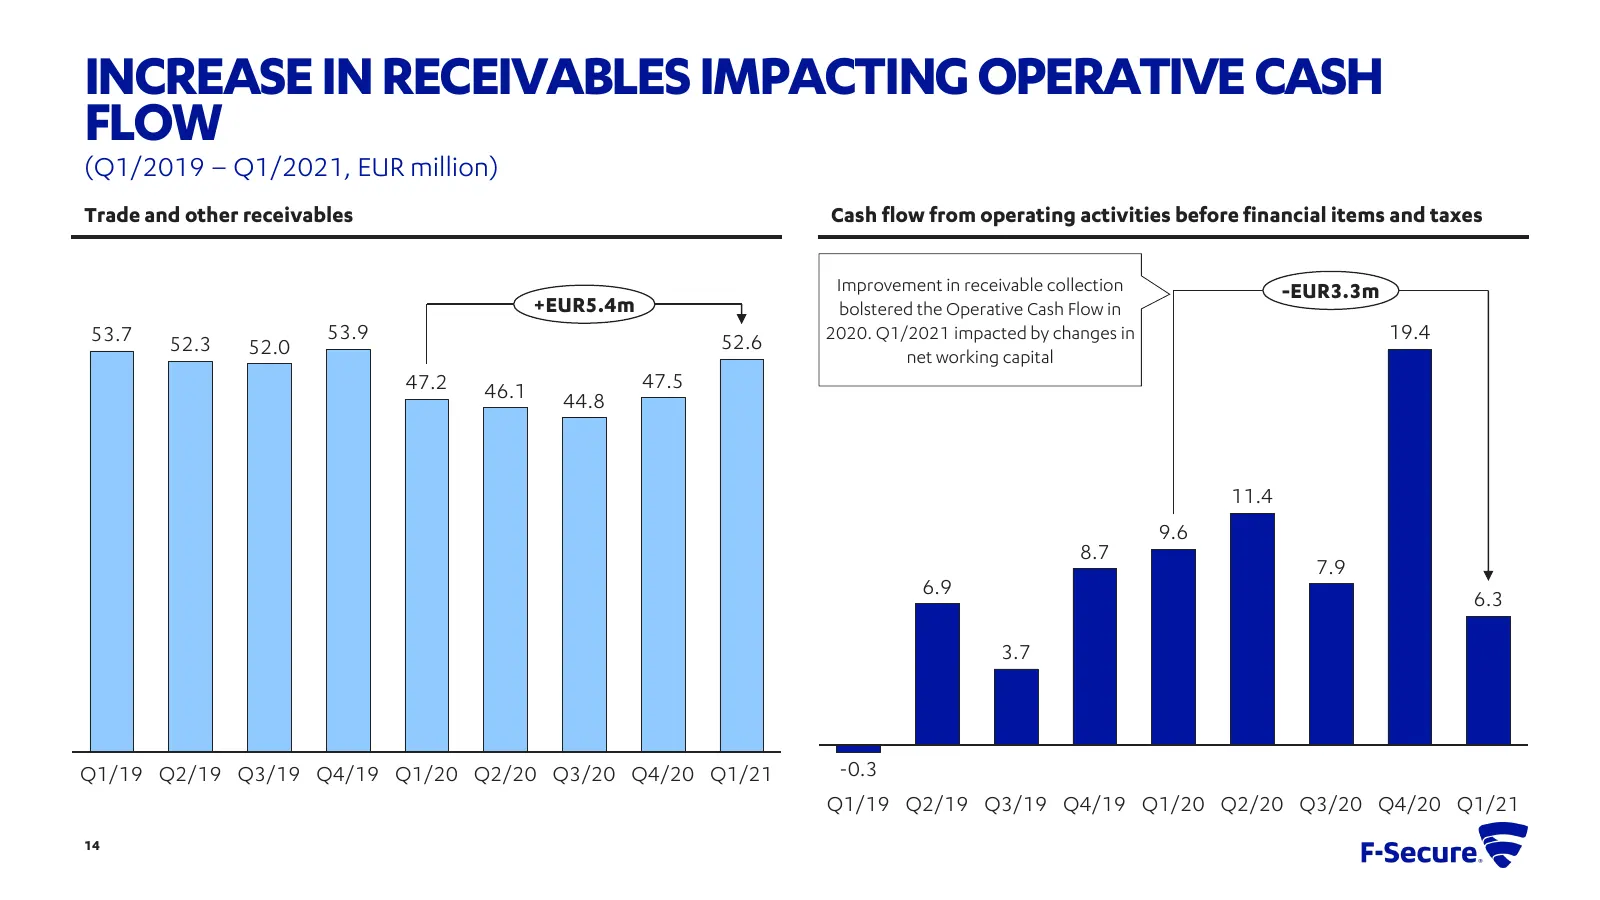
Slide 14: Increase in receivables impacting operative cash flow
INCREASE IN RECEIVABLES IMPACTING OPERATIVE CASH FLOW (Q1/2019 – Q1/2021, EUR million) Trade and other receivables Cash flow from operating activities before financial items and taxes Improvement in receivable collection -EUR3.3m +EUR5.4m bolstered the Operative Cash Flow in 53.7 53.9 52.6 2020. Q1/
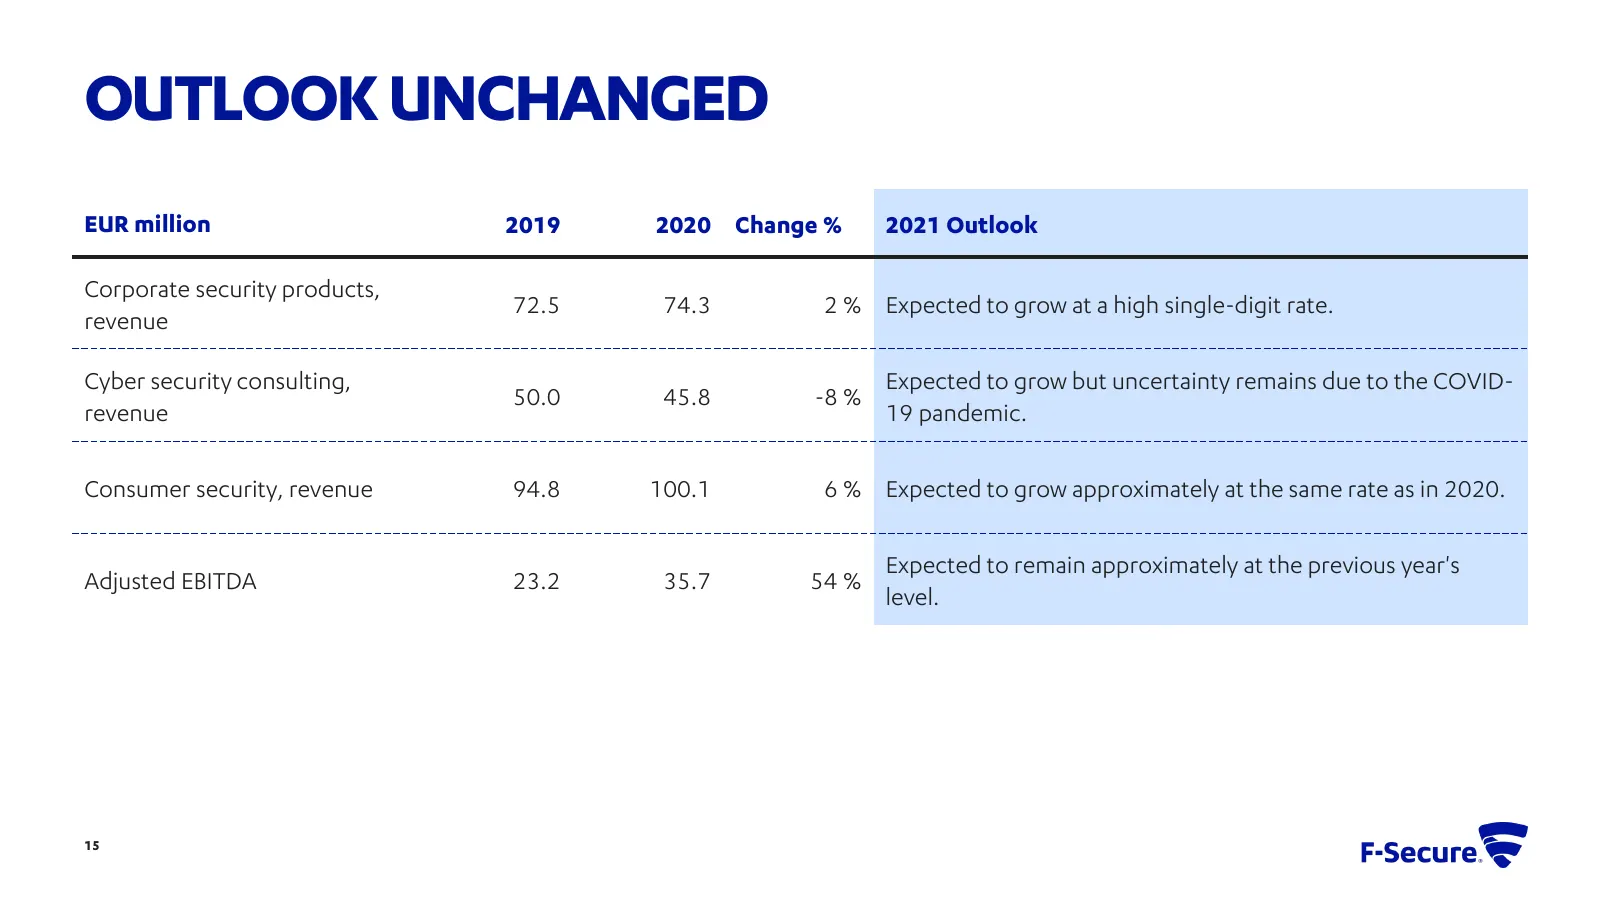
Slide 15: Outlook unchanged
OUTLOOK UNCHANGED EUR million 2019 2020 Change % 2021 Outlook Corporate security products, 72.5 74.3 2 % Expected to grow at a high single-digit rate. revenue Cyber security consulting, Expected to grow but uncertainty remains due to the COVID- 50.0 45.8 -8 % revenue 19 pandemic. Consumer security,

Slide 16: F-Secure. & e
= F-Secure. & e

Slide 17: F-Secure
F-Secure. Ut
Source: Internet Archive copy of f-secure.com
More decks from F-Secure Oyj
 Q3 2026 Earnings Presentation23 slides · Oct 28, 2026
 Q2 2026 Earnings Presentation20 slides · Jul 17, 2026
 Investor Day (June 2026)42 slides · Jun 4, 2026
 Q1 2026 Earnings Presentation19 slides · Apr 29, 2026
 Q4 2025 Earnings Presentation29 slides · Feb 5, 2026
 Q3 2025 Earnings Presentation18 slides · Oct 28, 2025