First South Bancorp — Investor Presentation (February 2017)
24 slides from First South Bancorp's investor presentation, Feb 1, 2017

Slide 1: First South Bancorp February 2017
Appendix NASDAQ: FSBK February 2017
Slide 2: Cautionary Note Regarding Forward-Looking Statements
2 CAUTIONARY NOTE REGARDING FORWARD - LOOKING STATEMENTS Certain statements in this presentation may contain “forward - looking statements” within the meaning of the Private Securities Litigation Reform Act of 1995 , such as statements relating to future plans and expectations, and are thus prospect
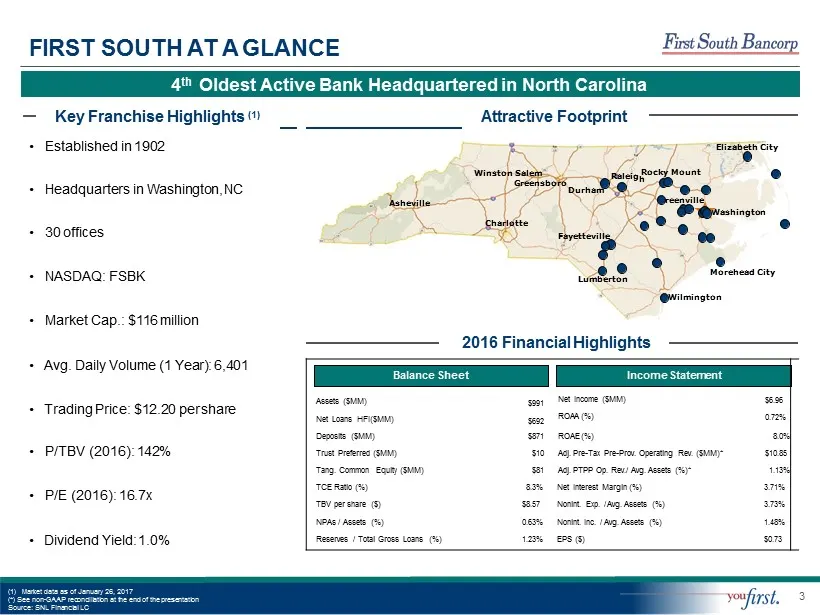
Slide 3: First South at a Glance
3 C h arlo t t e Ash eville Washington Fayetteville W il m ing t on h Winston Salem Gr e e ns boro Elizabeth City Morehead City FIRST SOUTH AT A GLANCE 4 th Oldest Active Bank Headquartered in North Carolina • Headquarters in Washington, NC • 30 offices • NASDAQ: FSBK Key Franchise Highlights (1) At
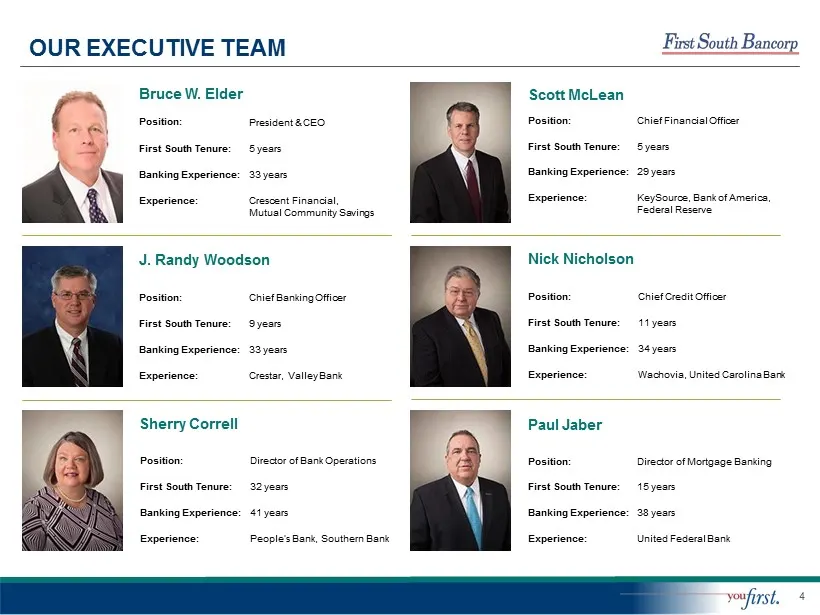
Slide 4: Our Executive Team
4 OUR EXECUTIVE TEAM J. Randy Woodson Sherry Correll Nick Nicholson Bruce W. Elder Position: President & CEO First South Tenure: 5 years Banking Experience: 33 years Experienc e : Crescent Financial, Mutual Community Savings Position: Chief Banking Officer First South Tenure: 9 years Banking Experie
Slide 5: Company Turnaround
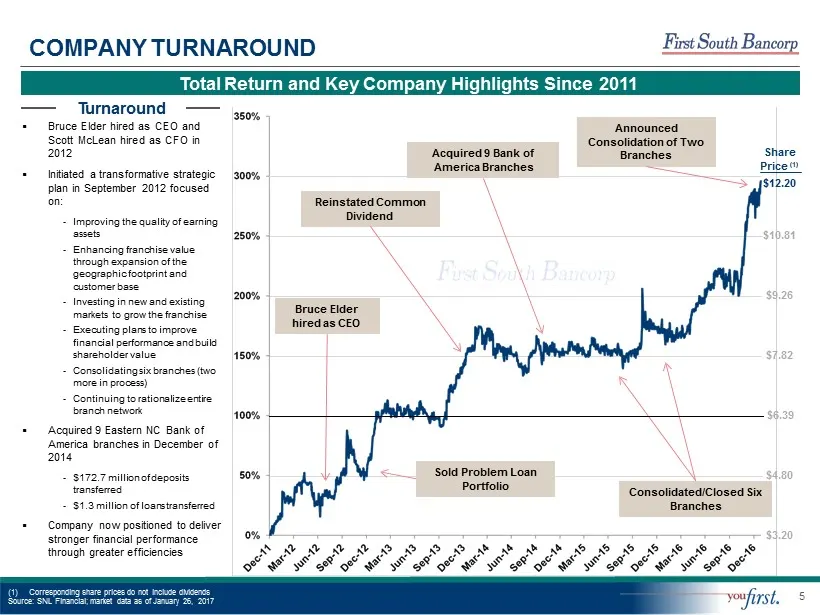
5 COMPANY TURNAROUND (1) Corresponding share prices do not include dividends Source: SNL Financial; market data as of January 26, 2017 Total Return and Key Company Highlights Since 2011 Bruce Elder hired as CEO Reinstated Common Dividend Sold Problem Loan Portfolio Acquired 9 Bank of America Branche
Slide 6: Company Turnaround (Cont.)
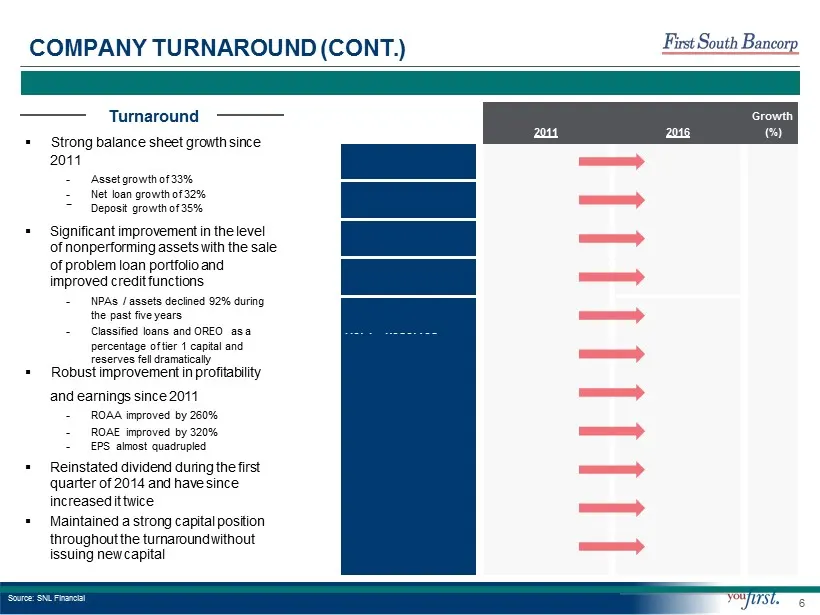
COMPANY TURNAROUND (CONT.) ▪ Strong balance sheet growth since ▪ Robust improvement in profitability Strong Growth and Improved Health Turnaround Growth 2011 2016 (%) 2011 Assets ($000s) - Asset growth of 33% 746,941 990,637 33 - Net loan growth of 32% - Deposit growth of 35% Total Net Loans ($000s)
Slide 7: Effective Business Model
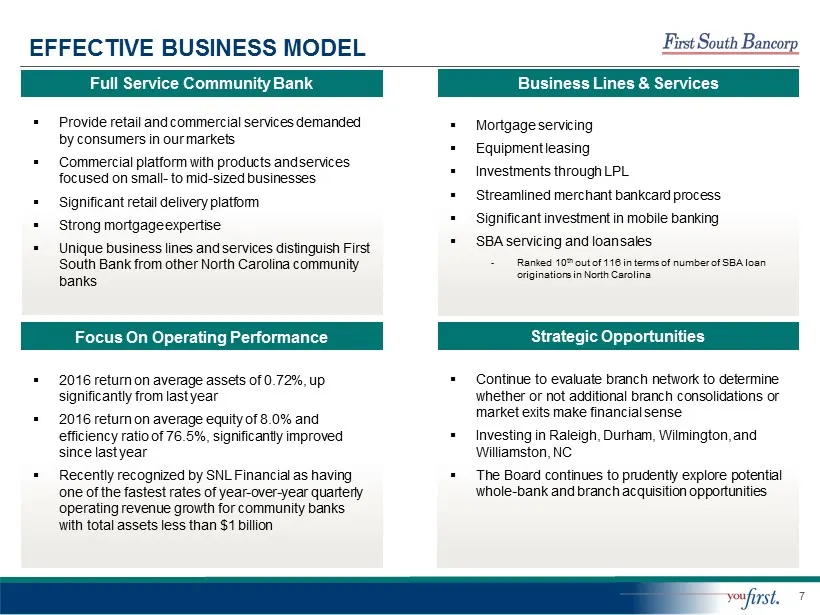
7 EFFECTIVE BUSINESS MODEL Full Service Community Bank ▪ Provide retail and commercial services demanded by consumers in our markets ▪ Commercial platform with products and services focused on small - to mid - sized businesses ▪ Significant retail delivery platform ▪ Strong mortgage expertise ▪ Uniq
Slide 8: Operating in Top North Carolina Economies
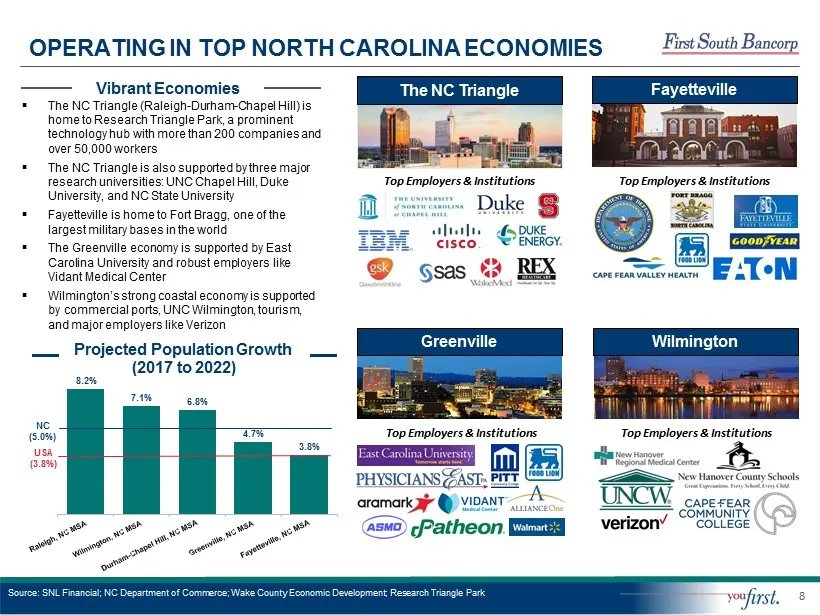
8 7.1% 6.8% 4.7% 3.8% OPERATING IN TOP NORTH CAROLINA ECONOMIES Source: SNL Financial; NC Department of Commerce; Wake County Economic Development; Research Triangle Park The NC Triangle Top Employers & Institutions Fayetteville Top Employers & Institutions Greenville Top Employers & Institutions Wi
Slide 9: Competitive Positioning
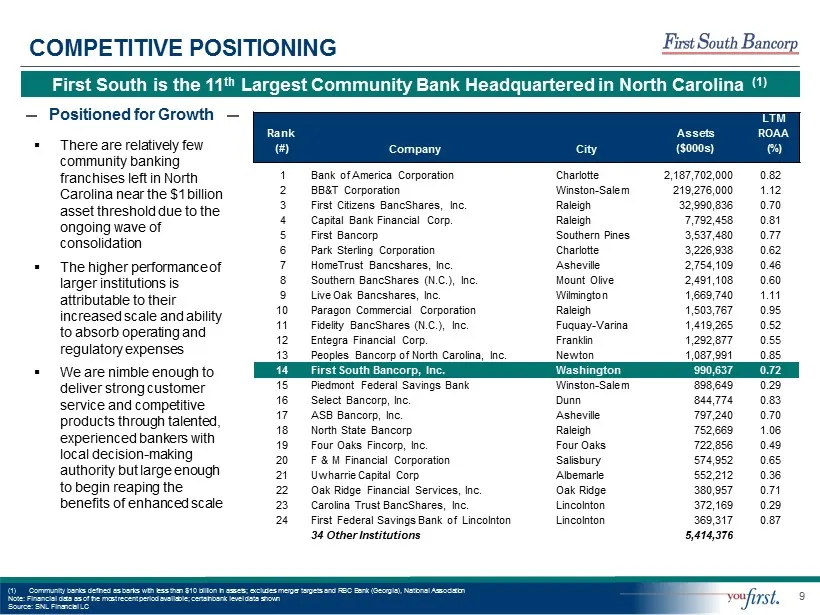
9 COMPETITIVE POSITIONING (1) Community banks defined as banks with less than $10 billion in assets; excludes merger targets and RBC Bank (Georgia), National Association Note: Financial data as of the most recent period available; certain bank level data shown Source: SNL Financial LC First South is
Slide 10: Executing on Growth Strategy
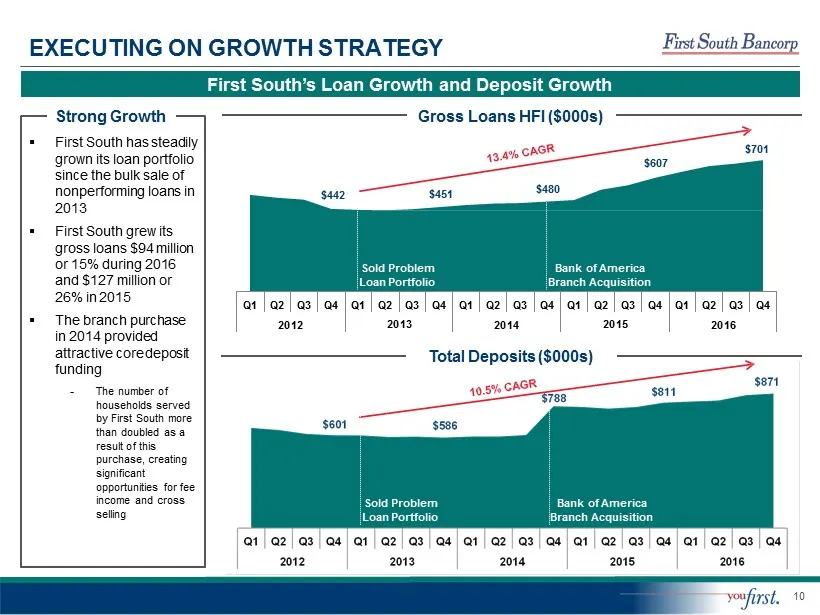
10 $442 $451 $480 $607 $701 Q 4 Q 1 Q 2 Q 3 Q4 2 0 1 2 Q 1 Q 2 Q 3 Q 4 Q 1 Q 2 Q3 2 0 1 3 2 0 1 4 Q 4 Q 1 Q 2 Q 3 Q 4 Q 1 Q 2 Q3 2 0 1 5 2 0 1 6 EXECUTING ON GROWTH STRATEGY First South’s Loan Growth and Deposit Growth Total Deposits ($000s) ▪ First South has steadily grown its loan portfolio since
Slide 11: Disciplined Loan Portfolio
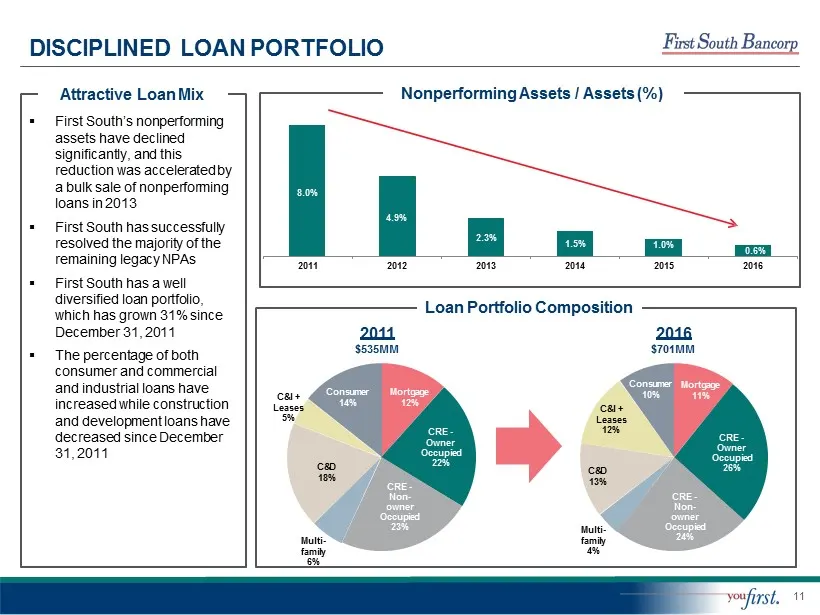
11 M o r tgage 11% CRE - Owner Oc c upied 26% CRE - Non - owner Oc c upied 24% M ulti - family 4% C&D 13% C&I + Le ase s 12% Consumer 10% M o r tgage 12% CRE - Owner Oc c upied 22% CRE - Non - owner O cc upi e d 23% M ulti - family 6% C&D 18% C&I + Le ase s 5% Consumer 14% 8.0% 4.9% 2.3% 1.5% 1.0% 0
Slide 12: Deposit Composition
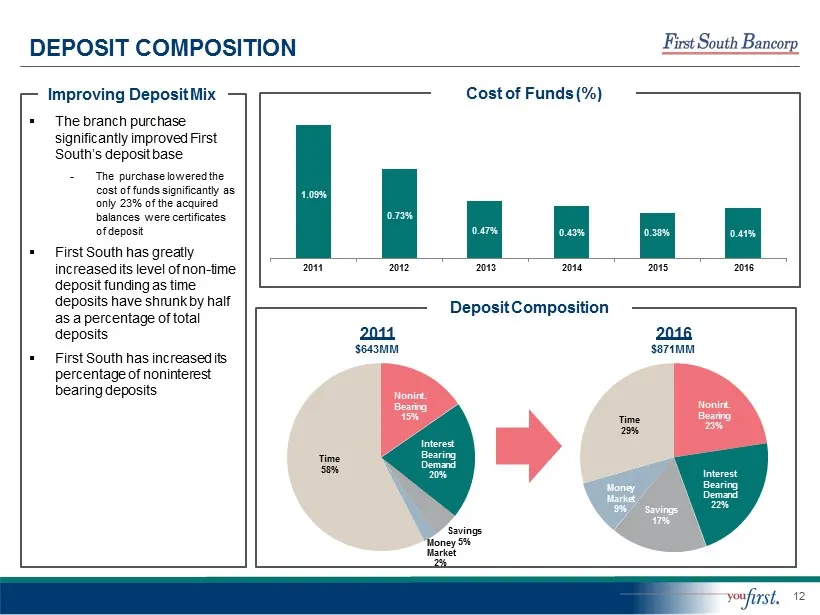
12 1.09% 0.73% 0.47% 0.43% 0.38% 0.41% 2011 2012 2013 2014 2015 2016 Nonint. Bea r ing 23% Interest Bea r ing Demand 22% S a v ings 17% M oney M a r k e t 9% T ime 29% Nonint. Bea r ing 15% Int eres t Bea r ing Demand 20% Sa v ings Money 5% Market 2% T ime 58% DEPOSIT COMPOSITION Cost of Funds (%) D
Slide 13: Revenue Trends
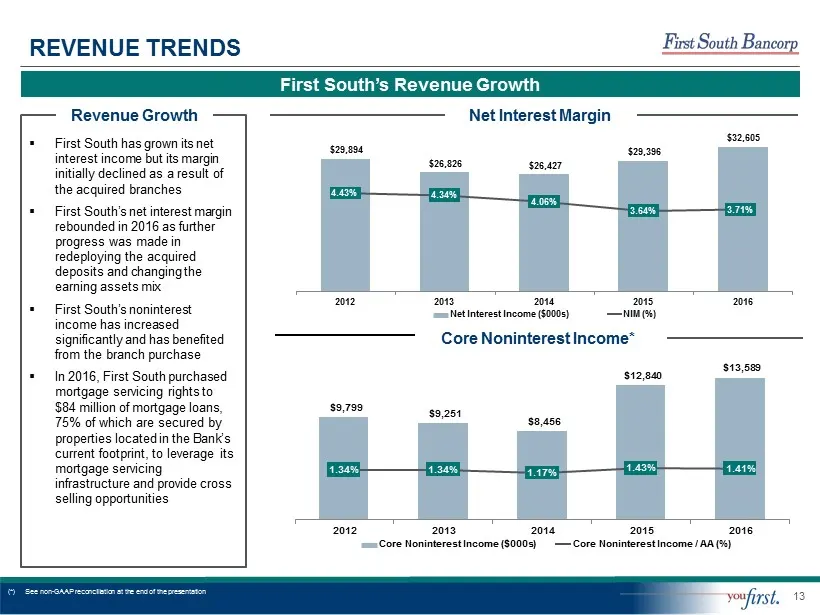
13 $9 , 799 $9 , 251 $8,456 $12 , 840 $13 , 589 1.34% 1.34% 1.17% 1.43% 1.41% 2012 2013 2014 Core Noninterest Income ($000s) 201 5 2016 Core Noninterest Income / AA (%) REVENUE TRENDS First South’s Revenue Growth ▪ First South has grown its net interest income but its margin initially declined as a
Slide 14: Enhanced Efficiency Metrics
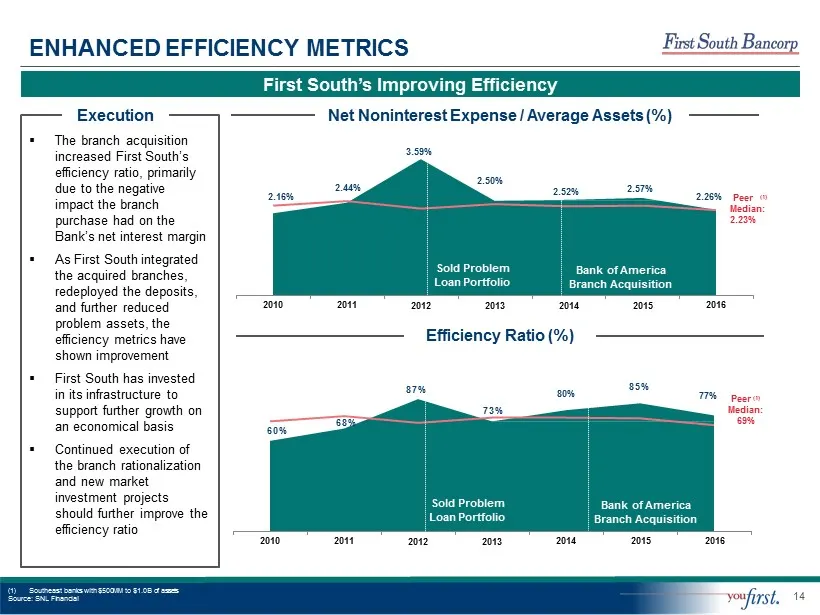
14 ENHANCED EFFICIENCY METRICS First South’s Improving Efficiency ▪ The branch acquisition increased First South’s efficiency ratio, primarily due to the negative impact the branch purchase had on the Bank’s net interest margin ▪ As First South integrated the acquired branches, redeployed the deposi
Slide 15: Creating Shareholder Value
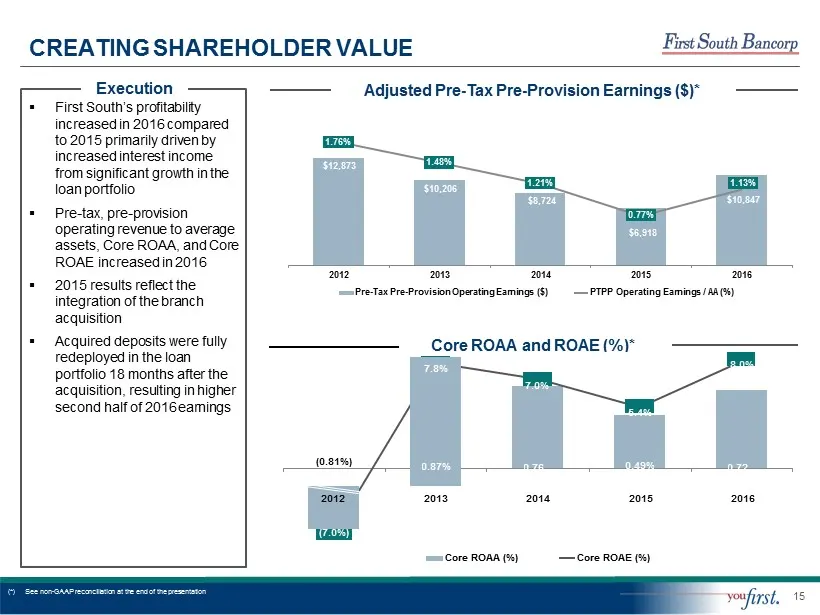
15 CREATING SHAREHOLDER VALUE Adjusted Pre - Tax Pre - Provision Earnings ($)* Core ROAA and ROAE (%)* ▪ First South’s profitability increased in 2016 compared to 2015 primarily driven by increased interest income from significant growth in the loan portfolio ▪ Pre - tax, pre - provision operating r
Slide 16: Creating Shareholder Value (Cont.)
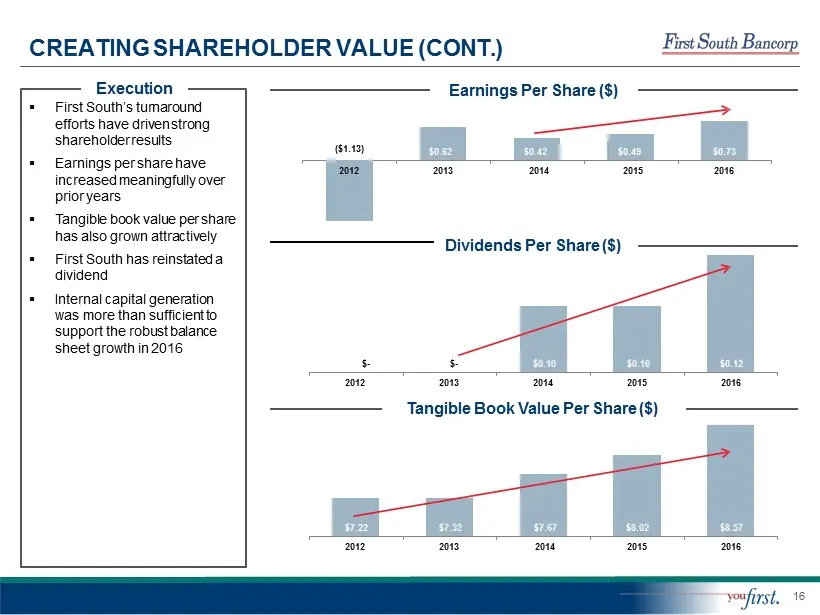
16 ($1.13) $0.62 $0 . 42 $0 . 49 $0.73 2012 2013 2014 2015 2016 CREATING SHAREHOLDER VALUE (CONT.) Earnings Per Share ($) ▪ First South’s turnaround efforts have driven strong shareholder results ▪ Earnings per share have increased meaningfully over prior years ▪ Tangible book value per share has al
Slide 17: Selected Southeast Banks $1.0B to $2.0B of Assets
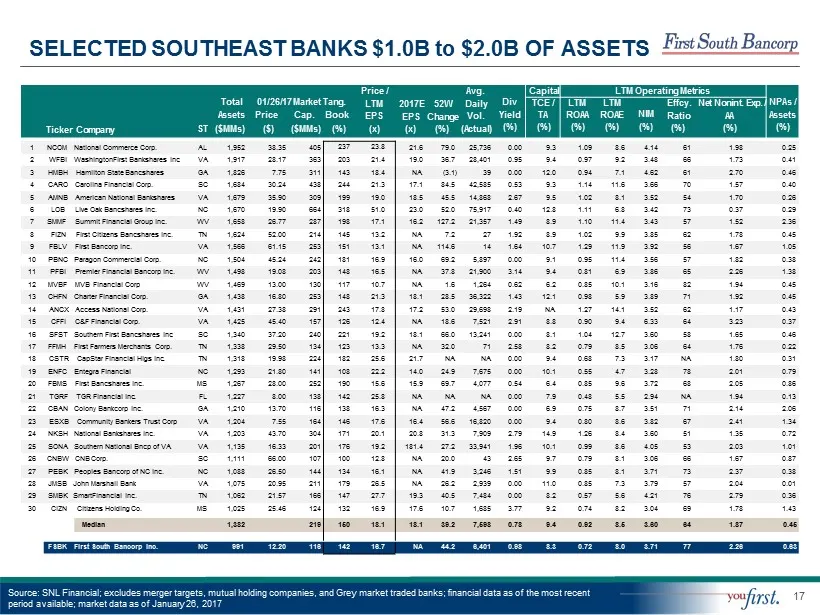
17 SELECTED SOUTHEAST BANKS $1.0B to $2.0B OF ASSETS Source: SNL Financial; excludes merger targets, mutual holding companies, and Grey market traded banks; financial data as of the most recent period available; market data as of January 26, 2017 Ticker Company Total A ss e ts ST ($MMs) 01/26/17 Mar
Slide 18: Investment highlights
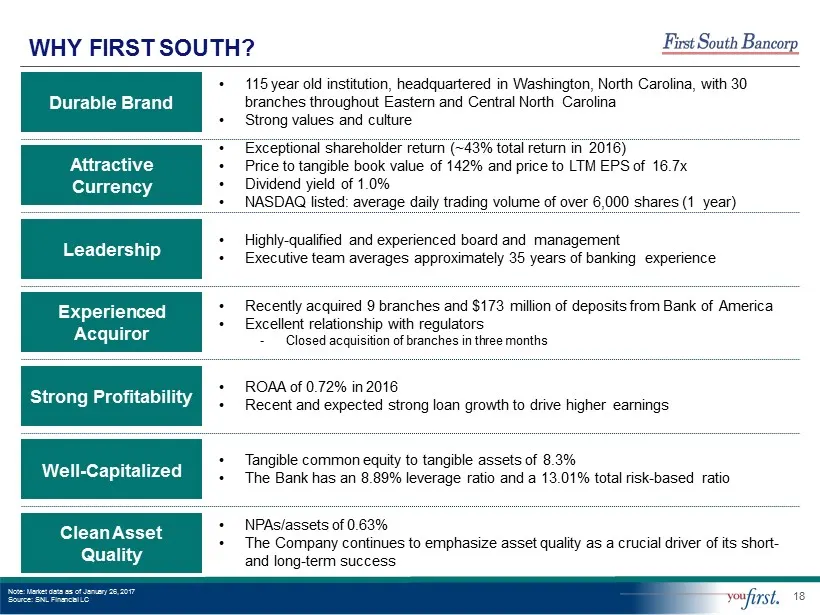
18 Strong Profitability Durable Brand • 115 year old institution, headquartered in Washington, North Carolina, with 30 branches throughout Eastern and Central North Carolina • Strong values and culture Well - Capitalized Experienced Acquiror A t t ra c t i v e Currency Leadership • Highly - qualifie
Slide 19: Our Culture: You First Banking
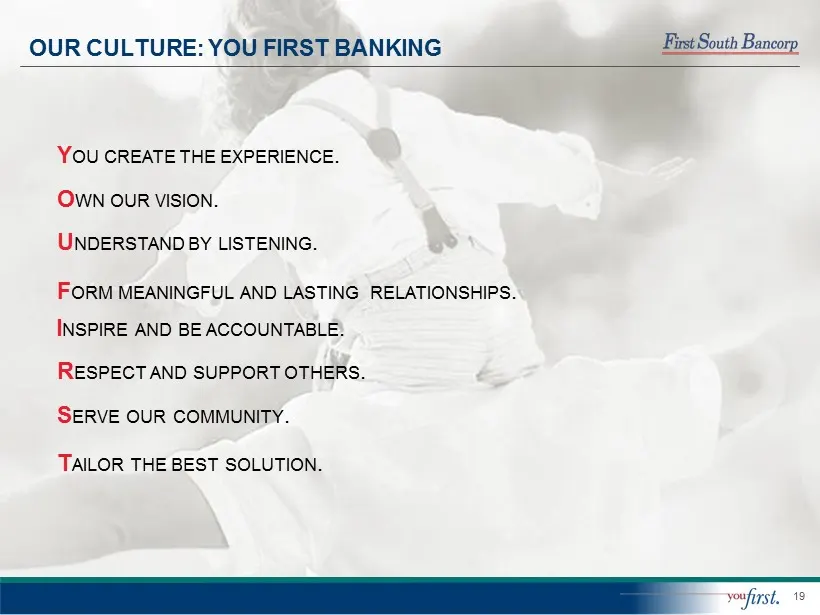
19 OUR CULTURE: YOU FIRST BANKING Y OU CREATE THE EXPERIENCE . O WN OUR VISION . U NDERSTAND BY LISTENING . F ORM MEANINGFUL AND LASTING RELATIONSHIPS . I NSPIRE AND BE ACCOUNTABLE . R ESPECT AND SUPPORT OTHERS . S ERVE OUR COMMUNITY . T AILOR THE BEST SOLUTION .
Slide 20: Appendix
Appendix Append i x
Slide 21: Our Directors
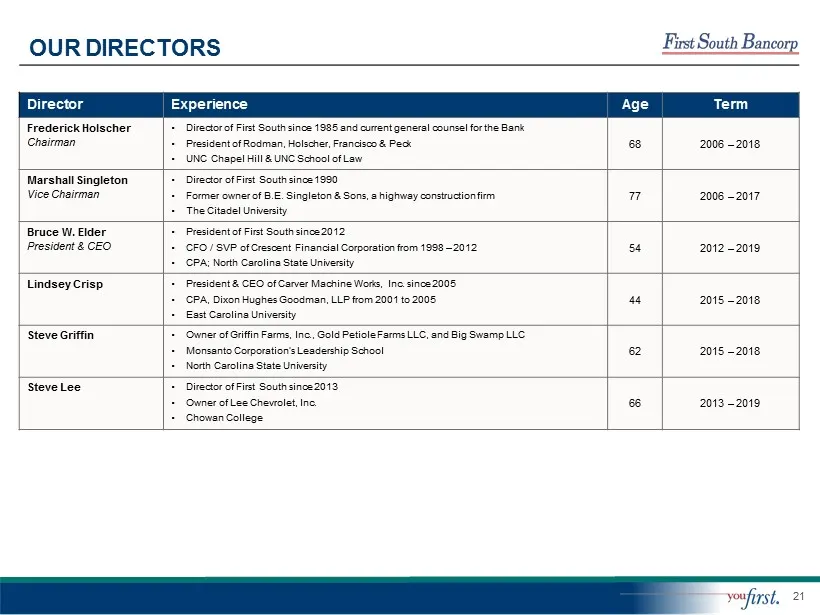
21 OUR DIRECTORS Director Experience Age Term Frederick Holscher Chairman • Director of First South since 1985 and current general counsel for the Bank • President of Rodman, Holscher, Francisco & Peck • UNC Chapel Hill & UNC School of Law 68 2006 – 2018 Marshall Singleton Vice Chairman • Director o
Slide 22: Non-GAAP Reconciliation – PTPP Operating Earnings
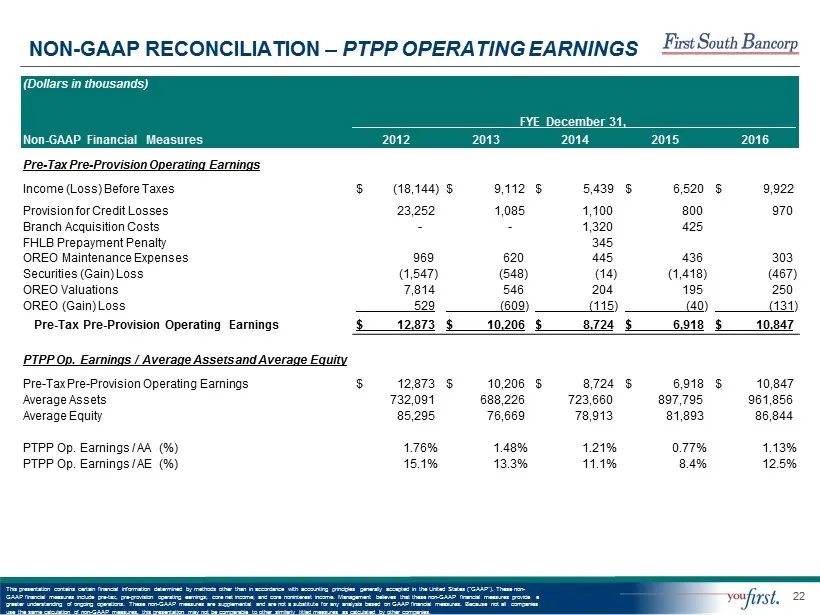
22 NON - GAAP RECONCILIATION – PTPP OPERATING EARNINGS (Dollars in thousands) FYE December 31, Non - GAAP Financial Measures 2012 2013 2014 2015 2016 Pre - Tax Pre - Provision Operating Earnings Income (Loss) Before Taxes $ (18,144) $ 9,112 $ 5 , 43 9 $ 6,520 $ 9 , 92 2 Provision for Credit Losses 2
Slide 23: Non-GAAP Reconciliation – Core Net Income
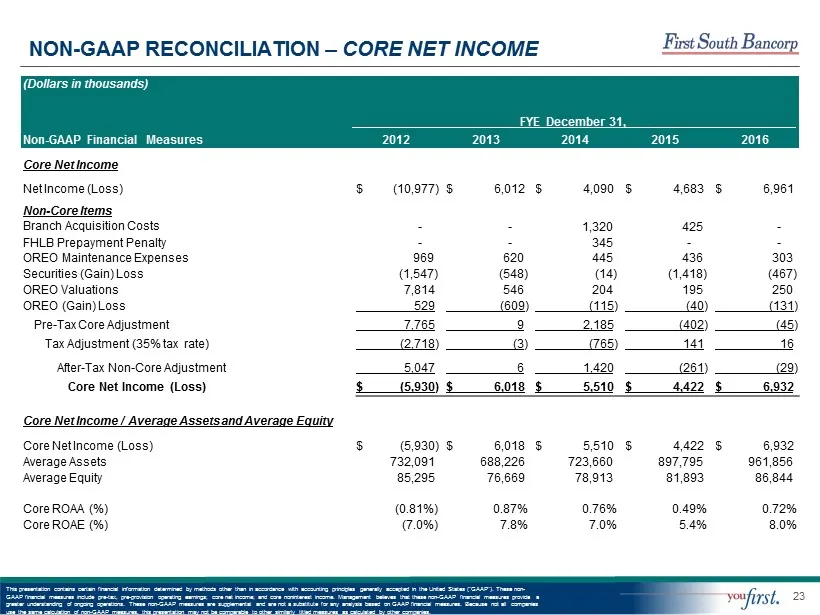
23 NON - GAAP RECONCILIATION – CORE NET INCOME (Dollars in thousands) FYE December 31, Non - GAAP Financial Measures 2012 2013 2014 2015 2016 Core Net Income Net Income (Loss) $ (10,977) $ 6,012 $ 4 , 09 0 $ 4,683 $ 6 , 96 1 Non - Core Items Branch Acquisition Costs - - 1 , 32 0 425 - FHLB Prepaymen
Slide 24: Non-GAAP Reconciliation – Core Noninterest Income
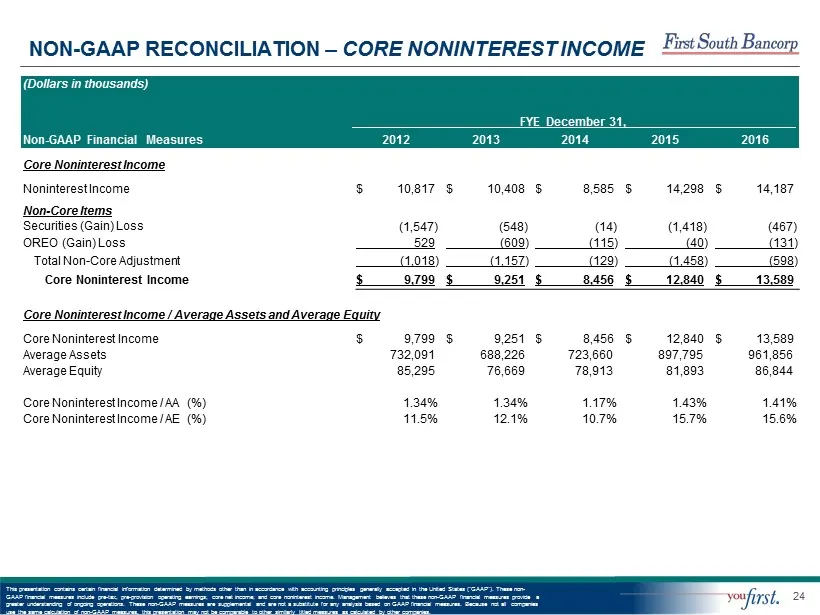
24 NON - GAAP RECONCILIATION – CORE NONINTEREST INCOME (Dollars in thousands) FYE December 31, Non - GAAP Financial Measures 2012 2013 2014 2015 2016 Core Noninterest Income Noninterest Income $ 10,817 $ 10,408 $ 8 , 58 5 $ 14,298 $ 14 , 18 7 Non - Core Items Securities (Gain) Loss ( 1 , 547 ) ( 548
Source: SEC EDGAR · 8-K filed Feb 1, 2017