Airtran — Bear Stearns Global Transportation Conference 2007
28 slides from Airtran's conference presentation, May 11, 2007
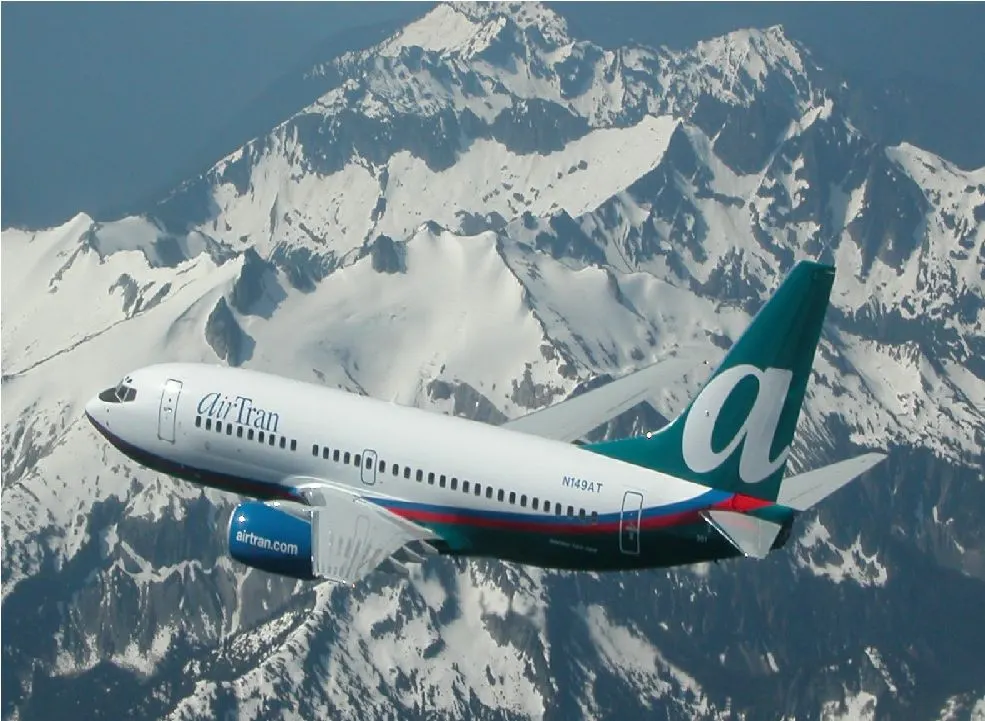
Slide 1: Bear Stearns Global Transportation Conference
1 Bear Stearns Global Transportation Conference May 9, 2007 Exhibit 99.1 Bear Stearns Global Transportation Conference May 9, 2007
Slide 2: Forward Looking Information
2 Forward Looking Information Certain of the statements contained herein should be considered “forward-looking statements,” including, except in connection with the Offer (as defined below) within the meaning of the Private Securities Litigation Reform Act of 1995. These forward-looking statements m
Slide 3: Safe Harbor Disclosure
3 Safe Harbor Disclosure Safe Harbor Disclosure Additional Information This document relates, in part, to the offer (the “ Offer ”) by AirTran, through its wholly-owned subsidiary, Galena Acquisition Corp. (“ Galena ”), to exchange each issued and outstanding share of common stock and Series A Junio
Slide 4: AirTran Airways Today
4 Youngest all-Boeing fleet in America – 132 Airplanes – 87 717s / 45 737s 56 cities served – Announced 7 new cities in 2007 Charleston, SC Portland, ME Daytona Beach, FL St. Louis, MO Newburgh, NY San Diego, CA Phoenix, AZ Consistent record of profitability – One of two consistently profitable airl
Slide 5: AirTran Airways Business Model
5 To provide a superior product with very low costs – Assigned seating – Business class Only major U.S. airline with business class on every flight – Convenient distribution Internet, telephone reservations, and travel agencies – XM Radio and oversized luggage bins – Friendly crewmembers Provide val
Slide 6: AirTran Has Very Low Costs
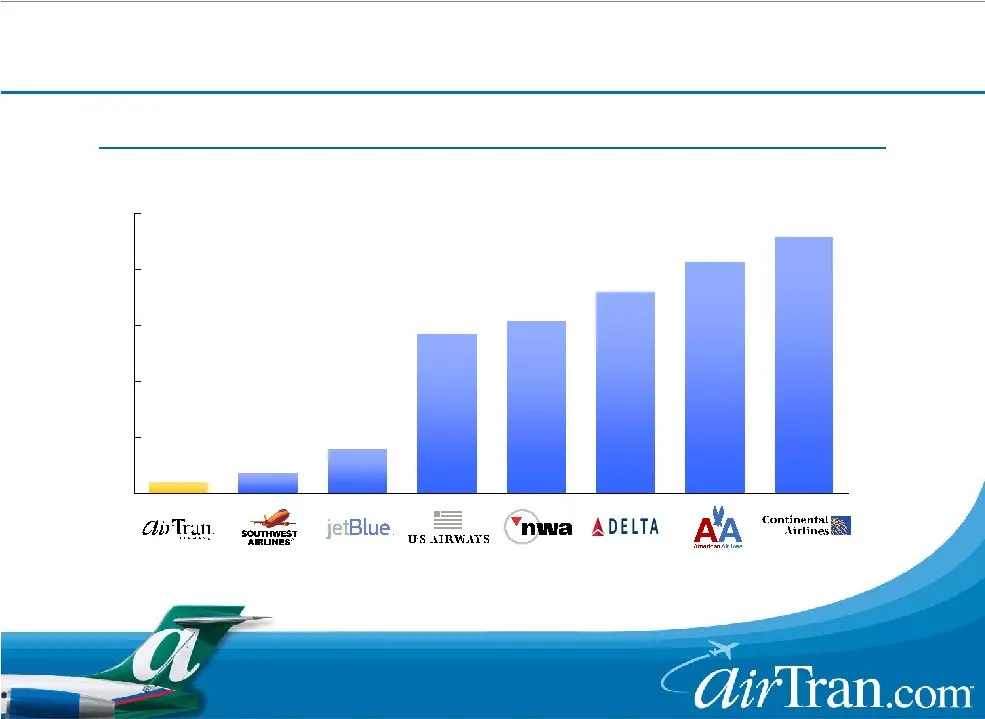
6 (cents) AirTran Has Very Low Costs AirTran Has Very Low Costs While legacy costs are down, gap remains large * Excludes fuel and special items Industry Cost Comparison Non-Fuel Unit Costs at 652 Miles for 2006 Q406 =5.94 cents
Slide 7: AirTran's Non-Fuel Unit Cost Trend
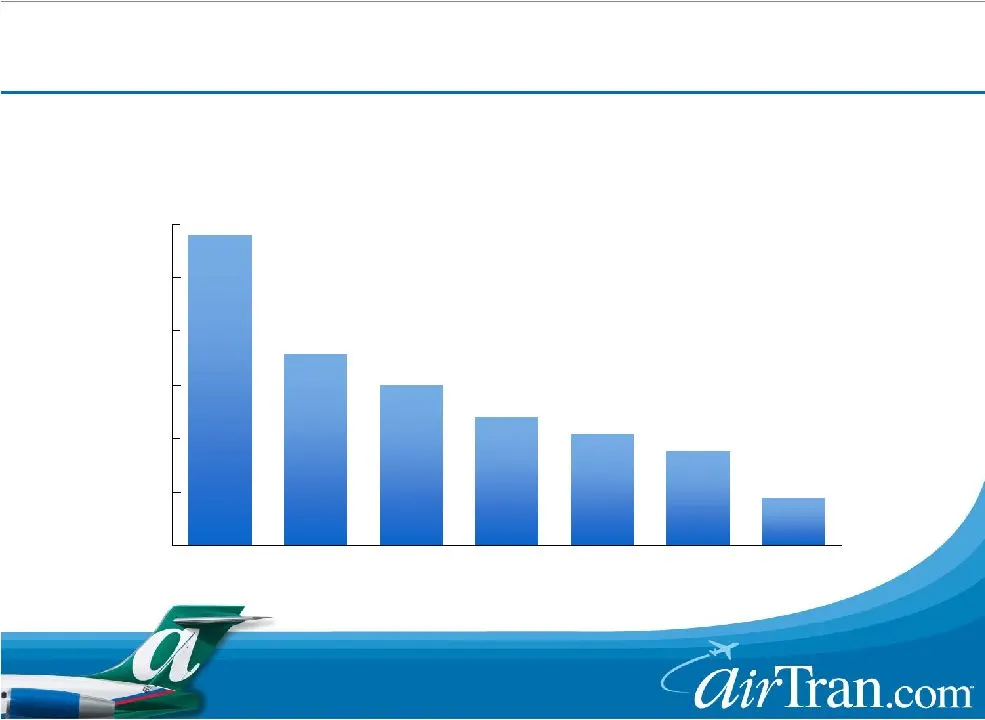
7 5.75 6.00 6.25 6.50 6.75 7.00 7.25 2001 2002 2003 2004 2005 2006 2007E * Excludes non-recurring special items (cents per mile) AirTran’s Non-Fuel Unit Cost Trend -3% Projecting A Sixth Consecutive Year Of Cost Reductions Projecting A Sixth Consecutive Year Of Cost Reductions
Slide 8: AirTran Is Poised To Become Industry Low Cost Provider
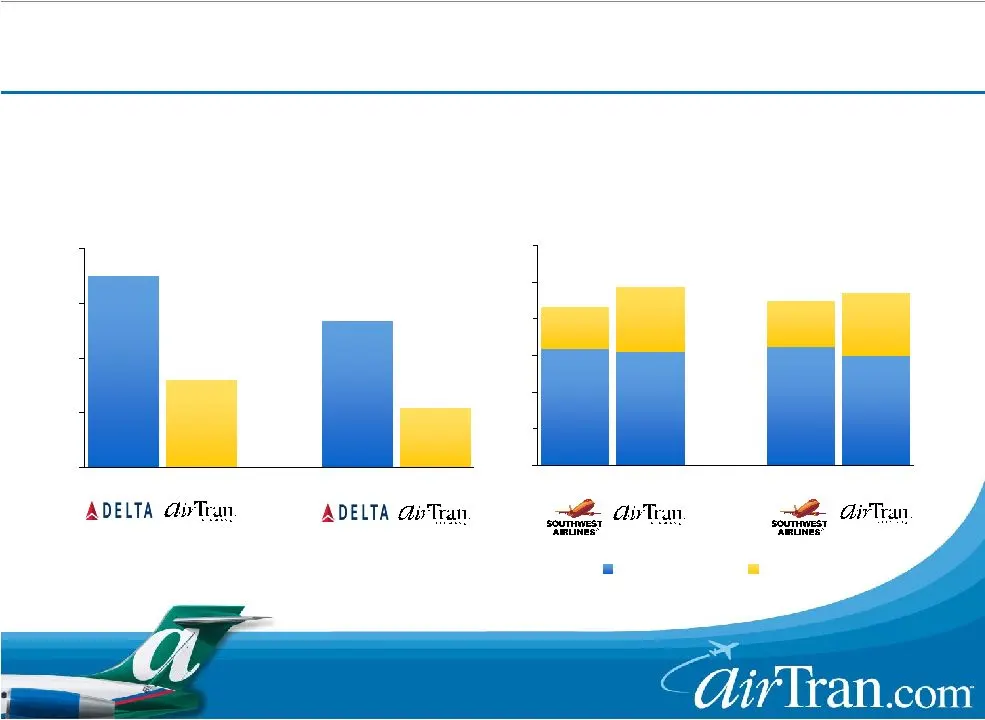
8 Non-Fuel CASM 2001 2001 2006 2006 2006 2006 2007E 2007E Non-Fuel CASM Fuel CASM AAI 12% Higher AAI 4-5% Higher AAI -34% Lower AAI -35% Lower (cents) (cents) Despite bankruptcy, cost advantage vs. Delta has stayed the same Cost gap vs. Southwest has narrowed AirTran Is Poised To Become Industry Low
Slide 9: AirTran Delivers Both Low Costs And High Quality
9 AirTran AirTran AirTran 2005 2004 2003 2006 AirTran JetBlue Frontier Northwest Southwest Continental United Alaska American ATA JetBlue Independence Southwest United America West Northwest Continental Alaska American JetBlue Southwest United Alaska America West Northwest American Continental ATA 1
Slide 10: J.D. Power Airline Survey Validates Strong Products
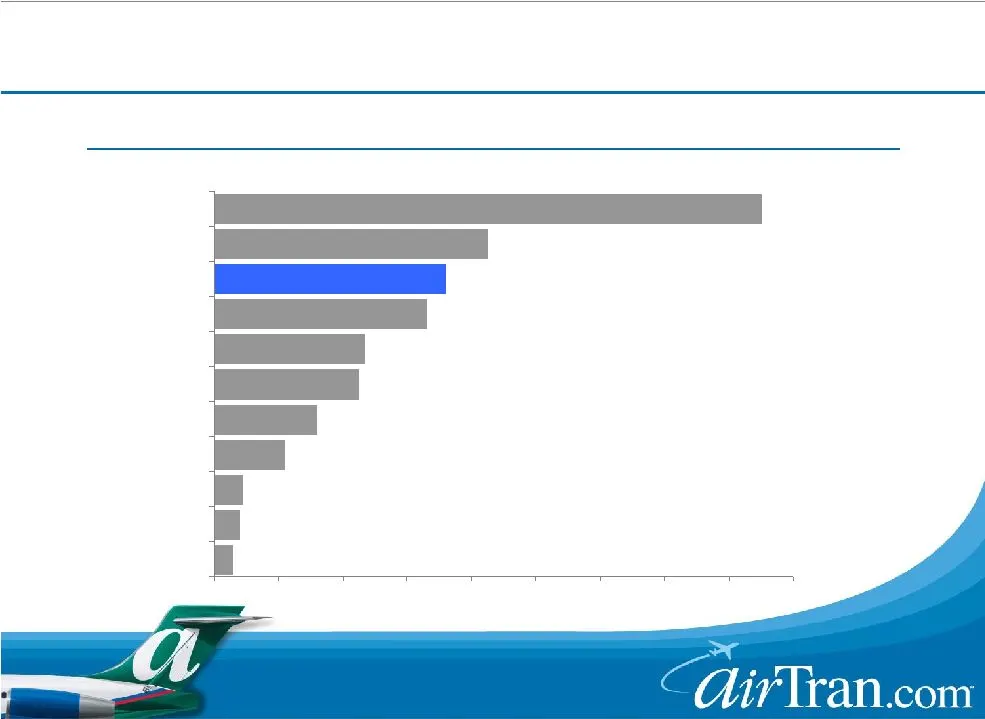
10 Overall Customer Satisfaction for 2006 Northwest Airlines United Airlines US Airways Alaska Airlines American Airlines Delta Airlines Continental Airlines Frontier Airlines AirTran Airways Southwest Airlines JetBlue Airways Mean / Weighted Average J.D. Power Airline Survey Validates Strong Produc
Slide 11: Operational Quality Service Excels In 2007
11 Operational Quality Service Excels In 2007 Operational Quality Service Excels In 2007 0.63 0.60 Consumer Complaints (100K Enplanements) 3.74 3.86 Mishandled Baggage (1K Passengers) 98.5% 99.0% Completion Factor 76.4% 75.8% On-Time Arrival A14 Q1-2007 Major Carrier Rank Q1-2007 Q1-2006
Slide 12: Low Costs And Modern Jets Create Great Growth Opportunities
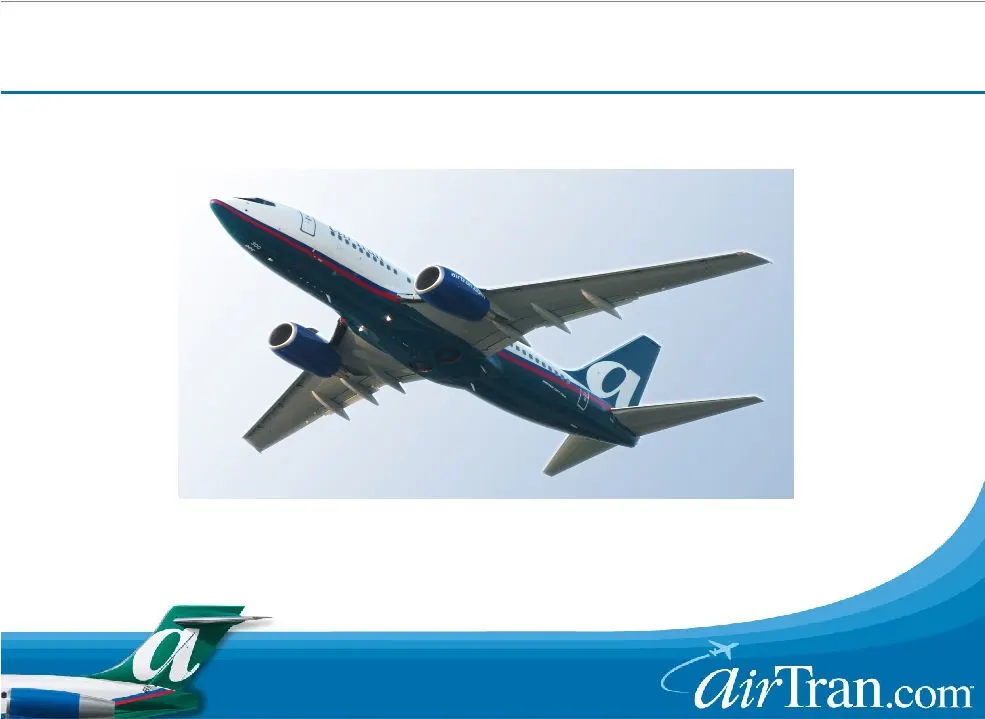
12 Low Costs And Modern Jets Create Great Low Costs And Modern Jets Create Great Growth Opportunities Growth Opportunities
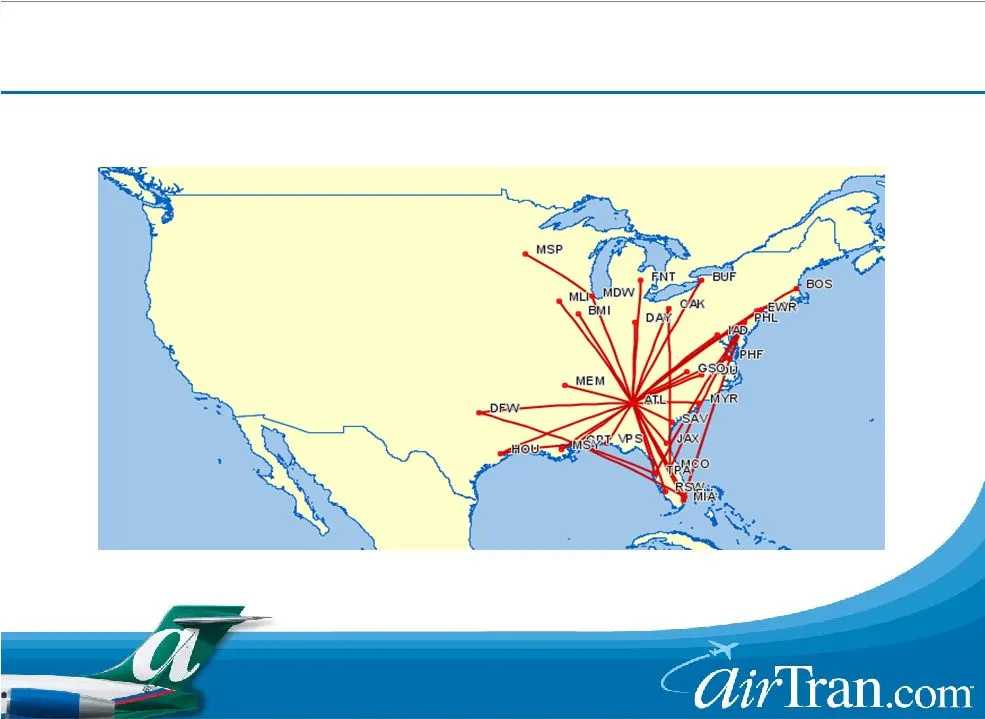
Slide 13: Route Map August 2000
13 Route Map Route Map August 2000 Cities: 31 Cities: 31 Routes: 38 Routes: 38 Transcon: 0% Transcon: 0%
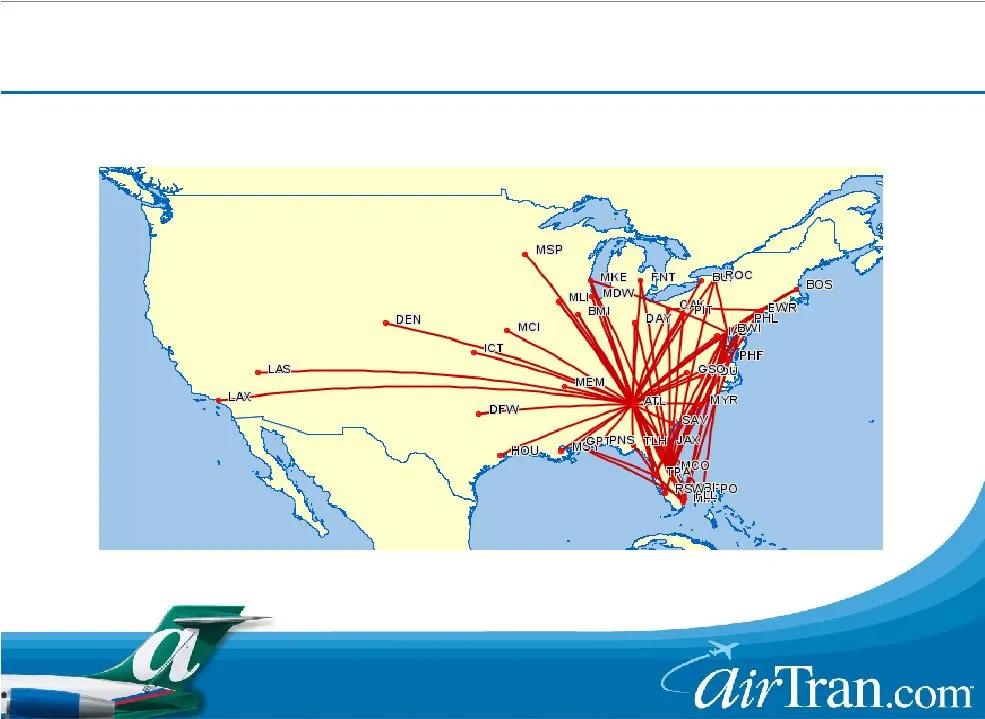
Slide 14: Route Map August 2003
14 Route Map Route Map August 2003 Cities: 43 Cities: 43 Routes: 71 Routes: 71 Transcon: 9% Transcon: 9%
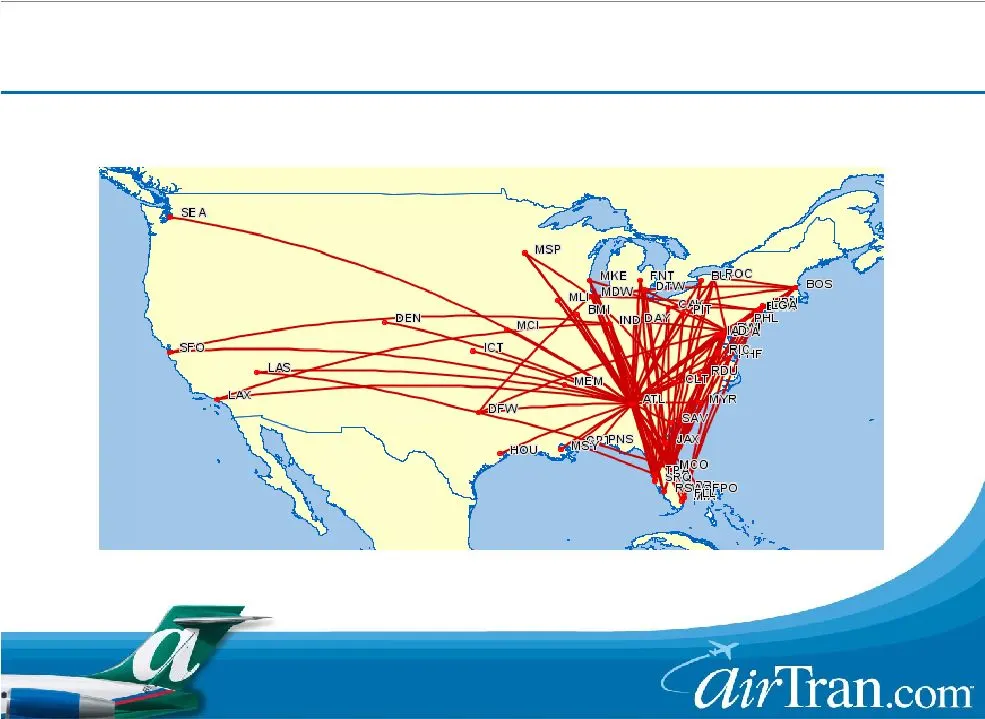
Slide 15: Route Map August 2006
15 Route Map Route Map August 2006 Cities: 50 Cities: 50 Routes: 106 Routes: 106 Transcon: 17% Transcon: 17%
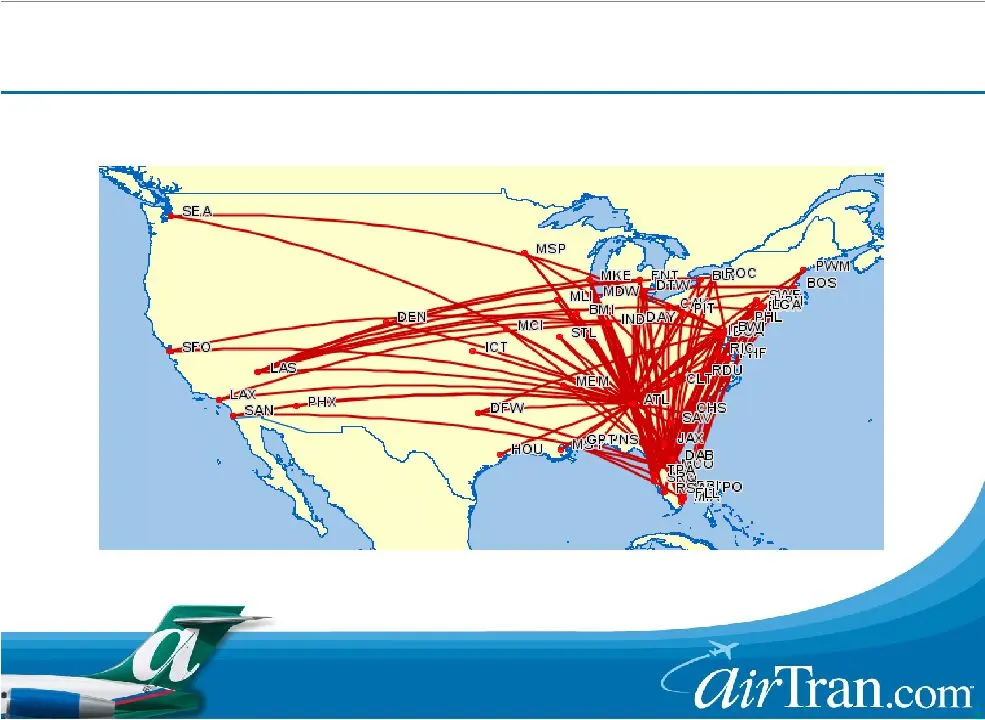
Slide 16: Route Map August 2007
16 Route Map Route Map August 2007 Cities: 56 Cities: 56 Routes: 129 Routes: 129 Transcon: 23% Transcon: 23%
Slide 17: Network Breadth Drives Cost And Revenue Efficiencies
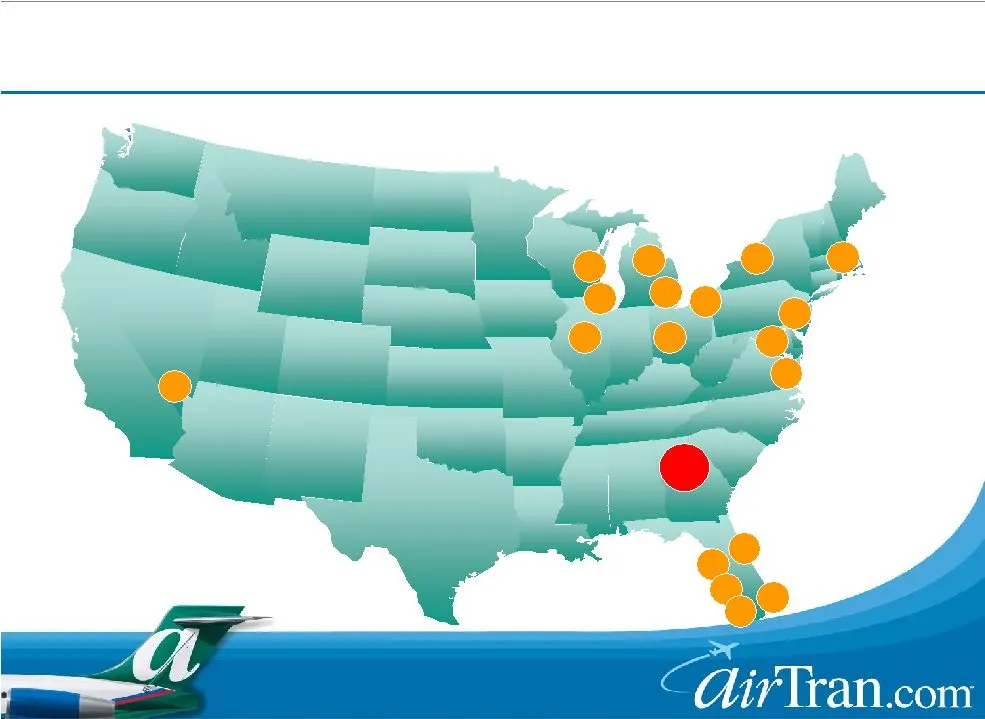
17 54 Orlando Orlando Atlanta Atlanta November 2007 Baltimore Baltimore Tampa Tampa Philadelphia Philadelphia Newport News Newport News Akron / Canton Akron / Canton Boston Boston Ft. Lauderdale Ft. Lauderdale Indianapolis Indianapolis Chicago Chicago Network Breadth Drives Cost And Revenue Efficien
Slide 18: AirTran's Atlanta Hub Is The World's Largest Low Cost Hub
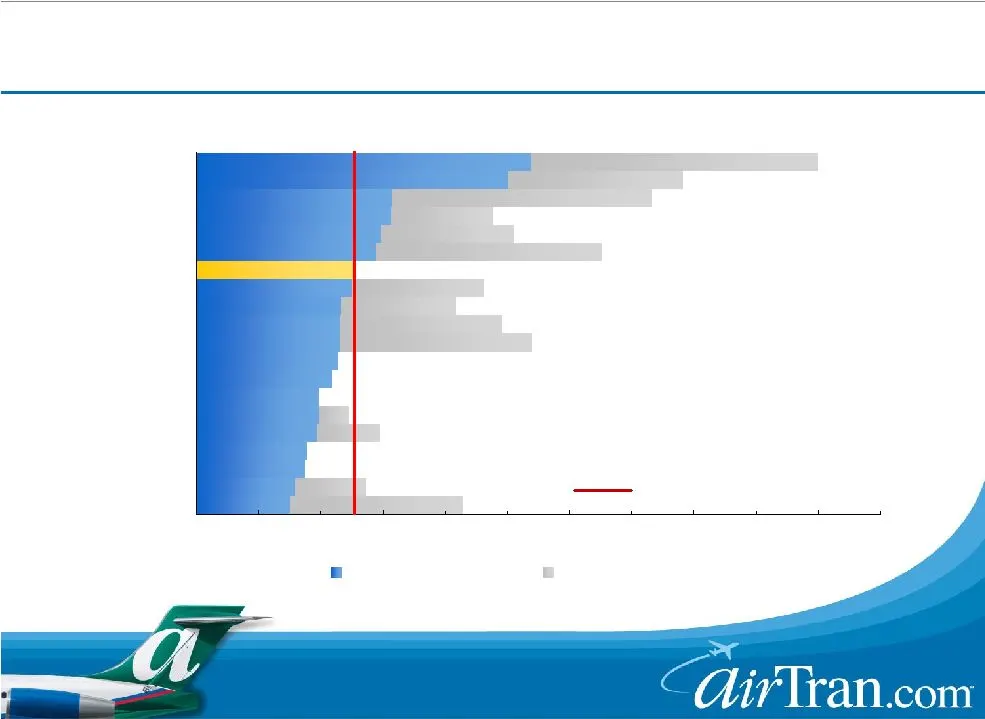
18 1,000 1,100 LCC-Philadelphia UAUA-San Francisco LUV-Baltimore JBLU-New York LCC-Phoenix AA-Miami LUV-Phoenix LUV-Chicago LUV-Las Vegas LCC-Charlotte AA-Chicago CAL-Newark UAUA-Denver AAI-Atlanta UAUA-Chicago NWAC-Detroit NWAC-Minneapolis CAL-Houston AA-Dallas DAL-Atlanta Mainline Departures Regio
Slide 19: Low Cost Fleet Plan
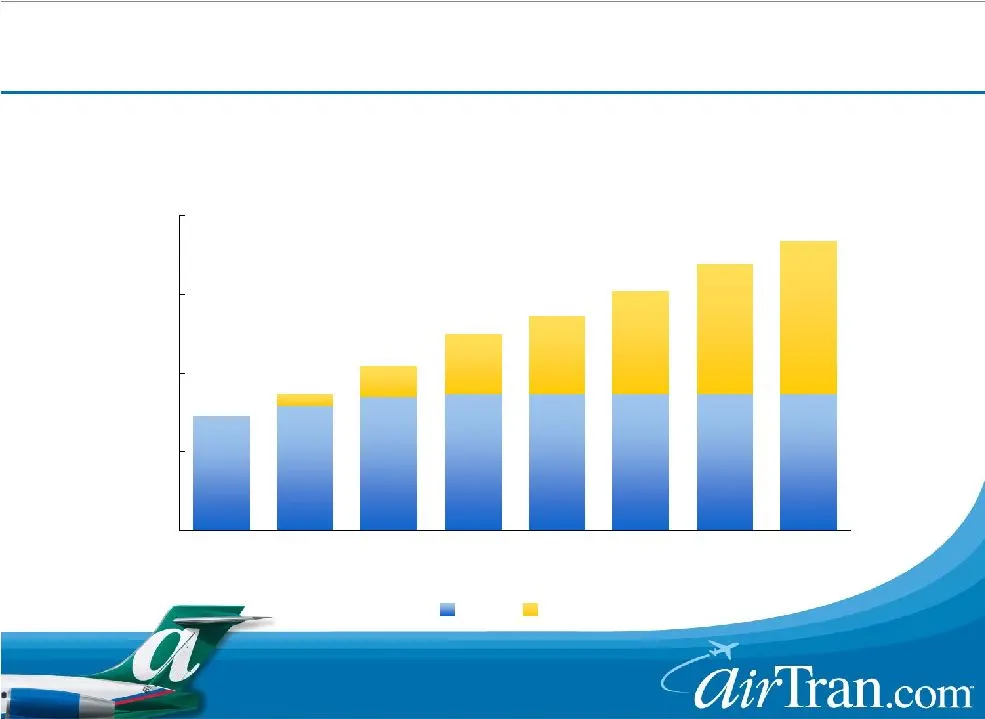
19 2003 2004 2005 2006 2007 2008 2009 2010 717s 737s Aircraft Currently 132 Aircraft: 87 717s / 45 737s Low Cost Fleet Plan Low Cost Fleet Plan
Slide 20: Revenue Outlook Is Improving
20 AirTran RASM performance has improved – Q107 RASM down 0.4% on a 20% increase in capacity – Competitive capacity has been reduced Q207 demand continues to look good – Expect passenger RASM to be down 3-4% – Non-fuel operating CASM should be down 5-6% – Expect record quarterly net income Revenue O
Slide 21: AirTran Continues To Manage Fuel Exposure
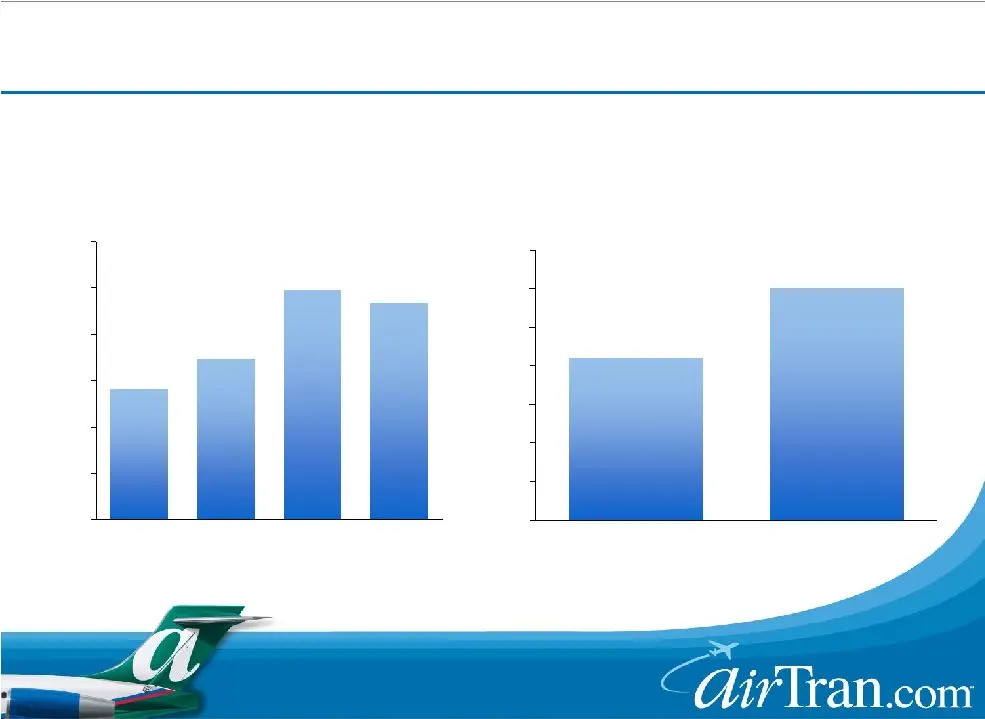
21 28% 35% 50% 47% ASMs per Gallon 2000 2006 >40% improvement AirTran's Current Hedge Position 0% 10% 20% 30% 40% 50% 60% Q107 Q207 Q307 Q407 $2.05/gal to $2.10/gal Forecast $2.00/gal to $2.05/gal Forecast $2.00/gal to $2.05/gal Forecast $1.96/gal actual AirTran Continues To Manage Fuel Exposure Air
Slide 22: Midwest Air Group Update
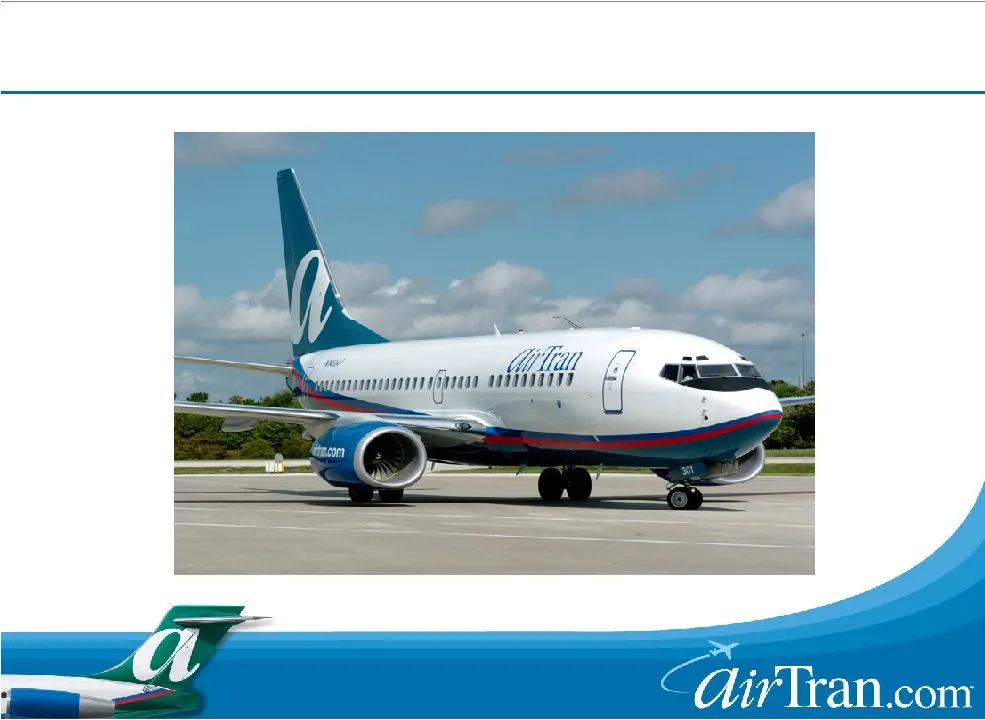
22 Midwest Air Group Update Midwest Air Group Update
Slide 23: Powerful Strategic Rationale
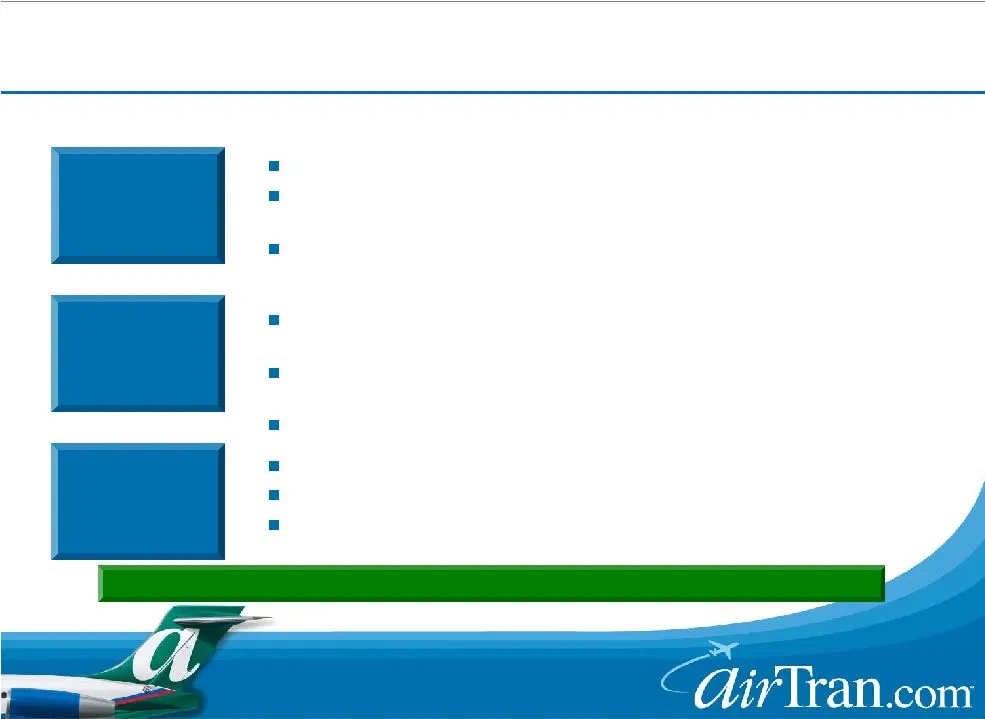
23 Network Fleet Financial AirTran & Midwest Are Stronger Together Than As Independent Entities Complementary route networks with limited overlap Combine AirTran’s strong East Coast network with Midwest’s hubs in Milwaukee and Kansas City Improved scale in consolidating industry with improved increm
Slide 24: Complementary Route Networks
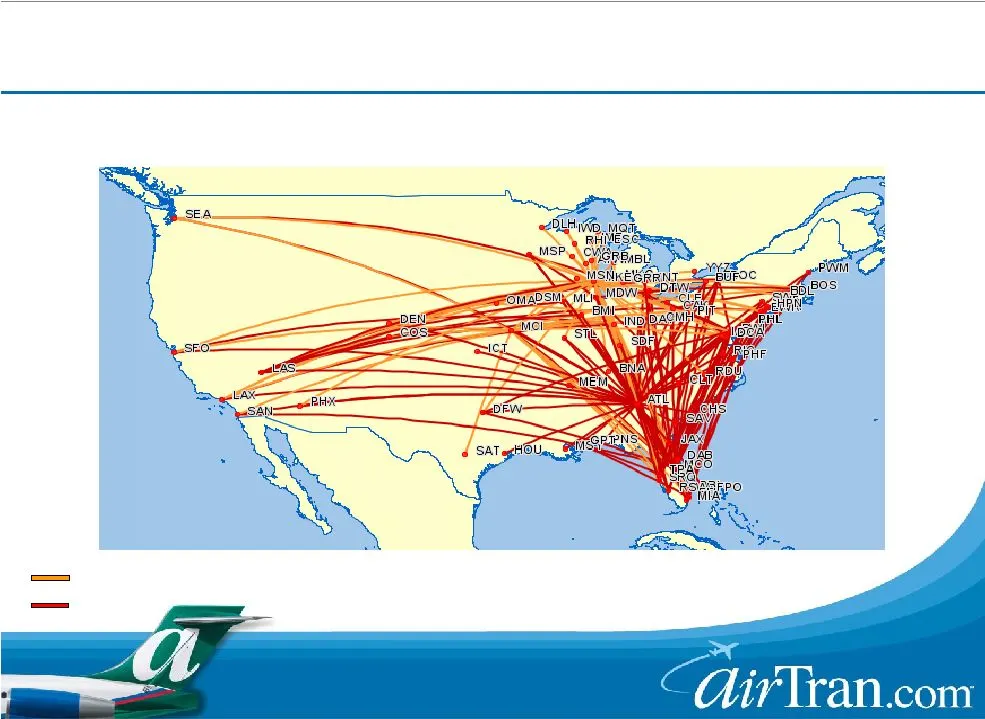
24 AirTran Midwest Combined carrier will be well positioned in key markets throughout the Eastern, Midwestern and Southeastern U.S. Complementary Route Networks Complementary Route Networks
Slide 25: Merger Creates Instant Diversification
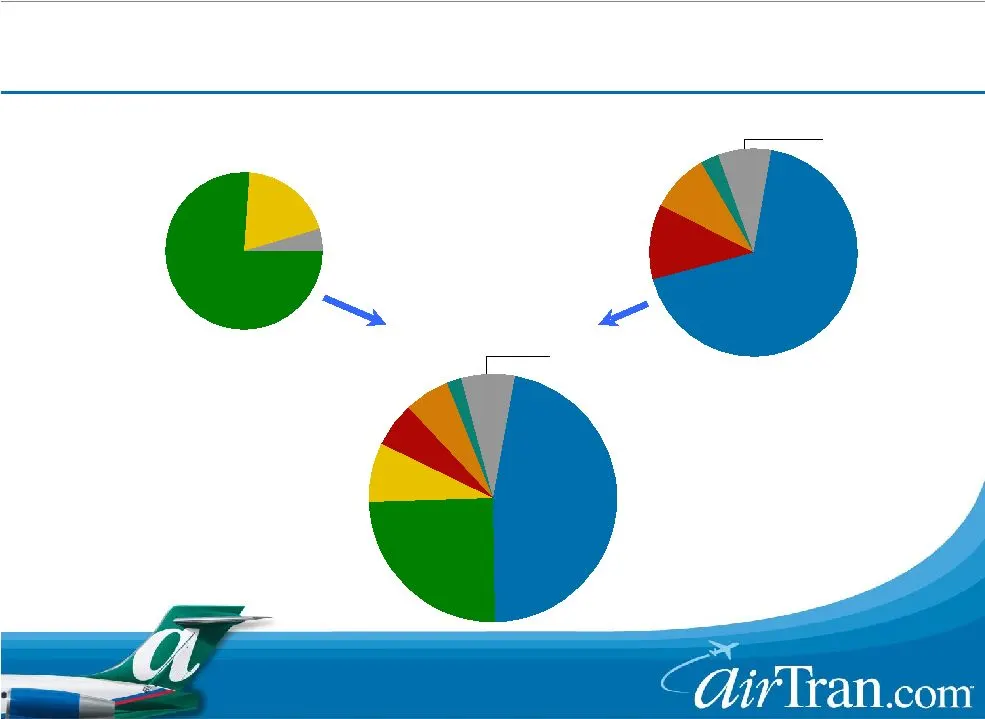
25 77% 4% 68% 12% 9% 3% 8% 46% 25% 6% 6% 2% 7% 19% Midwest Network AirTran Network Combined Network Milwaukee Kansas City Other Atlanta Orlando Baltimore Chicago Other Atlanta Milwaukee Kansas City Orlando Baltimore Chicago Other Share of departures Merger Creates Instant Diversification Merger Crea
Slide 26: Potential Combination Synergies
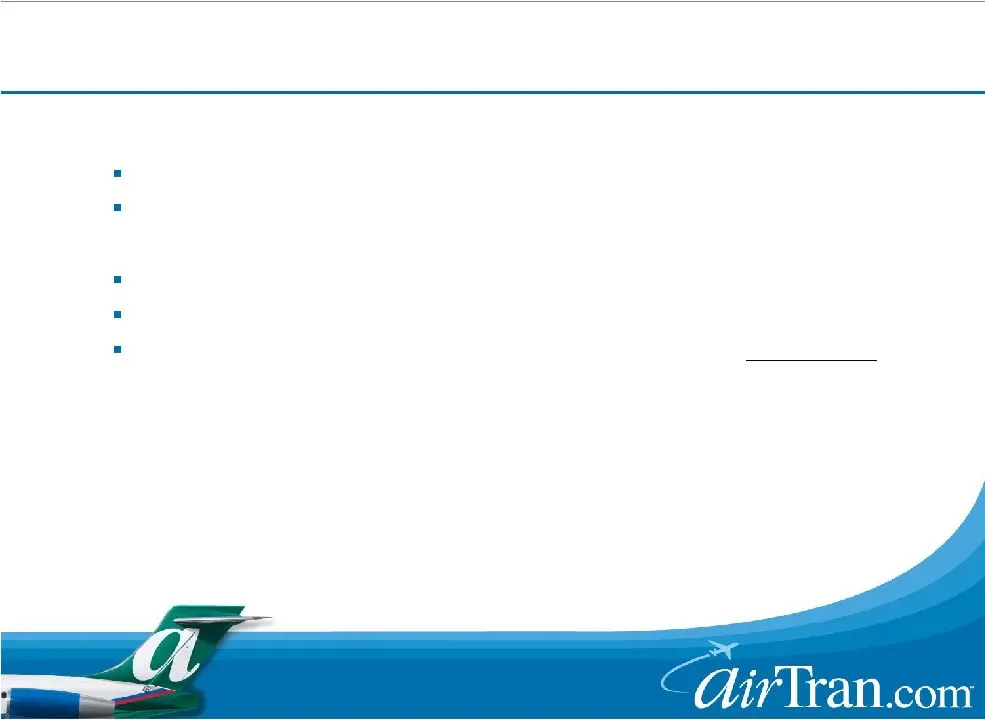
26 Network Synergies Improve fleet and capacity utilization Increase aircraft utilization Cost Synergies Replace MD-80s with cost efficient 737s Maintenance & facilities efficiencies Adapt best practices from both companies Total Annual Run-Rate Synergies $40MM+ $20MM+ $60MM+ Potential Combination S
Slide 27: Summary
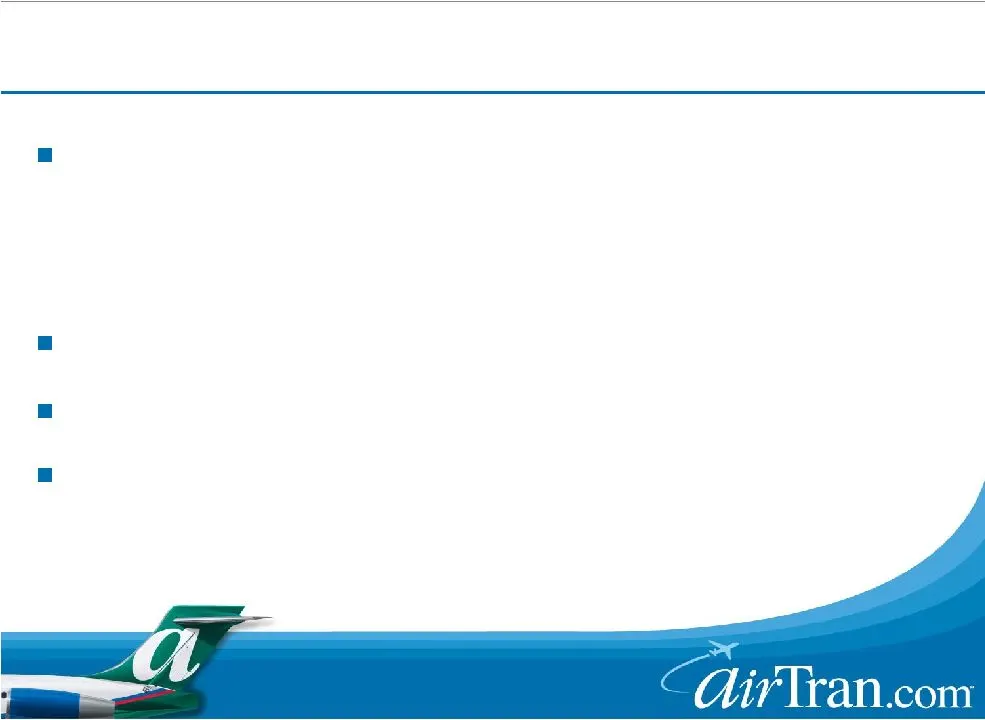
27 AirTran has solid fundamentals – Young fleet – Very low costs going lower – Strong East Coast presence Competitive environment in Atlanta is moderating AirTran and Midwest are stronger together than alone Midwest transaction presents significant benefits for all constituents Summary Summary
Slide 28: 28
28
Source: SEC EDGAR · 8-K filed May 11, 2007
More decks from Airtran Holdings Inc
 Merger or Acquisition (September 2010)21 slides · Sep 27, 2010
 Bank of America - Merrill Lynch Global Transportation Conference 201025 slides · Jun 15, 2010
 Shareholder Meeting (May 2010)33 slides · May 18, 2010
 Investor Presentation (May 2010)26 slides · May 13, 2010
 JP Morgan Aviation, Transportation and Defense Conference 201025 slides · Mar 9, 2010
 Raymond James 2010 Growth Airline Conference25 slides · Feb 4, 2010